Collaborative framework for care and control of ...
48
Transcript of Collaborative framework for care and control of ...


Collaborative framework for care and control of tuberculosis and diabetes. WHO/HTM/TB/2011.15
1.Tuberculosis - prevention and control. 2.Tuberculosis - etiology. 3.Tuberculosis - complications. 4.Diabetes complications. 4.Diabetes mellitus - prevention and control. 5.Health programs and plans. 6.Guidelines. I.World Health Organization. II.International Union against Tuberculosis and Lung Disease
ISBN 978 92 4 150225 2 (NLM classification: WF 200) Provisional collaborative framework, 2011 Expiry date, 2015 © World Health Organization 2011 All rights reserved. Publications of the World Health Organization are available on the WHO web site (www.who.int) or can be purchased from WHO Press, World Health Organization, 20 Avenue Appia, 1211 Geneva 27, Switzerland (tel.: +41 22 791 3264; fax: +41 22 791 4857; e-mail: [email protected]). Requests for permission to reproduce or translate WHO publications – whether for sale or for noncommercial distribution – should be addressed to WHO Press through the WHO web site (http://www.who.int/about/licensing/copyright_form/en/index.html).
The designations employed and the presentation of the material in this publication do not imply the expression of any opinion whatsoever on the part of the World Health Organization concerning the legal status of any country, territory, city or area or of its authorities, or concerning the delimitation of its frontiers or boundaries. Dotted lines on maps represent approximate border lines for which there may not yet be full agreement. The mention of specific companies or of certain manufacturers’ products does not imply that they are endorsed or recommended by the World Health Organization in preference to others of a similar nature that are not mentioned. Errors and omissions excepted, the names of proprietary products are distinguished by initial capital letters. All reasonable precautions have been taken by the World Health Organization to verify the information contained in this publication. However, the published material is being distributed without warranty of any kind, either expressed or implied. The responsibility for the interpretation and use of the material lies with the reader. In no event shall the World Health Organization be liable for damages arising from its use.

1. Associations between diabetes and tuberculosis infection, tuberculosis disease and drug-resistant tuberculosis
Table 1. Summary of the four cross-sectional studies on the association between diabetes and tuberculosis infection included in the meta-analysis Table 2. Summary of the 16 observational studies on the association between diabetes and active tuberculosis included in the meta-analysis Table 3. Association between diabetes and active tuberculosis in studies stratifying by glucose control Table 4. Summary of studies on the association between diabetes and drug-resistant tuberculosis Figure 1. Association between diabetes and tuberculosis infection in four cross-sectional studies Figure 2. Association between diabetes and active tuberculosis in 16 observational studies, with age-adjustment Figure 3. Funnel plot to examine the possibility of publication bias among studies on the association between diabetes and active tuberculosis
Figure 4. Association between diabetes and drug-resistant tuberculosis in 20 observational studies Figure 5. Funnel plot to examine the possibility of publication bias among studies on the association between diabetes and primary or acquired multidrug-resistant tuberculosis

Table 1. Summary of the four cross-sectional studies on the association between diabetes and tuberculosis infection included in the meta-analysis Study Country; population Study period Background
TB incidence*
Exposure Outcome Adjusted variables
Marton et al., 1963 (1) Hungary; people with and without diabetes of similar age, sex, region
Summer 1960
>100** Diabetes diagnosis by medical records
TST (>10mm) among people with negative X-rays
None
Woeltje et al., 1998 (2) USA.; patients receiving haemodialysis
Jun. 1996 – Aug. 1996
4.1** Diabetes diagnosis by medical records
TST (>10mm, >=5 mm for HIV+)
None
Brock et al., 2006 (3) Denmark, HIV-positive individuals Oct. 2004 – Jan. 2005
<10 Diabetes diagnosis by medical records
QFT-IT (≥0.35 IU/mL IFN-γ)
None
Chan-Yeung et al., 2006 (4)
Hong Kong (SAR China); elderly aged >65 years
2002–2003 98.9 Diabetes diagnosis by medical records
TST (>10mm) Age, marital status, education, place of birth, smoking, drug abuse, past TB, CVD, arthritis, fracture, ischemic heart disease, COPD, cancer, liver disease, BMI, feeding method, Norton score
* Background Incidence of TB per 100 000 person-years ** Data obtained from external source
TST = tuberculin skin testing; HIV = human immunodeficiency virus; CVD = cardiovascular disease; COPD = chronic obstructive pulmonary disease

Table 2. Summary of the 16 observational studies on the association between diabetes and active tuberculosis included in the meta-analysis
Type of Study
Study Country; population
Study period Background TB
incidence*
Exposure Outcome Adjusted variables
Prospective cohort
Kim et al., 1995 (5)
Republic of Korea; civil servants
1988–1990 306 DM diagnosed as ≥119mg/dl at screening, followed by FBG ≥150mg/dl and PPBG ≥180 mg/dl
PTB determined by X-ray Age^
John et al., 2001 (6)
India; renal transplant patients in Vellore
1986–1999 168** DM diagnosed as FBG >120 mg/dL or PPBG >200 mg/dL; or two elevated levels of either measurement
All TB diagnosed by X-ray, AFB, gastric juice, or culture
Age, chronic liver disease, other co-existing infections (CMV, PCP, nocardiosis, deep mycoses), immunosuppressive meds
Chen et al., 2006 (7)
Taiwan (China); renal transplant recipients in Taichung
1983–2003 66.7 DM diagnosis from medical chart
All TB diagnosed by 1) positive culture, 2) presence of granuloma in biopsy, 3) typical chest x-ray finding, OR 4) clinical presentation consistent with TB and favorable response to Tx
Age, gender, dialysis duration, HBV and HCV infection, graft rejection >3, immunosuppressive medications
Leung et al., 2008 (8)
Hong Kong (SAR China); elderly aged >65 years
Jan. 2000 –Dec. 2000
90 DM determined by FBG >7.0mmol/L
All TB diagnosed by bacteriology, X-ray, histology, or response to TB Tx
Age, sex, smoking, alcohol, language, marital status, education, housing, employment, SES, BMI, cardiovascular disease, hypertension, COPD/asthma, malignancy, recent weight loss, recent hospitalization, activities and daily living scores
Case-control Mori et al., 1992 (9)
USA; Oglala Sioux indians in South Dakota
1986 90.9 DM determined by anti-diabetic treatment; or ≥ 11.1 mmol/L at screening or ≥ 7.8 mmol/L FBG
Clinically diagnosed TB, not otherwise specified
Age, sex, alcohol abuse, isoniazid therapy, residence
Buskin et al., 1994 (10)
USA; residents seen at TB clinic in Washington DC
1988–1990 9 DM by self-report All TB defined by CDC 1990 Age
Rosenman et al., 1996 (11)
USA; male residents registered at the New Jersey Department of Health
Jan. 1985 –May 1987
9.5 DM by self-report All TB diagnosed by positive culture, OR physician's diagnosis with anti-TB medication
Age, gender, race
Pablo-Mendez et al., 1997 (12)
USA; civilians in California (based on discharge records)
1991 17.3** DM diagnosis from medical chart coded as ICD-9 : 250.0 - 250.9
All TB coded as ICD-9 010-018
Age, sex, race, poor education, median income, health insurance, HIV-related conditions, chronic renal insufficiency, alcohol-related conditions, drug use and two-way interactions
Jick et al., 2005 (13)
UK; general practice research database
1990–2001 3 DM determined by anti-diabetic treatment
All TB treated with anti-TB medication
Age, sex, index date, amount of computerized medical history, glucocorticoid use, smoking, BMI, pulmonary disease, use of anti-rheumatic or immunosuppressive agents
Alisjahbana et al., 2006 (14)
Indonesia; Bandung and Jakarta,
Mar. 2001 – Mar. 2005
263** DM determined by FBG ≥126 mg/dl
PTB diagnosed by clinical presentation, X-ray, confirmed by AFB in sputum
Age
Brassard et al., 2006 (15)
USA; PharMetrics Database with ≥1 prescription for anti-rheumatic medicines
Sept.1998 – Dec. 2003
5.6 DM diagnosis from medical chart coded as ICD-9 : 250.0 - 250.9
All TB coded as ICD-9 010-018
Age, sex, silicosis, chronic renal failure, haemodialysis, solid organ transplant, head and neck cancer, NSAIDS, steroids, Cox-2 inhibitors
Coker et al., 2006 (16)
Russian Federation; residents in the city of Samara
Jan. 2003 – Dec. 2003
118** DM by self-report PTB diagnosed by positive culture
Age, sex, relative with TB, drinking raw milk, assets, number of co-habiting persons, employment, financial security, smoking, alcohol, illicit drugs, history of imprisonment
Perez et al., 2006 (17)
USA; residents of 15 Texas/Mexico border counties (based on discharge records)
1999–2001 13.1 DM diagnosis from medical chart coded as ICD-9 : 250.0 - 250.9
All TB coded as ICD-9 010-018
Age, sex, race^, insurance, chronic renal failure, nutrition deficit, income, education, border^
Wu et al., 2007 (18)
Keelung, Taiwan (China); TB cases and controls with lower respiratory infections without pneumonia OR contacts of TB cases without TB disease
Jan. 2002 –Dec. 2004
87** DM diagnosis from medical chart
PTB confirmed by culture Age, gender, pneumoconiosis, bronchiectasis, liver cirrhosis, haemodialysis, lung cancer
Type of Study Study Country; population
Study period Background TB
Exposure Outcome Adjusted variables

incidence*
Other" Ponce-de-Leon et al., 2004 (19)
Mexico; civilians in Veracruz
Mar. 1995 –Apr. 2003 for TB case accrual; 2005 for diabetes survey
28 DM previously diagnosed by a physician; or FBG ≥ 126 mg/dl or ≥ 200 mg/dl for random samples
All TB diagnosed by positive AFB or postiive culture
Age^, and standardized by sex
Dyck et al., 2007 (20)
Canada; aboriginals in Saskatchewan
Jan. 1986 – Dec. 2001 for TB case accrual; Jan. 1991 – Dec. 1995 for diabetes survey
44 DM from medical chart coded as ICD-9 : 250
All TB cases reported to Saskatchewan Health
Age^
* Background incidence of TB per 100 000 person-years ** Data obtained from external source; ^ Stratum-specific relative risks were pooled by inverse-variance weighting method
Other: neither of the studies by Ponce-de-Leon et al. and Dyck et al. was specified as cohort or case-control. Case accrual occurred prospectively, while the underlying distribution of diabetes was determined during a different time after baseline.
AFB = acid fast bacilli stain; BMI = body mass index; CMV = cytomegalovirus; DM = diabetes mellitus; FBG = fasting blood glucose; NSAIDS = non-steroidal anti-inflammatory medicines; PCP = pneumocystis pneumonia; PPBG = post-prandial blood glucose; PTB = pulmonary TB; Tx = treatment

Table 3. Association between diabetes (DM) and active tuberculosis in studies stratifying by glucose control
Study Diabetes strata Relative risk 95% confidence interval
Pablo-Mendez et al., 1997 (12) No DM 1 --
Type II DM; uncomplicated 1.08 (0.98–1.20)
Type I DM; uncomplicated 1.47 (1.25, 1.73)
Poor control / complicated 2.75 (2.46, 3.06)
Leung et al., 2008 (8) No DM 1 --
DM; HbA1c<7% 0.81 (0.44, 1.48)
DM HbA1c>7% 2.56 (1.95, 3.35)

Table 4. Summary of studies on the association between diabetes (DM) and drug-resistant tuberculosis (DR-TB) Study Country Study design Study period Method of ascertaining
DM Adjusted variables
STUDIES ON DM AND DR-TB (NO DISTINCTION BETWEEN MDR-TB)
Studies on DM and primary DR-TB
Subhash et al., 2003 (21) South India Cross-sectional Jan. 1997 – Dec. 1999
FBG>140mg/dl; or known diabetics on antidiabetic medication or diet control
None
Singla et al., 2006 (22) Riyadh, Saudi Arabia
Cross-sectional; DM vs. no DM
Jan. 1998 – Dec. 1999
FBG >140mg/dl in repeat testings
None
Kong et al., 2008 (23) Seoul, Republic of Korea
Cross-sectional Sept. 2005 – Sept. 2007
Medical records None
Studies on DM and acquired DR-TB
Subhash et al., 2003 (21) South India Cross-sectional Jan. 1997 – Dec. 1999
FBG>140mg/dl; or known diabetics on antidiabetic medication or diet control
None
Ito et al., 2004 (24) Tokyo, Japan Cross-sectional Jan. 1993 – Dec. 2003
Not reported None
Studies on DM and DR-TB (no distinction between primary or acquired) Borchardt et al., 1995 (25) Northern Germany Cross-sectional Jan. 1984 –
Dec. 1993 Medical records None
Arevalo et al., 1996 (26) Southeastern Spain Cross-sectional Jan. 1988 – Oct. 1994
Medical records Age, sex, chest hospital, pulmonary TB, smear positive, previous anti-TB treatment, cavitary lung disease, alcohol dependency, COPD, corticosteroids, neoplasia, IDUs, hepatic cirrhosis
Lee et al., 2001 (27) Seoul, Republic of Korea
Cross-sectional Mar. 1995 – Feb. 2000
Medical records None
Moniruzzaman et al., 2006 (28)
British Columbia, Canada
Cross-sectional 1990–2001 Medical records None
STUDIES ON DM AND MDR-TB
Studies on DM and primary MDR-TB
Wang et al., 2001 (29) Taipei, Taiwan (China)
Cross-sectional Jan. 1996 –Dec. 1999
Medical records None
Min et al., 2005 (30) Masan, Republic of Korea
Cross-sectional Jan. 2001 – Jun. 2003
Medical records Age, smoking
Studies on DM and acquired MDR-TB
Wang et al., 2001 (29) Taipei, Taiwan Cross-sectional Jan. 1996 – Dec. 1999
Medical records None
Studies on DM and MDR-TB (no distinction between primary or acquired)
Fujino et al., 1998 (31) Japan Cross-sectional MDR vs. matched non-MDR
Jan. 1994 – Dec. 1996
Not reported Matched by age, sex, time of hospitalization; adjusted for previous treatment, non-compliance with treatment, alcohol dependency, high bacillary AFB smear and culture
Bashar et al., 2001 (32) New York City, USA Cross-sectional; DM vs. no DM
1987–1997 Medical records
Toungoussova et al. 2002 (33)
Archangels, Oblast, Russian Federation
Cross-sectional 1998–2000 Medical records None
Liaw et al., 2004 (34) Taipei, Taiwan (China)
Cross-sectional; MDR vs. non-MDR
Jan. 1998 – Dec. 2002
Medical records None
Kim et al., 2005 (35) Seoul, Republic of Korea
Cross-sectional Mar. 1999 – Mar. 2003
Not reported None
Telles et al., 2005 (36) Sao Paulo, Brazil Cross-sectional; Population-based
Mar. 2000 – May 2002
Self-reported None
Fisher-Hoch et al., 2008 (37)
Texas, USA Cross-sectional 1996–2003 Self-reported Age, gender, alcohol and drug dependency, HIV, previous TB
Tanrikulu et al., 2008 (38) South-east Turkey Cross-sectional Dec. 2001 – Apr. 2005
Medical records None
Suarez Garcia et al., 2009 (39)
Madrid, Spain Cross-sectional Sept. 1997 – Dec. 2006
Medical records None
STUDIES ON DM AND XDR-TB
Jeon et al., 2008 (40) Masan, Republic of Korea
Cross-sectional 2005–2007 Self-reported Sex, cumulative duration of treatment
FBG = fasting blood glucose; COPD = chronic obstructive pulmonary disease; IDU = intravenous drug use; AFB = acid fast bacilli; HIV = human immunodeficiency virus

Figure 1. Association between diabetes and tuberculosis (TB) infection in four cross-sectional studies

Figure 2. Association between diabetes and active tuberculosis in 16 observational studies, with age-adjustment
* These studies were not specified as prospective cohort or case-control. TB case accrual occurred prospectively, while the underlying distribution of diabetes was determined during a different time period after baseline. Note: Arrows indicate the truncation of confidence intervals due to limited space on forest plot.

Figure 3. Funnel plot to examine the possibility of publication bias among studies on the association between diabetes and active tuberculosis
-0.5 0.0 0.5 1.0 1.5 2.0
0.6
0.4
0.2
0.0
log(RR)
Sta
nd
ard
err
or
Begg Test p=0.21
Egger Test p=0.21

Figure 4. Association between diabetes (DM) and drug-resistant TB (DRTB) in 20 observational studies

Figure 5. Funnel plot to examine the possibility of publication bias among studies on the association between diabetes and primary or acquired multidrug-resistant tuberculosis
-1 0 1 2
0.8
0.6
0.4
0.2
0.0
log(RR)
Sta
nd
ard
err
or
Begg Test p=0.34
Egger Test p=0.68

References
1. Marton S et al. Representative tuberculosis mass examinations in diabetics in hungary. Acta Tuberc Pneumol Scand, 1963, 43:29-38.
2. Woeltje KF et al. Tuberculosis infection and anergy in hemodialysis patients.
American Journal of Kidney Diseases, 1998, 31(5):848–852. 3. Brock I et al. Latent tuberculosis in HIV positive, diagnosed by the M. tuberculosis
specific interferon-gamma test. Respiratory Research, 2006, 7:56. 4. Chan-Yeung M et al. Prevalence and determinants of positive tuberculin reactions of
residents in old age homes in Hong Kong. International Journal of Tuberculosis and Lung Disease, 2006, 10(8):892–898.
5. Kim SJ et al. Incidence of pulmonary tuberculosis among diabetics. Tubercle and Lung
Disease, 1995, 76(6):529–533. 6. John GT et al. Risk factors for post-transplant tuberculosis. Kidney International,
2001, 60(3):1148–1153. 7. Chen CH et al. Mycobacterium tuberculosis infection following renal transplantation
in Taiwan. Transplant Infectious Diseases, 2006, 8(3):148–156. 8. Leung CC et al. Diabetic control and risk of tuberculosis: a cohort study. American
Journal of Epidemiology, 2008, 167(12):1486–1494. 9. Mori MA, Leonardson G, Welty TK. The benefits of isoniazid chemoprophylaxis and
risk factors for tuberculosis among Oglala Sioux Indians. Archives of Internal Medicine, 1992, 152(3):547–550.
10. Buskin SE et al. Tuberculosis risk factors in adults in King County, Washington, 1988
through 1990. American Journal of Public Health, 1994, 84(11):1750–1756. 11. Rosenman KD, Hall N. Occupational risk factors for developing tuberculosis.
American Journal of Industrial Medicine, 1996, 30(2):148–154. 12. Pablos-Mendez A, Blustein J, Knirsch CA. The role of diabetes mellitus in the higher
prevalence of tuberculosis among Hispanics. American Journal of Public Health, 1997, 87(4):574–579.
13. Jick SS et al. Glucocorticoid use, other associated factors, and the risk of tuberculosis.
Arthritis & Rheumatism, 2006, 55(1):19–26.

14. Alisjahbana B et al. Diabetes mellitus is strongly associated with tuberculosis in Indonesia. International Journal of Tuberculosis and Lung Disease, 2006, 10(6):696–700.
15. Brassard P, Kezouh A, Suissa S. Antirheumatic drugs and the risk of tuberculosis.
Clinical Infectious Diseases, 2006, 43(6):717–722. 16. Coker R et al. Risk factors for pulmonary tuberculosis in Russia: case-control study.
Bmj 2006 Jan 14;332(7533):85-7. 17. Perez A, Brown HS 3rd, Restrepo BI. Association between tuberculosis and diabetes
in the Mexican border and non-border regions of Texas. American Journal of Tropical Medicine and Hygiene, 2006, 74(4):604–611.
18. Wu HP et al. Pneumoconiosis and liver cirrhosis are not risk factors for tuberculosis
in patients with pulmonary infection. Respirology, 2007, 12(3):416–419. 19. Ponce-De-Leon A et al. Tuberculosis and diabetes in southern Mexico. Diabetes Care,
2004, 27(7):1584–1590. 20. Dyck RF et al. The relationship between diabetes and tuberculosis in Saskatchewan:
comparison of registered Indians and other Saskatchewan people. Canadian Journal of Public Health, 2007, 98(1):55–59.
21. Subhash HS et al. Drug resistant tuberculosis in diabetes mellitus: a retrospective
study from south India. Tropical Doctor, 2003, 33(3):154–156. 22. Singla R et al. Influence of diabetes on manifestations and treatment outcome of
pulmonary TB patients. International Journal of Tuberculosis and Lung Disease, 2006, 10(1):74–79.
23. Kong J et al. The prevalence of initial drug resistance among pulmonary tuberculosis
patients. Tuberculosis and Respiratory Diseases, 2008, 64(2):95–101. 24. Ito K et al. Drug resistance in recurrent cases of tuberculosis. Kekkaku, 2004,
79(8):461–467. 25. Borchardt J et al. Drug-resistant tuberculosis in northern Germany: a retrospective
hospital-based study of 1,055 patients from 1984 until 1993. European Respiratory Journal, 1995, 8(7):1076–1083.
26. Arevalo M et al. Risk factors associated with drug-resistant Mycobacterium
tuberculosis in Castilla-la-Mancha (Spain). European Respiratory Journal, 1996, 9(2):274–278.

27. Lee JH, Chang JH. Drug-resistant tuberculosis in a tertiary referral teaching hospital of Korea. Korean Journal of Internal Medicine, 2001, 16(3):173–179.
28. Moniruzzaman A et al. A population-based study of risk factors for drug-resistant TB
in British Columbia. International Journal of Tuberculosis and Lung Disease, 2006, 10(6):631–638.
29. Wang PD, Lin RS. Drug-resistant tuberculosis in Taipei, 1996–1999. American Journal
of Infection Control, 2001, 29(1):41–47. 30. Min J et al. Risk factors for primary multidrug resistant tuberculosis. Tuberculosis and
Respiratory Diseases, 2005, 59(6):600–605. 31. Fujino T et al. Attributable factors to the emergence of multidrug-resistant
Mycobacterium tuberculosis based on the observation of consecutive drug resistance test results. Kekkaku, 1998, 73(7):471–476.
32. Bashar M et al. Increased incidence of multidrug-resistant tuberculosis in diabetic
patients on the Bellevue Chest Service, 1987 to 1997. Chest, 2001, 120(5):1514–1519.
33. Toungoussova S et al. Drug resistance of Mycobacterium tuberculosis strains isolated
from patients with pulmonary tuberculosis in Archangels, Russia. International Journal of Tuberculosis and Lung Disease, 2002, 6(5):406–414.
34. Liaw YS et al. Drug resistance pattern of Mycobacterium tuberculosis in a university
hospital in Taiwan, 1998–2002. Journal of the Formosan Medical Association, 2004, 103(9):671–677.
35. Kim DK et al. The prevalence and risk factors of drug resistant pulmonary
tuberculosis investigated at one university hospital in Seoul. Tuberculosis and Respiratory Diseases, 2005, 58(3):243–247.
36. Telles MA et al. A population-based study of drug resistance and transmission of
tuberculosis in an urban community. International Journal of Tuberculosis and Lung Disease, 2005, 9(9):970–976.
37. Fisher-Hoch SP et al. Type 2 diabetes and multidrug-resistant tuberculosis.
Scandinavian Journal of Infectious Diseases, 2008, 40(11–12):888–893. 38. Tanrikulu AC et al. Risk factors for drug resistant tuberculosis in southeast Turkey.
Tropical Doctor, 2008, 38(2):91–93. 39. Suarez-Garcia I et al. Risk factors for multidrug-resistant tuberculosis in a
tuberculosis unit in Madrid, Spain. European Journal of Clinical Microbiology and Infectious Diseases, 2009, 28(4):325–330.

40. Jeon CY et al. Extensively drug-resistant tuberculosis in South Korea: risk factors and treatment outcomes among patients at a tertiary referral hospital. Clinical Infectious Diseases, 2008, 46(1):42–49.

2. Associations between diabetes and tuberculosis treatment outcomes
Table. Characteristics of included studies on the association between diabetes and tuberculosis
treatment outcomes Figure 1. Risk of remaining sputum culture-positive after 2–3 months of anti-tuberculosis
treatment for patients with and without diabetes
Figure 2. Begg’s funnel plot, with pseudo 95% confidence limits for all studies with sputum cultures at 2–3
months
Figure 3. Risk of failure and death for tuberculosis patients with and without diabetes
Figure 4. Begg’s funnel plot with pseudo 95% confidence limits for all studies with the combined outcome
of failure and death
Figure 5. Risk of death for tuberculosis patients with and without diabetes
Figure 6. Begg’s funnel plot with pseudo 95% confidence limits for all studies with the outcome of death.
Figure 7. Adjusted odds of death for tuberculosis patients with and without diabetes
Figure 8. Begg’s funnel plot with pseudo 95% confidence limits for all studies, with the outcome of death
adjusted for age and other confounding factors
Figure 9. Risk of tuberculosis relapsing for patients with and without diabetes
Figure 10. Begg’s funnel plot, with pseudo 95% confidence limits for all studies with tuberculosis relapse
Figure 11. Odds of drug-resistant tuberculosis recurring in patients with and without diabetes
Figure 12. Begg’s funnel plot, with pseudo 95% confidence limits for all studies with recurrent tuberculosis
that is drug-resistant

Table. Characteristics of included studies for the association between DM and TB outcomes Study
Type of study
Country
Type of TB
Total (N)
Population with diabetes
(N)
Outcomes Definition of diabetes (DM)
Sputum culture
conversion 2–3 months
Failure
and death
Death
Adjusted
variables for death
outcome
Relapse
Recurrent
drug resistance
Alisjahbana (1)
Prospective cohort
Indonesia Pulmonary TB 634 94 √
√
√
–
–
–
Two measurements of FBG >126 mg/dL
Ambrosetti (2)
Prospective cohort
Italy Undifferentiated TB
778 32 –
√
√
–
–
–
Medical records
Ambrosetti (3)
Prospective cohort
Italy Undifferentiated TB
838 50
–
√
√
–
–
–
Medical records
Ambrosetti (4)
Prospective cohort
Italy Undifferentiated TB
715 40 –
√
√
–
–
–
Medical records
Anunnatsiri (5)
Retrospective cohort
Thailand Pulmonary TB 226 117 –
√
–
–
–
–
Medical records
Banu Rekha (6)
Retrospective analysis of three concurrent studies
India Pulmonary TB 190 92 √
–
–
–
–
–
Medical records, FBG
Bashar (7) Retrospective case-control
USA Undifferentiated TB
155 50 –
–
√
–
–
–
Medical records
Blanco (8) Retrospective cohort
Canary Islands (Spain)
Pulmonary TB 98 14 √
–
–
–
–
–
Medical records
Centis (9)
Prospective cohort
Italy Undifferentiated TB
1,162 56 –
√
√
–
–
–
Medical records
Centis (10)
Prospective cohort
Italy Undifferentiated TB
906 40 –
√
√
–
–
–
Medical records
Chiang (11)
Retrospective cohort
Taiwan (China)
Pulmonary TB 1,127 241 –
√
√
–
–
–
Medical records
Dooley (12) Retrospective cohort
USA Undifferentiated TB
297 42 √
–
√
Age, HIV, weight,
foreign birth
–
–
Medical records, non-FBG >200mg/dL, DM medications
Fielder (13)
Retrospective cohort
USA Pulmonary TB 174 22 –
–
√
Age
–
–
Medical records
Fisher-Hoch (14)
Retrospective cohort
Mexico and USA
Undifferentiated TB
2878 688 –
–
√
–
–
√
Self report
Guler (15)
Retrospective cohort
Turkey Pulmonary TB 306 44 √
–
–
–
–
–
Medical records
Hara (16)
Retrospective cohort
Japan Pulmonary TB 624 112 √
–
–
–
–
–
Medical records
Hasibi (17)
Retrospective cohort
Iran Disseminated TB 50 6 –
–
√
–
–
–
Medical records
Ito (18)
Retrospective cohort
Japan Undifferentiated TB
109 16 –
–
–
–
–
√
Medical records
Kitahara (19)
Retrospective cohort
Japan Pulmonary TB 520 71 √
–
√
–
–
–
Medical records
Kourbatova (20)
Retrospective case-control
Russian Federation
Undifferentiated TB
460 20 –
–
√
–
–
–
Medical records
Maalej (21)
Retrospective case-control
Tunisia Pulmonary TB 142 60 –
–
√
–
√
–
Medical records
Mboussa (22)
Retrospective cohort
Republic of the Congo
Pulmonary TB 132 32 –
√
√ –
√
–
Two measurements of FBG ≥126 mg/dL
Oursler (23) Retrospective cohort
USA Pulmonary TB 139 18 –
–
√
Age, HIV,
Renal, COPD
–
–
Medical records
Pina (24)
Retrospective cohort
Spain Undifferentiated TB
1,511 73 –
–
√
–
–
–
Medical records
Ponce-De-Leon (25)
Prospective cohort Mexico Pulmonary TB 581 172 –
√
√
–
–
–
Medical records (FBG ≥126 mg/dL or non-FBG ≥200 mg/dL sensitivity anal)
Singla (26)
Retrospective cohort
Saudi Arabia
Pulmonary TB 692 187 –
√
√
–
√
–
2 measurements of FBG >140 mg/dL

DM = diabetes mellitus; COPD = chronic obstructive pulmonary disease; FBG = fasting blood glucose
Subhash (27) Retrospective cohort
India Undifferentiated TB
361 72 –
–
–
–
–
√
FBG >140 mg/dL, medical records and DM medication or diet
Tatar (28)
Retrospective cohort
Turkey Undifferentiated TB
78 156 |√
–
√
–
–
–
Medical records
Vasankari (29)
Retrospective cohort
Finland Pulmonary TB 629 92 –
–
√
–
–
–
Treatment with DM medications
Wada (30)
Retrospective cohort
Japan Pulmonary TB 726 143 √
–
–
–
√
–
Medical records
Wang (31)
Retrospective cohort
Taiwan (China)
Pulmonary TB 453 75 –
–
–
–
–
√
Medical records
Wang (32) Retrospective cohort
Taiwan (China)
Pulmonary TB 217 74 –
√
√
Age, sex
–
–
Medical records and DM medication or FBG>126 mg/dL
Zhang (33) Retrospective Cohort
China Pulmonary TB 203 2141 –
–
–
√
–
Medical records or non-FBG ≥126 mg/dL

Figure 1. Risk of remaining sputum culture positive after 2-3 months of treatment for TB patients
with DM compared with TB patients without DM. Size of the square is proportional to the
precision of the study-specific effect estimates, and the bars indicate the corresponding
95% CIs.
Weights are from random effects analysis
Heterogeneity I-squared = 58% (12, 80)
Kithara, 1994 [19]
Alisjahbana, 2007 [1]
Study
Tatar, 2009 [28]
Dooley, 2009 [12]
Hara, 1996 [16]
Blanco, 2007 [8]
Banu Rekha, 2007 [6]
Guler, 2007* [15]
Wada, 2000 [30]
Japan
Indonesia
Country
Turkey
USA
Japan
Canary Islands,
Spain
India
Turkey
Japan
11/71 (15%)
7/41 (17%)
11/55 (20%)
9/30 (30%)
32/93 (34%)
4/13 (31%)
8/69 (12%)
32/44 (73%)
14/90 (16%)
Population with DM
Positive sputum
Culture 2-3 months/
Total
33/449 (7%)
68/372 (18%)
8/53 (15%)
50/163 (31%)
43/301 (14%)
13/85 (15%)
10/68 (15%)
88/262 (34%)
16/334 (5%)
Population without DM
Positive sputum
Culture 2-3 months/
Total
2.11 (1.12, 3.98)
0.93 (0.46, 1.90)
RR (95% CI)
1.33 (0.58, 3.04)
0.98 (0.54, 1.77)
2.41 (1.62, 3.57)
2.01 (0.77, 5.24)
0.79 (0.33, 1.88)
2.17 (1.69, 2.78)
3.25 (1.65, 6.40)
2.11 (1.12, 3.98)
0.93 (0.46, 1.90)
RR (95% CI)
1.33 (0.58, 3.04)
0.98 (0.54, 1.77)
2.41 (1.62, 3.57)
2.01 (0.77, 5.24)
0.79 (0.33, 1.88)
2.17 (1.69, 2.78)
3.25 (1.65, 6.40)
1.3 1 2 7
*The RR for Guler et al. (15) was calculated using the OR, CI and total number of patients with and without DM
provided in the paper.

Figure 2. Begg’s funnel plot with pseudo 95% confidence limits for all studies with sputum
cultures at 2-3 months
0 .2 .4 .6
-1
0
1
2
Log RR
Standard Error of Log RR
P=0.30

Figure 3. Risk of failure and death for TB patients with DM compared with TB patients without
DM. Size of the square is proportional to the precision of the study-specific effect
estimates, and the bars indicate the corresponding 95% CIs. The diamond is centered on
the summary RR of the observational studies, and the width indicates the corresponding
95% CI.
Weights are from random effects analysis
Summary
Heterogeneity I-squared = 19% (0,58)
Alisjahbana, 2007 [1]
Centis, 1999 Report [10]
Ambrosetti, 1996 Report [3]
Centis, 1998 Report [9]
Ponce-de-Leon, 2004 [25]
Study
Ambrosetti, 1995 Report [2]
Singla, 2006 [26]
Ambrosetti, 1997 Report [4]
Chiang, 2009 [11]
Wang, 2009 [32]
Anunnatsiri, 2005 [5]
Mboussa, 2003 [22]
Indonesia
Italy
Italy
Italy
Mexico
Country
Italy
Saudi
Arabia
Italy
Taiwan
Taiwan
Thailand
Congo
8/94 (9%)
2/40 (5%)
5/50 (10%)
5/41 (12%)
42/172 (24%)
Population
with DMFailure and
Deaths/
Total
3/32 (9%)
1/187 (<1%)
2/40 (5%)
60/241 (25%)
13/74 (18%)
4/38 (11%)
13/32 (41%)
32/540 (6%)
28/852 (3%)
20/773 (3%)
61/1059 (6%)
67/409 (16%)
Population
without DMFailure and
Deaths/
Total
33/737 (4%)
7/505 (1%)
45/667 (7%)
161/886 (18%)
11/143 (8%)
11/188 (6%)
13/100 (13%)
1.69 (1.36, 2.12)
1.44 (0.68, 3.02)
1.52 (0.38, 6.16)
3.87 (1.51, 9.87)
2.12 (0.90, 4.99)
1.49 (1.06, 2.10)
RR (95% CI)
2.09 (0.68, 6.47)
0.39 (0.05, 3.11)
0.74 (0.19, 2.95)
1.37 (1.06, 1.78)
2.28 (1.08, 4.85)
1.80 (0.60, 5.35)
3.13 (1.62, 6.03)
1.69 (1.36, 2.12)
1.44 (0.68, 3.02)
1.52 (0.38, 6.16)
3.87 (1.51, 9.87)
2.12 (0.90, 4.99)
1.49 (1.06, 2.10)
RR (95% CI)
2.09 (0.68, 6.47)
0.39 (0.05, 3.11)
0.74 (0.19, 2.95)
1.37 (1.06, 1.78)
2.28 (1.08, 4.85)
1.80 (0.60, 5.35)
3.13 (1.62, 6.03)
1.3 1 1.69 7

Figure 4. Begg’s funnel plot with pseudo 95% confidence limits for all studies with the combined
outcome of failure and death.
0 .5 1 1.5
-2
0
2
4
Log RR
Standard Error of Log RR
P=0.49

Figure 5. Risk of death for TB patients with DM compared with TB patients without DM. Size of
the square is proportional to the precision of the study-specific effect estimates, and the
bars indicate the corresponding 95% CIs. The diamond is centered on the summary RR
of the observational studies, and the width indicates the corresponding 95% CI.
Weights are from random effects analysis
Summary
Heterogeneity I-squared = 46% (12, 67)
Centis, 1998 Report [9]
Singla, 2006 [26]
Kithara, 1994 [19]
Kourbatova, 2006 [20]
Vasankari, 2007 [29]
Pina, 2006 [24]
Study
Mboussa, 2003 [22]
Tatar, 2009 [28]
Hasibi, 2008 [17]
Bashar, 2001 [7]
Maalej, 2009 [21]
Alisjahbana, 2007 [1]
Centis, 1999 Report [10]
Fielder, 2002 [13]
Oursler, 2002 [23]
Wang, 2009 [32]
Ambrosetti, 1996 Report [3]
Ambrosetti, 1995 Report [2]
Dooley, 2009 [12]
Ponce-de-Leon, 2004 [25]
Chiang, 2009 [11]
Ambrosetti, 1997 Report [4]
Fisher-Hoch, 2008 [14]
Italy
Saudi Arabia
Japan
Russia
Finland
Spain
Country
Congo
Turkey
Iran
USA
Tunisia
Indonesia
Italy
USA
USA
Taiwan
Italy
Italy
USA
Mexico
Taiwan
Italy
USA
5/41 (12%)
1/187 (<1%)
3/71 (4%)
5/20 (25%)
22/92 (24%)
8/73 (11%)
8/32 (25%)
2/78 (3%)
3/6 (50%)
7/50 (14%)
2/57 (4%)
2/94 (2%)
2/40 (5%)
13/22 (59%)
8/18 (44%)
13/74 (18%)
Population with DM
Deaths/Total
4/50 (8%)
3/32 (9%)
6/42 (14%)
34/172 (20%)
52/241 (22%)
1/40 (3%)
46/391 (12%)
49/1059 (5%)
3/505 (<1%)
14/449 (3%)
87/440 (20%)
86/537 (16%)
97/1438 (7%)
8/100 (8%)
0/78 (0%)
6/44 (14%)
1/105 (1%)
0/82 (0%)
0/540 (0%)
26/852 (3%)
29/152 (19%)
14/108 (13%)
11/143 (8%)
Population without DM
Deaths/Total
19/773 (2%)
29/737 (4%)
20/255 (8%)
61/409 (15%)
137/886 (15%)
43/667 (6%)
112/1022 (11%)
1.89 (1.52, 2.36)
2.64 (1.11, 6.26)
0.90 (0.09, 8.60)
1.36 (0.40, 4.60)
1.26 (0.58, 2.76)
1.49 (0.99, 2.26)
1.62 (0.82, 3.21)
RR (95% CI)
3.13 (1.28, 7.65)
5.00 (0.24, 102)
3.67 (1.23, 10.93)
14.70 (1.86, 116)
7.16 (0.35, 146)
28.47 (1.38, 588
1.64 (0.40, 6.66)
3.10 (1.92, 4.99)
3.43 (1.68, 6.98)
2.28 (1.08, 4.85)
3.25 (1.15, 9.20)
2.38 (0.77, 7.41)
1.82 (0.78, 4.27)
1.33 (0.91, 1.94)
1.40 (1.05, 1.86)
0.39 (0.05, 2.74)
1.07 (0.78, 1.48)
1.89 (1.52, 2.36)
2.64 (1.11, 6.26)
0.90 (0.09, 8.60)
1.36 (0.40, 4.60)
1.26 (0.58, 2.76)
1.49 (0.99, 2.26)
1.62 (0.82, 3.21)
RR (95% CI)
3.13 (1.28, 7.65)
5.00 (0.24, 102)
3.67 (1.23, 10.93)
14.70 (1.86, 116
7.16 (0.35, 146)
28.47 (1.38, 588)
1.64 (0.40, 6.66)
3.10 (1.92, 4.99)
3.43 (1.68, 6.98)
2.28 (1.08, 4.85)
3.25 (1.15, 9.20)
2.38 (0.77, 7.41)
1.82 (0.78, 4.27)
1.33 (0.91, 1.94)
1.40 (1.05, 1.86)
0.39 (0.05, 2.74)
1.07 (0.78, 1.48)
1.3 1.89 7

Figure 6. Begg’s funnel plot with pseudo 95% confidence limits for all studies with the outcome of
death.
P=0.19
0 .5 1 1.5
-4
-2
0
2
4
Log RR
Standard Error of Log RR
P=0.19

Figure 7. Adjusted odds of death for TB patients with DM compared with TB patients without DM,
for all studies with the outcome of death adjusted for age and other confounding factors.
Size of the square is proportional to the precision of the study-specific effect estimates,
and the bars indicate the corresponding 95% CIs. The diamond is centered on the
summary OR of the observational studies, and the width indicates the corresponding 95%
CI.
Weights are from random effects analysis
Summary
Wang, 2009 [32]
Dooley, 2009 [12]
Oursler, 2002 [23]
Study
Fielder, 2002 [13]
Taiwan
USA
USA
USA
13/74 (18%)
6/42 (14%)
8/18 (44%)
13/22 (59%)
11/143 (8%)
20/255 (8%)
14/108 (13%)
29/152 (19%)
4.95 (2.69, 9.10)
5.20 (1.77, 15.25)
6.50 (1.11, 38.20)
6.70 (1.57, 28.52)
OR (95% CI)
3.80 (1.42, 10.16)
11 4.95 15 40
Heterogeneity I-squared = 0% (0,85)
Population
with DM
Deaths/
Total
Population
Without DM
Deaths/
Total
Country

Figure 8. Begg’s funnel plot with pseudo 95% confidence limits for all studies with the outcome of
death adjusted for age and other confounding factors.
P=0.17
0 .5 1
0
1
2
3
4
P=0.17
Standard Error of Log OR
Log OR

Figure 9. Risk of TB relapse for TB patients with DM compared with TB patients without DM.
Size of the square is proportional to the precision of the study-specific effect estimates,
and the bars indicate the corresponding 95% CIs. The diamond is centered on the
summary RR of the observational studies, and the width indicates the corresponding 95%
CI.
Weights are from random effects analysis
Summary
Heterogeneity I-squared = 0% (0,79)
Wada, 2000 [30]
Singla, 2006 [26]
Zhang, 2009 [33]
Study
Mboussa, 2003 [22]
Maalej, 2009 [21]
Japan
Saudi
Arabia
China
Country
Congo
Tunisia
7/61 (11%)
2/130 (2%)
33/165 (20%)
6/17 (35%)
4/55 (7%)
4/284 (1%)
3/367 (1%)
9/170 (5%)
9/77 (12%)
1/82 (1%)
3.89 (2.43, 6.23)
8.15 (2.46, 26.97)
1.88 (0.32, 11.14)
3.78 (1.87, 7.65)
RR (95% CI)
3.02 (1.24, 7.35)
5.96 (0.68, 51.95)
3.89 (2.43, 6.23)
8.15 (2.46, 26.97)
1.88 (0.32, 11.14)
3.78 (1.87, 7.65)
RR (95% CI)
3.02 (1.24, 7.35)
5.96 (0.68, 51.95)
1.3 1 3.89 15 60
Population
with DM
Relapse/
Total
Population
without DM
Relapse/
Total

Figure 10. Begg’s funnel plot with pseudo 95% confidence limits for all studies with TB
relapse.
P=1.00
0 .5 1 1.5
-2
0
2
4
P=1.00
Log RR
Standard Error of Log RR

Figure 11. The odds of recurrent TB that is DR, comparing patients with DM to patients
without DM. Size of the square is proportional to the precision of the study-specific
effect estimates, and the bars indicate the corresponding 95% CIs. The diamond
is centered on the summary OR of the observational studies, and the width
indicates the corresponding 95% CI.
Weights are from random effects analysis
Subhash, 2003 [27]
Fisher-Hoch, 2008 [14]-
Ito, 2004 [18]
Wang, 2001 [31]
Fisher-Hoch, 2008 [14] -
Study
India
USA
Japan
Taiwan
Mexico
Country
20/28 (71%)
3/23 (13%)
2/16 (13%)
3/25 (12%)
11/24 (46%)
106/145 (73%)
6/51 (12%)
16/93 (17%)
27/173 (16%)
14/64 (22%)
1.24 (0.72, 2.16)
0.92 (0.37, 2.27)
1.10 (0.27, 4.49)
0.69 (0.14, 3.37)
0.80 (0.17, 3.67)
3.00 (1.10, 8.19)
OR (95% CI)
1.1 .4 1.24 5 10
Population with DM DR Recurrent TB/Recurrent TB
Population without DM DR Recurrent TB/Recurrent TB
Summary
Heterogeneity I-squared = 6% (0,80)

Figure 12. Begg’s funnel plot with pseudo 95% confidence limits for all studies with recurrent TB
that is DR.
P=0.62
0 .2 .4 .6 .8
-2
-1
0
1
2
P=0.62
Log OR
Standard Error of Log OR

References 1. Alisjahbana B et al. The effect of type 2 diabetes mellitus on the presentation and
treatment response of pulmonary tuberculosis. Clinical Infectious Diseases, 2007, 45:428–435.
2. Ambrosetti M et al. The Italian AIPO study on tuberculosis treatment results, report 1995.
National AIPO “Tuberculosis” Study Group. Monaldi Archives for Chest Disease, 1999, 54:49–54.
3. Ambrosetti M et al. The Italian AIPO study on tuberculosis treatment results, report 1996.
National AIPO “Tuberculosis” Study Group. Associazione Italiana Pneumologi Ospedalieri. Monaldi Archives for Chest Disease, 1999, 54:237–241.
4. Ambrosetti M et al. The Italian AIPO study on tuberculosis treatment results, report 1997.
National AIPO “Tuberculosis” Study Group. Monaldi Archives for Chest Disease, 1999, 54:407–412.
5. Anunnatsiri S, Chetchotisakd P, Wanke C. Factors associated with treatment outcomes in
pulmonary tuberculosis in Northeastern Thailand. Southeast Asian Journal of Tropical Medicine and Public Health, 2005, 36:324–330.
6. Banu Rekha VV et al. Sputum conversion at the end of intensive phase of Category-1
regimen in the treatment of pulmonary tuberculosis patients with diabetes mellitus or HIV infection: An analysis of risk factors. Indian Journal of Medical Research, 2007, 126:452–458.
7. Bashar M et al. Increased incidence of multidrug-resistant tuberculosis in diabetic
patients on the Bellevue Chest Service, 1987 to 1997. Chest, 2001, 120:1514–1519. 8. Blanco JAG et al. Tobacco smoking and sputum smear conversion in pulmonary
tuberculosis. Medicina Clinica, 2007, 128:565–568. 9. Centis R, Ianni A, Migliori GB: Evaluation of tuberculosis treatment results in Italy, report
1998. Tuberculosis section of the National AIPO Study Group on Infectious Disease and the SMIRA Group. Monaldi Archives for Chest Disease, 2000, 55:293–298.
10. Centis R, Migliori GB. Evaluation of tuberculosis treatment results in Italy, report 1999.
Monaldi Archives for Chest Disease, 2002, 57:297–305. 11. Chiang CY et al. Tuberculosis outcomes in Taipei: factors associated with treatment
interruption for 2 months and death. International Journal of Tuberculosis and Lung Disease, 2009, 13:105–111.
12. Dooley KE et al. Impact of diabetes mellitus on treatment outcomes of patients with active
tuberculosis. American Journal of Tropical Medicine and Hygiene, 2009, 80:634–639. 13. Fielder JF et al. A high tuberculosis case-fatality rate in a setting of effective tuberculosis
control: implications for acceptable treatment success rates. International Journal of Tuberculosis and Lung Disease, 2002, 6:1114–1117.

14. Fisher-Hoch SP et al, Nuevo Santander Tuberculosis Trackers. Type 2 diabetes and
multidrug-resistant tuberculosis. Scandinavian Journal of Infectious Diseases, 2008, 40:888–893.
15. Guler M et al. Factors influencing sputum smear and culture conversion time among
patients with new case pulmonary tuberculosis. International Journal of Clinical Practice, 2007, 61:231–235.
16. Hara H. From the aspects of complicated diseases. Kekkaku, 1996, 71:47–56. 17. Hasibi M et al. Epidemiological, clinical, laboratory findings, and outcomes of
disseminated tuberculosis in Tehran, Iran. Southern Medical Journal, 2008, 101:910–913. 18. Ito K et al. Drug resistance in recurrent cases of tuberculosis. Kekkaku, 2004, 79:461–
467. 19. Kitahara Y et al. An investigation on risk factors relating to the treatment difficulty in
originally treated pulmonary tuberculosis cases. Kekkaku, 1994, 69:503–511. 20. Kourbatova EV et al. Risk factors for mortality among adult patients with newly diagnosed
tuberculosis in Samara, Russia. International Journal of Tuberculosis and Lung Disease, 2006, 10:1224–1230.
21. Maalej S et al. Pulmonary tuberculosis and diabetes. A retrospective study of 60 patients
in Tunisia. Presse Medicale, 2009, 38:20–24. 22. Mboussa J et al. Course of pulmonary tuberculosis in diabetics. Rev Pneumol Clin, 2003,
59:39–44. 23. Oursler KK et al. Survival of patients with pulmonary tuberculosis: clinical and molecular
epidemiologic factors. Clinical Infectious Diseases, 2002, 34:752–759. 24. Pina JM, Dominguez A et al. Excess mortality due to tuberculosis and factors associated
to death in and annual cohort of patients diagnosed of tuberculosis. Revista Clinica Espanola, 2006, 206:560–565.
25. Ponce-De-Leon A et al. Tuberculosis and diabetes in southern Mexico. Diabetes Care,
2004, 27:1584–1590. 26. Singla R et al. Influence of diabetes on manifestations and treatment outcome of
pulmonary TB patients. International Journal of Tuberculosis and Lung Disease, 2006, 10:74–79.
27. Subhash HS et al. Drug resistant tuberculosis in diabetes mellitus: a retrospective study
from south India. Tropical Doctor, 2003, 33:154–156. 28. Tatar D et al. Tuberculosis in diabetics: features in an endemic area. Japanese Journal of
Infectious Diseases, 62:423–427.

29. Vasankari T et al. Risk factors for poor tuberculosis treatment outcome in Finland: a cohort study. BMC Public Health, 2007, 7:291.
30. Wada M. The effectiveness of pyrazinamide-containing six-month short course
chemotherapy. Kekkaku, 2000, 75:665–673. 31. Wang PD, Lin RS. Drug-resistant tuberculosis in Taipei, 1996–1999. American Journal of
Infection Control, 2001, 29:41–47. 32. Wang CS et al. Impact of type 2 diabetes on manifestations and treatment outcome of
pulmonary tuberculosis. Epidemiology and Infection, 2009, 137:203–210. 33. Zhang Q, Xiao H, Sugawara I. Tuberculosis complicated by diabetes mellitus at Shanghai
Pulmonary Hospital, China. Japanese Journal of Infectious Diseases, 62:390–691.

3. Summary of studies on screening for tuberculosis in diabetes patients and screening for diabetes in tuberculosis patients, and studies on tuberculosis preventive therapy in patients with diabetes
Table 1. Summary of studies on screening for tuberculosis among people with diabetes and
selected comparison population Table 2. Summary of results of screening for tuberculosis in people with diabetes and selected
comparisons Table 3. Summary of studies on screening for tuberculosis infection among people with diabetes
and selected comparison population Table 4. Summary of results of screening for tuberculosis infection in people with diabetes and
selected comparisons Table 5. Summary of studies on screening for diabetes among tuberculosis patients and selected
comparison populations Table 6. Summary of results on screening for diabetes in tuberculosis patients and selected
comparisons Figure. The decreasing trend of hyperglycaemia in tuberculosis patients receiving anti-
tuberculosis treatment Text. Summary of two studies on tuberculosis preventive therapy in patients with diabetes Note: Tables 1, 2, 5, 6; the figure and the text reflect findings from the following published review: Jeon CY et al., Bi-directional screening for tuberculosis and diabetes: a systematic review. Tropical Medicine and International Health, 2010, 15: 1300–1314 (doi: 10.1111/j.1365-3156.2010.02632.x).

Table 1. Summary of studies on screening for tuberculosis among people with diabetes and selected comparison population
Study Region, Country
Study Period
Diabetes diagnosis methods TB identification method
% insulin depen-
dent
% male Age distribution Comparison Population
Studies on screening for prevalent TB in DM
Boucot et al., 1952[1]
Philadelphia, United States
1946 Diabetics referred by clinics (FBG >=130mg/dl; Random BG>=170mg/dl with glycosuria)
PTB by chest X-ray 74% Among DM 31%; Among TB 45%
Among DM 14% <40 years; Among TB 13% <40 years
Non diabetic industrial workers of Philadelphia in 1942**
Oscarsson and Silwer, 1958[2]
County of Kristianstad, Swedan
March 1954 Diabetics identified by medical records
PTB by chest X-ray 64% Among DM 45%, Among TB 52%
Among DM 18% <40 years; Among TB 26% <40 years
Residents of county of Kristianstad in 1953**
Opsahl et al., 1961[3]
Korea N/R Diabetic patients at The National Medical Center
PTB by chest X-ray 43% Among DM 63%; Among TB N/R
Among DM 35% <40 years; Among TB N/A
Patients applying to the surgical out-patients department for diseases other than TB
Davidovich et al., 1963[4]
Rosario, Argentina
N/R Diabetic patients at the clinic identified by medical records
PTB by chest X-ray N/R Among DM 22%; Among TB 25%
Among DM 12% < 45 year; Among TB 25% <45 years
No comparison
Marton et al., 1963[5]
Hungary Summer 1960
Diabetic patients of hospital; and nondiabetic controls
PTB by chest X-ray, followed by sputum culture
N/R Among DM 44%; Among TB 58%
Among DM: Mean 59; Among TB: Mean 60
Non diabetics of similar age and sex distribution from the same hospital
Golli et al., 1975[6] Germany N/R Diabetic patients registered in the diabetes center in Berlin
PTB by chest X-ray 38% Among DM 62%, Among TB 92%
Among DM 11% <=40; Among TB 17%<=40
No comparison
Gill et al., 1984[7] Soweto, South Africa
N/R Diabetics <30 years with insulin dependence by medical records
PTB by chest X-ray 100% Among DM 50%; Among TB N/R
Among DM Mean 21.7,SD 4.8; 100% <30 years; Among TB N/R
No comparison
Tripathy et al., 1984[8]
Adra, India N/R Diabetics identified by medical records
PTB by sputum smear on three consecutive days
N/R Among DM N/R; Among TB 78%
Among DM 24% <40 years; Among TB 12% <40 years
No comparison
Ezung et al., 2002[9] Imphal, India N/R Diabetics at diabetic clinic; DM established by clinical symptoms and by WHO criteria
PTB by chest X-ray, and sputum smear
N/R Among DM 65%, Among TB 74%
Among DM 12% <=40 years; Among TB 15% <=40
No comparison
Webb et al., 2009[10]
Western Cape, South Africa
Sept 2006 - Jan 2007
Type 1 diabetics diagnosed by pediatric endocrinologist
TB by chest X-ray, suggestive symptoms, and positive Mantoux test
100% Among DM 42%, Among TB 67%
100% <21 years for DM and TB
No comparison
Studies on screening for incident TB in DM
Lester, 1984[11] Ethiopia Apr 1976 – Jul 1983
Diabetic patients at a hospital diagnosed by FBG >140mg/dl, Random BG >200mg/dl OR history of diabetes treatment
PTB by chest X-ray, sputum smears; OR positive Mantoux test with suggestive clinical presentation
40% Among DM 50%, Among TB 69%
Among DM 53% <40 years; Among TB 79%<40 years
No comparison
Kim et al., 1995[12] South Korea 1988-1990 Civil servants with DM diagnosed by random >=119mg/dl, FBG >=150mg/dl and >=180 mg/dl post meal
PTB by chest X-ray, smear microscopy and culture
N/R Among DM 96%, Among TB 98%
>=20 Korean civil servants without diabetes
N/R = not reported; PTB = pulmonary tuberculosis; DM = diabetes mellitus; FBG = fasting blood glucose

Table 2. Summary of results of screening for tuberculosis in people with diabetes and selected comparisons
Study Pop Size of Diabetics
Number of TB
Number of TB Diagnosed
prior to screening
TB Prevalence or incidence in
diabetics (per 100,000)
TB Prevalence or Incidence for
Comparison (per 100,000)
Prevalence or
Incidence Ratio
Prevalence or Incidence Difference
(per 100,000)
Number needed to screen to
detect 1 TB case^
Studies on screening for prevalent TB in DM
Boucot et al., 1952[1] 3106 261 87 8403* 4300* 2.0 4103 24
Oscarsson and Silwer, 1958[2]
1270 46 N/R 3622* 880* 4.1 2742 36
Opsahl et al., 1961[3] 116 42 13 36206* 10359* 3.5 25848 4
Davidovich et al., 1963[4] 100 4 N/R 4000* -- -- -- --
Marton et al., 1963[5] 802 16 8 1995 997 2.0 998 100
Golli et al., 1975[6] 304 12 N/R 3947* -- -- -- --
Gill et al., 1984[7] 66 7 3 10606* -- -- -- --
Tripathy et al., 1984[8] 219 9 N/R 4110 -- -- -- --
Ezung et al., 2002[9] 100 6 N/R 6000 -- -- -- --
Webb et al., 2009[10] 258 9 2 3488 -- -- -- --
Studies on screening for incident TB in DM
Lester, 1984[11] 849 29 N/R 488† -- -- -- --
Kim et al., 1995[12] 8015 45 Excluded at baseline
281† 55 5.1 226 442
--No appropriate comparison could be identified ^ computed by taking the inverse of prevalence difference
* The TB cases were determined only by X-ray, thus TB prevalence may be overestimated † The cumulative incidence in the diabetic were divided by the number of years of follow-up N/R = not reported; DM = diabetes mellitus

Table 3. Summary of studies on screening for TB infection among diabetics and selected comparison population
Study
Region, Country
Study Period Diabetes diagnosis methods
TB identification method % insulin depen-dent
% male Age distribution Comparison Population
Davidovich et al., 1963[4]
Rosario, Argentina
Not specified Diabetic patients at the clinic identified by medical records
TB infection by Mantoux Test (no distinction made for BCG vaccinated)
N/A Among DM 22%, Among TB N/A
Among DM 12% < 45 years, Among TB N/A
Annual prevalence of TB in Argentina 1964**[13]
Marton et al., 1963[5]
Hungary Summer 1960 Diabetic patients of hospital; and nondiabetic controls
TB infection TST (>=10mm) among negative X-rays
N/A Among DM 44%, Among TB N/A
Among DM Mean 58.8 for men, 60.2 for women; Among TB N/A
Non diabetics of similar age and sex distribution from the same region
Hernandez Garcia et al., 1992[14]
Elche, Spain 1986-1990 Diabetics registered at health center; identified by medical records
TB infection by TST(>=10 mm) 12% TIDM Among DM 34%, Among TB N/A
Among DM mean 62, SD 11.4, Among TB N/A
No comparison
Mansilla Bermejo et al., 1995[15]
Ciudad Real, Spain
Jun 1994 - Jul 1994
Diabetics registered at health center
TB infection by Mantoux test >=5 mm at first test, for BCG vaccinated >14mm; OR >=18mm at second test, or difference of >14 mm between first and second tests
32% Among DM 38%, Among TB N/A
Among DM mean 68, SD 9.9; Among TB
No comparison
Webb et al., 2009[10]
Western Cape, South Africa
Sept 2006 - Jan 2007
<21 year olds with T1DM diagnosed by pediatric endocrinologist
TB infection by Mantoux test (>=10mm)
100% Among DM 42%, Among TB 67%
<21 Western Cape pediatric population**
** Information on comparison group obtained in external source cited in the original paper, in other medical literature, or obtained from public database (WHO)
OGTT=oral glucose tolerance test, FBG=fasting blood glucose, PTB=pulmonary tuberculosis, TST=tuberculin skin testing, BCG=bacillus Calmette-Guerin, T1DM=type 1 diabetes mellitus
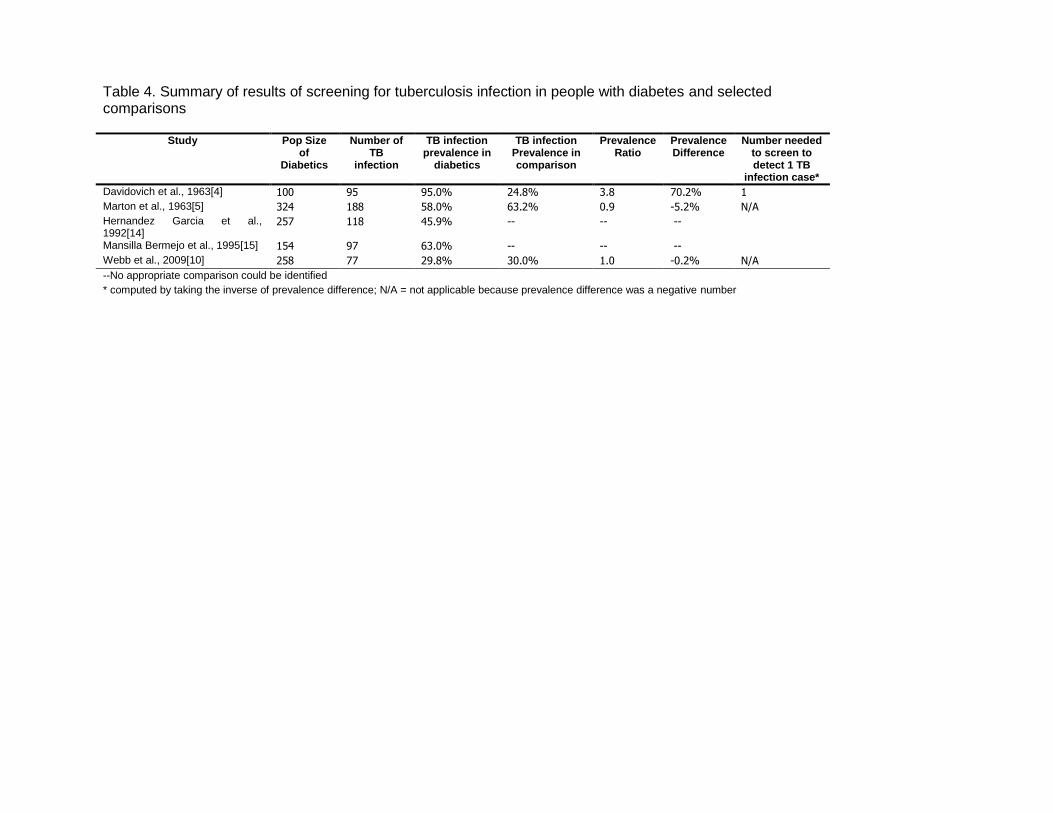
Table 4. Summary of results of screening for tuberculosis infection in people with diabetes and selected comparisons
Study Pop Size of
Diabetics
Number of TB
infection
TB infection prevalence in
diabetics
TB infection Prevalence in comparison
Prevalence Ratio
Prevalence Difference
Number needed to screen to detect 1 TB
infection case*
Davidovich et al., 1963[4] 100 95 95.0% 24.8% 3.8 70.2% 1
Marton et al., 1963[5] 324 188 58.0% 63.2% 0.9 -5.2% N/A
Hernandez Garcia et al., 1992[14]
257 118 45.9% -- -- --
Mansilla Bermejo et al., 1995[15] 154 97 63.0% -- -- --
Webb et al., 2009[10] 258 77 29.8% 30.0% 1.0 -0.2% N/A
--No appropriate comparison could be identified
* computed by taking the inverse of prevalence difference; N/A = not applicable because prevalence difference was a negative number

Table 5. Summary of studies on screening for diabetes among tuberculosis patients and selected comparison populations
Study Region, Country
Study Period
TB diagnosis method
DM diagnosis method Timing of DM
diagnosis
% Male Age distribution Comparison Population
Studies in which DM was screened for all study participants after TB Tx initiation
Nichols, 1957[16] Denver, Colorado, U.S.
N/R TB inpatients seen at the Fitzsimons Army Hospital
DM defined by following criteria 1. OGTT peak sugar > 180 mg/dl, 2. OGTT > 130mg/dl at 2 hr and 3. More than a trace of glycosuria
7-9 mo post Tx start
Among TB 100%; Among DM 100%
Among TB: Mean 27.9, Range 18-53; Among DM: Mean 33.4
No comparison
Kishore et al., 1973[17]
Agra, India Apr 1971 -Oct 1971
PTB patients diagnosed by clinical examination, sputum smear, or X-ray
DM defined by WHO 1965 criteria, OGTT(100g) 2hr >130mg/dl
3 mo post Tx start
Among TB 66%; Among DM 74%
Among TB: Mean 29.4, Range 13-61, 84%<40; Among DM: N/R
Health subjects of comparable age and sex, without family history of diabetes and tuberculosis
Kovaleva et al., 1975[18]
Moscow, Russia
N/R TB inpatients DM defined by FBG >120mg/dl, OGTT(50g) >200m/dl at 1hr, >160mg/dl at 2 hr; exclude previous diagnosed DM
post Tx start (unspecified time)
Among TB 76%; Among DM N/R
Among TB: 60%<=50; Among DM: 33%<=50
No comparison
Goyal et al., 1978[19]
Uttar Pradesh, India
N/R PTB patients diagnosed by clinical examination, sputum smear and X-ray
DM defined by WHO 1965 criteria, OGTT and cortisone primed GTT
3 mo post Tx start
Among TB 85%; Among DM N/R
Among TB: 69% <=40; Among DM: N/R
Healthy individuals of comparable age and sex without family history of diabetes and pulmonary tuberculosis
Singh et al., 1984[20]
Delhi, India N/R PTB outpatients, diagnosed by X-ray and bacteriologically confirmed
DM defined by WHO 1980 criteria, FBG >=120 mg/dl, OGTT (75g) 0.5 hr – 2hr >=180mg/dl after eating
12 wk post Tx start
Among TB 65%; Among DM N/R
Among TB: Mean 30.5, Range 19-60; Among DM: N/R
No comparison
Oluboyo and Erasmus, 1990[21]
Ilorin, Nigeria N/R Newly diagnosed PTB patients diagnosed by sputum smear and X-ray
DM defined by WHO 1980 criteria, OGTT (75g), FBG
3 mo post Tx start
Among TB 56%; Among DM N/R
Among TB: Mean 34.9, SD 14.4; Among DM: N/R
Health individuals matched by age, sex and BMI
Balde et al., 2006[22]
Conakry, Guinea
Feb 2002-May 2002
TB patients from the registry
DM defined by WHO 1999 criteria; known diabetic confirmed with FBG in capillary >1.1g/L (corresponding to venous 126mg/dl); random glycaemia in capillary > 2g/L with clinical signs
post Tx start (unspecified time)
Among TB 66%, Among DM 69%
Among TB: Mean 31, Range 14-75; Among DM: Mean 47.1, SD 13.1
No comparison

Studies in which DM was screened before TB Tx initiation
Nanda and Tripathy, 1968[23]
Orissa, India N/R PTB patients diagnosed by clinical examination, X-ray and bacteriology
DM defined by FBG>120mg/dl, OR PPGTT peak sugar >180mg/dl, OR 2 hr >130mg/dl
At diagnosis Among TB 83%; Among DM N/R
Among TB: 54%<=40; Among DM: 50%<=40
No comparison
Jawad et al., 1995[24]
Nazimabad, Pakistan
N/R PTB patients diagnosed by X-ray and sputum smear
DM defined by WHO 1985 criteria, OGTT(75g); previously known diabetics excluded
At diagnosis Among TB 59%; Among DM N/R
Among TB: Mean 39.3; 74.6% <40; Among DM: N/R
Urban population of Baluchistan, Pakistan, 1995**
Basoglu et al., 1999[25]
Izmir, Turkey N/R PTB patients diagnosed by clinical examination, X-ray and sputum smear
DM defined by OGTT(75g) 0.5 or 1hr and 2hr >200 mg/dl
At diagnosis Among TB 78%; Among DM N/R
Among TB: Mean 41.9, Range 15-82; Among DM: Mean 53.9, Range 37-82
No comparison
Alisjahbana et al., 2006[26]
Jakarta and Badung, Indonesia
Mar 2001- Mar 2005
Primary TB patients with clinical symptoms and suggestive X-ray, confirmed by + smear
DM defined by FBG >=126mg/dl At diagnosis Among TB 52%; Among DM N/R
Among TB: Median 30, Range 15-75; Among DM: Median 45
Randomly selected control of the same sex, age (+/- 10%) from same region
Studies in which timing of DM diagnosis relative to TB Tx is unclear
Higashi, 1967[27] Kyushu, Japan
Jul 1966 TB inpatients in 23 TB sanatoria
DM defined by glycosuria and venous blood 2hr after meal >120mg/dl, or capillary blood 2 hr after meal >140mg/dl
Unclear Among TB 64%; Among DM 71%
Among TB: 45.3% <40; Among DM: 20.3%<40
No comparison
Roychowdhury and Sen, 1980[28]
Calcutta, India
Apr 1975 - Mar 1976
TB inpatients diagnosed by smear, culture, X-ray or clinical symptoms suggestive of TB
DM defined by OGTT(100g) >140mg/dl at 2hr, Potential DM defined by 131-140mg/dl
Unclear Among TB 83%; Among DM N/R
Among TB: 70%<45; Among DM: 67%<45
No comparison
Deshmukh and Shaw, 1984[29]
Jamshedpur, India
N/R PTB patients diagnosed by clinical, radiological and bacteriological methods
DM defined by glucosuria and FBG >120mg/dl, OGTT (75g)>140mg/dl
Unclear Among TB 64%; Among DM 72%
Among TB: 60% <45; Among DM: 17% <45
No comparison
Tripathy et al., 1984[8]
Adra, India N/R PTB patients diagnosed by sputum smear
DM defined by WHO 1965 criteria, OGTT (100g)
Variable Among TB: N/R; Among DM N/R
Among TB: 66% <40; Among DM: 52% <40
No comparison
Mugusi et al., 1990[30]
Dar es Salaam, Tanzania
N/R PTB patients diagnosed by sputum smear
DM defined by WHO 1985 criteria, OGTT (75g) >=10mmol/L or FBG >6.7 mmol/L
Unclear Among TB 69%; Among DM N/R
Among TB: Mean 35, Range 14-88; Among DM: N/R
Urban community in Dar es Salaam
Ponce-de-Leon et al., 2004[31]
Veracruz, Mexico
Mar 1995 -Mar 2003
PTB patients confirmed by sputum smear or culture
DM defined by E11FBG>=126mg/dl OR >=200mg/dl for random samples
Unclear Among TB 66%; Among DM N/R
Among TB: Mean 44, Range19-86; Among DM: Mean 53, Range 23-82
General population of state of Veracruz (ENSA2000 diabetes survey)**
Golsha et al., 2009[32]
Gorgan, Iran 2001 - 2005
TB patients with 2 + smears or 1+ smear with abnormal X-ray, OR physician's diagnosis with response to Tx
DM defined by FBG >126mg/dl Unclear Among TB 53%; Among DM 43%
Among TB: Mean 50.2, SD 19, 30%<=40; Among DM 7% <=40
General population of Iran (National survey of diabetes conducted in 2005)**
** Comparison data from external source
N/R = not reported, PTB = pulmonary tuberculosis, FBG = fasting blood glucose, OGTT = oral glucose tolerance test, BMI = body mass index, PPGTT = prednisone-primed glucose tolerance test, Tx = TB treatment

Table 6. Summary of results on screening for diabetes in tuberculosis patients and selected comparisons
Study Pop Size of TB patients
Number of DM in TB patients
Diagnosed prior to
screening
DM Prevalence
in TB
DM Prevalence in Comparison
Prevalence or Incidence
Ratio
Prevalence or
Incidence Difference
Number needed to screen to
detect 1 DM case^
Studies in which DM was screened for all study participants after TB Tx initiation
Nichols, 1957[16] 178 9 N/R 5.1% -- -- -- --
Kishore et al., 1973[17] 90 5 4 5.6% 2.0% 2.78 3.6% 28
Kovaleva et al., 1975[18] 771 27 0 3.5% -- -- -- --
Goyal et al., 1978[19] 110 11 10 10.0% 1.3% 8.00 8.8% 11
Singh et al., 1984[20] 52 1 N/R 1.9% -- -- -- --
Oluboyo and Erasmus, 1990[21] 54 1 N/R 1.9% 0%* Infinity 1.9% 54
Balde et al., 2006[22] 388 13 9 3.4% -- -- -- --
Studies for which DM was screened before TB Tx initiation
Nanda and Tripathy, 1968[23] 200 24 N/R 12.0% -- -- -- --
Jawad et al., 1995[24] 106 21 N/R 19.8% 10.8% 1.83 9.0% 11
Basoglu et al., 1999[25] 58 5 N/R 8.6% -- -- -- --
Alisjahbana et al., 2006[26] 454 60 N/R 13.2% 3.2% 4.08 10.0% 10
Studies in which timing of screening of DM is unclear
Higashi, 1967[27] 6065 222 109 3.7% -- -- -- --
Roychowdhury and Sen, 1980[28]
961 199 N/R 20.7% -- -- -- --
Deshmukh and Shaw, 1984[29] 2434 138 60 5.7% -- -- -- --
Tripathy et al., 1984[8] 1359 29 9 2.1% -- -- -- --
Mugusi et al., 1990[30] 506 34 N/R 6.7% 0.9% 7.81 5.9% 17
Ponce-de-Leon et al., 2004[31] 525 185 172 35.2% 7.6% 4.63 27.6% 4
Golsha et al., 2009[32] 243 56 N/R 23.0% 7.7% 2.99 15.3% 7
* No DM was found a control population of 54 health individuals who were also screened for DM ^ computed by taking the inverse of prevalence difference
--No appropriate comparison could be identified
Tx = TB treatment
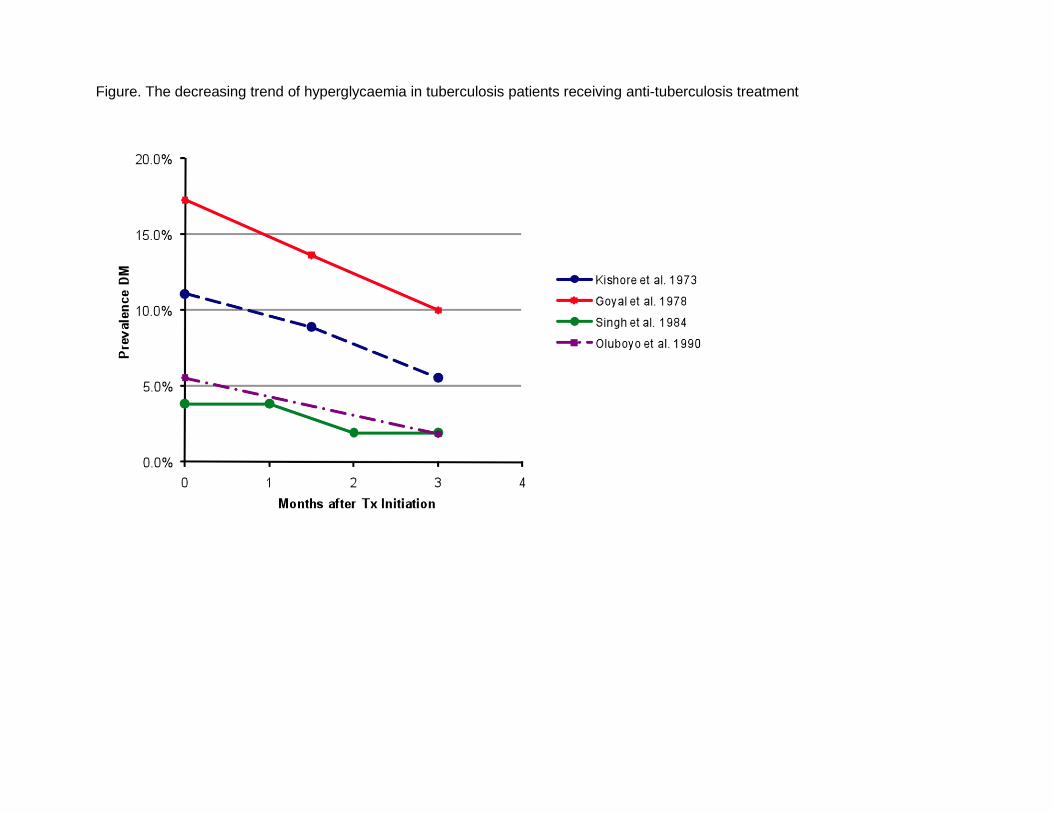
Figure. The decreasing trend of hyperglycaemia in tuberculosis patients receiving anti-tuberculosis treatment

Summary of two studies on tuberculosis preventive therapy in patients with diabetes
We identified two observational studies in which people with diabetes had been administered
chemopropylaxis for prevention of TB. In a study conducted in Germany [33] in the 1950s, 63
diabetes patients who had completed a course of treatment for active TB were subsequently
treated with isoniazid for 6–24 months while a comparison group of 164 people with diabetes
completing treatment for active TB was not treated. While the comparison group accrued 18
cases of recurrent TB over a mean of 2.3 years of follow up time, the intervention group
experienced no recurrent TB over 1.6 years of follow up time. In a second study conducted in the
Russian Federation in the 1960s [34], investigators administered ftivazid, a Russian analog of
isoniazid, to 2006 diabetes patients and compared their course to 387 controls who were not
treated. Treated patients were reported to experience 2–3 times lower incidence of TB compared
with controls who did not receive any ftivazid during a follow-up period of five years. The study
did not report raw numbers of TB cases, specify whether the follow-up period occurred during the
intervention or afterwards, nor indicate the reasons for not administering ftivazid in the control
group.

References 1. Boucot KR et al. Tuberculosis among diabetics: the Philadelphia survey. American
Review of Tuberculosis, 1952, 65(1:2):1–50. 2. Oscarsson PNS, H. Incidence and coincidence of diabetes mellitus and pulmonary
tuberculosis in a Swedish county. Acta Med Scand Suppl, 1958, 335:22–48. 3. Opsahl R, Riddervold HO, Wessel A. Pulmonary tuberculosis in mitral stenosis and
diabetes mellitus. Acta Tuberculosea Scandinavica, 1961, 40:290–296. 4. Davidovich D, Aiello CR, Hassan IA. [Antitubercular preventive examination in diabetics.]
Sem Med, 1963, 122:781–784. 5. Marton S et al. [Representative tuberculosis mass examinations in diabetics in Hungary.]
Acta tuberculosea et pneumologica Scandinavica, 1963, 43:29–38. 6. Golli V et al. [Incidence of pulmonary tuberculosis in diabetics (author's transl)]. MMW
Munch Med Wochenschr, 1975, 117(3):93–96. 7. Gill GV, Huddle KR, Krige LP. Intensive health screening of young Black diabetics.
South African Medical Journal, 1984, 65(20):815–816. 8. Tripathy SR et al. Diabetes mellitus and pulmonary tuberculosis. A prospective study.
Indian Journal of Tuberculosis, 1984, 31(3):122–125. 9. Ezung T et al. Pulmonary tuberculosis and diabetes mellitus--a study. Journal of the
Indian Medical Association, 2002, 100(6):376, 8–9. 10. Webb EA et al. High prevalence of Mycobacterium tuberculosis infection and disease in
children and adolescents with type 1 diabetes mellitus. International Journal of Tuberculosis and Lung Disease, 2009, 13(7):868–874.
11. Lester FT. Tuberculosis in Ethiopian diabetics. Ethiopian Medical Journal, 1984, 22(3):129–133.
12. Kim SJ et al. Incidence of pulmonary tuberculosis among diabetics. Tubercle and Lung Disease, 1995, 76(6):529–533.
13. Indices Epidemiologicos Actuales De la Tuberculosis en la Ciudad de Buenos Aires. Vol. Tomo 1: XI Congreso Argentino de Tisiologia y Neumonologia, 1967:25–27.
14. Hernandez Garcia P, Martinez Cruz F, Cayuelas Martinez T. [PPD and chemoprophylaxis in diabetes mellitus]. Aten Primaria, 1992, 9(2):106–108.
15. Mansilla Bermejo MJ et al. [Tuberculin test in diabetic patients in a health center]. Aten Primaria, 1995, 16(3):154–157.
16. Nichols GP. Diabetes among young tuberculous patients; a review of the association of the two diseases. American Review of Tuberculosis, 1957, 76(6):1016–1030.
17. Kishore B et al. Manifest, chemical and latent chemical diabetes in pulmonary tuberculosis. Journal of Associations of Physicians of India, 1973, 21(10):875–881.
18. Kovaleva SI, Gaponova SA, Abrosimova NN. [Diabetes mellitus in patients with pulmonary tuberculosis]. Probl Tuberk, 1975, (3):43–45.
19. Goyal BN et al. Study of diabetic status in pulmonary tuberculosis. Journal of Diabetes Association in India, 1978,18:191–197.
20. Singh MM, Biswas SK, Shah A. Impaired glucose tolerance in active pulmonary tuberculosis. Indian Journal of Tuberculosis, 1984, 31(3):118–121.
21. Oluboyo PO, Erasmus RT. The significance of glucose intolerance in pulmonary tuberculosis. Tubercle, 1990, 71(2):135–138.
22. Balde NM et al. Associated tuberculosis and diabetes in Conakry, Guinea: prevalence and clinical characteristics. International Journal of Tuberculosis and Lung Disease, 2006, 10(9):1036–1040.
23. Nanda CN, Tripathy SN. Association of diabetes mellitus with pulmonary tuberculosis. Journal of Associations of Physicians of India, 1968, 16(10):741–746.

24. Jawad F et al. Glucose intolerance in pulmonary tuberculosis. Journal of Pakistan Medical Association, 1995, 45(9):237–238.
25. Basoglu OK et al. The oral glucose tolerance test in patients with respiratory infections. Monaldi Archives for Chest Disease, 1999, 54(4):307–310.
26. Alisjahbana B et al. Diabetes mellitus is strongly associated with tuberculosis in Indonesia. International Journal of Tuberculosis and Lung Disease, 2006, 10(6):696–700.
27. Higashi H. [Screening test for diabetes in tuberculous sanatoria]. Iryo, 1967, 21(3):361–368.
28. Roychowdhury AB, Sen PK. Diabetes in tuberculosis patients. Journal of the Indian Medical Association, 1980, 74(1):8–15.
29. Deshmukh PA, Shaw T. Pulmonary tuberculosis and diabetes mellitus. Indian Journal of Tuberculosis, 1984, 31(3):114–117.
30. Mugusi F et al. Increased prevalence of diabetes mellitus in patients with pulmonary tuberculosis in Tanzania. Tubercle, 1990, 71(4):271–276.
31. Ponce-De-Leon A et al. Tuberculosis and diabetes in southern Mexico. Diabetes Care, 2004, 27(7):1584–1590.
32. Golsha R et al. Pulmonary tuberculosis and some underlying conditions in Golestan Province of Iran, during 2001–2005. Journal of Clinical and Diagnostic Research, 2009, 3(1):1302–1306.
33. Pfaffenberg R, Jahler H. [Isoniazid & recurrence of tuberculosis in diabetics.]. Z Tuberk, 1958, 111(3–4):167–173.
34. Lesnichii AV, Karpina LZ. [Experience with the chemoprophylaxis of pulmonary tuberculosis in diabetes mellitus patients]. Probl Tuberk, 1969, 47(12):1–3.