
Institutionalizing Collaborative Research in Marine Conservation Amy Freitag, PhD.
Upload
truongcongCategory
view
214download
0
Collaborative Energy Conservation in a Microgrid
Mohit JainI , Harshad KhadilkarI , Neha SenguptaI∗, Zainul CharbiwalaI ,Kushan U TennakoonB , Rodzay bin Haji Abdul WahabB ,Liyanage Chandratilak De SilvaU , Deva P. SeetharamI∗
I IBM Research, B Institute for Biodiversity & Environmental Research,UUniversiti Brunei Darussalam
{mohitjain,harshad.khadilkar,zainulcharbiwala}@in.ibm.com
AbstractKBFSC (Kuala Belalong Field Studies Centre) is a re-
search centre located in a remote tropical evergreen rainfor-est in Brunei Darussalam in South East Asia. It is visited bybiologists and ecologists from all over the world. Power isavailable at the centre for 8-10 hours per day from a dieselgenerator (DG). The diesel travels2-3 hours by road, by boatand on foot over harsh terrain to reach the centre from theclosest gas station. This paper describes the software andhardware of a microgrid system that was designed and de-ployed at KBFSC to reduce the fuel consumption while im-proving duration of power availability. A key feature ofthe energy management software is a collaborative sched-uler interface that provides visitors at the centre the choice ofscheduling appliance usage. The system optimises generatoractive hours using a customised DG Optimiser technique, toensure minimum diesel consumption. Simulations extrapo-lating from empirical data suggest that our system could re-duce diesel consumption by a third, and total cost by 20%,while making power available 24 hours a day. In addition, auser study with 8 visitors and 4 administrators showed thatthe collaborative scheduler interface is effective and usable.Categories and Subject Descriptors
C.3 [Computer systems organization]: Special-purposeand application-based systemsGeneral Terms
Design; Experimentation; PerformanceKeywords
Microgrid; Scheduling; Dynamic Programming1 Introduction
Microgrids [10] are emerging as a potential solution tothe problem of remote electrification, where it is either im-
∗Work completed at IBM Researchc©2014 Association for Computing Machinery. ACM acknowledges that this
contribution was authored or co-authored by an employee, contractor or affiliate of anational government. As such, the Government retains a nonexclusive, royalty-freeright to publish or reproduce this article, or to allow others to do so, for Governmentpurposes only.
BuildSys’14, November 5–6, 2014, Memphis, TN, USA.Copyright 2014 ACM 978-1-4503-3144-9/14/11 ...$15.00http://dx.doi.org/10.1145/2674061.2674079
practical and/or uneconomical to extend the electricity grid[3]. Microgrids combine local sources of energy to form aminiature grid to which consumers can be connected to drawpower as needed. While renewable sources of energy arepicking up pace, a majority of remote locations still rely ondiesel generators (DGs) [4] since they are simple to set up,lower in capital expenditure, and are available for use on-demand. The inherent remoteness of these locations makestransportation of diesel to these places an arduous task. TheKuala Belalong Field Studies Center (KBFSC) is a remotecampus located within the scientific zone of a tropical rain-forest in the Temburong District of Brunei Darussalam [8].The center is not connected to the electricity grid, and isinstead powered by a diesel generator. The generator atKBFSC is typically operated on a fixed schedule between6am-8am and 4pm-11pm (≈9 hours/day), consuming 30-50litres of diesel per day. The diesel is periodically suppliedthrough a laborious process involving road- and water-basedtransport.
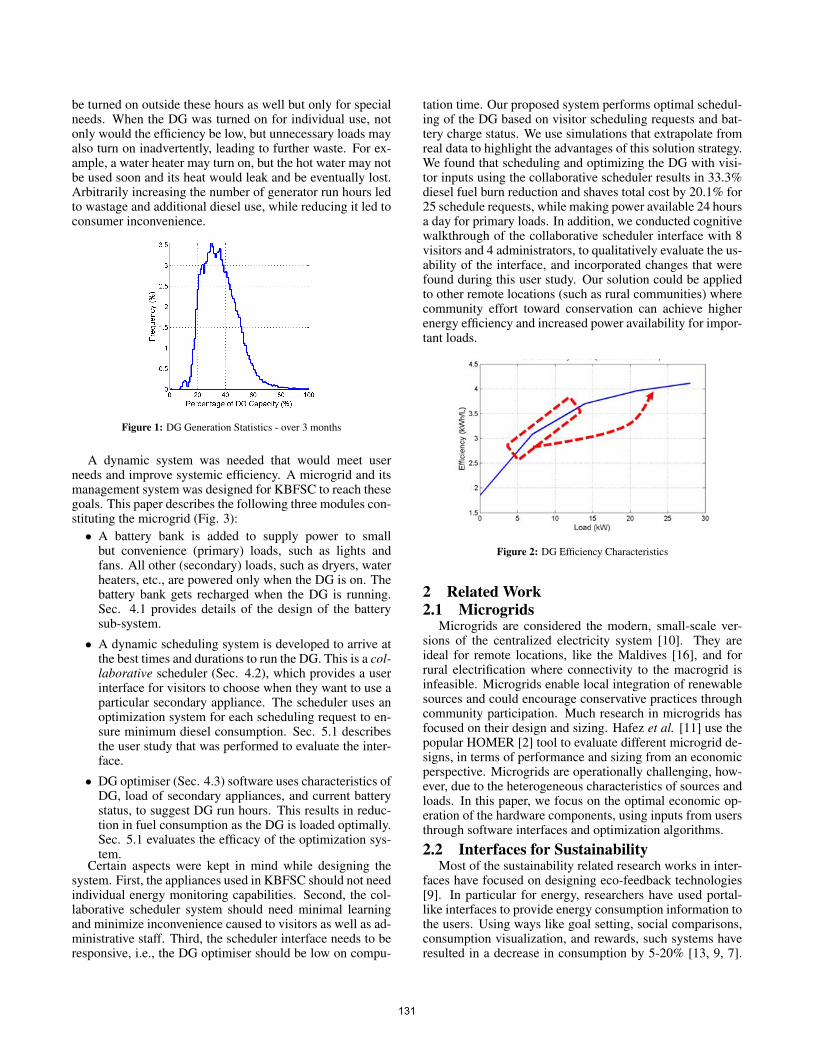
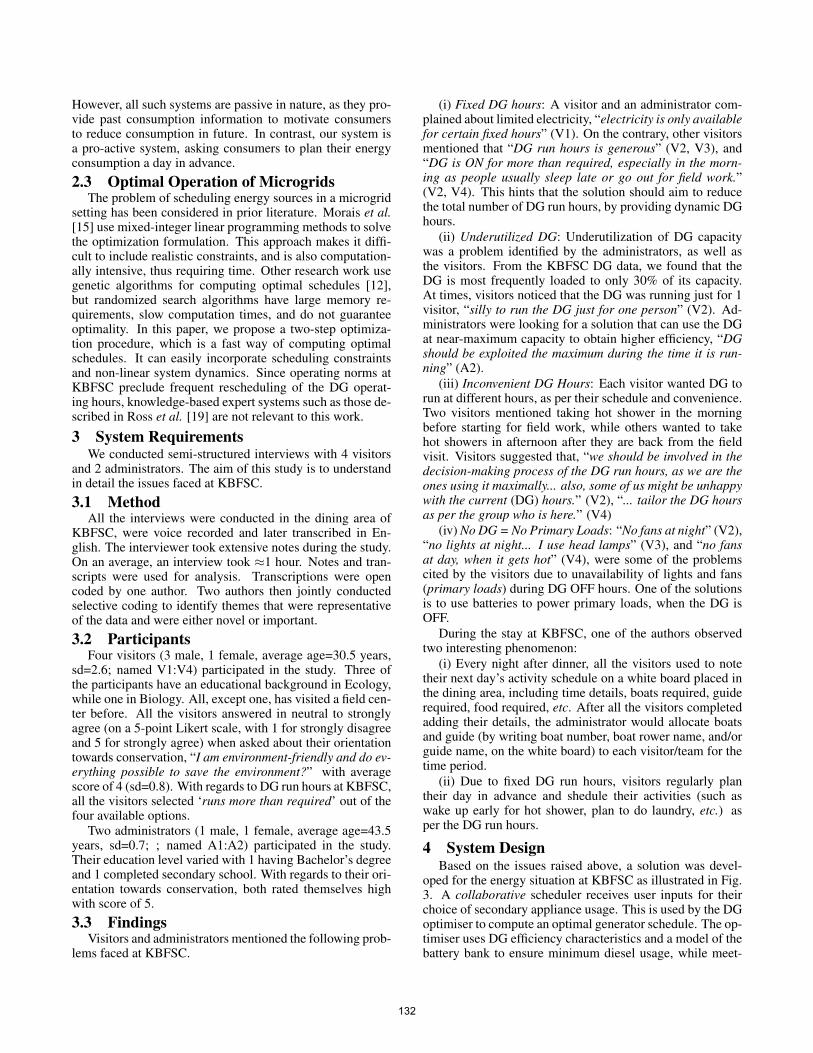
The objectives for an energy solution at KBFSC werethreefold: (i) increase the duration of power availability, (ii)reduce diesel consumption, and (iii) minimize user inconve-nience. Through discussions with administrators and visitorsat the center and through energy instrumentation and analy-sis of power and fuel data, we discovered a number of issues.First, we found that during much of the fixed times that thegenerator was turned on, it powered only light loads. The DGwas, therefore, frequently loaded to only 30% of its capac-ity (Fig. 1). Through further instrumentation, we discoveredthat the fuel efficiency characteristics of the DG is particu-larly non-linear. While efficiency non-linearity is inherent toall generators [18], DGs are typically sized to operate in therelatively flat portion of their efficiency curve. At KBFSC,however, the DG is sized for worst case load (a full center)and the average case load falls well below its flat portion (seeFig. 2). Improving this efficiency could lead us to significantdiesel savings without affecting the overall energy genera-tion.
A second aspect of the energy problem stemmed fromfixed generator timings. On one hand, the DG stayed on evenduring times when no (or small) loads were needed. On theother hand, consumers would need to time-shift their con-sumption just to use some appliances. The generator could
130
be turned on outside these hours as well but only for specialneeds. When the DG was turned on for individual use, notonly would the efficiency be low, but unnecessary loads mayalso turn on inadvertently, leading to further waste. For ex-ample, a water heater may turn on, but the hot water may notbe used soon and its heat would leak and be eventually lost.Arbitrarily increasing the number of generator run hours ledto wastage and additional diesel use, while reducing it led toconsumer inconvenience.
Figure 1: DG Generation Statistics - over 3 months
A dynamic system was needed that would meet userneeds and improve systemic efficiency. A microgrid and itsmanagement system was designed for KBFSC to reach thesegoals. This paper describes the following three modules con-stituting the microgrid (Fig. 3):• A battery bank is added to supply power to small
but convenience (primary) loads, such as lights andfans. All other (secondary) loads, such as dryers, waterheaters, etc., are powered only when the DG is on. Thebattery bank gets recharged when the DG is running.Sec. 4.1 provides details of the design of the batterysub-system.
• A dynamic scheduling system is developed to arrive atthe best times and durations to run the DG. This is a col-laborative scheduler (Sec. 4.2), which provides a userinterface for visitors to choose when they want to use aparticular secondary appliance. The scheduler uses anoptimization system for each scheduling request to en-sure minimum diesel consumption. Sec. 5.1 describesthe user study that was performed to evaluate the inter-face.
• DG optimiser (Sec. 4.3) software uses characteristics ofDG, load of secondary appliances, and current batterystatus, to suggest DG run hours. This results in reduc-tion in fuel consumption as the DG is loaded optimally.Sec. 5.1 evaluates the efficacy of the optimization sys-tem.
Certain aspects were kept in mind while designing thesystem. First, the appliances used in KBFSC should not needindividual energy monitoring capabilities. Second, the col-laborative scheduler system should need minimal learningand minimize inconvenience caused to visitors as well as ad-ministrative staff. Third, the scheduler interface needs to beresponsive, i.e., the DG optimiser should be low on compu-
tation time. Our proposed system performs optimal schedul-ing of the DG based on visitor scheduling requests and bat-tery charge status. We use simulations that extrapolate fromreal data to highlight the advantages of this solution strategy.We found that scheduling and optimizing the DG with visi-tor inputs using the collaborative scheduler results in 33.3%diesel fuel burn reduction and shaves total cost by 20.1% for25 schedule requests, while making power available 24 hoursa day for primary loads. In addition, we conducted cognitivewalkthrough of the collaborative scheduler interface with 8visitors and 4 administrators, to qualitatively evaluate the us-ability of the interface, and incorporated changes that werefound during this user study. Our solution could be appliedto other remote locations (such as rural communities) wherecommunity effort toward conservation can achieve higherenergy efficiency and increased power availability for impor-tant loads.
Figure 2: DG Efficiency Characteristics
2 Related Work2.1 Microgrids
Microgrids are considered the modern, small-scale ver-sions of the centralized electricity system [10]. They areideal for remote locations, like the Maldives [16], and forrural electrification where connectivity to the macrogrid isinfeasible. Microgrids enable local integration of renewablesources and could encourage conservative practices throughcommunity participation. Much research in microgrids hasfocused on their design and sizing. Hafez et al. [11] use thepopular HOMER [2] tool to evaluate different microgrid de-signs, in terms of performance and sizing from an economicperspective. Microgrids are operationally challenging, how-ever, due to the heterogeneous characteristics of sources andloads. In this paper, we focus on the optimal economic op-eration of the hardware components, using inputs from usersthrough software interfaces and optimization algorithms.
2.2 Interfaces for SustainabilityMost of the sustainability related research works in inter-
faces have focused on designing eco-feedback technologies[9]. In particular for energy, researchers have used portal-like interfaces to provide energy consumption information tothe users. Using ways like goal setting, social comparisons,consumption visualization, and rewards, such systems haveresulted in a decrease in consumption by 5-20% [13, 9, 7].
131
However, all such systems are passive in nature, as they pro-vide past consumption information to motivate consumersto reduce consumption in future. In contrast, our system isa pro-active system, asking consumers to plan their energyconsumption a day in advance.2.3 Optimal Operation of Microgrids
The problem of scheduling energy sources in a microgridsetting has been considered in prior literature. Morais et al.[15] use mixed-integer linear programming methods to solvethe optimization formulation. This approach makes it diffi-cult to include realistic constraints, and is also computation-ally intensive, thus requiring time. Other research work usegenetic algorithms for computing optimal schedules [12],but randomized search algorithms have large memory re-quirements, slow computation times, and do not guaranteeoptimality. In this paper, we propose a two-step optimiza-tion procedure, which is a fast way of computing optimalschedules. It can easily incorporate scheduling constraintsand non-linear system dynamics. Since operating norms atKBFSC preclude frequent rescheduling of the DG operat-ing hours, knowledge-based expert systems such as those de-scribed in Ross et al. [19] are not relevant to this work.
3 System RequirementsWe conducted semi-structured interviews with 4 visitors
and 2 administrators. The aim of this study is to understandin detail the issues faced at KBFSC.3.1 Method
All the interviews were conducted in the dining area ofKBFSC, were voice recorded and later transcribed in En-glish. The interviewer took extensive notes during the study.On an average, an interview took ≈1 hour. Notes and tran-scripts were used for analysis. Transcriptions were opencoded by one author. Two authors then jointly conductedselective coding to identify themes that were representativeof the data and were either novel or important.3.2 Participants
Four visitors (3 male, 1 female, average age=30.5 years,sd=2.6; named V1:V4) participated in the study. Three ofthe participants have an educational background in Ecology,while one in Biology. All, except one, has visited a field cen-ter before. All the visitors answered in neutral to stronglyagree (on a 5-point Likert scale, with 1 for strongly disagreeand 5 for strongly agree) when asked about their orientationtowards conservation, “I am environment-friendly and do ev-erything possible to save the environment?” with averagescore of 4 (sd=0.8). With regards to DG run hours at KBFSC,all the visitors selected ‘runs more than required’ out of thefour available options.
Two administrators (1 male, 1 female, average age=43.5years, sd=0.7; ; named A1:A2) participated in the study.Their education level varied with 1 having Bachelor’s degreeand 1 completed secondary school. With regards to their ori-entation towards conservation, both rated themselves highwith score of 5.3.3 Findings
Visitors and administrators mentioned the following prob-lems faced at KBFSC.
(i) Fixed DG hours: A visitor and an administrator com-plained about limited electricity, “electricity is only availablefor certain fixed hours” (V1). On the contrary, other visitorsmentioned that “DG run hours is generous” (V2, V3), and“DG is ON for more than required, especially in the morn-ing as people usually sleep late or go out for field work.”(V2, V4). This hints that the solution should aim to reducethe total number of DG run hours, by providing dynamic DGhours.
(ii) Underutilized DG: Underutilization of DG capacitywas a problem identified by the administrators, as well asthe visitors. From the KBFSC DG data, we found that theDG is most frequently loaded to only 30% of its capacity.At times, visitors noticed that the DG was running just for 1visitor, “silly to run the DG just for one person” (V2). Ad-ministrators were looking for a solution that can use the DGat near-maximum capacity to obtain higher efficiency, “DGshould be exploited the maximum during the time it is run-ning” (A2).
(iii) Inconvenient DG Hours: Each visitor wanted DG torun at different hours, as per their schedule and convenience.Two visitors mentioned taking hot shower in the morningbefore starting for field work, while others wanted to takehot showers in afternoon after they are back from the fieldvisit. Visitors suggested that, “we should be involved in thedecision-making process of the DG run hours, as we are theones using it maximally... also, some of us might be unhappywith the current (DG) hours.” (V2), “... tailor the DG hoursas per the group who is here.” (V4)
(iv) No DG = No Primary Loads: “No fans at night” (V2),“no lights at night... I use head lamps” (V3), and “no fansat day, when it gets hot” (V4), were some of the problemscited by the visitors due to unavailability of lights and fans(primary loads) during DG OFF hours. One of the solutionsis to use batteries to power primary loads, when the DG isOFF.
During the stay at KBFSC, one of the authors observedtwo interesting phenomenon:
(i) Every night after dinner, all the visitors used to notetheir next day’s activity schedule on a white board placed inthe dining area, including time details, boats required, guiderequired, food required, etc. After all the visitors completedadding their details, the administrator would allocate boatsand guide (by writing boat number, boat rower name, and/orguide name, on the white board) to each visitor/team for thetime period.
(ii) Due to fixed DG run hours, visitors regularly plantheir day in advance and shedule their activities (such aswake up early for hot shower, plan to do laundry, etc.) asper the DG run hours.
4 System DesignBased on the issues raised above, a solution was devel-
oped for the energy situation at KBFSC as illustrated in Fig.3. A collaborative scheduler receives user inputs for theirchoice of secondary appliance usage. This is used by the DGoptimiser to compute an optimal generator schedule. The op-timiser uses DG efficiency characteristics and a model of thebattery bank to ensure minimum diesel usage, while meet-
132
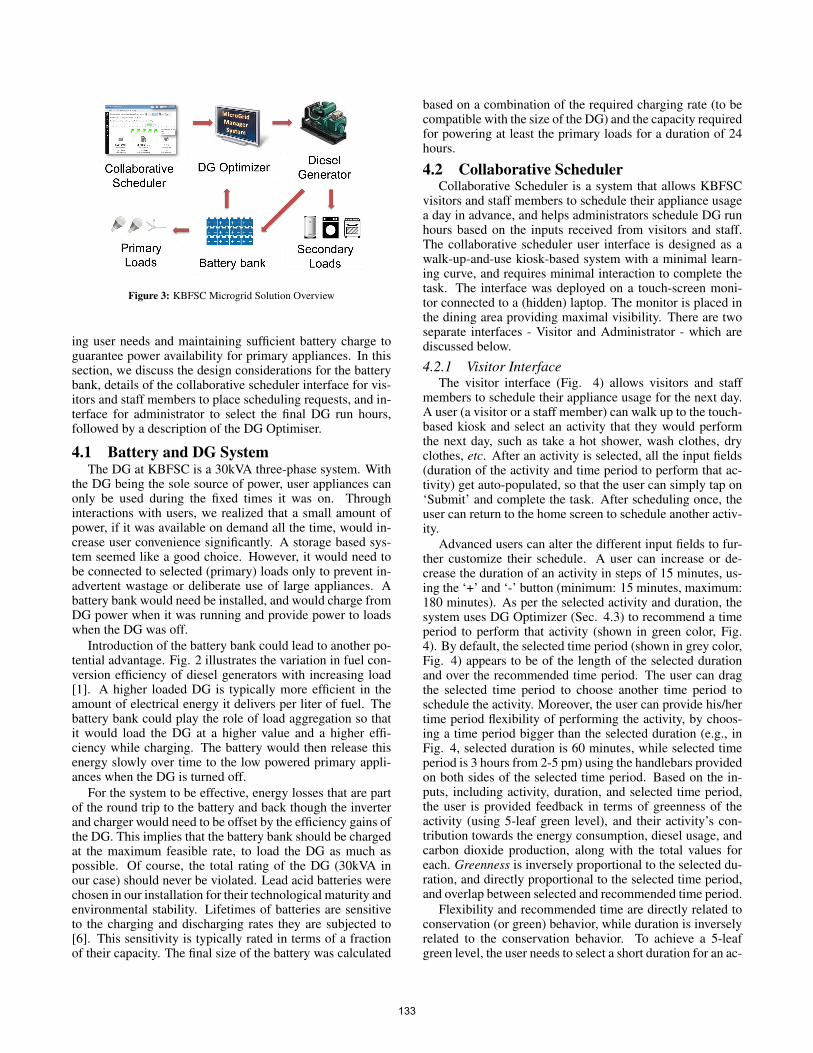
Figure 3: KBFSC Microgrid Solution Overview
ing user needs and maintaining sufficient battery charge toguarantee power availability for primary appliances. In thissection, we discuss the design considerations for the batterybank, details of the collaborative scheduler interface for vis-itors and staff members to place scheduling requests, and in-terface for administrator to select the final DG run hours,followed by a description of the DG Optimiser.
4.1 Battery and DG SystemThe DG at KBFSC is a 30kVA three-phase system. With
the DG being the sole source of power, user appliances canonly be used during the fixed times it was on. Throughinteractions with users, we realized that a small amount ofpower, if it was available on demand all the time, would in-crease user convenience significantly. A storage based sys-tem seemed like a good choice. However, it would need tobe connected to selected (primary) loads only to prevent in-advertent wastage or deliberate use of large appliances. Abattery bank would need be installed, and would charge fromDG power when it was running and provide power to loadswhen the DG was off.
Introduction of the battery bank could lead to another po-tential advantage. Fig. 2 illustrates the variation in fuel con-version efficiency of diesel generators with increasing load[1]. A higher loaded DG is typically more efficient in theamount of electrical energy it delivers per liter of fuel. Thebattery bank could play the role of load aggregation so thatit would load the DG at a higher value and a higher effi-ciency while charging. The battery would then release thisenergy slowly over time to the low powered primary appli-ances when the DG is turned off.
For the system to be effective, energy losses that are partof the round trip to the battery and back though the inverterand charger would need to be offset by the efficiency gains ofthe DG. This implies that the battery bank should be chargedat the maximum feasible rate, to load the DG as much aspossible. Of course, the total rating of the DG (30kVA inour case) should never be violated. Lead acid batteries werechosen in our installation for their technological maturity andenvironmental stability. Lifetimes of batteries are sensitiveto the charging and discharging rates they are subjected to[6]. This sensitivity is typically rated in terms of a fractionof their capacity. The final size of the battery was calculated
based on a combination of the required charging rate (to becompatible with the size of the DG) and the capacity requiredfor powering at least the primary loads for a duration of 24hours.
4.2 Collaborative SchedulerCollaborative Scheduler is a system that allows KBFSC
visitors and staff members to schedule their appliance usagea day in advance, and helps administrators schedule DG runhours based on the inputs received from visitors and staff.The collaborative scheduler user interface is designed as awalk-up-and-use kiosk-based system with a minimal learn-ing curve, and requires minimal interaction to complete thetask. The interface was deployed on a touch-screen moni-tor connected to a (hidden) laptop. The monitor is placed inthe dining area providing maximal visibility. There are twoseparate interfaces - Visitor and Administrator - which arediscussed below.
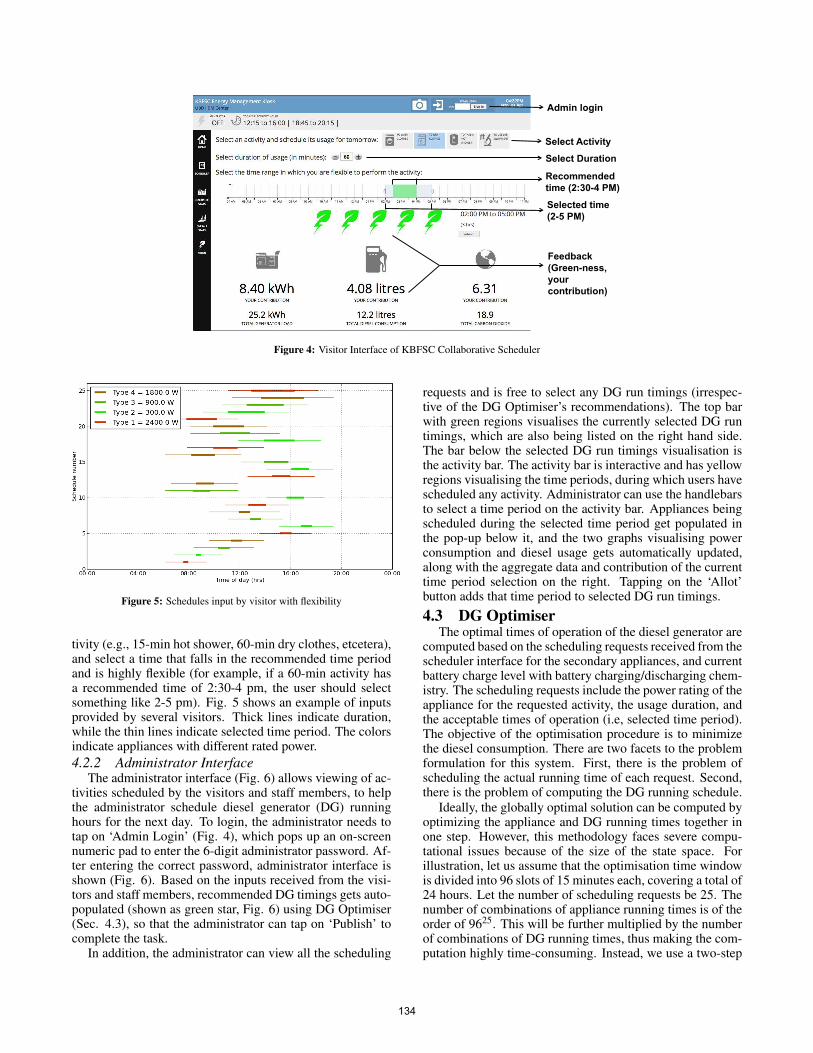
4.2.1 Visitor InterfaceThe visitor interface (Fig. 4) allows visitors and staff
members to schedule their appliance usage for the next day.A user (a visitor or a staff member) can walk up to the touch-based kiosk and select an activity that they would performthe next day, such as take a hot shower, wash clothes, dryclothes, etc. After an activity is selected, all the input fields(duration of the activity and time period to perform that ac-tivity) get auto-populated, so that the user can simply tap on‘Submit’ and complete the task. After scheduling once, theuser can return to the home screen to schedule another activ-ity.
Advanced users can alter the different input fields to fur-ther customize their schedule. A user can increase or de-crease the duration of an activity in steps of 15 minutes, us-ing the ‘+’ and ‘-’ button (minimum: 15 minutes, maximum:180 minutes). As per the selected activity and duration, thesystem uses DG Optimizer (Sec. 4.3) to recommend a timeperiod to perform that activity (shown in green color, Fig.4). By default, the selected time period (shown in grey color,Fig. 4) appears to be of the length of the selected durationand over the recommended time period. The user can dragthe selected time period to choose another time period toschedule the activity. Moreover, the user can provide his/hertime period flexibility of performing the activity, by choos-ing a time period bigger than the selected duration (e.g., inFig. 4, selected duration is 60 minutes, while selected timeperiod is 3 hours from 2-5 pm) using the handlebars providedon both sides of the selected time period. Based on the in-puts, including activity, duration, and selected time period,the user is provided feedback in terms of greenness of theactivity (using 5-leaf green level), and their activity’s con-tribution towards the energy consumption, diesel usage, andcarbon dioxide production, along with the total values foreach. Greenness is inversely proportional to the selected du-ration, and directly proportional to the selected time period,and overlap between selected and recommended time period.
Flexibility and recommended time are directly related toconservation (or green) behavior, while duration is inverselyrelated to the conservation behavior. To achieve a 5-leafgreen level, the user needs to select a short duration for an ac-
133
Select Activity
Select Duration
Recommended time (2:30-4 PM)
Admin login
Selected time (2-5 PM)
Feedback (Green-ness, your contribution)
Figure 4: Visitor Interface of KBFSC Collaborative Scheduler
Figure 5: Schedules input by visitor with flexibility
tivity (e.g., 15-min hot shower, 60-min dry clothes, etcetera),and select a time that falls in the recommended time periodand is highly flexible (for example, if a 60-min activity hasa recommended time of 2:30-4 pm, the user should selectsomething like 2-5 pm). Fig. 5 shows an example of inputsprovided by several visitors. Thick lines indicate duration,while the thin lines indicate selected time period. The colorsindicate appliances with different rated power.4.2.2 Administrator Interface
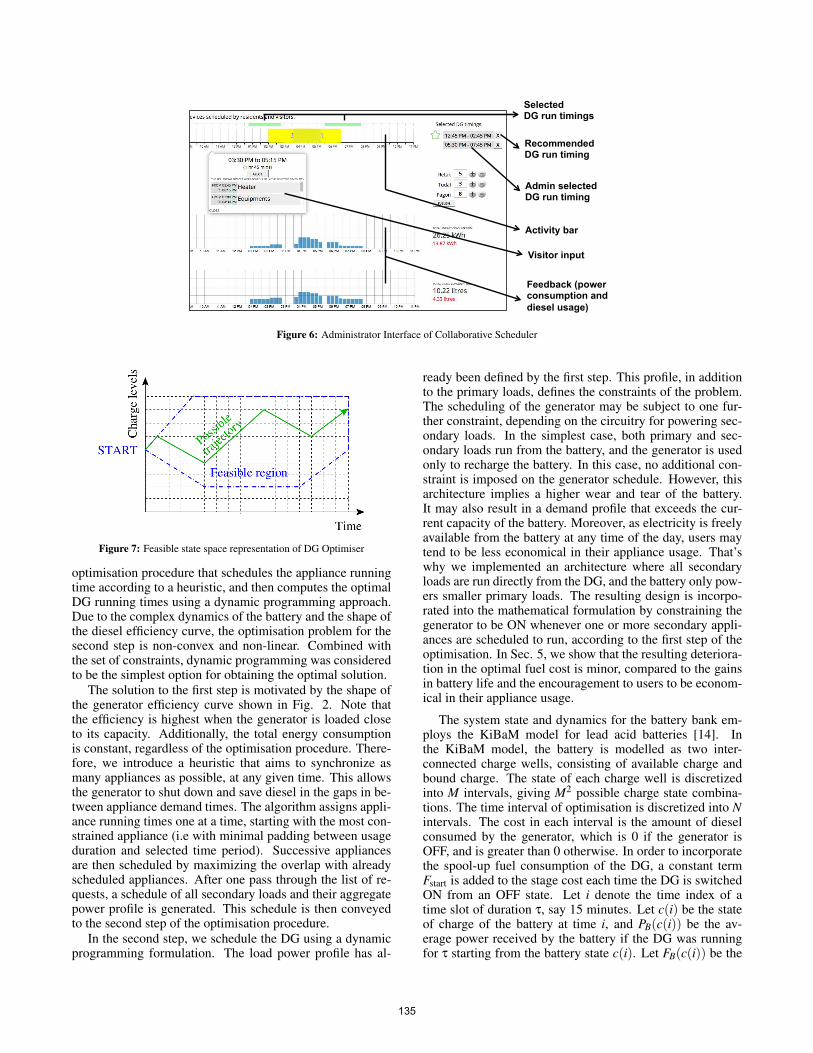
The administrator interface (Fig. 6) allows viewing of ac-tivities scheduled by the visitors and staff members, to helpthe administrator schedule diesel generator (DG) runninghours for the next day. To login, the administrator needs totap on ‘Admin Login’ (Fig. 4), which pops up an on-screennumeric pad to enter the 6-digit administrator password. Af-ter entering the correct password, administrator interface isshown (Fig. 6). Based on the inputs received from the visi-tors and staff members, recommended DG timings gets auto-populated (shown as green star, Fig. 6) using DG Optimiser(Sec. 4.3), so that the administrator can tap on ‘Publish’ tocomplete the task.
In addition, the administrator can view all the scheduling
requests and is free to select any DG run timings (irrespec-tive of the DG Optimiser’s recommendations). The top barwith green regions visualises the currently selected DG runtimings, which are also being listed on the right hand side.The bar below the selected DG run timings visualisation isthe activity bar. The activity bar is interactive and has yellowregions visualising the time periods, during which users havescheduled any activity. Administrator can use the handlebarsto select a time period on the activity bar. Appliances beingscheduled during the selected time period get populated inthe pop-up below it, and the two graphs visualising powerconsumption and diesel usage gets automatically updated,along with the aggregate data and contribution of the currenttime period selection on the right. Tapping on the ‘Allot’button adds that time period to selected DG run timings.
4.3 DG OptimiserThe optimal times of operation of the diesel generator are
computed based on the scheduling requests received from thescheduler interface for the secondary appliances, and currentbattery charge level with battery charging/discharging chem-istry. The scheduling requests include the power rating of theappliance for the requested activity, the usage duration, andthe acceptable times of operation (i.e, selected time period).The objective of the optimisation procedure is to minimizethe diesel consumption. There are two facets to the problemformulation for this system. First, there is the problem ofscheduling the actual running time of each request. Second,there is the problem of computing the DG running schedule.
Ideally, the globally optimal solution can be computed byoptimizing the appliance and DG running times together inone step. However, this methodology faces severe compu-tational issues because of the size of the state space. Forillustration, let us assume that the optimisation time windowis divided into 96 slots of 15 minutes each, covering a total of24 hours. Let the number of scheduling requests be 25. Thenumber of combinations of appliance running times is of theorder of 9625. This will be further multiplied by the numberof combinations of DG running times, thus making the com-putation highly time-consuming. Instead, we use a two-step
134
Recommended DG run timing
Feedback (power consumption and diesel usage)
Admin selected DG run timing
Selected DG run timings
Activity bar
Visitor input
Figure 6: Administrator Interface of Collaborative Scheduler
Figure 7: Feasible state space representation of DG Optimiser
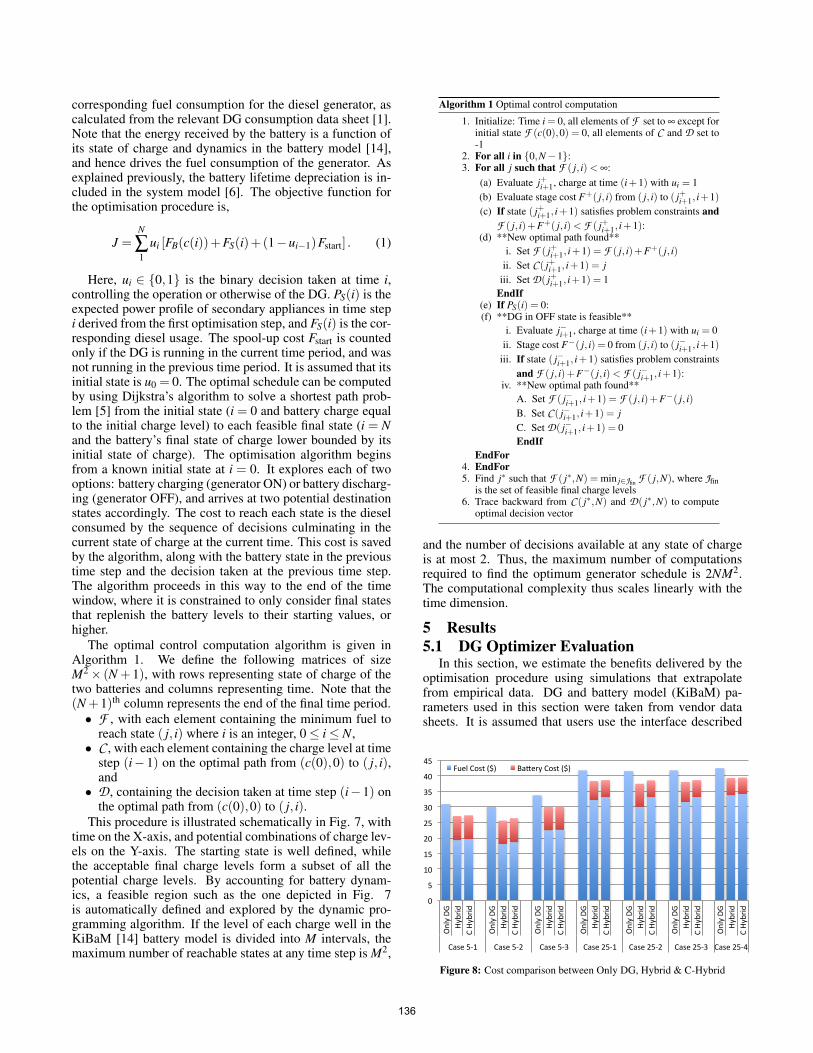
optimisation procedure that schedules the appliance runningtime according to a heuristic, and then computes the optimalDG running times using a dynamic programming approach.Due to the complex dynamics of the battery and the shape ofthe diesel efficiency curve, the optimisation problem for thesecond step is non-convex and non-linear. Combined withthe set of constraints, dynamic programming was consideredto be the simplest option for obtaining the optimal solution.
The solution to the first step is motivated by the shape ofthe generator efficiency curve shown in Fig. 2. Note thatthe efficiency is highest when the generator is loaded closeto its capacity. Additionally, the total energy consumptionis constant, regardless of the optimisation procedure. There-fore, we introduce a heuristic that aims to synchronize asmany appliances as possible, at any given time. This allowsthe generator to shut down and save diesel in the gaps in be-tween appliance demand times. The algorithm assigns appli-ance running times one at a time, starting with the most con-strained appliance (i.e with minimal padding between usageduration and selected time period). Successive appliancesare then scheduled by maximizing the overlap with alreadyscheduled appliances. After one pass through the list of re-quests, a schedule of all secondary loads and their aggregatepower profile is generated. This schedule is then conveyedto the second step of the optimisation procedure.
In the second step, we schedule the DG using a dynamicprogramming formulation. The load power profile has al-
ready been defined by the first step. This profile, in additionto the primary loads, defines the constraints of the problem.The scheduling of the generator may be subject to one fur-ther constraint, depending on the circuitry for powering sec-ondary loads. In the simplest case, both primary and sec-ondary loads run from the battery, and the generator is usedonly to recharge the battery. In this case, no additional con-straint is imposed on the generator schedule. However, thisarchitecture implies a higher wear and tear of the battery.It may also result in a demand profile that exceeds the cur-rent capacity of the battery. Moreover, as electricity is freelyavailable from the battery at any time of the day, users maytend to be less economical in their appliance usage. That’swhy we implemented an architecture where all secondaryloads are run directly from the DG, and the battery only pow-ers smaller primary loads. The resulting design is incorpo-rated into the mathematical formulation by constraining thegenerator to be ON whenever one or more secondary appli-ances are scheduled to run, according to the first step of theoptimisation. In Sec. 5, we show that the resulting deteriora-tion in the optimal fuel cost is minor, compared to the gainsin battery life and the encouragement to users to be econom-ical in their appliance usage.
The system state and dynamics for the battery bank em-ploys the KiBaM model for lead acid batteries [14]. Inthe KiBaM model, the battery is modelled as two inter-connected charge wells, consisting of available charge andbound charge. The state of each charge well is discretizedinto M intervals, giving M2 possible charge state combina-tions. The time interval of optimisation is discretized into Nintervals. The cost in each interval is the amount of dieselconsumed by the generator, which is 0 if the generator isOFF, and is greater than 0 otherwise. In order to incorporatethe spool-up fuel consumption of the DG, a constant termFstart is added to the stage cost each time the DG is switchedON from an OFF state. Let i denote the time index of atime slot of duration τ, say 15 minutes. Let c(i) be the stateof charge of the battery at time i, and PB(c(i)) be the av-erage power received by the battery if the DG was runningfor τ starting from the battery state c(i). Let FB(c(i)) be the
135
corresponding fuel consumption for the diesel generator, ascalculated from the relevant DG consumption data sheet [1].Note that the energy received by the battery is a function ofits state of charge and dynamics in the battery model [14],and hence drives the fuel consumption of the generator. Asexplained previously, the battery lifetime depreciation is in-cluded in the system model [6]. The objective function forthe optimisation procedure is,
J =N
∑1
ui [FB(c(i))+FS(i)+(1−ui−1)Fstart] . (1)
Here, ui ∈ {0,1} is the binary decision taken at time i,controlling the operation or otherwise of the DG. PS(i) is theexpected power profile of secondary appliances in time stepi derived from the first optimisation step, and FS(i) is the cor-responding diesel usage. The spool-up cost Fstart is countedonly if the DG is running in the current time period, and wasnot running in the previous time period. It is assumed that itsinitial state is u0 = 0. The optimal schedule can be computedby using Dijkstra’s algorithm to solve a shortest path prob-lem [5] from the initial state (i = 0 and battery charge equalto the initial charge level) to each feasible final state (i = Nand the battery’s final state of charge lower bounded by itsinitial state of charge). The optimisation algorithm beginsfrom a known initial state at i = 0. It explores each of twooptions: battery charging (generator ON) or battery discharg-ing (generator OFF), and arrives at two potential destinationstates accordingly. The cost to reach each state is the dieselconsumed by the sequence of decisions culminating in thecurrent state of charge at the current time. This cost is savedby the algorithm, along with the battery state in the previoustime step and the decision taken at the previous time step.The algorithm proceeds in this way to the end of the timewindow, where it is constrained to only consider final statesthat replenish the battery levels to their starting values, orhigher.
The optimal control computation algorithm is given inAlgorithm 1. We define the following matrices of sizeM2× (N + 1), with rows representing state of charge of thetwo batteries and columns representing time. Note that the(N +1)th column represents the end of the final time period.• F , with each element containing the minimum fuel to
reach state ( j, i) where i is an integer, 0≤ i≤ N,• C , with each element containing the charge level at time
step (i− 1) on the optimal path from (c(0),0) to ( j, i),and• D , containing the decision taken at time step (i−1) on
the optimal path from (c(0),0) to ( j, i).This procedure is illustrated schematically in Fig. 7, with
time on the X-axis, and potential combinations of charge lev-els on the Y-axis. The starting state is well defined, whilethe acceptable final charge levels form a subset of all thepotential charge levels. By accounting for battery dynam-ics, a feasible region such as the one depicted in Fig. 7is automatically defined and explored by the dynamic pro-gramming algorithm. If the level of each charge well in theKiBaM [14] battery model is divided into M intervals, themaximum number of reachable states at any time step is M2,
Recommended DG run timing
Feedback (power consumption and diesel usage)
Admin selected DG run timing
Selected DG run timings
Activity bar
Visitor input
Figure 9: Administrator Interface of Collaborative Scheduler
in the current time period, and was not running in the previous timeperiod. It is assumed that its initial state is u0 = 0. The optimalschedule can be computed by using Dijkstra’s algorithm to solve ashortest path problem [5] from the initial state (i = 0 and batterycharge equal to the initial charge level) to each feasible final state(i = N and the battery’s final state of charge lower bounded by itsinitial state of charge). The optimisation algorithm begins from aknown initial state at i = 0. It explores each of two options: batterycharging (generator ON) or battery discharging (generator OFF),and arrives at two potential destination states accordingly. The costto reach each state is the diesel consumed by the sequence of deci-sions culminating in the current state of charge at the current time.This cost is saved by the algorithm, along with the battery state inthe previous time step and the decision taken at the previous timestep. The algorithm proceeds in this way to the end of the timewindow, where it is constrained to only consider final states thatreplenish the battery levels to their starting values, or higher.
The optimal control computation algorithm is given in Algo-rithm 1. We define the following matrices of size M2⇥(N+1), withrows representing state of charge of the two batteries and columnsrepresenting time. Note that the (N + 1)th column represents theend of the final time period.
• F , with each element containing the minimum fuel to reachstate ( j, i) where i is an integer, 0 i N,
• C , with each element containing the charge level at time step(i�1) on the optimal path from (c(0),0) to ( j, i), and
• D , containing the decision taken at time step (i� 1) on theoptimal path from (c(0),0) to ( j, i).
This procedure is illustrated schematically in Fig. 10, with timeon the X-axis, and potential combinations of charge levels on theY-axis. The starting state is well defined, while the acceptable fi-nal charge levels form a subset of all the potential charge levels.By accounting for battery dynamics, a feasible region such as theone depicted in Fig. 10 is automatically defined and explored bythe dynamic programming algorithm. If the level of each chargewell in the KiBaM [14] battery model is divided into M intervals,the maximum number of reachable states at any time step is M2,and the number of decisions available at any state of charge is atmost 2. Thus, the maximum number of computations required tofind the optimum generator schedule is 2NM2. The computationalcomplexity thus scales linearly with the time dimension.
5 Results5.1 DG Optimizer Evaluation
In this section, we estimate the benefits delivered by the optimi-sation procedure using simulations that extrapolate from empirical
Algorithm 1 Optimal control computation
1. Initialize: Time i = 0, all elements of F set to • except forinitial state F (c(0),0) = 0, all elements of C and D set to-1
2. For all i in {0,N �1}:3. For all j such that F ( j, i) < •:
(a) Evaluate j+i+1, charge at time (i+1) with ui = 1(b) Evaluate stage cost F+( j, i) from ( j, i) to ( j+i+1, i+1)
(c) If state ( j+i+1, i+1) satisfies problem constraints andF ( j, i)+F+( j, i) < F ( j+i+1, i+1):
(d) **New optimal path found**i. Set F ( j+i+1, i+1) = F ( j, i)+F+( j, i)
ii. Set C ( j+i+1, i+1) = jiii. Set D( j+i+1, i+1) = 1
EndIf(e) If PS(i) = 0:(f) **DG in OFF state is feasible**
i. Evaluate j�i+1, charge at time (i+1) with ui = 0ii. Stage cost F�( j, i) = 0 from ( j, i) to ( j�i+1, i+1)
iii. If state ( j�i+1, i+1) satisfies problem constraintsand F ( j, i)+F�( j, i) < F ( j�i+1, i+1):
iv. **New optimal path found**A. Set F ( j�i+1, i+1) = F ( j, i)+F�( j, i)B. Set C ( j�i+1, i+1) = jC. Set D( j�i+1, i+1) = 0EndIf
EndFor4. EndFor5. Find j⇤ such that F ( j⇤,N) = min j2Jfin F ( j,N), where Jfin
is the set of feasible final charge levels6. Trace backward from C ( j⇤,N) and D( j⇤,N) to compute
optimal decision vector
and the number of decisions available at any state of chargeis at most 2. Thus, the maximum number of computationsrequired to find the optimum generator schedule is 2NM2.The computational complexity thus scales linearly with thetime dimension.
5 Results5.1 DG Optimizer Evaluation
In this section, we estimate the benefits delivered by theoptimisation procedure using simulations that extrapolatefrom empirical data. DG and battery model (KiBaM) pa-rameters used in this section were taken from vendor datasheets. It is assumed that users use the interface described
0"
5"
10"
15"
20"
25"
30"
35"
40"
45"
Only"DG
"Hy
brid"
C"Hy
brid"
Only"DG
"Hy
brid"
C"Hy
brid"
Only"DG
"Hy
brid"
C"Hy
brid"
Only"DG
"Hy
brid"
C"Hy
brid"
Only"DG
"Hy
brid"
C"Hy
brid"
Only"DG
"Hy
brid"
C"Hy
brid"
Only"DG
"Hy
brid"
C"Hy
brid"
Case"571" Case"572" Case"573" Case"2571" Case"2572" Case"2573" Case"2574"
Fuel"Cost"($)" Ba@ery"Cost"($)"
Figure 8: Cost comparison between Only DG, Hybrid & C-Hybrid
136

0
10
20
30
40
50
60
70
80
10 W 20 W 50 W 100 W 200 W 500 W 1000 W 1500 W 2000 W 5000 W 0
10
20
30
40
50
60
70
10 W 20 W 50 W 100 W 200 W 500 W 1000 W 1500 W 2000 W 5000 W
Only DG
Hybrid
C Hybrid
A B
33.3% 20.1%
Primary Load Primary Load
Fuel
Cos
t ($)
Tota
l Cos
t ($)
Figure 9: Cost sensitivity (a. Fuel cost, and b. Total cost) to variation in primary load
in Sec. 4.2 to communicate their secondary appliance usagepreferences. Each scheduling request includes the power rat-ing of the appliance, the expected duration of usage, and theacceptable time window of operation (i.e, selected time pe-riod). A sample set of inputs is shown in Fig. 5, whichdepicts 25 scheduling requests over the course of a day. Theearliest feasible time for any request is 6:00 am, and the latestfeasible time is 7:30 pm. Several such inputs were generatedfor analysis: 4 input cases with 25 schedule requests each(Case 25-1 to 25-4), and 3 input cases with 5 schedule re-quests each (Case 5-1 to 5-3). The inputs were based on ananalysis of measurements taken for ten appliances at KBFSCover three months.
Based on the description in Sec. 4.3, we compared thecosts associated with three possible architectures. First, torun the generator whenever there is non-zero demand (with-out any optimisation, which is how KBFSC currently oper-ates). This option is referred as ‘Only DG’ in Fig. 8. Second,it is possible to run all appliances from the battery, with thegenerator being used only to optimally recharge the battery.This option is referred as ‘Hybrid’. Finally, the third archi-tecture runs all primary appliances from the battery, and allsecondary appliances directly from the generator. This op-tion is referred as ‘C-Hybrid’, which implies a hybrid archi-tecture constrained to operate the DG for all secondary ap-pliances. The resulting total costs are compared in Fig. 8 forall seven input cases. The total cost consists of the cost ofdiesel used over the course of the day, as well as the amor-tized depreciation in battery life because of its usage. Evenafter including the cost of the battery, it can be seen that thereis a significant cost reduction in moving from the former ar-chitecture to one of the two latter ones. While the C-Hybridcase does not perform as well as the pure Hybrid case, it canbe noted that the increase in cost is very small. When takenin context of the battery capacity costs and human factors de-scribed in Sec. 4.3, this is likely to be an acceptable tradeoff.
The sensitivity of the optimal cost to the magnitude of theprimary load is depicted in Fig. 9. The value on the X-axisis the mean primary load throughout the course of the day. Itis seen that the two hybrid architectures always have lowerdiesel fuel cost when compared to the generator-only archi-tecture. Note that the constrained hybrid case has higher fuelcost than the pure hybrid case when the primary loads aresmall (Fig. 9A). This is because of the constraint that the
generator must run whenever secondary loads are operating.When this constraint is removed for the pure hybrid case,the generator can push sufficient charge into the battery tosupply both primary and secondary loads, while still runningfor a shorter duration of time. If we include the cost dueto a decrease in the battery life, the total cost for the hybridarchitectures is higher than that for the generator-only archi-tecture, for large primary loads (Fig. 9B). The parity pointoccurs at 2 kW. For primary loads higher than this value, thedecrease in battery life is too rapid to be offset by the reduc-tion in the cost of diesel. At the expected primary load levelat KBFSC (1 kW), the expected cost savings are 33% for fuelonly, and 20.1% when the battery cost is included.
Finally, we consider the effect of incorporating the cost ofspooling up the generator (change from OFF to ON state). InFig. 10, we demonstrate the effect for the input case shown inFig. 5. The X-axis denotes the time of day, while the Y-axisdepicts the generator state (OFF/ON) in each 15-minute timeperiod. If the cost of starting the generator is ignored, theoptimisation procedure would produce a generator schedulewith 11 OFF to ON switches (blue circles in Fig. 10). Whena cost of 2 USD is assigned to each switch event, the opti-miser instead produces a schedule that contains only 2 OFFto ON switches (black stars in Fig. 10). We do not comparethe fuel cost for the two cases described here, because ignor-ing the spooling cost of switching ON the generator is not arealistic assumption.
Figure 10: DG cost analysis with and without switching cost
137

5.2 Collaborative Interface EvaluationWe conducted cognitive walkthrough with 8 visitors and
4 administrators. The aim of this study is to evaluate theusability of both the visitor and administrator collaborativescheduler interface. The interface presented in Sec. 4.2 is thefinal version that was deployed, which incorporates severalchanges that were found through the cognitive walkthroughevaluation.5.2.1 Method
As both the visitors and administrators have to performspecific tasks - scheduling appliances usage and schedulingDG run hours, respectively - we used a task-specific quali-tative evaluation method, Cognitive Walkthrough [20]. Theparticipants were asked to think aloud through out the study.Visitors were asked to schedule their appliance usage for thenext day in basic mode with minimal input (only activity se-lection and ‘submit’), and in advanced mode with maximalcustomization (including activity selection, duration selec-tion, time period selection, and ‘submit’). Similarly, admin-istrators were asked to login, schedule DG run hours for thenext day, with minimal inputs and with maximal customiza-tion.
Similar to the interviews, all the walkthroughs were con-ducted in the dining area of KBFSC, audio-recorded andlater transcribed in English. Rest of the analysis details forwalkthroughs is the same as semi-structured interviews (Sec.3.1).5.2.2 Participants
Eight visitors (4 male, 4 female, average age=29.1 years,sd=11.7) participated in the study. The visitors were fromdifferent locations - 5 from USA, 2 from Brunei and 1 fromIndonesia. All the visitors have an educational backgroundin Ecology; six of the visitors were PhD students, one wasa Research Assistant, and one was a Professor. All of themwere visiting KBFSC for a 10-days long field study Ecologycourse; four of the visitors have visited a field study centerbefore. All were aware of their monthly electricity bills andper unit energy pricing at their residence. All the visitorsanswered in neutral to strongly agree (on a 5-point Likertscale) when asked about their orientation towards conserva-tion, with average score of 3.8 (sd=0.6). With regards toDG run hours at KBFSC, all (except one, who selected ‘runsfor optimal hours’) the visitors selected ‘runs more than re-quired’. In addition, all the visitors were Internet savvy, withan average self-score of 4.2 (sd=0.8), on a 5-point Likertscale, with 1 lowest and 5 highest in terms of Internet us-age.
Four administrators (2 male, 2 female, average age=41.5years, sd=5.1) participated in the study. Their education levelvaried with 2 having Bachelor’s degree, 1 having Master’sdegree and 1 completed secondary school. With regards totheir orientation towards conservation, all rated themselveshigh with average score of 4.5 (sd=0.5). All, except one,were Internet savvy. (Note: Two of these administrators evenparticipated in the semi-strcutured interviews.)5.2.3 Visitor Interface Findings
Below are the key findings from the visitor collaborativeschedule interface:
(i) Addition of 5-leaf Green Level: In the initial design,based on the activity, duration, and time period selection,users were provided feedback only through their activity’scontribution towards the energy consumption, diesel usage,and carbon dioxide production, along with the total valuesfor each (lower portion of Fig. 4). During the cognitivewalkthrough, we found participants struggling to understandthe impact of changing activity, duration, or time period se-lection, as the feedback numbers kept changing accordingto any change in selection. It was hard for the participants tokeep track of the three feedback numbers, to identify the bestschedule selection. In addition, there was no goal to achieve,i.e., the upper limit of the “goodness of selection” (V5) wasnot clear. Hence we decided to add a new feedback parame-ter, ‘greenness’ of the activity (using 5-leaf green level, Fig.4). This allowed the visitors to try and achieve maximumnumber of green leaves during their scheduling selection.
(ii) Duration Selection: In the intial design, duration se-lection used to be a text box with the number of minuteswritten inside it. On tapping it, a pop-up opened up to selectany number of minutes. With the cognitive walkthrough, wefound that participants were having difficulties in changingthe duration, “what to click? should I click the box?” (V4).Moreover, visitors mostly chose period of 15-mins interval(such as 15 mins for shower, 30 mins for washing machine,45 mins for dryer). Hence we decided to replace the numberselector pop-up with the ‘+’ and ‘-’ button, allowing usersto quickly increase or decrease the duration of an activityin steps of 15 mins (minimum: 15 minutes, maximum: 180minutes).
(iii) Selected Time Period Animation: Using the handle-bars provided on both sides of the selected time period, auser can provide his/her time period flexibility of perform-ing the activity. The participants complained that, “thoughI selected 2 pm to 5 pm, which is also showed on the textbelow, the (grey-colored) selection actually shows 2:10ish to4:55ish” (V7). In the intial design, the selected time periodwindow used to show the visitor’s selection, and the text be-low used to round it up to the nearest time window, thus a2:05-4:55 pm or 1:55-5:05 pm selection was written as 2-5pm. In the updated interface, as soon as the handlebars werereleased, the selected time period automatically expand, re-duce, and/or transition to the nearest full time period win-dow, such that the text and actual (grey-colored) selectionwere consistent.5.2.4 Administrator Interface Findings
Below are the key findings from the administrator collab-orative schedule interface:
(i) Selected DG Run Timings Visualization: In the initialversion, the top bar showing DG run timings was not present.The selected DG timings were only shown as numbers onthe top right (Fig. 6). During the cognitive walkthrough, wefound that administrators require multiple attempts to selecta non-overlapping time period on the activity bar using han-dlebars. As A3 pointed, “it is hard to read the time here (onthe top right), while making the selection here (in the activ-ity bar).” In the revised interface, we added a selected DGrun timings visualization at the top of the activity bar, thusguiding the user in selecting non-overlapping period.
138
(ii) Recommended DG Run Timing Star: Administratorsshowed interest in keeping the recommended DG timings,stating that “the system must have made intelligent deci-sions” (A2). However, after allotting multiple other DG runtimings, the participants were not able to distinguish be-tween the recommended versus self-selected DG run tim-ings. Hence we added a green star to show the recommendedDG run timings. Moreover, removing an administrator se-lected DG run timing is a 1-step process (clicking on the ‘X’button next to the text), while removing a recommended DGrun timing is a 2-step process with a comfirmation pop-up asthe second step.
6 DiscussionThe system and methodology described in this paper does
not explicitly account for schedule disruptions, which can becaused by a discrepancies between user input and actual us-age. It is difficult to model the stochasticity introduced bythis aspect, because the type and magnitude of discrepancydiffers from one user to another. A direct method to accountfor stochasticity would be to implement a robust optimisationframework. This would involve replacing the minimisationin (1) with a minimax formulation [17], where the worst case(maximum) fuel cost is minimised. It is expected that theconsequent modification required to the dynamic program-ming algorithm would be minimal. However, formal imple-mentation of this methodology and its evaluation are a partof future work.
In this work, we demonstrated the value of implementingcollaborative optimisation techniques for energy resources ina microgrid setting. However, the same methodology is po-tentially applicable to a wide spectrum of instances in theenergy space. The core idea of the design effort was on pro-viding feedback to consumers about the impact of their ownactivities on collective consumption. In addition, the systemalso provided suggestions about optimal scheduling of userdemand. Implicit in this design is the coordination of energyconsumption across users who may or may not be able tointeract directly with each other. As such, the collaborativeinterface idea can even be applied to systems where the usersare not collocated. Some examples of minimising ecologicalimpact through coordination of activities can include, (i) Op-timal scheduling of commercial shuttle services by havingusers log their planned times of travel to/from work for thenext day, and, (ii)Planning of thermal storage (for example,pre-cooling) in office premises by using forecasts of buildingoccupancy.
7 ConclusionsThis paper describes the solution designed for reducing
diesel consumption at KBFSC, a remote ecological fieldstudy centre in Brunei. The system employed a battery bankto increase power availability to primary loads and a collabo-rative scheduler for access to power for secondary loads. Anoptimiser ensures that the DG run at the appropriate timesto minimize fuel consumption while keeping the batteriescharged and meeting user needs. Simulations modelled onreal data suggest that our system could reduce diesel con-sumption by up to 33.3% and total cost by 20.1%. More-over, our proposed system can provide power to the centre
uninterruptedly, as oppose to only ≈9 hours available in thepast.8 Acknowledgements
We would like to thank Pg Dr Iskandar Petra and AbdulAziz bin Haji Mohamad Ali of the UBD|IBM Centre; TeddyChua Wee Li, Muhammad Salleh bin Abdullah Bat and HjhMasnah Hj Mirasan at KBFSC and Institute for Biodiversity& Environmental Research, UBD; and RadioStudio, for theirsupport in this project.9 References[1] Cummins Power DG datasheets. http://www.cumminspower.com/.[2] HOMER - hybrid optimization of multiple energy resources.
http://www.homerenergy.com/.[3] Solarising India: Commercial feasibility analysis and an implemen-
tation roadmap. http://www.ima-india.com/solarising-rural-india.pdf,2006.
[4] The Rising Sun: Grid Parity Gets Closer. KPMG, 2012.[5] Bertsekas, D. Dynamic Programming and Optimal Control, 2nd ed.
Athena Scientific, 2000.[6] Bindner, H., Cronin, T., Lundsager, P., Manwell, J. F., Abdulwahid,
U., and Baring-Gould, I. Lifetime modelling of lead acid batteries.2005.
[7] Erickson, T., Li, M., Kim, Y., Deshpande, A., Sahu, S., Chao, T.,Sukaviriya, P., and Naphade, M. The Dubuque Electricity Portal:Evaluation of a city-scale residential electricity consumption feedbacksystem. In SIGCHI Conference on Human Factors in Computing Sys-tems (Paris, France, 2013).
[8] Faudzulani, A., Tennakoon, K., and Malai, A. Life Underneath theCanopy: The Kuala Belalong Field Studies Centre Showcase. Univer-siti Brunei Darussalam, 2011.
[9] Froehlich, J., Findlater, L., and Landay, J. The design of eco-feedbacktechnology. In SIGCHI Conference on Human Factors in ComputingSystems (Atlanta, GA, 2010).
[10] Galvin, R., Yeager, K., and Stuller, J. Perfect Power. McGraw Hill,2009.
[11] Hafez, O., and Bhattacharya, K. Optimal planning and design of arenewable energy based supply system for microgrids. RenewableEnergy 45 (2012), 7–15.
[12] Hong, Y., and Li, C. Short-term real-power scheduling consideringfuzzy factors in an autonomous system using genetic algorithms. Pro-ceedings of Generation, Transmission and Distribution 153, 6 (Nov2006), 684–692.
[13] Kjeldskov, J., Skov, M., Paay, J., and Pathmanathan, R. Using mobilephones to support sustainability: A field study of residential electricityconsumption. In SIGCHI Conference on Human Factors in Comput-ing Systems (Austin, TX, 2012).
[14] Manwell, J., and McGowan, J. Lead acid battery storage model forhybrid energy systems. Solar Energy 50, 5 (1993), 399–405.
[15] Morais, H., Kadar, P., Faria, P., Vale, Z., and Khodr, H. Optimalscheduling of a renewable micro-grid in an isolated load area usingmixed-integer linear programming. Renewable Energy 35, 1 (2010),151–156.
[16] Nayar, C., Tang, M., and Suponthana, W. Wind/PV/diesel micro gridsystem implemented in remote islands in the republic of Maldives. InInternational Conference on Sustainable Energy Technologies (Nov2008), 1076–1080.
[17] Osborne, M., and Rubinstein, A. A Course in Game Theory. MITPress, Cambridge, MA, 1994.
[18] Prasetiawan, E. Modeling, simulation and control of an earthmovingvehicle powertrain simulator. PhD thesis, 2001.
[19] Ross, M., Hidalgo, R., Abbey, C., and Joos, G. Energy storage systemscheduling for an isolated microgrid. Renewable Power Generation 5,2 (Mar 2011), 117–123.
[20] Wharton, C., Rieman, J., Lewis, C., and Polson, P. Usability inspec-tion methods. John Wiley & Sons, Inc., New York, NY, USA, 1994,ch. The Cognitive Walkthrough Method: A Practitioner’s Guide, 105–140.
139