Cold Wire Feed Submerged Arc Welding
78
Approved for public release; distribution is unlimited. Cold Wire Feed Submerged Arc Welding NSRP Subcontract Agreement Number: 2006-354 NSRP Sub Number: 012306 Final Report Submitted to: Advanced Technology Institute (ATI) 5300 International Boulevard North Charleston, SC 29418 Attention: Dolly Pelto Submitted by: 100 CTC Drive Johnstown, PA 15904 Dec 12, 2006 Technical Point of Contact: Administrative: Mark F. Mruczek Darnella Parker Project Manager Contracts Manager Telephone: 814-269-2735 Telephone: 814-269-2602 Facsimile: 814-269-2799 Facsimile: 814-269-6530 E-mail: mruczekm@ctc.com E-mail: parkerd@ctc.com Copyright 2006. Concurrent Technologies Corporation. All rights reserved. Category B Data - Government Purpose Rights
Transcript of Cold Wire Feed Submerged Arc Welding
Approved for public release; distribution is unlimited.
Cold Wire Feed Submerged Arc Welding NSRP Subcontract Agreement Number: 2006-354 NSRP Sub Number: 012306
Final Report Submitted to: Advanced Technology Institute (ATI) 5300 International Boulevard North Charleston, SC 29418 Attention: Dolly Pelto
Submitted by:
100 CTC Drive Johnstown, PA 15904
Dec 12, 2006
Technical Point of Contact: Administrative: Mark F. Mruczek Darnella Parker Project Manager Contracts Manager Telephone: 814-269-2735 Telephone: 814-269-2602 Facsimile: 814-269-2799 Facsimile: 814-269-6530 E-mail: [email protected] E-mail: [email protected]
Copyright 2006. Concurrent Technologies Corporation. All rights reserved.
Category B Data - Government Purpose Rights
Approved for public release; distribution is unlimited.
ACKNOWLEDGMENTS
Concurrent Technologies Corporation (CTC) conducted this research project under the National Shipbuilding Research Program (NSRP) Subcontract Agreement Number 2006-354. The author acknowledges the advice and guidance of Northrop Grumman Ship Systems (Lee Kvidahl) and Northrop Grumman Newport News Shipbuilding (Paul A. Hebert). The author also wishes to acknowledge the Lincoln Electric Company (Harry Sadler) for providing the submerged-arc welding flux 800H and LA-71 electrodes for use in this project.

(This page intentionally left blank.)
i
EXECUTIVE SUMMARY
This document is the final report for the “Cold Wire Feed Submerged Arc Welding (CWF-
SAW)” project conducted by Concurrent Technologies Corporation (CTC) as part of the National
Shipbuilding Research Program (NSRP), SP–7 Panel project. CWF involves the addition of a
separate base solid or tubular filler metal into the molten weld pool to provide additional metal
deposition without the use welding current. This report provides practical insight into the CWF-
SAW process and its effects on the weldability of HSLA-65 and HSLA-100 high strength low alloy
(HSLA) steels and ABS grade EH-36 steel.
The intent of this report is to summarize information derived from welding trials conducted
at CTC on several representative ship steels. These welding trials were intended to produce
weldments that exhibit mechanical properties necessary to meet the specified requirements for the
single-wire SAW process while increasing deposition rates and decreasing the overall heat input into
the weldment. This information will help the shipyards enhance their welding capabilities and
improve weld productivity due to an increase in deposition rates.
In this project, ten (10) weldments were fabricated at CTC using 2-inch thick HSLA-100,
1.5-inch thick HSLA-65 and 0.5-inch thick ABS EH-36 carbon steels. Welding of HSLA-65 steel
was performed using Lincoln Electric LA-71(AWS EM14K) for both the electrode and cold wire
using a Lincoln Electric MIL800-H flux. Welding of the HSLA-100 steel was performed using
Lincoln Electric LA-100 wire for the electrode and ESAB Spoolarc 95, ER100S for the cold wire.
The flux used to weld all HSLA-100 weldments was ESAB OK10.62. Welding of the EH-36 steel
was performed using Lincoln Electric LA-50 (AWS EM13K) wire for the electrode and Hobart
Brothers Quantum Arc 3 ER70S-3 for the cold wire. The flux used to weld all EH-36 weldments
was ESAB OK10.62. Mechanical properties, including yield strength, ultimate tensile strength,
elongation, and Charpy V-notch toughness, were evaluated to determine whether the requirements
specified for conventional SAW could be achieved at higher deposition rates and higher calculated
electrode heat inputs beyond the established limit of 85 kJ/in. In addition, cold-wire placement
(leading VS. trailing) was investigated to determine weld bead penetration effects.
Deposition rates were increased from 36% to 68% for the HSLA-65 weldments when
compared to the benchmark weldment made with the single wire SAW process at approximately 85
kJ/in heat input. In addition, electrode heat input was increased from 88 kJ/in to 125 kJ/in with no
deterioration in mechanical properties. In fact, both yield and tensile strengths increased slightly
ii
along with a dramatic improvement in weld metal toughness. For the HSLA-100 steel, two (2)
weldments were produced, one (1) benchmark weldment using the single wire process at
approximately 85 kJ/in heat input and a second weldment made using the CWF-SAW process at 124
kJ/in heat input. Deposition rates were increased 39% for the root pass and 97.5% for the fill and
cap passes. Yield strength and toughness properties of the CWF-SAW weldment meet the
requirements for MIL-100S electrode in NAVSEA Technical Publication T9074-BC-GIB-010/0200;
however, elongation requirements did not meet the requirements. Finally, three (3) weldments were
fabricated using EH-36 steel. One (1) benchmark weldment was manufactured using the single wire
process at approximately 85 kJ/in heat input, a second weldment made using the CWF-SAW process
also at approximately 85 kJ/in heat input, and finally, a weldment made at 100 kJ/in heat input made
using the CWF-SAW process. Deposition rates increased from 39% for the root pass and 81% for
the fill and cap passes while both yield and tensile strengths decreased slightly but were above the
American Bureau of Shipping requirements. However, toughness requirements were not met for
the benchmark nor the CWF-SAW processes.
iii
TABLE OF CONTENTS
Page #
1.0 INTRODUCTION & BACKGROUND...................................................................................9
2.0 GOALS AND OBJECTIVES.................................................................................................10
3.0 TECHNICAL APPROACH .................................................................................................10
3.1 Materials ..........................................................................................................................10
3.1.1 Base Metals .........................................................................................................10
3.1.2 Welding Consumables.........................................................................................13
3.2 Weldment and Joint Details ............................................................................................14
3.3 Welding Equipment.........................................................................................................17
3.4 Deposition Rate Calculations ..........................................................................................19
3.5 Effective Heat Input Calculation.....................................................................................20
3.6 Task 1 HSLA-65 Cold Wire Feed ...................................................................................21
3.6.1 Process Development ..........................................................................................21
3.6.2 Weldment CTC-024 Single Wire Process ...........................................................23
3.6.3 Machining and Testing........................................................................................24
3.6.4 Weldment CTC-026 89.8 kJ/inch Cold Wire Leading ........................................26
3.6.5 Weldment CTC-027 89.8 kJ/inch Cold Wire Lagging........................................32
3.6.6 Weldment CTC-028 111.6 kJ/in Heat Input........................................................37
3.6.7 Weldment CTC-029 111.6 kJ/in Heat Input........................................................42
3.6.8 Weldment CTC-030 125.4 kJ/in Heat input........................................................43
3.7 Task 2 HSLA-100 Cold Wire Feed .................................................................................48
3.7.1 Weldment CTC-037 Single Wire Process ...........................................................48
3.7.2 Machining and Testing........................................................................................50
3.7.3 Weldment CTC-038 124.2 kJ/in Heat input........................................................53
3.8 Task 3 EH-36 Cold Wire Feed .......................................................................................58
3.8.1 Weldment CTC-031 Single Wire Process ...........................................................58
3.8.2 Machining and Testing........................................................................................59
3.8.3 Weldment CTC-033 100.5 kJ/in Heat input........................................................61
4.0 BENEFITS AND SAVINGS..................................................................................................65
iv
4.1 Cold Wire Feed SAW of HSLA-65 Steel .......................................................................65
4.2 Cold Wire Feed SAW of HSLA-100 Steel .....................................................................66
4.3 Cold Wire Feed SAW of EH-36 Steel.............................................................................68
5.0 SUMMARY AND CONCLUSIONS.....................................................................................69
5.1 Cold Wire Feed SAW of HSLA-65 Steel .......................................................................69
5.2 Cold Wire Feed SAW of HSLA-100 Steel .....................................................................69
5.3 Cold Wire Feed SAW of EH-36 Steel.............................................................................69
6.0 RECOMMENDATIONS........................................................................................................70
6.1 Cold Wire Feed SAW of HSLA-65 Steel .......................................................................70
6.2 Cold Wire Feed SAW of HSLA-100 Steel .....................................................................70
6.3 Cold Wire Feed SAW of EH-36 Steel.............................................................................72
7.0 REFERENCES .......................................................................................................................73
8.0 APPENDICES ........................................................................................................................74
8.1 Appendix A: CTC Experience........................................................................................74
8.2 CTC Capabilities – Welding Applications ......................................................................74
8.2.1 Design for Manufacturing and Assembly ...........................................................74
8.2.2 Prototyping of Components and Assemblies ......................................................74
8.2.3 Machine Shop......................................................................................................75
8.2.4 Weld Shop ...........................................................................................................75
8.2.5 Coordinate Measuring Machine (CMM).............................................................75
v
LIST OF TABLES
Page #
Table 3-1. Specified Chemical Composition of HSLA-100 Comp 3 Steel.................................... 11
Table 3-2. Specified Chemical Composition of HSLA-65 Steel.................................................... 12
Table 3-3. Specified Chemical Composition of ABS EH-36 Steel ................................................ 12
Table 3-4. Welding Consumables for Each Base Metal................................................................. 13
Table 3-5. Number of Weldments and Thickness for Each Base Metal ........................................ 14
Table 3-6. Weld Parameters for Single Wire Benchmark Weldment CTC-024 ............................ 23
Table 3-7. Heat Input and Deposition Rates Benchmark Weldment CTC-024.............................. 23
Table 3-8. 70 Series Weld Metal Requirements............................................................................. 25
Table 3-9. Tensile and Yield Strength for Benchmark Weldment CTC-024 HSLA-65 Steel ....... 25
Table 3-10. CVN Properties for Benchmark Weldment CTC-024 HSLA-65 Steel ...................... 25
Table 3-11. Weld Parameters for Weldment CTC-026 HSLA-65 Steel Cold Wire Feed SAW.... 26
Table 3-12. Heat Input and Deposition Rates for Weldment CTC-026 Cold Wire Feed SAW..... 26
Table 3-13. Deposition Rate Comparison and Percent Increase for CTC-024 VS. CTC-026 ....... 27
Table 3-14. Tensile and Yield Strength Comparison for Weldments CTC-024 and CTC-026 ..... 27
Table 3-15. CVN Properties Comparison for Weldments CTC-024 and CTC-026....................... 28
Table 3-16. Tensile and Yield Strength Comparison Weldments CTC-026 and CTC-027 ........... 33
Table 3-17. CVN Comparison for Weldments CTC-026 and CTC-027........................................ 34
Table 3-18. Weld Parameters for Weldment CTC-028 Cold Wire Feed SAW ............................. 38
Table 3-19. Heat Input and Deposition Rates for Weldment CTC-028 Cold Wire Feed SAW..... 38
Table 3-20. Deposition Rate Comparison and Percent Increase for CTC-024 VS. CTC-028 ....... 39
Table 3-21. Tensile and Yield Strength Comparison for Weldments CTC-024 and CTC-028 ..... 39
Table 3-22. CVN Comparison for Weldments CTC-024 and CTC-028........................................ 40
Table 3-23. Tensile and Yield Strength Comparison for Weldments CTC-028 and CTC-029 ..... 42
Table 3-24. CVN Comparison for Weldments CTC-028 and CTC-029........................................ 43
Table 3-25. Weld Parameters for Weldment CTC-030 Cold Wire Feed SAW ............................. 44
Table 3-26. Heat Input and Deposition Rates for Weldment CTC-030 Cold Wire Feed SAW..... 44
Table 3-27. Deposition Rate Comparison and Percent Increase for CTC-024 VS. CTC-030 ....... 44
Table 3-28. Tensile and Yield Strength Comparison for Weldments CTC-024 and CTC-030 ..... 45
vi
Table 3-29. CVN Comparison for Weldments CTC-024 and CTC-030........................................ 46
Table 3-31. Weld Parameters for Single Wire Benchmark Weldment CTC-037 .......................... 49
Table 3-32. Heat Input and Deposition Rates for Weldment CTC-037 Cold Wire Feed SAW..... 49
Table 3-33. MIL-100S Weld Metal Requirements for Joining HSLA-100 ................................... 50
Table 3-34. Tensile Properties for Benchmark Weldment CTC-037 HSLA-100 Steel ................. 51
Table 3-35. CVN Properties for Benchmark Weldment CTC-037 HSLA-100 Steel .................... 52
Table 3-36. Weld Parameters for Weldment CTC-038 Cold Wire Feed SAW ............................. 53
Table 3-37. Heat Input and Deposition Rates for Weldment CTC-038 Cold Wire Feed SAW..... 54
Table 3-38. Deposition Rate Comparison and Percent Increase for CTC-037 VS. CTC-038 ....... 54
Table 3-39. Tensile Property Comparison for Weldments CTC-037 and CTC-038...................... 55
Table 3-40. CVN Properties Comparison for Weldments CTC-037 and CTC-038....................... 56
Table 3-41. Weld Parameters for Single Wire Benchmark Weldment CTC-031 .......................... 58
Table 3-42. Heat Input and Deposition Rates for Single Wire Benchmark Weldment CTC-031 . 58
Table 3-43. 3M or 3YM Weld Metal Requirements for Joining EH-36........................................ 59
Table 3-44. Tensile Properties of Benchmark Weldment CTC-031 .............................................. 60
Table 3-45. CVN Properties of Benchmark Weldment CTC-031 ................................................. 60
Table 3-46. Weld Parameters for Weldment CTC-033 Cold Wire Feed SAW ............................. 61
Table 3-47. Heat Input and Deposition Rates for Weldment CTC-033 Cold Wire Feed SAW..... 62
Table 3-48. Deposition Rate Comparison and Percent Increase for CTC-031 VS. CTC-033 ....... 62
Table 3-49. Tensile and Yield Strength Comparison for Weldments CTC-031 and CTC-033 ..... 63
Table 3-50. CVN Comparison Weldments CTC-031 and CTC-033.............................................. 63
Table 3-51. Weld Parameters for New HSLA-100 Cold Wire Feed SAW Weldment.................. 71
Table 3-52. Heat Input and Deposition Rates for New HSLA-100 Cold Wire Feed Weldment ... 71
Table 3-53. Deposition Rate Comparison and Percent Increase New HSLA-100 Weldment....... 71
vii
LIST OF FIGURES
Page # Figure 3-1. Plate dimensions. ........................................................................................................ 15
Figure 3-2. Joint design B2V.3 for HSLA-65 welding process development............................... 16
Figure 3-3. Joint design B2V.3 for HSLA-100 welding process development............................. 16
Figure 3-4. Joint design B2V.1 for EH-36 welding process development.................................... 16
Figure 3-5. Lincoln Electric NA-5 wire feed controller. ............................................................... 17
Figure 3-6. CK Worldwide WF-3 cold wire feed unit. ................................................................. 18
Figure 3-7. CK Worldwide WF-3 cold wire feed unit side view. ................................................. 19
Figure 3-8. Cold-wire bracket. ...................................................................................................... 22
Figure 3-9. Cold-wire leading configuration. ................................................................................ 22
Figure 3-10. Mechanical test specimen locations for all HSLA-65 weldments. ............................. 24
Figure 3-11. Transverse hardness detail of weldments CTC-024 and CTC-026............................. 29
Figure 3-12. Transverse hardness profile of weldments CTC-024 VS. CTC-026........................... 29
Figure 3-13. Temperature indicating liquid application example. .................................................. 30
Figure 3-14. Surface temperature comparison. ............................................................................... 31
Figure 3-15. Transverse section of CTC-026. ................................................................................. 32
Figure 3-16. Cold-wire lagging configuration................................................................................. 33
Figure 3-17. Transverse hardness profile of weldments CTC-024, CTC-026 and CTC-027. ......... 35
Figure 3-18. Penetration profile for weldments CTC-026 and CTC-027. ....................................... 36
Figure 3-19. Surface temperature comparison CTC-024, CTC-026 and CTC-027. ........................ 37
Figure 3-20. Transverse section of CTC-027. ................................................................................. 37
Figure 3-21. Transverse hardness profile of weldments CTC-024 VS. CTC-028........................... 41
Figure 3-22. Transverse section of CTC-028. ................................................................................. 41
Figure 3-23. Transverse hardness profile of weldments CTC-024 VS. CTC-030........................... 47
Figure 3-24. Transverse section of CTC-030. ................................................................................. 47
Figure 3-25. Weld bead placement and number, weldment CTC-024. ........................................... 48
Figure 3-26. Weld bead placement and number, weldment CTC-030. ........................................... 48
Figure 3-27. Mechanical test specimen locations for all HSLA-100 weldments. ........................... 51
Figure 3-28. Transverse section of CTC-037. ................................................................................. 53
Figure 3-29. Transverse hardness profile of weldments CTC-037 VS. CTC-038........................... 57
viii
Figure 3-30. Transverse section of CTC-038. ................................................................................. 57
Figure 3-31. Mechanical test specimen locations for all EH-36 weldments. .................................. 59
Figure 3-32. Transverse section of CTC-031. ................................................................................. 61
Figure 3-33. Transverse hardness profile of weldments CTC-031 VS. CTC-033........................... 64
Figure 3-34. Transverse section of CTC-033. ................................................................................. 65
Figure 3-35. Cost saving comparison for single wire SAW vs. CWF-SAW of HSLA-65. ............ 66
Figure 3-36. Cost saving comparison for single wire SAW vs. CWF-SAW of HSLA-100. .......... 67
Figure 3-36. Cost Saving Comparison for New HSLA-100 CWF-SAW weldment....................... 68

9
1.0 INTRODUCTION & BACKGROUND
The current design concept for surface combatant ships include several large structures for
each ship that are fabricated from thick-section, high-strength steels. Welding large, thick structures
or plate requires large volumes of weld metal to be deposited using many beads and layers of weld
metal. This requires thousands of production man-hours per ship and results in long production
cycles. Therefore, there is great interest in the naval shipbuilding community to increase the
productivity of fabrication joining process by increasing deposition rates without mechanical
property deterioration and without the use of expensive additional equipment.
The current means of increasing deposition rates is to increase the electrode feed rate, which
consequently increases welding current and total heat input into the weldment. NAVSEA had
approved single wire Submerged Arc Welding (SAW) of HSLA-100 up to 110 kJ/inch, and some
shipyards had qualified procedures at that energy input. However, experience has shown that at
such a high-energy input, mechanical properties, particularly toughness, are known to be inferior due
to grain coarsening in the heat-affected zone (HAZ) and segregation in the weld metal along with the
formation large columnar grains. In addition to the mechanical property deterioration, poor bead
appearances are typically encountered as well; thus, shipyards typically limit SAW energy input to
less than 85 kJ/inch. Therefore, increasing deposition rates by increasing heat input is at the expense
of mechanical properties and not a viable solution. Attempts have been made to lower the heat input
by such means as increasing welding speed; however, it has been shown that an increase in welding
speed beyond a certain limit leads to defects such as undercut and a lack of sidewall fusion.
Due to the inherent problems with the current means of increasing deposition rates, an
alternative welding method was investigated that would increase deposition rates while maintaining
or decreasing total heat input into the weldment. This method was the CWF-SAW process. Cold-
wire additions have been shown to be feasible using both solid and flux-cored wires; however, the
technique has not been applied to high-strength steels in the domestic shipbuilding industry. This
project focused on cold-wire feed additions using a solid wire with a separate wire feed controller to
allow cold-wire feed rates independent of the hot wire (electrode). There have been other
applications where the cold wire is fed at the same speed as the electrode (Synergic Cold-Wire), [1]
but the author felt that an independent cold-wire feed rate would allow for greater flexibility of the
process for the operator and for weld procedure development as well.
10
2.0 GOALS AND OBJECTIVES
The objective of this project was to improve deposition rates and lower heat inputs by
developing and optimize welding procedures using the CWF-SAW process to produce welds in steel
types HSLA-65, HSLA-100 and EH-36 for large thick-section, high-strength steel structures. This
process is not only expected to reduce welding labor by increasing deposition rates, but also help
control distortion, help assure first-time quality, generate cost savings and reduce production
schedules.
In this project, weld joints were made at CTC using the CWF-SAW process in the above-
mentioned structural steels. Mechanical properties, including weld-metal yield strength, ultimate
tensile strength, elongation and Charpy V-notch toughness, were evaluated to determine whether the
requirements specified for conventional SAW could be achieved at higher deposition rates and
higher heat inputs. In addition, cold-wire placement (leading VS. trailing) was also investigated to
determine the effect on weld bead penetration. Hardness readings were performed to help determine
the change in overall heat input into the weldment to help prove the theory of an “effective heat
input” when welding with the CWF-SAW process.
3.0 TECHNICAL APPROACH
3.1 Materials
3.1.1 Base Metals
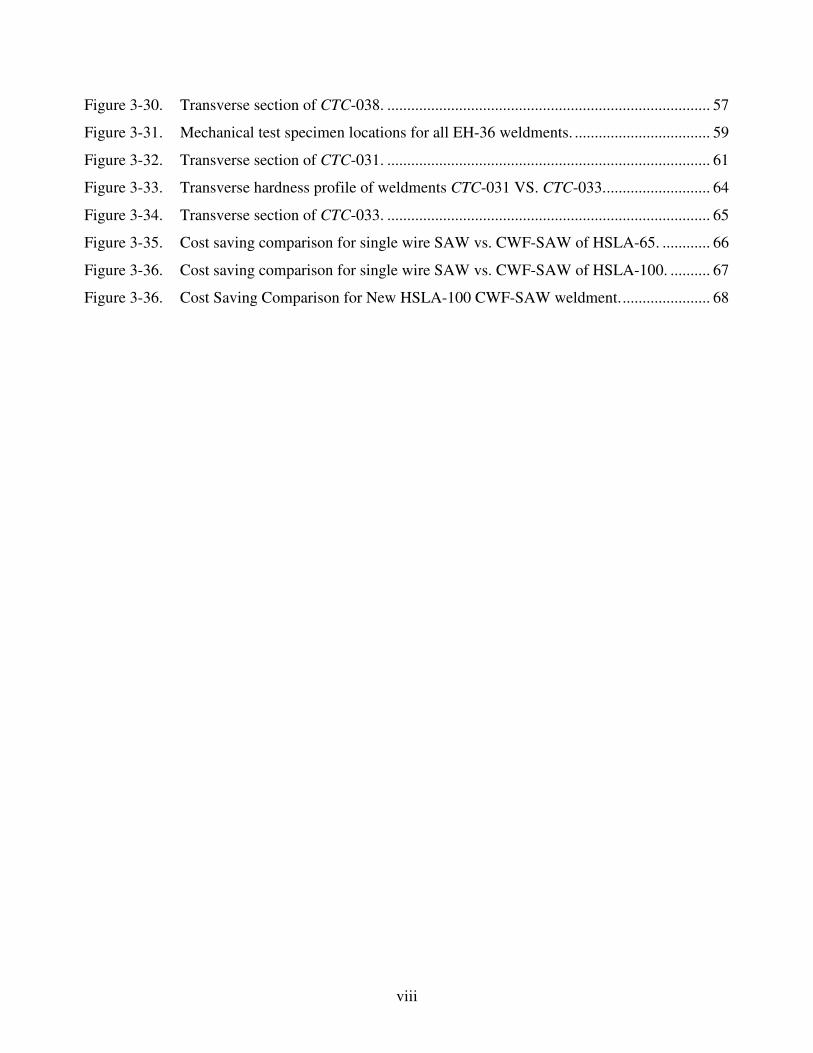
All base metal used for the procedure development for the CWF-SAW processes was 2-inch
thick HSLA-100 Comp 3, 1.25-inch thick HSLA-65, and 0.5-inch thick EH-36 steels. HSLA-100 is
a low-carbon, copper strengthened steel that was introduced as a replacement for HY-100 in order to
reduce fabrication costs by reduced preheating while using the same welding consumables and
process used in welding HY-100. One of the benefits of the low-carbon, copper strengthened
HSLA-100 steel is its ability to produce a weld heat-affected zone (HAZ) with excellent strength
and toughness without the need for preheat. Some regions may actually soften due to over-aging
and the dissolution of copper and grain coarsening caused by the heat of welding [2]. The specified
composition for two-inch HSLA-100 per T9074-BD-GIB-010/030 Appendix A (24645) is shown in
Table 3-1.
11
Table 3-1. Specified Chemical Composition of HSLA-100 Comp 3 Steel
Element Weight %
Carbon (C) 0.06 Manganese (Mn) 0.75–1.15 Phosphorus (P) 0.020
Sulfur (S) 0.004 Silicon (Si) 0.40 Nickel (Ni) 3.35–3.65
Chromium (Cr) 0.45–0.75 Molybdenum (Mo) 0.55–0.65
Copper (Cu) 1.15–1.75 Niobium (Nb) 0.02–0.06
Aluminum (Al) 0.015 Vanadium (V) 0.03
Note: Single values are maxima
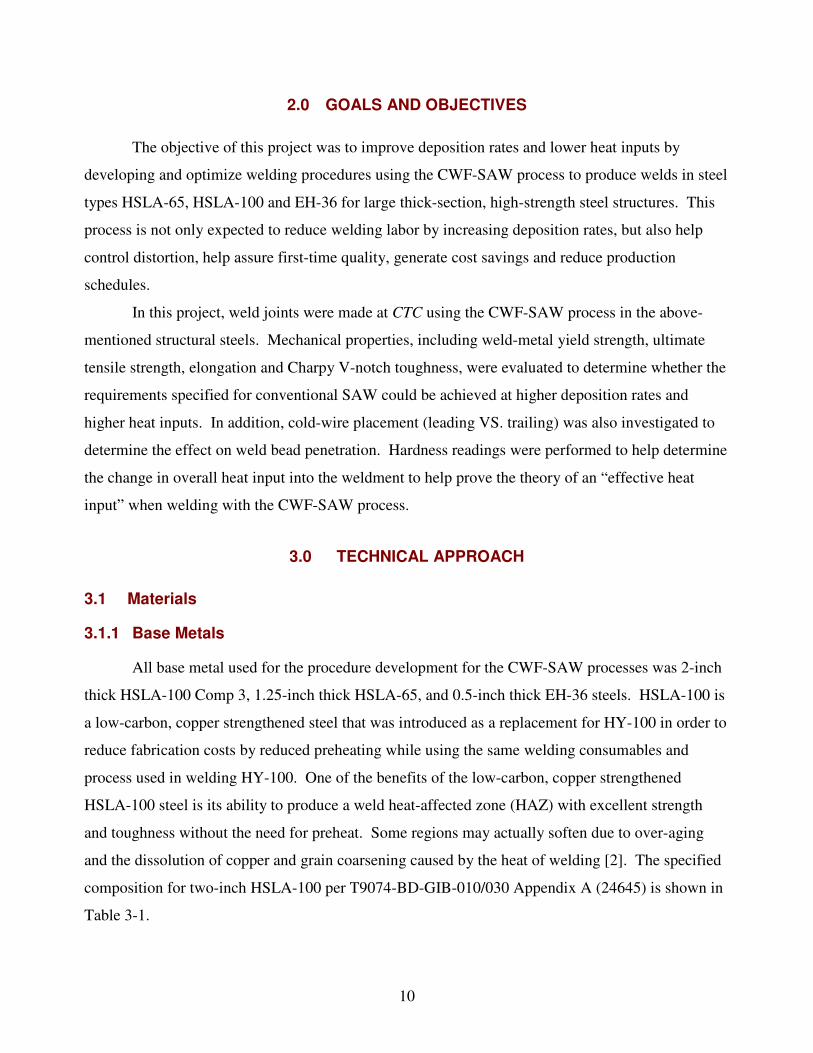
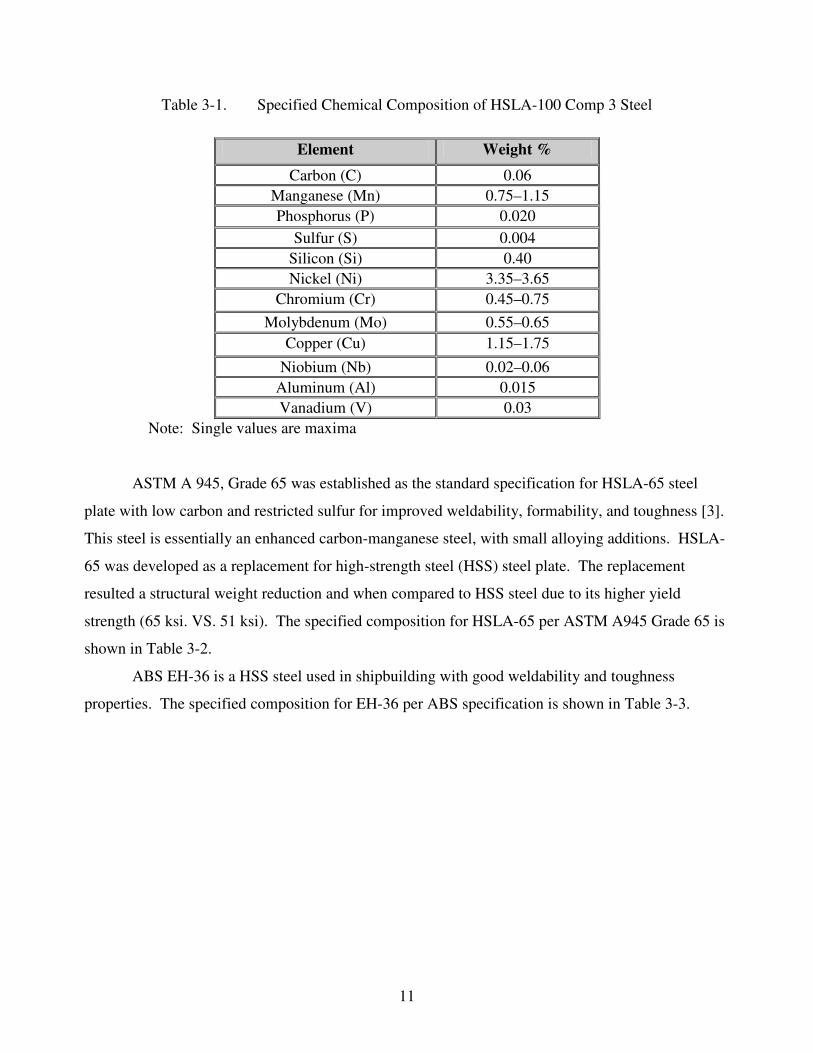
ASTM A 945, Grade 65 was established as the standard specification for HSLA-65 steel
plate with low carbon and restricted sulfur for improved weldability, formability, and toughness [3].
This steel is essentially an enhanced carbon-manganese steel, with small alloying additions. HSLA-
65 was developed as a replacement for high-strength steel (HSS) steel plate. The replacement
resulted a structural weight reduction and when compared to HSS steel due to its higher yield
strength (65 ksi. VS. 51 ksi). The specified composition for HSLA-65 per ASTM A945 Grade 65 is
shown in Table 3-2.
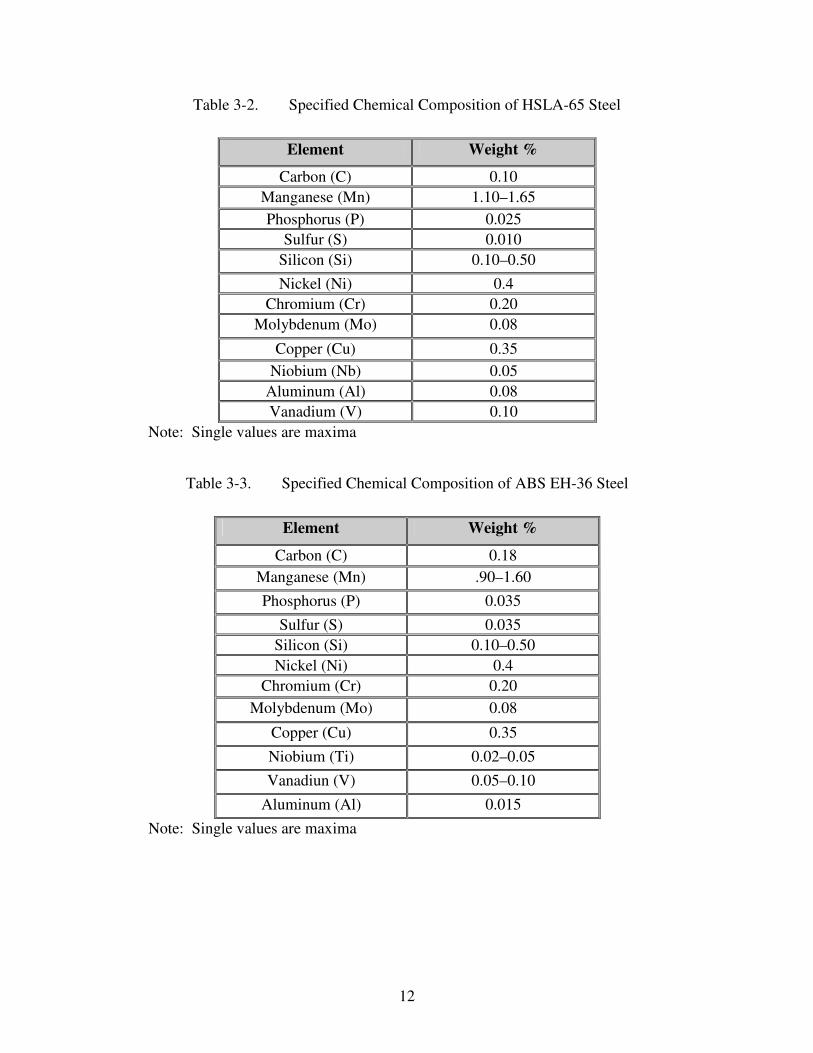
ABS EH-36 is a HSS steel used in shipbuilding with good weldability and toughness
properties. The specified composition for EH-36 per ABS specification is shown in Table 3-3.
12
Table 3-2. Specified Chemical Composition of HSLA-65 Steel
Element Weight %
Carbon (C) 0.10 Manganese (Mn) 1.10–1.65 Phosphorus (P) 0.025
Sulfur (S) 0.010 Silicon (Si) 0.10–0.50 Nickel (Ni) 0.4
Chromium (Cr) 0.20 Molybdenum (Mo) 0.08
Copper (Cu) 0.35 Niobium (Nb) 0.05
Aluminum (Al) 0.08 Vanadium (V) 0.10
Note: Single values are maxima
Table 3-3. Specified Chemical Composition of ABS EH-36 Steel
Element Weight %
Carbon (C) 0.18 Manganese (Mn) .90–1.60 Phosphorus (P) 0.035
Sulfur (S) 0.035 Silicon (Si) 0.10–0.50 Nickel (Ni) 0.4
Chromium (Cr) 0.20 Molybdenum (Mo) 0.08
Copper (Cu) 0.35 Niobium (Ti) 0.02–0.05 Vanadiun (V) 0.05–0.10
Aluminum (Al) 0.015 Note: Single values are maxima
13
3.1.2 Welding Consumables
SAW is a well-established method for welding most grades of carbon and low alloy steels
found in today’s shipbuilding industry. Offering high productivity, along with good weld quality,
excellent weld appearance and environmental advantages (e.g., no fume emissions), SAW is an
attractive method, especially when welding thicker materials such as those found in shipbuilding.
Welding of HSLA-65 steel was performed using Lincoln Electric LA-71(AWS EM14K) for
both the electrode and cold wire using a Lincoln Electric MIL800-H flux. Welding of the HSLA-
100 steel was performed using Lincoln Electric LA-100 wire for the electrode and ESAB Spoolarc
95, ER100S for the cold wire, both are produced to the requirements of MIL-100S-1 per MIL-E-
23765/2D. The flux used to weld all HSLA-100 weldments was ESAB OK10.62. Welding of the
EH-36 steel was performed using Lincoln Electric LA-50 (AWS EM13K) wire for the electrode and
Hobart Brothers Quantum Arc 3 ER70S-3 for the cold wire. The flux used to weld all EH-36
weldments was ESAB OK10.62. Base metal and electrode combinations are shown in Tables 3-4.
Table 3-4. Welding Consumables for Each Base Metal
Steel Electrode Class and
Brand
Electrode Diameter,
inch
Cold wire Class and
Brand
Cold Wire Diameter,
inch Flux
HSLA-65 AWS
EM14K LA-71
0.125 AWS EM14K LA-71 0.0625 Lincoln
MIL800-H
HSLA-100 MIL-100S-1 LA-100 0.125 SpoolArc 95/
MIL-100S-1 0.0625 ESAB OK 10.62
EH-36 AWS
EM13K L-50
0.125 ER70S-3 0.0625 ESAB OK 10.62
ESAB OK10.62 flux is a bonded, fully basic flux used primarily for multipass butt-welding
carbon and low alloy steel plate and is manufactured by ESAB Welding and Cutting. OK10.62 flux
is suited for AC and DC, single- and multi-wire systems at currents up to 1000 A. Lincoln Electric
MIL800-H flux is an agglomerated, neutral flux used for multipass butt-welding carbon and low
alloy steel plate with single- and multi-wire systems.
Agglomerated fluxes are manufactured by taking a mixture of prescribed ingredients and
adding a ceramic or a mineral material as a cementing or binding agent. To accomplish
14
cementation, the total mixture is then heated to about 600 °C (1100 °F). After cementation has been
completed, the mixture is cooled and cakes of flux are formed. These cakes are then crushed and
screened to produce the specified range of flux mesh sizes.
Bonded fluxes, like agglomerated fluxes, also use a binding agent to hold all the ingredients
together until a solid cake of flux is formed. The bonding materials used are aqueous silicates of
sodium and potassium, which differ from the ceramic or mineral materials used in the manufacture
of agglomerated fluxes. The dry ingredients are mixed with the liquid silicate and then dried by
baking to approximately 300 °C (600 °F). The dried, bonded cake is then crushed and screened just
like the agglomerated flux. It should be noted that bonded fluxes sometimes have a greater tendency
to pick up moisture than agglomerated fluxes; therefore, bonded flux may require better protection
than agglomerated and fused fluxes during storage and handling [4].
3.2 Weldment and Joint Details
For each base material type described above, CTC produced the number of weldments shown
in Table 3-5 below. These quantities included one benchmark welding for each base metal welded
at approximately 85 kJ/in total heat input.
Table 3-5. Number of Weldments and Thickness for Each Base Metal
Steel Thickness, inch No. of Joints
HSLA-65 1.25 6 HSLA-100 2 2
EH-36 0.5 2 10 total
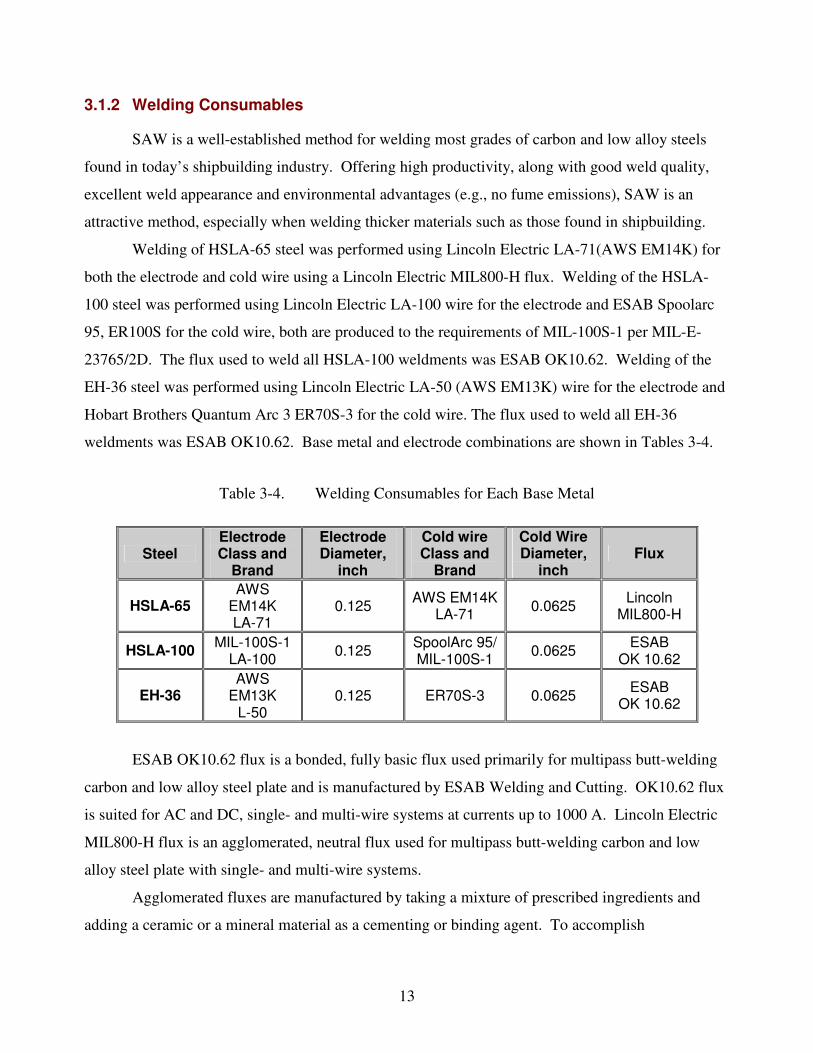
Each weldment was 16 inches wide (minimum) and 28 inches long (minimum) as shown in
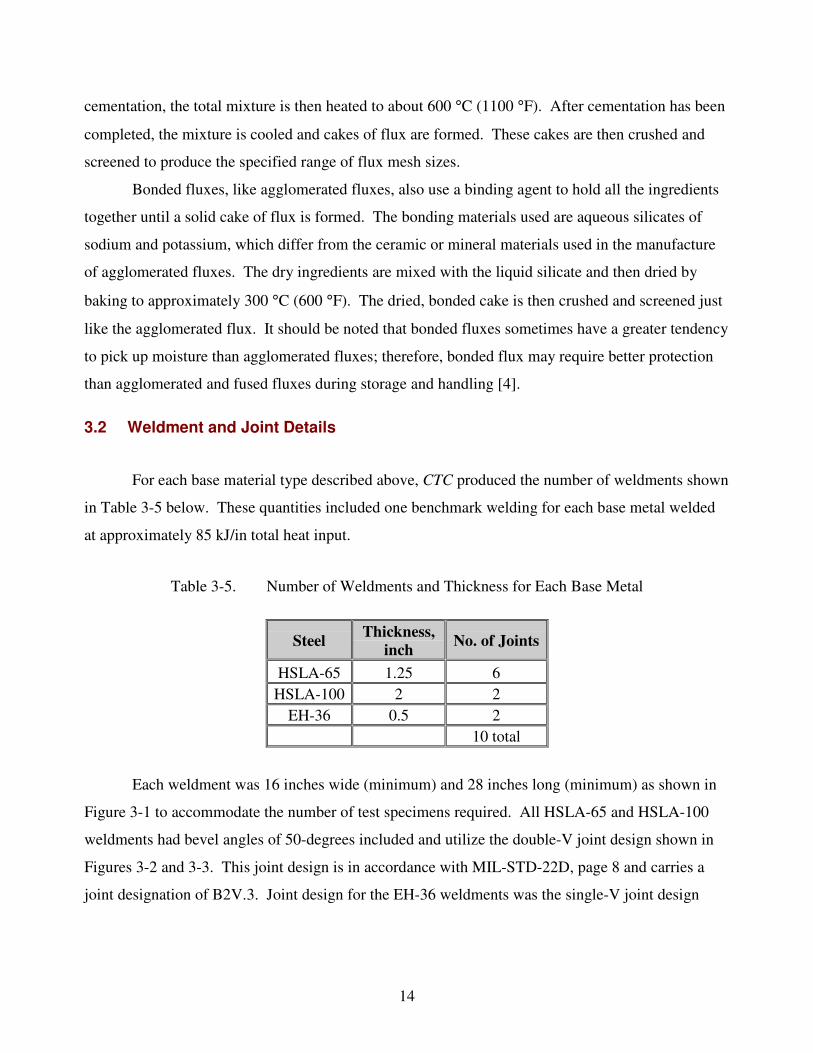
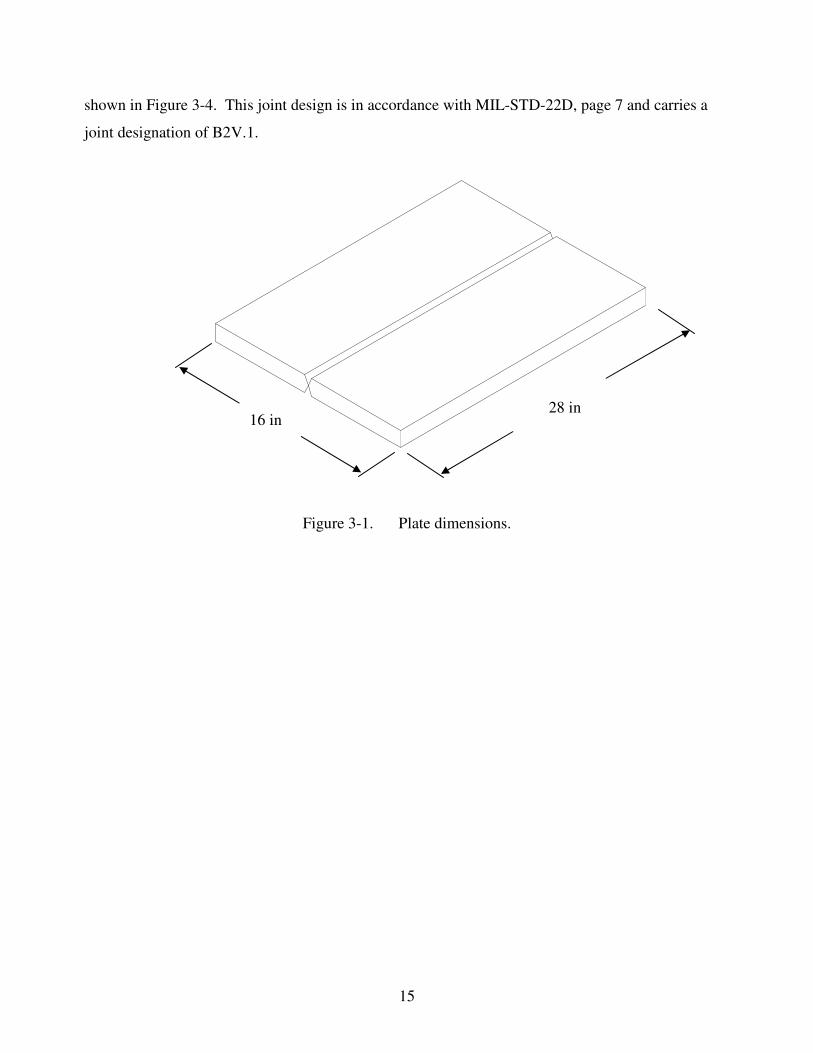
Figure 3-1 to accommodate the number of test specimens required. All HSLA-65 and HSLA-100
weldments had bevel angles of 50-degrees included and utilize the double-V joint design shown in
Figures 3-2 and 3-3. This joint design is in accordance with MIL-STD-22D, page 8 and carries a
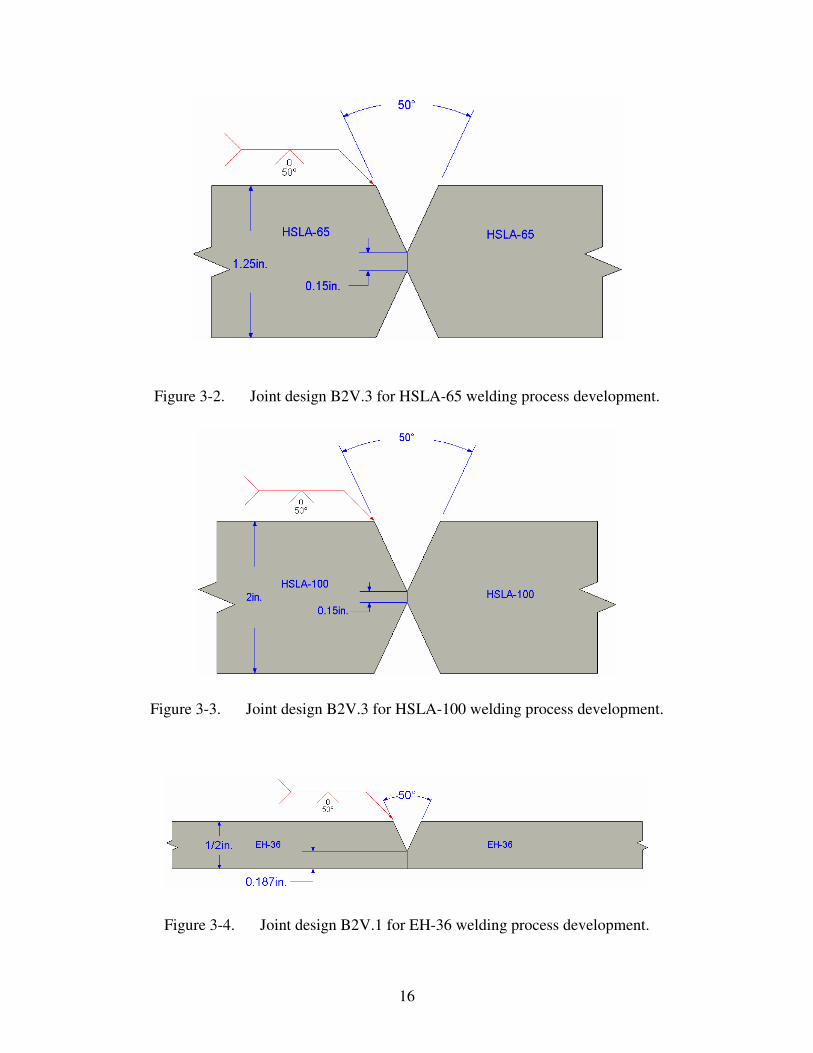
joint designation of B2V.3. Joint design for the EH-36 weldments was the single-V joint design
15
shown in Figure 3-4. This joint design is in accordance with MIL-STD-22D, page 7 and carries a
joint designation of B2V.1.
Figure 3-1. Plate dimensions.
16 in 28 in
16
Figure 3-2. Joint design B2V.3 for HSLA-65 welding process development.
Figure 3-3. Joint design B2V.3 for HSLA-100 welding process development.
Figure 3-4. Joint design B2V.1 for EH-36 welding process development.
17
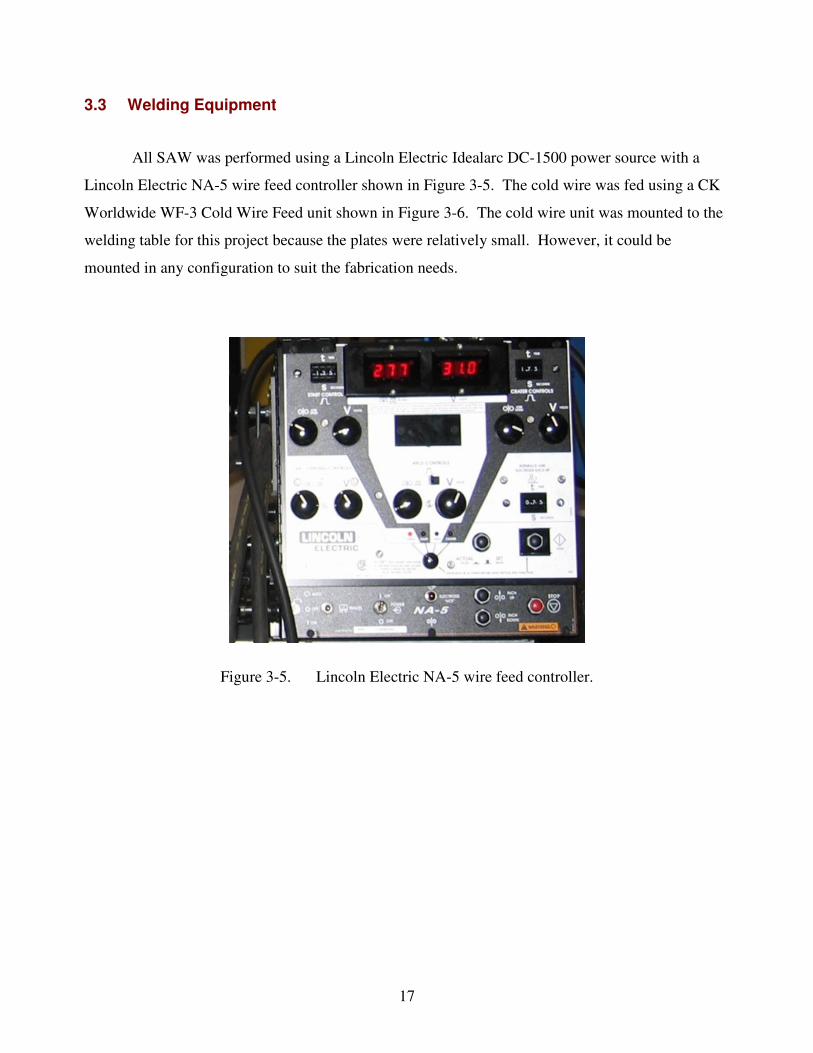
3.3 Welding Equipment
All SAW was performed using a Lincoln Electric Idealarc DC-1500 power source with a
Lincoln Electric NA-5 wire feed controller shown in Figure 3-5. The cold wire was fed using a CK
Worldwide WF-3 Cold Wire Feed unit shown in Figure 3-6. The cold wire unit was mounted to the
welding table for this project because the plates were relatively small. However, it could be
mounted in any configuration to suit the fabrication needs.
Figure 3-5. Lincoln Electric NA-5 wire feed controller.
18
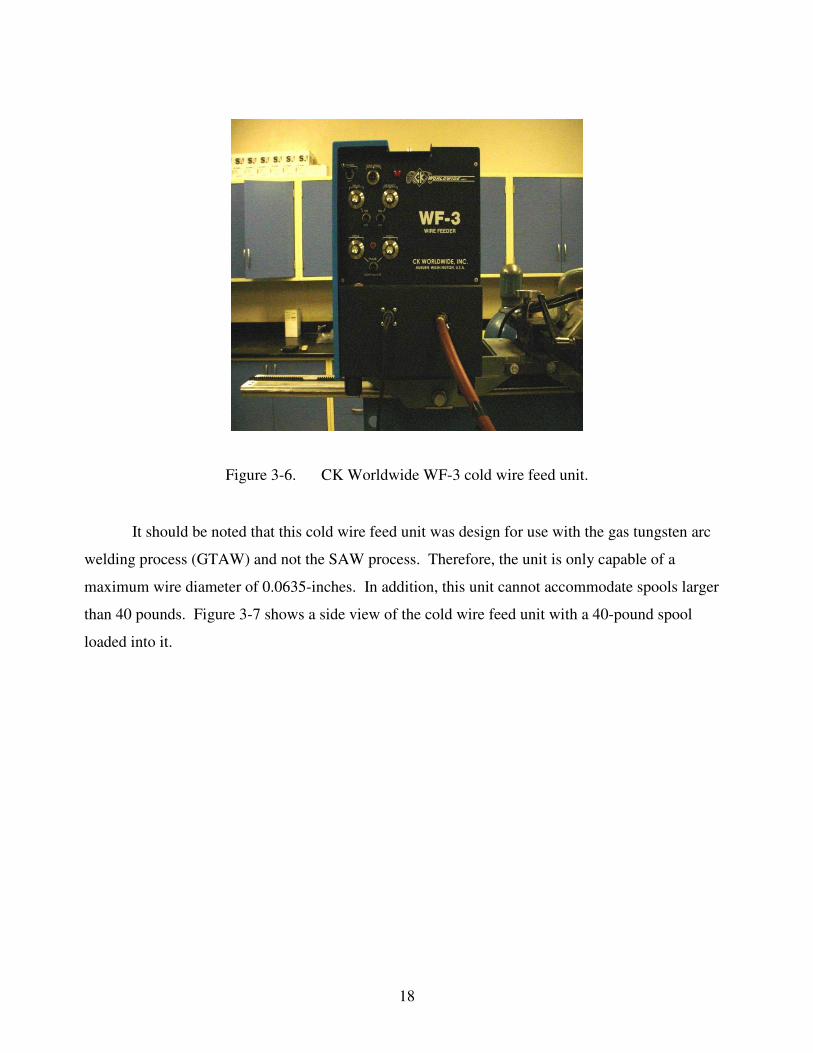
Figure 3-6. CK Worldwide WF-3 cold wire feed unit.
It should be noted that this cold wire feed unit was design for use with the gas tungsten arc
welding process (GTAW) and not the SAW process. Therefore, the unit is only capable of a
maximum wire diameter of 0.0635-inches. In addition, this unit cannot accommodate spools larger
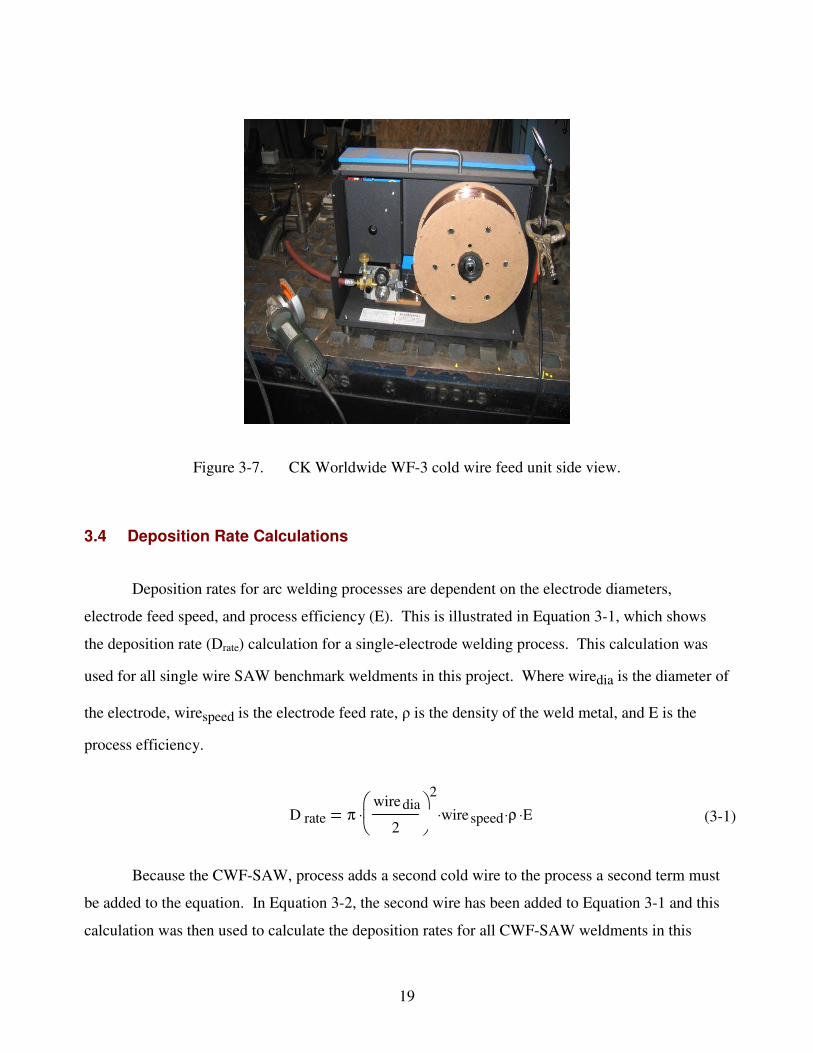
than 40 pounds. Figure 3-7 shows a side view of the cold wire feed unit with a 40-pound spool
loaded into it.
19
Figure 3-7. CK Worldwide WF-3 cold wire feed unit side view.
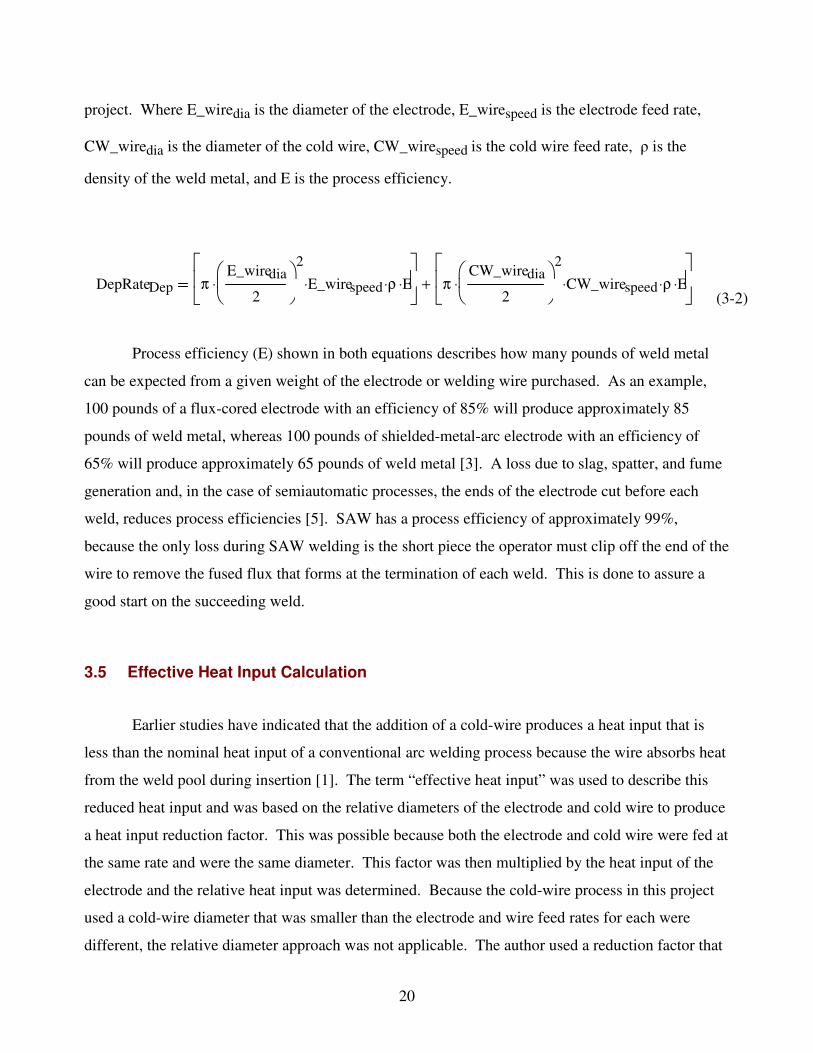
3.4 Deposition Rate Calculations
Deposition rates for arc welding processes are dependent on the electrode diameters,
electrode feed speed, and process efficiency (E). This is illustrated in Equation 3-1, which shows
the deposition rate (Drate) calculation for a single-electrode welding process. This calculation was
used for all single wire SAW benchmark weldments in this project. Where wiredia is the diameter of
the electrode, wirespeed is the electrode feed rate, � is the density of the weld metal, and E is the
process efficiency.
Because the CWF-SAW, process adds a second cold wire to the process a second term must
be added to the equation. In Equation 3-2, the second wire has been added to Equation 3-1 and this
calculation was then used to calculate the deposition rates for all CWF-SAW weldments in this
D rate πwiredia
2
���
���
2
⋅ wire speed⋅ ρ⋅ E⋅ (3-1)
20
project. Where E_wiredia is the diameter of the electrode, E_wirespeed is the electrode feed rate,
CW_wiredia is the diameter of the cold wire, CW_wirespeed is the cold wire feed rate, � is the
density of the weld metal, and E is the process efficiency.
DepRateDep πE_wiredia
2
���
���
2
⋅ E_wirespeed⋅ ρ⋅ E⋅��
��
πCW_wiredia
2
���
���
2
⋅ CW_wirespeed⋅ ρ⋅ E⋅��
��
+
Process efficiency (E) shown in both equations describes how many pounds of weld metal
can be expected from a given weight of the electrode or welding wire purchased. As an example,
100 pounds of a flux-cored electrode with an efficiency of 85% will produce approximately 85
pounds of weld metal, whereas 100 pounds of shielded-metal-arc electrode with an efficiency of
65% will produce approximately 65 pounds of weld metal [3]. A loss due to slag, spatter, and fume
generation and, in the case of semiautomatic processes, the ends of the electrode cut before each
weld, reduces process efficiencies [5]. SAW has a process efficiency of approximately 99%,
because the only loss during SAW welding is the short piece the operator must clip off the end of the
wire to remove the fused flux that forms at the termination of each weld. This is done to assure a
good start on the succeeding weld.
3.5 Effective Heat Input Calculation
Earlier studies have indicated that the addition of a cold-wire produces a heat input that is
less than the nominal heat input of a conventional arc welding process because the wire absorbs heat
from the weld pool during insertion [1]. The term “effective heat input” was used to describe this
reduced heat input and was based on the relative diameters of the electrode and cold wire to produce
a heat input reduction factor. This was possible because both the electrode and cold wire were fed at
the same rate and were the same diameter. This factor was then multiplied by the heat input of the
electrode and the relative heat input was determined. Because the cold-wire process in this project
used a cold-wire diameter that was smaller than the electrode and wire feed rates for each were
different, the relative diameter approach was not applicable. The author used a reduction factor that
(3-2)
21
was based on previous research done at CTC and was based on electrode volume per unit time [7].
This would accommodate the feed rate difference between the electrode and the cold wire.
Equations 3-3 and 3-4 show how the electrode and cold-wire volume per unit time were
calculated (evol and cwvol) and Equation 3-5 shows the reduction factor calculation (Cf_mod) that
was used to calculate the effective heat input for all cold wire feed weldments [7].
In the above calculations, de and dcw are the electrode and cold-wire diameters respectively,
and espeed and cwspeed are the electrode and cold-wire feed rates. This reduction in heat input was
not verified during actual welding trials by the use of thermocouples, however, this report will show
that the hypothesis of an effective heat input is plausible through the use of hardness readings,
weldment surface temperature readings, and CVN data generated for various benchmark and cold-
wire feed weldments.
3.6 Task 1 HSLA-65 Cold Wire Feed
3.6.1 Process Development
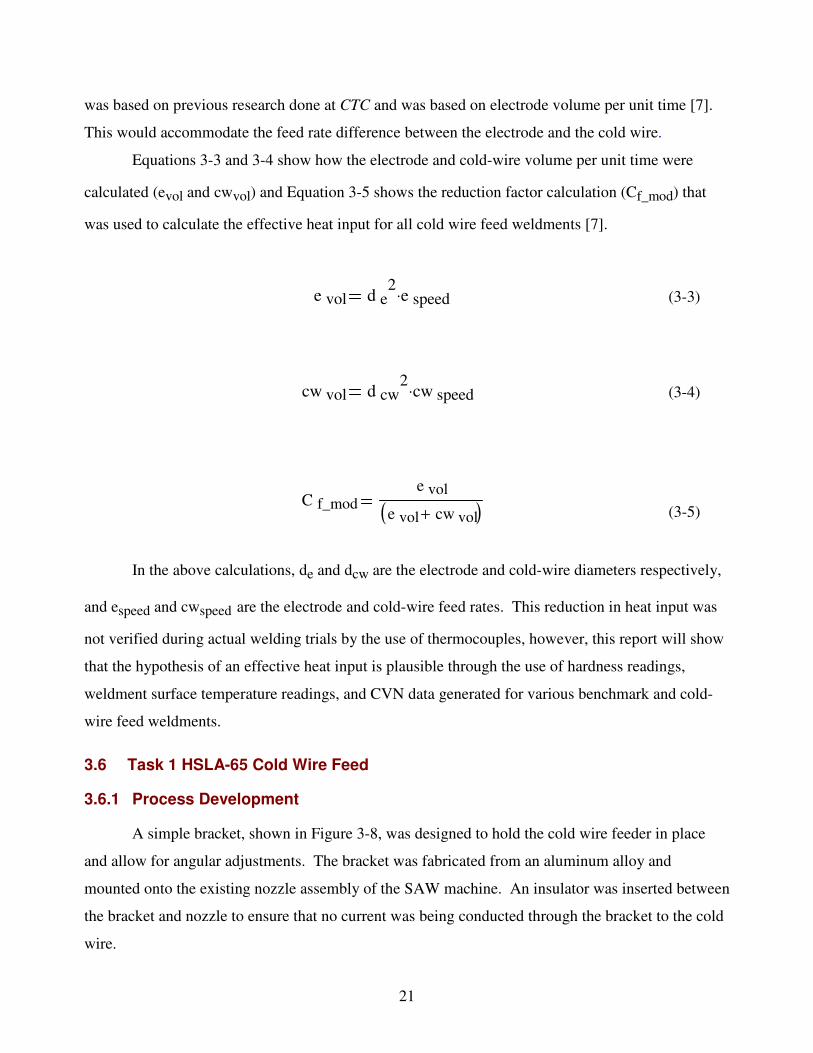
A simple bracket, shown in Figure 3-8, was designed to hold the cold wire feeder in place
and allow for angular adjustments. The bracket was fabricated from an aluminum alloy and
mounted onto the existing nozzle assembly of the SAW machine. An insulator was inserted between
the bracket and nozzle to ensure that no current was being conducted through the bracket to the cold
wire.
e vol d e2
e speed⋅
cw vol d cw2
cw speed⋅
C f_mode vol
e vol cw vol+( )
(3-3)
(3-4)
(3-5)
22
Figure 3-8. Cold-wire bracket.
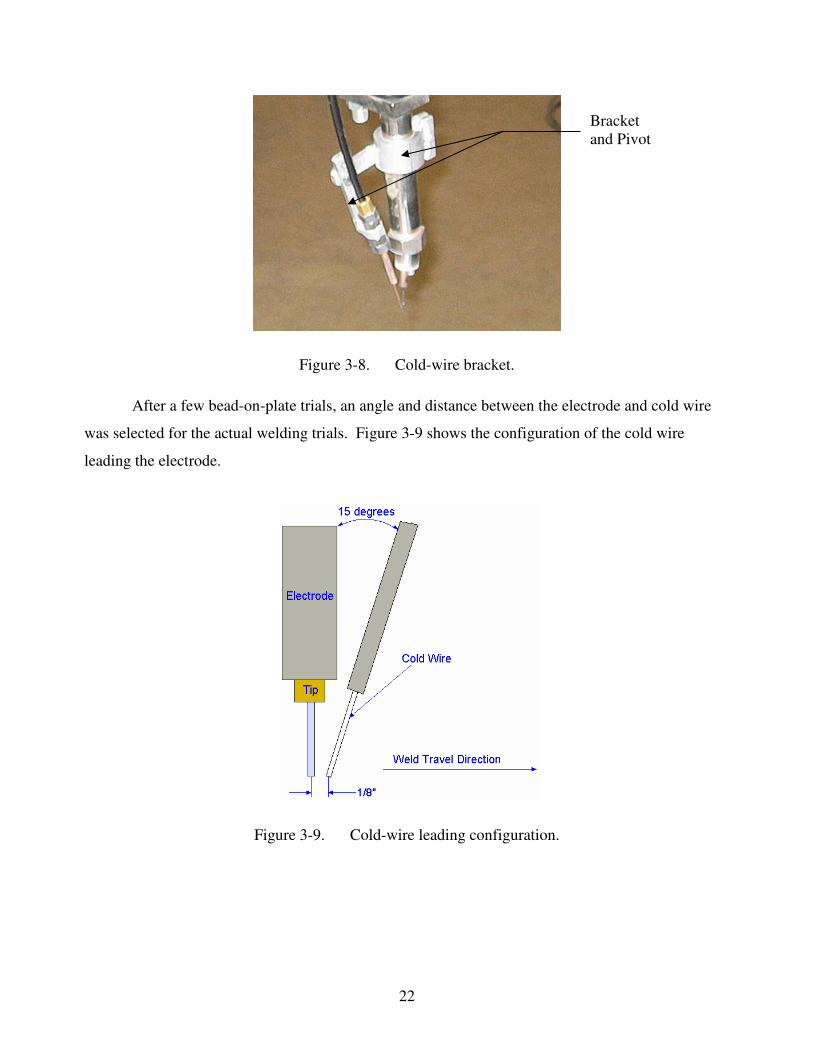
After a few bead-on-plate trials, an angle and distance between the electrode and cold wire
was selected for the actual welding trials. Figure 3-9 shows the configuration of the cold wire
leading the electrode.
Figure 3-9. Cold-wire leading configuration.
Bracket and Pivot Arm
23
3.6.2 Weldment CTC-024 Single Wire Process
In this task, six (6) weldments were fabricated using 1.25-inch HSLA-65 steel. The first
weldment, CTC-024, was fabricated using the single wire SAW process with a 0.125-inch diameter
electrode. All welding parameters are shown in Table 3-6. This weldment was used as the
benchmark for the last five weldments fabricated using the cold wire process.
Table 3-6. Weld Parameters for Single Wire Benchmark Weldment CTC-024
Wire Size (in) Wire Speed (ipm) Pass
Electrode Cold Wire
Current Avg. Amps
Avg. Volts
Avg. Travel Speed (ipm) Electrode
Cold Wire
Root 0.125 0.0625 DCEP 412 30.2 12 53 N/A
Fill and Cap 0.125 0.0625 DCEP 470 31.4 10 62 N/A
Table 3-7 shows the calculated average heat input for each pass and the deposition rates
using equation 3-1 for weldment CTC-024 with the parameters shown in Table 3-7. It should be
noted that the heat input calculation does not include the arc efficiency factor for the SAW process.
In arc welding, heat losses by convection and radiation should be taken into account by the
efficiency factor when calculating heat input. This factor is used to determine the actual heat
transferred to the weldment. Most fabrication codes do not use this factor so it was decided by the
author not to incorporate it into this project for heat input calculations.
Table 3-7. Heat Input and Deposition Rates Benchmark Weldment CTC-024
Weld Identification Pass Avg. Heat Input
Electrode (kJ/in)
Reduction Factor
Effective Heat Input (kJ/in)
Calculated Deposition
Rate (lb/hr)
Root Passes 62.2 N/A N/A 10.9
CTC-024 Fill and Cap
Passes 88.5 N/A N/A 12.8
24
3.6.3 Machining and Testing
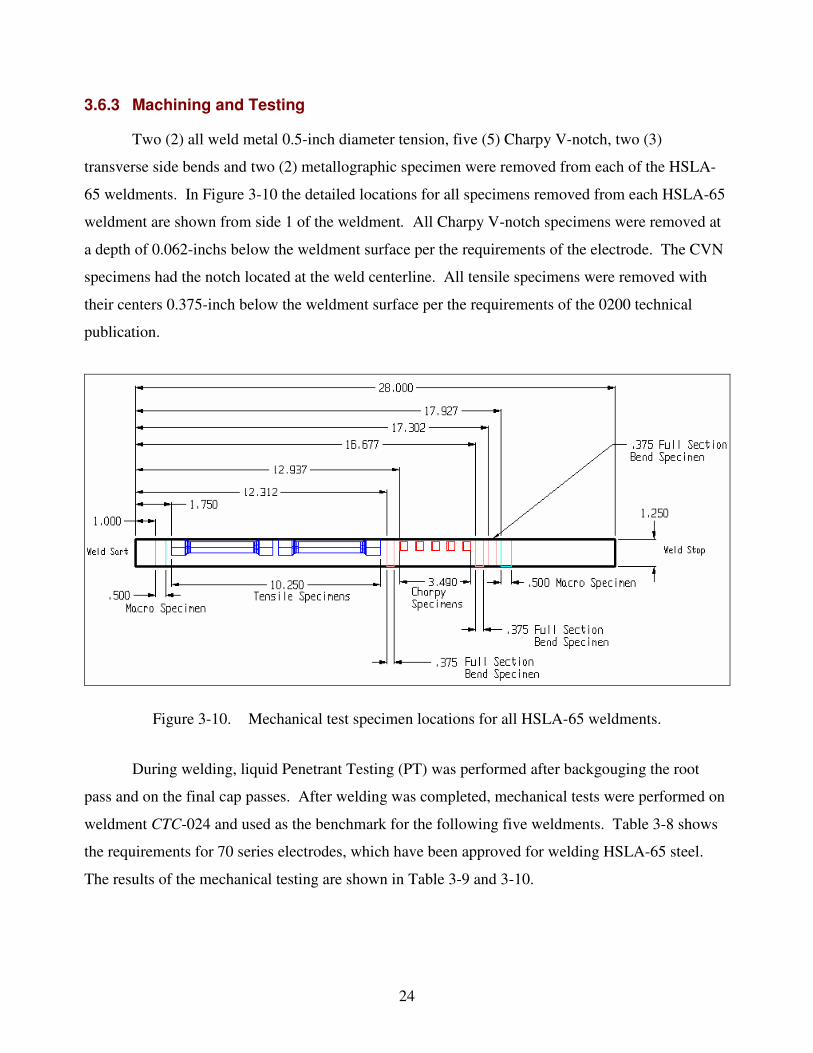
Two (2) all weld metal 0.5-inch diameter tension, five (5) Charpy V-notch, two (3)
transverse side bends and two (2) metallographic specimen were removed from each of the HSLA-
65 weldments. In Figure 3-10 the detailed locations for all specimens removed from each HSLA-65
weldment are shown from side 1 of the weldment. All Charpy V-notch specimens were removed at
a depth of 0.062-inchs below the weldment surface per the requirements of the electrode. The CVN
specimens had the notch located at the weld centerline. All tensile specimens were removed with
their centers 0.375-inch below the weldment surface per the requirements of the 0200 technical
publication.
Figure 3-10. Mechanical test specimen locations for all HSLA-65 weldments.
During welding, liquid Penetrant Testing (PT) was performed after backgouging the root
pass and on the final cap passes. After welding was completed, mechanical tests were performed on
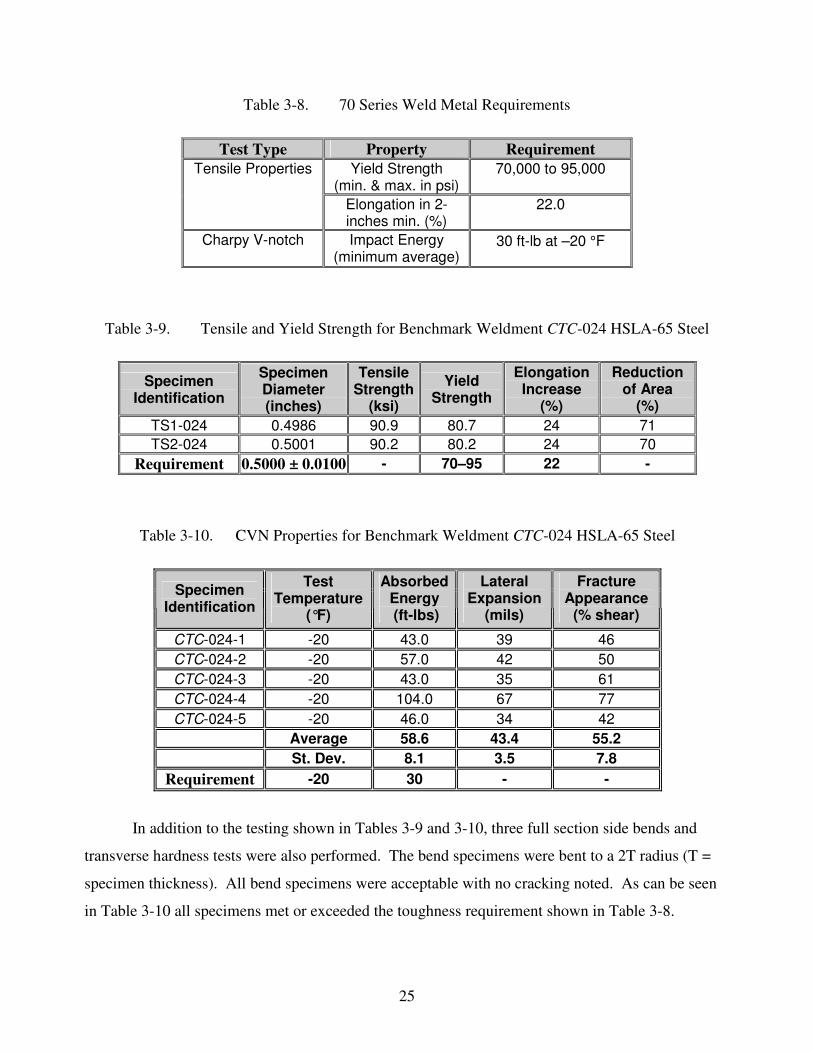
weldment CTC-024 and used as the benchmark for the following five weldments. Table 3-8 shows
the requirements for 70 series electrodes, which have been approved for welding HSLA-65 steel.
The results of the mechanical testing are shown in Table 3-9 and 3-10.
25
Table 3-8. 70 Series Weld Metal Requirements
Test Type Property Requirement Yield Strength
(min. & max. in psi) 70,000 to 95,000 Tensile Properties
Elongation in 2-inches min. (%)
22.0
Charpy V-notch Impact Energy (minimum average)
30 ft-lb at –20 °F
Table 3-9. Tensile and Yield Strength for Benchmark Weldment CTC-024 HSLA-65 Steel
Specimen Identification
Specimen Diameter (inches)
Tensile Strength
(ksi)
Yield Strength
Elongation Increase
(%)
Reduction of Area
(%) TS1-024 0.4986 90.9 80.7 24 71 TS2-024 0.5001 90.2 80.2 24 70
Requirement 0.5000 ± 0.0100 - 70–95 22 -
Table 3-10. CVN Properties for Benchmark Weldment CTC-024 HSLA-65 Steel
Specimen Identification
Test Temperature
(°F)
Absorbed Energy (ft-lbs)
Lateral Expansion
(mils)
Fracture Appearance
(% shear)
CTC-024-1 -20 43.0 39 46 CTC-024-2 -20 57.0 42 50 CTC-024-3 -20 43.0 35 61 CTC-024-4 -20 104.0 67 77 CTC-024-5 -20 46.0 34 42
Average 58.6 43.4 55.2 St. Dev. 8.1 3.5 7.8
Requirement -20 30 - -
In addition to the testing shown in Tables 3-9 and 3-10, three full section side bends and
transverse hardness tests were also performed. The bend specimens were bent to a 2T radius (T =
specimen thickness). All bend specimens were acceptable with no cracking noted. As can be seen
in Table 3-10 all specimens met or exceeded the toughness requirement shown in Table 3-8.
26
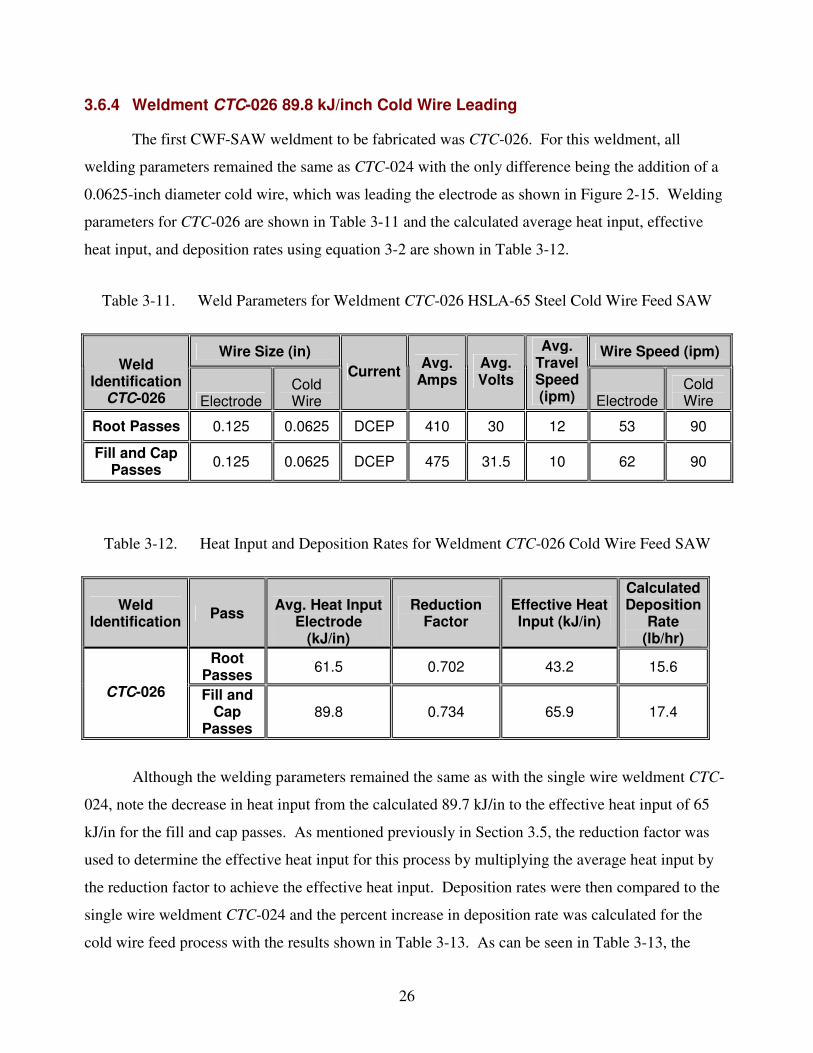
3.6.4 Weldment CTC-026 89.8 kJ/inch Cold Wire Leading
The first CWF-SAW weldment to be fabricated was CTC-026. For this weldment, all
welding parameters remained the same as CTC-024 with the only difference being the addition of a
0.0625-inch diameter cold wire, which was leading the electrode as shown in Figure 2-15. Welding
parameters for CTC-026 are shown in Table 3-11 and the calculated average heat input, effective
heat input, and deposition rates using equation 3-2 are shown in Table 3-12.
Table 3-11. Weld Parameters for Weldment CTC-026 HSLA-65 Steel Cold Wire Feed SAW
Wire Size (in) Wire Speed (ipm) Weld
Identification CTC-026 Electrode
Cold Wire
Current Avg. Amps
Avg. Volts
Avg. Travel Speed (ipm) Electrode
Cold Wire
Root Passes 0.125 0.0625 DCEP 410 30 12 53 90
Fill and Cap Passes 0.125 0.0625 DCEP 475 31.5 10 62 90
Table 3-12. Heat Input and Deposition Rates for Weldment CTC-026 Cold Wire Feed SAW
Weld Identification Pass Avg. Heat Input
Electrode (kJ/in)
Reduction Factor
Effective Heat Input (kJ/in)
Calculated Deposition
Rate (lb/hr)
Root Passes 61.5 0.702 43.2 15.6
CTC-026 Fill and Cap
Passes 89.8 0.734 65.9 17.4
Although the welding parameters remained the same as with the single wire weldment CTC-
024, note the decrease in heat input from the calculated 89.7 kJ/in to the effective heat input of 65
kJ/in for the fill and cap passes. As mentioned previously in Section 3.5, the reduction factor was
used to determine the effective heat input for this process by multiplying the average heat input by
the reduction factor to achieve the effective heat input. Deposition rates were then compared to the
single wire weldment CTC-024 and the percent increase in deposition rate was calculated for the
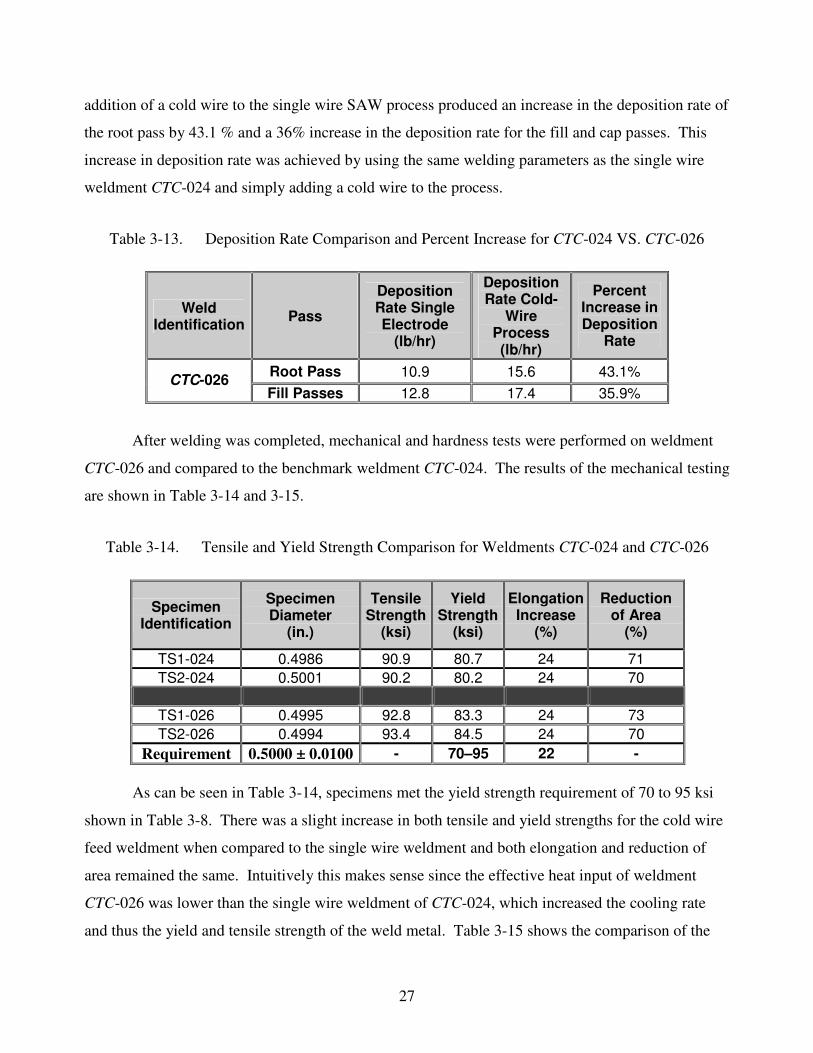
cold wire feed process with the results shown in Table 3-13. As can be seen in Table 3-13, the
27
addition of a cold wire to the single wire SAW process produced an increase in the deposition rate of
the root pass by 43.1 % and a 36% increase in the deposition rate for the fill and cap passes. This
increase in deposition rate was achieved by using the same welding parameters as the single wire
weldment CTC-024 and simply adding a cold wire to the process.
Table 3-13. Deposition Rate Comparison and Percent Increase for CTC-024 VS. CTC-026
Weld Identification Pass
Deposition Rate Single Electrode
(lb/hr)
Deposition Rate Cold-
Wire Process (lb/hr)
Percent Increase in Deposition
Rate
Root Pass 10.9 15.6 43.1% CTC-026 Fill Passes 12.8 17.4 35.9%
After welding was completed, mechanical and hardness tests were performed on weldment
CTC-026 and compared to the benchmark weldment CTC-024. The results of the mechanical testing
are shown in Table 3-14 and 3-15.
Table 3-14. Tensile and Yield Strength Comparison for Weldments CTC-024 and CTC-026
Specimen Identification
Specimen Diameter
(in.)
Tensile Strength
(ksi)
Yield Strength
(ksi)
Elongation Increase
(%)
Reduction of Area
(%)
TS1-024 0.4986 90.9 80.7 24 71 TS2-024 0.5001 90.2 80.2 24 70
TS1-026 0.4995 92.8 83.3 24 73 TS2-026 0.4994 93.4 84.5 24 70
Requirement 0.5000 ± 0.0100 - 70–95 22 -
As can be seen in Table 3-14, specimens met the yield strength requirement of 70 to 95 ksi
shown in Table 3-8. There was a slight increase in both tensile and yield strengths for the cold wire
feed weldment when compared to the single wire weldment and both elongation and reduction of
area remained the same. Intuitively this makes sense since the effective heat input of weldment
CTC-026 was lower than the single wire weldment of CTC-024, which increased the cooling rate
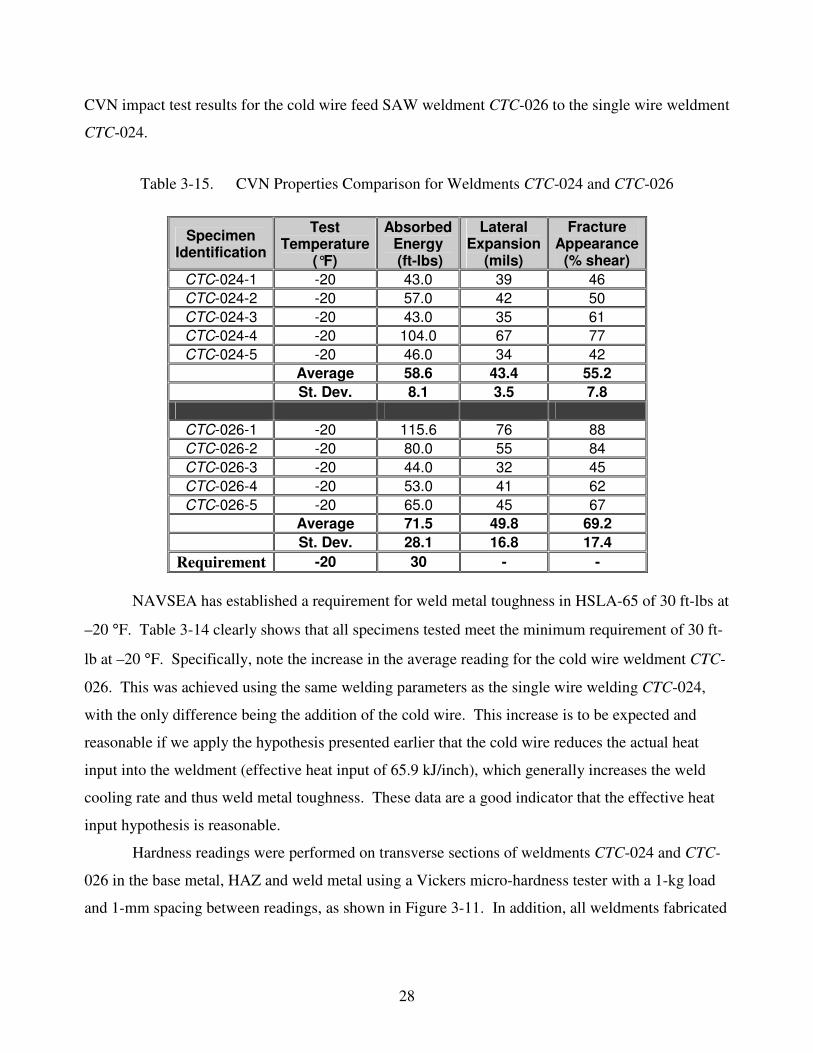
and thus the yield and tensile strength of the weld metal. Table 3-15 shows the comparison of the
28
CVN impact test results for the cold wire feed SAW weldment CTC-026 to the single wire weldment
CTC-024.
Table 3-15. CVN Properties Comparison for Weldments CTC-024 and CTC-026
Specimen Identification
Test Temperature
(°F)
Absorbed Energy (ft-lbs)
Lateral Expansion
(mils)
Fracture Appearance
(% shear) CTC-024-1 -20 43.0 39 46 CTC-024-2 -20 57.0 42 50 CTC-024-3 -20 43.0 35 61 CTC-024-4 -20 104.0 67 77 CTC-024-5 -20 46.0 34 42
Average 58.6 43.4 55.2 St. Dev. 8.1 3.5 7.8
CTC-026-1 -20 115.6 76 88 CTC-026-2 -20 80.0 55 84 CTC-026-3 -20 44.0 32 45 CTC-026-4 -20 53.0 41 62 CTC-026-5 -20 65.0 45 67
Average 71.5 49.8 69.2 St. Dev. 28.1 16.8 17.4
Requirement -20 30 - -
NAVSEA has established a requirement for weld metal toughness in HSLA-65 of 30 ft-lbs at
–20 °F. Table 3-14 clearly shows that all specimens tested meet the minimum requirement of 30 ft-
lb at –20 °F. Specifically, note the increase in the average reading for the cold wire weldment CTC-
026. This was achieved using the same welding parameters as the single wire welding CTC-024,
with the only difference being the addition of the cold wire. This increase is to be expected and
reasonable if we apply the hypothesis presented earlier that the cold wire reduces the actual heat
input into the weldment (effective heat input of 65.9 kJ/inch), which generally increases the weld
cooling rate and thus weld metal toughness. These data are a good indicator that the effective heat
input hypothesis is reasonable.
Hardness readings were performed on transverse sections of weldments CTC-024 and CTC-
026 in the base metal, HAZ and weld metal using a Vickers micro-hardness tester with a 1-kg load
and 1-mm spacing between readings, as shown in Figure 3-11. In addition, all weldments fabricated
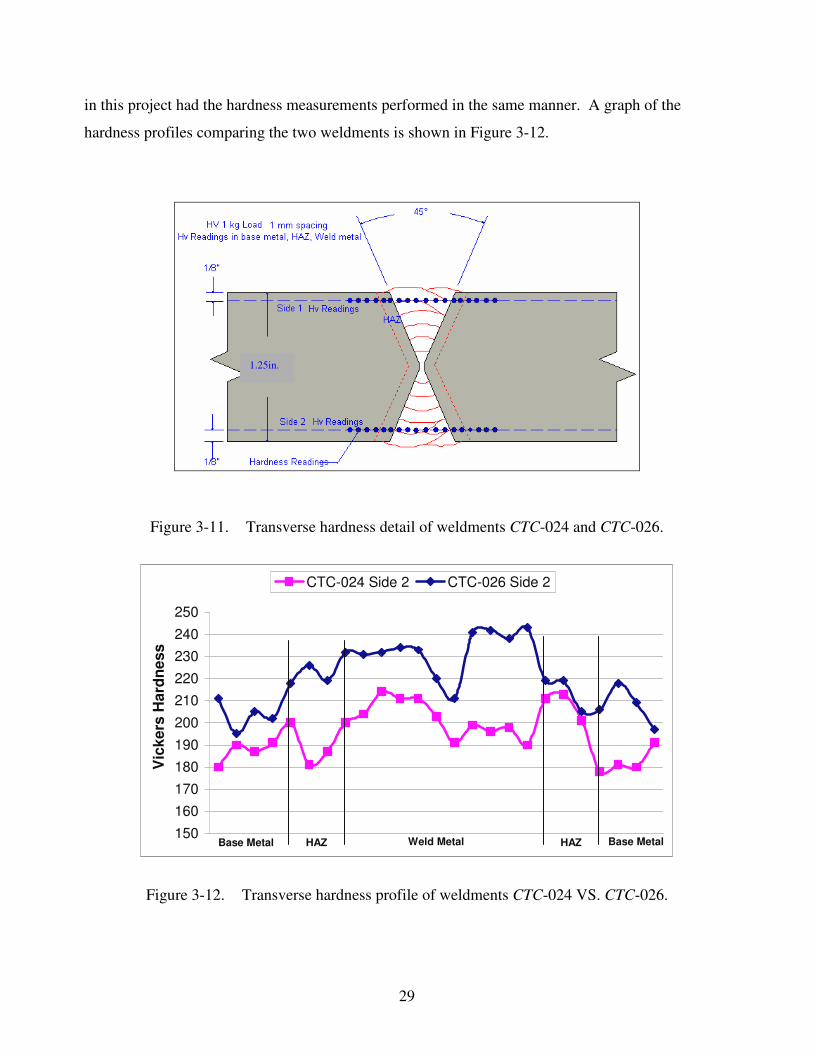
29
in this project had the hardness measurements performed in the same manner. A graph of the
hardness profiles comparing the two weldments is shown in Figure 3-12.
Figure 3-11. Transverse hardness detail of weldments CTC-024 and CTC-026.
150160170180190200210220230240250
Vic
kers
Har
dnes
s
CTC-024 Side 2 CTC-026 Side 2
Base Metal HAZ Weld Metal HAZ Base Metal
Figure 3-12. Transverse hardness profile of weldments CTC-024 VS. CTC-026.
1.25in.
30
Figure 3-12 shows a distinct and significant difference in hardness readings for these two
weldments. The cold wire feed welding has a higher harness reading for both the HAZ and the weld
metal. This is a good indicator of the effective heat input hypothesis that was presented in section
3.5. As shown in Table 3-7, the heat input for CTC-024 is 88.5 kJ/in and the effective heat input for
weldment CTC-026 is 65.9 kJ/in. The lower heat input for CTC-026 would produce a cooling rate
that was higher than that of CTC-024. Typically, the higher the cooling rate the higher the hardness
readings, which is what is observed in Figure 3-12.
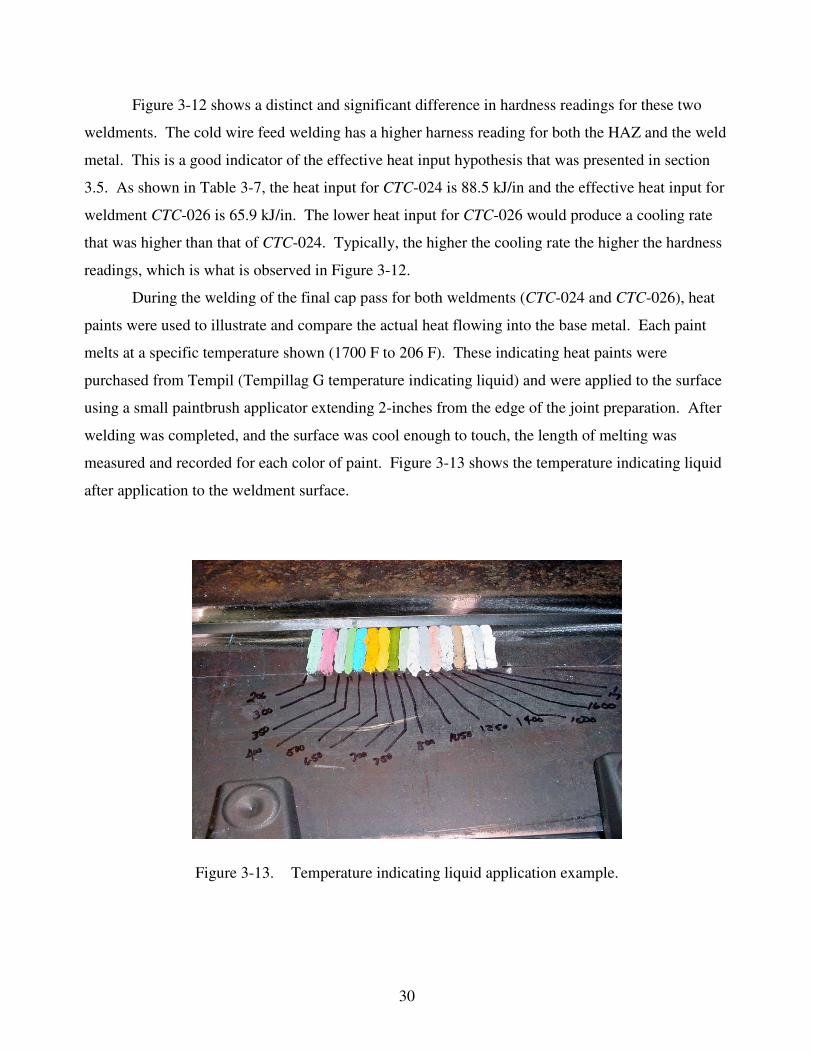
During the welding of the final cap pass for both weldments (CTC-024 and CTC-026), heat
paints were used to illustrate and compare the actual heat flowing into the base metal. Each paint
melts at a specific temperature shown (1700 F to 206 F). These indicating heat paints were
purchased from Tempil (Tempillag G temperature indicating liquid) and were applied to the surface
using a small paintbrush applicator extending 2-inches from the edge of the joint preparation. After
welding was completed, and the surface was cool enough to touch, the length of melting was
measured and recorded for each color of paint. Figure 3-13 shows the temperature indicating liquid
after application to the weldment surface.
Figure 3-13. Temperature indicating liquid application example.
31
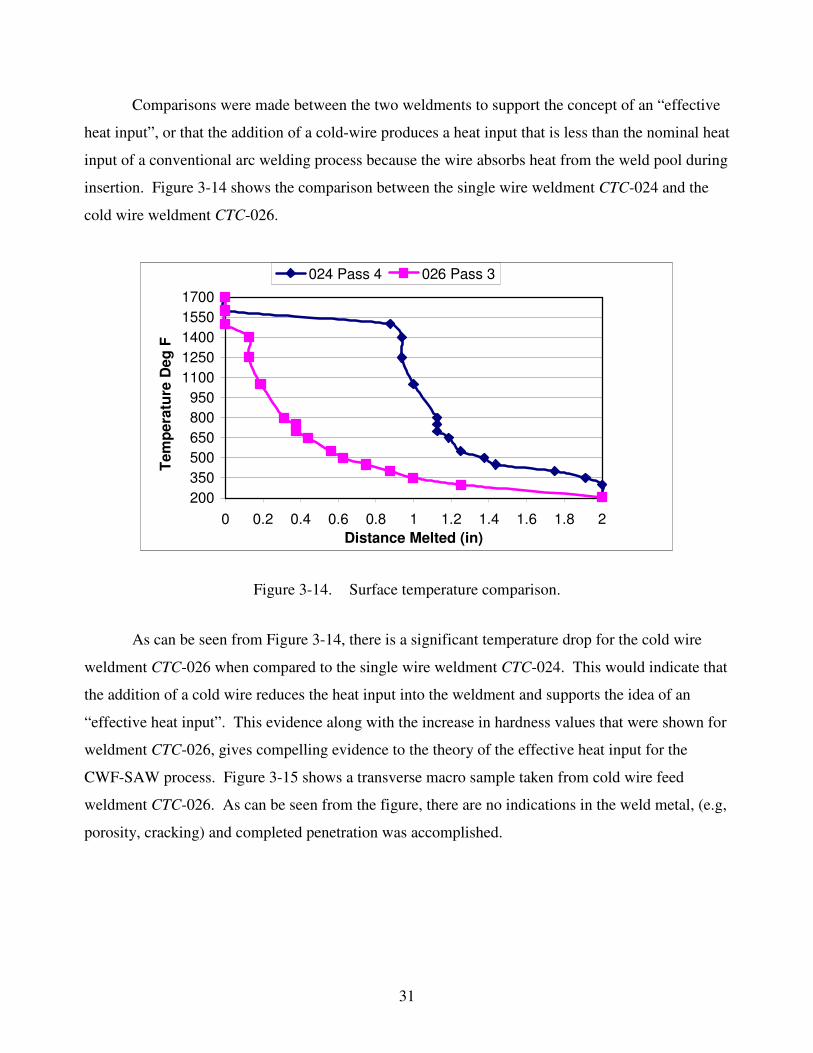
Comparisons were made between the two weldments to support the concept of an “effective
heat input”, or that the addition of a cold-wire produces a heat input that is less than the nominal heat
input of a conventional arc welding process because the wire absorbs heat from the weld pool during
insertion. Figure 3-14 shows the comparison between the single wire weldment CTC-024 and the
cold wire weldment CTC-026.
200350500650800950
11001250140015501700
0 0.2 0.4 0.6 0.8 1 1.2 1.4 1.6 1.8 2Distance Melted (in)
Tem
pera
ture
Deg
F
024 Pass 4 026 Pass 3
Figure 3-14. Surface temperature comparison.
As can be seen from Figure 3-14, there is a significant temperature drop for the cold wire
weldment CTC-026 when compared to the single wire weldment CTC-024. This would indicate that
the addition of a cold wire reduces the heat input into the weldment and supports the idea of an
“effective heat input”. This evidence along with the increase in hardness values that were shown for
weldment CTC-026, gives compelling evidence to the theory of the effective heat input for the
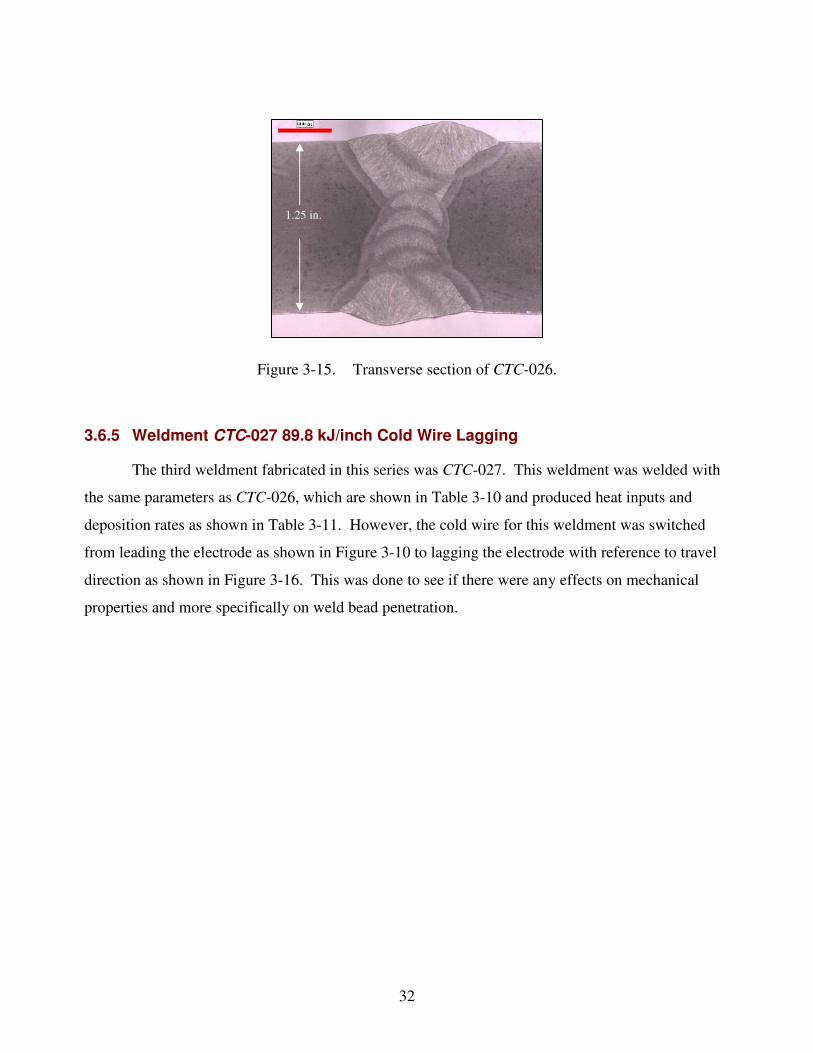
CWF-SAW process. Figure 3-15 shows a transverse macro sample taken from cold wire feed
weldment CTC-026. As can be seen from the figure, there are no indications in the weld metal, (e.g,
porosity, cracking) and completed penetration was accomplished.
32
Figure 3-15. Transverse section of CTC-026.
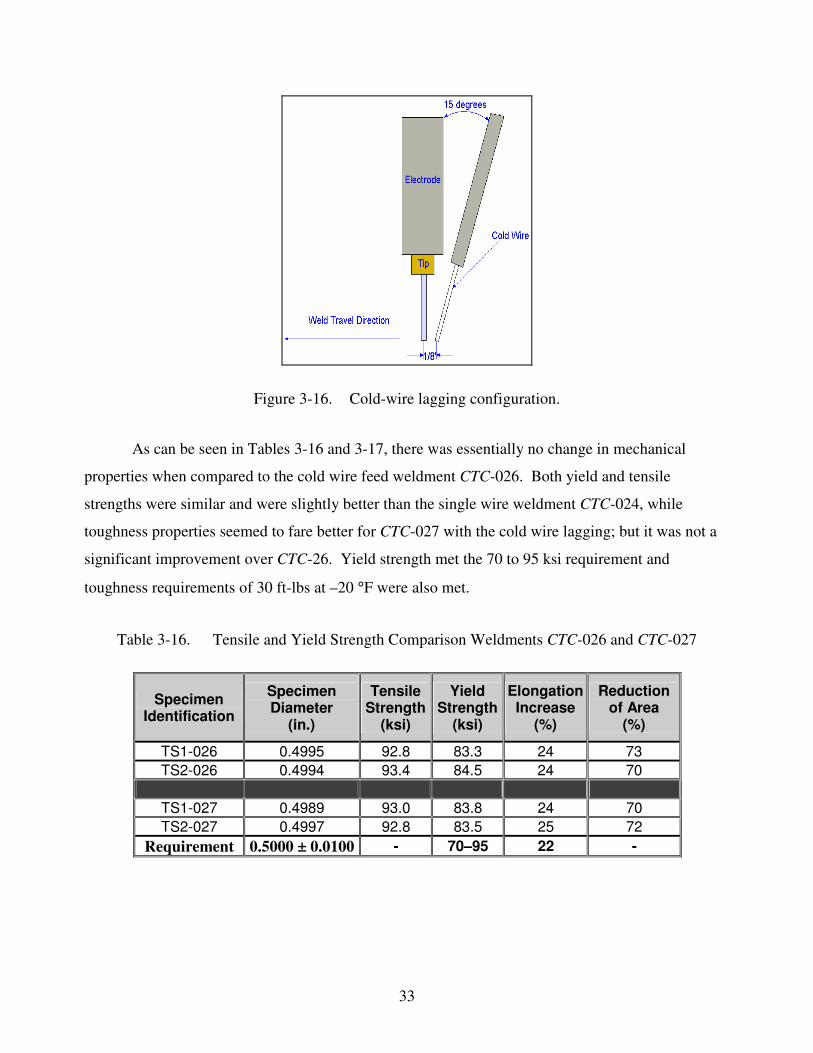
3.6.5 Weldment CTC-027 89.8 kJ/inch Cold Wire Lagging
The third weldment fabricated in this series was CTC-027. This weldment was welded with
the same parameters as CTC-026, which are shown in Table 3-10 and produced heat inputs and
deposition rates as shown in Table 3-11. However, the cold wire for this weldment was switched
from leading the electrode as shown in Figure 3-10 to lagging the electrode with reference to travel
direction as shown in Figure 3-16. This was done to see if there were any effects on mechanical
properties and more specifically on weld bead penetration.
1.25 in.
33
Figure 3-16. Cold-wire lagging configuration.
As can be seen in Tables 3-16 and 3-17, there was essentially no change in mechanical
properties when compared to the cold wire feed weldment CTC-026. Both yield and tensile
strengths were similar and were slightly better than the single wire weldment CTC-024, while
toughness properties seemed to fare better for CTC-027 with the cold wire lagging; but it was not a
significant improvement over CTC-26. Yield strength met the 70 to 95 ksi requirement and
toughness requirements of 30 ft-lbs at –20 °F were also met.
Table 3-16. Tensile and Yield Strength Comparison Weldments CTC-026 and CTC-027
Specimen Identification
Specimen Diameter
(in.)
Tensile Strength
(ksi)
Yield Strength
(ksi)
Elongation Increase
(%)
Reduction of Area
(%)
TS1-026 0.4995 92.8 83.3 24 73 TS2-026 0.4994 93.4 84.5 24 70
TS1-027 0.4989 93.0 83.8 24 70 TS2-027 0.4997 92.8 83.5 25 72
Requirement 0.5000 ± 0.0100 - 70–95 22 -
34
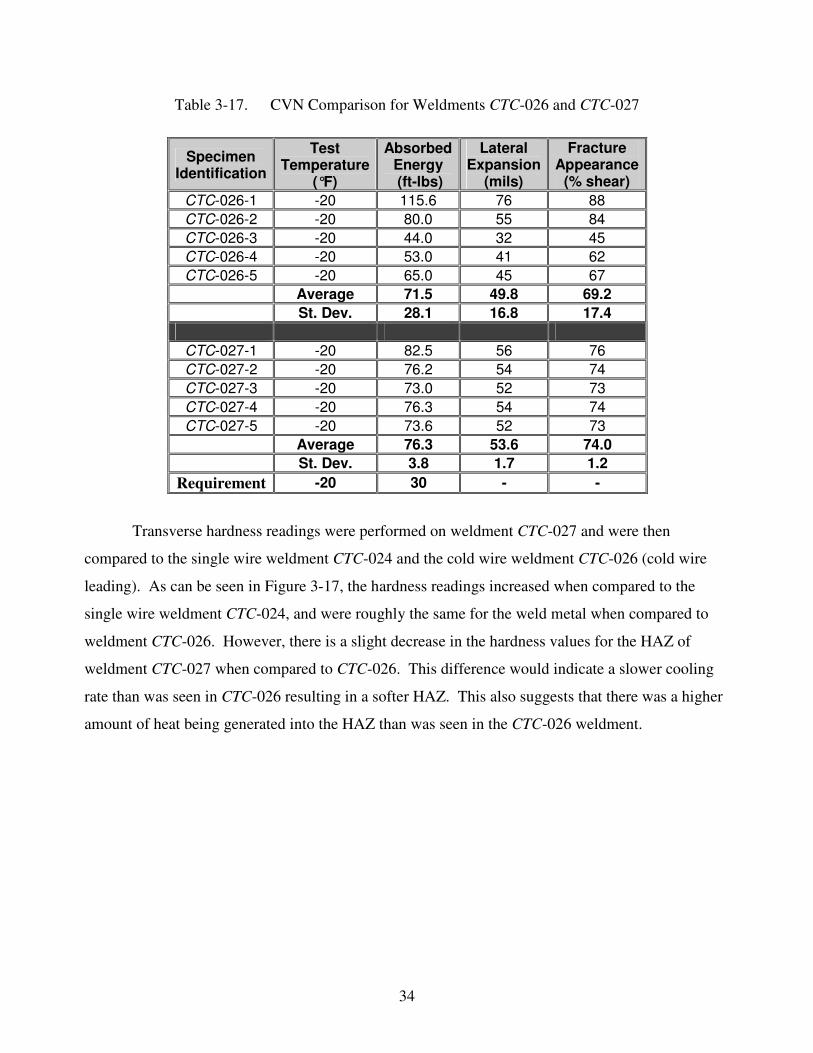
Table 3-17. CVN Comparison for Weldments CTC-026 and CTC-027
Specimen Identification
Test Temperature
(°F)
Absorbed Energy (ft-lbs)
Lateral Expansion
(mils)
Fracture Appearance
(% shear) CTC-026-1 -20 115.6 76 88 CTC-026-2 -20 80.0 55 84 CTC-026-3 -20 44.0 32 45 CTC-026-4 -20 53.0 41 62 CTC-026-5 -20 65.0 45 67
Average 71.5 49.8 69.2 St. Dev. 28.1 16.8 17.4
CTC-027-1 -20 82.5 56 76 CTC-027-2 -20 76.2 54 74 CTC-027-3 -20 73.0 52 73 CTC-027-4 -20 76.3 54 74 CTC-027-5 -20 73.6 52 73
Average 76.3 53.6 74.0 St. Dev. 3.8 1.7 1.2
Requirement -20 30 - -
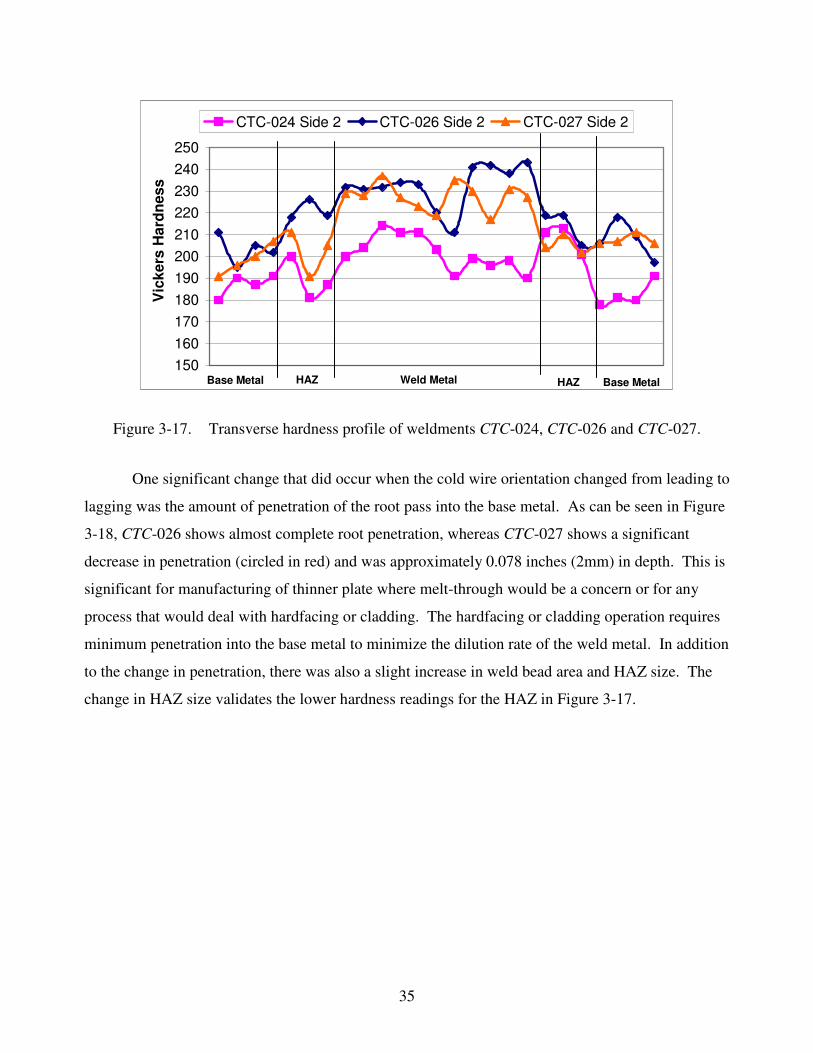
Transverse hardness readings were performed on weldment CTC-027 and were then
compared to the single wire weldment CTC-024 and the cold wire weldment CTC-026 (cold wire
leading). As can be seen in Figure 3-17, the hardness readings increased when compared to the
single wire weldment CTC-024, and were roughly the same for the weld metal when compared to
weldment CTC-026. However, there is a slight decrease in the hardness values for the HAZ of
weldment CTC-027 when compared to CTC-026. This difference would indicate a slower cooling
rate than was seen in CTC-026 resulting in a softer HAZ. This also suggests that there was a higher
amount of heat being generated into the HAZ than was seen in the CTC-026 weldment.
35
150160170180190200210220230240250
Vic
kers
Har
dnes
s
CTC-024 Side 2 CTC-026 Side 2 CTC-027 Side 2
Base MetalHAZWeld MetalBase Metal HAZ
Figure 3-17. Transverse hardness profile of weldments CTC-024, CTC-026 and CTC-027.
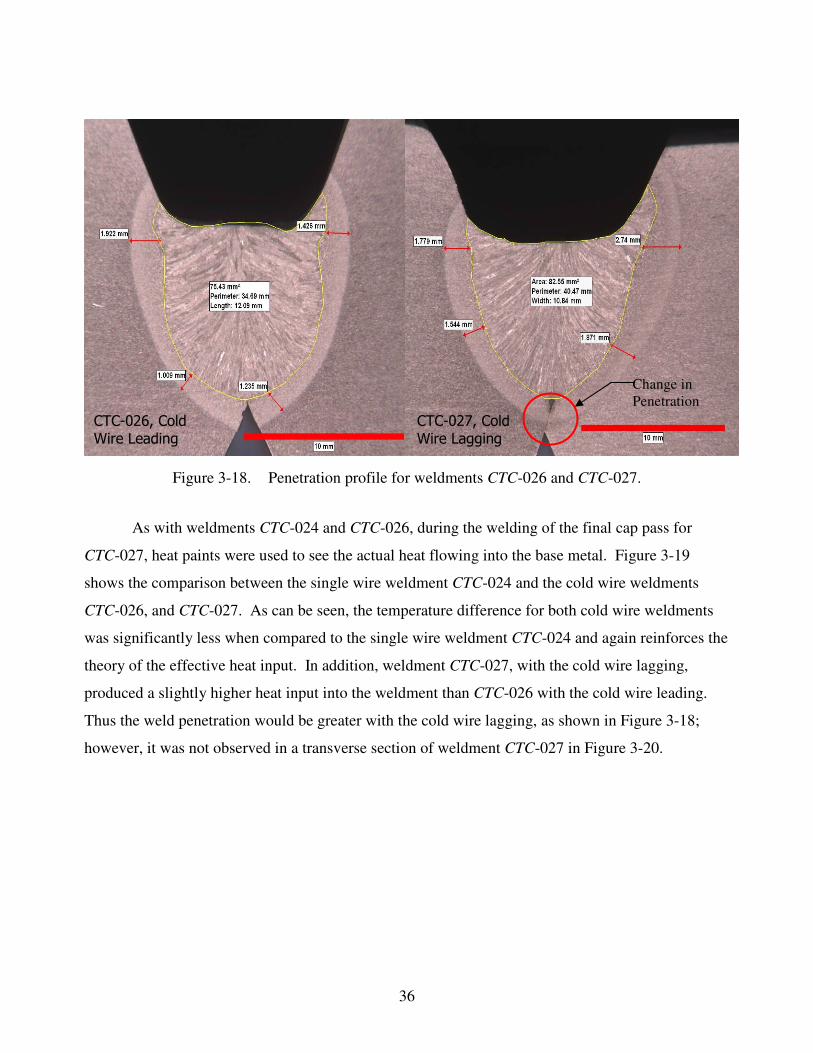
One significant change that did occur when the cold wire orientation changed from leading to
lagging was the amount of penetration of the root pass into the base metal. As can be seen in Figure
3-18, CTC-026 shows almost complete root penetration, whereas CTC-027 shows a significant
decrease in penetration (circled in red) and was approximately 0.078 inches (2mm) in depth. This is
significant for manufacturing of thinner plate where melt-through would be a concern or for any
process that would deal with hardfacing or cladding. The hardfacing or cladding operation requires
minimum penetration into the base metal to minimize the dilution rate of the weld metal. In addition
to the change in penetration, there was also a slight increase in weld bead area and HAZ size. The
change in HAZ size validates the lower hardness readings for the HAZ in Figure 3-17.
36
Figure 3-18. Penetration profile for weldments CTC-026 and CTC-027.
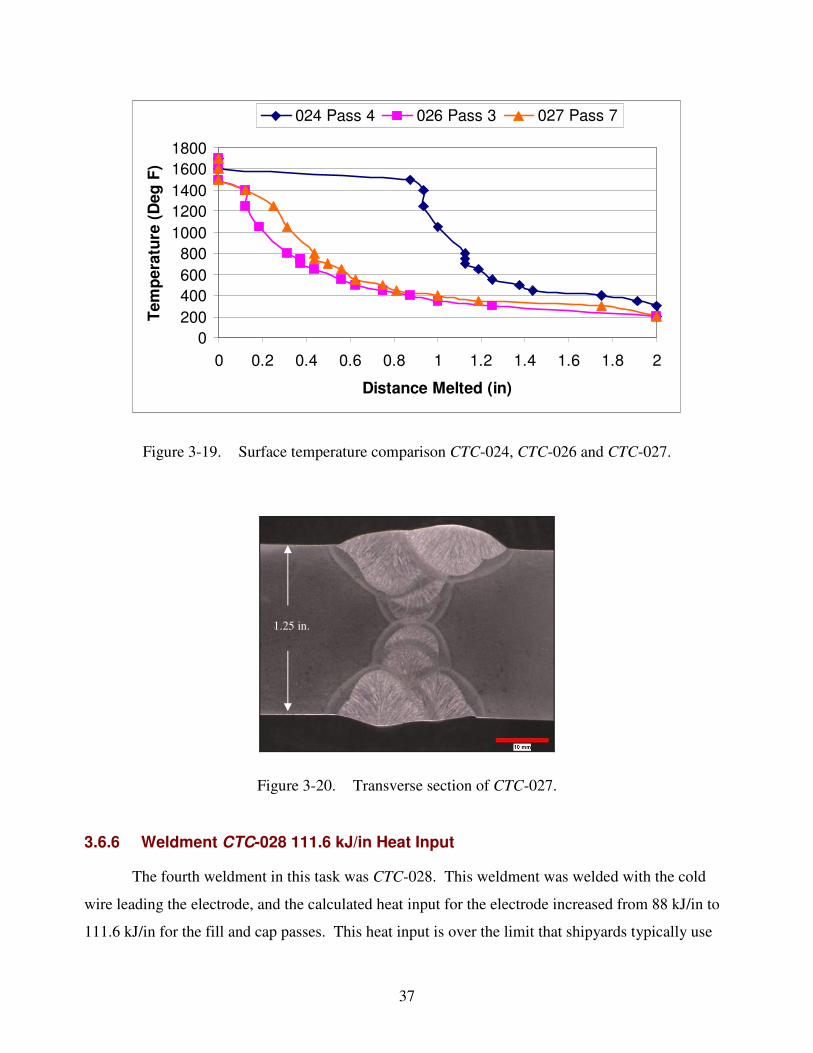
As with weldments CTC-024 and CTC-026, during the welding of the final cap pass for
CTC-027, heat paints were used to see the actual heat flowing into the base metal. Figure 3-19
shows the comparison between the single wire weldment CTC-024 and the cold wire weldments
CTC-026, and CTC-027. As can be seen, the temperature difference for both cold wire weldments
was significantly less when compared to the single wire weldment CTC-024 and again reinforces the
theory of the effective heat input. In addition, weldment CTC-027, with the cold wire lagging,
produced a slightly higher heat input into the weldment than CTC-026 with the cold wire leading.
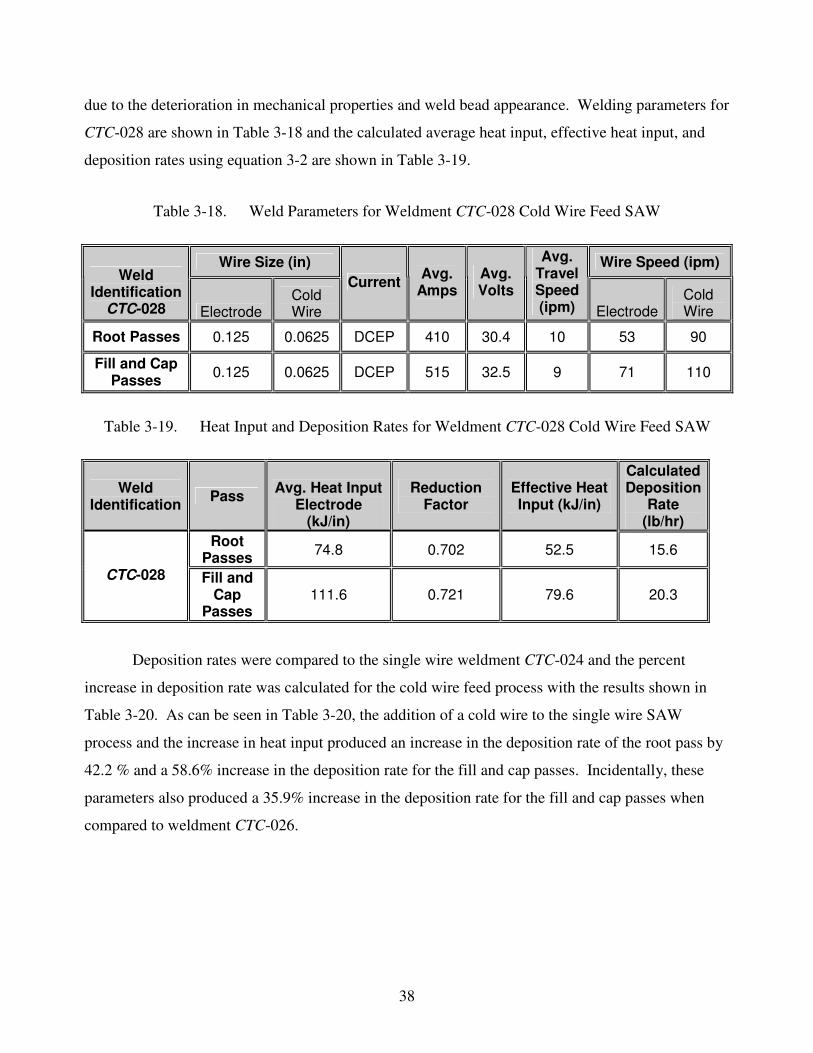
Thus the weld penetration would be greater with the cold wire lagging, as shown in Figure 3-18;
however, it was not observed in a transverse section of weldment CTC-027 in Figure 3-20.
�������������
� ������� ���
�������������
� ������� ���
Change in Penetration
37
0200400600800
10001200140016001800
0 0.2 0.4 0.6 0.8 1 1.2 1.4 1.6 1.8 2
Distance Melted (in)
Tem
pera
ture
(D
eg F
)
024 Pass 4 026 Pass 3 027 Pass 7
Figure 3-19. Surface temperature comparison CTC-024, CTC-026 and CTC-027.
Figure 3-20. Transverse section of CTC-027.
3.6.6 Weldment CTC-028 111.6 kJ/in Heat Input
The fourth weldment in this task was CTC-028. This weldment was welded with the cold
wire leading the electrode, and the calculated heat input for the electrode increased from 88 kJ/in to
111.6 kJ/in for the fill and cap passes. This heat input is over the limit that shipyards typically use
1.25 in.
38
due to the deterioration in mechanical properties and weld bead appearance. Welding parameters for
CTC-028 are shown in Table 3-18 and the calculated average heat input, effective heat input, and
deposition rates using equation 3-2 are shown in Table 3-19.
Table 3-18. Weld Parameters for Weldment CTC-028 Cold Wire Feed SAW
Wire Size (in) Wire Speed (ipm) Weld
Identification CTC-028 Electrode
Cold Wire
Current Avg. Amps
Avg. Volts
Avg. Travel Speed (ipm) Electrode
Cold Wire
Root Passes 0.125 0.0625 DCEP 410 30.4 10 53 90
Fill and Cap Passes 0.125 0.0625 DCEP 515 32.5 9 71 110
Table 3-19. Heat Input and Deposition Rates for Weldment CTC-028 Cold Wire Feed SAW
Weld Identification Pass Avg. Heat Input
Electrode (kJ/in)
Reduction Factor
Effective Heat Input (kJ/in)
Calculated Deposition
Rate (lb/hr)
Root Passes 74.8 0.702 52.5 15.6
CTC-028 Fill and Cap
Passes 111.6 0.721 79.6 20.3
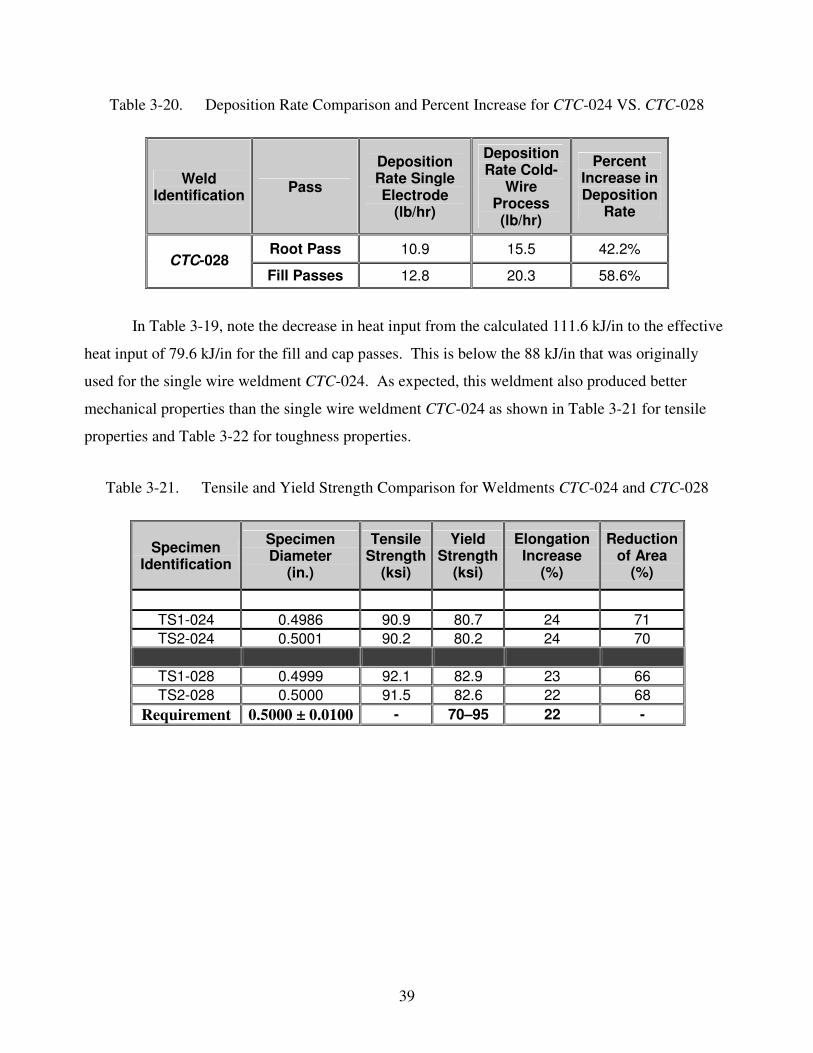
Deposition rates were compared to the single wire weldment CTC-024 and the percent
increase in deposition rate was calculated for the cold wire feed process with the results shown in
Table 3-20. As can be seen in Table 3-20, the addition of a cold wire to the single wire SAW
process and the increase in heat input produced an increase in the deposition rate of the root pass by
42.2 % and a 58.6% increase in the deposition rate for the fill and cap passes. Incidentally, these
parameters also produced a 35.9% increase in the deposition rate for the fill and cap passes when
compared to weldment CTC-026.
39
Table 3-20. Deposition Rate Comparison and Percent Increase for CTC-024 VS. CTC-028
Weld Identification Pass
Deposition Rate Single Electrode
(lb/hr)
Deposition Rate Cold-
Wire Process (lb/hr)
Percent Increase in Deposition
Rate
Root Pass 10.9 15.5 42.2% CTC-028
Fill Passes 12.8 20.3 58.6%
In Table 3-19, note the decrease in heat input from the calculated 111.6 kJ/in to the effective
heat input of 79.6 kJ/in for the fill and cap passes. This is below the 88 kJ/in that was originally
used for the single wire weldment CTC-024. As expected, this weldment also produced better
mechanical properties than the single wire weldment CTC-024 as shown in Table 3-21 for tensile
properties and Table 3-22 for toughness properties.
Table 3-21. Tensile and Yield Strength Comparison for Weldments CTC-024 and CTC-028
Specimen Identification
Specimen Diameter
(in.)
Tensile Strength
(ksi)
Yield Strength
(ksi)
Elongation Increase
(%)
Reduction of Area
(%)
TS1-024 0.4986 90.9 80.7 24 71 TS2-024 0.5001 90.2 80.2 24 70
TS1-028 0.4999 92.1 82.9 23 66 TS2-028 0.5000 91.5 82.6 22 68
Requirement 0.5000 ± 0.0100 - 70–95 22 -
40
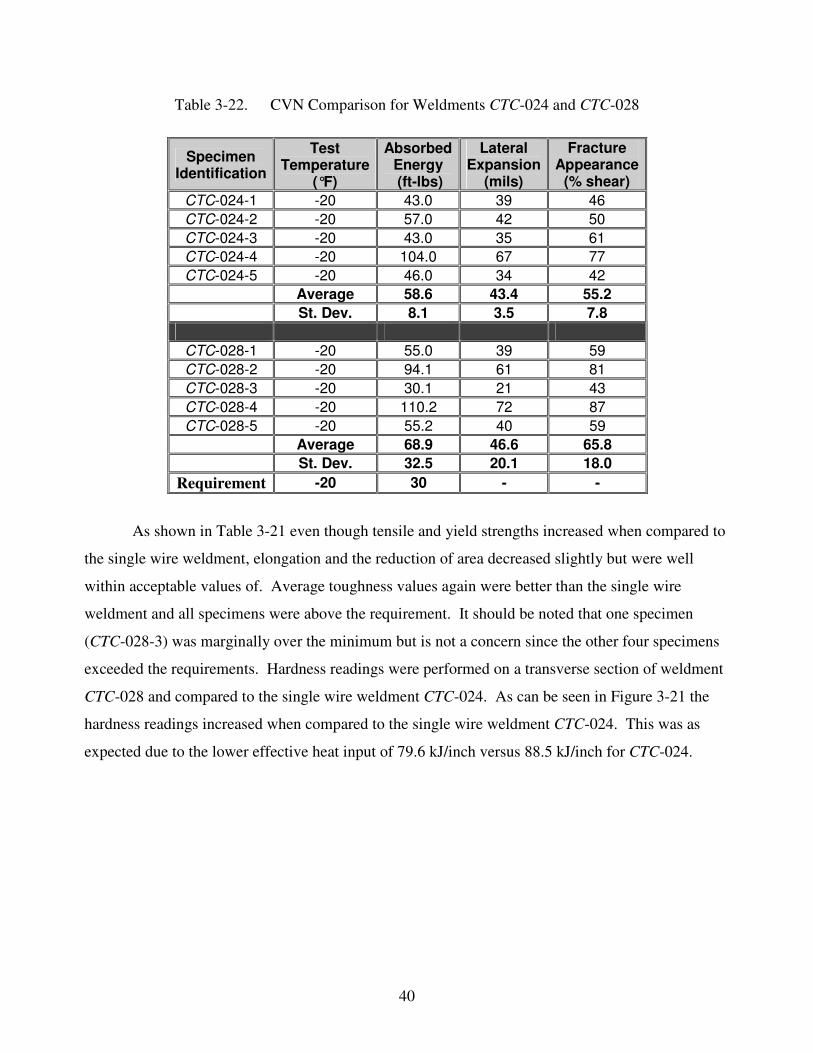
Table 3-22. CVN Comparison for Weldments CTC-024 and CTC-028
Specimen Identification
Test Temperature
(°F)
Absorbed Energy (ft-lbs)
Lateral Expansion
(mils)
Fracture Appearance
(% shear) CTC-024-1 -20 43.0 39 46 CTC-024-2 -20 57.0 42 50 CTC-024-3 -20 43.0 35 61 CTC-024-4 -20 104.0 67 77 CTC-024-5 -20 46.0 34 42
Average 58.6 43.4 55.2 St. Dev. 8.1 3.5 7.8
CTC-028-1 -20 55.0 39 59 CTC-028-2 -20 94.1 61 81 CTC-028-3 -20 30.1 21 43 CTC-028-4 -20 110.2 72 87 CTC-028-5 -20 55.2 40 59
Average 68.9 46.6 65.8 St. Dev. 32.5 20.1 18.0
Requirement -20 30 - -
As shown in Table 3-21 even though tensile and yield strengths increased when compared to
the single wire weldment, elongation and the reduction of area decreased slightly but were well
within acceptable values of. Average toughness values again were better than the single wire
weldment and all specimens were above the requirement. It should be noted that one specimen
(CTC-028-3) was marginally over the minimum but is not a concern since the other four specimens
exceeded the requirements. Hardness readings were performed on a transverse section of weldment
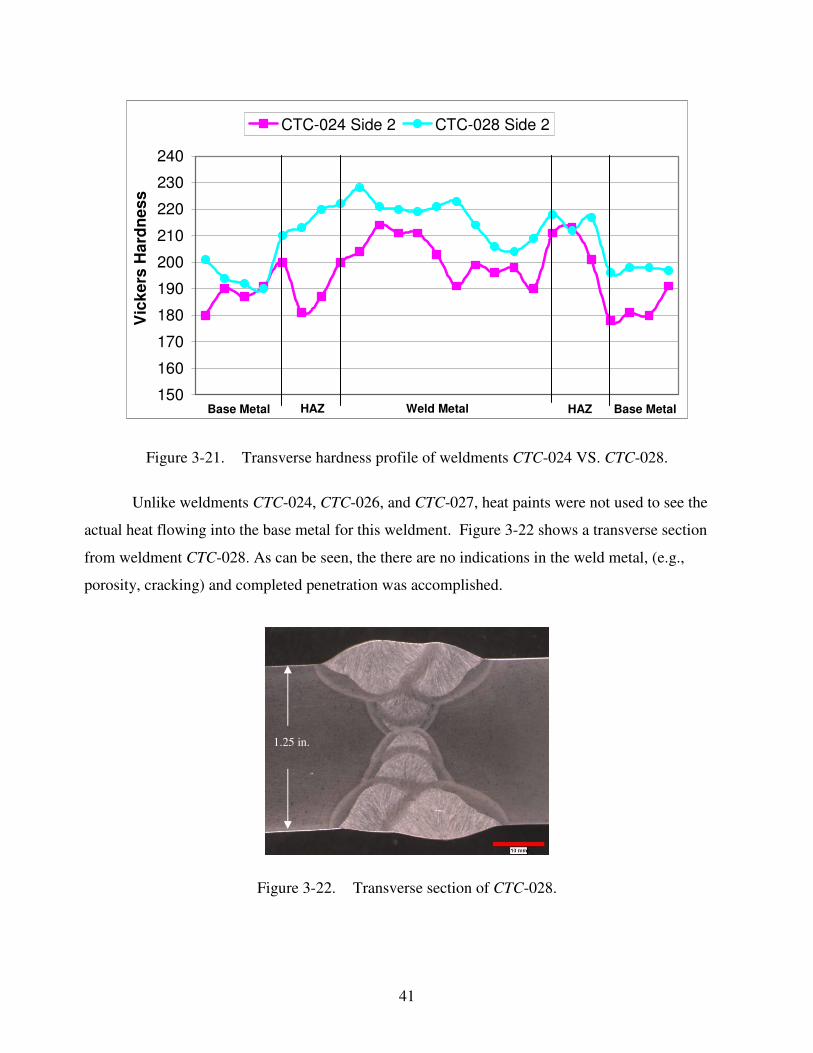
CTC-028 and compared to the single wire weldment CTC-024. As can be seen in Figure 3-21 the
hardness readings increased when compared to the single wire weldment CTC-024. This was as
expected due to the lower effective heat input of 79.6 kJ/inch versus 88.5 kJ/inch for CTC-024.
41
150
160
170
180
190
200
210
220
230
240V
icke
rs H
ardn
ess
CTC-024 Side 2 CTC-028 Side 2
Base MetalHAZWeld MetalBase Metal HAZ
Figure 3-21. Transverse hardness profile of weldments CTC-024 VS. CTC-028.
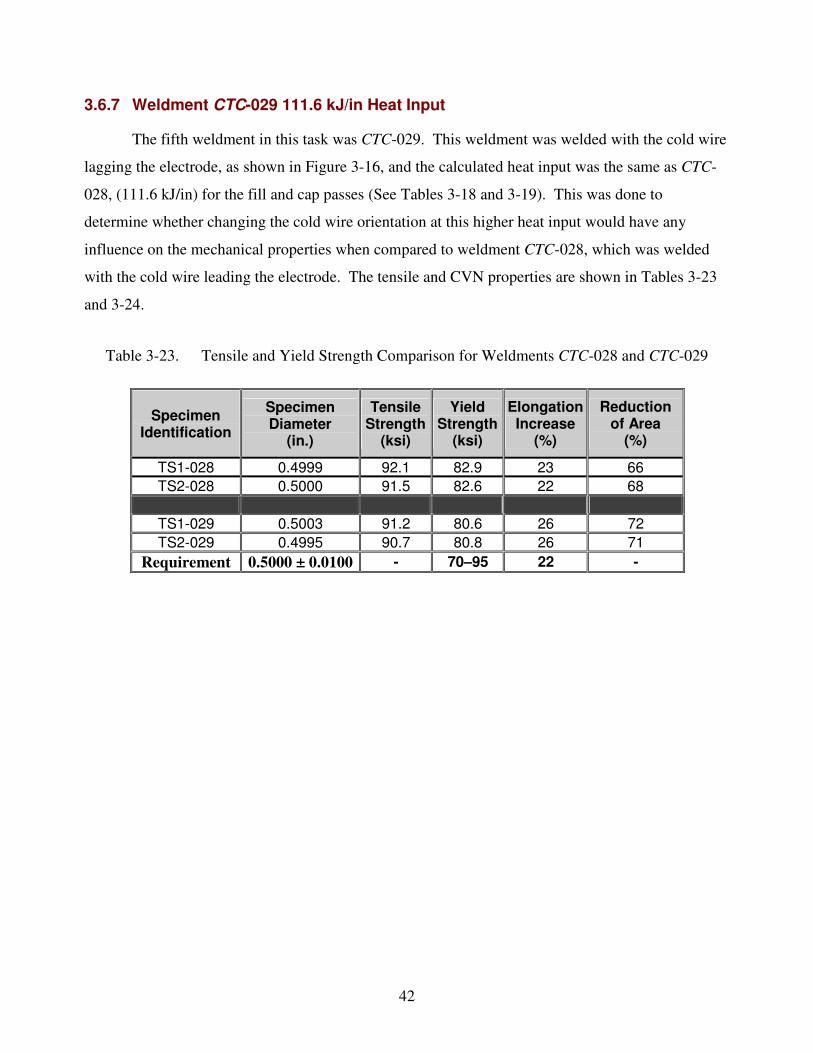
Unlike weldments CTC-024, CTC-026, and CTC-027, heat paints were not used to see the
actual heat flowing into the base metal for this weldment. Figure 3-22 shows a transverse section
from weldment CTC-028. As can be seen, the there are no indications in the weld metal, (e.g.,
porosity, cracking) and completed penetration was accomplished.
Figure 3-22. Transverse section of CTC-028.
1.25 in.
42
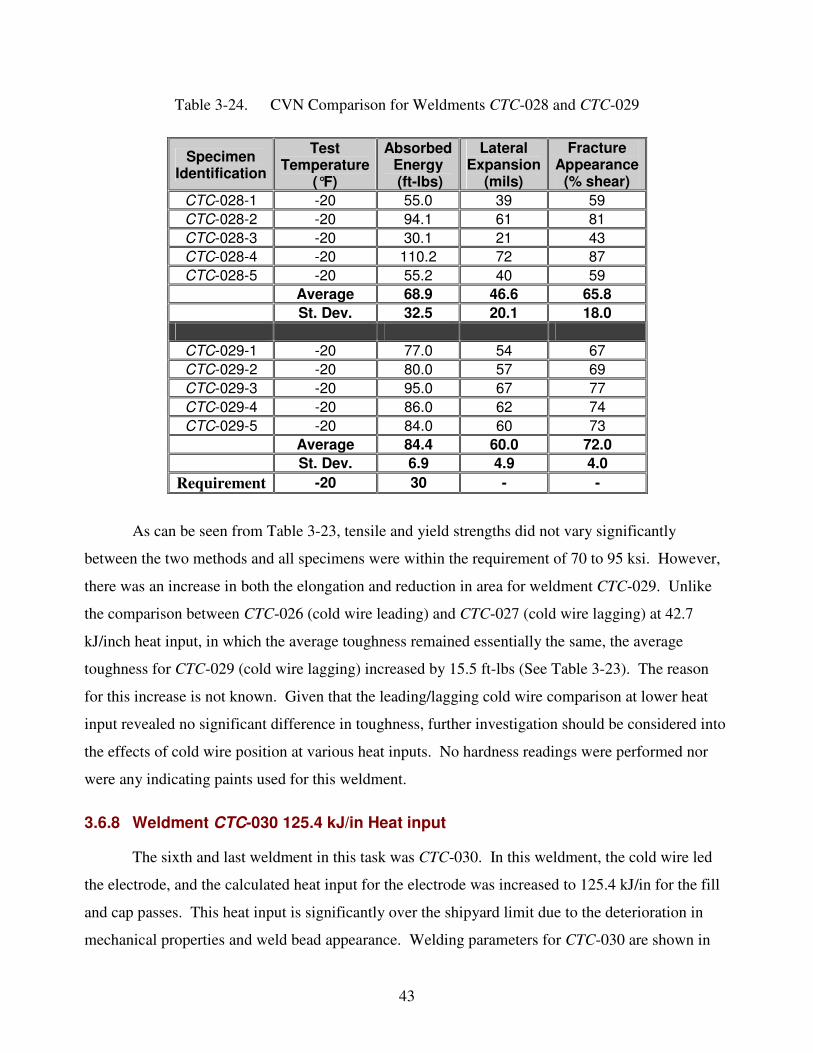
3.6.7 Weldment CTC-029 111.6 kJ/in Heat Input
The fifth weldment in this task was CTC-029. This weldment was welded with the cold wire
lagging the electrode, as shown in Figure 3-16, and the calculated heat input was the same as CTC-
028, (111.6 kJ/in) for the fill and cap passes (See Tables 3-18 and 3-19). This was done to
determine whether changing the cold wire orientation at this higher heat input would have any
influence on the mechanical properties when compared to weldment CTC-028, which was welded
with the cold wire leading the electrode. The tensile and CVN properties are shown in Tables 3-23
and 3-24.
Table 3-23. Tensile and Yield Strength Comparison for Weldments CTC-028 and CTC-029
Specimen Identification
Specimen Diameter
(in.)
Tensile Strength
(ksi)
Yield Strength
(ksi)
Elongation Increase
(%)
Reduction of Area
(%)
TS1-028 0.4999 92.1 82.9 23 66 TS2-028 0.5000 91.5 82.6 22 68
TS1-029 0.5003 91.2 80.6 26 72 TS2-029 0.4995 90.7 80.8 26 71
Requirement 0.5000 ± 0.0100 - 70–95 22 -
43
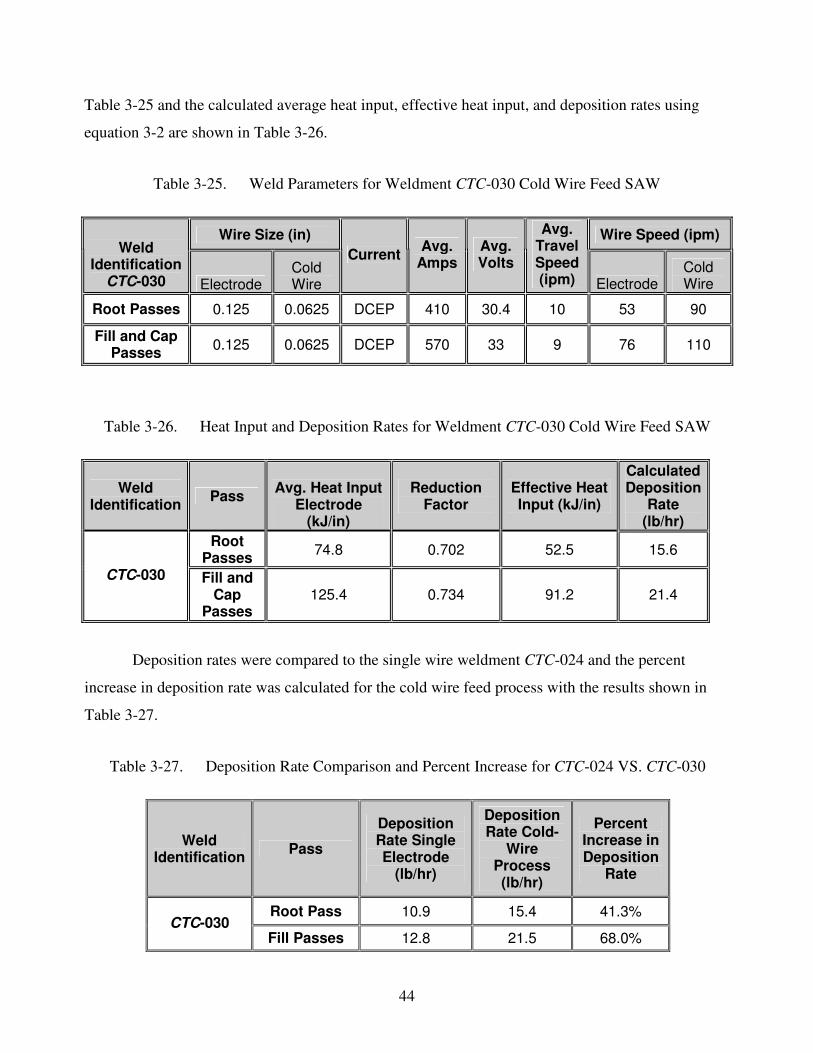
Table 3-24. CVN Comparison for Weldments CTC-028 and CTC-029
Specimen Identification
Test Temperature
(°F)
Absorbed Energy (ft-lbs)
Lateral Expansion
(mils)
Fracture Appearance
(% shear) CTC-028-1 -20 55.0 39 59 CTC-028-2 -20 94.1 61 81 CTC-028-3 -20 30.1 21 43 CTC-028-4 -20 110.2 72 87 CTC-028-5 -20 55.2 40 59
Average 68.9 46.6 65.8 St. Dev. 32.5 20.1 18.0
CTC-029-1 -20 77.0 54 67 CTC-029-2 -20 80.0 57 69 CTC-029-3 -20 95.0 67 77 CTC-029-4 -20 86.0 62 74 CTC-029-5 -20 84.0 60 73
Average 84.4 60.0 72.0 St. Dev. 6.9 4.9 4.0
Requirement -20 30 - -
As can be seen from Table 3-23, tensile and yield strengths did not vary significantly
between the two methods and all specimens were within the requirement of 70 to 95 ksi. However,
there was an increase in both the elongation and reduction in area for weldment CTC-029. Unlike
the comparison between CTC-026 (cold wire leading) and CTC-027 (cold wire lagging) at 42.7
kJ/inch heat input, in which the average toughness remained essentially the same, the average
toughness for CTC-029 (cold wire lagging) increased by 15.5 ft-lbs (See Table 3-23). The reason
for this increase is not known. Given that the leading/lagging cold wire comparison at lower heat
input revealed no significant difference in toughness, further investigation should be considered into
the effects of cold wire position at various heat inputs. No hardness readings were performed nor
were any indicating paints used for this weldment.
3.6.8 Weldment CTC-030 125.4 kJ/in Heat input
The sixth and last weldment in this task was CTC-030. In this weldment, the cold wire led
the electrode, and the calculated heat input for the electrode was increased to 125.4 kJ/in for the fill
and cap passes. This heat input is significantly over the shipyard limit due to the deterioration in
mechanical properties and weld bead appearance. Welding parameters for CTC-030 are shown in
44
Table 3-25 and the calculated average heat input, effective heat input, and deposition rates using
equation 3-2 are shown in Table 3-26.
Table 3-25. Weld Parameters for Weldment CTC-030 Cold Wire Feed SAW
Wire Size (in) Wire Speed (ipm) Weld
Identification CTC-030 Electrode
Cold Wire
Current Avg. Amps
Avg. Volts
Avg. Travel Speed (ipm) Electrode
Cold Wire
Root Passes 0.125 0.0625 DCEP 410 30.4 10 53 90
Fill and Cap Passes 0.125 0.0625 DCEP 570 33 9 76 110
Table 3-26. Heat Input and Deposition Rates for Weldment CTC-030 Cold Wire Feed SAW
Weld Identification Pass Avg. Heat Input
Electrode (kJ/in)
Reduction Factor
Effective Heat Input (kJ/in)
Calculated Deposition
Rate (lb/hr)
Root Passes 74.8 0.702 52.5 15.6
CTC-030 Fill and Cap
Passes 125.4 0.734 91.2 21.4
Deposition rates were compared to the single wire weldment CTC-024 and the percent
increase in deposition rate was calculated for the cold wire feed process with the results shown in
Table 3-27.
Table 3-27. Deposition Rate Comparison and Percent Increase for CTC-024 VS. CTC-030
Weld Identification Pass
Deposition Rate Single Electrode
(lb/hr)
Deposition Rate Cold-
Wire Process (lb/hr)
Percent Increase in Deposition
Rate
Root Pass 10.9 15.4 41.3% CTC-030
Fill Passes 12.8 21.5 68.0%
45
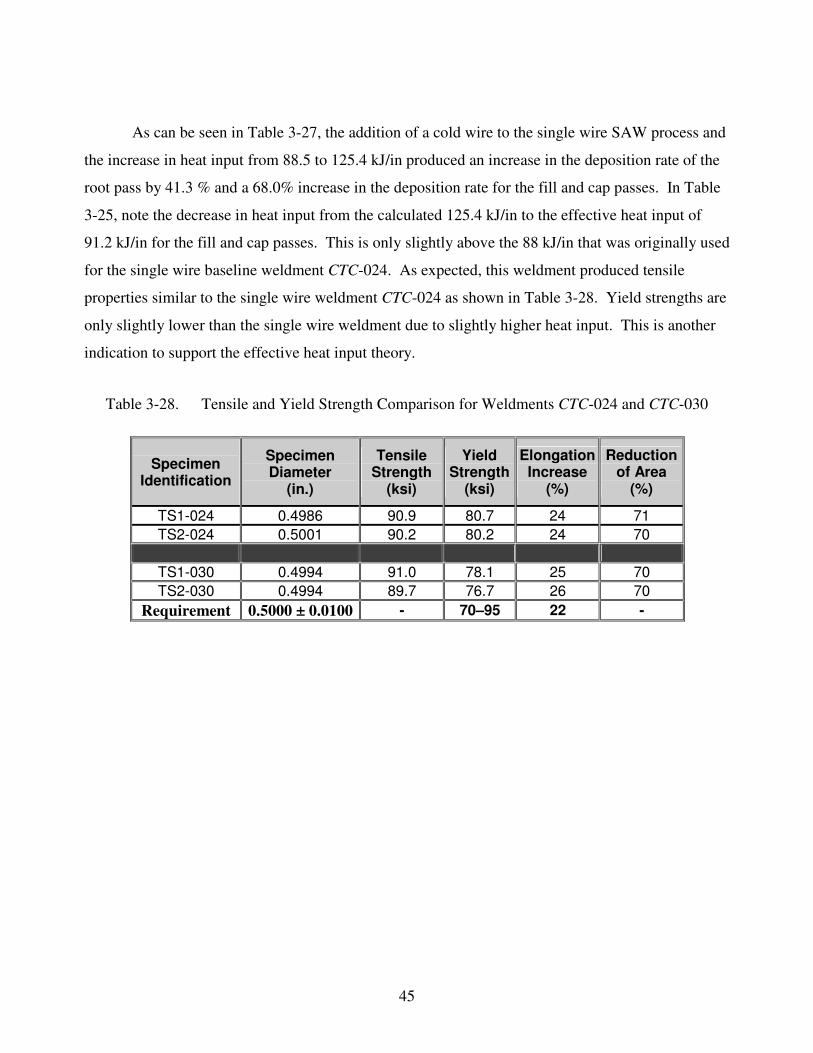
As can be seen in Table 3-27, the addition of a cold wire to the single wire SAW process and
the increase in heat input from 88.5 to 125.4 kJ/in produced an increase in the deposition rate of the
root pass by 41.3 % and a 68.0% increase in the deposition rate for the fill and cap passes. In Table
3-25, note the decrease in heat input from the calculated 125.4 kJ/in to the effective heat input of
91.2 kJ/in for the fill and cap passes. This is only slightly above the 88 kJ/in that was originally used
for the single wire baseline weldment CTC-024. As expected, this weldment produced tensile
properties similar to the single wire weldment CTC-024 as shown in Table 3-28. Yield strengths are
only slightly lower than the single wire weldment due to slightly higher heat input. This is another
indication to support the effective heat input theory.
Table 3-28. Tensile and Yield Strength Comparison for Weldments CTC-024 and CTC-030
Specimen Identification
Specimen Diameter
(in.)
Tensile Strength
(ksi)
Yield Strength
(ksi)
Elongation Increase
(%)
Reduction of Area
(%)
TS1-024 0.4986 90.9 80.7 24 71 TS2-024 0.5001 90.2 80.2 24 70
TS1-030 0.4994 91.0 78.1 25 70 TS2-030 0.4994 89.7 76.7 26 70
Requirement 0.5000 ± 0.0100 - 70–95 22 -
46
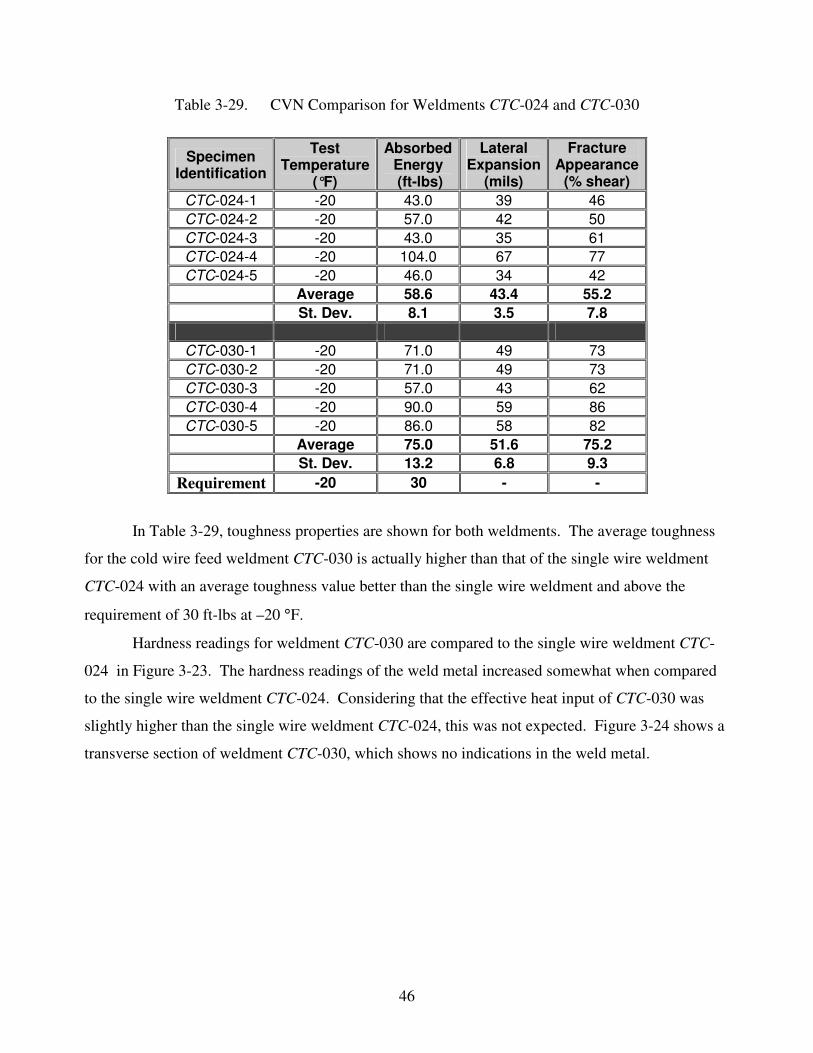
Table 3-29. CVN Comparison for Weldments CTC-024 and CTC-030
Specimen Identification
Test Temperature
(°F)
Absorbed Energy (ft-lbs)
Lateral Expansion
(mils)
Fracture Appearance
(% shear) CTC-024-1 -20 43.0 39 46 CTC-024-2 -20 57.0 42 50 CTC-024-3 -20 43.0 35 61 CTC-024-4 -20 104.0 67 77 CTC-024-5 -20 46.0 34 42
Average 58.6 43.4 55.2 St. Dev. 8.1 3.5 7.8
CTC-030-1 -20 71.0 49 73 CTC-030-2 -20 71.0 49 73 CTC-030-3 -20 57.0 43 62 CTC-030-4 -20 90.0 59 86 CTC-030-5 -20 86.0 58 82
Average 75.0 51.6 75.2 St. Dev. 13.2 6.8 9.3
Requirement -20 30 - -
In Table 3-29, toughness properties are shown for both weldments. The average toughness
for the cold wire feed weldment CTC-030 is actually higher than that of the single wire weldment
CTC-024 with an average toughness value better than the single wire weldment and above the
requirement of 30 ft-lbs at –20 °F.
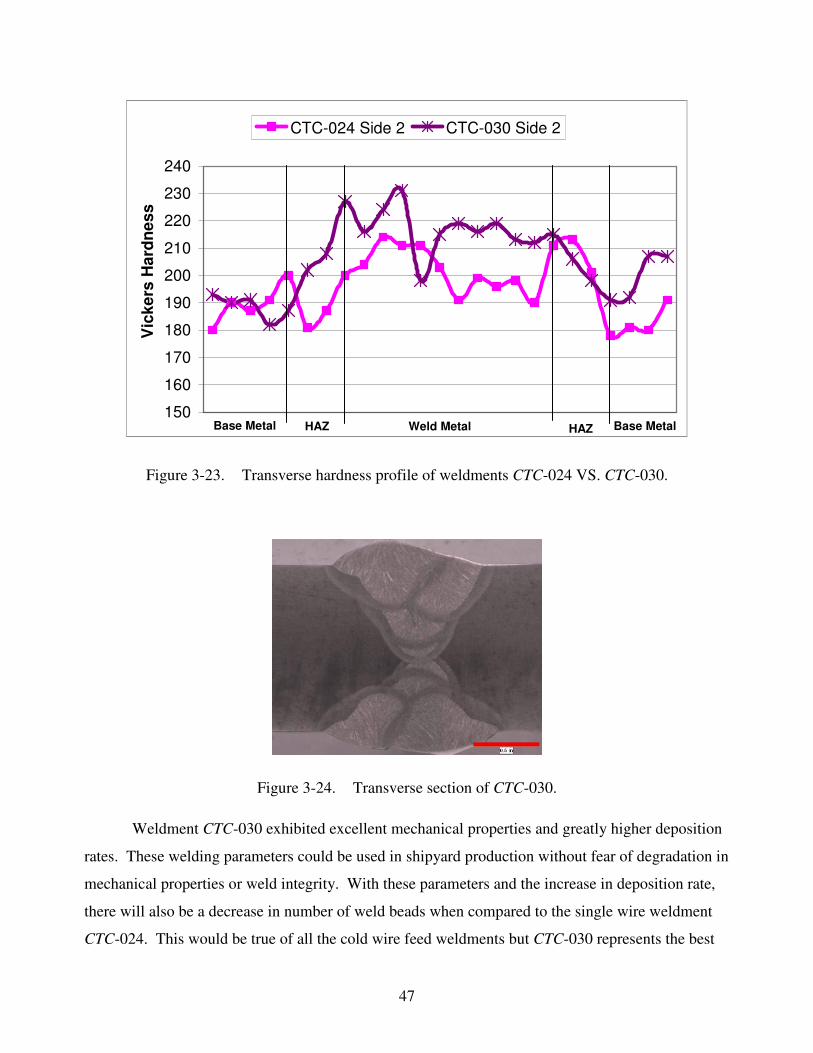
Hardness readings for weldment CTC-030 are compared to the single wire weldment CTC-
024 in Figure 3-23. The hardness readings of the weld metal increased somewhat when compared
to the single wire weldment CTC-024. Considering that the effective heat input of CTC-030 was
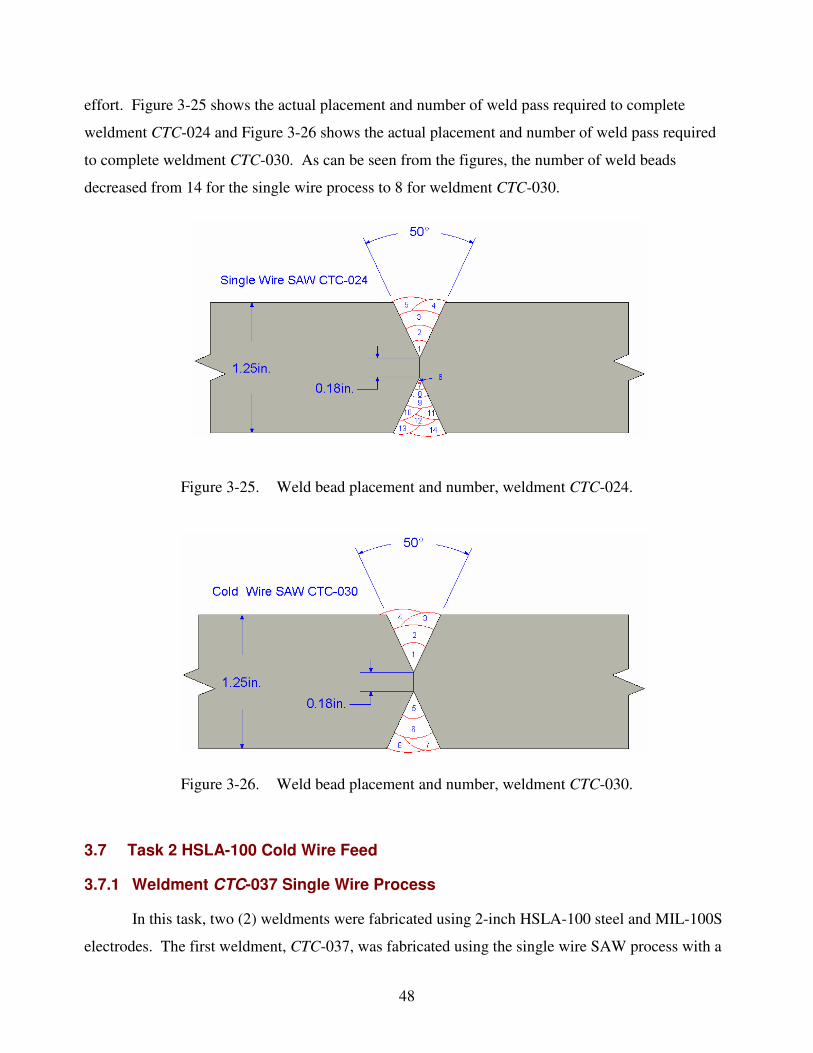
slightly higher than the single wire weldment CTC-024, this was not expected. Figure 3-24 shows a
transverse section of weldment CTC-030, which shows no indications in the weld metal.
47
150
160
170
180
190
200
210
220
230
240V
icke
rs H
ardn
ess
CTC-024 Side 2 CTC-030 Side 2
Base MetalHAZWeld MetalBase Metal HAZ
Figure 3-23. Transverse hardness profile of weldments CTC-024 VS. CTC-030.
Figure 3-24. Transverse section of CTC-030.
Weldment CTC-030 exhibited excellent mechanical properties and greatly higher deposition
rates. These welding parameters could be used in shipyard production without fear of degradation in
mechanical properties or weld integrity. With these parameters and the increase in deposition rate,
there will also be a decrease in number of weld beads when compared to the single wire weldment
CTC-024. This would be true of all the cold wire feed weldments but CTC-030 represents the best
48
effort. Figure 3-25 shows the actual placement and number of weld pass required to complete
weldment CTC-024 and Figure 3-26 shows the actual placement and number of weld pass required
to complete weldment CTC-030. As can be seen from the figures, the number of weld beads
decreased from 14 for the single wire process to 8 for weldment CTC-030.
Figure 3-25. Weld bead placement and number, weldment CTC-024.
Figure 3-26. Weld bead placement and number, weldment CTC-030.
3.7 Task 2 HSLA-100 Cold Wire Feed
3.7.1 Weldment CTC-037 Single Wire Process
In this task, two (2) weldments were fabricated using 2-inch HSLA-100 steel and MIL-100S
electrodes. The first weldment, CTC-037, was fabricated using the single wire SAW process with a
49
0.125-inch diameter electrode. All welding parameters are shown in Table 3-31. This weldment
was used as the benchmark for the last weldment fabricated using the cold wire process.
Table 3-31. Weld Parameters for Single Wire Benchmark Weldment CTC-037
Wire Size (in) Wire Speed (ipm) Pass
Electrode Cold Wire
Current Avg. Amps
Avg. Volts
Avg. Travel Speed (ipm) Electrode
Cold Wire
Root 0.125 0.0625 DCEP 420 31.1 10.5 57 N/A
Fill and Cap 0.125 0.0625 DCEP 415 31.1 9 57 N/A
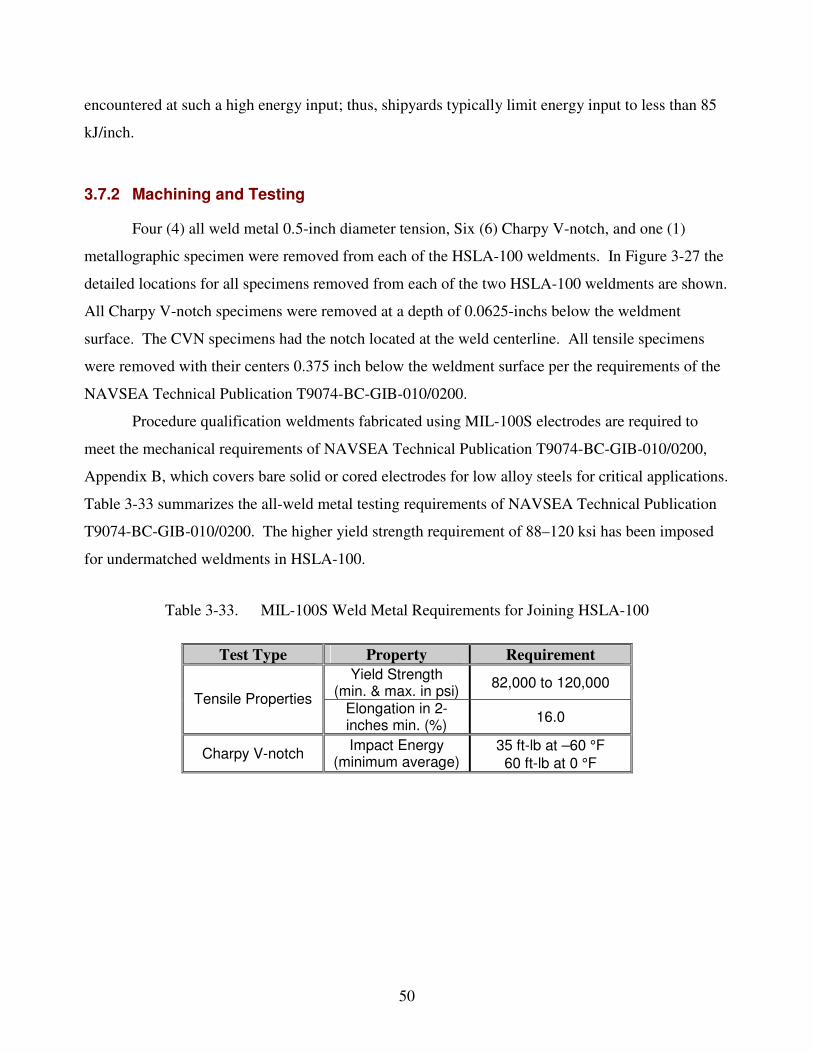
Table 3-32 shows the calculated average heat input for each pass and the deposition rates
using equation 3-1 for weldment CTC-037 with the parameters shown in Table 3-31. It should be
noted as with the HSLA-65 weldments, that the heat input calculation does not include the arc
efficiency factor for the SAW process.
Table 3-32. Heat Input and Deposition Rates for Weldment CTC-037 Cold Wire Feed SAW
Weld Identification Pass Avg. Heat Input
Electrode (kJ/in)
Reduction Factor
Effective Heat Input (kJ/in)
Calculated Deposition
Rate (lb/hr)
Root Passes 74.5 N/A N/A 11.8
CTC-037 Fill and Cap
Passes 86 N/A N/A 11.8
As can be seen from Table 3-32, the total heat input for the fill and cap passes were at the
maximum heat input used by shipyards for welding HSLA-100 steel (85 kJ/in +/- 5 kJ/in). The
fabrication documents for welding HSLA-100 normally permit energy input up to 55 kJ/inch, with
alternative heat inputs allowed upon NAVSEA approval. NAVSEA had approved SAW up to 110
kJ/inch and some shipyards had qualified procedures at that energy input. However, experience has
shown that marginal soundness, bead appearance and mechanical properties are typically
50
encountered at such a high energy input; thus, shipyards typically limit energy input to less than 85
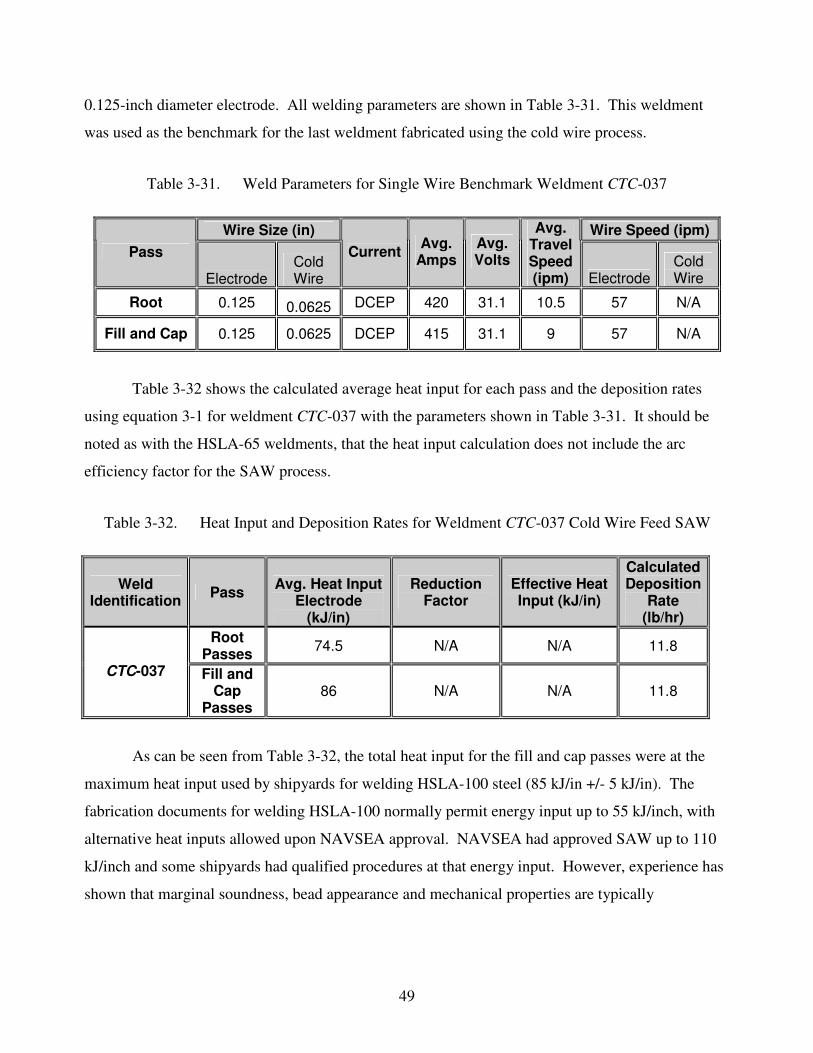
kJ/inch.
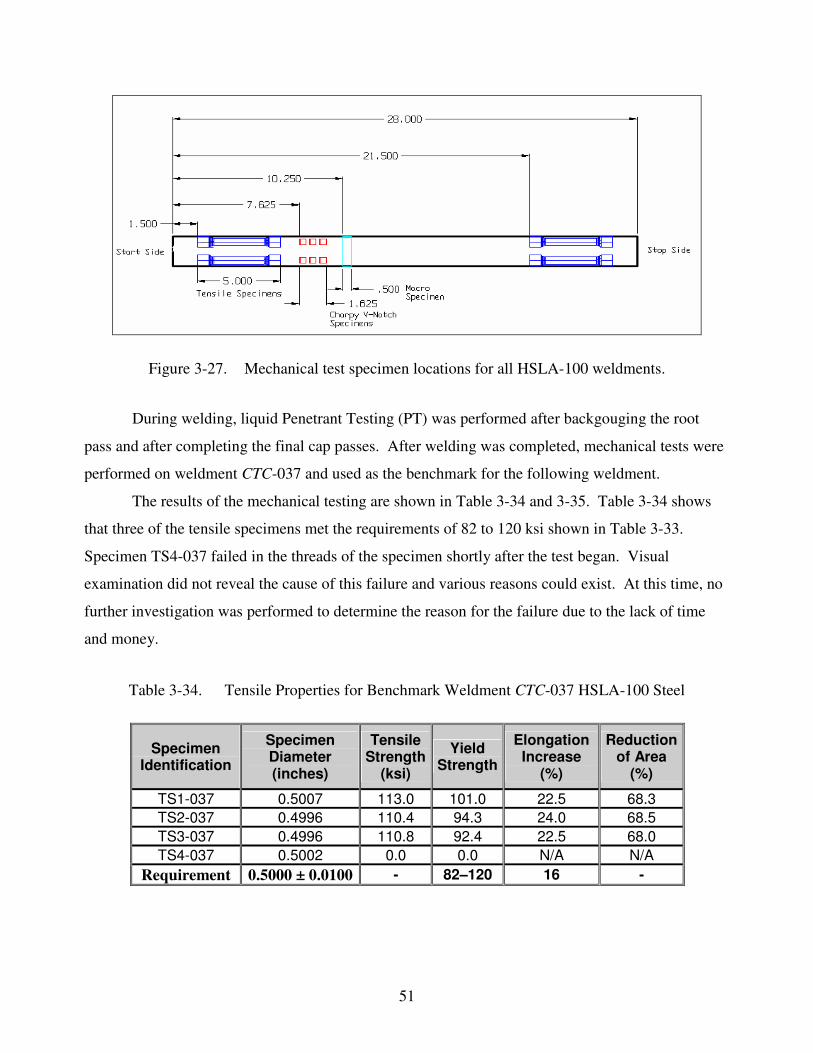
3.7.2 Machining and Testing
Four (4) all weld metal 0.5-inch diameter tension, Six (6) Charpy V-notch, and one (1)
metallographic specimen were removed from each of the HSLA-100 weldments. In Figure 3-27 the
detailed locations for all specimens removed from each of the two HSLA-100 weldments are shown.
All Charpy V-notch specimens were removed at a depth of 0.0625-inchs below the weldment
surface. The CVN specimens had the notch located at the weld centerline. All tensile specimens
were removed with their centers 0.375 inch below the weldment surface per the requirements of the
NAVSEA Technical Publication T9074-BC-GIB-010/0200.
Procedure qualification weldments fabricated using MIL-100S electrodes are required to
meet the mechanical requirements of NAVSEA Technical Publication T9074-BC-GIB-010/0200,
Appendix B, which covers bare solid or cored electrodes for low alloy steels for critical applications.
Table 3-33 summarizes the all-weld metal testing requirements of NAVSEA Technical Publication
T9074-BC-GIB-010/0200. The higher yield strength requirement of 88–120 ksi has been imposed
for undermatched weldments in HSLA-100.
Table 3-33. MIL-100S Weld Metal Requirements for Joining HSLA-100
Test Type Property Requirement Yield Strength
(min. & max. in psi) 82,000 to 120,000 Tensile Properties
Elongation in 2-inches min. (%) 16.0
Charpy V-notch Impact Energy (minimum average)
35 ft-lb at –60 °F 60 ft-lb at 0 °F
51
Figure 3-27. Mechanical test specimen locations for all HSLA-100 weldments.
During welding, liquid Penetrant Testing (PT) was performed after backgouging the root
pass and after completing the final cap passes. After welding was completed, mechanical tests were
performed on weldment CTC-037 and used as the benchmark for the following weldment.
The results of the mechanical testing are shown in Table 3-34 and 3-35. Table 3-34 shows
that three of the tensile specimens met the requirements of 82 to 120 ksi shown in Table 3-33.
Specimen TS4-037 failed in the threads of the specimen shortly after the test began. Visual
examination did not reveal the cause of this failure and various reasons could exist. At this time, no
further investigation was performed to determine the reason for the failure due to the lack of time
and money.
Table 3-34. Tensile Properties for Benchmark Weldment CTC-037 HSLA-100 Steel
Specimen Identification
Specimen Diameter (inches)
Tensile Strength
(ksi)
Yield Strength
Elongation Increase
(%)
Reduction of Area
(%)
TS1-037 0.5007 113.0 101.0 22.5 68.3 TS2-037 0.4996 110.4 94.3 24.0 68.5 TS3-037 0.4996 110.8 92.4 22.5 68.0 TS4-037 0.5002 0.0 0.0 N/A N/A
Requirement 0.5000 ± 0.0100 - 82–120 16 -
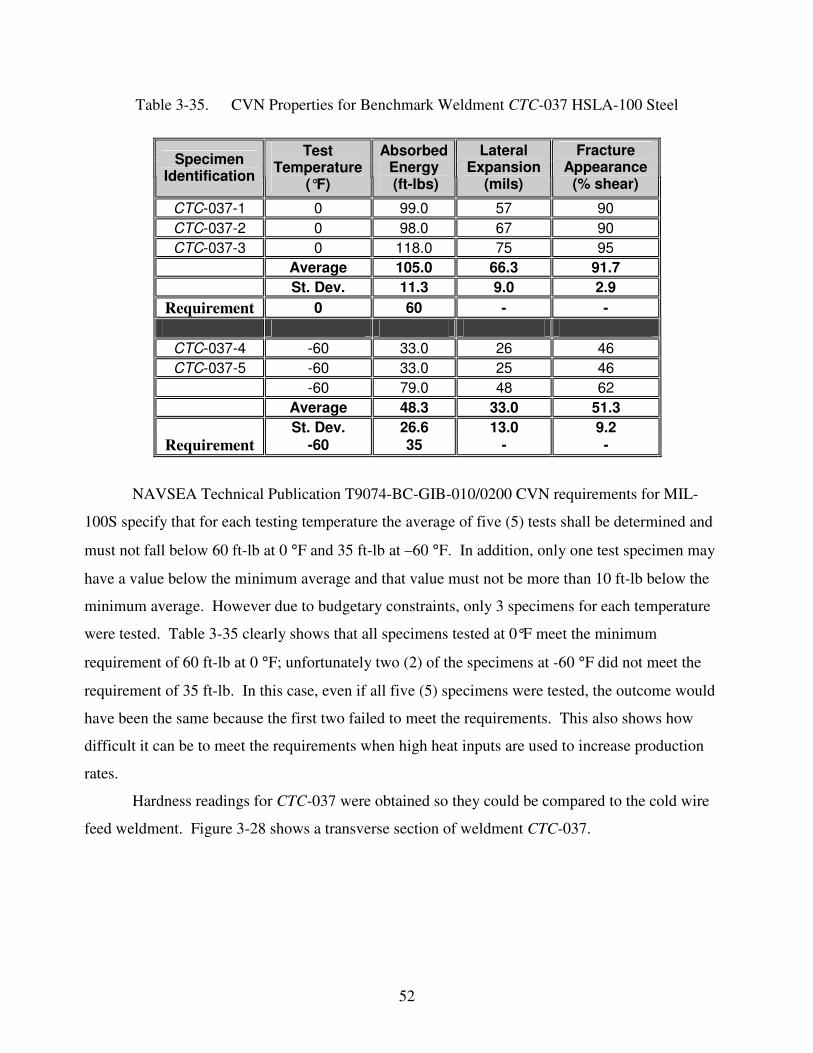
52
Table 3-35. CVN Properties for Benchmark Weldment CTC-037 HSLA-100 Steel
Specimen Identification
Test Temperature
(°F)
Absorbed Energy (ft-lbs)
Lateral Expansion
(mils)
Fracture Appearance
(% shear)
CTC-037-1 0 99.0 57 90 CTC-037-2 0 98.0 67 90 CTC-037-3 0 118.0 75 95
Average 105.0 66.3 91.7 St. Dev. 11.3 9.0 2.9
Requirement 0 60 - -
CTC-037-4 -60 33.0 26 46 CTC-037-5 -60 33.0 25 46
-60 79.0 48 62 Average 48.3 33.0 51.3 St. Dev. 26.6 13.0 9.2
Requirement -60 35 - -
NAVSEA Technical Publication T9074-BC-GIB-010/0200 CVN requirements for MIL-
100S specify that for each testing temperature the average of five (5) tests shall be determined and
must not fall below 60 ft-lb at 0 °F and 35 ft-lb at –60 °F. In addition, only one test specimen may
have a value below the minimum average and that value must not be more than 10 ft-lb below the
minimum average. However due to budgetary constraints, only 3 specimens for each temperature
were tested. Table 3-35 clearly shows that all specimens tested at 0°F meet the minimum
requirement of 60 ft-lb at 0 °F; unfortunately two (2) of the specimens at -60 °F did not meet the
requirement of 35 ft-lb. In this case, even if all five (5) specimens were tested, the outcome would
have been the same because the first two failed to meet the requirements. This also shows how
difficult it can be to meet the requirements when high heat inputs are used to increase production
rates.
Hardness readings for CTC-037 were obtained so they could be compared to the cold wire
feed weldment. Figure 3-28 shows a transverse section of weldment CTC-037.
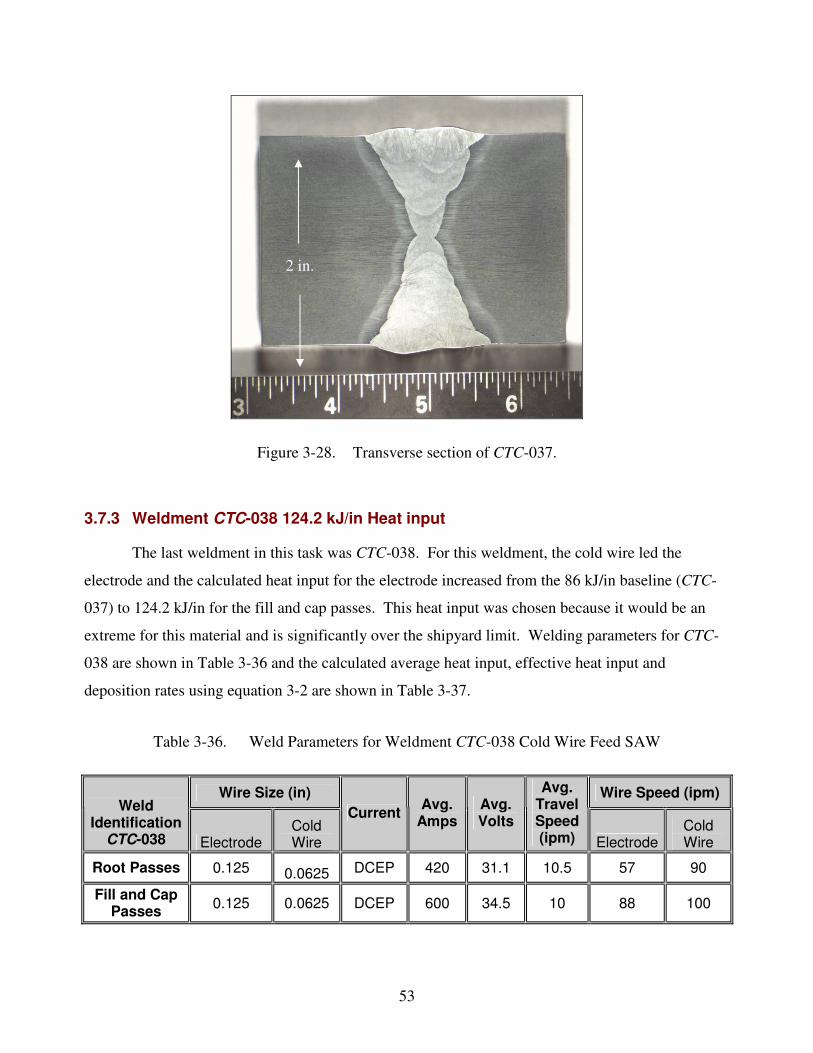
53
Figure 3-28. Transverse section of CTC-037.
3.7.3 Weldment CTC-038 124.2 kJ/in Heat input
The last weldment in this task was CTC-038. For this weldment, the cold wire led the
electrode and the calculated heat input for the electrode increased from the 86 kJ/in baseline (CTC-
037) to 124.2 kJ/in for the fill and cap passes. This heat input was chosen because it would be an
extreme for this material and is significantly over the shipyard limit. Welding parameters for CTC-
038 are shown in Table 3-36 and the calculated average heat input, effective heat input and
deposition rates using equation 3-2 are shown in Table 3-37.
Table 3-36. Weld Parameters for Weldment CTC-038 Cold Wire Feed SAW
Wire Size (in) Wire Speed (ipm) Weld
Identification CTC-038 Electrode
Cold Wire
Current Avg. Amps
Avg. Volts
Avg. Travel Speed (ipm) Electrode
Cold Wire
Root Passes 0.125 0.0625 DCEP 420 31.1 10.5 57 90
Fill and Cap Passes 0.125 0.0625 DCEP 600 34.5 10 88 100
2 in.
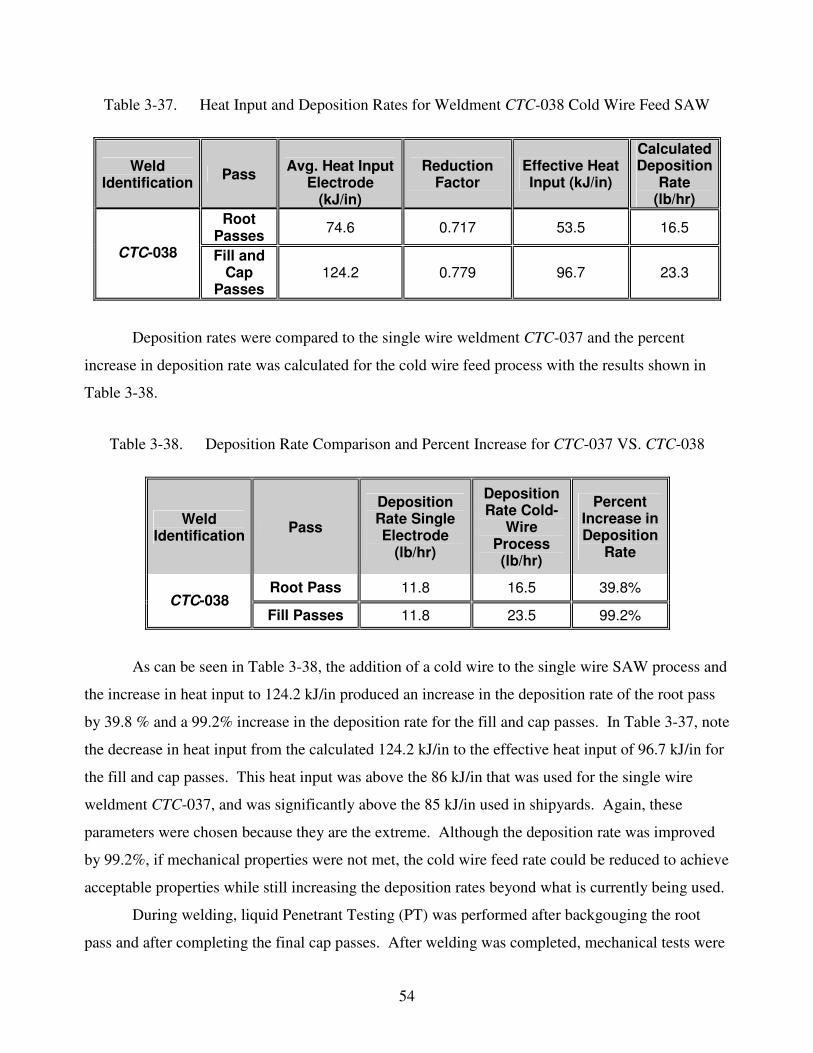
54
Table 3-37. Heat Input and Deposition Rates for Weldment CTC-038 Cold Wire Feed SAW
Weld Identification Pass Avg. Heat Input
Electrode (kJ/in)
Reduction Factor
Effective Heat Input (kJ/in)
Calculated Deposition
Rate (lb/hr)
Root Passes 74.6 0.717 53.5 16.5
CTC-038 Fill and Cap
Passes 124.2 0.779 96.7 23.3
Deposition rates were compared to the single wire weldment CTC-037 and the percent
increase in deposition rate was calculated for the cold wire feed process with the results shown in
Table 3-38.
Table 3-38. Deposition Rate Comparison and Percent Increase for CTC-037 VS. CTC-038
Weld Identification Pass
Deposition Rate Single Electrode
(lb/hr)
Deposition Rate Cold-
Wire Process (lb/hr)
Percent Increase in Deposition
Rate
Root Pass 11.8 16.5 39.8% CTC-038
Fill Passes 11.8 23.5 99.2%
As can be seen in Table 3-38, the addition of a cold wire to the single wire SAW process and
the increase in heat input to 124.2 kJ/in produced an increase in the deposition rate of the root pass
by 39.8 % and a 99.2% increase in the deposition rate for the fill and cap passes. In Table 3-37, note
the decrease in heat input from the calculated 124.2 kJ/in to the effective heat input of 96.7 kJ/in for
the fill and cap passes. This heat input was above the 86 kJ/in that was used for the single wire
weldment CTC-037, and was significantly above the 85 kJ/in used in shipyards. Again, these
parameters were chosen because they are the extreme. Although the deposition rate was improved
by 99.2%, if mechanical properties were not met, the cold wire feed rate could be reduced to achieve
acceptable properties while still increasing the deposition rates beyond what is currently being used.
During welding, liquid Penetrant Testing (PT) was performed after backgouging the root
pass and after completing the final cap passes. After welding was completed, mechanical tests were
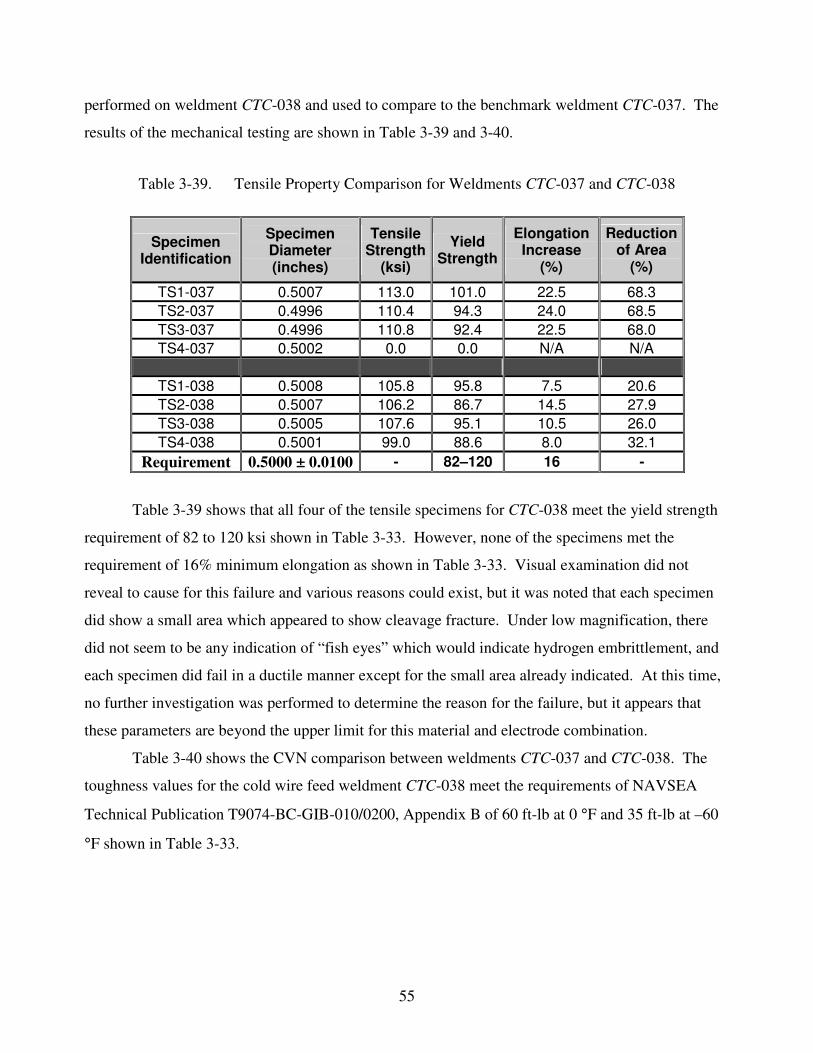
55
performed on weldment CTC-038 and used to compare to the benchmark weldment CTC-037. The
results of the mechanical testing are shown in Table 3-39 and 3-40.
Table 3-39. Tensile Property Comparison for Weldments CTC-037 and CTC-038
Specimen Identification
Specimen Diameter (inches)
Tensile Strength
(ksi)
Yield Strength
Elongation Increase
(%)
Reduction of Area
(%)
TS1-037 0.5007 113.0 101.0 22.5 68.3 TS2-037 0.4996 110.4 94.3 24.0 68.5 TS3-037 0.4996 110.8 92.4 22.5 68.0 TS4-037 0.5002 0.0 0.0 N/A N/A
TS1-038 0.5008 105.8 95.8 7.5 20.6 TS2-038 0.5007 106.2 86.7 14.5 27.9 TS3-038 0.5005 107.6 95.1 10.5 26.0 TS4-038 0.5001 99.0 88.6 8.0 32.1
Requirement 0.5000 ± 0.0100 - 82–120 16 -
Table 3-39 shows that all four of the tensile specimens for CTC-038 meet the yield strength
requirement of 82 to 120 ksi shown in Table 3-33. However, none of the specimens met the
requirement of 16% minimum elongation as shown in Table 3-33. Visual examination did not
reveal to cause for this failure and various reasons could exist, but it was noted that each specimen
did show a small area which appeared to show cleavage fracture. Under low magnification, there
did not seem to be any indication of “fish eyes” which would indicate hydrogen embrittlement, and
each specimen did fail in a ductile manner except for the small area already indicated. At this time,
no further investigation was performed to determine the reason for the failure, but it appears that
these parameters are beyond the upper limit for this material and electrode combination.
Table 3-40 shows the CVN comparison between weldments CTC-037 and CTC-038. The
toughness values for the cold wire feed weldment CTC-038 meet the requirements of NAVSEA
Technical Publication T9074-BC-GIB-010/0200, Appendix B of 60 ft-lb at 0 °F and 35 ft-lb at –60
°F shown in Table 3-33.
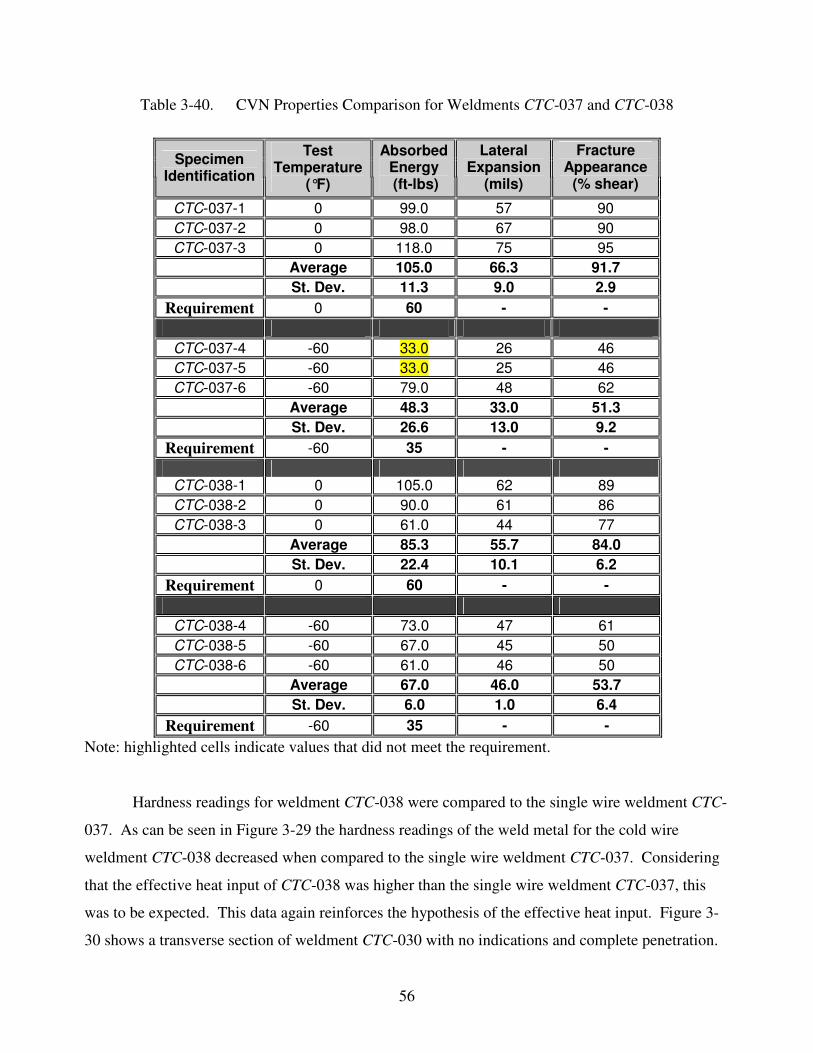
56
Table 3-40. CVN Properties Comparison for Weldments CTC-037 and CTC-038
Specimen Identification
Test Temperature
(°F)
Absorbed Energy (ft-lbs)
Lateral Expansion
(mils)
Fracture Appearance
(% shear)
CTC-037-1 0 99.0 57 90 CTC-037-2 0 98.0 67 90 CTC-037-3 0 118.0 75 95
Average 105.0 66.3 91.7 St. Dev. 11.3 9.0 2.9
Requirement 0 60 - -
CTC-037-4 -60 33.0 26 46 CTC-037-5 -60 33.0 25 46 CTC-037-6 -60 79.0 48 62
Average 48.3 33.0 51.3 St. Dev. 26.6 13.0 9.2
Requirement -60 35 - -
CTC-038-1 0 105.0 62 89 CTC-038-2 0 90.0 61 86 CTC-038-3 0 61.0 44 77
Average 85.3 55.7 84.0 St. Dev. 22.4 10.1 6.2
Requirement 0 60 - -
CTC-038-4 -60 73.0 47 61 CTC-038-5 -60 67.0 45 50 CTC-038-6 -60 61.0 46 50
Average 67.0 46.0 53.7 St. Dev. 6.0 1.0 6.4
Requirement -60 35 - - Note: highlighted cells indicate values that did not meet the requirement.
Hardness readings for weldment CTC-038 were compared to the single wire weldment CTC-
037. As can be seen in Figure 3-29 the hardness readings of the weld metal for the cold wire
weldment CTC-038 decreased when compared to the single wire weldment CTC-037. Considering
that the effective heat input of CTC-038 was higher than the single wire weldment CTC-037, this
was to be expected. This data again reinforces the hypothesis of the effective heat input. Figure 3-
30 shows a transverse section of weldment CTC-030 with no indications and complete penetration.
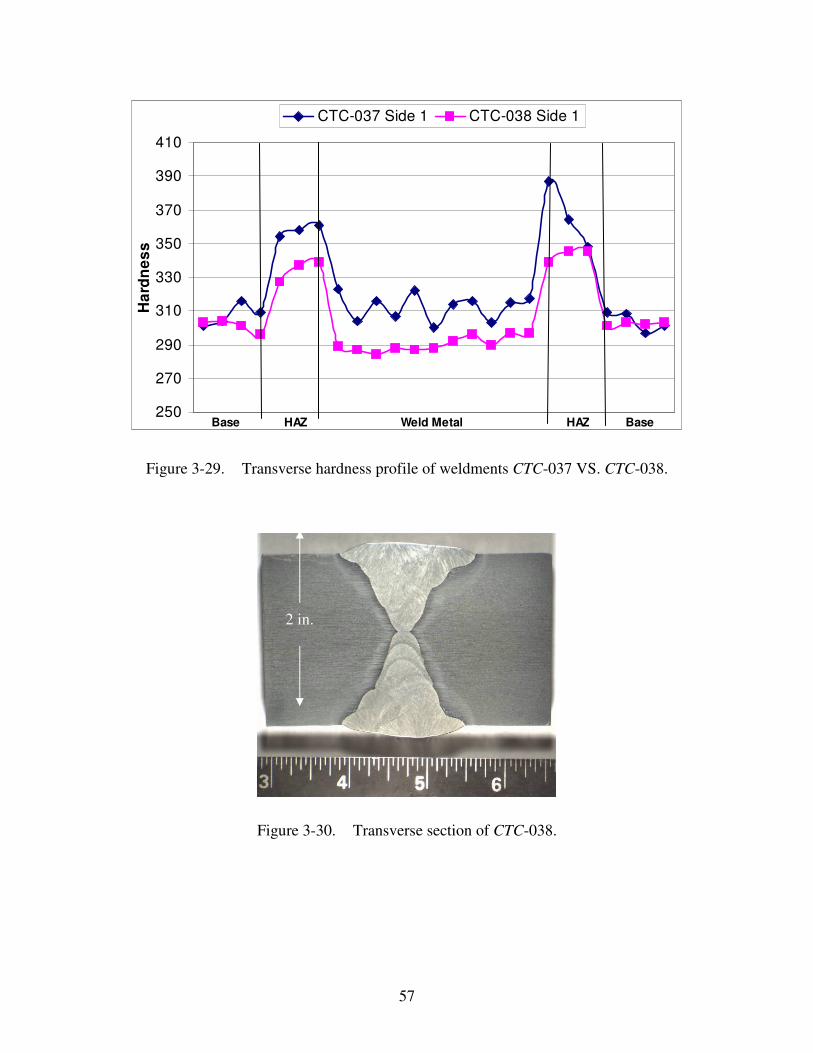
57
250
270
290
310
330
350
370
390
410H
ardn
ess
CTC-037 Side 1 CTC-038 Side 1
Base Base HAZ HAZWeld Metal
Figure 3-29. Transverse hardness profile of weldments CTC-037 VS. CTC-038.
Figure 3-30. Transverse section of CTC-038.
2 in.
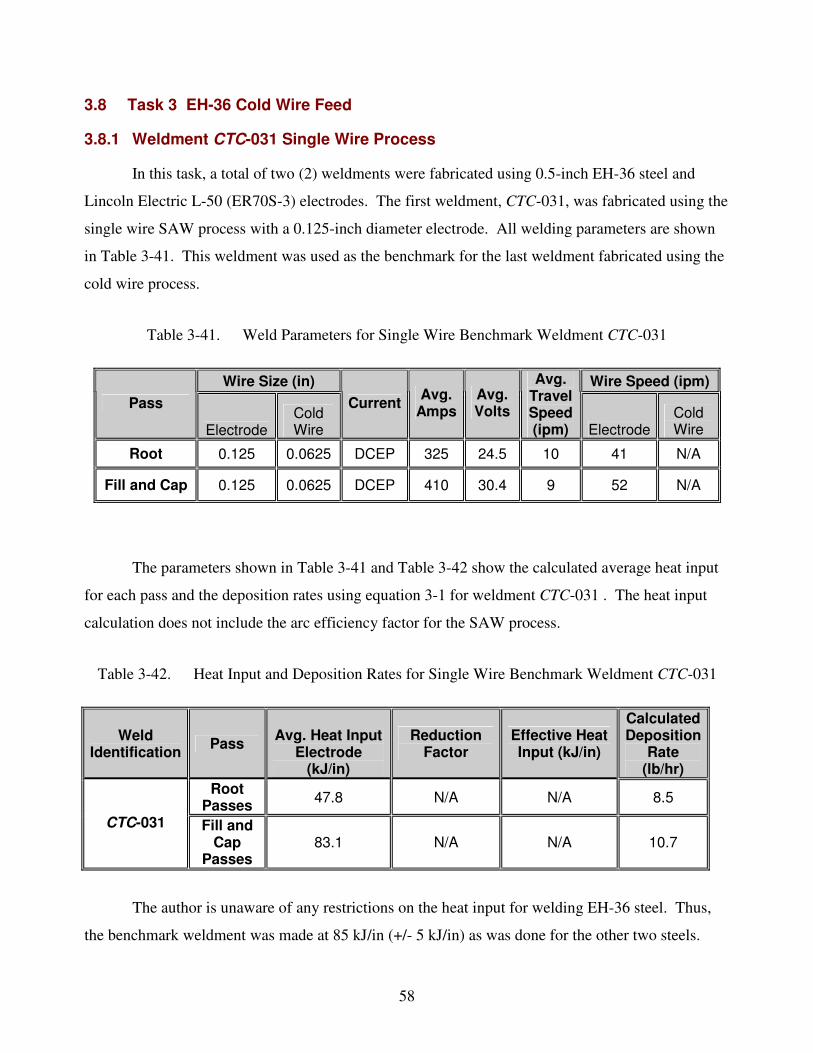
58
3.8 Task 3 EH-36 Cold Wire Feed
3.8.1 Weldment CTC-031 Single Wire Process
In this task, a total of two (2) weldments were fabricated using 0.5-inch EH-36 steel and
Lincoln Electric L-50 (ER70S-3) electrodes. The first weldment, CTC-031, was fabricated using the
single wire SAW process with a 0.125-inch diameter electrode. All welding parameters are shown
in Table 3-41. This weldment was used as the benchmark for the last weldment fabricated using the
cold wire process.
Table 3-41. Weld Parameters for Single Wire Benchmark Weldment CTC-031
Wire Size (in) Wire Speed (ipm) Pass
Electrode Cold Wire
Current Avg. Amps
Avg. Volts
Avg. Travel Speed (ipm) Electrode
Cold Wire
Root 0.125 0.0625 DCEP 325 24.5 10 41 N/A
Fill and Cap 0.125 0.0625 DCEP 410 30.4 9 52 N/A
The parameters shown in Table 3-41 and Table 3-42 show the calculated average heat input
for each pass and the deposition rates using equation 3-1 for weldment CTC-031 . The heat input
calculation does not include the arc efficiency factor for the SAW process.
Table 3-42. Heat Input and Deposition Rates for Single Wire Benchmark Weldment CTC-031
Weld Identification Pass Avg. Heat Input
Electrode (kJ/in)
Reduction Factor
Effective Heat Input (kJ/in)
Calculated Deposition
Rate (lb/hr)
Root Passes 47.8 N/A N/A 8.5
CTC-031 Fill and Cap
Passes 83.1 N/A N/A 10.7
The author is unaware of any restrictions on the heat input for welding EH-36 steel. Thus,
the benchmark weldment was made at 85 kJ/in (+/- 5 kJ/in) as was done for the other two steels.
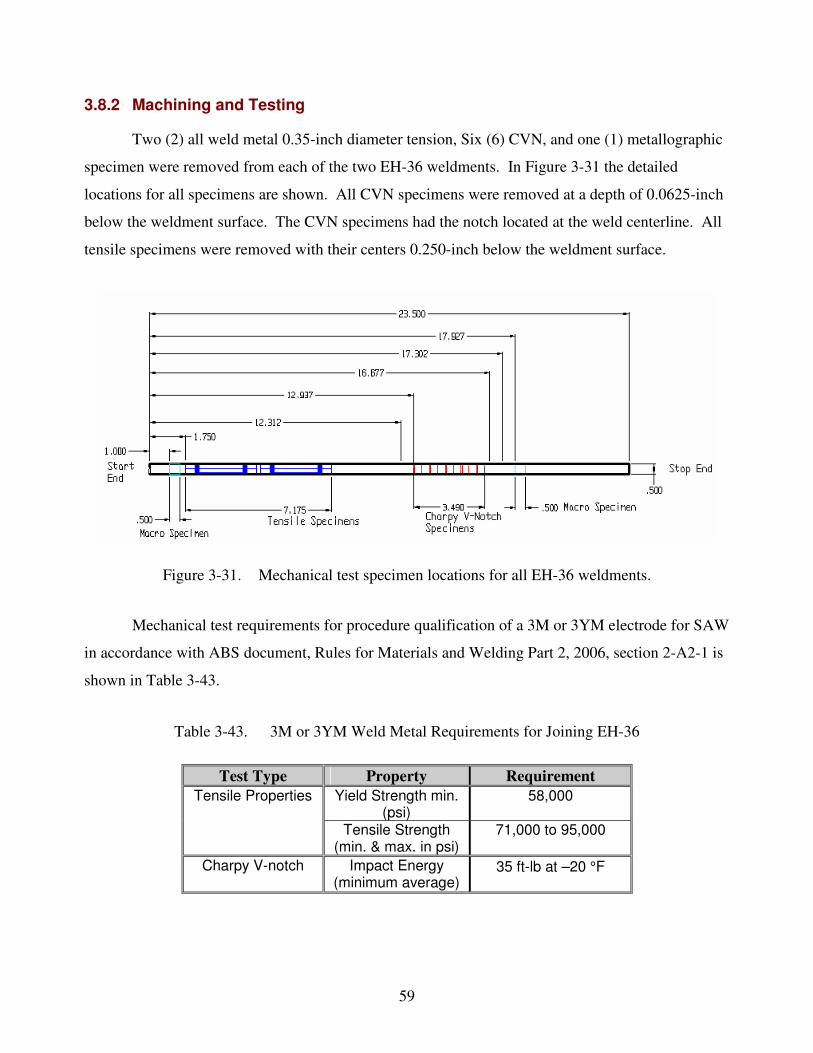
59
3.8.2 Machining and Testing
Two (2) all weld metal 0.35-inch diameter tension, Six (6) CVN, and one (1) metallographic
specimen were removed from each of the two EH-36 weldments. In Figure 3-31 the detailed
locations for all specimens are shown. All CVN specimens were removed at a depth of 0.0625-inch
below the weldment surface. The CVN specimens had the notch located at the weld centerline. All
tensile specimens were removed with their centers 0.250-inch below the weldment surface.
Figure 3-31. Mechanical test specimen locations for all EH-36 weldments.
Mechanical test requirements for procedure qualification of a 3M or 3YM electrode for SAW
in accordance with ABS document, Rules for Materials and Welding Part 2, 2006, section 2-A2-1 is
shown in Table 3-43.
Table 3-43. 3M or 3YM Weld Metal Requirements for Joining EH-36
Test Type Property Requirement Yield Strength min.
(psi) 58,000 Tensile Properties
Tensile Strength (min. & max. in psi)
71,000 to 95,000
Charpy V-notch Impact Energy (minimum average)
35 ft-lb at –20 °F
60
During welding, PT was performed after backgouging the root pass and after completing the
final cap passes. After welding was completed, mechanical tests were performed on weldment CTC-
031 and used as the benchmark for the following weldment. The results of the mechanical testing
are shown in Table 3-44 and 3-45. Table 3-44 shows that the tensile specimens meet the
requirements shown in table 3-39 for 3M or 3YM electrodes.
Table 3-44. Tensile Properties of Benchmark Weldment CTC-031
Specimen Identification
Specimen Diameter (inches)
Tensile Strength
(ksi)
Yield Strength
Elongation Increase
(%)
Reduction of Area
(%)
TS1-031 0.3495 83.6 69.1 39 80 TS2-031 0.3492 83.4 69.7 41 81
Requirement 0.3500 ± 0.0070 71–95 58 - -
Table 3-45. CVN Properties of Benchmark Weldment CTC-031
Specimen Identification
Test Temperature
(°F)
Absorbed Energy (ft-lbs)
Lateral Expansion
(mils)
Fracture Appearance
(% shear)
CTC-031-1 -20 8.0 8 20 CTC-031-2 -20 10.0 9 20 CTC-031-3 -20 15.0 14 25 CTC-031-4 -20 10.0 9 20 CTC-031-5 -20 11.0 11 20
Average 10.8 10.2 21.0 St. Dev. 2.6 2.4 2.2
Requirement -20 35 - -
As can be seen in table 3-45, none of the specimens met the requirement of the ABS
specification; in fact they failed to meet the requirement by a significant amount. Thus, when
deposited in a relatively thin (0.5 inch) plate at high heat inputs, the actual weld metal CVN
toughness can be much lower than the current ABS requirements. Figure 3-32 shows a transverse
section of weldment CTC-031.
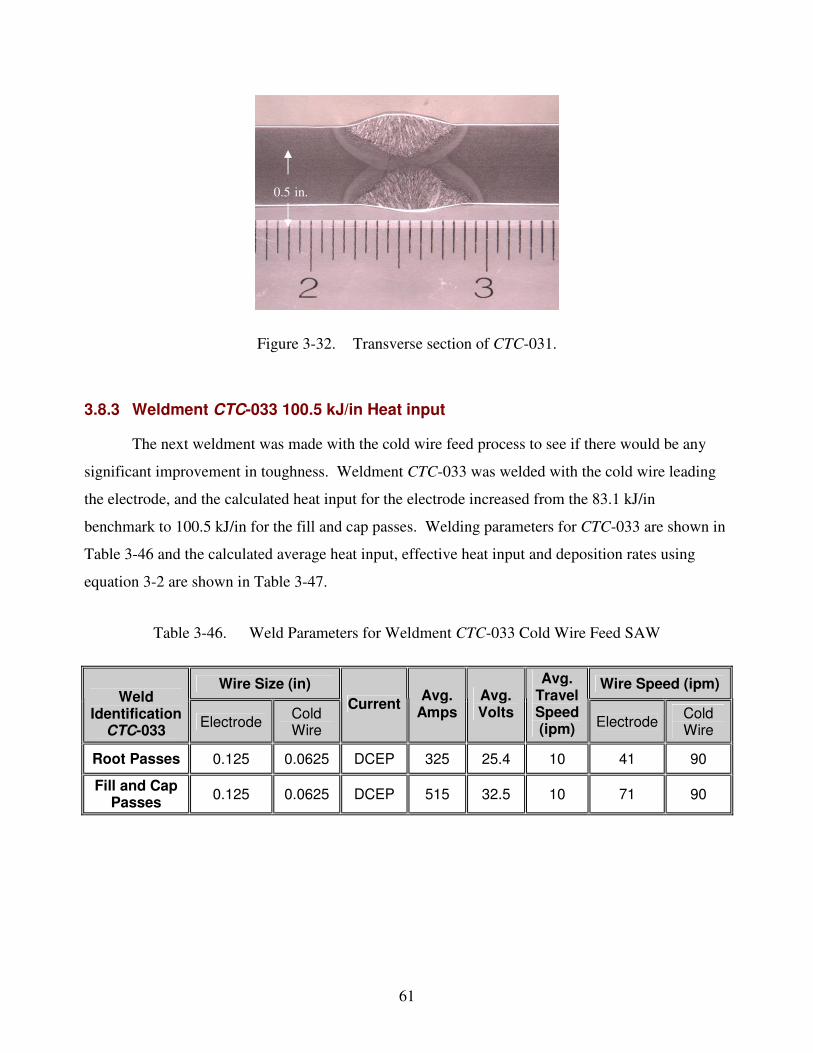
61
Figure 3-32. Transverse section of CTC-031.
3.8.3 Weldment CTC-033 100.5 kJ/in Heat input
The next weldment was made with the cold wire feed process to see if there would be any
significant improvement in toughness. Weldment CTC-033 was welded with the cold wire leading
the electrode, and the calculated heat input for the electrode increased from the 83.1 kJ/in
benchmark to 100.5 kJ/in for the fill and cap passes. Welding parameters for CTC-033 are shown in
Table 3-46 and the calculated average heat input, effective heat input and deposition rates using
equation 3-2 are shown in Table 3-47.
Table 3-46. Weld Parameters for Weldment CTC-033 Cold Wire Feed SAW
Wire Size (in) Wire Speed (ipm) Weld
Identification CTC-033 Electrode Cold
Wire
Current Avg. Amps
Avg. Volts
Avg. Travel Speed (ipm) Electrode Cold
Wire
Root Passes 0.125 0.0625 DCEP 325 25.4 10 41 90
Fill and Cap Passes 0.125 0.0625 DCEP 515 32.5 10 71 90
0.5 in.
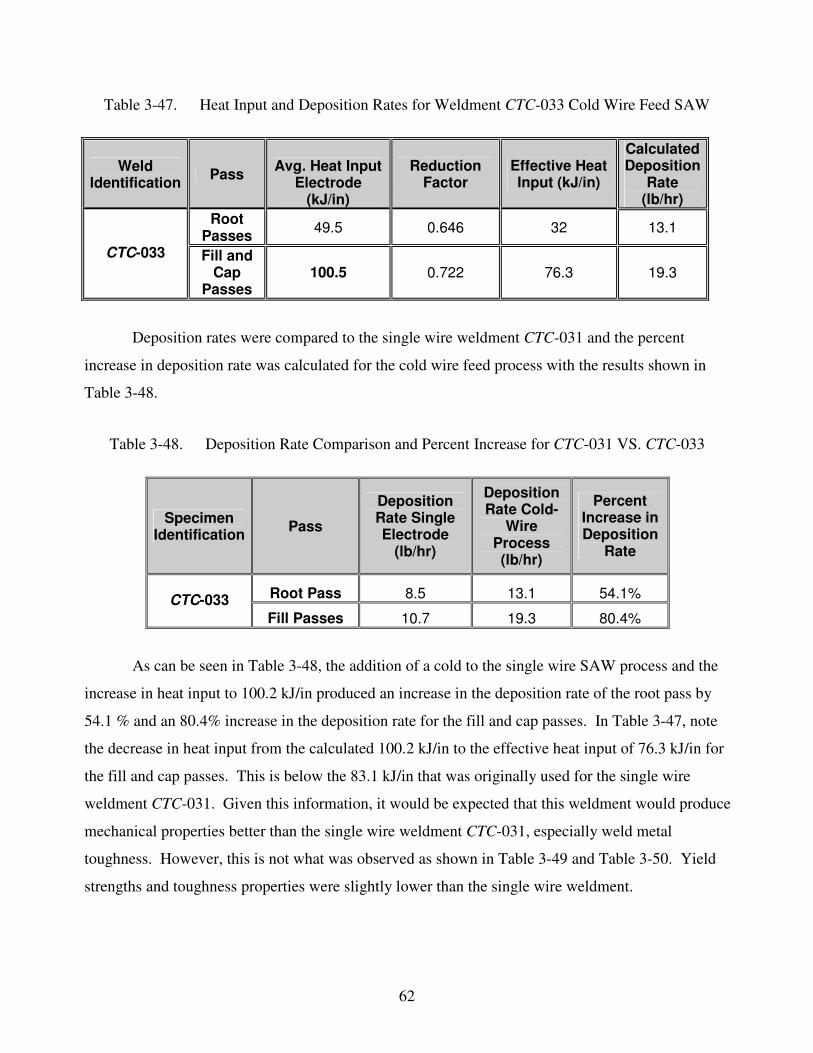
62
Table 3-47. Heat Input and Deposition Rates for Weldment CTC-033 Cold Wire Feed SAW
Weld Identification Pass Avg. Heat Input
Electrode (kJ/in)
Reduction Factor
Effective Heat Input (kJ/in)
Calculated Deposition
Rate (lb/hr)
Root Passes 49.5 0.646 32 13.1
CTC-033 Fill and Cap
Passes 100.5 0.722 76.3 19.3
Deposition rates were compared to the single wire weldment CTC-031 and the percent
increase in deposition rate was calculated for the cold wire feed process with the results shown in
Table 3-48.
Table 3-48. Deposition Rate Comparison and Percent Increase for CTC-031 VS. CTC-033
Specimen Identification Pass
Deposition Rate Single Electrode
(lb/hr)
Deposition Rate Cold-
Wire Process (lb/hr)
Percent Increase in Deposition
Rate
Root Pass 8.5 13.1 54.1% CTC-033 Fill Passes 10.7 19.3 80.4%
As can be seen in Table 3-48, the addition of a cold to the single wire SAW process and the
increase in heat input to 100.2 kJ/in produced an increase in the deposition rate of the root pass by
54.1 % and an 80.4% increase in the deposition rate for the fill and cap passes. In Table 3-47, note
the decrease in heat input from the calculated 100.2 kJ/in to the effective heat input of 76.3 kJ/in for
the fill and cap passes. This is below the 83.1 kJ/in that was originally used for the single wire
weldment CTC-031. Given this information, it would be expected that this weldment would produce
mechanical properties better than the single wire weldment CTC-031, especially weld metal
toughness. However, this is not what was observed as shown in Table 3-49 and Table 3-50. Yield
strengths and toughness properties were slightly lower than the single wire weldment.
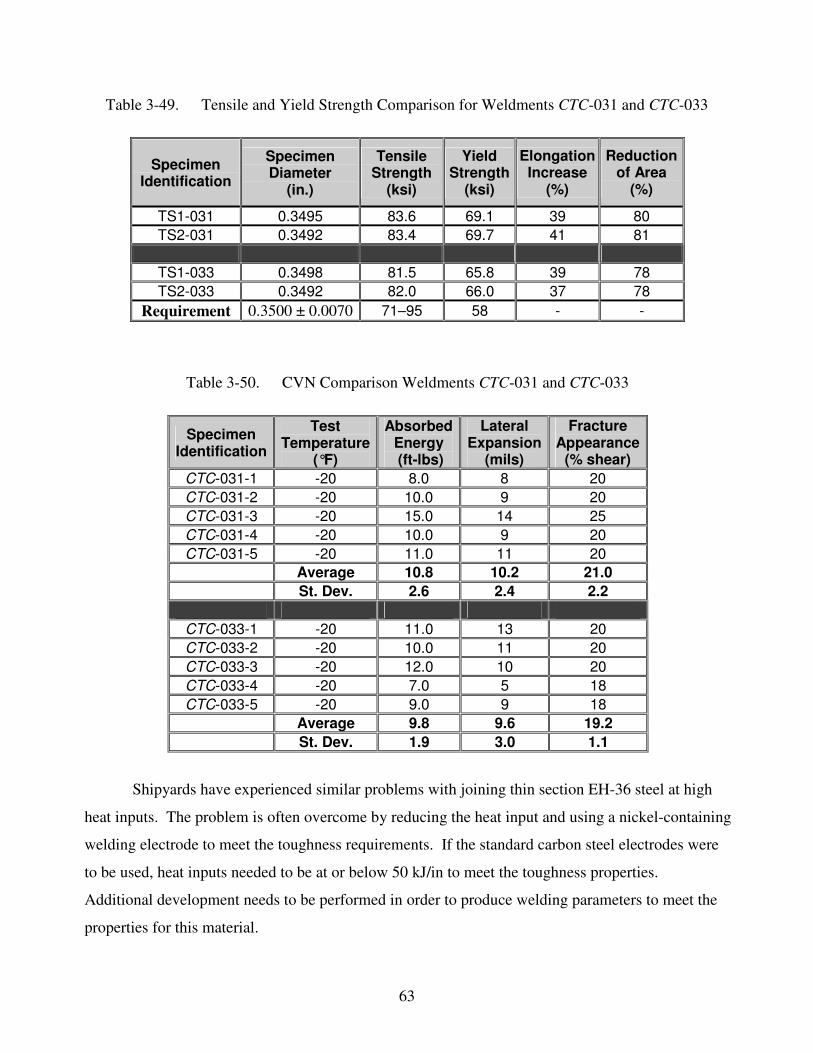
63
Table 3-49. Tensile and Yield Strength Comparison for Weldments CTC-031 and CTC-033
Specimen Identification
Specimen Diameter
(in.)
Tensile Strength
(ksi)
Yield Strength
(ksi)
Elongation Increase
(%)
Reduction of Area
(%)
TS1-031 0.3495 83.6 69.1 39 80 TS2-031 0.3492 83.4 69.7 41 81
TS1-033 0.3498 81.5 65.8 39 78 TS2-033 0.3492 82.0 66.0 37 78
Requirement 0.3500 ± 0.0070 71–95 58 - -
Table 3-50. CVN Comparison Weldments CTC-031 and CTC-033
Specimen Identification
Test Temperature
(°F)
Absorbed Energy (ft-lbs)
Lateral Expansion
(mils)
Fracture Appearance
(% shear) CTC-031-1 -20 8.0 8 20 CTC-031-2 -20 10.0 9 20 CTC-031-3 -20 15.0 14 25 CTC-031-4 -20 10.0 9 20 CTC-031-5 -20 11.0 11 20
Average 10.8 10.2 21.0 St. Dev. 2.6 2.4 2.2
CTC-033-1 -20 11.0 13 20 CTC-033-2 -20 10.0 11 20 CTC-033-3 -20 12.0 10 20 CTC-033-4 -20 7.0 5 18 CTC-033-5 -20 9.0 9 18
Average 9.8 9.6 19.2 St. Dev. 1.9 3.0 1.1
Shipyards have experienced similar problems with joining thin section EH-36 steel at high
heat inputs. The problem is often overcome by reducing the heat input and using a nickel-containing
welding electrode to meet the toughness requirements. If the standard carbon steel electrodes were
to be used, heat inputs needed to be at or below 50 kJ/in to meet the toughness properties.
Additional development needs to be performed in order to produce welding parameters to meet the
properties for this material.
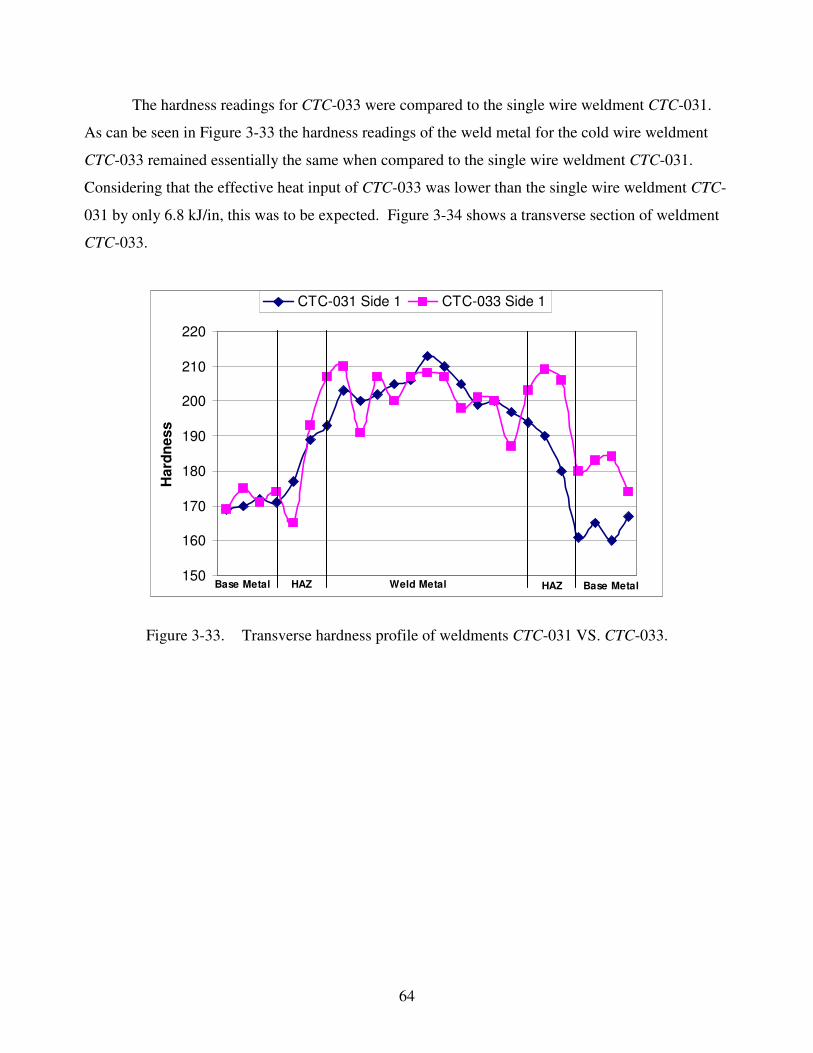
64
The hardness readings for CTC-033 were compared to the single wire weldment CTC-031.
As can be seen in Figure 3-33 the hardness readings of the weld metal for the cold wire weldment
CTC-033 remained essentially the same when compared to the single wire weldment CTC-031.
Considering that the effective heat input of CTC-033 was lower than the single wire weldment CTC-
031 by only 6.8 kJ/in, this was to be expected. Figure 3-34 shows a transverse section of weldment
CTC-033.
150
160
170
180
190
200
210
220
Har
dnes
s
CTC-031 Side 1 CTC-033 Side 1
Base Metal Base MetalHAZ HAZWeld Metal
Figure 3-33. Transverse hardness profile of weldments CTC-031 VS. CTC-033.
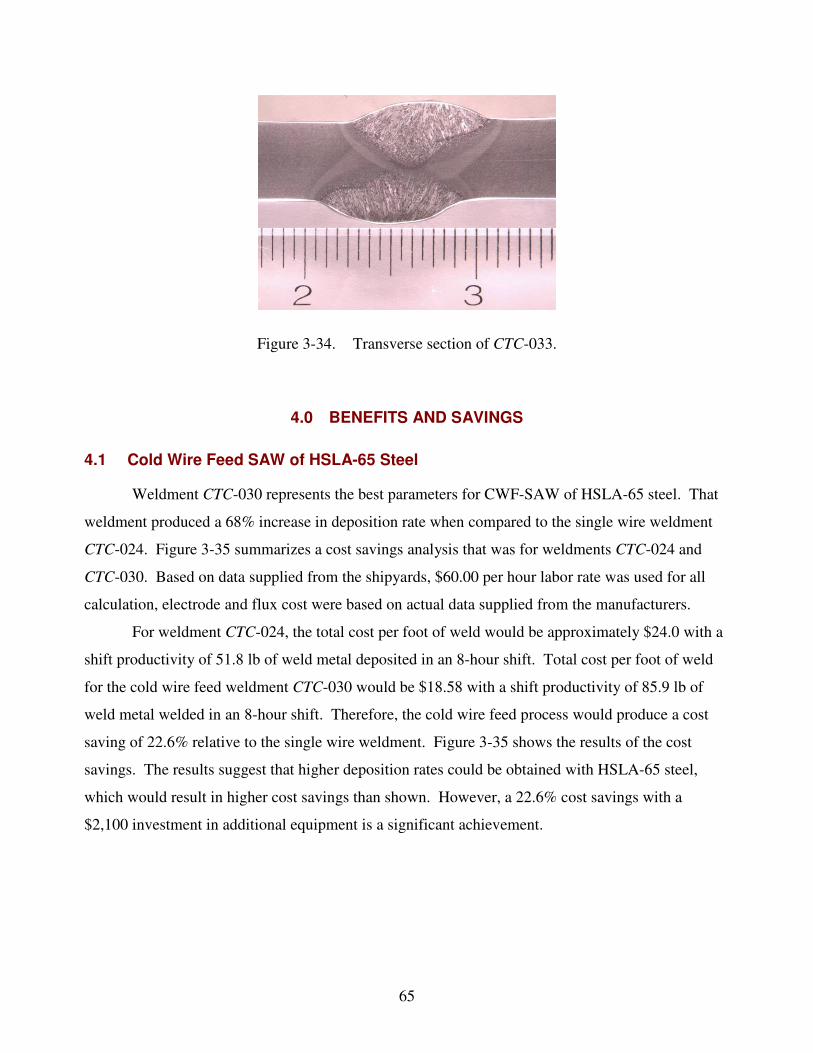
65
Figure 3-34. Transverse section of CTC-033.
4.0 BENEFITS AND SAVINGS
4.1 Cold Wire Feed SAW of HSLA-65 Steel
Weldment CTC-030 represents the best parameters for CWF-SAW of HSLA-65 steel. That
weldment produced a 68% increase in deposition rate when compared to the single wire weldment
CTC-024. Figure 3-35 summarizes a cost savings analysis that was for weldments CTC-024 and
CTC-030. Based on data supplied from the shipyards, $60.00 per hour labor rate was used for all
calculation, electrode and flux cost were based on actual data supplied from the manufacturers.
For weldment CTC-024, the total cost per foot of weld would be approximately $24.0 with a
shift productivity of 51.8 lb of weld metal deposited in an 8-hour shift. Total cost per foot of weld
for the cold wire feed weldment CTC-030 would be $18.58 with a shift productivity of 85.9 lb of
weld metal welded in an 8-hour shift. Therefore, the cold wire feed process would produce a cost
saving of 22.6% relative to the single wire weldment. Figure 3-35 shows the results of the cost
savings. The results suggest that higher deposition rates could be obtained with HSLA-65 steel,
which would result in higher cost savings than shown. However, a 22.6% cost savings with a
$2,100 investment in additional equipment is a significant achievement.
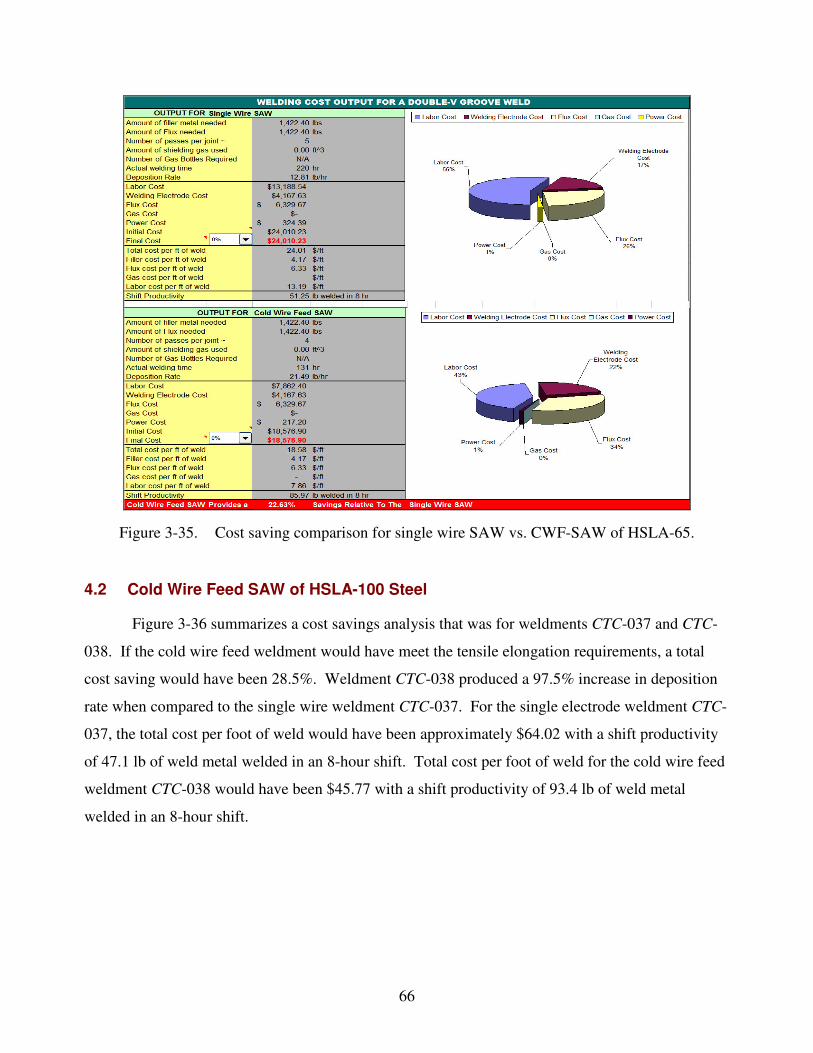
66
Figure 3-35. Cost saving comparison for single wire SAW vs. CWF-SAW of HSLA-65.
4.2 Cold Wire Feed SAW of HSLA-100 Steel
Figure 3-36 summarizes a cost savings analysis that was for weldments CTC-037 and CTC-
038. If the cold wire feed weldment would have meet the tensile elongation requirements, a total
cost saving would have been 28.5%. Weldment CTC-038 produced a 97.5% increase in deposition
rate when compared to the single wire weldment CTC-037. For the single electrode weldment CTC-
037, the total cost per foot of weld would have been approximately $64.02 with a shift productivity
of 47.1 lb of weld metal welded in an 8-hour shift. Total cost per foot of weld for the cold wire feed
weldment CTC-038 would have been $45.77 with a shift productivity of 93.4 lb of weld metal
welded in an 8-hour shift.
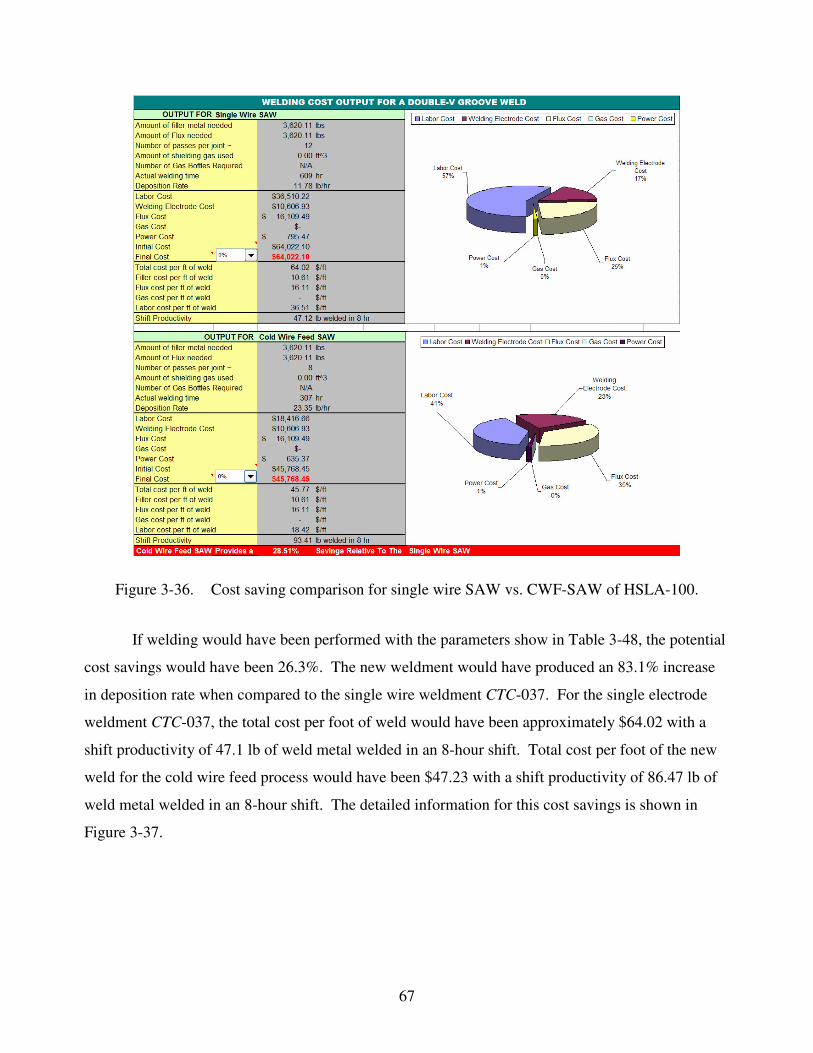
67
Figure 3-36. Cost saving comparison for single wire SAW vs. CWF-SAW of HSLA-100.
If welding would have been performed with the parameters show in Table 3-48, the potential
cost savings would have been 26.3%. The new weldment would have produced an 83.1% increase
in deposition rate when compared to the single wire weldment CTC-037. For the single electrode
weldment CTC-037, the total cost per foot of weld would have been approximately $64.02 with a
shift productivity of 47.1 lb of weld metal welded in an 8-hour shift. Total cost per foot of the new
weld for the cold wire feed process would have been $47.23 with a shift productivity of 86.47 lb of
weld metal welded in an 8-hour shift. The detailed information for this cost savings is shown in
Figure 3-37.
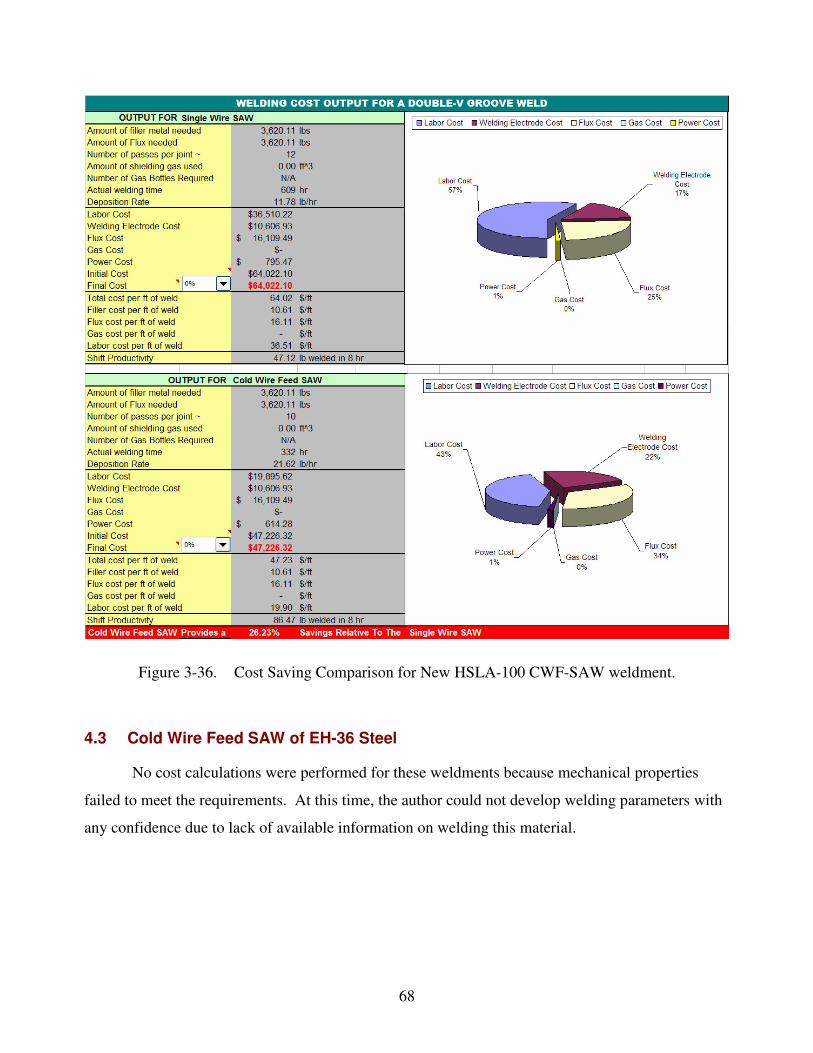
68
Figure 3-36. Cost Saving Comparison for New HSLA-100 CWF-SAW weldment.
4.3 Cold Wire Feed SAW of EH-36 Steel
No cost calculations were performed for these weldments because mechanical properties
failed to meet the requirements. At this time, the author could not develop welding parameters with
any confidence due to lack of available information on welding this material.
69
5.0 SUMMARY AND CONCLUSIONS
5.1 Cold Wire Feed SAW of HSLA-65 Steel
Deposition rates of the CWF-SAW weldments were increased from 36% to 68% for the
HSLA-65 weldments when compared to the benchmark weldment made with the single wire SAW
process at approximately 85 kJ/in heat input. Heat inputs were increased from 85 kJ/in to a
maximum of 125 kJ/in with no deterioration in mechanical properties, which is a significant
improvement. As deposition rates increased, both yield and tensile strengths increased slightly with
the most dramatic improvement in weld metal toughness; this was true for all HSLA-65 weldments.
Hardness readings for all weldments increased as the amount of heat entering the weldment
decreased. The increase in hardness indicates an increase in the cooling rate of the weld and
supports the hypothesis of the cold wire addition lowering the effective heat input.
All cold wire feed welding ran smoothly with no complications noted with the process. Root
pass welding for all weldments was also conducted using the CWF-SAW process. Typically with
twin-arc SAW or tandem arc SAW a separate process such as GMAW or FCAW is used to deposit
the root pass, which is an added cost. The CWF-SAW process eliminated the need for a separate
welding process for the root pass, which will reduce set-up and handling time.
5.2 Cold Wire Feed SAW of HSLA-100 Steel
For the HSLA-100 task, two (2) weldments were produced, one (1) benchmark weldment
using the single wire process at approximately 85 kJ/in heat input and a second weldment made
using the CWF-SAW process at 124 kJ/in heat input.
Deposition rates were increased 39% for the root pass and 97.5% for the fill and cap passes
using the cold wire feed process. All yield strength and toughness properties of the cold wire
weldment meet the requirements for MIL-100S, however elongation requirements were not meet.
This would indicate that an upper limit for the welding parameters was exceeded for this material
and filler metal combination. It should be noted that the single wire benchmark weldment did not
meet the -60 °F toughness requirement.
5.3 Cold Wire Feed SAW of EH-36 Steel
The single wire weldment using a Lincoln Electric LA-50, AWS EM13K electrode met the
requirements of 71 ksi–95 ksi tensile strength per the ABS document, Rules for Materials and
70
Welding Part 2, 2006, section 2-A2-1, Table 1 for a 3M or 3YM electrode. In addition, the
weldment also meet the requirement of 58 ksi for the yield strength. However, none of the
specimens met the procedure qualification CVN requirement of 35 ft-lb at -20 °F in accordance with
the ABS specification; in fact they failed to meet the requirement by a significant amount. This was
also true for the cold wire weldment for this steel. Again, the toughness requirements could not be
met even though the effective heat input was below the heat input for the single wire weldment.
6.0 Recommendations
6.1 Cold Wire Feed SAW of HSLA-65 Steel
Results for the HSLA-65 material were very promising. Additional research should be
performed with this material and the CWF-SAW process to optimize performance. Additional
testing should be performed such as CVN testing of the HAZ and a more in-depth study into the
effective heat input theory using thermocouples. This project did not produce a maximum heat input
for this material, therefore, additional weldments should be made increasing the heat input beyond
the 124 kJ/in that was used in this project until a maximum is found.
Distortion should also be investigated with this and all other materials when using the CWF-
SAW process. Although this project did not focus specifically on distortion control, it was noted
that the plates that were welded using the CWF-SAW process visually exhibit less distortion than
the plate using the single wire SAW process.
6.2 Cold Wire Feed SAW of HSLA-100 Steel
With the valuable information produced in this report for HSLA-100 material, the author is
confident that welding parameters can be developed to meet the requirements of the specification
and still produce at least an 80% increase in deposition rates. As an example, parameters could have
been adjusted to develop a deposition rate of 21.6 lb/hr and an effective heat input of 81.6 kJ/in.
This would produce an 83.1% increase in the deposition rate at a decreased cost, which is still a
significant increase in production. See Tables 3-51–3-53 for parameters and deposition rates.
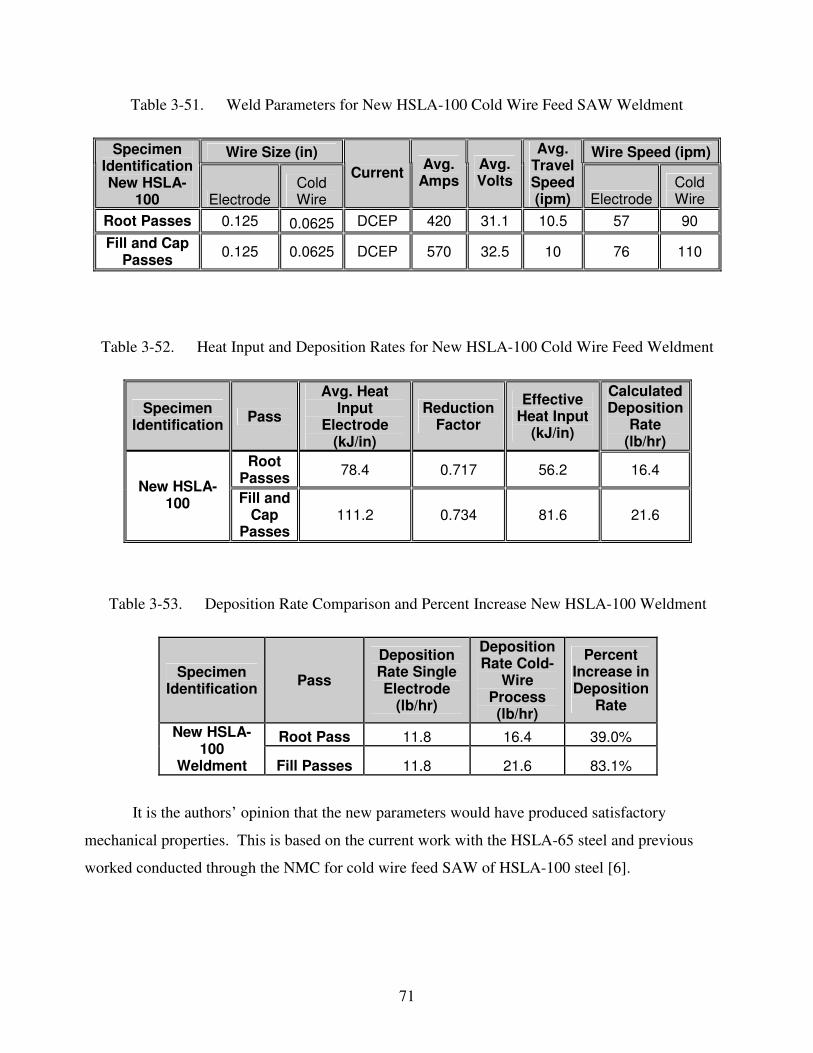
71
Table 3-51. Weld Parameters for New HSLA-100 Cold Wire Feed SAW Weldment
Wire Size (in) Wire Speed (ipm) Specimen Identification New HSLA-
100 Electrode Cold Wire
Current Avg. Amps
Avg. Volts
Avg. Travel Speed (ipm) Electrode
Cold Wire
Root Passes 0.125 0.0625 DCEP 420 31.1 10.5 57 90 Fill and Cap
Passes 0.125 0.0625 DCEP 570 32.5 10 76 110
Table 3-52. Heat Input and Deposition Rates for New HSLA-100 Cold Wire Feed Weldment
Specimen Identification Pass
Avg. Heat Input
Electrode (kJ/in)
Reduction Factor
Effective Heat Input
(kJ/in)
Calculated Deposition
Rate (lb/hr)
Root Passes 78.4 0.717 56.2 16.4
New HSLA-100 Fill and
Cap Passes
111.2 0.734 81.6 21.6
Table 3-53. Deposition Rate Comparison and Percent Increase New HSLA-100 Weldment
Specimen Identification Pass
Deposition Rate Single Electrode
(lb/hr)
Deposition Rate Cold-
Wire Process (lb/hr)
Percent Increase in Deposition
Rate
Root Pass 11.8 16.4 39.0% New HSLA-100
Weldment Fill Passes 11.8 21.6 83.1%
It is the authors’ opinion that the new parameters would have produced satisfactory
mechanical properties. This is based on the current work with the HSLA-65 steel and previous
worked conducted through the NMC for cold wire feed SAW of HSLA-100 steel [6].
72
6.3 Cold Wire Feed SAW of EH-36 Steel
Additional work needs to be performed in order to produce welding parameters to meet the
mechanical property requirements for this material. The problem with the low CVN results may be
overcome by reducing the heat input and using a welding electrode containing a high nickel content
to meet the toughness requirements. Welding should be conducted starting with the single wire
SAW process at a heat input of 50 kJ/in using a standard carbon steel electrode to see if toughness
requirements can be meet. If toughness requirements are not met at 50 kJ/in the heat input should be
decreased to 40 kJ/in and mechanical testing performed. This should continue until a heat input is
reached that would produce satisfactory toughness results.
Once toughness requirements are met, heat inputs can be increased until an upper limit for
heat input is met for the single wire SAW process. After adequate procedures have been developed,
and maximum heat inputs are established, CWF-SAW process can be used to determine deposition
rate increases and mechanical property improvements.
73
7.0 REFERENCES
1. Synergic Cold Wire Submerged Arc Welding of High Alloyed Stainless Steels, L. Karlsson, H. Arcini, P. Dyberg, S. Rigdal and M. Thuvander, ESAB AB, 2002, pp. 285–286.
2. Submerged Arc Welding of Low-Carbon Copper-Strengthened Alloy Steel, R.J. Jesseman, and G.J. Murphy, Welding Journal, Vol. 62, No. 11 November 1983, pp. 321s–330s.
3. Evaluation of HSLA-65 (ASTM A 945, Grade 65) Steel for Surface Combatant Structures, E.J. Czyryca, J.J. DeLoach, and E.M. Focht, Naval Surface Warfare Center Carderock Division, NSWCCD-61-TR-2001/20 December 2001, pg. Xiii.
4. Welding Metallurgy Vol. 1, G.E. Linnert, GML Publications, Hilton Head Island, South Carolina, p. 749, 1994, ISBN: 0-87171-457-4.
5. Welding Filler Metal Data Book, ESAB Welding and Cutting, 2005, p. 7-2.
6. “Manufacturing Large Marine Structures – NCEMT Tasks: Task 3 – Weld Procedure Robustness Optimization, Final Report,” Mark F. Mruczek and Paul J. Konkol, NCEMT TR No. 05-044, Concurrent Technologies Corporation, Johnstown, PA, 30 April 2005, p. 27
74
8.0 Appendices
8.1 Appendix A: CTC Experience
8.2 CTC Capabilities – Welding Applications
CTC is an independent, nonprofit, applied research and development professional services
organization that provides technology-based solutions to a wide variety of clients representing state
and federal government as well as the private sector. CTC addresses welding application projects
with experienced teams of mechanical, material and welding engineering staff. CTC uses state-of-
the-art computer-aided engineering tools and technologies to enhance our clients’ product quality,
producability and cost effectiveness. CTC staff experts have built virtual product models and have
performed numerically-based simulations to support welding applications and product evolution
from concept to shop floor fabrication.
CTC applies advanced manufacturing techniques, computer aided engineering, design for
manufacturing and assembly, prototyping and numerical analysis capabilities from the development
of the design concept through final fabrication. Concurrent engineering principles are applied for
total systems integration. The following paragraphs describe CTC’s design and manufacturing
capabilities toward welding applications.
8.2.1 Design for Manufacturing and Assembly
CTC incorporates a design philosophy for weld fabrication design from start to finish that
will aid in the transition of computer/paper designs into fabricated part/assemblies. CTC can bridge
the gap between fabrication and design before a part is created on the manufacturing floor. This
virtual development relies upon concurrent engineering teams, which understand welding theory,
metallography, welding practices, welding code/specifications and ship building.
8.2.2 Prototyping of Components and Assemblies
CTC has built capabilities and expertise in full service machine and welding shops that
quickly develop prototypes for test and evaluation purposes and to provide correlation to numerical
modeling for simple to complex systems. These capabilities are critical to ensure designs are
sufficient to meet customer requirements.
75
8.2.3 Machine Shop
The machining areas at CTC heavily support responsiveness and flexibility in meeting
project requirements from machining test specimens and fixtures to fabricating subassemblies. The
machining area contains a lean amount of equipment necessary to support the projects. The core
machining equipment is used in a flexible manner to provide capabilities for CNC turning, CNC
milling, surface grinding, wire Electrical Discharge Machining (EDM) and cutting saws. Manual
mills and lathes are also available for use. Some examples of this equipment include a CNC
Cincinnati Milacron Sabre-750 three-axis milling center, a Fanuc Robocut Alpha-1B Submersible
four-axis EDM, a Mori Seki CNC turning machine equipped with rotary tooling for milling, drilling
and tapping operations and a Gallmeyer & Livingston precision surface grinder that can be used for
flat, radius and angle finishes capable of attaining 10�" within 0.0001".
8.2.4 Weld Shop
The welding area consists of a variety of equipment to support various welding processes.
An overhead crane allows materials to be moved efficiently and safely. An environmentally
controlled clean room is capable of temperature and humidity control to extreme conditions.
GMAW, gas tungsten arc welding (GTAW), plasma arc welding (PAW), submerged arc welding
(SAW), electroslag surfacing (ESS) and cutting operations are available to support project
requirements. Some examples of the GMAW welding equipment include a Lincoln Idealarc 500,
Miller Synchrowave 500, Miller Deltaweld 451 and Lincoln Power Wave 455M. For GTAW
welding, a Miller Synchrowave 350 with AC/DC constant power source and manual or automatic
torch is available. A Thermal Dynamic PS 3000 is used for PAW welding, has a 300-amp power
supply complete with thermal arc sequencer and is able to run in manual or automatic modes. A
Miller Pulstar 450, Miller Spectrum 1500 and Airco welding and cutting torches for oxygen
acetylene cutting are available to support cutting operations. Preheating units, fixturing devices,
turning rolls and portable air filtration units are available to support welding operations.
8.2.5 Coordinate Measuring Machine (CMM)
CTC has a calibrated CMM machine/surface plate in a controlled temperature and positive
pressure environment.