COLD ROLLING EVOLUTION IN HIGH PURITY NIOBIUM USING A ... · COLD ROLLING EVOLUTION IN HIGH PURITY...
3
COLD ROLLING EVOLUTION IN HIGH PURITY NIOBIUM USING A TAPERED WEDGE SPECIMEN H. Jiang, T.R. Bieler, C. Compton, T.L. Grimm, Michigan State University, East Lansing, MI 48823, U.S.A Abstract A tapered wedge niobium specimen was rolled at room temperature with multiple passes in the same direction without lubricant and then annealed at 750°C for 1 hour. The crystal orientation distribution of the 50, 70%, 80%, 90% deformed samples was investigated using x-rays to obtain a quantitative texture analysis. The initial rotated cube (001)<110> texture was largely retained up to about 70% reduction in the interior of the samples. After 80% rolling deformation the initial texture vanished and revealed a {111} fiber texture in the interior, which remained stable during annealing. With 90% reduction, the {111} fiber texture become somewhat stronger. In the surface layer, the {001} fiber orientation remained stable but after annealing, the surface texture sharpened to become {001}<110> INTRODUCTION The formability of pure niobium metal sheet for forming complex shaped RF cavities for superconducting accelerators depends critically on its plastic anisotropy. Also, the gradients in texture from the surface inward affect the surface finish that is critical for the application. It is well known that the development of {111} texture increase the drawability of bcc metals, other texture component, such as {001}, have been found to be detrimental [1,2]. The texture evolution is significantly affected by the initial textures and prior deformation history. Previous results clearly show that inhomogeneity in texture is often present both in rolled and annealed initial textures [3,4]. In order to investigate the effect of texture evolution on recrystallization as a function of rolling strain, a tapered slab experiment was carried out on high purity niobium to impose different cold rolling reductions. Through thickness variations in texture were investigated by X-ray diffraction at different depths in the rolled sample. The textures in annealed samples were also analyzed by EBSD technique. EXPERIMENT PROCEDURES The material used in this work was high purity niobium (RRR=150); the dimensions of the specimen was the same as shown in.[4]. The specimen was single directional rolled without lubrication at room temperature with six passes so that the thickness of the specimen was reduced to 0.7 mm to provide a gradient of rolling reductions in a single specimen. After rolling, the specimen was sliced along the rolling direction to make 8 equal size strips. A strip from the center was annealed at 750°C for 1 hour in an evacuated quartz tube. Incomplete (200), (220) and (111) pole figures of surface and the center layer were measured in deformed and recrystallized specimens using Ni filtered Cu-K α radiation. The Sample Orientation Distribution (SOD) was computed using the big WIMV method using triclinic sample symmetry in the popLA software package [5]. Local crystal orientation data were also collected using a Camscan 44FE with an EBSP mapping system (version 4.2) from hkl Technologies, and post processed with TexSEM labs analysis software version 3.0. BCC metals often reveal fiber textures after rolling, the orientation densities are represented either in sections through Euler space or along special orientation tubes in Euler space such as α fiber, γ fiber etc (see fig, 1). Fig. 1 Reduced Euler space with important fibers and orientations for bcc metals RESULTS AND DISCUSSION Fig. 2 shows that the initial texture of the tapered wedge niobium sample has a rotated cube component close to {001}<120> and partial α and γ fibers in the interior, and a weak {001} texture on the surface. Fig.3 shows the textures measured by X-ray diffraction on surface and interior layer of the cold rolled and annealed niobium samples. It is obvious that the orientation density maxima vary with the cold rolling reduction as well as through the sheet thickness. In the surface layer of the cold rolled sheet with different reductions, {001}<110> was the dominant texture component. Annealing strengthened the existing surface texture significantly.
Transcript of COLD ROLLING EVOLUTION IN HIGH PURITY NIOBIUM USING A ... · COLD ROLLING EVOLUTION IN HIGH PURITY...
COLD ROLLING EVOLUTION IN HIGH PURITY NIOBIUM USING A TAPERED WEDGE SPECIMEN
H. Jiang, T.R. Bieler, C. Compton, T.L. Grimm, Michigan State University, East Lansing, MI 48823, U.S.A
Abstract A tapered wedge niobium specimen was rolled at room
temperature with multiple passes in the same direction without lubricant and then annealed at 750°C for 1 hour. The crystal orientation distribution of the 50, 70%, 80%, 90% deformed samples was investigated using x-rays to obtain a quantitative texture analysis. The initial rotated cube (001)<110> texture was largely retained up to about 70% reduction in the interior of the samples. After 80% rolling deformation the initial texture vanished and revealed a {111} fiber texture in the interior, which remained stable during annealing. With 90% reduction, the {111} fiber texture become somewhat stronger. In the surface layer, the {001} fiber orientation remained stable but after annealing, the surface texture sharpened to become {001}<110>
INTRODUCTION The formability of pure niobium metal sheet for
forming complex shaped RF cavities for superconducting accelerators depends critically on its plastic anisotropy. Also, the gradients in texture from the surface inward affect the surface finish that is critical for the application. It is well known that the development of {111} texture increase the drawability of bcc metals, other texture component, such as {001}, have been found to be detrimental [1,2]. The texture evolution is significantly affected by the initial textures and prior deformation history. Previous results clearly show that inhomogeneity in texture is often present both in rolled and annealed initial textures [3,4]. In order to investigate the effect of texture evolution on recrystallization as a function of rolling strain, a tapered slab experiment was carried out on high purity niobium to impose different cold rolling reductions. Through thickness variations in texture were investigated by X-ray diffraction at different depths in the rolled sample. The textures in annealed samples were also analyzed by EBSD technique.
EXPERIMENT PROCEDURES The material used in this work was high purity niobium
(RRR=150); the dimensions of the specimen was the same as shown in.[4]. The specimen was single directional rolled without lubrication at room temperature with six passes so that the thickness of the specimen was reduced to 0.7 mm to provide a gradient of rolling reductions in a single specimen. After rolling, the specimen was sliced along the rolling direction to make 8 equal size strips. A strip from the center was annealed at
750°C for 1 hour in an evacuated quartz tube. Incomplete (200), (220) and (111) pole figures of surface and the center layer were measured in deformed and recrystallized specimens using Ni filtered Cu-Kα radiation. The Sample Orientation Distribution (SOD) was computed using the big WIMV method using triclinic sample symmetry in the popLA software package [5]. Local crystal orientation data were also collected using a Camscan 44FE with an EBSP mapping system (version 4.2) from hkl Technologies, and post processed with TexSEM labs analysis software version 3.0.
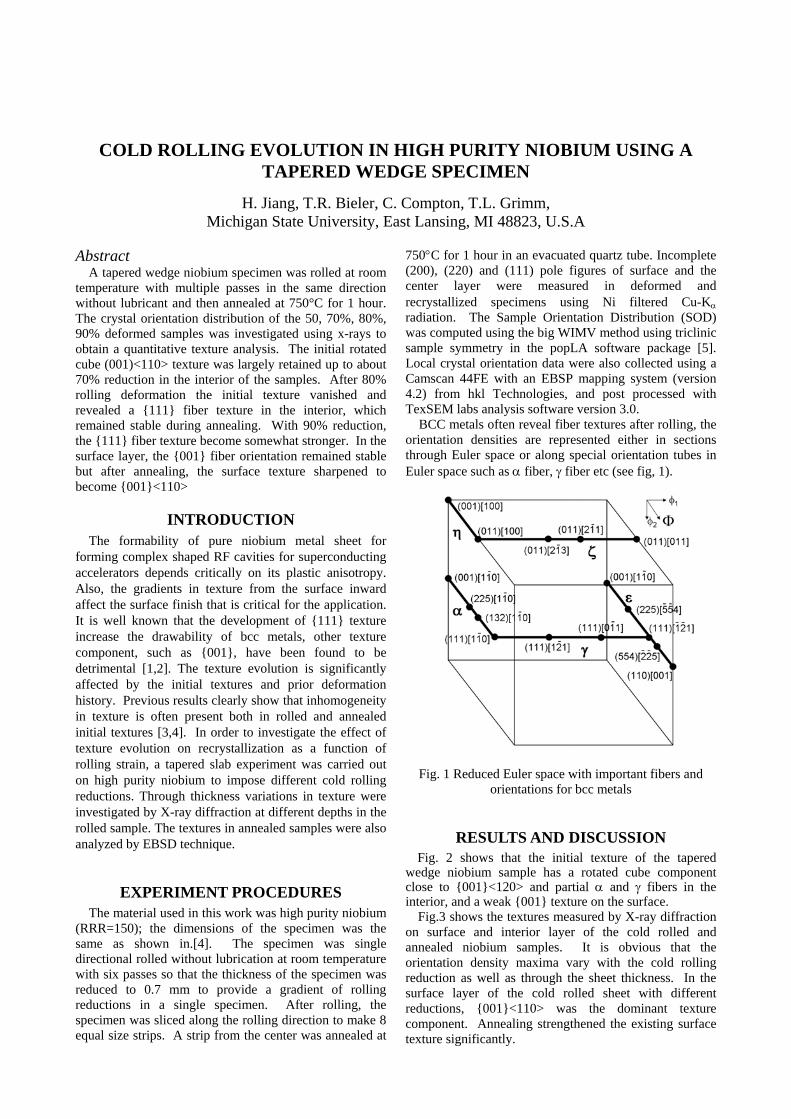
BCC metals often reveal fiber textures after rolling, the orientation densities are represented either in sections through Euler space or along special orientation tubes in Euler space such as α fiber, γ fiber etc (see fig, 1).
Fig. 1 Reduced Euler space with important fibers and orientations for bcc metals
RESULTS AND DISCUSSION Fig. 2 shows that the initial texture of the tapered
wedge niobium sample has a rotated cube component close to {001}<120> and partial α and γ fibers in the interior, and a weak {001} texture on the surface.
Fig.3 shows the textures measured by X-ray diffraction on surface and interior layer of the cold rolled and annealed niobium samples. It is obvious that the orientation density maxima vary with the cold rolling reduction as well as through the sheet thickness. In the surface layer of the cold rolled sheet with different reductions, {001}<110> was the dominant texture component. Annealing strengthened the existing surface texture significantly.
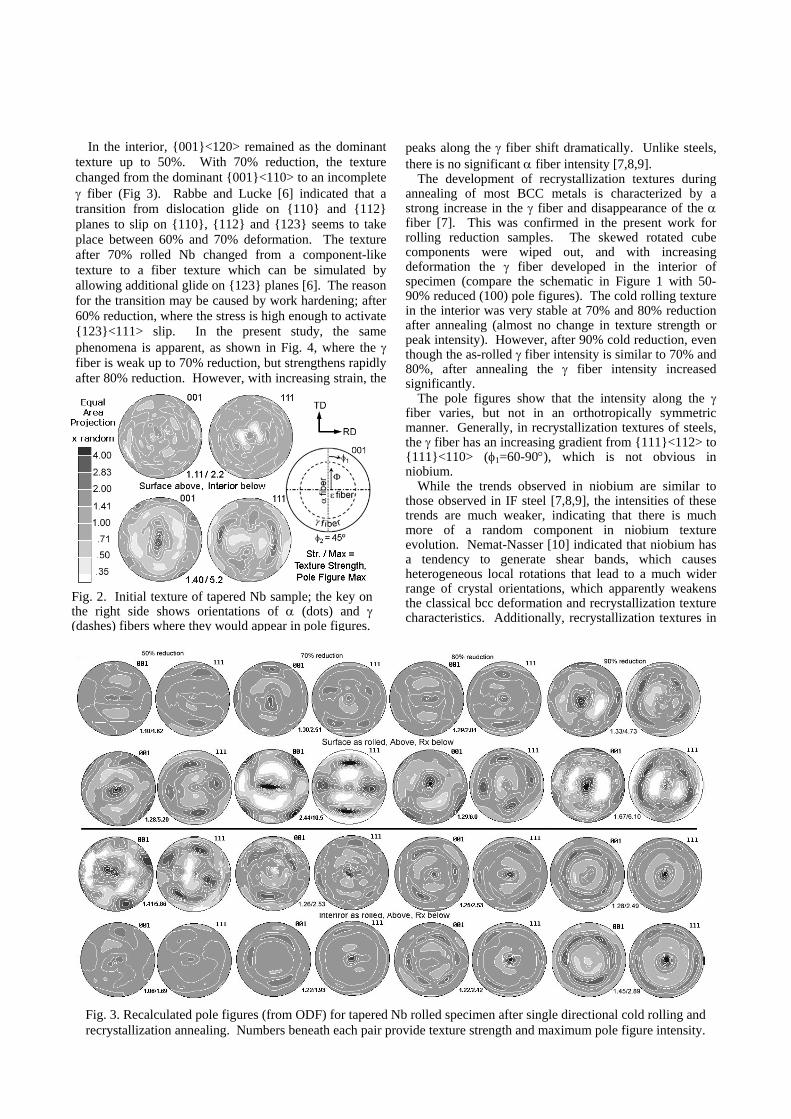
In the interior, {001}<120> remained as the dominant texture up to 50%. With 70% reduction, the texture changed from the dominant {001}<110> to an incomplete γ fiber (Fig 3). Rabbe and Lucke [6] indicated that a transition from dislocation glide on {110} and {112} planes to slip on {110}, {112} and {123} seems to take place between 60% and 70% deformation. The texture after 70% rolled Nb changed from a component-like texture to a fiber texture which can be simulated by allowing additional glide on {123} planes [6]. The reason for the transition may be caused by work hardening; after 60% reduction, where the stress is high enough to activate {123}<111> slip. In the present study, the same phenomena is apparent, as shown in Fig. 4, where the γ fiber is weak up to 70% reduction, but strengthens rapidly after 80% reduction. However, with increasing strain, the
peaks along the γ fiber shift dramatically. Unlike steels, there is no significant α fiber intensity [7,8,9].
The development of recrystallization textures during annealing of most BCC metals is characterized by a strong increase in the γ fiber and disappearance of the α fiber [7]. This was confirmed in the present work for rolling reduction samples. The skewed rotated cube components were wiped out, and with increasing deformation the γ fiber developed in the interior of specimen (compare the schematic in Figure 1 with 50-90% reduced (100) pole figures). The cold rolling texture in the interior was very stable at 70% and 80% reduction after annealing (almost no change in texture strength or peak intensity). However, after 90% cold reduction, even though the as-rolled γ fiber intensity is similar to 70% and 80%, after annealing the γ fiber intensity increased significantly.
The pole figures show that the intensity along the γ fiber varies, but not in an orthotropically symmetric manner. Generally, in recrystallization textures of steels, the γ fiber has an increasing gradient from {111}<112> to {111}<110> (φ1=60-90°), which is not obvious in niobium.
While the trends observed in niobium are similar to those observed in IF steel [7,8,9], the intensities of these trends are much weaker, indicating that there is much more of a random component in niobium texture evolution. Nemat-Nasser [10] indicated that niobium has a tendency to generate shear bands, which causes heterogeneous local rotations that lead to a much wider range of crystal orientations, which apparently weakens the classical bcc deformation and recrystallization texture characteristics. Additionally, recrystallization textures in
Fig. 2. Initial texture of tapered Nb sample; the key onthe right side shows orientations of α (dots) and γ(dashes) fibers where they would appear in pole figures.
Fig. 3. Recalculated pole figures (from ODF) for tapered Nb rolled specimen after single directional cold rolling and recrystallization annealing. Numbers beneath each pair provide texture strength and maximum pole figure intensity.
IF steelsrelease chas the driving recrysta
Fig. 5
90% cinhomog{111} teof howconsisterays. Tarises frstress co
The rrolling r70% cocenter oAll of stexture aof γfibreductio
[1] F Sm[2] H
SupNY
[3] H. JLet
[4] H. ProConIEE
{001} {112} {111} {110} {111} {111} <110> <110> <110> <110> <110> <112>
0
2
4
6
8
0 30 60 90
0
2
4
6
8
0 30 60 90
f(g)
φ1
γ fiberf(g)
As-received50% reduc.70% reduc.80% reduc.90% reduc.
Φ
α fiber
Fig.4. Texture changes in terms of α (left figure) and γ (right figure) fibers during annealing of giving
specimen after 80% cold rolling
can be accounted for based upon a strain energy riterion based upon elastic anisotropy. Niobium opposite elastic anisotropy as iron [11], so the force to favor particular orientations in
llization may be opposite or non-existent.
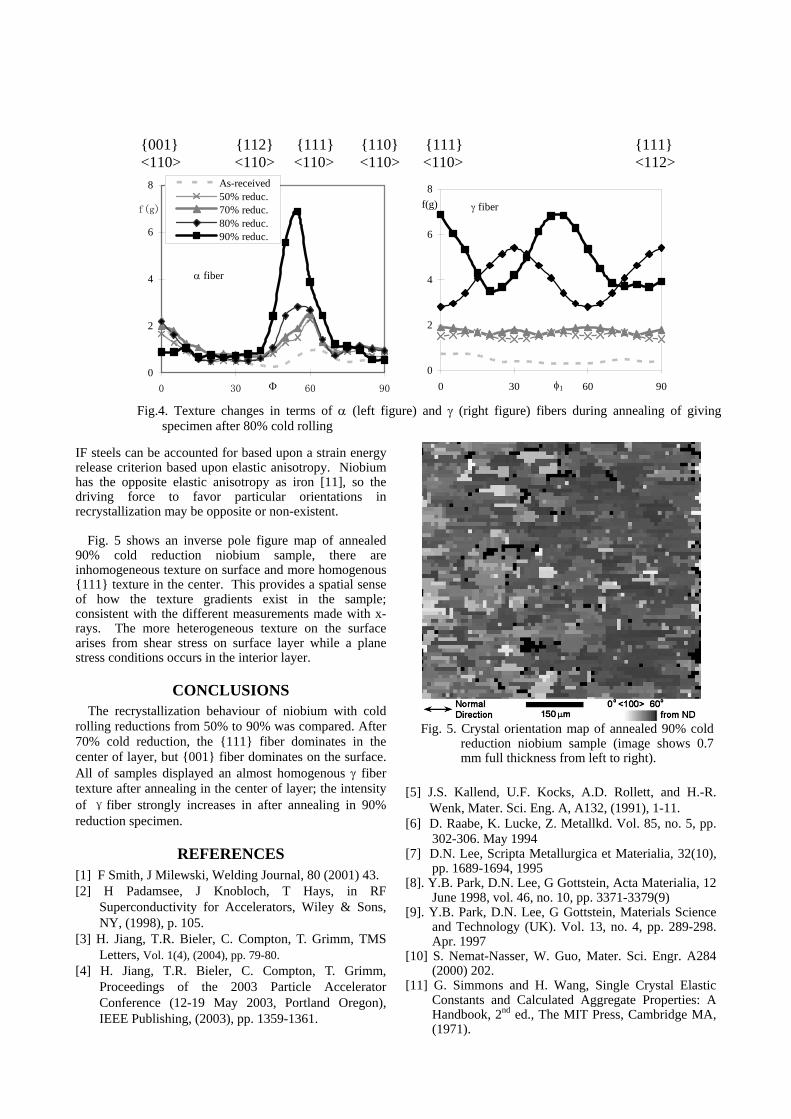
shows an inverse pole figure map of annealed old reduction niobium sample, there are eneous texture on surface and more homogenous xture in the center. This provides a spatial sense the texture gradients exist in the sample; nt with the different measurements made with x-he more heterogeneous texture on the surface om shear stress on surface layer while a plane nditions occurs in the interior layer.
CONCLUSIONS ecrystallization behaviour of niobium with cold eductions from 50% to 90% was compared. After ld reduction, the {111} fiber dominates in the f layer, but {001} fiber dominates on the surface. amples displayed an almost homogenous γ fiber fter annealing in the center of layer; the intensity er strongly increases in after annealing in 90% n specimen.
REFERENCES ith, J Milewski, Welding Journal, 80 (2001) 43. Padamsee, J Knobloch, T Hays, in RF
erconductivity for Accelerators, Wiley & Sons, , (1998), p. 105. iang, T.R. Bieler, C. Compton, T. Grimm, TMS ters, Vol. 1(4), (2004), pp. 79-80. Jiang, T.R. Bieler, C. Compton, T. Grimm,
ceedings of the 2003 Particle Accelerator ference (12-19 May 2003, Portland Oregon), E Publishing, (2003), pp. 1359-1361.
[5
[6
[7
[8
[9
[1
[1
Fig. 5. Crystal orientation map of annealed 90% cold
reduction niobium sample (image shows 0.7mm full thickness from left to right).
] J.S. Kallend, U.F. Kocks, A.D. Rollett, and H.-R. Wenk, Mater. Sci. Eng. A, A132, (1991), 1-11.
] D. Raabe, K. Lucke, Z. Metallkd. Vol. 85, no. 5, pp. 302-306. May 1994
] D.N. Lee, Scripta Metallurgica et Materialia, 32(10), pp. 1689-1694, 1995
]. Y.B. Park, D.N. Lee, G Gottstein, Acta Materialia, 12 June 1998, vol. 46, no. 10, pp. 3371-3379(9)
]. Y.B. Park, D.N. Lee, G Gottstein, Materials Science and Technology (UK). Vol. 13, no. 4, pp. 289-298. Apr. 1997
0] S. Nemat-Nasser, W. Guo, Mater. Sci. Engr. A284 (2000) 202.
1] G. Simmons and H. Wang, Single Crystal Elastic Constants and Calculated Aggregate Properties: A Handbook, 2nd ed., The MIT Press, Cambridge MA, (1971).