Coefficient of correlation
24
Coefficient of Correlation Linear Regression, Scatter Diagram, Coefficient of Determination, Pearson Product Moment Correlation Coefficient
-
Upload
juan-apolinario-reyes -
Category
Education
-
view
98 -
download
1
Transcript of Coefficient of correlation
Coefficient of CorrelationLinear Regression, Scatter Diagram,
Coefficient of Determination, Pearson Product Moment Correlation Coefficient

Linear Regression

Linear Regression
Why is it called LEAST SQUARES METHOD?
Linear Regression
Excel Demonstration to find regression equation
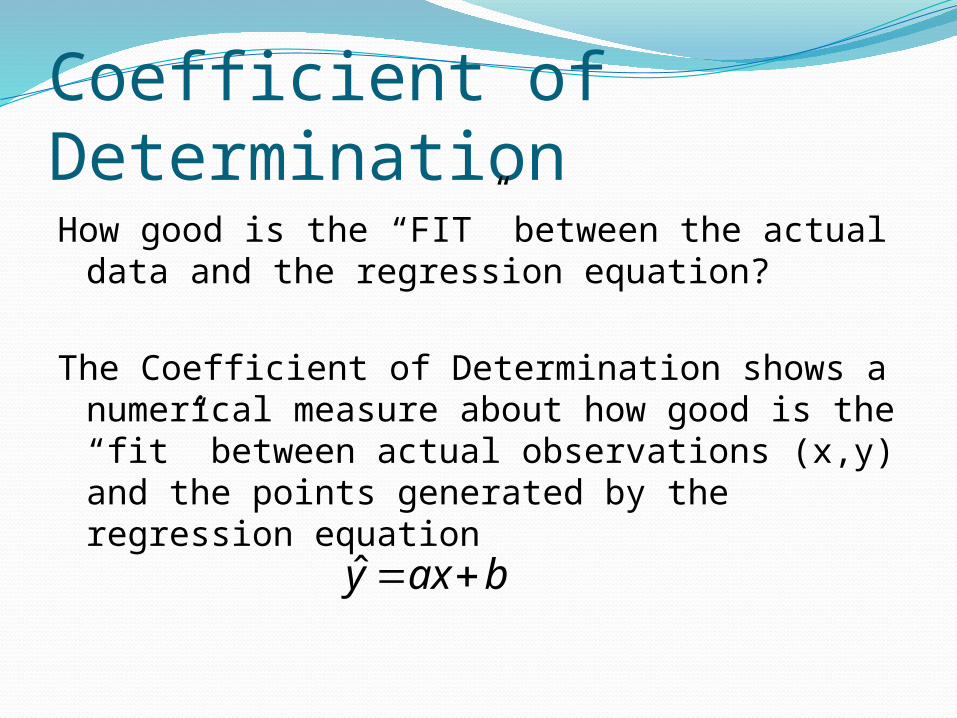
Coefficient of DeterminationHow good is the “FIT” between the actual data
and the regression equation?
The Coefficient of Determination shows a numerical measure about how good is the “fit” between actual observations (x,y) and the points generated by the regression equation
baxy ˆ

Coefficient of Determination
0.5 1 1.5 2 2.5 3 3.5 4 4.5 5 5.50
1
2
3
4
5
6
7
f(x) = 0.5 x + 1.3R² = 0.109649122807018
Axis Title
Axis Title
0 1 2 3 4 5 6 70
1
2
3
4
5
6
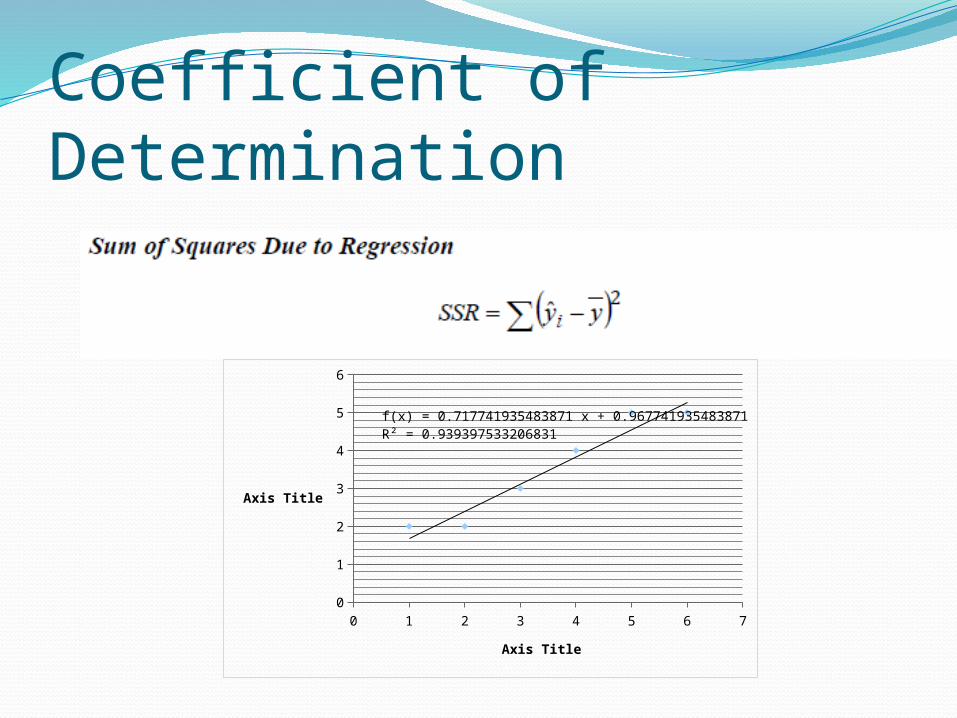
f(x) = 0.717741935483871 x + 0.967741935483871R² = 0.939397533206831
Axis Title
Axis Title
0 1 2 3 4 5 6 70
1
2
3
4
5
6
f(x) = 0.717741935483871 x + 0.967741935483871R² = 0.939397533206831
Axis Title
Axis Title

Coefficient of DeterminationThe symbol for the coefficient of determination
is
1,0)range( 22 rr

Coefficient of Determination
0.5 1 1.5 2 2.5 3 3.5 4 4.5 5 5.50
1
2
3
4
5
6
7
f(x) = 0.5 x + 1.3R² = 0.109649122807018
Axis Title
Axis Title 109.02 r
0 1 2 3 4 5 6 70
1
2
3
4
5
6
f(x) = 0.717741935483871 x + 0.967741935483871R² = 0.939397533206831
Axis Title
Axis Title 939.02 r

Coefficient of Determination

Coefficient of Determination
0 1 2 3 4 5 6 70
1
2
3
4
5
6
f(x) = 0.717741935483871 x + 0.967741935483871R² = 0.939397533206831
Axis Title
Axis Title

Coefficient of Determination
0 1 2 3 4 5 6 70
1
2
3
4
5
6
f(x) = 0.717741935483871 x + 0.967741935483871R² = 0.939397533206831
Axis Title
Axis Title
Coefficient of Determination
0 1 2 3 4 5 6 70
1
2
3
4
5
6
f(x) = 0.717741935483871 x + 0.967741935483871R² = 0.939397533206831
Axis Title
Axis Title

Coefficient of Determination

Correlation AnalysisHow strong is the “relationship” between the
variables x and y?
Coefficient Analysis shows the strength of relationship between x and y.
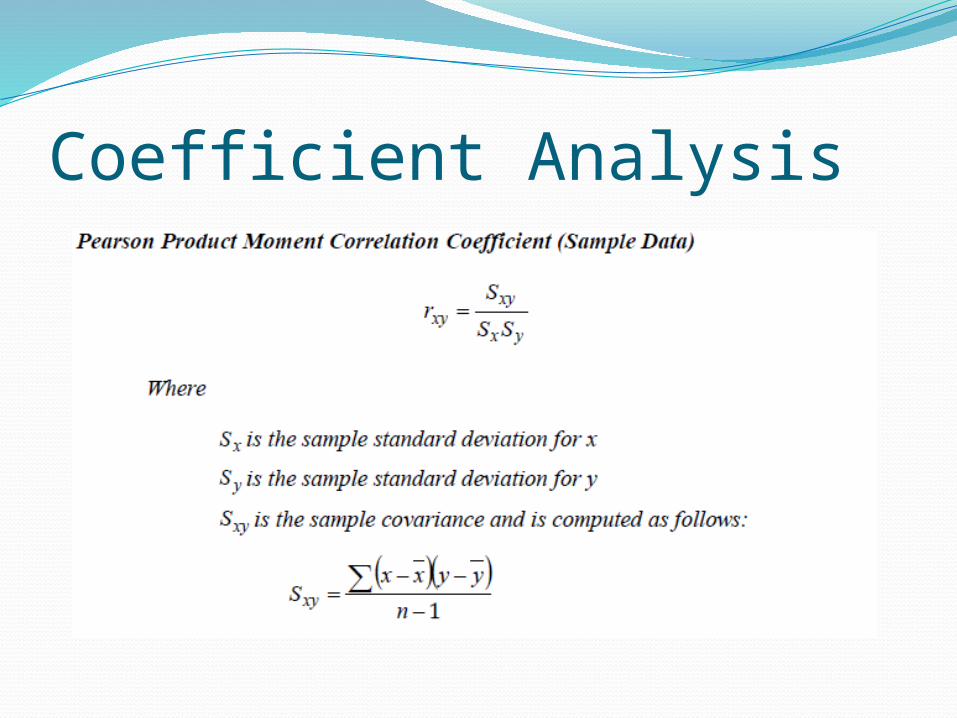
Coefficient Analysis

Correlation Coefficient

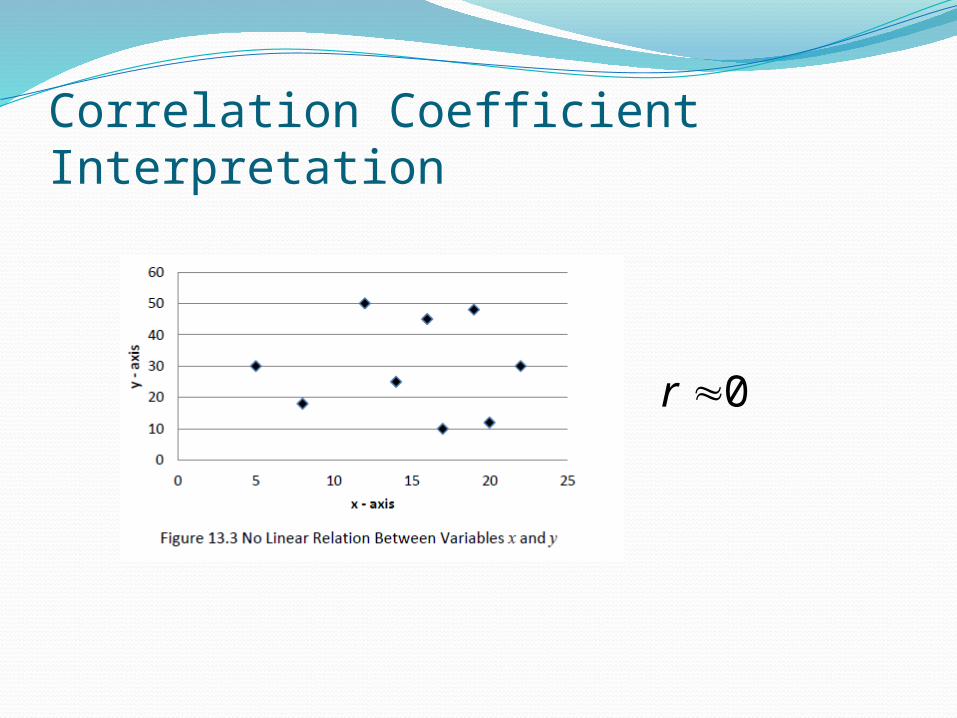
Correlation Coefficient Interpretation
10 r

Correlation Coefficient Interpretation
01 r
Correlation Coefficient Interpretation
0r
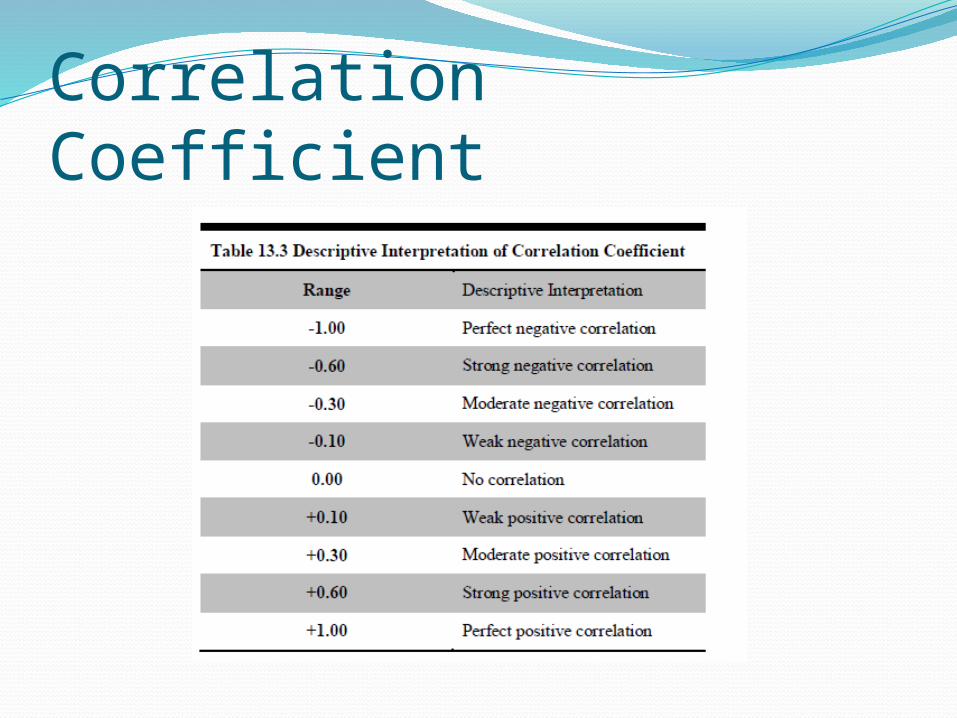
Correlation Coefficient

Correlation Coefficient

Correlation Coefficient

Correlation Coefficient

Final RemarksThe correlation coefficient r does not
necessarily indicate causation.
It does not demonstrate a cause-and-effect connection between variables.
It is a measure that demonstrates how frequently two variables x and y are observed to occur together.