coefficient. It..
17
TUNNEL TEMPERATURE STUDY D. Shuman SSC Central Design Group Conventional Facilities SSC-N-615 April 3, 1989 2. Cryostat shell Temperature 2.1. Thermal time constant 2.2. Installation and servicing considerations 3. Air temperature rise 3.1. DIstributed heat sources 3.2. Lumped heat sources 4. Appendix 4.1. Nomenclature 4.2. Convection heat transfer coefficient. It.. 4.3. Air -wall AT decay length * 4A. Cryostat shell thermal time constant. 4.5. Tunnel wall temperature 4.6. Niche heating 4.7. Tunnel heat sources 1 I 1 1 2 a 4 S 5 S I a 111 ii 12 1. InconilntAirlentuerature Decay Lenwth2 £=263 meters 4.8. DehumidifIcation requirements. 15
Transcript of coefficient. It..
TUNNEL TEMPERATURE STUDY
D. Shuman
SSC Central DesignGroup
Conventional Facilities
SSC-N-615April 3, 1989
2. Cryostat shell Temperature
2.1. Thermal time constant
2.2. Installation andservicingconsiderations
3. Air temperaturerise
3.1. DIstributedheatsources
3.2. Lumpedheat sources
4. Appendix
4.1. Nomenclature
4.2. Convectionheat transfercoefficient. It..
4.3. Air -wall AT decaylength*
4A. Cryostat shell thermaltime constant.
4.5. Tunnel wall temperature
4.6. Niche heating
4.7. Tunnel heatsources
1
I
1
1
2
a4
S
5
S
I
a111
ii
12
1. InconilntAirlentueratureDecayLenwth2 £=263meters
4.8. DehumidifIcation requirements. 15

Tunnel Temperature Profile 0. ShunianTunnel air andciyostat shell temperaturefunctionsare exploredin this note. Except in unusualsituations, the cryostatshell temperatureequalsthatof the surroundingair. During operation, nooutsideair is pulled into the tunnel,however, air is kept circulatingaroundthe tunnel to distributegeneratedheat. Temperature is a function of both the heat generatedin the tunnel andthe circulationvelocity. During maintenance,freshair is pulled into thetunnelat the exit/vent shaftsandexhausted atthe serviceareashafts.If this air is at adifferenttemperature from thatof the tunnel it will have to travela certaindistancebeforeit equilibrateswith the tunnel wall.
1. Incoming Air Temperature DecayLeng& £=263metersAs air at an initial outsidetemperature travels into the tunnel,it losesor gainsheat from the tunnelwalls which are essentiallyat a constant temperatureequalto thatof the surroundingrock until thethe temperature differencebetweenthe air and the wall is mm. This temperature differencefollowsan exponentialdecay function when plotted against distancefrom the air entry point, andthe decaylength is definedas the distancealongthetunnelfrom the air entry point at which the temperaturedifferencehasdecayedto 37% tIe of its original value.For thecaseof little or no heatinput fromcables,etc. into the tunnel air, the decay length is computedto be 263 utters, usingthe foilowingtunnelparametersasfollows:
1. Tunnel crosssectionradius, r = 1.5 meters2. Averagetunnel air speed,v = 0.5 in/s3. Thermal conductivity ofrock, k = 3.5Watt/meter°C.4. Convectionheattransfer coeff. thru wall, h = 1.6Watt/sq. meter°C.
The decaylengthformula and value for h arederivedin theappendix.Assumptions are that walltemperature remainsconstant over time andlength.Sinceair is to be pulled into the tunnel only formaintenance,and the thermaltime constantof the wall temperatureis on the orderof a year, thisassumptionholds true. SeetheAppendix,Wail Temp.Profile, for a discussionof this.
Daily temperaturechangesof theearthdo notpenetratefurtherthan3-4 ft. andannualsummer/wintertemperaturedifferencesare not seenat depthsof morethan 60-70ft. Earthtemperatureat SSCdepths hasbeenestimatedto be 66°F for SSCdepthsfrom Texasproposal,Volume7.
2. CrynstatshellTemperatureCryostatshell temperatureis essentiallythatof thesurroundingair. Heatlossto the80K shield isnegligible; thethermaltint constantis fairly short,andthesupportstandsdo not act asthermalshort circuits to tunnelwall or floor assumptionscheckedin appendix.
2.1. Thermal time constantCiyostacshell thermaltime constantis calculated,with the aboveassumptions,in theappendixtobe 4 hours.This is the time it takesfor the cryostatshell to respondto a suddentemperaturechangeof theambientair suchthatthetemperaturedifferencebetweenshell andambientreaches37% of the initial difference.Fasterthannormalair flows and/or condensation/evaporationonthe cryostatshellwill reducethis tint constant.Conversely,insulatingthe cryostatshell on theoutsidewill increasethe time constant
2.2. Installation and servicingconsiderationsFor structuralreasons,it may be desirableto bolt the magnetsrigidly to their support standsorfootings. The main ringdipolecryostatshell expands/contractsa distanceof 0.0058" betweenthesupport feet540" foot spacingfor each°C of temperaturechange.It is assumedthat themagnetswould be allowed to come to thermalequilibriumbeforebeingaligned andboltedrigidlyto their support stands.Therefore, the abovementionedcryostat shell thermal expansion
April 3, 1989 Page 1
propertieswill primarily beof concern where large air temperatureexcursionsmay occurnearexit/vent shaftsand to a lesserextent the entiretunnel generatedheat fluctuations andniches.Fresh air will be pulled into the tunnel only for installationandmaintenance.The CDRspecifiesa100kW heater at eachexit/vent shaft,but no coolingprovisions. The heater is sufficient to raisethe temperature24°C, which shouldbe adequatefor servicinginmostwinter conditions.Thereforethe supportstandsneedno contractioncababiityunlessthe capability forwithstandingcryogenleaksisto be incorporated. For summer conditions where servicingis tobe caniedout on a continuous basis for severaldaysormore,magnetsupportsin these areasmust either be designedto allow for shell expansion,or the air can be heated/cooledand/ordehumidifiedas it enters the tunnel. It will require32 tons of refrigeration =32 kW power plus38 kW heating to bring outside air at 85 °F and 60 % RH to 65 °F and60 % RH avengesummerconditions. Seeappendixfor other conditions.
Rigidmagnetsupports withoutfull expansion/contractioncapability might be feasibleunder the following conditions:
For short servicingperiods, or for dayftight air temperatureavengeswhich are closetothe rock temperature of 66°F, magnetcryostatsnearthe air entry point could be coveredwithinsulation if servicing periodswere kept short. For high avengethy/night temperatures, thetunnel could be ventilatedat night whenthe air is coolest,then this tunnelair could be circulatedduring the thy, without fresh air intake hot. Two days worth of fresh air can be stored in thetunnel if it is assumedthat serviceis occurring at only onepoint in the tunnel e.g.a magnetchangeout.The tunnel is 280,000ft long so if air velocity is 1.5 ft/sec. it will take51 hours forair to circulatearoundthe entire cofflider tunnel. Similarly, it will take5.5hours to charge thetunnel with fresh air from eachexit/vent shaft,unlesshigherthannormalair velocity is used.
Air temperatures at the current SSCsite canrange from 112°Fto -8°F which is a ÷46°,-74° F temperatureswing from 66°F. Avenge daily temperatures computedas an avengeofthe monthly averagemaximum andminimum are above65°F 6 months of the year, andabove80°F for 3 months, reaching 85°F in July. This would represent the maximum temperature of aninsulated cryostat shell thermal time constanton the onler of a day. This information is fromthe DEIS.
A note of caution: Any scenariowhich relies on air temperature control to limit cryostatexpansionhas an inherent risk, in that emergencysituations suchas a tunnel cave-in,fire,medicalemergency,cryogen spill, etc. may require continuous ventilation for long periods oftime, andit would be a shame to have realign,or possiblyevenreplace large numbersof magnetsand/or magnet standsdue to this one-tint occurrence. It is thereforesuggestedthat themagnetMagnetstand assemblybe designedto be damageresistant, if not re-alignment resistant,to the maximum temperatureexcursion thatmay occur. Alternatively, ventilationintakescan beprovided with full heat/cool/dehumidification capability with backup or emergencypower.
3. Air temperature riseAir temperaturerise occursfrom both distributed heat sourcessuch as cablesand lights, andfromlumped sourcessuch as electronics niches. Shown on the next page is a chart showing varioustunnel air heat sources,the estimatedpercentageof heat which finds its way into the tunnel air andtheir combinedeffectson air temperature.Lumpedsourcesare avengedalongthe tunnel for thisanalysis. The totalsoccuronly betweenserviceareasE andF and betweenG and H, as can be seenfrom the 35 kV feedermain distributed heat sourcediagramon page 12. Not all the heat generatedfrom these items will find its way into the tunnel air, as some itemssuch as lights and cablesaremounteddirectly to the ceiling andsomeheat transfer through direct conduction occurs. There isalsoa laminar boundarysublayer or film of air next to the tunnel wall which doesnot mx with thebulk tunnel air, however this layer is only 3-4 mm thick which is negligible.
April 3, 1989 Page 2

MAXIMUM TUNNEL HEAT LOADS
IUNNEI.APTEW. RISE
________________ _______________ _____________
*0-_______ AVG OK C
_______________
[24.6 41.3 38.8 1.8 2,8 2.6 I
Assumingsteadystateconditions,andalocationseveraltempdecaylengthsinto the tunnel; anyheatflow into the main airsu’eam will causearise in air temperature until heatflow out throughwall convectionmatchesthe inflow. This steadystatetemperature rise of bulk tunnel air issimply:
= hAT-T = h2mrNF or
=2xrh
= 2iv1.5 meters1.6Wattm°C
= l5- totunnelairtoproduceal°Cairtemprise
Heatingvaluesfor thesesourcesarederivedin the AppendixunderTunnel Heat Sources.
QMEGRYITEM
fUNIfPOWER 0t UNrI POWER 01St % lIT WATTAETERkW PSR waIt/mstsr .,AIfl ... AM
j mstsr
________________ _______________
fAvGfl -- SRVC - AVG PKWC AVG Pic VC1UNNELIOTAL
1UNILOI5TRSJTEDTOTAI.
125.8 44.3 41.6 I1l2.6130.4124.4I Iii .3J27.312i .a
3SKVSO £OOMCMCA8LEA ID 24.2 to ao 0 21.9 935 KY 30500 11CM CAB&.EB 2.5 6 2.5 90 2.25 5.4 2.25¶3.8KV 30 50081CM CABLE 0.1 0.1$ 0.18 00 0.09 0.18 0.1$480V 25011CM CABLE maginl ssaøn w.nnup 0 0 11.7 80 0 0 10.5120/240V CABLE 0 0 ao 0 0 0TPN1PJS 0 0 90 0 0 0HEIJJMLEAWRETtWIPFE 0 0 0 90 0 0 0OlC19ATCNFfl4AP 0 0 0 100 0 0 0EVARATUFMWALLSEFAGE 0 0 0 100 .0 0 0
mr*ELWI.cWTOmL 113.2113.0117.21 J13.2113.9Il5.9Lflfl 0.1 30.5 0 0 3.28 90 0 0 2.95CIELECTtN1CSSIBTOTM_ I y.54 2.54 2.541 229 [11.1 11.1 11.1 1100111.1 11.1 11.1
E.ECTC 2.5 2.5 2.5SERVIcE TRANS. 480-120.240 0.04 0.04 0.04
PY4ERM.’&A0OTCWALW81tTM. I 2.18 2.9 asI 1031 [LII 2.82 2.821100 12.11 2.82 2.82TRANS.. 13.$kV.440V.500KVA l.5%J 2.18 2.9
3.1. Distributedheatsources
April 3, 1989 Page 3

3.2. Lumped heat sourcesCurrent thinking is to locate mostof these sourcesin tunnelniches or alcoves,as shownbelow.Thesenichesoccurevery cell, 228metersand contain electronicsand power supplies forcorrectionelements,beamposition monitors,radiatIondetectors,etc.Somenichesalsocontainstep-downpower transformersanddistributionpanels.It is shown in the appendixthat theseniches,if enclosed,are not self-coolingandrequireactiveheatremoval.We assumehere thatpart of the tunnelair is divertedinto the niche or alcoveto cool these heat sourcesand the returnflow back into the tunnelis well mixed into the main air streamand doesnot impinge directly onthe cryostat shells. Theseniche fan! might alsobe usedto keep tunnelair circulatingduringoperation, asis doneat Fermilab, which is necessary to avoid hot air recirculationback into theniches. Shaft fans axeonly usedfor tunnelintake/exhaust.Note that other methodsof coolingtheselumped sourcesmayobviate theneedto keeptunnelair circulatingduring operation, at leastfor heat removal purposes.
",2TunneI Niche Model//
The temperatureriseof the tunnelair immediatelydownstreamof the niche is then a simpleenergybalanceon a tunnelcontrol volume of air. The formula andan examplefor a typicalelectronics niche is:
pcva= kWJ
l.177O.5E1tl.5m1
AT CC = qkW.239 = 2.5.239= 0.6 C
I,
April 3, 1989 Page4

4. AppendixAssumptions usedare as follows:
1. Tunnel diameter =3 meters2. Avenge air velocity = 0.5 rn/sec3. Tunnel rock or cementwall heat conductivity, k = 3.5W/m°K4. Dry tunnel walls, andno condensationfrom humid air.
All numbered formulas and values other than thosederivedhere, or otherwisenoted ate from J.P.Holman, jjj Transfer. 4th ed.
4.1. Nomenclature
a = crosssectionalarea of tunnel
[3 = volume coeff. of expansion1/fla = thermaldifflisivity k/pcc, c = heat capacityat constantpressureGr =Grashof#Gr modifiedGrashof#Gr1Nuk = thermal conductivityh = surfaceheattransfer coefficient convection
V = kinematic viscosityp = densityPr =Prandtl#r = tunnelcross-sectionradiusRe = Reynold’s 4*
= Temperatureat tunnelwall
q =dQ/dtQ = heatenergy
4.2. Convectionheat transfer coefficient.It
1. Reynolds #, air flowing through tunnel;
Re= where d=tunneldia. =3mV
v=avg.airvelocity =0.5?
v = air kinematic viscosity = 16.84 x 10’ !_ table A-S. Holman
= 30.5= 89,000 indicates fully turbulent flow
16.84x10
April 3, 1989 Page 5

2. Tunnel wall surface heat transfer coefficient, h:
Nu = .023 Re2Pr4
Pr = .708; k = .0262!?i_rot
kNuh d
4.3. Air -wall AT
Nu = .023 89,00027084
Nu= 182=!
1’2mt
.0262 182
3m
Considera sectionof tunnelaspicturedhere:
Heatbalance:
Heatflow
qx = qx+dx +d.-dq
qx = c.pvaTx
qx+dx = yva Tx+dx
c7pvaTx
orCdx
q x+dx
x+dx
dq =2xthr.-Tdx
dqg = tit; where = heat/unitlengthproducedfrom cables,etc.
= cpvaTx+dx + [2vrficr1 -Tv-
dx
- Tx+dx-Tx - w
- dx
6-4,Holman
tableA-S. Holman
decaylenath:
sscComdatunnel section
April 3, 1989 Page6
let Q=T,-TW; A= 2irrh s =-____
cpva c,pvathen dO=dT,
and
dO
integratingboth sidesgives:
= -Ax + C2
exponentiating both sidesgives:nfqi ,-. -Ax‘-it A’-P
for x =0, and =0 no heat generation:C A
ec,=.L=T1Tw T1=initialairtemp
or: o4T3x = T+OcTwkM +
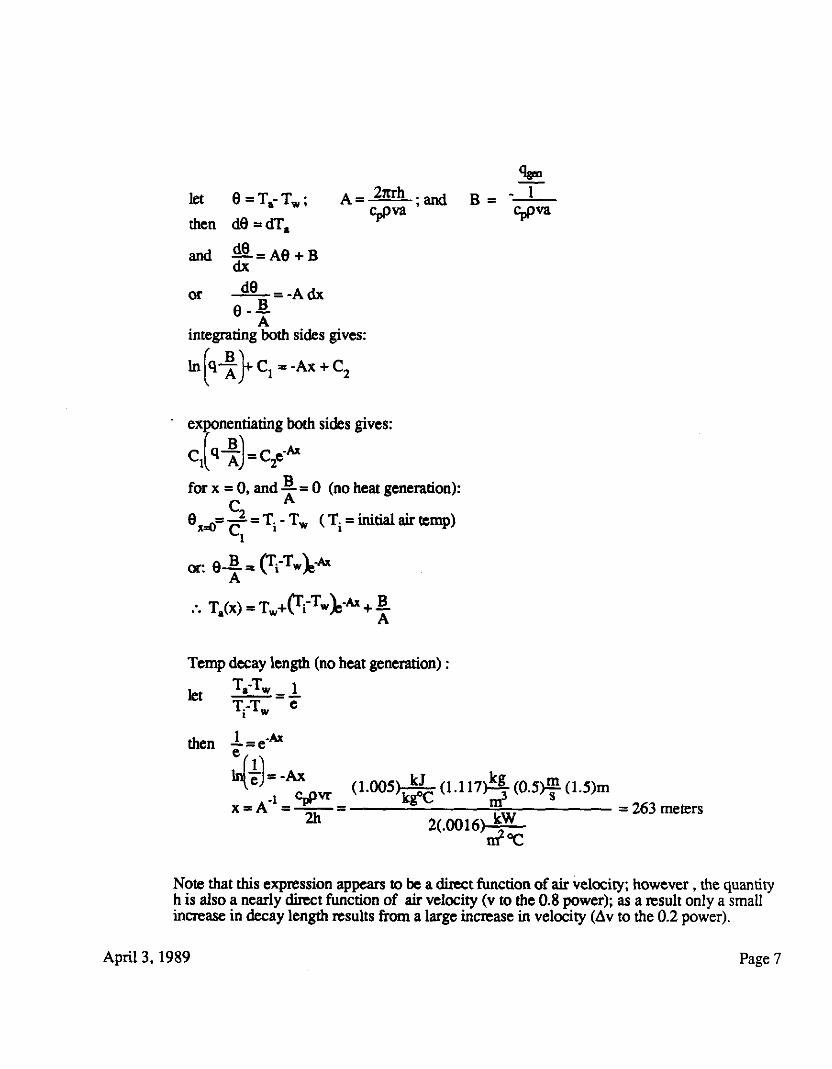
Tempdecaylength noheat generation:T5-T,
=
t-T e
then
kJ kC.QVr °‘°°5kCC l.ll7_ 0.51! l.5m
x=A = ‘‘ = 111 =263meters20016 kW
m20c
Note that this expressionappearsto be adirectfunction of air velocity; however , the quantityh is alsoa nearly directfunction of air velocity v to the 0.8 power; as a result only a smallincrease in decaylengthresults from a large increase in velocity Av to the 0.2 power.
April 3, 1989 Page7

We canmakethe assumptionthat both the wall temperatureand surfaceheattransfercoefficientthroughthewall Ii, stayfairly constantover time. The wall temperatureassumptionis shown to be true elsewherein the appendix.The heat transfer coefficient is onlya weak function of temperature difference,andis bestassumedconstant for this analysis. Ifpresent, humidity or tunnel seepagewould have an appreciable effect on wall temperature.The tunnel is expectedto be thy, however, andwill be lined if water is presentfmmconversationwith DaveGoss.Dehumidification is expectedto be provided for condensationcontrolandestimatedrequirementsarecalculatedin the last sectionof this appendix.
4.4. Cryostat shell thermal time constant
1. Lumped mass criterion:
where:
h = convection heat transfer coeff. = 1.6 W
k = conduction " = 55 W low carbon steelm°C
V = volume,cryostatshellA = area,cryostatshellt =shellthickness=.635cm
for a thin-walledcylinderof radiusr, length1 andthicknesst:V.. 2ivrtl
-t andlit- l.6.00635- 00018.01
A2ivrV k 55 -.
uselumpedmassanalysisnegligiblethermalgradientacrossthickness
2. Time constant, using lumped masssolution:
oman
where: c= heatcapacity,steel =465kg°C
p=density,steel =7833.j
kJ kg.465IL oc 7833! 1.00635m
" / =14.445s=4hours
__
‘a1.6J °°1T
April 3, 1989 Page 8

3. Supportstandthermalresistancerelative to airl:For what length of cryostatis the conductionthermalresistanceto the stand equalto loxthe convectionthermalresistanceto tunnel air?
L = magnethalf length = 8.2 m= cryostatthickness= .25" = .00635m
d = cryostatdia. = 24" = 0.61 m
k=
tableA-2, Holman
h=2.22 ascomputedbelowm°C
cryostat convection heat transfer coefficient, it
Nu = qur Prj’ 7-25,Hoirnan
gRA1Dd3= 9.84k to .612
= 183 x to6 7-21,HoimanV 16.84x
Pr = .708 table A-S. Holman
GrPr= 183x io6andC=0.53; m=.25 table7-1,Holman
Nu =O.53183E6Y=62 =j
k = 0.026m°C table A-5
h-62’6--222w
- .61 - m2°C
therefore:
Rk=é?5.=Axll 1=10h= =10 1
ka kkzdt h,vdLkt 54.00635
or zx=lO KU = 2.228.2 =.Ol9m
April 3, 1989 Page9
Thus even for a very short cryostatconnectedto athermalgroundif the standcouldevenbe assumedas one,the thermalresistanceto air is still an orderof magnitudeless,thereforecryostatshell temperaturecomesto equilibriumwith theair only.
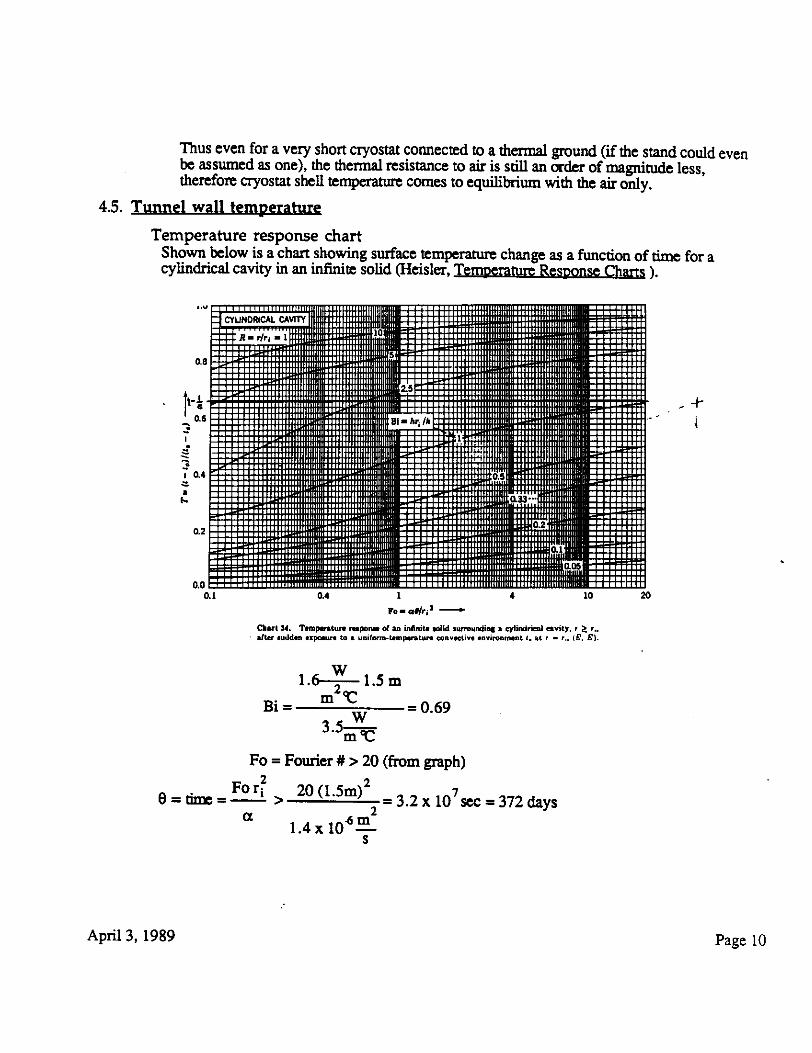
4.5. Tunnel wall temperature
Temperature responsechartShown below is a chartshowingsurfacetemperaturechangeasafunctionof time for acylindrical cavity in an infinite solid Heisler,TemperatureResnonseCharts.
________
CYLiNDRICAL CAVITY
______ ______
Rsr/rt.1
_______ _______ _______
0.8 -
__________
1t-.
____. _ ___
0.6:
___ ____
:
7a4
____ _____ __________
I
_____ _____
I..
_____ _____
0.2
_______ _________ ___
06::
0.1 0.4 1 4 10 20
Fea*1r11
CM,’ 31. T.mpentun rnpor of an inAnit. toDd sisrouSing * cylisriS cavity. r r..
alter .udd.n *xpun to a unhlonn-tmr.p.ntIstt coayectâve *nviroament I. atr-r.. B. B.
1.6-’" 1.5mmtBr= =0.69
nit
Fo=Fourier#>20fromgraph
0.For 201.5rn232x107372thys
1.4xlO -
S
April 3, 1989 Page 10

4.6. Niche heating
enclosedniche: convection cooling to niche wall; fan coolingAssumean enclosedcubic niche3x.3x3 meters,with sufficient fans on the electronics tothoroughly mix the heat and air. Assunr further that the walls remain at constant temperature65°F. The air temperaturerise at steadystateconditions is:
q=hthT oraT== w25°’ 2
=23°C=41.6°F2 63x3mnit
The air temperatureis thus at least 65+41 = 106 °F and possiblyhigher as wall temperaturewill slowly rise over time. In addition, the elecnvnicsthemselvesrun appreciablyhotter thanthe cooling air. It is expectedthatthese temperaturesare too high for reliability andthat thenicheheat must be activelyremoved.
April 3, 1989 Page 11
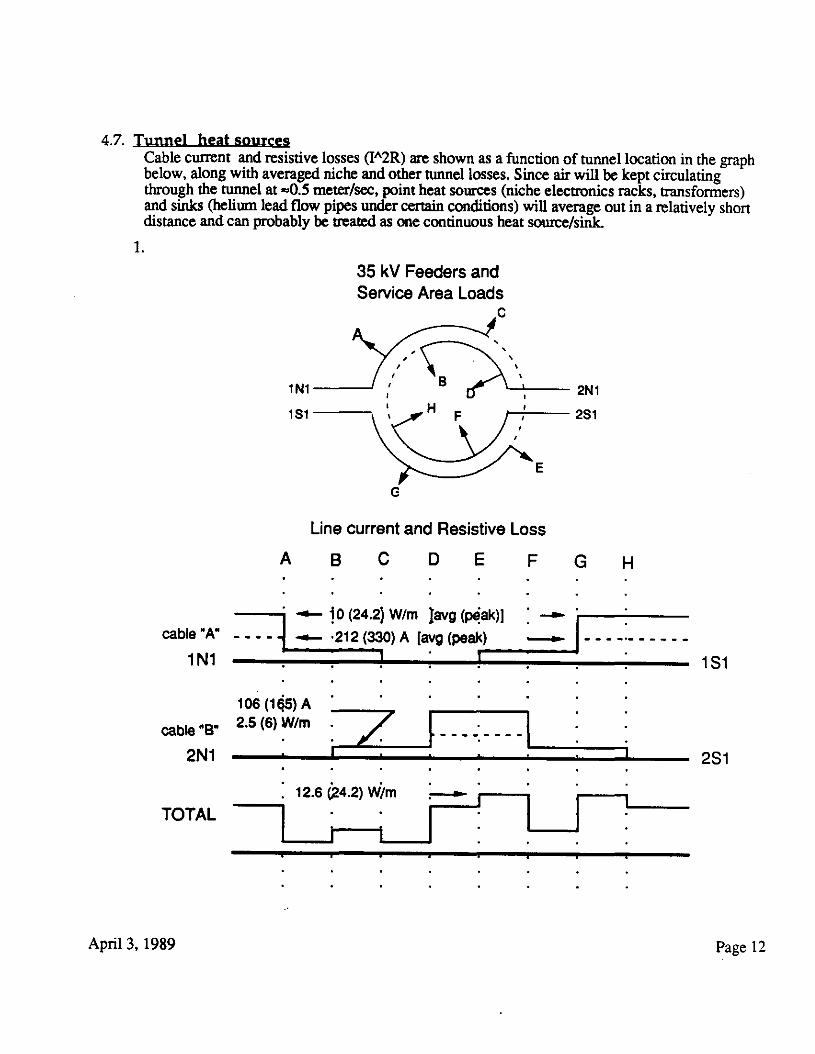
4.7. Tunnel heat sourcesCableculTent and resistive lossesF2R are shown as a functionof tunnellocation in the graphbelow, along with averagedniche and other tunnel losses.Since air will be kept circulatingthrough the tunnel at -0.5meter/sec,point heat sourcesnicheelectronics racks, transformersandsinkshelium lead flow pipesundercertainconditions will averageout in a relatively shortdistanceandcan probably be treatedas one continuous heat source/sink.
I Ni
I Si
35 kV Feeders andService Area Loads
C
Line current and Resistive Loss
2N 1
251
A B C 0 E F G H
cable A" - - - -
1N1
cable0B"
2N1
0 24.2 W/m Javg péak1.212330A [avg peak
---I
- -
10615A2.56W/m ./" j*
:
12.6 24.2 W/m
__
IS_ITOTAL .
1.
G
1S1
2S1
April 3, 1989 Page 12

2. Cable heatingThese 35 kV 500MCM triplex cablesare the dominantcableheating sourcein the tunnel.FullCurrentheatingvaluesfor each cable in the nearclustertunnelsectorturnoutto be 10,0Watt/meter for averageloads,and24.2Watt/meterduring peakpower demand.Even so,thisrepresentsnegligible air temperature rise. Of more interestis the temperatureof the cablejacket, forsafetyreasonsduring servicing.
2.1. Power usageper sector from SSC-N-282,Conventional SystemsParametersP=5.7MWavg;8.91MWpeak
line current per sectot 1= 106 A avg; 165 A peakat sectorsF2,F3,F7, andPS: I = 212 A avg ; 330 A peak
2.2. Delivered power: line current:P =ñElcos$
E = load voltageI = line currentcos $ = powerfactor
or
/5 E cos$
2.3. Cable resistance:
L .66x10r39.37rR 500MCM conductor,20 °C= Pr
= In= 66.2-
ii 2 rn
k500x 10
temperaturecorrectionto 50°C:
R = R0ccaT+l = 66.2E-6.003930+l= 1.11766.2E-6 a2.4. Feeder heating
q=312R
for cable"A", near cluster, avg operatingcond.= 3212274E-6= 10.0
cable"A", near cluster, peak operating= 3330274E-6= 24.2
April 3, 1989 Page 13

3. Cable surface temperature
q=haATorAT= qh,cd
d=cabledia.=4.3" = .llm
q=23.3
tofindh,firstassumeAT=10°C; then;
Nu = QOr Prtm 7-25,Hoirnan
Gr=gJ3AT d3_ 9.81k 10 .112
= 1.4 x 10 7-21,Holman
16.84x101
Pr=.708 table A-5,Holman
GrPr= 1.Ox 10andC=0.53; m=.25 table7-1,Holman
Nu =O.531.0E7Z =30 hd
k = 0.027m’C table A-5
______
W- .11 - m2°C
= 23.3= 9.2°C ATassumption correct
7.4ir.ll
This representsexterior temperature rise for a cable mountedhorizontallyin open still air.For a ceiling or sidemountedcable, lessconvection,but more conduction heat losswilloccurandthe temperature is estimatednot to differ substantially.
April 3, 1989 Page14

4.8. DehumidificatIonreouirementsThe DEIS statesthatavengemonthlymaximumdewpointtemperaturesare66-67 °F for July andAugust. Howeverit is not uncommon for higher dewpointsto occur,and Dave Gosshasestimated 105 °F 70 % Relative Humidity asa likely maximum. This is equivalent to a95°Fdewpoint. 80% RH 65 °F is probably the highesthumidity that the electronicsandcablesin thetunnel should seedewpoint=59°F.Powerandheatingneedsarecalculatedhere, using atypical refrigerationcycle of coolingthe air to condenseout the water, then reheating slightly tolower the RH. Swamp coolers won’t work due to high RH. Dessicantsystemsmay be analternative.
Processand psychrometric chart
S
I1I
air massflow rate, th=pva=m
IIftS
I
Mold air
April 3, 1989 Page15

Outside air 85 °F; 60% RB to tunnel air at 65 °F; 80% RH
h*1=35 ; h*3=26 fromflgB-13a,Holman
h*1 h*3= 25.5-37.5 = -11 = -25.4!
25.44.16= 106kW = 22.3tons refrig.hp kWmech. power req. = 1 andelecir. power req. = 1
electr. pwr. req. =22 kW
14 kW reheat
Outside air 85 °F: 60% RH to tunnel air at 65 °F; 60% RH
h* -35!!!.. h*- lbm’ r lbm
h*1h*3=2137.5 =-15.5
364.16= 149 kW = 31.5tons refrig. = 313kW power req’d.
h*4h*3 =2521=4=9.4L=38kWreheat
Outside air 95 °F; 60% RH to tunnel air at 65 °F; 80% RH
10’ =46.! h*1 ibm’ lbm
h*1h*3=25.546 =-20.5 47!
474.16= 197 kW = 42 tons refrig. = 42kW power req’d
Outside air 105 °F; 70% RH to tunnel air at 65 °F; 80% RH
h* =63!!!i 10’lbm ibm
h*1.h*3=25.563 =-37.5 a!. =-87ibm kg874.16= 362kW = 76 tons refrig. = 76 kW power req’d
April 3, 1989 Page16