Coding Ants: Using Ant Colony Optimization to …mueller/papers/codingAnts_utah_2012.pdfCoding Ants:...
4
Coding Ants: Using Ant Colony Optimization to Accelerate CT Reconstruction Eric Papenhausen, Ziyi Zheng and Klaus Mueller Abstract –There is no one size fits all solution when it comes to CT reconstruction. Many different CT reconstruction algo- rithms and implementations have been devised in an attempt to solve the problem of producing an image under a specific set of constraints. One optimal CT reconstruction implementation can look very different from another optimal implementation; depending on the data, quality, and time constraints. In this paper, we present a framework that is able to dynamically create and compile new implementations that optimize the multiple objectives contained in CT reconstruction. We then show the results of this framework when applied to a GPU accelerated version of the FDK back-projection algorithm. Index Terms—CT reconstruction, GPU, ant colony optimization, Filtered backprojection I. INTRODUCTION Any CT reconstruction algorithm can be identified as a mul- ti-objective optimization problem. The optimal result will provide the highest quality reconstruction in the shortest time. Many algorithms have been developed and extended, and good parameter settings have been identified to solve this problem under specific conditions [1][4][7]. However, if the boundary conditions change (i.e. noisier projections, different numbers of projections, stricter time constraint, anatomy and pathology, etc.), the existing implementation is rendered sub-optimal, and in some cases, useless. In this paper, we use swarm optimization to determine an optimal CT reconstruction implementation for any given set of parameters. More specifically, we use the ant colony optimization algorithm to find an optimal implementation of a GPU accelerated FDK back-projection, described in [5]. In this paper, we begin in Section II by discussing relat- ed work. Section III gives a brief description of the ant col- ony system optimization algorithm. Section IV presents the details of the coding ants framework. Section V gives a brief description of the graphics hardware used in our experi- ments and the structure of a CUDA program. Section VI presents the results of our experiments. Section VII presents future work and Section VIII concludes the paper. Eric Papenhausen, Ziyi Zheng and Klaus Mueller are with the Computer Science Department, Stony Brook University, Stony Brook, NY 11777 USA(e-mail: {epapenhausen, zizhen, mueller}@cs.sunysb.edu). II. RELATED WORK Recent work has focused on finding good algorithmic pa- rameters for iterative CT reconstruction [9]. Parameter tun- ing is critical in finding a good balance between image qual- ity and reconstruction speed. The use of GPUs in accelerat- ing CT reconstruction has also become very popular in de- creasing reconstruction time [5][8][10]. However, not all GPUs are created equally; and there are many parameters to consider when creating a GPU accelerated program. Whereas [9] focused on tuning algorithmic parameters, we focus on tuning system level parameters. Our optimiza- tions come from creating a framework that will find an op- timal implementation by directly manipulating source code. The optimal implementation may change across different machines and this framework will be able to produce a ma- chine dependent optimal implementation without direct pro- grammer intervention. III. ANT COLONY SYSTEM The ant colony system optimization algorithm is a part of the family of swarm optimization algorithms. It is a modifi- cation of the ant system algorithm which was designed to mimic the way ants find the shortest path from the ant nest to a food source. Initially ants will choose paths randomly. Once an ant finds food, it will travel back to the nest and emit pheromones so other ants can follow that path to the food source. As other ants follow the pheromone trail, they emit pheromones as well which reinforces the trail. After some time, however, the pheromone trail will evaporate. Given multiple paths to a food source, the pheromones on the shortest path will have the least amount of time to evap- orate before being reinforced by another ant. Over time, the ants will converge to the shortest path. The ant colony system was presented in [2] and was ap- plied to the traveling salesman problem. It modifies the ant system algorithm [3] in several ways to lead to a faster con- vergence rate. After an ant crosses an edge, the pheromone value of that edge is decayed according to equation 1:
Transcript of Coding Ants: Using Ant Colony Optimization to …mueller/papers/codingAnts_utah_2012.pdfCoding Ants:...

Coding Ants: Using Ant Colony Optimization
to Accelerate CT Reconstruction
Eric Papenhausen, Ziyi Zheng and Klaus Mueller
Abstract –There is no one size fits all solution when it comes to
CT reconstruction. Many different CT reconstruction algo-
rithms and implementations have been devised in an attempt to
solve the problem of producing an image under a specific set of
constraints. One optimal CT reconstruction implementation
can look very different from another optimal implementation;
depending on the data, quality, and time constraints. In this
paper, we present a framework that is able to dynamically
create and compile new implementations that optimize the
multiple objectives contained in CT reconstruction. We then
show the results of this framework when applied to a GPU
accelerated version of the FDK back-projection algorithm.
Index Terms—CT reconstruction, GPU, ant colony optimization,
Filtered backprojection
I. INTRODUCTION
Any CT reconstruction algorithm can be identified as a mul-
ti-objective optimization problem. The optimal result will
provide the highest quality reconstruction in the shortest
time. Many algorithms have been developed and extended,
and good parameter settings have been identified to solve
this problem under specific conditions [1][4][7]. However,
if the boundary conditions change (i.e. noisier projections,
different numbers of projections, stricter time constraint,
anatomy and pathology, etc.), the existing implementation is
rendered sub-optimal, and in some cases, useless.
In this paper, we use swarm optimization to determine
an optimal CT reconstruction implementation for any given
set of parameters. More specifically, we use the ant colony
optimization algorithm to find an optimal implementation of
a GPU accelerated FDK back-projection, described in [5].
In this paper, we begin in Section II by discussing relat-
ed work. Section III gives a brief description of the ant col-
ony system optimization algorithm. Section IV presents the
details of the coding ants framework. Section V gives a brief
description of the graphics hardware used in our experi-
ments and the structure of a CUDA program. Section VI
presents the results of our experiments. Section VII presents
future work and Section VIII concludes the paper.
Eric Papenhausen, Ziyi Zheng and Klaus Mueller are with the Computer Science
Department, Stony Brook University, Stony Brook, NY 11777 USA(e-mail:
{epapenhausen, zizhen, mueller}@cs.sunysb.edu).
II. RELATED WORK
Recent work has focused on finding good algorithmic pa-
rameters for iterative CT reconstruction [9]. Parameter tun-
ing is critical in finding a good balance between image qual-
ity and reconstruction speed. The use of GPUs in accelerat-
ing CT reconstruction has also become very popular in de-
creasing reconstruction time [5][8][10]. However, not all
GPUs are created equally; and there are many parameters to
consider when creating a GPU accelerated program.
Whereas [9] focused on tuning algorithmic parameters,
we focus on tuning system level parameters. Our optimiza-
tions come from creating a framework that will find an op-
timal implementation by directly manipulating source code.
The optimal implementation may change across different
machines and this framework will be able to produce a ma-
chine dependent optimal implementation without direct pro-
grammer intervention.
III. ANT COLONY SYSTEM
The ant colony system optimization algorithm is a part of
the family of swarm optimization algorithms. It is a modifi-
cation of the ant system algorithm which was designed to
mimic the way ants find the shortest path from the ant nest
to a food source. Initially ants will choose paths randomly.
Once an ant finds food, it will travel back to the nest and
emit pheromones so other ants can follow that path to the
food source. As other ants follow the pheromone trail, they
emit pheromones as well which reinforces the trail. After
some time, however, the pheromone trail will evaporate.
Given multiple paths to a food source, the pheromones on
the shortest path will have the least amount of time to evap-
orate before being reinforced by another ant. Over time, the
ants will converge to the shortest path.
The ant colony system was presented in [2] and was ap-
plied to the traveling salesman problem. It modifies the ant
system algorithm [3] in several ways to lead to a faster con-
vergence rate. After an ant crosses an edge, the pheromone
value of that edge is decayed according to equation 1:

where τij denotes the pheromone quantity on the edge from
state i to state j. The pheromone decay coefficient, φ, de-
termines how much pheromone is decayed after an ant
choses the edge from i to j. The initial pheromone value, τ0,
is the value every edge has at the beginning of the program.
Equation 1 reduces the probability of multiple ants choosing
the same path.
After all ants have chosen a path, the pheromone of each
edge is updated as follows:
The variable τij has the same meaning as equation 1. The
variable Δτijbest
evaluates to the inverse of the length of the
best path if the edge from i to j was taken by the ant with the
best path; otherwise it evaluates to zero. The variable ρ
represents the evaporation rate. This leads to a pheromone
increase on the edges taken by the ant that produced the best
solution; while decaying the pheromones on all other edges.
When transitioning from one state to another, the edge is
selected probabilistically according to the following proba-
bility:
where τij determines the amount of pheromone on the edge
from i to j, and ηij defines some predetermined desirability
of that edge (e.g. the inverse of the edge weight). The vari-
ables α and β are weighting factors for τij and ηij respective-
ly. The variable pijk is the probability that an ant will select
an edge that goes from state i to state j during the kth
itera-
tion.
IV. IMPLEMENTATION
We use the ant colony system described in the previous sec-
tion to find and create an optimal implementation for a spe-
cific set of constraints. In order to do so we define the struc-
ture of a program as a directed graph with a single source, at
which every ant will start, and a single sink, where every ant
will finish. The nodes of the graph correspond to source
code snippets. A path from source to sink corresponds to a
candidate implementation that can be compiled and execut-
ed. The output of the candidate implementation can then be
measured and ranked among the other candidate implemen-
tations to find the ant with the shortest path for that iteration.
The shortest path can be defined as a function of image
quality and reconstruction time.
The graph is constructed by creating a super source file.
This super source file contains annotated sections of code.
These annotations specify node id and incoming edges. Fig-
ure 1(a) and 1(b) show the graph and its corresponding su-
per source file. Figure 1(c) and 1(d) show a potential path
through the graph, and the corresponding candidate imple-
mentation. This super source file is then submitted as input
to our program, which converts it to its graph representation
and runs the ant colony system algorithm to produce an op-
timal implementation.
One aspect of our program differs from the traditional
ant colony system algorithm. There is no predetermined
desirability, η. There is no way of determining edge weight
(b)
(d)
Figure 1. An illustration of the framework presented in this paper. (a) a graph representing all possible implementations of a program. (b) the super source
file represented by the graph in (a). (c) a path is selected through the graph. (d) source code corresponding to the path selected in (c).
/*#{id=1, path=0}*/
If(A==B)
/*#{end 1}*/
/*#{id=2, path=0}*/
If(A!=B)
/*#{end 2}*/
/*#{id=3, path=1:2}*/
A+=B;
/*#{end 3}
/*#{id=4, path=2}*/
A*=B;
/*#{end 4}
/*#{id=5, path=3:4, sink)*/
return A;
/*#{end 5}*/
If(A!=B)
A+=B;
return A;
(a) (c)
(1)
(2)
(3)
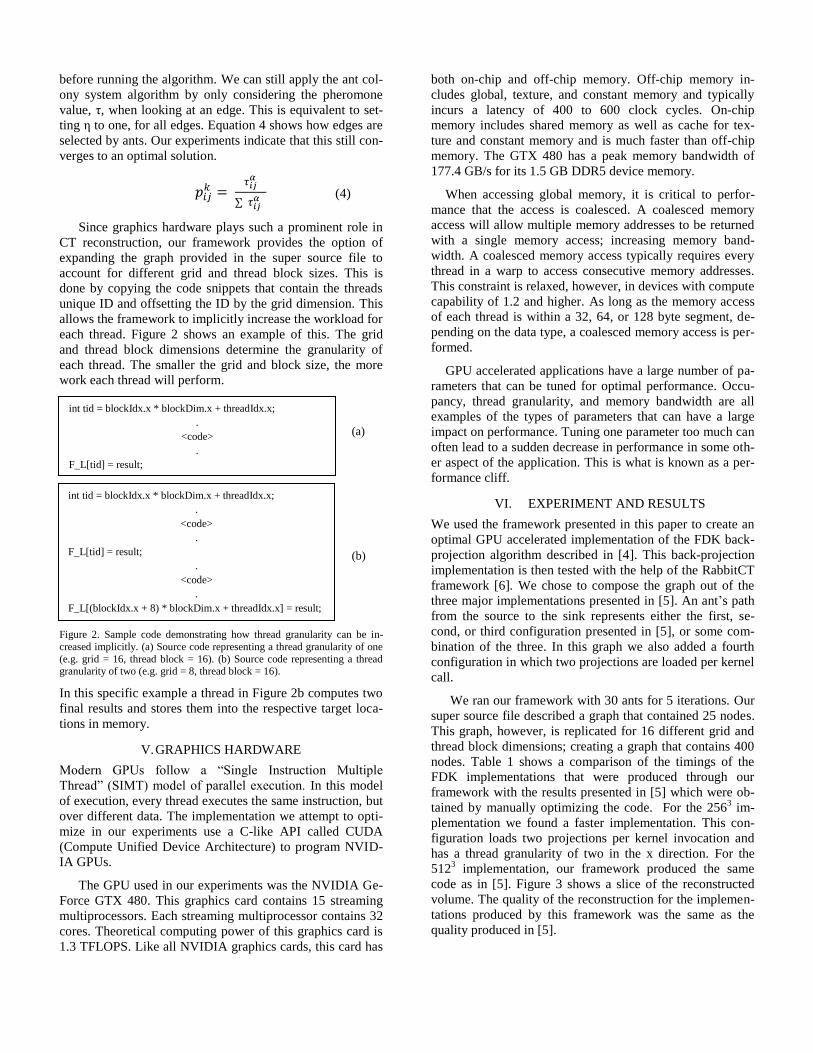
before running the algorithm. We can still apply the ant col-
ony system algorithm by only considering the pheromone
value, τ, when looking at an edge. This is equivalent to set-
ting η to one, for all edges. Equation 4 shows how edges are
selected by ants. Our experiments indicate that this still con-
verges to an optimal solution.
Since graphics hardware plays such a prominent role in
CT reconstruction, our framework provides the option of
expanding the graph provided in the super source file to
account for different grid and thread block sizes. This is
done by copying the code snippets that contain the threads
unique ID and offsetting the ID by the grid dimension. This
allows the framework to implicitly increase the workload for
each thread. Figure 2 shows an example of this. The grid
and thread block dimensions determine the granularity of
each thread. The smaller the grid and block size, the more
work each thread will perform.
Figure 2. Sample code demonstrating how thread granularity can be in-
creased implicitly. (a) Source code representing a thread granularity of one
(e.g. grid = 16, thread block = 16). (b) Source code representing a thread granularity of two (e.g. grid = 8, thread block = 16).
In this specific example a thread in Figure 2b computes two
final results and stores them into the respective target loca-
tions in memory.
V. GRAPHICS HARDWARE
Modern GPUs follow a “Single Instruction Multiple
Thread” (SIMT) model of parallel execution. In this model
of execution, every thread executes the same instruction, but
over different data. The implementation we attempt to opti-
mize in our experiments use a C-like API called CUDA
(Compute Unified Device Architecture) to program NVID-
IA GPUs.
The GPU used in our experiments was the NVIDIA Ge-
Force GTX 480. This graphics card contains 15 streaming
multiprocessors. Each streaming multiprocessor contains 32
cores. Theoretical computing power of this graphics card is
1.3 TFLOPS. Like all NVIDIA graphics cards, this card has
both on-chip and off-chip memory. Off-chip memory in-
cludes global, texture, and constant memory and typically
incurs a latency of 400 to 600 clock cycles. On-chip
memory includes shared memory as well as cache for tex-
ture and constant memory and is much faster than off-chip
memory. The GTX 480 has a peak memory bandwidth of
177.4 GB/s for its 1.5 GB DDR5 device memory.
When accessing global memory, it is critical to perfor-
mance that the access is coalesced. A coalesced memory
access will allow multiple memory addresses to be returned
with a single memory access; increasing memory band-
width. A coalesced memory access typically requires every
thread in a warp to access consecutive memory addresses.
This constraint is relaxed, however, in devices with compute
capability of 1.2 and higher. As long as the memory access
of each thread is within a 32, 64, or 128 byte segment, de-
pending on the data type, a coalesced memory access is per-
formed.
GPU accelerated applications have a large number of pa-
rameters that can be tuned for optimal performance. Occu-
pancy, thread granularity, and memory bandwidth are all
examples of the types of parameters that can have a large
impact on performance. Tuning one parameter too much can
often lead to a sudden decrease in performance in some oth-
er aspect of the application. This is what is known as a per-
formance cliff.
VI. EXPERIMENT AND RESULTS
We used the framework presented in this paper to create an
optimal GPU accelerated implementation of the FDK back-
projection algorithm described in [4]. This back-projection
implementation is then tested with the help of the RabbitCT
framework [6]. We chose to compose the graph out of the
three major implementations presented in [5]. An ant’s path
from the source to the sink represents either the first, se-
cond, or third configuration presented in [5], or some com-
bination of the three. In this graph we also added a fourth
configuration in which two projections are loaded per kernel
call.
We ran our framework with 30 ants for 5 iterations. Our
super source file described a graph that contained 25 nodes.
This graph, however, is replicated for 16 different grid and
thread block dimensions; creating a graph that contains 400
nodes. Table 1 shows a comparison of the timings of the
FDK implementations that were produced through our
framework with the results presented in [5] which were ob-
tained by manually optimizing the code. For the 2563 im-
plementation we found a faster implementation. This con-
figuration loads two projections per kernel invocation and
has a thread granularity of two in the x direction. For the
5123 implementation, our framework produced the same
code as in [5]. Figure 3 shows a slice of the reconstructed
volume. The quality of the reconstruction for the implemen-
tations produced by this framework was the same as the
quality produced in [5].
int tid = blockIdx.x * blockDim.x + threadIdx.x;
.
<code>
.
F_L[tid] = result;
int tid = blockIdx.x * blockDim.x + threadIdx.x;
.
<code>
.
F_L[tid] = result;
.
<code>
.
F_L[(blockIdx.x + 8) * blockDim.x + threadIdx.x] = result;
(a)
(b)
(4)

TABLE I
RUNTIMES OF BEST KNOWN AND FRAMEWORK PRODUCED
IMPLEMENTATIONS
Configuration Volume Time (s)
Framework 2563 2.54
Best Known 2563 2.71
Framework 5123 6.07
Best Known 5123 6.07
Figure 3. Slice of the reconstructed image.
The run time of our framework is dependent on the scale
of the application it is trying to produce. For each ant,
source code is generated, compiled, and executed. For the
experiments that we ran, it took approximately 2 hours for
all 30 ants to complete 5 iterations. The graph could have
been pruned, however, by eliminating nodes that correlate to
configurations that we know have bad performance. In our
experiments, we included the naïve configuration explained
in [5], as a possible implementation. By pruning the graph
of bad implementations, we could reduce the number of
ants; thus greatly reducing the amount of time required by
our framework.
We wish to add that the code produced by the ant colo-
ny optimization can be re-used for any new CT reconstruc-
tion task with the same boundary conditions the code was
generated for. Therefore the optimization overhead is well
amortized.
VII. FUTURE WORK
One direction of future work for this framework is to de-
velop a visual interface that is much more user friendly. At
its current state, this framework requires the input to be an
annotated source file. As the size of this source file grows, it
can become difficult to keep track of the graph structure. In
the future, we would like to develop a visual interface that
clearly shows the graph. Nodes can be easily added or re-
moved from this graph. Source code can be easily added or
modified inside a node; and the information that is currently
stored in the annotations can be abstracted away.
Another direction of future work, involves using this
framework to build an all-encompassing CT reconstruction
builder. This would incorporate different CT reconstruction
algorithms and implementations. Given a set of parameters,
this CT reconstruction builder would produce an optimal
implementation.
VIII. CONCLUSION
In this paper we presented a novel framework for producing
an optimal code structure using an ant colony optimization
algorithm. Through our experiments in applying our frame-
work to the RabbitCT platform, we have discovered a better
implementation for the 2563 volume reconstruction, while
producing the same results as [5] for the 5123 implementa-
tion.
Although we apply this framework to GPU accelerated
CT reconstruction, it is in no way restricted to that field of
study. The graph structure that the framework works off of
ensures that this framework can be applied to produce an
optimal implementation of any type of application.
REFERENCES
[1] A. Andersen and A. Kak, “Simultaneous algebraic reconstruction technique (SART): A superior implementation of the ART algorithm,” Ultrason. Imaging, 6:81–94, 1984
[2] M. Dorigo and L. M. Gambardella. “Ant Colony System: A cooperative learning approach to the traveling salesman problem.” IEEE Transactions on Evolutionary Computation, 1(1):53–66,
[3] M. Dorigo, V. Maniezzo, and A. Colorni. “Ant System: Optimization by a colony of cooperating agents.” IEEE Transactions on Systems, Man, and Cybernetics – Part B, 26(1):29–41, 1996.
[4] L. Feldkamp, L. Davis, and J. Kress, “Practical cone-beam algorithm,” J. Opt. Soc. Am. Vol 1, No. A6, 612–619 , 1984
[5] E. Papenhausen, Z. Zheng, and K. Mueller, "GPU-Accelerated Back-Projecting Revisited: Squeezing Performance by Careful Tuning," Fully Three-Dimensional Image Reconstruction in Radiology and Nuclear Medicine (Potsdam, Germany, 2011)
[6] C. Rohkohl, B. Keck, H. G. Hofmann and J. Hornegger, “RabbitCT---an open platform for benchmarking 3D cone-beam reconstruction algorithms,” Medical Physics, 36:3940, 2009.
[7] L. Shepp and Y. Vardi, “Maximum likelihood reconstruction for emission tomography,” IEEE Trans. Med. Imag., 1(2):113–122, 1982.
[8] H. Scherl, B. Keck, M. Kowarschik, J. Hornegger, “Fast GPU-based CT reconstruction using the Common Unified Device Architecture (CUDA),” IEEE Medical Imaging Conference, 6: 4464-4466, Honolulu, HI, 2007.
[9] W. Xu, K.Mueller "Learning Effective Parameter Settings for Iterative CT Reconstruction Algorithms," Fully 3D Image Reconstruction in Radiology and Nuclear Medicine (Beijing, China, 2009)
[10] Z. Zheng, K. Mueller “Cache-Aware GPU Memory Scheduling Scheme for CT Back-Projection,” IEEE Medical Imaging Conference, Oct. 2010.


![Inducing Decision Trees with an Ant Colony …...Ant colony optimization (ACO) [11, 12, 13] algorithms involve a colony of ants (agents), which despite the relative simplicity of their](https://static.fdocuments.net/doc/165x107/5f3f784fd014a027ae317de4/inducing-decision-trees-with-an-ant-colony-ant-colony-optimization-aco-11.jpg)


![Utilizing Colored Pheromones and Helping Ants for Wireless ... Colored Phermone.pdfE. GHASEMKHANI . ET AL. 9. ant colony optimization (MACO) [26] uses multiple ant colonies, each trying](https://static.fdocuments.net/doc/165x107/5fe958d4ff966b1b2b3622c4/utilizing-colored-pheromones-and-helping-ants-for-wireless-colored-phermonepdf.jpg)