Code Profiling Plugin for MPLAB X IDE User...
29
2015 Microchip Technology Inc. DS50002384A Code Profiling Plugin for MPLAB ® X IDE
Transcript of Code Profiling Plugin for MPLAB X IDE User...

2015 Microchip Technology Inc. DS50002384A
Code Profiling Plugin for
MPLAB® X IDE

DS50002384A-page 2 2015 Microchip Technology Inc.
Information contained in this publication regarding deviceapplications and the like is provided only for your convenienceand may be superseded by updates. It is your responsibility toensure that your application meets with your specifications.MICROCHIP MAKES NO REPRESENTATIONS ORWARRANTIES OF ANY KIND WHETHER EXPRESS ORIMPLIED, WRITTEN OR ORAL, STATUTORY OROTHERWISE, RELATED TO THE INFORMATION,INCLUDING BUT NOT LIMITED TO ITS CONDITION,QUALITY, PERFORMANCE, MERCHANTABILITY ORFITNESS FOR PURPOSE. Microchip disclaims all liabilityarising from this information and its use. Use of Microchipdevices in life support and/or safety applications is entirely atthe buyer’s risk, and the buyer agrees to defend, indemnify andhold harmless Microchip from any and all damages, claims,suits, or expenses resulting from such use. No licenses areconveyed, implicitly or otherwise, under any Microchipintellectual property rights unless otherwise stated.
Note the following details of the code protection feature on Microchip devices:
• Microchip products meet the specification contained in their particular Microchip Data Sheet.
• Microchip believes that its family of products is one of the most secure families of its kind on the market today, when used in the intended manner and under normal conditions.
• There are dishonest and possibly illegal methods used to breach the code protection feature. All of these methods, to our knowledge, require using the Microchip products in a manner outside the operating specifications contained in Microchip’s Data Sheets. Most likely, the person doing so is engaged in theft of intellectual property.
• Microchip is willing to work with the customer who is concerned about the integrity of their code.
• Neither Microchip nor any other semiconductor manufacturer can guarantee the security of their code. Code protection does not mean that we are guaranteeing the product as “unbreakable.”
Code protection is constantly evolving. We at Microchip are committed to continuously improving the code protection features of ourproducts. Attempts to break Microchip’s code protection feature may be a violation of the Digital Millennium Copyright Act. If such actsallow unauthorized access to your software or other copyrighted work, you may have a right to sue for relief under that Act.
Microchip received ISO/TS-16949:2009 certification for its worldwide headquarters, design and wafer fabrication facilities in Chandler and Tempe, Arizona; Gresham, Oregon and design centers in California and India. The Company’s quality system processes and procedures are for its PIC® MCUs and dsPIC® DSCs, KEELOQ® code hopping devices, Serial EEPROMs, microperipherals, nonvolatile memory and analog products. In addition, Microchip’s quality system for the design and manufacture of development systems is ISO 9001:2000 certified.
QUALITY MANAGEMENT SYSTEM CERTIFIED BY DNV
== ISO/TS 16949 ==
Trademarks
The Microchip name and logo, the Microchip logo, dsPIC, FlashFlex, flexPWR, JukeBlox, KEELOQ, KEELOQ logo, Kleer, LANCheck, MediaLB, MOST, MOST logo, MPLAB, OptoLyzer, PIC, PICSTART, PIC32 logo, RightTouch, SpyNIC, SST, SST Logo, SuperFlash and UNI/O are registered trademarks of Microchip Technology Incorporated in the U.S.A. and other countries.
The Embedded Control Solutions Company and mTouch are registered trademarks of Microchip Technology Incorporated in the U.S.A.
Analog-for-the-Digital Age, BodyCom, chipKIT, chipKIT logo, CodeGuard, dsPICDEM, dsPICDEM.net, ECAN, In-Circuit Serial Programming, ICSP, Inter-Chip Connectivity, KleerNet, KleerNet logo, MiWi, MPASM, MPF, MPLAB Certified logo, MPLIB, MPLINK, MultiTRAK, NetDetach, Omniscient Code Generation, PICDEM, PICDEM.net, PICkit, PICtail, RightTouch logo, REAL ICE, SQI, Serial Quad I/O, Total Endurance, TSHARC, USBCheck, VariSense, ViewSpan, WiperLock, Wireless DNA, and ZENA are trademarks of Microchip Technology Incorporated in the U.S.A. and other countries.
SQTP is a service mark of Microchip Technology Incorporated in the U.S.A.
Silicon Storage Technology is a registered trademark of Microchip Technology Inc. in other countries.
GestIC is a registered trademark of Microchip Technology Germany II GmbH & Co. KG, a subsidiary of Microchip Technology Inc., in other countries.
All other trademarks mentioned herein are property of their respective companies.
© 2015, Microchip Technology Incorporated, Printed in the U.S.A., All Rights Reserved.
ISBN: 978-1-63277-506-1
CODE PROFILING PLUGIN®
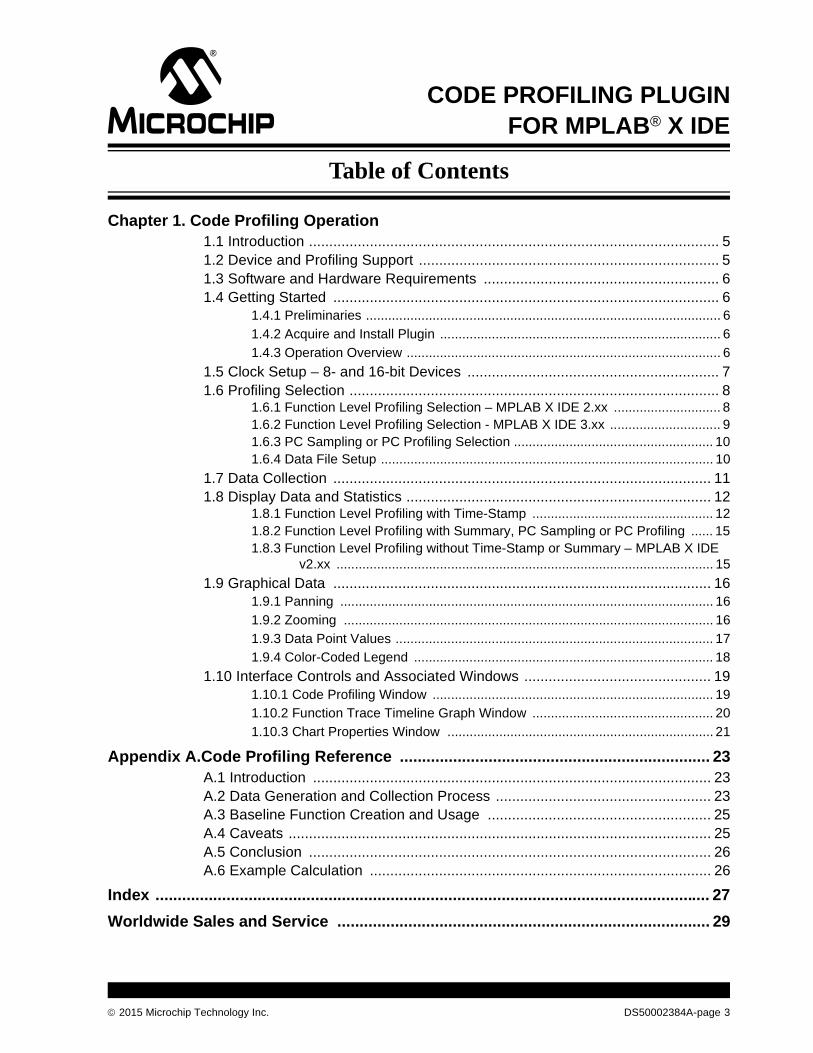
FOR MPLAB X IDETable of Contents
Chapter 1. Code Profiling Operation1.1 Introduction ..................................................................................................... 51.2 Device and Profiling Support .......................................................................... 51.3 Software and Hardware Requirements .......................................................... 61.4 Getting Started ............................................................................................... 6
1.4.1 Preliminaries ................................................................................................ 6
1.4.2 Acquire and Install Plugin ............................................................................ 6
1.4.3 Operation Overview ..................................................................................... 6
1.5 Clock Setup – 8- and 16-bit Devices .............................................................. 71.6 Profiling Selection ........................................................................................... 8
1.6.1 Function Level Profiling Selection – MPLAB X IDE 2.xx ............................. 81.6.2 Function Level Profiling Selection - MPLAB X IDE 3.xx .............................. 91.6.3 PC Sampling or PC Profiling Selection ...................................................... 101.6.4 Data File Setup .......................................................................................... 10
1.7 Data Collection ............................................................................................. 111.8 Display Data and Statistics ........................................................................... 12
1.8.1 Function Level Profiling with Time-Stamp ................................................. 121.8.2 Function Level Profiling with Summary, PC Sampling or PC Profiling ...... 151.8.3 Function Level Profiling without Time-Stamp or Summary – MPLAB X IDE
v2.xx ...................................................................................................... 15
1.9 Graphical Data ............................................................................................. 161.9.1 Panning ..................................................................................................... 16
1.9.2 Zooming .................................................................................................... 16
1.9.3 Data Point Values ...................................................................................... 17
1.9.4 Color-Coded Legend ................................................................................. 18
1.10 Interface Controls and Associated Windows .............................................. 191.10.1 Code Profiling Window ............................................................................ 19
1.10.2 Function Trace Timeline Graph Window ................................................. 20
1.10.3 Chart Properties Window ........................................................................ 21
Appendix A.Code Profiling Reference ...................................................................... 23A.1 Introduction .................................................................................................. 23A.2 Data Generation and Collection Process ..................................................... 23A.3 Baseline Function Creation and Usage ....................................................... 25A.4 Caveats ........................................................................................................ 25A.5 Conclusion ................................................................................................... 26A.6 Example Calculation .................................................................................... 26
Index ............................................................................................................................. 27
Worldwide Sales and Service .................................................................................... 29
2015 Microchip Technology Inc. DS50002384A-page 3

Code Profiling Plugin for MPLAB® X IDE
NOTES:
DS50002384A-page 4 2015 Microchip Technology Inc.

CODE PROFILING PLUGIN®
FOR MPLAB X IDEChapter 1. Code Profiling Operation
1.1 INTRODUCTION
MPLAB X IDE provides the functionality to gather Function Level Profiling (FLP) data about C code functions. However, this data cannot be displayed in the IDE without the MPLAB X IDE Plugin – Code Profiling (SW100100). The Code Profiling plugin shows you the percentage of time spent in each function. It does not give precise timing data.
In addition to FLP, PC sampling data and PC profiling data may also be displayed in the Code Profiling plugin, even though a display is already available in MPLAB X IDE.
• Device and Profiling Support
• Software and Hardware Requirements
• Getting Started
• Clock Setup – 8- and 16-bit Devices
• Profiling Selection
• Data Collection
• Display Data and Statistics
• Graphical Data
• Interface Controls and Associated Windows
1.2 DEVICE AND PROFILING SUPPORT
The Code Profiling plugin supports the following device families and related types of profiling available in MPLAB X IDE:
The Code Profiling plugin DOES NOT SUPPORT these device families:
• PIC16F1
• PIC32MZ
These devices use a different type of data capture not supported by the plugin.
Devices Supported Related Profiling Supported
PIC18F with data capture* PC SamplingFunction Level Profiling
PIC24F, PIC24E PC SamplingFunction Level Profiling
dsPIC33FJ, dsPIC33E PC SamplingFunction Level Profiling
PIC32MX with data capture* PC ProfilingFunction Level Profiling
* To find out if your device has data capture, please see the online Development Tool Selector: http://www.microchip.com/dts.
2015 Microchip Technology Inc. DS50002384A-page 5

Code Profiling Plugin for MPLAB® X IDE
1.3 SOFTWARE AND HARDWARE REQUIREMENTS
Code Profiling requires the following software versions and hardware:
• MPLAB X IDE v2.26 or later
• MPLAB XC C Compiler version 1.20 or later – code profiling requires instrumentation
• MPLAB® REAL ICE™ In-Circuit Emulator – currently this is the only supported debug tool.
To obtain these items, see the Microchip web site at: http://www.microchip.com.
1.4 GETTING STARTED
1.4.1 Preliminaries
Before you install the plugin, you must first:
1. Select a supported device (Section 1.2 “Device and Profiling Support”) for your target.
2. Acquire and install the supported versions of software and hardware (Section 1.3 “Software and Hardware Requirements”).
3. Create and debug an MPLAB X IDE project.
1.4.2 Acquire and Install Plugin
Once the preliminaries are complete, you can acquire and install the Code Profiling plugin:
1. Acquire “MPLAB X IDE Plugin – Code Profiling (SW100100)”, available for purchase at: http://www.embeddedcodesource.com.
2. Install the plugin (called CodeProfiling) by following the steps below.
a) Select Tools>Plugins. The plugins dialog will open.
b) Click the Downloaded tab and then click the Add Plugin button. Navigate to the location of the plugin (file type *.nbm), select the file, and click Open. If the file was downloaded as a zipped file, you must unzip it before you can add it as a plugin.
c) Follow the installation instructions.
3. Once the plugin is installed, the Code Profiling window then may be accessed under Tools>Embedded>CodeProfiling.
1.4.3 Operation Overview
To use Code Profiling:
1. Set up the clock – Section 1.5 “Clock Setup – 8- and 16-bit Devices”
2. Select the type of profiling – Section 1.6 “Profiling Selection”
3. Collect data – Section 1.7 “Data Collection”
4. View data – Section 1.8 “Display Data and Statistics” and Section 1.9 “Graphical Data”
DS50002384A-page 6 2015 Microchip Technology Inc.
Code Profiling Operation
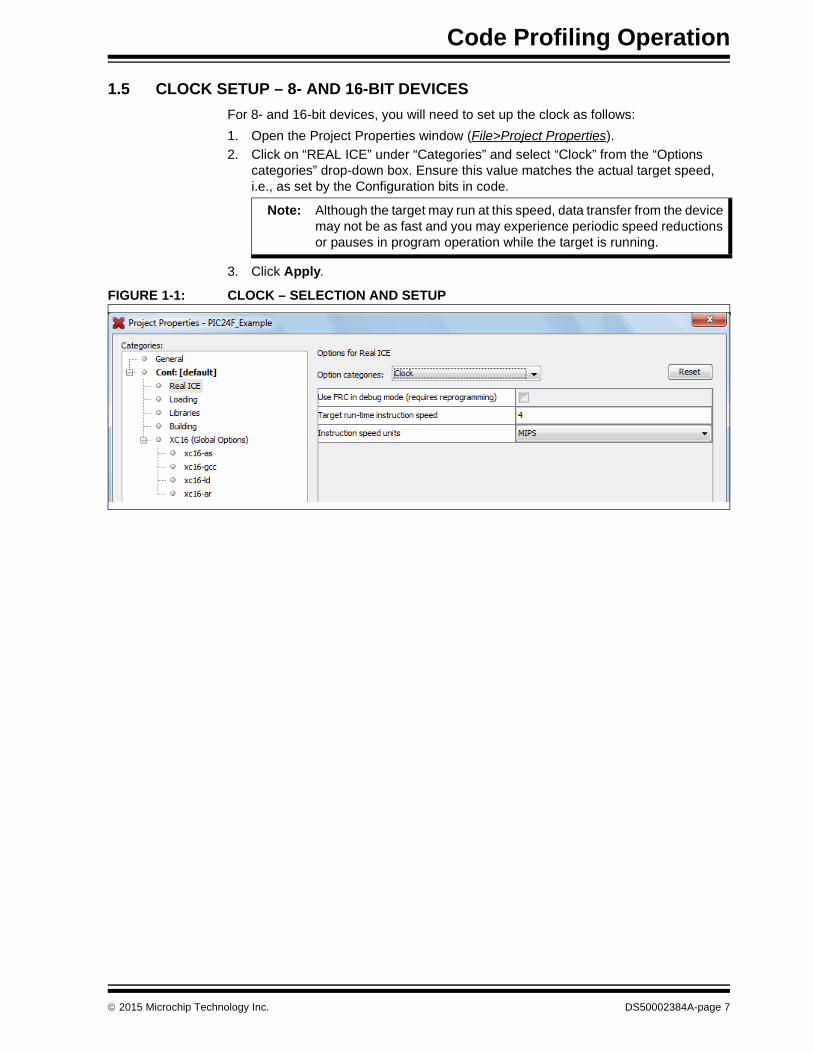
1.5 CLOCK SETUP – 8- AND 16-BIT DEVICES
For 8- and 16-bit devices, you will need to set up the clock as follows:
1. Open the Project Properties window (File>Project Properties).
2. Click on “REAL ICE” under “Categories” and select “Clock” from the “Options categories” drop-down box. Ensure this value matches the actual target speed, i.e., as set by the Configuration bits in code.
3. Click Apply.
FIGURE 1-1: CLOCK – SELECTION AND SETUP
Note: Although the target may run at this speed, data transfer from the device may not be as fast and you may experience periodic speed reductions or pauses in program operation while the target is running.
2015 Microchip Technology Inc. DS50002384A-page 7
Code Profiling Plugin for MPLAB® X IDE
1.6 PROFILING SELECTION
Select the type of profiling you wish to use with the Code Profiling plugin.
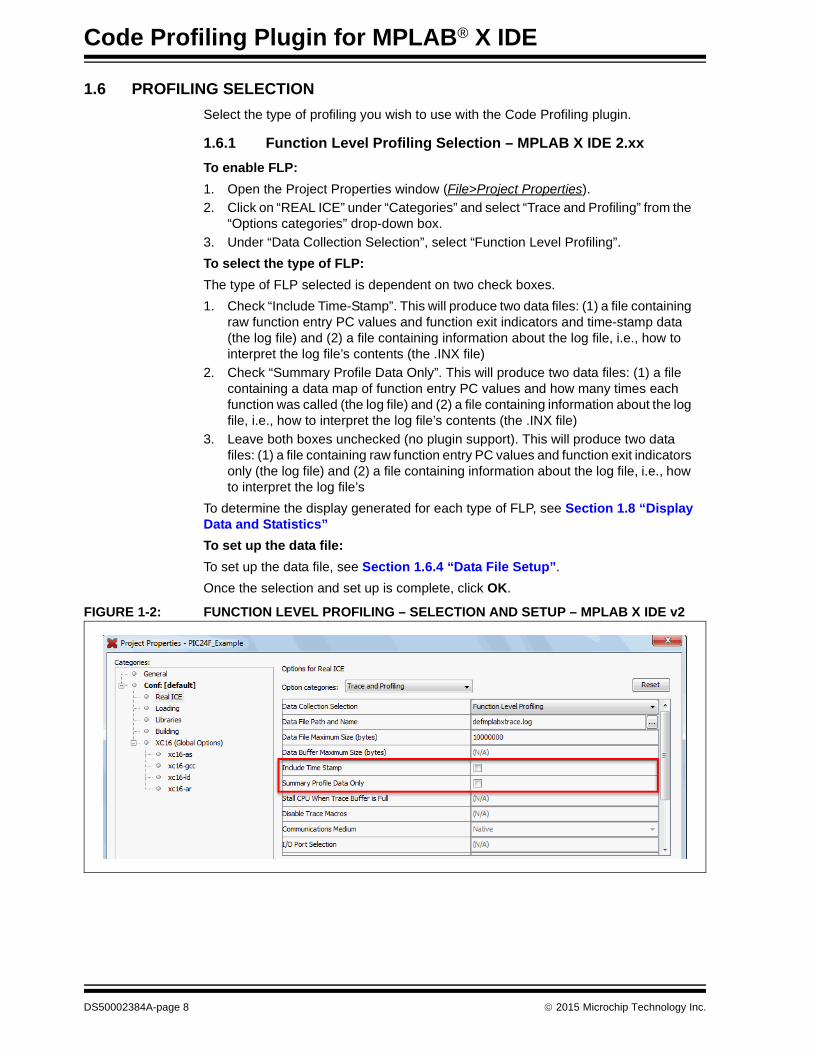
1.6.1 Function Level Profiling Selection – MPLAB X IDE 2.xx
To enable FLP:
1. Open the Project Properties window (File>Project Properties).
2. Click on “REAL ICE” under “Categories” and select “Trace and Profiling” from the “Options categories” drop-down box.
3. Under “Data Collection Selection”, select “Function Level Profiling”.
To select the type of FLP:
The type of FLP selected is dependent on two check boxes.
1. Check “Include Time-Stamp”. This will produce two data files: (1) a file containing raw function entry PC values and function exit indicators and time-stamp data (the log file) and (2) a file containing information about the log file, i.e., how to interpret the log file’s contents (the .INX file)
2. Check “Summary Profile Data Only”. This will produce two data files: (1) a file containing a data map of function entry PC values and how many times each function was called (the log file) and (2) a file containing information about the log file, i.e., how to interpret the log file’s contents (the .INX file)
3. Leave both boxes unchecked (no plugin support). This will produce two data files: (1) a file containing raw function entry PC values and function exit indicators only (the log file) and (2) a file containing information about the log file, i.e., how to interpret the log file’s
To determine the display generated for each type of FLP, see Section 1.8 “Display Data and Statistics”
To set up the data file:
To set up the data file, see Section 1.6.4 “Data File Setup”.
Once the selection and set up is complete, click OK.
FIGURE 1-2: FUNCTION LEVEL PROFILING – SELECTION AND SETUP – MPLAB X IDE v2
DS50002384A-page 8 2015 Microchip Technology Inc.

Code Profiling Operation
1.6.2 Function Level Profiling Selection - MPLAB X IDE 3.xx
To enable FLP:
1. Open the Project Properties window (File>Project Properties).
2. Click on “REAL ICE” under “Categories” and select “Trace and Profiling” from the “Options categories” drop-down box.
3. Under “Data Collection Selection”, select “Function Level Profiling”.
To select the type of FLP:
The type of FLP selected is dependent on the option “Time-Stamp or Summary Profile Data”.
1. Select “Include Time-Stamp” to produce two data files: (1) a file containing raw function entry PC values and function exit indicators and time-stamp data (the log file) and (2) a file containing information about the log file, i.e., how to interpret the log file’s contents (the .INX file)
2. Select “Summary Profile Data Only (No Time-Stamp)” to produce two data files: (1) a file containing a data map of function entry PC values and how many times each function was called (the log file) and (2) a file containing information about the log file, i.e., how to interpret the log file’s contents (the .INX file)
To determine the display generated for each type of FLP, see Section 1.8 “Display Data and Statistics”
To set up the data file:
To set up the data file, see Section 1.6.4 “Data File Setup”.
Once the selection and set up is complete, click OK.
FIGURE 1-3: FUNCTION LEVEL PROFILING – SELECTION AND SETUP – MPLAB X IDE v3
2015 Microchip Technology Inc. DS50002384A-page 9

Code Profiling Plugin for MPLAB® X IDE
1.6.3 PC Sampling or PC Profiling Selection
To enable PC Sampling (8- and 16-bit devices):
1. Open the Project Properties window (File>Project Properties).
2. Click on “REAL ICE” under “Categories” and select “Trace and Profiling” from the “Options categories” drop-down box.
3. Under “Data Collection Selection”, select “PC Sampling”.
To enable PC Profiling (32-bit devices):
1. Open the Project Properties window (File>Project Properties).
2. Click on “REAL ICE” under “Categories” and select “Trace and Profiling” from the “Options categories” drop-down box.
3. Under “Data Collection Selection”, select “Instruction Trace/Profiling”.
To determine the display generated for either selection, see Section 1.8 “Display Data and Statistics”
To set up the data file:
To set up the data file for either selection, see Section 1.6.4 “Data File Setup”.
For more information on PC sampling or PC profiling, see the MPLAB REAL ICE In-circuit Emulator documentation.
Once the selection and set up is complete, click OK.
1.6.4 Data File Setup
To set up the data file:
1. Data File Path and Name: Enter a name (and path) for the data file. A default name is already entered for a file that will be placed in the project directory.
2. Data File Maximum Size: Enter a data file maximum size. A default value is already entered. The data file is circular; once the maximum file size is reached, new data will continue to be collected while old data is pushed out.
3. For more information on these items, see the MPLAB REAL ICE In-Circuit Emu-lator documentation, “Software & Hardware Reference”, “Emulator Function Summary”, “Emulator Options Selection”, ”Trace and Profiling”.
DS50002384A-page 10 2015 Microchip Technology Inc.
Code Profiling Operation
1.7 DATA COLLECTION
To collect data:
1. Open the Code Profiling window by selecting Tools>Embedded>CodeProfiling.
2. Debug Run your program.
Ensure that you run your program for a sufficient amount of time to see relevant results. That is, the more data samples you collect, the more representative the average of samples (and related percentages) will be. So a complex program may need to be run longer then a smaller, simple one.
For Time-Stamp data, the incoming data represents a moving window on the data, in that the data is stored in a circular buffer and older data is lost (see Section A.2 “Data Generation and Collection Process”.)
Summary data contains exact count values (with no time-stamp information).
For MPLAB X IDE v2.xx, raw data is stored in a circular buffer but has no time-stamp information.
3. Halt program execution (Pause, Halt, or breakpoint).
4. View the data in the Code Profiling window.
See the next section for details about the contents of the window.
Note: Precompiled functions will not be profiled. Only the C files that are compiled with the project will get the necessary instrumentation.
2015 Microchip Technology Inc. DS50002384A-page 11
Code Profiling Plugin for MPLAB® X IDE
1.8 DISPLAY DATA AND STATISTICS
The data displayed in the Code Profiling window depends on the type of profiling you selected previously.
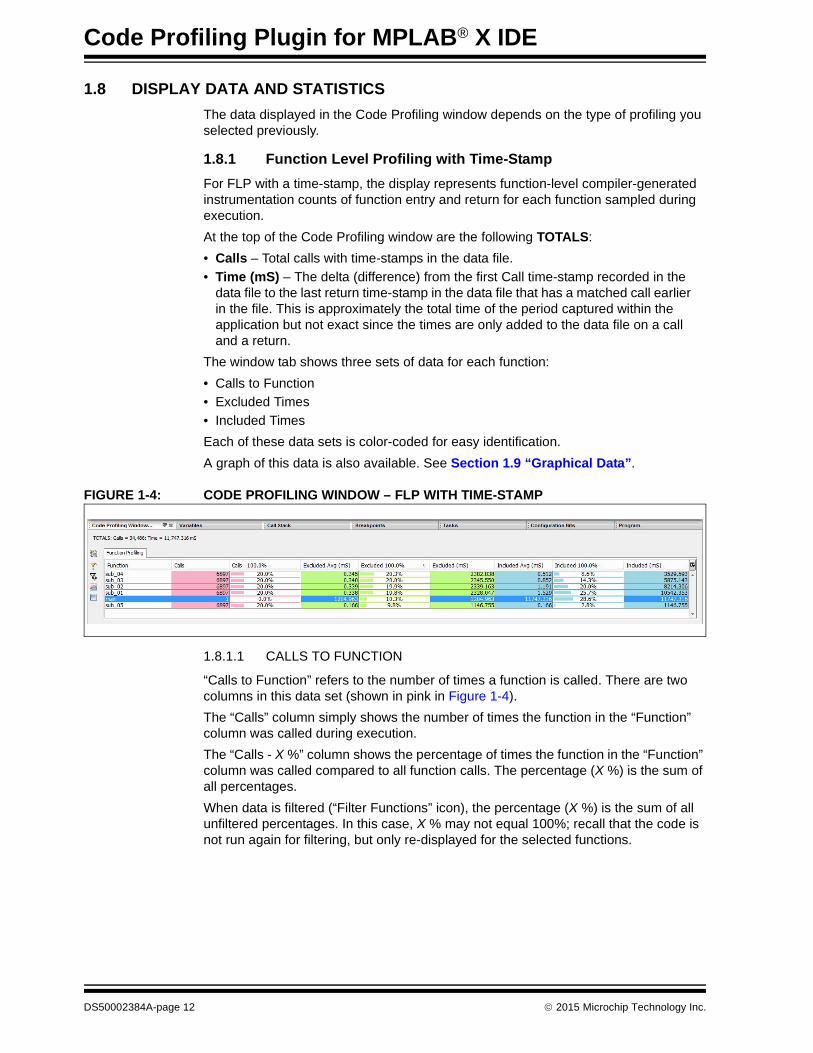
1.8.1 Function Level Profiling with Time-Stamp
For FLP with a time-stamp, the display represents function-level compiler-generated instrumentation counts of function entry and return for each function sampled during execution.
At the top of the Code Profiling window are the following TOTALS:
• Calls – Total calls with time-stamps in the data file.
• Time (mS) – The delta (difference) from the first Call time-stamp recorded in the data file to the last return time-stamp in the data file that has a matched call earlier in the file. This is approximately the total time of the period captured within the application but not exact since the times are only added to the data file on a call and a return.
The window tab shows three sets of data for each function:
• Calls to Function
• Excluded Times
• Included Times
Each of these data sets is color-coded for easy identification.
A graph of this data is also available. See Section 1.9 “Graphical Data”.
FIGURE 1-4: CODE PROFILING WINDOW – FLP WITH TIME-STAMP
1.8.1.1 CALLS TO FUNCTION
“Calls to Function” refers to the number of times a function is called. There are two columns in this data set (shown in pink in Figure 1-4).
The “Calls” column simply shows the number of times the function in the “Function” column was called during execution.
The “Calls - X %” column shows the percentage of times the function in the “Function” column was called compared to all function calls. The percentage (X %) is the sum of all percentages.
When data is filtered (“Filter Functions” icon), the percentage (X %) is the sum of all unfiltered percentages. In this case, X % may not equal 100%; recall that the code is not run again for filtering, but only re-displayed for the selected functions.
DS50002384A-page 12 2015 Microchip Technology Inc.

Code Profiling Operation
1.8.1.2 EXCLUDED TIMES
“Excluded Times” refers to the time spent in a function excluding (minus) the times spent in any functions called by that function. There are three columns in this data set (shown in green in Figure 1-4).
The “Excluded Avg (mS)” column represents the excluded call hierarchy of each function on average.
The “Excluded X %” column represents what percent of the total excluded profile time is represented by each function time. The percentage (X %) is the sum of all percent-ages. When data is filtered (“Filter Functions” icon), the percentage (X %) is the sum of all unfiltered percentages. In this case, X % may not equal 100%; recall that the code is not run again for filtering, but only re-displayed for the selected functions.
The “Excluded (mS)” column represents the time spent in the function listed in the “Function” column, excluding the time for other functions called within this function. This number is derived by multiplying the total number of calls to this function (“Calls” column) by the average excluded runtime of the function (“Avg (mS)” column).
For example, if Function F1 calls Function F2, which in turn calls Function F3, you could show the timing as in Figure 1-5, where the excluded time for F1 is shown. Each time F1 is called, the F1 excluded time is determined. When the program is halted, the aver-age F1 excluded time is calculated and used with the number of calls to determine value in the “Excluded (mS)” column.
FIGURE 1-5: EXAMPLE OF EXCLUDED TIME – FUNCTION F1
F1
F2
F3
Fun
ctio
n C
all H
eira
rchy
(m
S)
Sample Time (mS)
x y
Excluded time for Function F1 = x + y
2015 Microchip Technology Inc. DS50002384A-page 13

Code Profiling Plugin for MPLAB® X IDE
1.8.1.3 INCLUDED TIMES
“Included Times” refers to the total time spent in a function, including the times spent in any functions called by that function. There are four columns in this data set (shown in blue in Figure 1-4).
The “Included Avg (mS)” column represents the included call hierarchy of each function on average.
The “Included X %” column represents what percent of the total included profile time is represented by each function time. The percentage (X %) is the sum of all percentages. When data is filtered (“Filter Functions” icon), the percentage (X %) is the sum of all unfiltered percentages. In this case, X % may not equal 100%; recall that the code is not run again for filtering, but only re-displayed for the selected functions.
The “Included (mS)” column represents the time spent in the function listed in the “Function” column. This is the total time for the function, regardless of calls to other functions.This number is derived by multiplying the of total number of calls to this function (“Calls” column) by the average included runtime of the function (“Avg (mS)” column).
For example, if Function F1 calls Function F2, which in turn calls Function F3, you could show the timing as in Figure 1-6, where the included time for Function F1 is shown. Each time F1 is called, the F1 included time is determined. When the program is halted, the average F1 included time is calculated and used with the number of calls to determine value in the “Included (mS)” column.
FIGURE 1-6: EXAMPLE OF INCLUDED TIME – FUNCTION F1
F1
F2
F3
Fu
nctio
n C
all H
eira
rchy
(m
S)
Sample Time (mS)
x
Included time for Function F1 = x
DS50002384A-page 14 2015 Microchip Technology Inc.

Code Profiling Operation
1.8.2 Function Level Profiling with Summary, PC Sampling or PC Profiling
For FLP with a data summary, the display represents how many times each function was entered/called. For PC sampling or PC Profiling, the display represents a random sampling of the PC taken during the run of the program.
At the top of the Code Profiling window, one of the following is shown:
• Total Function Entry Count – Total entries to a function – FLP with summary.
• Total Samples – Total number of PC samples in a function – PC sampling or PC profiling.
The window tab shows the following data for each function.
• The “Entry Count” or “Sample Count” column shows the entry or sample count for he function in the “Function” column, respectively.
• The “Calls - X %” column shows the percentage of times the function in the “Func-tion” column was called compared to all function calls. The percentage (X %) is the sum of all percentages.
When data is filtered (“Filter Functions” icon), the percentage (X %) is the sum of all unfiltered percentages. In this case, X % may not equal 100%; recall that the code is not run again for filtering, but only re-displayed for the selected functions.
FIGURE 1-7: CODE PROFILING WINDOW – FLP WITH SUMMARY
1.8.3 Function Level Profiling without Time-Stamp or Summary – MPLAB X IDE v2.xx
For FLP without time-stamp or summary data (raw data), the display currently shows no data. Therefore, there is no plugin support for this type of profiling.
2015 Microchip Technology Inc. DS50002384A-page 15

Code Profiling Plugin for MPLAB® X IDE
1.9 GRAPHICAL DATA
Click on the graph icon to display a graph of the Code Profiling data, specifically a composite trace of the timeline of each function. Each function shown on the graph is color-coded per the legend at the bottom of the graph. These colors are not the same as those used for data sets in the window. Functions can also be identified by mousing over a line on the graph.
The graph axes are:
• “Time (mS)” represents the profile sampling time (in milliseconds).
• “Call Hierarchy” represents the hierarchy of each function call.
FIGURE 1-8: FUNCTION TRACE TIMELINE GRAPH WINDOW
1.9.1 Panning
To move left and right through the data on the Time axis, use:
• The “Pan Graph” slider
• <Ctrl> + click on mouse (on Windows® and Linux OS systems)
• <Apple> + click on the mouse (on Mac® OS systems)
1.9.2 Zooming
Ensure magnifying glass icon is selected:
• Click and drag with your mouse to zoom in.
• Right click on the graph, click on Zoom In or Zoom Out, and select an axes on which to zoom.
• Use the mouse wheel to zoom on the Time axis and <Ctrl> + mouse wheel to zoom on the Call Hierarchy axis.
Reset the zoom by clicking Reset Zoom.
DS50002384A-page 16 2015 Microchip Technology Inc.

Code Profiling Operation
1.9.3 Data Point Values
Ensure magnifying glass icon is NOT selected.
You can click and drag with your mouse to measure a time value. Two green bars will show the range and the value will be displayed on the bottom.
Alternately, you can hover over a corner of a graphed line to see a data point value in a pop-up.
FIGURE 1-9: MOUSE DRAG DATA POINT RANGE
FIGURE 1-10: MOUSE HOVER DATA POINT VALUE
2015 Microchip Technology Inc. DS50002384A-page 17
Code Profiling Plugin for MPLAB® X IDE
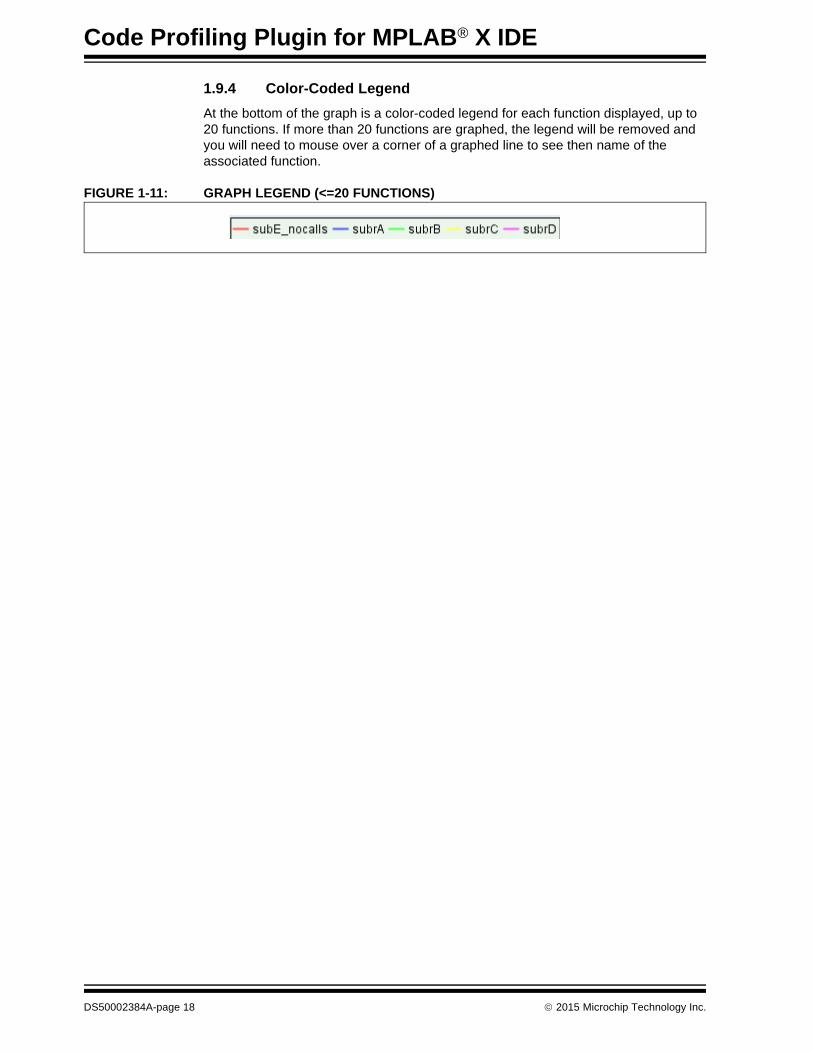
1.9.4 Color-Coded Legend
At the bottom of the graph is a color-coded legend for each function displayed, up to 20 functions. If more than 20 functions are graphed, the legend will be removed and you will need to mouse over a corner of a graphed line to see then name of the associated function.
FIGURE 1-11: GRAPH LEGEND (<=20 FUNCTIONS)
DS50002384A-page 18 2015 Microchip Technology Inc.
Code Profiling Operation
1.10 INTERFACE CONTROLS AND ASSOCIATED WINDOWS
The Code Profiling interface windows have controls, and associated windows, to assist in data display and analysis.
• Code Profiling Window
• Function Trace Timeline Graph Window
• Chart Properties Window
1.10.1 Code Profiling Window
Most icons are on the right side of the window, except for the Column Setup icon which is on the left. Context menu items may be accessed by right clicking in the window.
TABLE 1-1: CODE PROFILING WINDOW ICONS
Icon Text Description
Project Properties
Open the Project Properties window.
Filter Functions Filter the display to show only the selected functions.Note: Code is not run again; the data already collected is reduced to remove all non-selected functions.
Filter Select All Select to display all functions.
Show Function Trace Timeline Graph
Display a graph of data in the window, specifically a composite trace of the timeline of each function.
Output Statistics Output window data to a file.
Column Setup Click to display a menu for selecting which columns to show or hide. Also show or hide horizontal scroll, or pack columns (all or selected).
TABLE 1-2: CODE PROFILING WINDOW CONTEXT MENU
Item Description
Clear View and Data Clear all function data from the window.
Reload Data Reload function data from a file into the window.
Go To Function Source Go to the location in source code of the selected function.You can also double click on a function to do this.
2015 Microchip Technology Inc. DS50002384A-page 19
Code Profiling Plugin for MPLAB® X IDE
1.10.2 Function Trace Timeline Graph Window
The Graph window icon is found on the right side of this window. Context menu items may be accessed by right clicking in the window.
TABLE 1-3: FUNCTION TRACE TIMELINE GRAPH WINDOW ICONS
Icon Text Description
Measure/Zoom Mode Select
Icon unselected: Measurement mode. Drag mouse to measure time value.Icon selected: Zoom mode. Drag mouse to zoom in on an area.
TABLE 1-4: FUNCTION TRACE TIMELINE GRAPH WINDOW CONTEXT MENU
Item Description
Turn Off/On Zoom mode Click to disable Zoom mode.Click again to enabled Zoom mode.
Save Graph Image Save an image of the graph to a PNG file.
Print Print the graph.
Zoom In Zoom in on graph data. Choose to zoom in on:• Both Axes• Domain Axis (x coordinates)• Range Axis (y coordinates)
Zoom Out Zoom out on graph data. Choose to zoom out on:• Both Axes• Domain Axis (x coordinates)• Range Axis (y coordinates)
Zoom Reset Reset zoom to default level.
Properties Open the Chart Properties window. See Section 1.10.3 “Chart Properties Window”.
DS50002384A-page 20 2015 Microchip Technology Inc.

Code Profiling Operation
1.10.3 Chart Properties Window
Set up the graph look and feel on the tabs of this window.
TABLE 1-5: TITLE TAB
Item Description
Show Title Check to show the graph title listed under “Text”.Uncheck to hide the graph title.
Text Enter a title for the graph. “Show Title” must be checked.
Font Select font options for the graph title text.
Color Select a color scheme for the graph title text.
TABLE 1-6: PLOT TAB
Item Description
Domain and Range Axes Tabs
Label Enter a label for the axis
Font Select font options for the label
Paint Select a color scheme for the label (text and background).
Ticks Check to “Show tick labels”. Uncheck to hide.Select font options for the tick labels.Check to “Show tick marks”. Uncheck to hide.
Range Check to “Auto-adjust range” values.Uncheck to enter a “Minimum range value” and a “Maximum range value”.
TickUnit Check for “Auto-Selection of TickUnit”.Uncheck to enter “TickUnit value”.
Appearance Tab
Outline stroke Select the thickness of the line around the graph.
Outline paint Select the color of the line around the graph.
Background paint Select the color of the graph background.
Orientation Select an orientation for the graph domain (x) axis:• Vertical (default)• Horizontal
TABLE 1-7: OTHER TAB
Item Description
Draw anti-aliased Check to use anti-aliasing when drawing the graph.Uncheck to turn anti-aliasing off.
Background paint Select the color of the background outside of the graph.
Series paint Not implemented
Series stroke Not implemented
Series outline paint Not implemented
Series output stroke Not implemented
2015 Microchip Technology Inc. DS50002384A-page 21
Code Profiling Plugin for MPLAB® X IDE
NOTES:
DS50002384A-page 22 2015 Microchip Technology Inc.

CODE PROFILING PLUGIN®
FOR MPLAB X IDEAppendix A. Code Profiling Reference
A.1 INTRODUCTION
The Code Profiling plugin shows you the percentage of time spent in each function. It does not give precise timing data. However, if you wish to understand the timing implications of Code Profiling on your code, the reference section will give you greater insight.
Code profiling within MPLAB X IDE is accomplished by instrumenting each function within your target code. That instrumentation includes a call at the beginning of each function that retrieves the PC and sends that data up through the hardware tool to the host, and a call at the end of each function that sends a corresponding function exit indicator. The raw profiling data is displayed by the Code Profiling plugin and display.
This instrumentation increases the time that is spent in each function. The amount of time contributed by the instrumentation depends upon the clock speed of the target, the device (or part) on the target, and the compiler being used.
• Data Generation and Collection Process
• Baseline Function Creation and Usage
• Caveats
• Conclusion
• Example Calculation
A.2 DATA GENERATION AND COLLECTION PROCESS
Figure A-1 presents the generation and flow of code profiling data from the target up to the host. This data is eventually used by the Code Profiling plugin and display.
As can be seen in the figure, the device on the target, through the instrumentation code, retrieves the PC and sends it up to the MPLAB REAL ICE in-circuit emulator. The emu-lator then appends a time-stamp and sends the data up to MPLAB X IDE. The IDE then saves that raw data in a circular file. The circular file and its size are selected through the emulator “Trace and Profiling” page in the Project Properties window.
If the Code Profiling plugin is installed and its display is open when a debug session is paused or stopped, the data is interpreted and displayed in tabular form on a function-by-function line basis. Two main measures are given per function in that table: Average Excluded Time and Average Included Time. Average Included Time is the total time to execute a function and includes the time taken by any other functions it may call. Average Excluded Time is the total time to execute code only within that function and excludes the times of any functions it may call. Both of those times include code profiling instrumentation execution time.
When the debug session is continued, the log file is cleared and the data starts over again. Therefore incoming data cannot be concatenated.
The following sections describe how to calculate the time added by code profiling instrumentation. This will be done by creating a baseline function from which the code profiling instrumentation overhead time can be observed and then used to refine the recorded durations of the other functions in the target code.
2015 Microchip Technology Inc. DS50002384A-page 23

Code Profiling Plugin for MPLAB® X IDE
FIGURE A-1: CODE PROFILING GENERATION AND COLLECTION
DS50002384A-page 24 2015 Microchip Technology Inc.

Code Profiling Reference
A.3 BASELINE FUNCTION CREATION AND USAGE
A baseline function is one that contains only the code profiling instrumentation with little or no function entry and exit overhead (such as items like link, unlink, and return instructions).
The baseline function is defined simply as follows:
This function should be called outside of the principal while loop that normally consti-tutes the central code in the target’s main( ) function. For example:
When the target is run, it will execute the baseline function and then stop after its execution. The Code Profiling plugin display should show the baseline function with its average Excluded and Included times, which for this case should be equal. This value can be subtracted from either the Average Excluded Time or the Average Included Time of the other target functions to obtain a more accurate time for their execution (see Section A.4 “Caveats” for additional complications in adjusting the Average Included Time in this manner).
The breakpoint should then be removed, the Code Profiling display and data cleared (right click on the display), and the debug session restarted to collect data for the target functions.
A.4 CAVEATS
There are two main caveats to using the baseline function time as described above.
First, if clock switching is used, the above strategy will not work, as the baseline and/or other target functions may be operating at different clock frequencies. There will be no consistent ruler from which to base execution times.
Second, nested function calls contain multiple calls to the instrumentation code. As such, the baseline value can be subtracted from a function’s Average Excluded Time value to arrive at a more refined value for the Average Excluded Time. However when used on the Average Included Time, the baseline value for any calls that a function makes must also be included in the adjustment. For example:
void baseline () { return;
}
void main (void) { // possible start-up or initialization code here...
baseline();Set breakpointhere ----------> while (1) { // your main loop here... }
} // end main
Function_A() calls Function_B() which calls Function_C() which calls Function_D()
2015 Microchip Technology Inc. DS50002384A-page 25

Code Profiling Plugin for MPLAB® X IDE
In this instance, the baseline value would have to be subtracted four times from Function_A’s Average Included Time.
In either case (Excluded or Included time), if a function makes multiple calls to other functions, those calls may be bracketed by conditional statements, and as such not all calls within a function may be made. The code profiling has no way of determining this condition when generating the average Excluded and Included times.
A.5 CONCLUSION
Using a baseline function scheme allows the possibility of refining the function timing values provided by the Code Profiling plugin given the specific clock speed, device (part), and compiler that you have employed.
A.6 EXAMPLE CALCULATION
The following calculations are based on a dsPIC33EP part running at 40 MHz (20MIPS).The subroutine being adjusted does not call any other functions. The compiled example code for the function is as follows:
The Code Profiling display shows 0.031 milliseconds (mS), or 31 microSeconds (uS), for both the baseline function average Excluded and Included times. The number of samples taken were 1664 for this example.
Since the clock is running at 40 MHz (25 nanoSeconds (nS) per cycle), and each instruction is two cycles (hence the 20MIPS), each instruction takes 50 nS to execute.
The Average Included Time for function_C, from the Code Profiling display is listed as 0.032 mS (32 uS). Since there are no calls within function_C, we can simply subtract the baseline time from the function time, 32-31, resulting in 1 uS for function_C. (The Code Profiling display has a resolution of down to 1 uS).
To verify that this is close to what would be the actual value (again, given the resolution of the time-stamp and the Code Profiling calculations), the function_C time (without profiling) would be:
Rounding gives 1uS, the same as the 32-31 above.
Usually the larger a function, the closer will be the timing averages and hence the adjusted values to the actual timing (if the function does not have conditional calls).
function_C LNK #0x0 CALL __function_level_profiling_long NOP MOV gVarX, W4 : <-- Contains 22 more instructions (no calls) MOV WS, 0x106c ULNK GOTO __function_level_profiling_zero
NOP
function_C LNK #0x0 50 MOV gVarX, W4 50 : <-- 22 more instructions (so 22 x 50nS) 1100 MOV WS, 0x106c 50 ULNK 50 RETURN 50 ---- 1350 nS
or 1.35 uS
DS50002384A-page 26 2015 Microchip Technology Inc.

CODE PROFILING PLUGIN®
FOR MPLAB X IDEIndex
CChart Properties....................................................... 21Code Profiling Graph
Data Point Range ............................................. 17Legend.............................................................. 18Pan ................................................................... 16Print image........................................................ 20Save image to PNG .......................................... 20Set Appearance ................................................ 21Zoom In and Out ..........................................16, 20
Code Profiling MenuClear View and Data......................................... 19Go To Function Source..................................... 19Reload Data...................................................... 19
Code Profiling WindowCalls.................................................................. 12Column Setup ................................................... 19Count ................................................................ 15Excluded ........................................................... 13Filter Data ......................................................... 19Included ............................................................ 14Output Statistics................................................ 19Show Graph...................................................... 19
FFunction Level Profiling (FLP).................................... 5
Summary Data.................................................. 15Time Stamp ...................................................... 12
PPC Profiling .........................................................10, 15PC Sampling .......................................................10, 15Project Properties .................................................... 19
TTrace and Profiling............................................8, 9, 10
2015 Microchip Technology Inc. DS50002384A-page 27

Code Profiling Plugin for MPLAB® X IDE
NOTES:
DS50002384A-page 28 2015 Microchip Technology Inc.

2015 Microchip Technology Inc. DS50002384A-page 29
AMERICASCorporate Office2355 West Chandler Blvd.Chandler, AZ 85224-6199Tel: 480-792-7200 Fax: 480-792-7277Technical Support: http://www.microchip.com/supportWeb Address: www.microchip.com
AtlantaDuluth, GA Tel: 678-957-9614 Fax: 678-957-1455
Austin, TXTel: 512-257-3370
BostonWestborough, MA Tel: 774-760-0087 Fax: 774-760-0088
ChicagoItasca, IL Tel: 630-285-0071 Fax: 630-285-0075
ClevelandIndependence, OH Tel: 216-447-0464 Fax: 216-447-0643
DallasAddison, TX Tel: 972-818-7423 Fax: 972-818-2924
DetroitNovi, MI Tel: 248-848-4000
Houston, TX Tel: 281-894-5983
IndianapolisNoblesville, IN Tel: 317-773-8323Fax: 317-773-5453
Los AngelesMission Viejo, CA Tel: 949-462-9523 Fax: 949-462-9608
New York, NY Tel: 631-435-6000
San Jose, CA Tel: 408-735-9110
Canada - TorontoTel: 905-673-0699 Fax: 905-673-6509
ASIA/PACIFICAsia Pacific OfficeSuites 3707-14, 37th FloorTower 6, The GatewayHarbour City, Kowloon
Hong KongTel: 852-2943-5100Fax: 852-2401-3431
Australia - SydneyTel: 61-2-9868-6733Fax: 61-2-9868-6755
China - BeijingTel: 86-10-8569-7000 Fax: 86-10-8528-2104
China - ChengduTel: 86-28-8665-5511Fax: 86-28-8665-7889
China - ChongqingTel: 86-23-8980-9588Fax: 86-23-8980-9500
China - DongguanTel: 86-769-8702-9880
China - HangzhouTel: 86-571-8792-8115 Fax: 86-571-8792-8116
China - Hong Kong SARTel: 852-2943-5100 Fax: 852-2401-3431
China - NanjingTel: 86-25-8473-2460Fax: 86-25-8473-2470
China - QingdaoTel: 86-532-8502-7355Fax: 86-532-8502-7205
China - ShanghaiTel: 86-21-5407-5533 Fax: 86-21-5407-5066
China - ShenyangTel: 86-24-2334-2829Fax: 86-24-2334-2393
China - ShenzhenTel: 86-755-8864-2200 Fax: 86-755-8203-1760
China - WuhanTel: 86-27-5980-5300Fax: 86-27-5980-5118
China - XianTel: 86-29-8833-7252Fax: 86-29-8833-7256
ASIA/PACIFICChina - XiamenTel: 86-592-2388138 Fax: 86-592-2388130
China - ZhuhaiTel: 86-756-3210040 Fax: 86-756-3210049
India - BangaloreTel: 91-80-3090-4444 Fax: 91-80-3090-4123
India - New DelhiTel: 91-11-4160-8631Fax: 91-11-4160-8632
India - PuneTel: 91-20-3019-1500
Japan - OsakaTel: 81-6-6152-7160 Fax: 81-6-6152-9310
Japan - TokyoTel: 81-3-6880- 3770 Fax: 81-3-6880-3771
Korea - DaeguTel: 82-53-744-4301Fax: 82-53-744-4302
Korea - SeoulTel: 82-2-554-7200Fax: 82-2-558-5932 or 82-2-558-5934
Malaysia - Kuala LumpurTel: 60-3-6201-9857Fax: 60-3-6201-9859
Malaysia - PenangTel: 60-4-227-8870Fax: 60-4-227-4068
Philippines - ManilaTel: 63-2-634-9065Fax: 63-2-634-9069
SingaporeTel: 65-6334-8870Fax: 65-6334-8850
Taiwan - Hsin ChuTel: 886-3-5778-366Fax: 886-3-5770-955
Taiwan - KaohsiungTel: 886-7-213-7828
Taiwan - TaipeiTel: 886-2-2508-8600 Fax: 886-2-2508-0102
Thailand - BangkokTel: 66-2-694-1351Fax: 66-2-694-1350
EUROPEAustria - WelsTel: 43-7242-2244-39Fax: 43-7242-2244-393
Denmark - CopenhagenTel: 45-4450-2828 Fax: 45-4485-2829
France - ParisTel: 33-1-69-53-63-20 Fax: 33-1-69-30-90-79
Germany - DusseldorfTel: 49-2129-3766400
Germany - MunichTel: 49-89-627-144-0 Fax: 49-89-627-144-44
Germany - PforzheimTel: 49-7231-424750
Italy - Milan Tel: 39-0331-742611 Fax: 39-0331-466781
Italy - VeniceTel: 39-049-7625286
Netherlands - DrunenTel: 31-416-690399 Fax: 31-416-690340
Poland - WarsawTel: 48-22-3325737
Spain - MadridTel: 34-91-708-08-90Fax: 34-91-708-08-91
Sweden - StockholmTel: 46-8-5090-4654
UK - WokinghamTel: 44-118-921-5800Fax: 44-118-921-5820
Worldwide Sales and Service
01/27/15