Coca Cola Company and Industry Profile - RocSearch · • Coca-Cola is a leading non-alcoholic...
34
COCA-COLA Industry and Company Profile
Transcript of Coca Cola Company and Industry Profile - RocSearch · • Coca-Cola is a leading non-alcoholic...

COCA-COLAIndustry and Company Profile

Agenda• Executive Summary
• Glossary
• Industry Profile
– Global Industry Overview
– Competitive Landscape - Global
– Regional Industry Overview
– Competitive Landscape - US
– Industry Trends & Drivers
– Industry Challenges
– IT Forecast & Trends
• Company Profile
– Company Overview
– Performance Overview
– Segment Overview
– Competitor Financial Performance
– Credit Ratings and Stock Chart
– Strategic Direction
– Challenges
– SWOT Analysis
– IT Initiatives

3
Executive Summary
Global Industry• The global beverage industry has reached a value of US$1,581.7 billion, witnessing a CAGR of 2.6% over 2005-09 and is forecasted to decelerate, with an anticipated CAGR of
2.3% for the five year period 2009-2014, which is expected to drive the industry to a value of $1,775.3 billion by the end of 2014• In 2009, Food was the largest segment of the global food, beverage and tobacco industry, accounting for ~67% of the industry's total value while the beverage industry
formed 25% of the total industry value• The European and Asia-Pacific industries grew at a CAGR of 1.8% and 5.1% respectively, between 2005 and 2009, to reach respective values of US$806 billion and US$306.4
billion in 2009• Seven out of ten global food and beverage companies are based out of US- reflecting the country’s strong capabilities in both food products and beverages segments • Consumers of the beverage industry are shifting their focus towards health and wellness, convenient and innovative products such as nutrient-enhanced energy drinks, and
companies are looking at inorganic growth options to achieve the capabilities for the same • The industry has been heavily relying on technology and IT solutions to attain efficiency in packaging, and distribution management systems
Regional Industry (US)• The total US food, beverage and tobacco shipments reached US$793.2 billion in 2010, growing at a CAGR of 3.8% over the period spanning 2005-2010• Food product shipments in the US reached US$667.3 billion in 2010, witnessing a CAGR of 4.6% over the period spanning 2005-2010• Beverage shipment in the US reached US$90.3 billion in 2010, witnessing a CAGR of 2.1% between 2005 and 2010• Gains in the US beverage industry are expected to be boosted by new product introductions with novel ingredients that contribute to a healthy lifestyle• Though carbonated soft drinks constitute the maximum share in the beverages segment, they are slowly losing this share to non-carbonated sports and health-boosting
drinks• Almost six out of ten leading food and beverage companies in the US are headquartered at the East Coast adjacent to the shore
Industry
• Coca-Cola is a leading non-alcoholic beverage company with revenues of US$35.12 billion , 500+brands,1.7 billion servings per day and presence in nearly 200 countries• The company operates in seven business segments- Eurasia and Africa , Europe, Latin America, North America, Pacific, Bottling Investments and Corporate. The North America
Segment is the largest contributor to the revenue while the Europe segment is the largest contributor to the operating income• Diverse geographical presence and strong brand equity offers Coca-Cola a distinct competitive advantage. However, high competition and government regulations pose a
threat to the company's profitability• The company’s strategic priorities include driving global beverage leadership; accelerating innovation; and leveraging its balanced geographic portfolio• Coca-Cola has been using information systems extensively in all aspects of the business, including RFID in touch-screen vending machines, supply chain management solution,
VOIP technology in distribution system, and sales force automation
Coca-Cola

4
Glossary
CAGR Compounded Annual Growth Rate
CSD Carbonated Soft Drinks
ERP Enterprise Resource Planning
IS Information Systems
MDM Master Data Management
R&D Research & Development
RTD Ready-To-Drink
SaaS Software As A Service
CCE Coca-Cola Enterprise’s
DSP Dr Pepper Snapple

Industry ProfileGlobal Food & Beverages Market

6
The global beverage industry’s value has increased from US$1,428.4 billion in 2005 to US$1,581.7 billion in 2009, representing CAGR of 2.6% over the four years
Global Industry Overview
• Food is the largest segment of the global food, beverage and tobacco industry while the beverage industry contributes 25% to the total market
• The beverage industry grew by 2.2% Y-o-Y in 2009 to reach a value of US$1,618.4 billion at a CAGR of 2.5% over 2005-10– The European and Asia-Pacific industries grew with CAGR of 1.8% and 5.1%
respectively, over the same period, to reach respective values of US$806.0 billion and US$306.4 billion in 2009
• The industry is forecasted to decelerate, with an anticipated CAGR of 2.3% for the five year period 2009-2014, which is expected to drive the industry to a value of $1,775.3 billion by the end of 2014– The European and Asia-Pacific industries are expected to grow with CAGRs
of 1.5% and 4.9% respectively, over the same period, to reach respective values of $867.3 billion and $388.2 billion in 2014
Global Food & Beverage Industry Market Trends
Source: Datamonitor – Global Food Product – March 2010, European Securities Network- SNS Securities- Nestle
Food, Beverage and Tobacco Market, 2009
67.1%
25.0%
7.9%
Food Beverages Tobacco
Global Food Market Value
3,6613,850 4,046 4,194 4,235 4,381 4,568 4,780 5,022 5,255
0%
1%
2%
3%
4%
5%
6%
0
1,000
2,000
3,000
4,000
5,000
6,000
2005 2006 2007 2008 2009 2010E 2011E 2012E 2013E 2014E
Total Market Value Y-o-Y growth
US$
Bill
ions
Global Beverage Market Value
1,428 1,469
1,5141,548 1,582 1,618 1,658 1,696 1,737 1,775
0.0%
0.5%
1.0%
1.5%
2.0%
2.5%
3.0%
3.5%
0
500
1,000
1,500
2,000
2005 2006 2007 2008 2009 2010E 2011E 2012E 2013E 2014E
Total Market Value Y-o-Y growth
US$
Bill
ions
Total=US$6,319.2 billion

7
• The Coca-Cola Company is the leading player in the global beverages industry, generating a 16.1% share of the industry's volume
• Kraft Foods Inc. is the leading player in the US and second biggest player globally in the food products industry
Competitive Landscape - GlobalSeven out of ten global food and beverage market companies are based out of US- reflecting the country’s strong capabilities in both food products and beverages segments
Key Highlights
Note: 1) Includes companies in pure-beverage category; 2) Includes agricultural raw materials alsoSource: Bloomberg, Freedonia- US Food Industry Overview 2010, US Beverage Industry Overview 2010
Leading Food & Beverage Industry Players1
Rank Company Country Revenues (US$ billions)
1 Nestle SA Switzerland 100.6
2 Archer-Daniels USA 61.7
3 Unilever UK 58.7
4 Pepsico Inc. USA 57.8
5 Kraft Foods Inc. USA 49.2
6 Coca-Cola USA 35.1
7 Tyson Foods USA 28.4
8 Danone Spain 22.6
9 General Mills USA 14.8
10 Kellogg Co. USA 12.4
Source: Bloomberg- Financial Year 2010 Data
Global
Food Products2 Beverages
22.6% 27.8%
37.2% 19.4%
31% 51%
9.2% 1.9%
Americas
Asia Pacific
Europe
Rest of the World
Food & Beverage Industry Geographic Segmentation
8
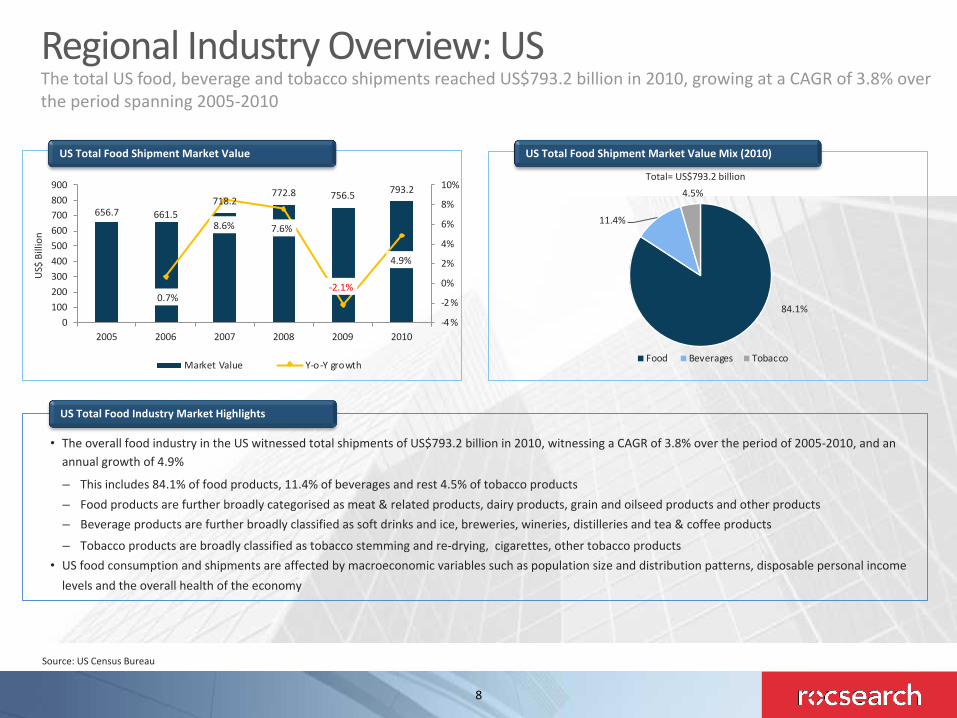
Regional Industry Overview: USThe total US food, beverage and tobacco shipments reached US$793.2 billion in 2010, growing at a CAGR of 3.8% over the period spanning 2005-2010
• The overall food industry in the US witnessed total shipments of US$793.2 billion in 2010, witnessing a CAGR of 3.8% over the period of 2005-2010, and an annual growth of 4.9%
– This includes 84.1% of food products, 11.4% of beverages and rest 4.5% of tobacco products– Food products are further broadly categorised as meat & related products, dairy products, grain and oilseed products and other products– Beverage products are further broadly classified as soft drinks and ice, breweries, wineries, distilleries and tea & coffee products
– Tobacco products are broadly classified as tobacco stemming and re-drying, cigarettes, other tobacco products• US food consumption and shipments are affected by macroeconomic variables such as population size and distribution patterns, disposable personal income
levels and the overall health of the economy
US Total Food Industry Market Highlights
US Total Food Shipment Market Value Mix (2010)US Total Food Shipment Market Value
656.7 661.5718.2
772.8 756.5 793.2
0.7%
8.6% 7.6%
-2.1%
4.9%
-4 %
-2 %
0%
2%
4%
6%
8%
10%
0100200300400500600700800900
2005 2006 2007 2008 2009 2010
Market Value Y-o-Y growth
US$
Bill
ion
84.1%
11.4%
4.5%
Food Beverages Tobacco
Total= US$793.2 billion
Source: US Census Bureau

9
Segmental Overview: US (1/2)Food product shipments in the US reached ~US$667.3 billion in 2010, at an annual increase of 4.9%, witnessing a CAGR of 4.6% over the period spanning 2005-2010
• Food shipments in the US reached ~US$667.3 billion in 2010, at an annual increase of 4.9%
– The market has witnessed a CAGR of 4.6% over the period spanning 2005-2010
• Shipments of meat and related products totaled ~US$189.5 billion in 2010, based on growth of ~10% from 2009
– This segment includes fresh and frozen meat, poultry and seafood processed and prepared packaged foods
• Other Food products reached US$293.6 billion in 2010, growing at a steady rate over the years
– This segment includes sugar products such as chocolates, non-chocolate candies, chewing gum and miscellaneous items such as nuts, peanut butter, dressings and other packaged sauces
• Dairy product shipments reached US$91.0 billion in 2010
– Includes packaged milk, cheese, yogurt, ice cream, condensed milk and similar packed products
• Shipments of grain and oilseed mill products were US$94.5 billion in 2010 based on the fastest annual pace among the segments
– This segment includes rice, corn and flour milling; cereals; breads, cookies, baking mixes and certain oils
US Food Industry Market Trends
Food Industry Segmentation By Product, 2010
28%
44%
14%
14%
Meat &RelatedProducts
OtherFood
DairyProducts
Grain &OilseedProducts
Total= US$667.3 billion
Food Shipment Market Value
532.7 537.4590.0
647.4 636.2 667.3
0.9%
9.8%9.7%
-1.7%
4.9%
-4 %-2 %0%2%4%6%8%10%12%
0
200
400
600
800
2005 2006 2007 2008 2009 2010
Market Value Y-o-Y growth
US$
Bill
ions
Source: US Census Bureau

10
Segmental Overview: US (2/2)Beverage shipment in the US reached US$90.3 billion in 2010, witnessing a CAGR of 2.1% between 2005 and 2010
Note: 1) Breakdown of 2010 shipments is not availableSource: US Census Bureau, Freedonia- US Food Industry Overview 2010
• Beverage shipment in the US reached US$90.3 billion in 2010, witnessing a CAGR of 2.1% between 2005 and 2010
– Gains have been boosted by new product introductions of beverages with novel ingredients that contribute to a healthy lifestyle
– Soft drinks continue to account for the largest share of beverage production despite eroding market share due to competition from sports drinks and a range of ready-to-drink (RTD) beverages such as energy drinks
• In 2009, the leading producers of beverages for the US market were Coca-Cola and PepsiCo. Both are expanding their product lines to include beverages that appeal to health-conscious consumers
• Production volume of beverages in the US grew 1.1% per annum between 2004 and 2009 to reach 43.2 billion gallons
• Production of carbonated soft drinks (CSDs) totaled 14.4 billion gallons in 2009 based on yearly declines of 1.6% from 2004
– Carbonated beverages have slowly lost market share to non-carbonated drinks as younger consumers are opting for the perceived health benefits of bottled water, and energy and sports drinks, which are largely un-carbonated
• Fruit beverages suffered the sharpest declines among all beverages due to ongoing concerns about their high caloric and sugar content
• Sports drinks posted growth of 4.4% per year in the 2004-2009 period, boosted by their ability to speed rehydration
US Beverage Industry Market Trends
Beverage industry segmentation by product, 20091
51%
23%
17%
9%
Soft drink and ice Breweries Wineries Distilleries
Total= US$84.9 billion
Beverages Shipment Market Value
81.3 82.688.0 87.9 84.9
90.3
1.6%
6.5%
-0.1%
-3.4%
6.3%
-4 %
-2 %
0%
2%
4%
6%
8%
0
20
40
60
80
100
2005 2006 2007 2008 2009 2010
Market Value Y-o-Y growth
US$
Bill
ion

11
Competitive Landscape - RegionalMost of the leading food and beverage companies in the US are concentrated in the region of Northern East Coast
Note: *Financial Year 2010 DataSource: Bloomberg, Freedonia- US Food Industry Overview 2010, US Beverage Industry Overview 2010
Top 10 Regional Food & Beverage Companies*
Rank Company HQ LocationRevenues
(US$ billions)
Asset Turnover
Ratio
R&D Expenditure (US$ billions)
1 Pepsico Inc. New York 43.2 1.07 0.488
2 Kraft Foods Inc.
Illinois 40.4 0.61 0.583
3 Coca-Cola Georgia 35.1 0.58 NA
4 Tyson Foods Arkansas 26.7 2.66 NA
5 General Mills
Minnesota 14.6 0.83 0.218
6 Kellogg Co. Michigan 12.5 1.08 0.187
7 ConAgra Foods
Nebraska 12.4 1.06 0.078
8 Sara Lee Corp.
Illinois 10.8 1.18 NA
9 H.J. Heinz Co.
Pennsylvania 10.0 1.06 NA
10 Campbell Soup
New Jersey 7.5 1.24 0.123
USA
Nebraska
IllinoisArkansas Georgia
MichiganMinnesota New York
Pennsylvania
New Jersey

12
Industry Trends & Drivers (1/2)Consumers of the beverage industry are shifting their focus towards health and wellness, convenient and innovative products, as companies are looking at inorganic growth options to achieve the capabilities for the same
High Focus On Health And Wellness
• Consumers are looking for health and energy drinks to counter poor health caused by insufficient exercise and to get instant high energy levels
Global sales for food and drink in the ‘naturally healthy’ category reached US$103 billion in 2004
Trends
Source: Fonterra, Report Linker News, Research and Markets, Multisorb, Bakery and Snacks, Scientist Live, HKTDC Info
Business Impact Technology/IT Impact
• Opportunities for technology players to develop solutions that accurately measure the nutrient value in beverages, and also retain the nutritional content during the shelf-life of the product
Rise In Mergers & Acquisitions
• To avoid constraining effects of economic uncertainty in increasingly matured carbonated drinks markets, expansion into other markets has been essential in the beverage industry
• ERP technology providers can help by providing smooth process integration of merged companies and change management processes
New Product Development
• Beverage manufacturers are increasingly investing in new product developments in light of better economic prospects
• Opportunities for technology companies to focus on solutions that increase the shelf-life of beverages, such as controlling the gas mixture to preserve its quality
Changing Consumer Preferences
• Producers are faced with finding ways to meet ever-changing consumer demands, while at the same time controlling costs and maintaining high quality and safety standards
• Beverage companies leverage the market analytics solutions to take effective decisions about their product mix

13
Industry Trends & Drivers (2/2)The beverage industry is moving its attention to higher technology adoption, R&D and nutrient-enhanced energy drinks
Higher Product Pricing • To offset cost pressures in the economic slowdown, Beverage companies are raising their product prices or decreasing the size of the beverage
Rise In Technology Adoption
Trends
Source: Fonterra, Report Linker News, Research and Markets, Multisorb, Bakery and Snacks, Scientist Live, HKTDC Info
• Beverage companies are increasingly depending on technology and IT solutions across functions to achieve cost optimization and efficiency
Business Impact Technology/IT Impact
• Technology solution providers can help by providing customized analytics solutions to gain insights on consumer preferences the size of the drink and competitive pricing
• Growth in opportunities for technology and IT companies to provide innovative solutions that cater to the beverage industry
More Focus On R&D• As consumers are shifting their preferences towards
health-drinks and energy beverage companies are enhancing their R&D skills to address their requirements
• Beverage companies are implementing special technologies to develop new products at a faster rate to capitalize on the growing market
Introduction Of nutrient-enhanced
energy drinks
• Leading beverage companies are increasingly investing in nutrient-enhanced energy drinks and teas, to pioneer a new industry between beverages and pharmaceuticals
• This has required them to invest largely in high-end research and development systems in order to treat chronic conditions such as diabetes and obesity

14
Industry Challenges (1/2)The food processing industry suffers from rising costs of raw materials, stringent regulations and counterfeit goods market- all of which are directly affecting its sales and revenue
Increase In Input Costs
§ The food industry is subject to rising costs of its raw materials with the increase in the prices of agricultural products and energy — Owing to the perishable nature of most raw
materials, food product companies are pressurized to maintain their inventory and order management very critically
Trends
Source: Reuters, Meat Trade News Daily-UK, Financial Times, Just-Food, Research and Markets, SAP Website, GlobalData- Nestle SA - Financial and Strategic Analysis
Stringent Regulatory Environment
§ The food industry is characterized by strict government regulations, such as those from US Food and Drug Administration (FDA), Department of Agriculture, the Environmental Protection Agency etc— In 2009, lawsuit was filed by the Food safety Law
Firm against Nestle for concerns over food contamination at its Danville Plant, resulting in product recall by the company
Rising Counterfeit Goods Market
§ The food industry may be affected by the rising influx of counterfeited products in the market which leads to a drop in the sales as well as the image of the established brand— The US Chamber of Commerce estimates a cost of
US$500-600 billion a year on the global economy due to counterfeiting and piracy activities in food
— The global anti counterfeit food and medicine packaging market is expected to be worth US$79.3 billion by 2014, growing at a CAGR of 8.6% from 2009
Business Impact Technology/IT Impact
§ Opportunities for ERP players to automate and control end-to-end processes within the packaged food industry, including management of procurement process of raw materials, customer orders, inventory management etc
§ Technology solutions can assist in accurate batch control for safety compliance
§ Track-and-trace capability of IT solutions can also help to find and recall a defective batch that may have been already delivered to a customer and trigger batch-specific returns processing
§ Opportunities for technology players to enhance their solution offerings on food quality checks, authentication packaging and track and trace packaging technologies

15
Industry Challenges (2/2)The industry is characterized by ever-changing consumer preferences and need to innovate rapidly to address such needs
Changing Consumer Preferences
§ Producers are faced with finding ways to meet ever-changing consumer demands, while at the same time controlling costs and maintaining high quality and safety standards
Trends
Source: Trade and Industry Development
Business Impact Technology/IT Impact
§ Food companies leverage the market analytics solutions to take effective decisions about their product mix
16
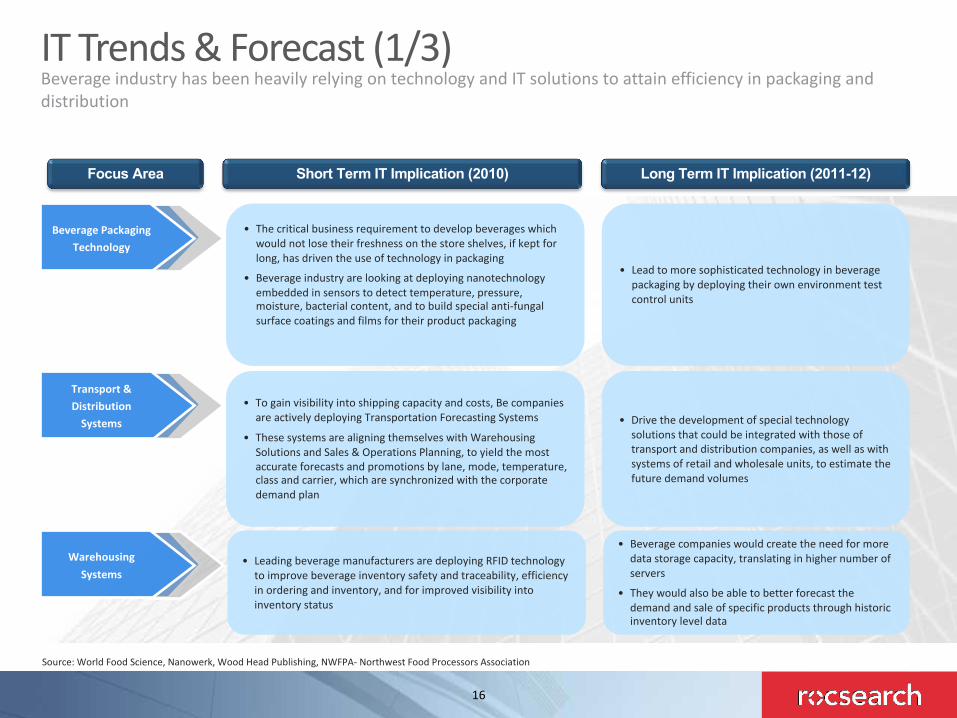
IT Trends & Forecast (1/3)Beverage industry has been heavily relying on technology and IT solutions to attain efficiency in packaging and distribution
Focus Area Short Term IT Implication (2010)
• The critical business requirement to develop beverages which would not lose their freshness on the store shelves, if kept for long, has driven the use of technology in packaging
• Beverage industry are looking at deploying nanotechnology embedded in sensors to detect temperature, pressure, moisture, bacterial content, and to build special anti-fungal surface coatings and films for their product packaging
Long Term IT Implication (2011-12)
• Lead to more sophisticated technology in beverage packaging by deploying their own environment test control units
• Leading beverage manufacturers are deploying RFID technology to improve beverage inventory safety and traceability, efficiency in ordering and inventory, and for improved visibility into inventory status
• Beverage companies would create the need for more data storage capacity, translating in higher number of servers
• They would also be able to better forecast the demand and sale of specific products through historic inventory level data
Source: World Food Science, Nanowerk, Wood Head Publishing, NWFPA- Northwest Food Processors Association
Beverage Packaging Technology
Warehousing Systems
• To gain visibility into shipping capacity and costs, Be companies are actively deploying Transportation Forecasting Systems
• These systems are aligning themselves with Warehousing Solutions and Sales & Operations Planning, to yield the most accurate forecasts and promotions by lane, mode, temperature, class and carrier, which are synchronized with the corporate demand plan
• Drive the development of special technology solutions that could be integrated with those of transport and distribution companies, as well as with systems of retail and wholesale units, to estimate the future demand volumes
Transport & Distribution
Systems

17
IT Trends & Forecast (2/3)Cloud computing, Account Management Systems and Market Analytics solutions provide operational efficiency, cross-selling opportunities and consumer insights to the beverage industry
Focus Area Short Term IT Implication (2010)
• Beverage companies are turning to SaaS and cloud solutions to implement their integration needs through Enterprise Resource Planning (ERP)
• Companies are integrating their procurement, production, financial, pricing and other-related departments for operational efficiency
– These systems are used as management tools in decision-making and strategy formulation to improve business results
Long Term IT Implication (2011-12)
• More integration projects which deliver infrastructure utility and consulting projects, comprehensive of business and IT advisory services
Source: Company website, Epsilon
• With the growing need to manage relationships with clients, suppliers and other business partners, beverage companies are using Account Management Systems
• These systems are also helping the companies identify areas of business process improvement, and opportunities to cross-sell and up-sell services
• Agile technology solutions that can be integrated with the systems of the business partners to enhance the service opportunities
• Beverage companies are implementing business intelligence and analytics solutions to gain insights from large consumer databases to offer services such as marketing campaigns, direct-to-consumer marketing solution and permission-based email marketing services, depending on user demographics and preferences
• Require the beverage companies to expand their IT setup in terms of data storage and processing to save and track the growing data
Account Management
Systems
Cloud Computing & SaaS
Market Analytics & Modelling
Technologies
Company ProfileCoca-Cola

19
Company OverviewCoca-Cola is one of the world’s largest non-alcoholic beverage company, with nearly 500 brands in more than 200 countries
• Feb. 2011 - Coca-Cola and Heinz announced strategic partnership toexpand use of innovative PlantBottle packaging -– To produce PET plastic bottles which are made partially from plants
and have a lower reliance on non-renewable resources– Coca-Cola first launched PlantBottle in 2009
• Feb. 2010 - Coca-Cola acquired Coca-Cola Enterprise’s (CCE’s) NorthAmerica’s bottling operation - Entered into a contract valued at US$3.4billion, in order to have direct control over 90% of North Americaoperations
• www.thecoca-colacompany.com
Financial Performance – Latest Quarterly*
• Coca-Cola is engaged in the manufacturing and global distribution andmarketing of non-alcoholic beverage concentrates and syrups
• The company owns two types of beverages, under 500 brands– Sparkling beverages - Non-alcoholic carbonated drinks such as energy
drinks and carbonated waters and flavored waters – Still beverages - Non-alcoholic beverages without carbonation such as
enhanced waters, juices and juice drinks• The company has operational reach in 200+ countries at a rate of 1.7
billion servings a day
Business Description
Website
Recent Developments / News
• Dr Pepper Snapple, Pepsico Inc., Nestle SA, Groupe Danone SA , KraftFoods Inc. and Unilever Plc
Major Competitors
• In 1886, Coca-Cola was founded as a soda fountain beverage• In 1894, the company began selling bottled Coca-Cola using a common
glass bottle called Hutchinson• In 1919, the company was incorporated• In 1960, the company launched new brands, Fanta, Sprite, Minute Maid,
Fresca and TaB• In 2008, the company entered into an agreement for the distribution of
Monster Energy beverages in Canada, the US and six West Europeancountries
• In 2006, the company acquired Fonti del Vulture S.r.l., a mineral watercompany in Italy and Apollinaris GmbH, a mineral water brand in Germany
Company History
• Headquarters: Georgia, USA• Presence: Global• Employees: 139,600 (as on 31 December 2010)
Geographic Presence
Particulars Q4 2009 Q4 2010
Revenue 7.51 10.49
Net Income 1.58 5.78
Operating Profit 1.78 1.16
EPS 0.67 2.5
Note: *Numbers in US$ Billions, except per share data in US$Source: Company website, OneSource, Bloomberg, Datamonitor, Globaldata
20
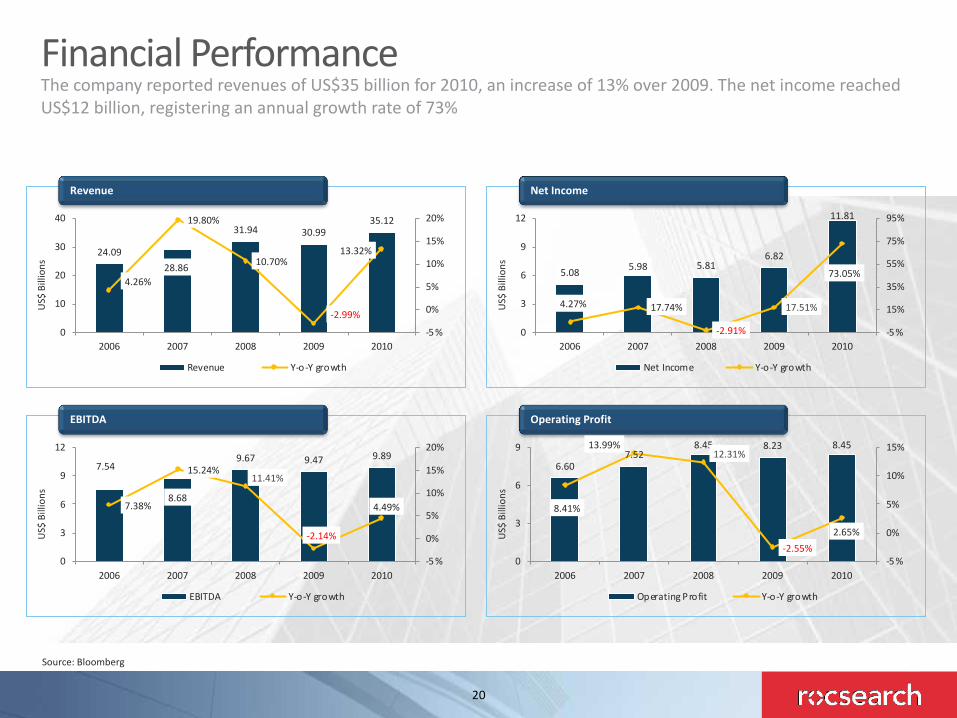
Revenue
US$
Bill
ions
24.0928.86
31.94 30.9935.12
4.26%
19.80%
10.70%
-2.99%
13.32%
-5 %
0%
5%
10%
15%
20%
0
10
20
30
40
2006 2007 2008 2009 2010
Revenue Y-o-Y growth
Net Income
US$
Bill
ions 5.08 5.98 5.81
6.82
11.81
4.27% 17.74%
-2.91%
17.51%
73.05%
-5 %
15%
35%
55%
75%
95%
0
3
6
9
12
2006 2007 2008 2009 2010
Net Income Y-o-Y growth
EBITDA
US$
Bill
ions
7.54
8.68
9.67 9.47 9.89
7.38%
15.24%11.41%
-2.14%
4.49%
-5 %
0%
5%
10%
15%
20%
0
3
6
9
12
2006 2007 2008 2009 2010
EBITDA Y-o-Y growth
Operating Profit
US$
Bill
ions
6.607.52
8.45 8.23 8.45
8.41%
13.99%12.31%
-2.55%2.65%
-5 %
0%
5%
10%
15%
0
3
6
9
2006 2007 2008 2009 2010
Operating Profit Y-o-Y growth
Financial Performance The company reported revenues of US$35 billion for 2010, an increase of 13% over 2009. The net income reached US$12 billion, registering an annual growth rate of 73%
Source: Bloomberg

21
Segmental Performance: OverallThe company operates in seven geographic segments: Eurasia and Africa , Europe, Latin America, North America, Pacific, Bottling Investments and Corporate
Revenue by Geographic Segments*, 2010
Coca-Cola Per Capita Consumption, 2010
Note: *Total revenue by geography is not equal to company revenue as intersegment eliminations are not subtracted while calculating revenue by geography; Total operating income by geography is not equal to company operating income as operating income from the Corporate segment was negative and thus, it is not included in operating income by segmentSource: Company Website, Bloomberg
Operating Income by Geographic Segments*, 2010
29.30%
23.68%20.17%
14.97%
9.65%
2.24%
Europe Latin America Pacific North America Eurasia and Africa Bottling Investments
Total* = US$10.16 billion
30.44%
22.59%14.32%
14.26%
11.20%
6.94%0.25%
North America Bottling Investments Pacific Europe
Latin America Eurasia and Africa Corporate
Total* = US$36.81 billion
• North America segment was the largest contributor to the company’srevenues while Europe was the largest contributor towards company’soperating income in 2010
• Coca-Cola sold approximately 25.5 billion unit cases of its products in2010, an y-o-y increase of 5%– Nearly 80% of the unit case volume were generated outside of North
America• In 2010, the company’s per capita consumption stood at 394 in US. The
highest per capita consumption was witnessed in Mexico (675) and thelowest in India (11)
Key Highlights
89
675394
254 229 179 159 14369 34 11
0
150
300
450
600
Global
Mexico US
S.Africa
Brazil
Germany
Turkey
FranceRussi
aChina
India

22
Segmental Performance (1/3)
Segment Revenue: Eurasia and Africa
• In 2010, the Eurasia and Africa segment held a 7% share to the total revenue and was the fifth largest contributor to the group’s operating income (10%) whileEurope was the largest contributor (29%) to the group operating income and the fourth largest contributor (14%) to the revenue
• The contribution to the total revenue from Eurasia and Africa has remained the same in 2006 and 2010 (7%) while for Europe it has decreased from 18% in2006 and to 14% in 2010
• In Eurasia and Africa, unit case volume increased 12% in 2010, which consisted of 10% growth in sparkling beverages and 21% growth in still Beverages
– The unit case volume growth was primarily attributable to 17% growth in India, which included growth of 15% and 23% in sparkling and still beverages, respectively
• In 2010, unit case volume in Europe was flat, which reflected the impact of continuing difficult macroeconomic conditions in some regions of Europe
Key Highlights
Source: Company Website, Bloomberg
1.802.11
2.33 2.20
2.56
-57.24%
16.91%10.34% -5.59%
16.34%
-6 0%
-4 0%
-2 0%
0%
20%
40%
0
3
2006 2007 2008 2009 2010
US$
Bill
ions
Revenue Y-o-Y growth
Segment Revenue: Europe
4.585.29 5.80 5.20 5.25
-6.80%
15.62%
9.62%
-10.31%
0.88%
-2 0%
-1 0%
0%
10%
20%
0
4
8
2006 2007 2008 2009 2010
US$
Bill
ions
Revenue Y-o-Y growth
Europe was the largest contributor to the group’s operating income while being the fourth largest contributor to the revenue in 2010
23
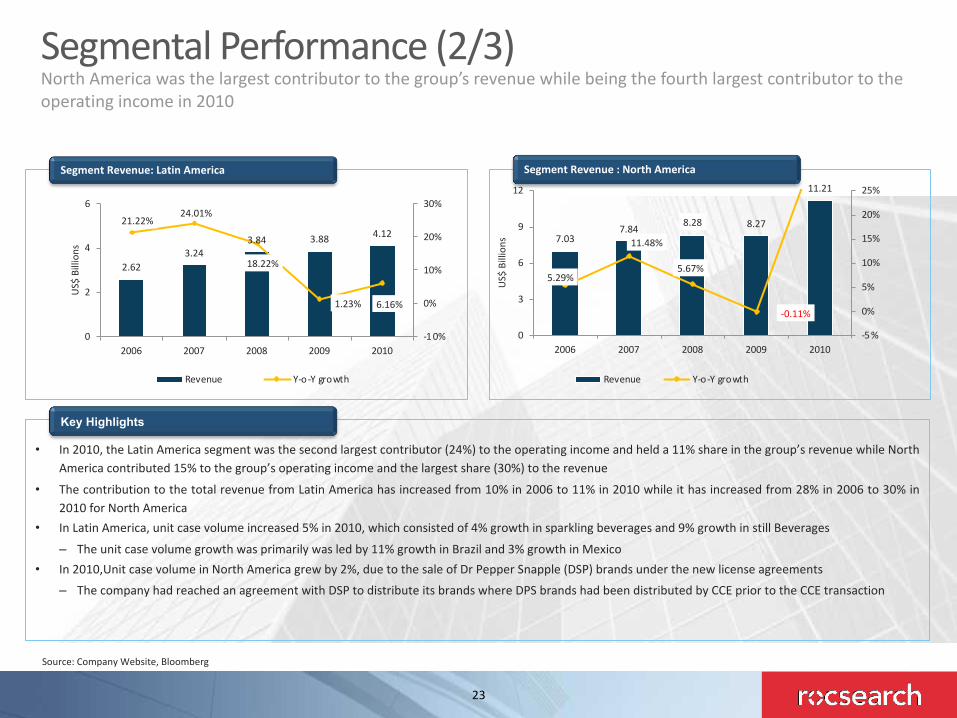
Segmental Performance (2/3)
Segment Revenue: Latin America
• In 2010, the Latin America segment was the second largest contributor (24%) to the operating income and held a 11% share in the group’s revenue while NorthAmerica contributed 15% to the group’s operating income and the largest share (30%) to the revenue
• The contribution to the total revenue from Latin America has increased from 10% in 2006 to 11% in 2010 while it has increased from 28% in 2006 to 30% in2010 for North America
• In Latin America, unit case volume increased 5% in 2010, which consisted of 4% growth in sparkling beverages and 9% growth in still Beverages
– The unit case volume growth was primarily was led by 11% growth in Brazil and 3% growth in Mexico• In 2010,Unit case volume in North America grew by 2%, due to the sale of Dr Pepper Snapple (DSP) brands under the new license agreements
– The company had reached an agreement with DSP to distribute its brands where DPS brands had been distributed by CCE prior to the CCE transaction
Key Highlights
Source: Company Website, Bloomberg
2.623.24
3.84 3.88 4.1221.22%
24.01%
18.22%
1.23% 6.16%
-1 0%
0%
10%
20%
30%
0
2
4
6
2006 2007 2008 2009 2010
US$
Bill
ions
Revenue Y-o-Y growth
Segment Revenue : North America
7.037.84 8.28 8.27
11.21
5.29%
11.48%
5.67%
-0.11%
-5 %
0%
5%
10%
15%
20%
25%
0
3
6
9
12
2006 2007 2008 2009 2010
US$
Bill
ions
Revenue Y-o-Y growth
North America was the largest contributor to the group’s revenue while being the fourth largest contributor to the operating income in 2010

24
Segmental Performance (3/3)
Segment Revenue: Pacific
• In 2010, the Pacific segment was the third largest contributor to therevenue (14%) and operating income (20%) while the Bottlinginvestments segment contributed 23% to the group revenue and 2% tothe operating income. The corporate segment contributed just 0.25% tothe company’s revenue
• The contribution to the total revenue from Pacific segment has declinedfrom 16% in 2006 to 14% in 2010 and it has increased from 20% in 2006and to 23% in 2010 for Bottling investments
• For the second quarter of 2010, the company reported a 5% increase inworldwide volume growth, boosted by its World Cup sponsorship andthe “Open Happiness” marketing campaign
Key Highlights
4.124.41
4.69 4.885.27428.63%
6.99%
6.56% 3.83%8.12%
0%
100%
200%
300%
400%
500%
0
3
6
2006 2007 2008 2009 2010
US$
Bill
ions
Revenue Y-o-Y growth
Segment Revenue: Bottling Investments
5.04
7.698.93 8.32 8.31
18.32%
52.59%
16.06%
-6.84%
-0.08%
-1 0%
30%
70%
0
2
4
6
8
10
2006 2007 2008 2009 2010
US$
Bill
ions
Revenue Y-o-Y growth
Segment Revenue: Corporate
0.09
0.07
0.11
0.09 0.09
12.05%
-22.58%
48.61%
-17.76%
4.55%
-3 0%
-2 0%
-1 0%
0%
10%
20%
30%
40%
50%
60%
0.00
0.02
0.04
0.06
0.08
0.10
0.12
2006 2007 2008 2009 2010
US$
Bill
ions
Revenue Y-o-Y growth
The share of the Bottling Investments segment to the total revenue has grown while that of the Pacific segment has fallen over the last four years
Source: Company Website, Bloomberg

25
The US beverage industry is dominated by two large companies with global distribution networks and resources -Coca-Cola and PepsiCo
Competitor Financial Performance - Annual
Revenue
US$
Bill
ions
30.99
5.53
43.23
92.90
35.12
5.64
57.84
100.64
0
20
40
60
80
100
120
Coca-Cola Dr Pepper Snapple Pepsico Inc. Nestle SA
2009 2010
Net Income
US$
Bill
ions
6.82
0.56
5.959.6311.81
0.53
6.32
32.93
0
5
10
15
20
25
30
35
Coca-Cola Dr Pepper Snapple Pepsico Inc. Nestle SA
2009 2010
Operating Profit
US$
Bill
ions
8.23
1.09
8.04
11.71
8.45
1.02
9.77
12.43
0
2
4
6
8
10
12
14
Coca-Cola Dr Pepper Snapple Pepsico Inc. Nestle SA
2009 2010
EBITDA
US$
Bill
ions
9.47
1.29
9.68
14.82
9.89
1.25
12.10
15.49
02468
1012141618
Coca-Cola Dr Pepper Snapple Pepsico Inc. Nestle SA
2009 2010
Source: Bloomberg

26
Stock Performance and Credit Ratings
40
60
80
100
120
140
160
180
Feb-
06M
ay-0
6
Aug-
06
Nov-
06
Feb-
07M
ay-0
7
Aug-
07
Nov-
07
Feb-
08M
ay-0
8
Aug-
08
Nov-
08
Feb-
09M
ay-0
9
Aug-
09
Nov-
09
Feb-
10M
ay-1
0
Aug-
10
Nov-
10
Feb-
11Coca-Cola Equity S&P 500 Index
While Coca-Cola stock has underperformed the S&P 500 index by 2.1% in the last year, it has outperformed the index in the last five years by over 50%. The company has received stable ratings from major credit rating agencies
Agency Current Rating Effective Date Previous Rating Change Direction Rating Date
Standard & Poor’s A+(Stable) 21 December 1999 AA- Up 9 September 1999
Moody’s Investor Services
Aa3( Stable) 26 July 1993 - - -
Fitch Ratings A+(Stable) 2 June 2003 - - -
Credit Ratings
Share Price (Five Year Performance)* Share Price (52 Week Performance)*
80
100
120
140
Feb-10 Apr-10 Jun-10 Aug-10 Oct-10 Dec-10 Feb-11
Coca-Cola Equity S&P 500 Index
51.55%
0.58% 14.98%
17.08%
Note: *Rebased to 100 as on Feb 16, 2006 (5-year performance) and Feb 16, 2010 (52 week performance); Stock Price updated on March 16, 2011Source: Bloomberg

27
Strategic DirectionThe company’s strategic priorities include driving global beverage leadership; accelerating innovation; and leveraging its balanced geographic portfolio
Disciplined Marketing Strategies
• Marketing investments to focus on enhancing consumer awareness and increase in consumer’s preference, to lead to long-term growth in unit case volume, per capita consumption and company’s share of worldwide nonalcoholic beverage sales
• For building consumer brand, company relies on packaging research, brand positioning and consumer feedbacks– In emerging markets, company is investing in infrastructure programs
that drive volume through increased access to consumers
– In developing markets, company’s focus is on differentiating its brands
• Over the last several years, the company has acquired a number of bottling and distribution operations to own a controlling interest in bottling operations
– This helps to focus the bottler's sales and marketing programs; assist in the development of the bottler's business and information systems; and establish an appropriate capital structure for the bottler
Drive customer preference for brands
• To build new beverage consumption occasions through unique and innovative consumer experiences, product availability and delivery systems, and beverage merchandising and displays
• Participate in joint brand-building initiatives with customers in order to drive customer preference for its brands
Collaboration with bottling partners
• To leverage recent acquisitions to expand the volume base and enhance margins
• Collaboration with bottling partners to produce differentiated beverages and packages that are appropriate for the right channels
• To build a supply chain network that leverages the size and scale of the Coca-Cola system to gain a competitive advantage
Consolidated Bottling and Distribution Operations
Source: Company Website
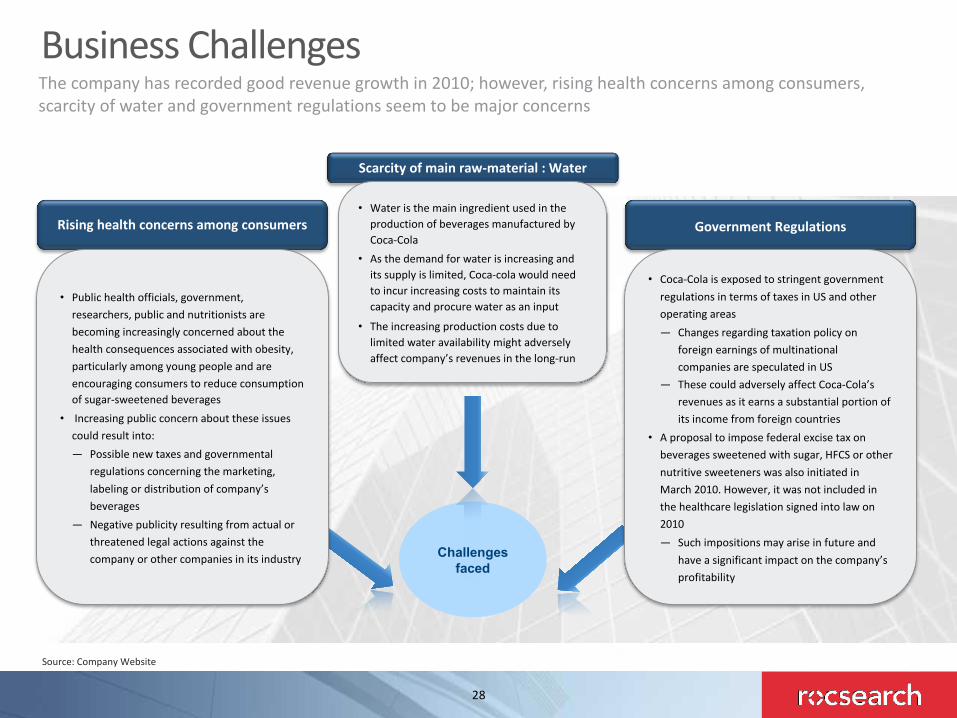
28
Government Regulations
Scarcity of main raw-material : Water
Rising health concerns among consumers
Business ChallengesThe company has recorded good revenue growth in 2010; however, rising health concerns among consumers, scarcity of water and government regulations seem to be major concerns
• Public health officials, government, researchers, public and nutritionists are becoming increasingly concerned about the health consequences associated with obesity, particularly among young people and are encouraging consumers to reduce consumption of sugar-sweetened beverages
• Increasing public concern about these issues could result into:― Possible new taxes and governmental
regulations concerning the marketing, labeling or distribution of company’s beverages
― Negative publicity resulting from actual or threatened legal actions against the company or other companies in its industry Challenges
faced
• Coca-Cola is exposed to stringent government regulations in terms of taxes in US and other operating areas― Changes regarding taxation policy on
foreign earnings of multinational companies are speculated in US
― These could adversely affect Coca-Cola’s revenues as it earns a substantial portion of its income from foreign countries
• A proposal to impose federal excise tax on beverages sweetened with sugar, HFCS or other nutritive sweeteners was also initiated in March 2010. However, it was not included in the healthcare legislation signed into law on 2010― Such impositions may arise in future and
have a significant impact on the company’s profitability
• Water is the main ingredient used in the production of beverages manufactured by Coca-Cola
• As the demand for water is increasing and its supply is limited, Coca-cola would need to incur increasing costs to maintain its capacity and procure water as an input
• The increasing production costs due to limited water availability might adversely affect company’s revenues in the long-run
Source: Company Website

29
• Dependence on bottling partners
• Liquidity is low as per industry standards
• Strong brand equity
• Global presence
• Good marketing strategies
• Efficient utilization of resources
ThreatOpportunity
Strength Weakness
SWOT
• Acquisitions leading to growth
• Launch of new and improved products
• Plans to enter into new markets like global confectionery markets
Diverse geographical presence and strong brand equity offers Coca-Cola a distinct competitive advantage . However, high competition and government regulations may negatively impact the company's revenues and margins
SWOT
Source: Datamonitor – SWOT Analysis, OneSource, Factiva
• Fluctuating costs of inputs
• Changing tastes and preferences of customers
• Market becoming more competitive
• Exposed to many government regulations

30
• In 2009, Coca-Cola launched sophisticated, interactive and user-friendly touch –screen vending machines, designed by Bsquare Corporation
• These vending machines were designed to allow consumers to select more than 100 different flavors and have desired mixed flavor drink
• RFID scanners are used to match cartridges to dispensers and internal data collection devices were enabled to electronically send demographics information to and from the Atlanta, GA-based Coca-Cola headquarters, including favorable locations, what flavors are the most popular among a range of ages/sexes, etc.− The machines could also provide information on the
beverage consumption, peak times, and popular locations
− The company could also talk back to the machine, letting it know if a particular flavor needed to be discontinued or recalled
RFID tags on touch-screen vending machines
• In 2011, Coca-Cola implemented SAP Business Objects Supply Chain Management Application, provided by ITC Infotech and SAP Consulting
− A project team of 12 experts was involved in the implementation, focusing on the supply chain, business warehouse, enterprise portal, delivery and project management
• The software was deployed to effectively align supply chain goals with business goals, providing visibility into end-to-end supply chain processes to drive process consistency
• “SAP Business Objects Supply Chain Performance Management aligns very well with the guiding principles of our project: focusing on metrics that need little manual intervention, focusing on metrics that help drive process consistency, and focusing on metrics that are in line with industry standards.” -Russ Rodal, metrics program manager at Coca-Cola
• Coca-Cola had earlier implemented SAP NetWeaver Business Warehouse, which captured significant details about business transactions
Supply Chain Management
IT Initiatives (1/3)Coca-Cola had implemented touch-screen technology in its vending machines and SAP for supply chain management
Source: Company website, News releases

31
• Oracle Database implemented at Coca-Cola Femsa, S.A. de C.V. to achieve high performance
Challenges• Boost performance of application server
infrastructure• Assure the availability of the new enterprise resource
planning systemSolution• Implemented Oracle Database, integrating
information from the company’s Latin American operations onto a single central processor
• Reduced order generation from two days to a few minutes
• Improved the flexibility of the database; enlarged the database from 10 terabytes to 15 terabytes without changing hardware
• Standardized the way in which satellite applications from the company’s SAP ERP system (including customer relationship management, business warehouse, strategic enterprise management and enterprise portal), making communication with the database easier and facilitating access by 8,000 users
Server Infrastructure
• Coca-Cola selected CAS to provide sales force automation solutions to its bottler network under its Program Sales Scale Mobile Customer Management (MCM) initiative
• Program Scale was designed to provide company owned and franchise bottlers with a common set of business processes under the Coke One operating model, using the SAP platform
• MCM is designed to take the power of Scale to the next level - extend Coke One to include advanced customer facing capabilities, particularly in the area of mobile customer management
• CAS’s front office solution in co-ordination with company’s back-office SAP applications enabled the company to serve its bottlers by helping their field sales force get closer to the customers, increase revenue and improve sales efficiency
Sales force automation solutions
IT Initiatives (2/3)Coca-Cola leveraged technology for its sales force automation and its delivery process in warehouses and distribution
Source: Company website, News releases

32
• In order to revitalize its distribution system, Coca-Cola Refreshments(US) implemented VOIP voice technology in 2007
• CCR investigated different technologies that would improve accuracy without sacrificing efficiency
− There was a wide variety of facilities in terms of age, sophistication and layout, they needed a solution that was flexible enough to adapt to all of the largest 100 facilities it planned to implement this technology
• After investigating voice, pick-to-light, RFID and bar code scanning, they agreed that they wanted a solution that allowed for heads-up, hands-free operation by the order selectors, voice made the most sense
− Once the voice team began talking to SAP, Cisco and Avaya, CCR’s strategic partners for its voice infrastructure, they decided to create their own solution
− CCR decided to implement Datria’s voice technology
− Where many voice solutions use proprietary mobile computing devices and headsets, a VoIP solution works with off-the-shelf handsets. These are considerably less expensive than traditional voice hardware
• The bottler launched two 60-day pilots to pit VoIP against traditional voice: a pilot in Jacksonville, Fla., got underway on June 15, 2007
• By the end of 2008, the voice system was up and running in an additional 75 facilities, bringing the total to 100
• The system uses wide area and local area networks to direct operations on the floor of warehouses across the enterprise
VoIP Technology
IT Initiatives (3/3)Coca-Cola introduced VoIP technology to simplify its delivery process in warehouses and distribution
Source: Company website, News releases

33
Our Offices
United Kingdom99 Kenton Road, Harrow, MiddlesexHA3 0ANUnited KingdomT: +44 203 051 8569
India A-16, Sector 16, NoidaU. P. - 201301IndiaT: +91 120 4017100
Hong Kong28th Floor, Fortis Tower77-79 Gloucester RoadWan chai, Hong KongT: +852 5801 4643
United States77 Park Avenue #1515Hoboken, NJ 07030USAT: +1 30 3502 5409
Business Enquiries – [email protected] | General Enquiries – [email protected] | Webpage – www.rocsearch.com
South America Pedro Agrelo 865. Rosario, Santa Fe. ArgentinaS2005OPCT: + 54 341 453 1088

About RocSearchPlease visit www.rocsearch.com for more details on the company.
© 2019 RocSearch. All Rights Reserved.
Disclaimer
This document is proprietary to RocSearch and the information contained hereinis confidential. Not without prior written permission from RocSearch, may this
document be reproduced, either in whole or in part, or disclosed to others
outside your firm.
Whilst care and attention has been exercised in the preparation of thisdocument, RocSearch does not accept responsibility for any inaccuracy or error
or any action taken in reliance on the information contained within. Allwarranties whether expressed or implied by statute, law or otherwise are hereby
disclaimed and excluded to the extent permitted by law.
In case of any questions on this document, please reply to the sender.