COBIAX LIFE CYCLE ANALYSIS Reinforced concrete slab … CSD life cycle analysis (Ingles).pdf ·...
56
Berlin, 04.02.2010 BN00100.100 CSD Ingenieure und Geologen GmbH Freiheit 12 a/b 12555 Berlin Tel. +49 30 65 01 30 67 Fax +49 30 65 01 30 68 [email protected] www.csdingenieure.de COBIAX LIFE CYCLE ANALYSIS Reinforced concrete slab system
Transcript of COBIAX LIFE CYCLE ANALYSIS Reinforced concrete slab … CSD life cycle analysis (Ingles).pdf ·...

Berlin, 04.02.2010BN00100.100
CSD Ingenieure und Geologen GmbHFreiheit 12 a/b12555 BerlinTel. +49 30 65 01 30 67Fax +49 30 65 01 30 [email protected]
COBIAX
LIFE CYCLE ANALYSIS
Reinforced concrete slab system

I
D:\002_CSD_Projekte\1_Berlin\BN00100_Cobiax\100_LCA_Bewertung\Übersetzungen\Bericht _Cobiaxbewertung_English.doc
TABLE OF CONTENTS
1. INTRODUCTION........................................................................................................ 3
1.1 Initial situation and objectives.....................................................................................................3
1.2 Boundary conditions ..................................................................................................................3
2. EVALUATION CRITERIA............................................................................................ 4
2.1 Indicators ..................................................................................................................................4
2.2 Object of study..........................................................................................................................5
2.3 Data description for the Life cycle inventory ................................................................................6
2.4 Data description for the Life cycle impact assessment ..................................................................7
2.5 Sensitivity analysis......................................................................................................................7
3. RESULTS.................................................................................................................... 7
4. CONCLUSIONS.......................................................................................................... 8
5. ABBREVIATIONS....................................................................................................... 9

II
D:\002_CSD_Projekte\1_Berlin\BN00100_Cobiax\100_LCA_Bewertung\Übersetzungen\Bericht _Cobiaxbewertung_English.doc
Disclaimer
CSD confirms having executed and performed the mandate with the requested diligence, that the results and conclusionsare founded on the current status of knowledge as described in the report and that these have been developed inaccordance with the generally accepted principles of the relevant field and to the best of one’s knowledge.
CSD assumes that:
all information and documentation presented to it by the principal and third parties are genuine, complete and true;
the results of the present report will not be used in part;
the results of the present report will not be used for a purpose other than agreed upon and may not be applied toanother object or to changed circumstances.
Otherwise, CSD disclaims any liability for damages of any kind.
If a third party uses the results of the present report in order to take decisions, CSD disclaims any liability for any kind ofdirect or indirect (consequential) damages.

BN00100.100 - Life Cycle Analysis - Reinforced concrete slab system - 09.03.2010
1. INTRODUCTION
1.1 Initial situation and objectives
The voided slab system developed by Cobiax Technologies AG is based on the use of void formers. Throughthe reduction of reinforced concrete in static non-stress areas there is a carcass optimization. Thisoptimization results in a reduction of toxic pollutants. In order to clearly quantify this positive impact on theenvironment CSD was commissioned to elaborate a Life Cycle Analysis. This analysis is aimed to provide basicdata for an environmental life cycle assessment and therefore provide planners with a basis of valuation toimplement a sustainable and holistic optimization of building concepts.
1.2 Boundary conditions
Material flows originated by structural engineering represent an economic main part. Analyzing theconstruction dimensions of reinforced concrete structures, it can be noted that a large percentage of thebuilding mass is needed for the constructive carcass.
Depending on the cubic volume, the structural shape and the occupancy, the following values can bespecified:
Constructive carcass: material ratio about 66% Building services heating/cooling: material ratio about 13% Structural interior work: material ratio about 12% Constructive cladding surface area: material ratio about 9%
In reinforced concrete buildings a mass fraction of about 45-55% is assumed for the slab elements.Considering these boundary conditions, a significant savings potential in the ecologicaloptimization of slabs systems can be noted.Through the identification of a characteristic value “dead load to live load”, a first estimate of thematerial efficiency of slab systems can be deduced:
Solid reinforced concrete slab:
Figure 1: Solid reinforced concrete slab
For a reinforced concrete slab with a slab depth of for example 30 cm the following characteristic values areobtained:
dead load: about 7,4 kN/m²live load: about 5 kN/m²
characteristic value dead load/live load = 1,48
Concrete structure

D:\002_CSD_Projekte\1_Berlin\BN00100_Cobiax\100_LCA_Bewertung\Übersetzungen\Bericht _Cobiaxbewertung_English.doc
Cobiax slab, reinforced concrete slab as voided slab system:
Figure 2: Reinforced concrete slab system Cobiax
For a reinforced concrete slab with the Cobiax System the following characteristic values are obtained:
dead load: ca. 6,0 kN/m²live load: ca. 5 kN/m²
characteristic value dead load/live load = 1,2
2. EVALUATION CRITERIA
2.1 Indicators
In the analysis of environmental indicators, both the pollutant equivalents for the creation process and for theperiod at the end of the life cycle were considered (End of Life). In the ecological analysis, the followingindicators were evaluated:
Global Warming Potential – GWP
Description:
The Global Warming Potential is a measure for the estimated contribution of a substance to the warming ofthe near-surface air, the so called greenhouse effect. The contribution of the substance is indicated as GWP-value in relation to the greenhouse potential of carbon dioxide (CO2).
Ozone Depletion Potential – ODP
Description:
Ozone, which is only present in the atmosphere in low concentrations, has a great significance for life onearth. Ozone absorbs short-wave UV-rays and emits longer wavelength radiation omnidirectionally. Theozone layer shields the earth from a large part of the UV-radiation, prevents excessive warming of the earth’ssurface, and contributes to protecting humans as well as flora and fauna from UV-A and UV-B radiation. Theaccumulation of R11-equivalent in the atmosphere contributes to the destruction of the ozone-layer.Consequences are e.g. tumour generation in humans and animals, as well as disruption of photosynthesis.
Photochemical Ozone Creation Potential – POCP
Description:
The photochemical ozone creation potential is the mass-based equivalent of destructive trace gases, e.g.nitric oxide and hydrocarbons, which in combination with UV-radiation contribute to the formation of near-surface (tropospheric) ozone. The resulting human- and eco-toxic contamination of the near-surface air iscalled summer-smog. It adversely affects the respiratory system and damages plants and animals. Theconcentration of near-surface ozone is regularly assessed by air monitoring stations, shown in load maps andpublished.
Void formers Cobiax system
Concrete structure
D:\002_CSD_Projekte\1_Berlin\BN00100_Cobiax\100_LCA_Bewertung\Übersetzungen\Bericht _Cobiaxbewertung_English.doc
Acidification Potential – AP
Description:
The increase of the concentration of H-ions in the air, water and soil is called acidification. Sulphur andnitrogen compounds from anthropogenic emissions react in the air to form sulphuric and/or nitric acids thatfall to the earth as “acid rain” and negatively impact soil, water bodies, creatures and buildings. There mayalso be a release of toxic cations which attack root systems, lead to an inappropriate nutrient supply fororganisms and perturb the water balance. The sum of the individual acidification impacts creates forestdieback. In surface waters with a low chemical buffering capacity it also causes fish mortality. Furthermore,acidic precipitations corrode historical sandstone buildings.
Eutrophication Potential – EP
Description:
Eutrophication describes the transition of water bodies and soil from a nutrient-poor (oligotrophic) to anutrient-rich (eutrophic) state. This state is mainly caused by supplying phosphor and nitrogen compounds.These compounds can get into the environment via fabrication of building materials and via washing-off ofcombustion emissions. The change in the availability of nutrients increases for example the formation ofalgae in water bodies which, among other things, can lead to higher fish mortality.
Non-Renewable Primary Energy Demands – PEnr
Description:
Primary energy is the energy that is available from naturally existing energy sources. It includes non-renewable energies such as black coal, brown coal, petroleum, natural gas, and uranium.
Total Primary Energy Demands and Proportion of Renewable Primary Energy – PEtot
Description:
Primary energy is the available energy of natural sources. Among the non-renewable primary energies areblack coal, brown coal, petroleum, natural gas and uranium; and among the renewable energies arebiomass, solar radiation, geothermal energy, hydropower, and wind energy. The sum of both energy sourcesis referred to as total primary energy demand.
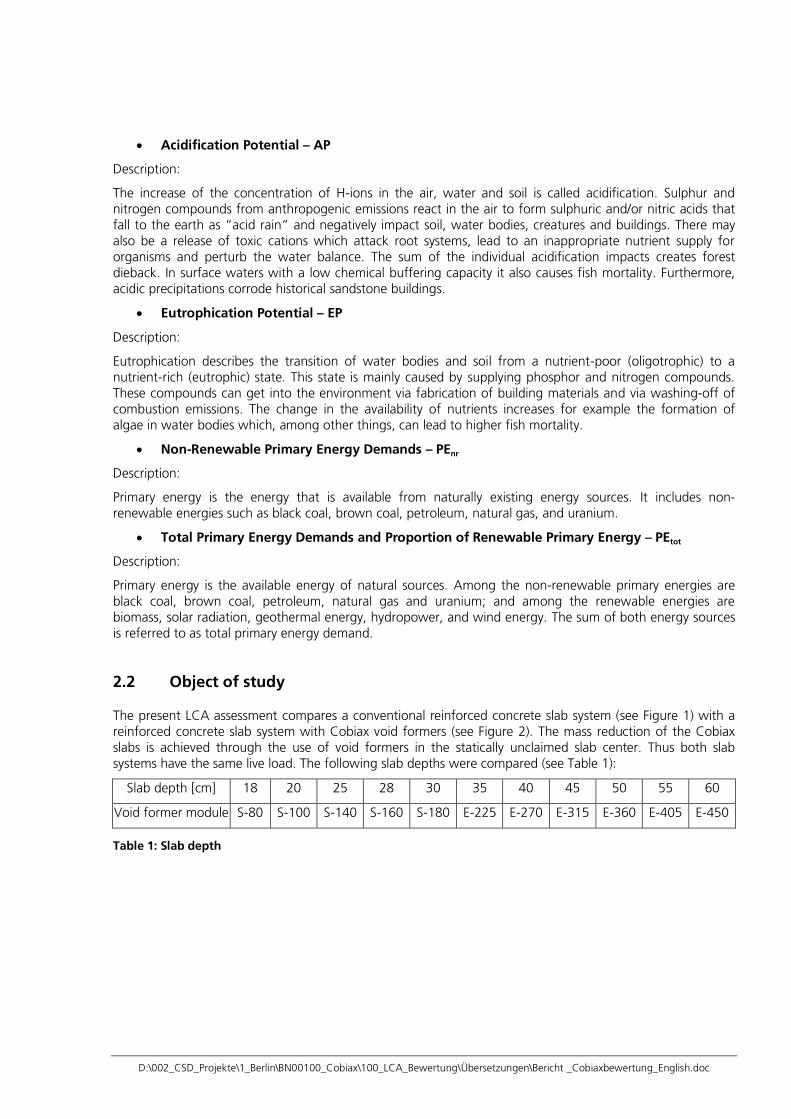
2.2 Object of study
The present LCA assessment compares a conventional reinforced concrete slab system (see Figure 1) with areinforced concrete slab system with Cobiax void formers (see Figure 2). The mass reduction of the Cobiaxslabs is achieved through the use of void formers in the statically unclaimed slab center. Thus both slabsystems have the same live load. The following slab depths were compared (see Table 1):
Slab depth [cm] 18 20 25 28 30 35 40 45 50 55 60
Void former module S-80 S-100 S-140 S-160 S-180 E-225 E-270 E-315 E-360 E-405 E-450
Table 1: Slab depth

D:\002_CSD_Projekte\1_Berlin\BN00100_Cobiax\100_LCA_Bewertung\Übersetzungen\Bericht _Cobiaxbewertung_English.doc
2.3 Data description for the Life cycle inventory
The description of the input variables for the life cycle inventory is shown in Table 2.
Description Description of the data determination Data source
Concrete content Data based on long-time project experience byCobiax (see appendix B)
Cobiax
Reinforcement steel content Data based on long-time project experience byCobiax (see appendix B)
Cobiax
Energy quantity for the injectionmoulding technique, Processingsynthetic granules
Void formers:
S-80; S-100; S-140; S-160; S-180
The energy calculation is based on an indicationof the energy consumption for the injectionmoulding machine according to themanufacturer, taking into account the loadquantities according to Cobiax (see calculationon table 13 in appendix C) as well as theproduction volume per unit time
Cobiax
WEFO-tec
Energy quantity for the blowmoulding technique
Void formers:
E-225; E-270; E-270; E-315;
E-360; E-405; E-450
The energy calculation is based on the energyconsumption for the blow moulding machineas designated by the manufacturer, taking intoaccount the load quantities according to Cobiax(see calculation on table 13 in appendix C) aswell as the production volume per unit time
Cobiax
rs-plastics
Synthetic granules The polypropylene synthetic granules are ofrecycled material. Therefore, the considerationof the input or output flows for this resourcecan be neglected, according to ISO 14040:2006allocations.
WEFO-tec
Transportation expenses steel Delivery from the closest steel wholesale isassumed. Taking into account averageddistances, a maximal distance of 30 km wasestimated.
CSD
Transportation expenses concrete Delivery from the closest concrete mixing plantis assumed. Taking into account averageddistances, a maximal distance of 30 km wasestimated.
CSD
Transportation expenses Cobiaxvoid formers
The manufacturing process of the syntheticcomponents takes place in central Germany(Zip code area 98544 and 63457). This resultsin transportation expenses in the east-westdirection of about 350 km and in the north-south direction of about 450 km. Taking intoaccount averaged distances, a maximal distanceof 200 km was estimated.
CSD
Table 2: Input variables for life cycle inventory

D:\002_CSD_Projekte\1_Berlin\BN00100_Cobiax\100_LCA_Bewertung\Übersetzungen\Bericht _Cobiaxbewertung_English.doc
2.4 Data description for the Life cycle impact assessment
The Life cycle impact assessment is done based on the data of „Ökobau.dat“ (Source: Federal Ministry ofTransport, Building and Urban Development, Germany).The used data basis as well as a capsule summary is given in appendix D.
2.5 Sensitivity analysis
A sensitivity analysis was conducted for the following assumptions and data from third parties:
Transport route raw material(concrete, reinforcement steel,synthetic components)
The sum of all transportation expenses is for the acidificationpotential < 5%, for all other indicators < 3%. A deviation of 20% inthe assumed transport route has a maximal percental impact of atenth. Moreover, in comparative analysis only the difference inquantity of materials and their transportation expenses are ofimportance. Thus, no impact can be detected.
Transport route rubble As the impact of transportation expenses is not significant, thoseexpenses as well as the differences in material mass can be waived.
Energy data for plastics processing The percental content of this characteristic value lies between 0,47and 2,41 The average of all investigated slabs is 1,6%. So differingenergy data do not have a significant influence.
Table 3: Sensitivity analysis
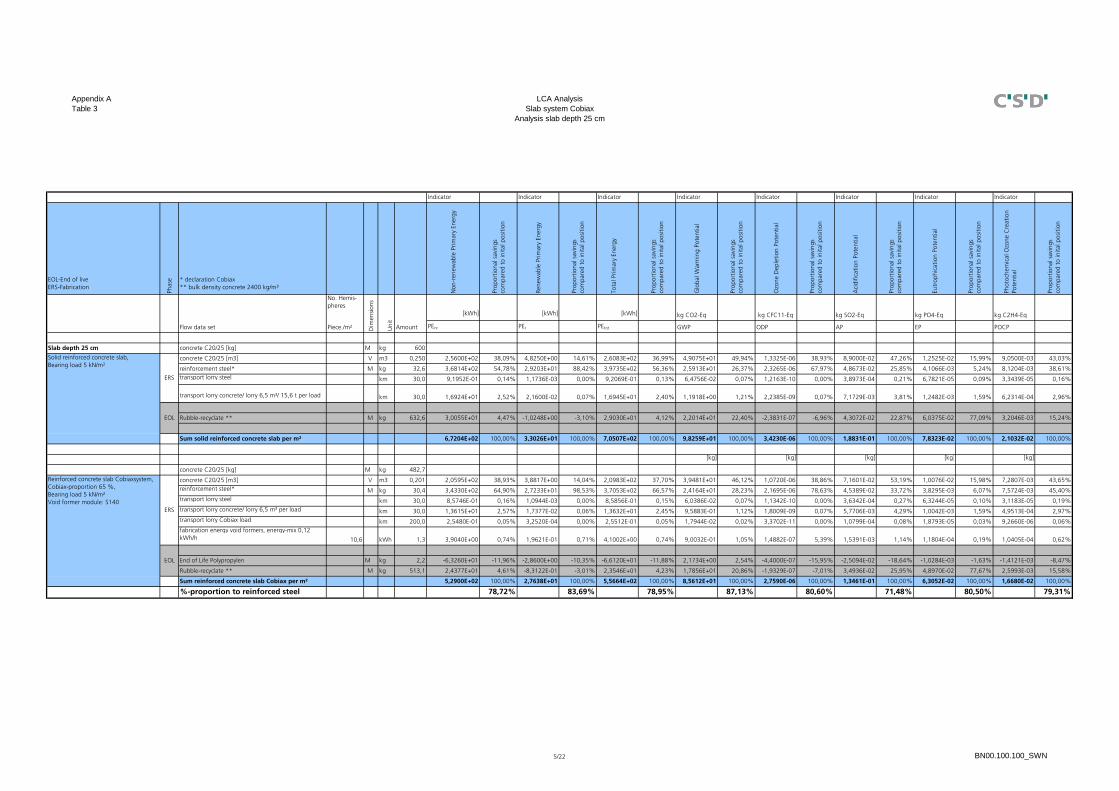
3. RESULTS
The results of the life cycle assessment are given in Appendix A Table 1 to Table 11. A summary of thepercentages compared with a reinforced concrete without void formers is presented in Table 1 and inDiagramm 1. It can be shown that the savings potential depends on the slab depth. The average reductioncompared to a solid reinforced concrete slab can be estimated at 20%.
Slab
dept
h18
cm
Slab
dept
h20
cm
Slab
dept
h25
cm
Slab
dept
h28
cm
Slab
dept
h30
cm
Slab
dept
h35
cm
Slab
dept
h40
cm
Slab
dept
h45
cm
Slab
dept
h50
cm
Slab
dept
h55
cm
Slab
dept
h60
cm
Øa
bso
lut
Øre
du
ctio
n
Non-renewablePrimary Energy
Demands 79,9% 79,5% 78,7% 79,3% 79,1% 81,3% 79,9% 78,0% 76,8% 75,7% 75,3% 78,5% 21,5%Renewable
Primary EnergyDemands 85,3% 85,1% 83,7% 84,0% 83,7% 85,3% 83,4% 80,9% 79,8% 78,4% 75,9% 82,3% 17,7%
Global WarmingPotential 92,5% 90,5% 87,1% 86,7% 85,8% 87,9% 88,0% 86,5% 84,7% 84,1% 83,7% 87,0% 13,0%
Ozone DepletionPotential 81,7% 81,6% 80,6% 81,1% 80,9% 84,1% 88,1% 84,1% 77,5% 76,7% 76,0% 81,1% 18,9%
AcidificationPotential 71,1% 71,0% 71,5% 72,7% 72,7% 75,7% 75,0% 73,3% 71,6% 70,8% 70,4% 72,3% 27,7%
EutrophicationPotential 84,0% 82,6% 80,5% 80,6% 80,0% 82,4% 81,5% 80,6% 79,9% 79,3% 78,9% 80,9% 19,1%
PhotochemicalOzone Creation
Potential 81,4% 80,5% 79,3% 79,7% 79,4% 81,7% 80,6% 78,9% 77,8% 76,9% 76,5% 79,3% 20,7%
Average savings 82,3% 81,5% 80,2% 80,6% 80,2% 82,6% 82,3% 80,3% 78,3% 77,4% 76,7% 80,2% 19,8%
Table 1: Overview of the percentages compared to a solid reinforced concrete slab

D:\002_CSD_Projekte\1_Berlin\BN00100_Cobiax\100_LCA_Bewertung\Übersetzungen\Bericht _Cobiaxbewertung_English.doc
0.0%
10.0%
20.0%
30.0%
40.0%
50.0%
60.0%
70.0%
80.0%
90.0%
100.0%
Slab depth 18 cm
Slab depth 20 cm
Slab depth 25 cm
Slab depth 28 cm
Slab depth 30 cm
Slab depth 35 cm
Slab depth 40 cm
Slab depth 45 cm
Slab depth 50 cm
Slab depth 55 cm
Slab depth 60 cm
Non-renewable Primary Energy
Renewable Primary Energy
Global Warming Potential
Ozone Depletion Potential
Acidification Potential
Eutrophication Potential
Photochemical Ozone CreationPotential
Diagramm 1: Overview of the percentages compared to a solid reinforced concrete slab
4. CONCLUSIONS
The implementation of void formers into a slab system increases the efficiency in material use. Thisimprovement of the carcass is the result of following effects.
Economization of material through the use of void formers
Reduction of the steel ratio through a lower dead load
Savings in material through reduction of dead load and a lower slab depth in consequence (notconsidered in this study)
Economization of material used in the foundation (not considered in this study)
Reduction of dimension and accordingly of the load- bearing components like for example shoring(not considered in this study)
Reduction of facing area through lower slab depths (not considered in this study)
The mass- fraction of the material used in slab systems to the total mass of a reinforced concrete building isabout 45%-55%. The mean reduction of toxic pollutants by 20% therefore results in a savings capacity oftoxic pollutants of about 9%-11% for the entire building construction.
Making use of enhancement potential in building materials will become more important in the future. Takinginto account a period of 50 years, building materials are responsible for 40% of ecologically relevantemissions. This value can be applied if following phases are considered in a life cycle analysis:
Fabrication/ new construction
Maintenance
Cleaning
Disposal

D:\002_CSD_Projekte\1_Berlin\BN00100_Cobiax\100_LCA_Bewertung\Übersetzungen\Bericht _Cobiaxbewertung_English.doc
The remaining 60% of pollutant emissions are caused by energy carriers used for the conditioning ofbuildings (heating, air ventilation, cooling, lighting). With an increase in energetic optimization theimportance of improvements in building materials and the use of resource efficient materials will increase aswell.
5. ABBREVIATIONS
LCA – Life Cycle Assessment
GWP – Global Warming Potential
ODP – Ozone Depletion Potential
POCP – Photochemical Ozone Creation Potential
AP – Acidification Potential
EP – Eutrophication Potential
PEnr – Non-renewable Primary Energy Demands
PEr – Renewable Primary Energy Demands
PEtot - Total Primary Energy Demands
Done by: Critical Review according to ISO14040ff by:
CSD Ingenieure und Geologen GmbH Verein Ate Service
Sven Wünschmann Dr. sc. techn. Gabriel Caduff
MSc / Dipl. Ing. UAS Dipl. Ing. of Management and Technology ETH
Architecture and Environment
Berlin, 04.02.2010 Bern, 04.02.2010

D:\002_CSD_Projekte\1_Berlin\BN00100_Cobiax\100_LCA_Bewertung\Übersetzungen\Bericht _Cobiaxbewertung_English.doc
APPENDIX A

Appendix ATable 1
LCA AnalysisSlab system Cobiax
Analysis slab depth 18 cm
Indicator Indicator Indicator Indicator Indicator Indicator Indicator Indicator
EOL-End of liveERS-Fabrication
Phas
e * declaration Cobiax** bulk density concrete 2400 kg/m³
Non
-ren
ewab
lePr
imar
yEn
ergy
Prop
ortio
nals
avin
gsco
mpa
red
toin
italp
ositi
on
Rene
wab
lePr
imar
yEn
ergy
Prop
ortio
nals
avin
gsco
mpa
red
toin
italp
ositi
on
Tota
lPrim
ary
Ener
gy
Prop
ortio
nals
avin
gsco
mpa
red
toin
italp
ositi
on
Glo
balW
arm
ing
Pote
ntia
l
Prop
ortio
nals
avin
gsco
mpa
red
toin
italp
ositi
on
Ozo
neD
eple
tion
Pote
ntia
l
Prop
ortio
nals
avin
gsco
mpa
red
toin
italp
ositi
on
Aci
dific
atio
nPo
tent
ial
Prop
ortio
nals
avin
gsco
mpa
red
toin
italp
ositi
on
Eutr
ophi
catio
nPo
tent
ial
Prop
ortio
nals
avin
gsco
mpa
red
toin
italp
ositi
on
Phot
oche
mic
alO
zone
Cre
atio
nPo
tent
ial
Prop
ortio
nals
avin
gsco
mpa
red
toin
italp
ositi
on
No. Hemis-pheres
[kWh] [kWh] [kWh] kg CO2-Eq kg CFC11-Eq kg SO2-Eq kg PO4-Eq kg C2H4-Eq
Piece./m² PEnr PEr PEtot GWP ODP AP EP POCP
Slab depth 18 cm concrete C20/25 [kg] M kg 432
concrete C20/25 [m3] V m3 0,180 1,8432E+02 38,34% 3,4740E+00 14,76% 1,8779E+02 37,24% 3,5334E+01 50,10% 9,5940E-07 39,23% 6,4080E-02 47,41% 9,0180E-03 16,01% 6,5160E-03 43,23%
reinforcement steel* M kg 23,2 2,6199E+02 54,49% 2,0783E+01 88,30% 2,8278E+02 56,07% 1,8441E+01 26,15% 1,6557E-06 67,71% 3,4639E-02 25,63% 2,9225E-03 5,19% 5,7789E-03 38,34%transport lorry steel km 30,0 6,5438E-01 0,14% 8,3520E-04 0,00% 6,5521E-01 0,13% 4,6084E-02 0,07% 8,6555E-11 0,00% 2,7735E-04 0,21% 4,8265E-05 0,09% 2,3797E-05 0,16%
transport lorry concrete/ lorry 6,5 m³/ 15,6 t per load km 30,0 1,2185E+01 2,53% 1,5552E-02 0,07% 1,2201E+01 2,42% 8,5812E-01 1,22% 1,6117E-09 0,07% 5,1645E-03 3,82% 8,9874E-04 1,60% 4,4866E-04 2,98%
Rubble-recyclate ** M kg 455,2 2,1627E+01 4,50% -7,3742E-01 -3,13% 2,0889E+01 4,14% 1,5841E+01 22,46% -1,7148E-07 -7,01% 3,0994E-02 22,93% 4,3444E-02 77,12% 2,3060E-03 15,30%
Sum solid reinforced concrete slab per m² 4,8078E+02 100,00% 2,3536E+01 100,00% 5,0431E+02 100,00% 7,0520E+01 100,00% 2,4453E-06 100,00% 1,3515E-01 100,00% 5,6332E-02 100,00% 1,5073E-02 100,00%
[kg] [kg] [kg] [kg] [kg]
concrete C20/25 [kg] M kg 362,7
concrete C20/25 [m3] V m3 0,151 1,5475E+02 40,26% 2,9167E+00 14,53% 1,5767E+02 38,99% 2,9666E+01 45,50% 8,0550E-07 40,32% 5,3801E-02 55,97% 7,5714E-03 16,01% 5,4707E-03 44,57%reinforcement steel* M kg 22,8 2,5748E+02 66,99% 2,0424E+01 101,77% 2,7790E+02 68,71% 1,8123E+01 27,79% 1,6271E-06 81,44% 3,4041E-02 35,42% 2,8721E-03 6,07% 5,6793E-03 46,27%transport lorry steel km 30,0 6,4310E-01 0,17% 8,2080E-04 0,00% 6,4392E-01 0,16% 4,5290E-02 0,07% 8,5063E-11 0,00% 2,7257E-04 0,28% 4,7433E-05 0,10% 2,3387E-05 0,19%transport lorry concrete/ lorry 6,5 m³ per load km 36,0 1,2276E+01 3,19% 1,5669E-02 0,08% 1,2292E+01 3,04% 8,6456E-01 1,33% 1,6238E-09 0,08% 5,2032E-03 5,41% 9,0548E-04 1,91% 4,4645E-04 3,64%transport lorry Cobiax load km 200,0 2,5480E-01 0,07% 3,2520E-04 0,00% 2,5512E-01 0,06% 1,7944E-02 0,03% 3,3702E-11 0,00% 1,0799E-04 0,11% 1,8793E-05 0,04% 9,2660E-06 0,08%fabrication energy void formers, energy-mix 0,12kWh/h 10,6 kWh 1,3 3,9040E+00 1,02% 1,9621E-01 0,98% 4,1002E+00 1,01% 9,0032E-01 1,38% 1,4882E-07 7,45% 1,5391E-03 1,60% 1,1804E-04 0,25% 1,0405E-04 0,85%
End of Life Polypropylen M kg 2,2 -6,3260E+01 -16,46% -2,8600E+00 -14,25% -6,6120E+01 -16,35% 2,1734E+00 3,33% -4,4000E-07 -22,02% -2,5094E-02 -26,11% -1,0284E-03 -2,17% -1,4121E-03 -11,50%
Rubble-recyclate ** M kg 385,5 1,8315E+01 4,77% -6,2451E-01 -3,11% 1,7691E+01 4,37% 1,3415E+01 20,57% -1,4522E-07 -7,27% 2,6248E-02 27,31% 3,6792E-02 77,79% 1,9529E-03 15,91%
Sum reinforced concrete slab Cobiax per m² 3,8436E+02 100,00% 2,0070E+01 100,00% 4,0443E+02 100,00% 6,5206E+01 100,00% 1,9979E-06 100,00% 9,6118E-02 100,00% 4,7297E-02 100,00% 1,2274E-02 100,00%
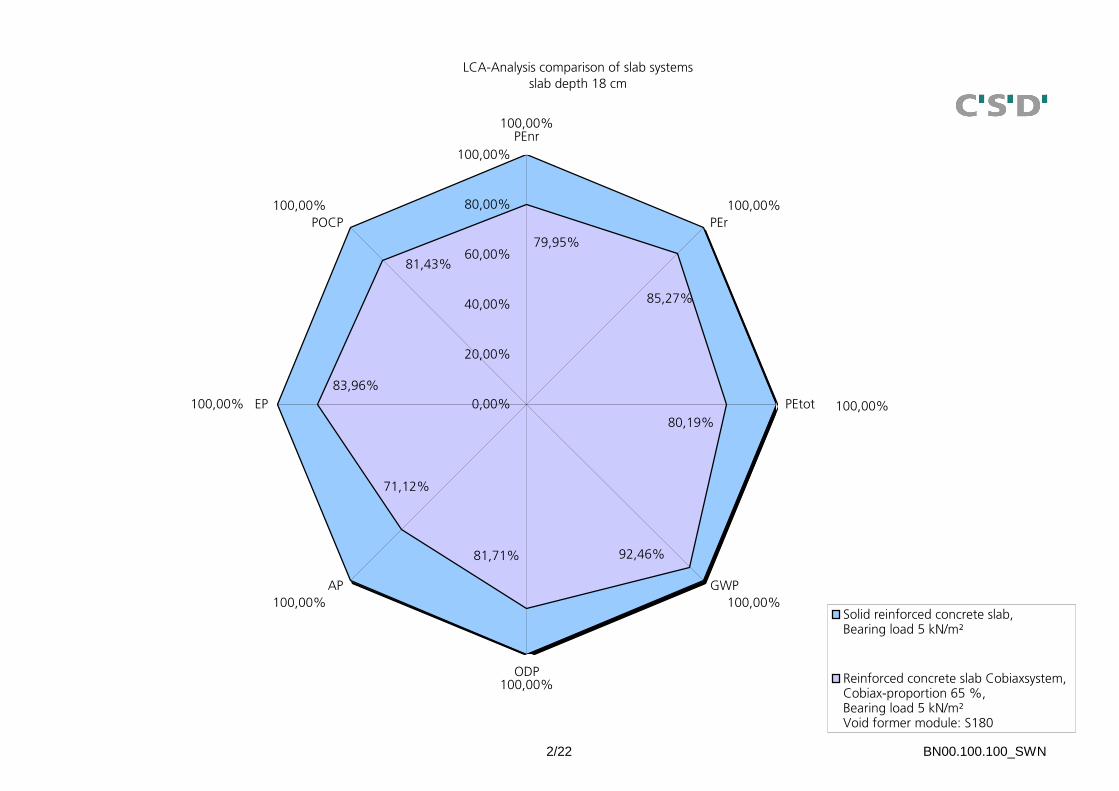
%-proportion to reinforced steel 79,95% 85,27% 80,19% 92,46% 81,71% 71,12% 83,96% 81,43%
ERS
EOL
Reinforced concrete slab Cobiaxsystem,Cobiax-proportion 65 %,Bearing load 5 kN/m²Void former module: S80
Solid reinforced concrete slab,Bearing load 5 kN/m²
EOL
ERS
AmountUni
t
Dim
ensio
ns
Flow data set
1/22 BN00.100.100_SWN
2/22 BN00.100.100_SWN
LCA-Analysis comparison of slab systemsslab depth 18 cm
100,00%
100,00%
100,00%
100,00%
100,00%
100,00%
100,00%
100,00%
79,95%
85,27%
80,19%
92,46%81,71%
71,12%
83,96%
81,43%
0,00%
20,00%
40,00%
60,00%
80,00%
100,00%PEnr
PEr
PEtot
GWP
ODP
AP
EP
POCP
Solid reinforced concrete slab,Bearing load 5 kN/m²
Reinforced concrete slab Cobiaxsystem,Cobiax-proportion 65 %,Bearing load 5 kN/m²Void former module: S180

Appendix ATable 2
LCA AnalysisSlab system Cobiax
Analysis slab depth 20 cm
Indicator Indicator Indicator Indicator Indicator Indicator Indicator Indicator
EOL-End of liveERS-Fabrication
Phas
e * declaration Cobiax** bulk density concrete 2400 kg/m³
Non
-ren
ewab
lePr
imar
yEn
ergy
Prop
ortio
nals
avin
gsco
mpa
red
toin
italp
ositi
on
Rene
wab
lePr
imar
yEn
ergy
Prop
ortio
nals
avin
gsco
mpa
red
toin
italp
ositi
on
Tota
lPrim
ary
Ener
gy
Prop
ortio
nals
avin
gsco
mpa
red
toin
italp
ositi
on
Glo
balW
arm
ing
Pote
ntia
l
Prop
ortio
nals
avin
gsco
mpa
red
toin
italp
ositi
on
Ozo
neD
eple
tion
Pote
ntia
l
Prop
ortio
nals
avin
gsco
mpa
red
toin
italp
ositi
on
Aci
dific
atio
nPo
tent
ial
Prop
ortio
nals
avin
gsco
mpa
red
toin
italp
ositi
on
Eutr
ophi
catio
nPo
tent
ial
Prop
ortio
nals
avin
gsco
mpa
red
toin
italp
ositi
on
Phot
oche
mic
alO
zone
Cre
atio
nPo
tent
ial
Prop
ortio
nals
avin
gsco
mpa
red
toin
italp
ositi
on
No. Hemis-pheres
[kWh] [kWh] [kWh] kg CO2-Eq kg CFC11-Eq kg SO2-Eq kg PO4-Eq kg C2H4-Eq
Piece./m² PEnr PEr PEtot GWP ODP AP EP POCP
Slab depth 20 cm concrete C20/25 [kg] M kg 480
concrete C20/25 [m3] V m3 0,200 2,0480E+02 38,24% 3,8600E+00 14,70% 2,0866E+02 37,14% 3,9260E+01 50,04% 1,0660E-06 39,11% 7,1200E-02 47,35% 1,0020E-02 16,00% 7,2400E-03 43,15%
reinforcement steel* M kg 25,9 2,9248E+02 54,61% 2,3201E+01 88,35% 3,1568E+02 56,19% 2,0587E+01 26,24% 1,8483E-06 67,81% 3,8670E-02 25,72% 3,2626E-03 5,21% 6,4515E-03 38,45%transport lorry steel km 30,0 7,3054E-01 0,14% 9,3240E-04 0,00% 7,3147E-01 0,13% 5,1448E-02 0,07% 9,6628E-11 0,00% 3,0963E-04 0,21% 5,3883E-05 0,09% 2,6567E-05 0,16%
transport lorry concrete/ lorry 6,5 m³/ 15,6 t per load km 30,0 1,3539E+01 2,53% 1,7280E-02 0,07% 1,3556E+01 2,41% 9,5347E-01 1,22% 1,7908E-09 0,07% 5,7383E-03 3,82% 9,9860E-04 1,59% 4,9851E-04 2,97%
Rubble-recyclate ** M kg 505,9 2,4035E+01 4,49% -8,1956E-01 -3,12% 2,3216E+01 4,13% 1,7605E+01 22,44% -1,9058E-07 -6,99% 3,4446E-02 22,91% 4,8283E-02 77,11% 2,5628E-03 15,27%
Sum solid reinforced concrete slab per m² 5,3559E+02 100,00% 2,6260E+01 100,00% 5,6185E+02 100,00% 7,8457E+01 100,00% 2,7256E-06 100,00% 1,5036E-01 100,00% 6,2618E-02 100,00% 1,6779E-02 100,00%
[kg] [kg] [kg] [kg] [kg]
concrete C20/25 [kg] M kg 397
concrete C20/25 [m3] V m3 0,165 1,6939E+02 39,79% 3,1925E+00 14,29% 1,7258E+02 38,52% 3,2471E+01 45,71% 8,8167E-07 39,64% 5,8888E-02 55,19% 8,2874E-03 16,02% 5,9881E-03 44,31%reinforcement steel* M kg 25,1 2,8345E+02 66,59% 2,2485E+01 100,62% 3,0593E+02 68,28% 1,9951E+01 28,08% 1,7912E-06 80,53% 3,7475E-02 35,12% 3,1618E-03 6,11% 6,2522E-03 46,27%transport lorry steel km 30,0 7,0797E-01 0,17% 9,0360E-04 0,00% 7,0887E-01 0,16% 4,9858E-02 0,07% 9,3644E-11 0,00% 3,0006E-04 0,28% 5,2218E-05 0,10% 2,5746E-05 0,19%transport lorry concrete/ lorry 6,5 m³ per load km 30,0 1,1198E+01 2,63% 1,4292E-02 0,06% 1,1212E+01 2,50% 7,8860E-01 1,11% 1,4811E-09 0,07% 4,7460E-03 4,45% 8,2592E-04 1,60% 4,0722E-04 3,01%transport lorry Cobiax load km 200,0 2,5480E-01 0,06% 3,2520E-04 0,00% 2,5512E-01 0,06% 1,7944E-02 0,03% 3,3702E-11 0,00% 1,0799E-04 0,10% 1,8793E-05 0,04% 9,2660E-06 0,07%fabrication energy void formers, energy-mix 0,12kWh/h 10,6 kWh 1,3 3,9040E+00 0,92% 1,9621E-01 0,88% 4,1002E+00 0,92% 9,0032E-01 1,27% 1,4882E-07 6,69% 1,5391E-03 1,44% 1,1804E-04 0,23% 1,0405E-04 0,77%
End of Life Polypropylen M kg 2,2 -6,3260E+01 -14,86% -2,8600E+00 -12,80% -6,6120E+01 -14,76% 2,1734E+00 3,06% -4,4000E-07 -19,78% -2,5094E-02 -23,52% -1,0284E-03 -1,99% -1,4121E-03 -10,45%
Rubble-recyclate ** M kg 422,1 2,0054E+01 4,71% -6,8380E-01 -3,06% 1,9370E+01 4,32% 1,4689E+01 20,68% -1,5901E-07 -7,15% 2,8740E-02 26,93% 4,0285E-02 77,89% 2,1383E-03 15,82%
Sum reinforced concrete slab Cobiax per m² 4,2569E+02 100,00% 2,2345E+01 100,00% 4,4804E+02 100,00% 7,1042E+01 100,00% 2,2243E-06 100,00% 1,0670E-01 100,00% 5,1721E-02 100,00% 1,3513E-02 100,00%
%-proportion to reinforced steel 79,48% 85,09% 79,74% 90,55% 81,61% 70,96% 82,60% 80,53%
AmountUni
t
Dim
ensi
ons
Flow data set
ERS
EOL
Reinforced concrete slab Cobiaxsystem,Cobiax-proportion 65 %,Bearing load 5 kN/m²Void former module: S100
Solid reinforced concrete slab,Bearing load 5 kN/m²
EOL
ERS
3/22 BN00.100.100_SWN

4/22 BN00.100.100_SWN
LCA-Analysis comparison of slab systemsslab depth 20 cm
100,00%
100,00%
100,00%
100,00%
100,00%
100,00%
100,00%
100,00%
79,48%
85,09%
79,74%
90,55%81,61%
70,96%
82,60%
80,53%
0,00%
20,00%
40,00%
60,00%
80,00%
100,00%PEnr
PEr
PEtot
GWP
ODP
AP
EP
POCP
Solid reinforced concrete slab,Bearing load 5 kN/m²
Reinforced concrete slab Cobiaxsystem,Cobiax-proportion 65 %,Bearing load 5 kN/m²Void former module: S180
Appendix ATable 3
LCA AnalysisSlab system Cobiax
Analysis slab depth 25 cm
Indicator Indicator Indicator Indicator Indicator Indicator Indicator Indicator
EOL-End of liveERS-Fabrication
Phas
e * declaration Cobiax** bulk density concrete 2400 kg/m³
Non
-ren
ewab
lePr
imar
yEn
ergy
Prop
ortio
nals
avin
gsco
mpa
red
toin
italp
ositi
on
Rene
wab
lePr
imar
yEn
ergy
Prop
ortio
nals
avin
gsco
mpa
red
toin
italp
ositi
on
Tota
lPrim
ary
Ener
gy
Prop
ortio
nals
avin
gsco
mpa
red
toin
italp
ositi
on
Glo
balW
arm
ing
Pote
ntia
l
Prop
ortio
nals
avin
gsco
mpa
red
toin
italp
ositi
on
Ozo
neD
eple
tion
Pote
ntia
l
Prop
ortio
nals
avin
gsco
mpa
red
toin
italp
ositi
on
Aci
dific
atio
nPo
tent
ial
Prop
ortio
nals
avin
gsco
mpa
red
toin
italp
ositi
on
Eutr
ophi
catio
nPo
tent
ial
Prop
ortio
nals
avin
gsco
mpa
red
toin
italp
ositi
on
Phot
oche
mic
alO
zone
Cre
atio
nPo
tent
ial
Prop
ortio
nals
avin
gsco
mpa
red
toin
italp
ositi
on
No. Hemis-pheres
[kWh] [kWh] [kWh] kg CO2-Eq kg CFC11-Eq kg SO2-Eq kg PO4-Eq kg C2H4-Eq
Piece./m² PEnr PEr PEtot GWP ODP AP EP POCP
Slab depth 25 cm concrete C20/25 [kg] M kg 600
concrete C20/25 [m3] V m3 0,250 2,5600E+02 38,09% 4,8250E+00 14,61% 2,6083E+02 36,99% 4,9075E+01 49,94% 1,3325E-06 38,93% 8,9000E-02 47,26% 1,2525E-02 15,99% 9,0500E-03 43,03%
reinforcement steel* M kg 32,6 3,6814E+02 54,78% 2,9203E+01 88,42% 3,9735E+02 56,36% 2,5913E+01 26,37% 2,3265E-06 67,97% 4,8673E-02 25,85% 4,1066E-03 5,24% 8,1204E-03 38,61%transport lorry steel km 30,0 9,1952E-01 0,14% 1,1736E-03 0,00% 9,2069E-01 0,13% 6,4756E-02 0,07% 1,2163E-10 0,00% 3,8973E-04 0,21% 6,7821E-05 0,09% 3,3439E-05 0,16%
transport lorry concrete/ lorry 6,5 m³/ 15,6 t per load km 30,0 1,6924E+01 2,52% 2,1600E-02 0,07% 1,6945E+01 2,40% 1,1918E+00 1,21% 2,2385E-09 0,07% 7,1729E-03 3,81% 1,2482E-03 1,59% 6,2314E-04 2,96%
Rubble-recyclate ** M kg 632,6 3,0055E+01 4,47% -1,0248E+00 -3,10% 2,9030E+01 4,12% 2,2014E+01 22,40% -2,3831E-07 -6,96% 4,3072E-02 22,87% 6,0375E-02 77,09% 3,2046E-03 15,24%
Sum solid reinforced concrete slab per m² 6,7204E+02 100,00% 3,3026E+01 100,00% 7,0507E+02 100,00% 9,8259E+01 100,00% 3,4230E-06 100,00% 1,8831E-01 100,00% 7,8323E-02 100,00% 2,1032E-02 100,00%
[kg] [kg] [kg] [kg] [kg]
concrete C20/25 [kg] M kg 482,7
concrete C20/25 [m3] V m3 0,201 2,0595E+02 38,93% 3,8817E+00 14,04% 2,0983E+02 37,70% 3,9481E+01 46,12% 1,0720E-06 38,86% 7,1601E-02 53,19% 1,0076E-02 15,98% 7,2807E-03 43,65%reinforcement steel* M kg 30,4 3,4330E+02 64,90% 2,7233E+01 98,53% 3,7053E+02 66,57% 2,4164E+01 28,23% 2,1695E-06 78,63% 4,5389E-02 33,72% 3,8295E-03 6,07% 7,5724E-03 45,40%transport lorry steel km 30,0 8,5746E-01 0,16% 1,0944E-03 0,00% 8,5856E-01 0,15% 6,0386E-02 0,07% 1,1342E-10 0,00% 3,6342E-04 0,27% 6,3244E-05 0,10% 3,1183E-05 0,19%transport lorry concrete/ lorry 6,5 m³ per load km 30,0 1,3615E+01 2,57% 1,7377E-02 0,06% 1,3632E+01 2,45% 9,5883E-01 1,12% 1,8009E-09 0,07% 5,7706E-03 4,29% 1,0042E-03 1,59% 4,9513E-04 2,97%transport lorry Cobiax load km 200,0 2,5480E-01 0,05% 3,2520E-04 0,00% 2,5512E-01 0,05% 1,7944E-02 0,02% 3,3702E-11 0,00% 1,0799E-04 0,08% 1,8793E-05 0,03% 9,2660E-06 0,06%fabrication energy void formers, energy-mix 0,12kWh/h 10,6 kWh 1,3 3,9040E+00 0,74% 1,9621E-01 0,71% 4,1002E+00 0,74% 9,0032E-01 1,05% 1,4882E-07 5,39% 1,5391E-03 1,14% 1,1804E-04 0,19% 1,0405E-04 0,62%
End of Life Polypropylen M kg 2,2 -6,3260E+01 -11,96% -2,8600E+00 -10,35% -6,6120E+01 -11,88% 2,1734E+00 2,54% -4,4000E-07 -15,95% -2,5094E-02 -18,64% -1,0284E-03 -1,63% -1,4121E-03 -8,47%
Rubble-recyclate ** M kg 513,1 2,4377E+01 4,61% -8,3122E-01 -3,01% 2,3546E+01 4,23% 1,7856E+01 20,86% -1,9329E-07 -7,01% 3,4936E-02 25,95% 4,8970E-02 77,67% 2,5993E-03 15,58%
Sum reinforced concrete slab Cobiax per m² 5,2900E+02 100,00% 2,7638E+01 100,00% 5,5664E+02 100,00% 8,5612E+01 100,00% 2,7590E-06 100,00% 1,3461E-01 100,00% 6,3052E-02 100,00% 1,6680E-02 100,00%
%-proportion to reinforced steel 78,72% 83,69% 78,95% 87,13% 80,60% 71,48% 80,50% 79,31%
AmountUni
t
Dim
ensi
ons
Flow data set
ERS
EOL
Reinforced concrete slab Cobiaxsystem,Cobiax-proportion 65 %,Bearing load 5 kN/m²Void former module: S140
Solid reinforced concrete slab,Bearing load 5 kN/m²
EOL
ERS
5/22 BN00.100.100_SWN

6/22 BN00.100.100_SWN
LCA-Analysis comparison of slab systemsslab depth 25 cm
100,00%
100,00%
100,00%
100,00%
100,00%
100,00%
100,00%
100,00%
78,72%
83,69%
78,95%
87,13%80,60%
71,48%
80,50%
79,31%
0,00%
10,00%
20,00%
30,00%
40,00%
50,00%
60,00%
70,00%
80,00%
90,00%
100,00%PEnr
PEr
PEtot
GWP
ODP
AP
EP
POCP
Solid reinforced concrete slab,Bearing load 5 kN/m²
Reinforced concrete slab Cobiaxsystem,Cobiax-proportion 65 %,Bearing load 5 kN/m²Void former module: S180

Appendix ATable 4
LCA AnalysisSlab system Cobiax
Analysis slab depth 28 cm
Indicator Indicator Indicator Indicator Indicator Indicator Indicator Indicator
EOL-End of liveERS-Fabrication
Phas
e * declaration Cobiax** bulk density concrete 2400 kg/m³
Non
-ren
ewab
lePr
imar
yEn
ergy
Prop
ortio
nals
avin
gsco
mpa
red
toin
italp
ositi
on
Rene
wab
lePr
imar
yEn
ergy
Prop
ortio
nals
avin
gsco
mpa
red
toin
italp
ositi
on
Tota
lPrim
ary
Ener
gy
Prop
ortio
nals
avin
gsco
mpa
red
toin
italp
ositi
on
Glo
balW
arm
ing
Pote
ntia
l
Prop
ortio
nals
avin
gsco
mpa
red
toin
italp
ositi
on
Ozo
neD
eple
tion
Pote
ntia
l
Prop
ortio
nals
avin
gsco
mpa
red
toin
italp
ositi
on
Aci
dific
atio
nPo
tent
ial
Prop
ortio
nals
avin
gsco
mpa
red
toin
italp
ositi
on
Eutr
ophi
catio
nPo
tent
ial
Prop
ortio
nals
avin
gsco
mpa
red
toin
italp
ositi
on
Phot
oche
mic
alO
zone
Cre
atio
nPo
tent
ial
Prop
ortio
nals
avin
gsco
mpa
red
toin
italp
ositi
on
No. Hemis-pheres
[kWh] [kWh] [kWh] kg CO2-Eq kg CFC11-Eq kg SO2-Eq kg PO4-Eq kg C2H4-Eq
Piece./m² PEnr PEr PEtot GWP ODP AP EP POCP
Slab depth 28 cm concrete C20/25 [kg] M kg 672
concrete C20/25 [m3] V m3 0,280 2,8672E+02 38,10% 5,4040E+00 14,61% 2,9212E+02 37,00% 5,4964E+01 49,95% 1,4924E-06 38,94% 9,9680E-02 47,27% 1,4028E-02 15,99% 1,0136E-02 43,04%
reinforcement steel* M kg 36,5 4,1219E+02 54,77% 3,2697E+01 88,42% 4,4488E+02 56,35% 2,9013E+01 26,37% 2,6048E-06 67,96% 5,4496E-02 25,84% 4,5979E-03 5,24% 9,0919E-03 38,60%transport lorry steel km 30,0 1,0295E+00 0,14% 1,3140E-03 0,00% 1,0308E+00 0,13% 7,2503E-02 0,07% 1,3618E-10 0,00% 4,3635E-04 0,21% 7,5935E-05 0,09% 3,7440E-05 0,16%
transport lorry concrete/ lorry 6,5 m³/ 15,6 t per load km 30,0 1,8954E+01 2,52% 2,4192E-02 0,07% 1,8979E+01 2,40% 1,3349E+00 1,21% 2,5071E-09 0,07% 8,0336E-03 3,81% 1,3980E-03 1,59% 6,9792E-04 2,96%
Rubble-recyclate ** M kg 708,5 3,3661E+01 4,47% -1,1478E+00 -3,10% 3,2513E+01 4,12% 2,4656E+01 22,41% -2,6690E-07 -6,96% 4,8240E-02 22,88% 6,7619E-02 77,09% 3,5891E-03 15,24%
Sum solid reinforced concrete slab per m² 7,5255E+02 100,00% 3,6979E+01 100,00% 7,8953E+02 100,00% 1,1004E+02 100,00% 3,8329E-06 100,00% 2,1089E-01 100,00% 8,7719E-02 100,00% 2,3552E-02 100,00%
[kg] [kg] [kg] [kg] [kg]
concrete C20/25 [kg] M kg 541
concrete C20/25 [m3] V m3 0,225 2,3083E+02 38,67% 4,3505E+00 14,01% 2,3518E+02 37,45% 4,4249E+01 46,41% 1,2015E-06 38,66% 8,0248E-02 52,36% 1,1293E-02 15,97% 8,1601E-03 43,45%reinforcement steel* M kg 33,8 3,8170E+02 63,94% 3,0278E+01 97,50% 4,1197E+02 65,60% 2,6867E+01 28,18% 2,4121E-06 77,61% 5,0465E-02 32,92% 4,2578E-03 6,02% 8,4193E-03 44,83%transport lorry steel km 30,0 9,5336E-01 0,16% 1,2168E-03 0,00% 9,5458E-01 0,15% 6,7140E-02 0,07% 1,2610E-10 0,00% 4,0407E-04 0,26% 7,0318E-05 0,10% 3,4670E-05 0,18%transport lorry concrete/ lorry 6,5 m³ per load km 30,0 1,5259E+01 2,56% 1,9476E-02 0,06% 1,5279E+01 2,43% 1,0746E+00 1,13% 2,0184E-09 0,06% 6,4675E-03 4,22% 1,1255E-03 1,59% 5,5493E-04 2,95%transport lorry Cobiax load km 200,0 2,5480E-01 0,04% 3,2520E-04 0,00% 2,5512E-01 0,04% 1,7944E-02 0,02% 3,3702E-11 0,00% 1,0799E-04 0,07% 1,8793E-05 0,03% 9,2660E-06 0,05%fabrication energy void formers, energy-mix 0,12kWh/h 10,6 kWh 1,3 3,9040E+00 0,65% 1,9621E-01 0,63% 4,1002E+00 0,65% 9,0032E-01 0,94% 1,4882E-07 4,79% 1,5391E-03 1,00% 1,1804E-04 0,17% 1,0405E-04 0,55%
End of Life Polypropylen M kg 2,2 -6,3260E+01 -10,60% -2,8600E+00 -9,21% -6,6120E+01 -10,53% 2,1734E+00 2,28% -4,4000E-07 -14,16% -2,5094E-02 -16,37% -1,0284E-03 -1,45% -1,4121E-03 -7,52%
Rubble-recyclate ** M kg 574,8 2,7309E+01 4,57% -9,3118E-01 -3,00% 2,6378E+01 4,20% 2,0003E+01 20,98% -2,1653E-07 -6,97% 3,9137E-02 25,53% 5,4859E-02 77,58% 2,9118E-03 15,50%
Sum reinforced concrete slab Cobiax per m² 5,9694E+02 100,00% 3,1055E+01 100,00% 6,2800E+02 100,00% 9,5352E+01 100,00% 3,1081E-06 100,00% 1,5327E-01 100,00% 7,0714E-02 100,00% 1,8782E-02 100,00%
%-proportion to reinforced steel 79,32% 83,98% 79,54% 86,65% 81,09% 72,68% 80,61% 79,75%
ERS
EOL
Reinforced concrete slab Cobiaxsystem,Cobiax-proportion 65 %,Bearing load 5 kN/m²Void former module: S160
Solid reinforced concrete slab,Bearing load 5 kN/m²
EOL
ERS
AmountUni
t
Dim
ensi
ons
Flow data set
7/22 BN00.100.100_SWN

8/22 BN00.100.100_SWN
LCA-Analysis comparison of slab systemsslab depth 28 cm
100,00%
100,00%
100,00%
100,00%
100,00%
100,00%
100,00%
100,00%
78,72%
83,69%
78,95%
87,13%80,60%
71,48%
80,50%
79,31%
0,00%
10,00%
20,00%
30,00%
40,00%
50,00%
60,00%
70,00%
80,00%
90,00%
100,00%PEnr
PEr
PEtot
GWP
ODP
AP
EP
POCP
Solid reinforced concrete slab,Bearing load 5 kN/m²
Reinforced concrete slab Cobiaxsystem,Cobiax-proportion 65 %,Bearing load 5 kN/m²Void former module: S180

Appendix ATable 5
LCA AnalysisSlab system Cobiax
Analysis slab depth 30 cm
Indicator Indicator Indicator Indicator Indicator Indicator Indicator Indicator
EOL-End of liveERS-Fabrication
Phas
e * declaration Cobiax** bulk density concrete 2400 kg/m³
Non
-ren
ewab
lePr
imar
yEn
ergy
Prop
ortio
nals
avin
gsco
mpa
red
toin
italp
ositi
on
Rene
wab
lePr
imar
yEn
ergy
Prop
ortio
nals
avin
gsco
mpa
red
toin
italp
ositi
on
Tota
lPrim
ary
Ener
gy
Prop
ortio
nals
avin
gsco
mpa
red
toin
italp
ositi
on
Glo
balW
arm
ing
Pote
ntia
l
Prop
ortio
nals
avin
gsco
mpa
red
toin
italp
ositi
on
Ozo
neD
eple
tion
Pote
ntia
l
Prop
ortio
nals
avin
gsco
mpa
red
toin
italp
ositi
on
Aci
dific
atio
nPo
tent
ial
Prop
ortio
nals
avin
gsco
mpa
red
toin
italp
ositi
on
Eutr
ophi
catio
nPo
tent
ial
Prop
ortio
nals
avin
gsco
mpa
red
toin
italp
ositi
on
Phot
oche
mic
alO
zone
Cre
atio
nPo
tent
ial
Prop
ortio
nals
avin
gsco
mpa
red
toin
italp
ositi
on
No. Hemis-pheres
[kWh] [kWh] [kWh] kg CO2-Eq compared to inital positionkg CFC11-Eq kg SO2-Eq kg PO4-Eq kg C2H4-Eq
Piece./m² PEnr PEr PEtot GWP ODP AP EP POCP
20,125
Slab depth 30 cm concrete C20/25 [kg] M kg 720
concrete C20/25 [m3] V m3 0,300 3,0720E+02 38,10% 5,7900E+00 14,62% 3,1299E+02 37,00% 5,8890E+01 49,95% 1,5990E-06 38,94% 1,0680E-01 47,27% 1,5030E-02 15,99% 1,0860E-02 43,04%
reinforcement steel* M kg 39,1 4,4155E+02 54,77% 3,5026E+01 88,42% 4,7657E+02 56,34% 3,1079E+01 26,36% 2,7903E-06 67,95% 5,8378E-02 25,84% 4,9254E-03 5,24% 9,7395E-03 38,60%transport lorry steel km 30,0 1,1029E+00 0,14% 1,4076E-03 0,00% 1,1043E+00 0,13% 7,7668E-02 0,07% 1,4588E-10 0,00% 4,6743E-04 0,21% 8,1344E-05 0,09% 4,0107E-05 0,16%
transport lorry concrete/ lorry 6,5 m³/ 15,6 t per load km 30,0 2,0308E+01 2,52% 2,5920E-02 0,07% 2,0334E+01 2,40% 1,4302E+00 1,21% 2,6862E-09 0,07% 8,6074E-03 3,81% 1,4979E-03 1,59% 7,4777E-04 2,96%
Rubble-recyclate ** M kg 759,1 3,6065E+01 4,47% -1,2297E+00 -3,10% 3,4835E+01 4,12% 2,6417E+01 22,41% -2,8596E-07 -6,96% 5,1686E-02 22,88% 7,2449E-02 77,09% 3,8454E-03 15,24%
Sum solid reinforced concrete slab per m² 8,0622E+02 100,00% 3,9614E+01 100,00% 8,4584E+02 100,00% 1,1789E+02 100,00% 4,1062E-06 100,00% 2,2594E-01 100,00% 9,3983E-02 100,00% 2,5233E-02 100,00%
8,184143223 [kg] [kg] [kg] [kg] [kg]
concrete C20/25 [kg] M kg 575,1
concrete C20/25 [m3] V m3 0,240 2,4538E+02 38,46% 4,6248E+00 13,95% 2,5000E+02 37,25% 4,7038E+01 46,51% 1,2772E-06 38,47% 8,5307E-02 51,90% 1,2005E-02 15,96% 8,6744E-03 43,29%reinforcement steel* M kg 35,9 4,0541E+02 63,55% 3,2160E+01 97,00% 4,3757E+02 65,20% 2,8536E+01 28,21% 2,5620E-06 77,16% 5,3600E-02 32,61% 4,5223E-03 6,01% 8,9424E-03 44,62%transport lorry steel km 30,0 1,0126E+00 0,16% 1,2924E-03 0,00% 1,0139E+00 0,15% 7,1311E-02 0,07% 1,3394E-10 0,00% 4,2918E-04 0,26% 7,4687E-05 0,10% 3,6824E-05 0,18%transport lorry concrete/ lorry 6,5 m³ per load km 30,0 1,6221E+01 2,54% 2,0704E-02 0,06% 1,6242E+01 2,42% 1,1424E+00 1,13% 2,1456E-09 0,06% 6,8752E-03 4,18% 1,1964E-03 1,59% 5,8991E-04 2,94%transport lorry Cobiax load km 200,0 2,5480E-01 0,04% 3,2520E-04 0,00% 2,5512E-01 0,04% 1,7944E-02 0,02% 3,3702E-11 0,00% 1,0799E-04 0,07% 1,8793E-05 0,02% 9,2660E-06 0,05%fabrication energy void formers, energy-mix 0,12kWh/h 10,6 kWh 1,3 3,9040E+00 0,61% 1,9621E-01 0,59% 4,1002E+00 0,61% 9,0032E-01 0,89% 1,4882E-07 4,48% 1,5391E-03 0,94% 1,1804E-04 0,16% 1,0405E-04 0,52%
End of Life Polypropylen M kg 2,2 -6,3260E+01 -9,92% -2,8600E+00 -8,63% -6,6120E+01 -9,85% 2,1734E+00 2,15% -4,4000E-07 -13,25% -2,5094E-02 -15,27% -1,0284E-03 -1,37% -1,4121E-03 -7,05%
Rubble-recyclate ** M kg 611,0 2,9029E+01 4,55% -9,8982E-01 -2,99% 2,8039E+01 4,18% 2,1263E+01 21,02% -2,3017E-07 -6,93% 4,1602E-02 25,31% 5,8314E-02 77,52% 3,0952E-03 15,45%
Sum reinforced concrete slab Cobiax per m² 6,3795E+02 100,00% 3,3153E+01 100,00% 6,7110E+02 100,00% 1,0114E+02 100,00% 3,3202E-06 100,00% 1,6437E-01 100,00% 7,5221E-02 100,00% 2,0040E-02 100,00%
%-proportion to reinforced steel 79,13% 83,69% 79,34% 85,79% 80,86% 72,75% 80,04% 79,42%
AmountUni
t
Dim
ensi
ons
Flow data set
ERS
EOL
Reinforced concrete slab Cobiaxsystem,Cobiax-proportion 65 %,Bearing load 5 kN/m²Void former module: S180
Solid reinforced concrete slab,Bearing load 5 kN/m²
EOL
ERS
9/22 BN00.100.100_SWN

10/22 BN00.100.100_SWN
LCA-Analysis comparison of slab systemsslab depth 30 cm
100,00%
100,00%
100,00%
100,00%
100,00%
100,00%
100,00%
100,00%
79,42%
80,04%
72,75%
80,86%85,79%
79,34%
83,69%
79,13%
0,00%
20,00%
40,00%
60,00%
80,00%
100,00%PEnr
PEr
PEtot
GWP
ODP
AP
EP
POCP
Solid reinforced concrete slab,Bearing load 5 kN/m²
Reinforced concrete slab Cobiaxsystem,Cobiax-proportion 65 %,Bearing load 5 kN/m²Void former module: S180

Appendix ATable 6
LCA AnalysisSlab system Cobiax
Analysis slab depth 35 cm
Indicator Indicator Indicator Indicator Indicator Indicator Indicator Indicator
EOL-End of liveERS-Fabrication
Phas
e * declaration Cobiax** bulk density concrete 2400 kg/m³
Non
-ren
ewab
lePr
imar
yEn
ergy
Prop
ortio
nals
avin
gsco
mpa
red
toin
italp
ositi
on
Rene
wab
lePr
imar
yEn
ergy
Prop
ortio
nals
avin
gsco
mpa
red
toin
italp
ositi
on
Tota
lPrim
ary
Ener
gy
Prop
ortio
nals
avin
gsco
mpa
red
toin
italp
ositi
on
Glo
balW
arm
ing
Pote
ntia
l
Prop
ortio
nals
avin
gsco
mpa
red
toin
italp
ositi
on
Ozo
neD
eple
tion
Pote
ntia
l
Prop
ortio
nals
avin
gsco
mpa
red
toin
italp
ositi
on
Aci
dific
atio
nPo
tent
ial
Prop
ortio
nals
avin
gsco
mpa
red
toin
italp
ositi
on
Eutr
ophi
catio
nPo
tent
ial
Prop
ortio
nals
avin
gsco
mpa
red
toin
italp
ositi
on
Phot
oche
mic
alO
zone
Cre
atio
nPo
tent
ial
Prop
ortio
nals
avin
gsco
mpa
red
toin
italp
ositi
on
No. Hemis-pheres
[kWh] [kWh] [kWh] kg CO2-Eq compared to inital positionkg CFC11-Eq kg SO2-Eq kg PO4-Eq kg C2H4-Eq
Piece./m² PEnr PEr PEtot GWP ODP AP EP POCP
Slab depth 35 cm concrete C20/25 [kg] M kg 840
concrete C20/25 [m3] V m3 0,350 3,5840E+02 38,02% 6,7550E+00 14,56% 3,6516E+02 36,92% 6,8705E+01 49,90% 1,8655E-06 38,84% 1,2460E-01 47,22% 1,7535E-02 15,99% 1,2670E-02 42,97%
reinforcement steel* M kg 45,8 5,1721E+02 54,87% 4,1028E+01 88,46% 5,5824E+02 56,44% 3,6405E+01 26,44% 3,2685E-06 68,04% 6,8382E-02 25,91% 5,7694E-03 5,26% 1,1408E-02 38,69%transport lorry steel km 30,0 1,2918E+00 0,14% 1,6488E-03 0,00% 1,2935E+00 0,13% 9,0977E-02 0,07% 1,7087E-10 0,00% 5,4753E-04 0,21% 9,5283E-05 0,09% 4,6979E-05 0,16%
transport lorry concrete/ lorry 6,5 m³/ 15,6 t per load km 30,0 2,3693E+01 2,51% 3,0240E-02 0,07% 2,3723E+01 2,40% 1,6686E+00 1,21% 3,1339E-09 0,07% 1,0042E-02 3,81% 1,7475E-03 1,59% 8,7240E-04 2,96%
Rubble-recyclate ** M kg 885,8 4,2084E+01 4,46% -1,4350E+00 -3,09% 4,0649E+01 4,11% 3,0826E+01 22,39% -3,3369E-07 -6,95% 6,0312E-02 22,86% 8,4541E-02 77,07% 4,4873E-03 15,22%
Sum solid reinforced concrete slab per m² 9,4268E+02 100,00% 4,6380E+01 100,00% 9,8906E+02 100,00% 1,3770E+02 100,00% 4,8036E-06 100,00% 2,6388E-01 100,00% 1,0969E-01 100,00% 2,9485E-02 100,00%
[kg] [kg] [kg] [kg] [kg]
concrete C20/25 [kg] M kg 691,2
concrete C20/25 [m3] V m3 0,288 2,9491E+02 38,47% 5,5584E+00 14,05% 3,0047E+02 37,27% 5,6534E+01 46,72% 1,5350E-06 38,01% 1,0253E-01 51,35% 1,4429E-02 15,96% 1,0426E-02 43,28%reinforcement steel* M kg 42,4 4,7881E+02 62,46% 3,7982E+01 96,00% 5,1680E+02 64,11% 3,3703E+01 27,85% 3,0259E-06 74,93% 6,3305E-02 31,70% 5,3411E-03 5,91% 1,0562E-02 43,85%transport lorry steel km 30,0 1,1959E+00 0,16% 1,5264E-03 0,00% 1,1975E+00 0,15% 8,4223E-02 0,07% 1,5819E-10 0,00% 5,0688E-04 0,25% 8,8209E-05 0,10% 4,3492E-05 0,18%transport lorry concrete/ lorry 6,5 m³ per load km 30,0 1,9496E+01 2,54% 2,4883E-02 0,06% 1,9521E+01 2,42% 1,3730E+00 1,13% 2,5787E-09 0,06% 8,2631E-03 4,14% 1,4380E-03 1,59% 7,0900E-04 2,94%transport lorry Cobiax load km 200,0 2,5480E-01 0,03% 3,2520E-04 0,00% 2,5512E-01 0,03% 1,7944E-02 0,01% 3,3702E-11 0,00% 1,0799E-04 0,05% 1,8793E-05 0,02% 9,2660E-06 0,04%fabrication energy void formers, energy-mix 0,12kWh/h 10,4 kWh 2,0 6,0647E+00 0,79% 3,0480E-01 0,77% 6,3695E+00 0,79% 1,3986E+00 1,16% 2,3119E-07 5,72% 2,3910E-03 1,20% 1,8337E-04 0,20% 1,6164E-04 0,67%
End of Life Polypropylen M kg 2,4 -6,9011E+01 -9,00% -3,1200E+00 -7,89% -7,2131E+01 -8,95% 2,3709E+00 1,96% -4,8000E-07 -11,89% -2,7376E-02 -13,71% -1,1219E-03 -1,24% -1,5404E-03 -6,40%
Rubble-recyclate ** M kg 733,6 3,4853E+01 4,55% -1,1884E+00 -3,00% 3,3665E+01 4,18% 2,5529E+01 21,10% -2,7635E-07 -6,84% 4,9949E-02 25,02% 7,0015E-02 77,46% 3,7163E-03 15,43%
Sum reinforced concrete slab Cobiax per m² 7,6658E+02 100,00% 3,9564E+01 100,00% 8,0614E+02 100,00% 1,2101E+02 100,00% 4,0385E-06 100,00% 1,9968E-01 100,00% 9,0391E-02 100,00% 2,4086E-02 100,00%
%-proportion to reinforced steel 81,32% 85,30% 81,51% 87,88% 84,07% 75,67% 82,41% 81,69%
ERS
EOL
Reinforced concrete slab Cobiaxsystem,Cobiax-proportion 65 %,Bearing load 5 kN/m²Void former module: E225
Solid reinforced concrete slab,Bearing load 5 kN/m²
EOL
ERS
AmountUni
t
Dim
ensi
ons
Flow data set
11/22 BN00.100.100_SWN

12/22 BN00.100.100_SWN
LCA-Analysis comparison of slab systemsslab depth 35 cm
100,00%
100,00%
100,00%
100,00%
100,00%
100,00%
100,00%
100,00%
81,32%
85,30%
81,51%
87,88%84,07%
75,67%
82,41%
81,69%
0,00%
10,00%
20,00%
30,00%
40,00%
50,00%
60,00%
70,00%
80,00%
90,00%
100,00%PEnr
PEr
PEtot
GWP
ODP
AP
EP
POCP
Solid reinforced concrete slab,Bearing load 5 kN/m²
Reinforced concrete slab Cobiaxsystem,Cobiax-proportion 65 %,Bearing load 5 kN/m²Void former module: S180

Appendix ATable 7
LCA AnalysisSlab system Cobiax
Analysis slab depth 40 cm
Indicator Indicator Indicator Indicator Indicator Indicator Indicator Indicator
EOL-End of liveERS-Fabrication
Phas
e * declaration Cobiax** bulk density concrete 2400 kg/m³
Non
-ren
ewab
lePr
imar
yEn
ergy
Prop
ortio
nals
avin
gsco
mpa
red
toin
italp
ositi
on
Rene
wab
lePr
imar
yEn
ergy
Prop
ortio
nals
avin
gsco
mpa
red
toin
italp
ositi
on
Tota
lPrim
ary
Ener
gy
Prop
ortio
nals
avin
gsco
mpa
red
toin
italp
ositi
on
Glo
balW
arm
ing
Pote
ntia
l
Prop
ortio
nals
avin
gsco
mpa
red
toin
italp
ositi
on
Ozo
neD
eple
tion
Pote
ntia
l
Prop
ortio
nals
avin
gsco
mpa
red
toin
italp
ositi
on
Aci
dific
atio
nPo
tent
ial
Prop
ortio
nals
avin
gsco
mpa
red
toin
italp
ositi
on
Eutr
ophi
catio
nPo
tent
ial
Prop
ortio
nals
avin
gsco
mpa
red
toin
italp
ositi
on
Phot
oche
mic
alO
zone
Cre
atio
nPo
tent
ial
Prop
ortio
nals
avin
gsco
mpa
red
toin
italp
ositi
on
No. Hemis-pheres
[kWh] [kWh] [kWh] kg CO2-Eq compared to inital positionkg CFC11-Eq kg SO2-Eq kg PO4-Eq kg C2H4-Eq
Piece./m² PEnr PEr PEtot GWP ODP AP EP POCP
Slab depth 40 cm concrete C20/25 [kg] M kg 960
concrete C20/25 [m3] V m3 0,400 4,0960E+02 38,00% 7,7200E+00 14,55% 4,1732E+02 36,90% 7,8520E+01 49,88% 2,1320E-06 38,81% 1,4240E-01 47,20% 2,0040E-02 15,98% 1,4480E-02 42,95%
reinforcement steel* M kg 52,4 5,9174E+02 54,89% 4,6940E+01 88,47% 6,3868E+02 56,47% 4,1651E+01 26,46% 3,7395E-06 68,07% 7,8236E-02 25,93% 6,6008E-03 5,27% 1,3052E-02 38,72%transport lorry steel km 30,0 1,4780E+00 0,14% 1,8864E-03 0,00% 1,4799E+00 0,13% 1,0409E-01 0,07% 1,9550E-10 0,00% 6,2643E-04 0,21% 1,0901E-04 0,09% 5,3749E-05 0,16%
transport lorry concrete/ lorry 6,5 m³/ 15,6 t per load km 30,0 2,7078E+01 2,51% 3,4560E-02 0,07% 2,7112E+01 2,40% 1,9069E+00 1,21% 3,5816E-09 0,07% 1,1477E-02 3,80% 1,9972E-03 1,59% 9,9703E-04 2,96%
Rubble-recyclate ** M kg 1012,4 4,8099E+01 4,46% -1,6401E+00 -3,09% 4,6459E+01 4,11% 3,5232E+01 22,38% -3,8138E-07 -6,94% 6,8932E-02 22,85% 9,6623E-02 77,07% 5,1286E-03 15,21%
Sum solid reinforced concrete slab per m² 1,0780E+03 100,00% 5,3057E+01 100,00% 1,1311E+03 100,00% 1,5741E+02 100,00% 5,4939E-06 100,00% 3,0167E-01 100,00% 1,2537E-01 100,00% 3,3712E-02 100,00%
[kg] [kg] [kg] [kg] [kg]
concrete C20/25 [kg] M kg 781,4
concrete C20/25 [m3] V m3 0,326 3,3340E+02 38,70% 6,2838E+00 14,21% 3,3968E+02 37,50% 6,3912E+01 46,13% 1,7354E-06 35,85% 1,1591E-01 51,26% 1,6312E-02 15,96% 1,1786E-02 43,40%reinforcement steel* M kg 47,1 5,3189E+02 61,74% 4,2193E+01 95,39% 5,7408E+02 63,38% 3,7438E+01 27,02% 3,3613E-06 69,43% 7,0322E-02 31,10% 5,9332E-03 5,81% 1,1732E-02 43,20%transport lorry steel km 30,0 1,3285E+00 0,15% 1,6956E-03 0,00% 1,3302E+00 0,15% 9,3559E-02 0,07% 1,7572E-10 0,00% 5,6307E-04 0,25% 9,7987E-05 0,10% 4,8313E-05 0,18%transport lorry concrete/ lorry 6,5 m³ per load km 30,0 2,2040E+01 2,56% 2,8130E-02 0,06% 2,2068E+01 2,44% 1,5522E+00 1,12% 2,9153E-09 0,06% 9,3414E-03 4,13% 1,6256E-03 1,59% 8,0152E-04 2,95%transport lorry Cobiax load km 200,0 2,5480E-01 0,03% 3,2520E-04 0,00% 2,5512E-01 0,03% 1,7944E-02 0,01% 3,3702E-11 0,00% 1,0799E-04 0,05% 1,8793E-05 0,02% 9,2660E-06 0,03%fabrication energy void formers, energy-mix 0,12kWh/h 7,2 kWh 5,4 1,6620E+01 1,93% 8,3526E-01 1,89% 1,7455E+01 1,93% 3,8327E+00 2,77% 6,3356E-07 13,09% 6,5522E-03 2,90% 5,0251E-04 0,49% 4,4295E-04 1,63%
End of Life Polypropylen M kg 2,9 -8,3388E+01 -9,68% -3,7700E+00 -8,52% -8,7158E+01 -9,62% 2,8649E+00 2,07% -5,8000E-07 -11,98% -3,3079E-02 -14,63% -1,3556E-03 -1,33% -1,8614E-03 -6,85%
Rubble-recyclate ** M kg 828,5 3,9362E+01 4,57% -1,3422E+00 -3,03% 3,8020E+01 4,20% 2,8832E+01 20,81% -3,1210E-07 -6,45% 5,6411E-02 24,95% 7,9072E-02 77,37% 4,1970E-03 15,46%
Sum reinforced concrete slab Cobiax per m² 8,6150E+02 100,00% 4,4230E+01 100,00% 9,0573E+02 100,00% 1,3854E+02 100,00% 4,8412E-06 100,00% 2,2613E-01 100,00% 1,0221E-01 100,00% 2,7156E-02 100,00%
%-proportion to reinforced steel 79,92% 83,36% 80,08% 88,01% 88,12% 74,96% 81,52% 80,55%
AmountUni
t
Dim
ensi
ons
Flow data set
ERS
EOL
Reinforced concrete slab Cobiaxsystem,Cobiax-proportion 65 %,Bearing load 5 kN/m²Void former module: E270
Solid reinforced concrete slab,Bearing load 5 kN/m²
EOL
ERS
13/22 BN00.100.100_SWN

14/22 BN00.100.100_SWN
LCA-Analysis comparison of slab systemsslab depth 40 cm
100,00%
100,00%
100,00%
100,00%
100,00%
100,00%
100,00%
100,00%
79,92%
83,36%
80,08%
88,01%
88,12%
74,96%
81,52%
80,55%
0,00%
20,00%
40,00%
60,00%
80,00%
100,00%PEnr
PEr
PEtot
GWP
ODP
AP
EP
POCP
Solid reinforced concrete slab,Bearing load 5 kN/m²
Reinforced concrete slab Cobiaxsystem,Cobiax-proportion 65 %,Bearing load 5 kN/m²Void former module: S180

Appendix ATable 8
LCA AnalysisSlab system Cobiax
Analysis slab depth 45 cm
Indicator Indicator Indicator Indicator Indicator Indicator Indicator Indicator
EOL-End of liveERS-Fabrication
Phas
e * declaration Cobiax** bulk density concrete 2400 kg/m³
Non
-ren
ewab
lePr
imar
yEn
ergy
Prop
ortio
nals
avin
gsco
mpa
red
toin
italp
ositi
on
Rene
wab
lePr
imar
yEn
ergy
Prop
ortio
nals
avin
gsco
mpa
red
toin
italp
ositi
on
Tota
lPrim
ary
Ener
gy
Prop
ortio
nals
avin
gsco
mpa
red
toin
italp
ositi
on
Glo
balW
arm
ing
Pote
ntia
l
Prop
ortio
nals
avin
gsco
mpa
red
toin
italp
ositi
on
Ozo
neD
eple
tion
Pote
ntia
l
Prop
ortio
nals
avin
gsco
mpa
red
toin
italp
ositi
on
Aci
dific
atio
nPo
tent
ial
Prop
ortio
nals
avin
gsco
mpa
red
toin
italp
ositi
on
Eutr
ophi
catio
nPo
tent
ial
Prop
ortio
nals
avin
gsco
mpa
red
toin
italp
ositi
on
Phot
oche
mic
alO
zone
Cre
atio
nPo
tent
ial
Prop
ortio
nals
avin
gsco
mpa
red
toin
italp
ositi
on
No. Hemis-pheres
[kWh] [kWh] [kWh] kg CO2-Eq compared to inital positionkg CFC11-Eq kg SO2-Eq kg PO4-Eq kg C2H4-Eq
Piece./m² PEnr PEr PEtot GWP ODP AP EP POCP
Slab depth 45 cm concrete C20/25 [kg] M kg 1080
concrete C20/25 [m3] V m3 0,450 4,6080E+02 37,98% 8,6850E+00 14,54% 4,6949E+02 36,88% 8,8335E+01 49,87% 2,3985E-06 38,78% 1,6020E-01 47,19% 2,2545E-02 15,98% 1,6290E-02 42,94%
reinforcement steel* M kg 59,0 6,6627E+02 54,91% 5,2853E+01 88,48% 7,1913E+02 56,49% 4,6897E+01 26,48% 4,2105E-06 68,09% 8,8090E-02 25,95% 7,4322E-03 5,27% 1,4696E-02 38,74%transport lorry steel km 30,0 1,6642E+00 0,14% 2,1240E-03 0,00% 1,6663E+00 0,13% 1,1720E-01 0,07% 2,2012E-10 0,00% 7,0533E-04 0,21% 1,2274E-04 0,09% 6,0519E-05 0,16%
transport lorry concrete/ lorry 6,5 m³/ 15,6 t per load km 30,0 3,0462E+01 2,51% 3,8880E-02 0,07% 3,0501E+01 2,40% 2,1453E+00 1,21% 4,0293E-09 0,07% 1,2911E-02 3,80% 2,2468E-03 1,59% 1,1217E-03 2,96%
Rubble-recyclate ** M kg 1139,0 5,4114E+01 4,46% -1,8452E+00 -3,09% 5,2269E+01 4,11% 3,9637E+01 22,38% -4,2907E-07 -6,94% 7,7552E-02 22,85% 1,0871E-01 77,07% 5,7699E-03 15,21%
Sum solid reinforced concrete slab per m² 1,2133E+03 100,00% 5,9734E+01 100,00% 1,2730E+03 100,00% 1,7713E+02 100,00% 6,1842E-06 100,00% 3,3946E-01 100,00% 1,4105E-01 100,00% 3,7939E-02 100,00%
[kg] [kg] [kg] [kg] [kg]
concrete C20/25 [kg] M kg 871,6
concrete C20/25 [m3] V m3 0,363 3,7188E+02 39,30% 7,0091E+00 14,50% 3,7889E+02 38,09% 7,1290E+01 46,55% 1,9357E-06 37,20% 1,2929E-01 51,95% 1,8195E-02 16,00% 1,3147E-02 43,90%reinforcement steel* M kg 51,7 5,8384E+02 61,70% 4,6313E+01 95,81% 6,3015E+02 63,36% 4,1095E+01 26,83% 3,6895E-06 70,90% 7,7190E-02 31,02% 6,5126E-03 5,73% 1,2878E-02 43,00%transport lorry steel km 30,0 1,4583E+00 0,15% 1,8612E-03 0,00% 1,4601E+00 0,15% 1,0270E-01 0,07% 1,9288E-10 0,00% 6,1806E-04 0,25% 1,0756E-04 0,09% 5,3031E-05 0,18%transport lorry concrete/ lorry 6,5 m³ per load km 30,0 2,4584E+01 2,60% 3,1378E-02 0,06% 2,4616E+01 2,47% 1,7313E+00 1,13% 3,2518E-09 0,06% 1,0420E-02 4,19% 1,8133E-03 1,59% 8,9404E-04 2,99%transport lorry Cobiax load km 200,0 2,5480E-01 0,03% 3,2520E-04 0,00% 2,5512E-01 0,03% 1,7944E-02 0,01% 3,3702E-11 0,00% 1,0799E-04 0,04% 1,8793E-05 0,02% 9,2660E-06 0,03%fabrication energy void formers, energy-mix 0,12kWh/h 5,3 kWh 5,0 1,5291E+01 1,62% 7,6847E-01 1,59% 1,6059E+01 1,61% 3,5263E+00 2,30% 5,8289E-07 11,20% 6,0282E-03 2,42% 4,6233E-04 0,41% 4,0753E-04 1,36%
End of Life Polypropylen M kg 3,3 -9,4890E+01 -10,03% -4,2900E+00 -8,87% -9,9180E+01 -9,97% 3,2600E+00 2,13% -6,6000E-07 -12,68% -3,7642E-02 -15,12% -1,5426E-03 -1,36% -2,1181E-03 -7,07%
Rubble-recyclate ** M kg 923,3 4,3866E+01 4,64% -1,4957E+00 -3,09% 4,2370E+01 4,26% 3,2131E+01 20,98% -3,4782E-07 -6,68% 6,2866E-02 25,26% 8,8120E-02 77,51% 4,6773E-03 15,62%
Sum reinforced concrete slab Cobiax per m² 9,4628E+02 100,00% 4,8339E+01 100,00% 9,9462E+02 100,00% 1,5315E+02 100,00% 5,2038E-06 100,00% 2,4888E-01 100,00% 1,1369E-01 100,00% 2,9948E-02 100,00%
%-proportion to reinforced steel 77,99% 80,92% 78,13% 86,46% 84,15% 73,32% 80,60% 78,94%
ERS
EOL
Reinforced concrete slab Cobiaxsystem,Cobiax-proportion 65 %,Bearing load 5 kN/m²Void former module: E315
Solid reinforced concrete slab,Bearing load 5 kN/m²
EOL
ERS
AmountUni
t
Dim
ensi
ons
Flow data set
15/22 BN00.100.100_SWN

16/22 BN00.100.100_SWN
LCA-Analysis comparison of slab systemsslab depth 45 cm
100,00%
100,00%
100,00%
100,00%
100,00%
100,00%
100,00%
100,00%
78,94%
80,60%
73,32%
84,15%86,46%
78,13%
80,92%
77,99%
0,00%
10,00%
20,00%
30,00%
40,00%
50,00%
60,00%
70,00%
80,00%
90,00%
100,00%PEnr
PEr
PEtot
GWP
ODP
AP
EP
POCP
Solid reinforced concrete slab,Bearing load 5 kN/m²
Reinforced concrete slab Cobiaxsystem,Cobiax-proportion 65 %,Bearing load 5 kN/m²Void former module: S180

Appendix ATable 9
LCA AnalysisSlab system Cobiax
Analysis slab depth 50 cm
Indicator Indicator Indicator Indicator Indicator Indicator Indicator Indicator
EOL-End of liveERS-Fabrication
Phas
e * declaration Cobiax** bulk density concrete 2400 kg/m³
Non
-ren
ewab
lePr
imar
yEn
ergy
Prop
ortio
nals
avin
gsco
mpa
red
toin
italp
ositi
on
Rene
wab
lePr
imar
yEn
ergy
Prop
ortio
nals
avin
gsco
mpa
red
toin
italp
ositi
on
Tota
lPrim
ary
Ener
gy
Prop
ortio
nals
avin
gsco
mpa
red
toin
italp
ositi
on
Glo
balW
arm
ing
Pote
ntia
l
Prop
ortio
nals
avin
gsco
mpa
red
toin
italp
ositi
on
Ozo
neD
eple
tion
Pote
ntia
l
Prop
ortio
nals
avin
gsco
mpa
red
toin
italp
ositi
on
Aci
dific
atio
nPo
tent
ial
Prop
ortio
nals
avin
gsco
mpa
red
toin
italp
ositi
on
Eutr
ophi
catio
nPo
tent
ial
Prop
ortio
nals
avin
gsco
mpa
red
toin
italp
ositi
on
Phot
oche
mic
alO
zone
Cre
atio
nPo
tent
ial
Prop
ortio
nals
avin
gsco
mpa
red
toin
italp
ositi
on
No. Hemis-pheres
[kWh] [kWh] [kWh] kg CO2-Eq compared to inital positionkg CFC11-Eq kg SO2-Eq kg PO4-Eq kg C2H4-Eq
Piece./m² PEnr PEr PEtot GWP ODP AP EP POCP
Slab depth 50 cm concrete C20/25 [kg] M kg 1200
concrete C20/25 [m3] V m3 0,500 5,1200E+02 37,96% 9,6500E+00 14,53% 5,2165E+02 36,86% 9,8150E+01 49,86% 2,6650E-06 38,77% 1,7800E-01 47,18% 2,5050E-02 15,98% 1,8100E-02 42,93%
reinforcement steel* M kg 65,6 7,4081E+02 54,93% 5,8765E+01 88,49% 7,9957E+02 56,51% 5,2144E+01 26,49% 4,6815E-06 68,10% 9,7944E-02 25,96% 8,2636E-03 5,27% 1,6340E-02 38,75%transport lorry steel km 30,0 1,8503E+00 0,14% 2,3616E-03 0,00% 1,8527E+00 0,13% 1,3031E-01 0,07% 2,4474E-10 0,00% 7,8423E-04 0,21% 1,3647E-04 0,09% 6,7289E-05 0,16%
transport lorry concrete/ lorry 6,5 m³/ 15,6 t per load km 30,0 3,3847E+01 2,51% 4,3200E-02 0,07% 3,3890E+01 2,40% 2,3837E+00 1,21% 4,4770E-09 0,07% 1,4346E-02 3,80% 2,4965E-03 1,59% 1,2463E-03 2,96%
Rubble-recyclate ** M kg 1265,6 6,0129E+01 4,46% -2,0503E+00 -3,09% 5,8078E+01 4,10% 4,4043E+01 22,37% -4,7676E-07 -6,94% 8,6172E-02 22,84% 1,2079E-01 77,07% 6,4113E-03 15,21%
Sum solid reinforced concrete slab per m² 1,3486E+03 100,00% 6,6410E+01 100,00% 1,4150E+03 100,00% 1,9685E+02 100,00% 6,8745E-06 100,00% 3,7725E-01 100,00% 1,5674E-01 100,00% 4,2165E-02 100,00%
[kg] [kg] [kg] [kg] [kg]
concrete C20/25 [kg] M kg 961,8
concrete C20/25 [m3] V m3 0,401 4,1037E+02 39,64% 7,7345E+00 14,59% 4,1810E+02 38,42% 7,8667E+01 47,17% 2,1360E-06 40,07% 1,4267E-01 52,82% 2,0078E-02 16,04% 1,4507E-02 44,23%reinforcement steel* M kg 57,4 6,4821E+02 62,61% 5,1419E+01 96,99% 6,9963E+02 64,28% 4,5626E+01 27,36% 4,0963E-06 76,84% 8,5701E-02 31,73% 7,2306E-03 5,78% 1,4298E-02 43,59%transport lorry steel km 30,0 1,6190E+00 0,16% 2,0664E-03 0,00% 1,6211E+00 0,15% 1,1402E-01 0,07% 2,1415E-10 0,00% 6,8620E-04 0,25% 1,1942E-04 0,10% 5,8878E-05 0,18%transport lorry concrete/ lorry 6,5 m³ per load km 30,0 2,7129E+01 2,62% 3,4625E-02 0,07% 2,7163E+01 2,50% 1,9105E+00 1,15% 3,5883E-09 0,07% 1,1498E-02 4,26% 2,0009E-03 1,60% 9,8656E-04 3,01%transport lorry Cobiax load km 200,0 2,5480E-01 0,02% 3,2520E-04 0,00% 2,5512E-01 0,02% 1,7944E-02 0,01% 3,3702E-11 0,00% 1,0799E-04 0,04% 1,8793E-05 0,02% 9,2660E-06 0,03%fabrication energy void formers, energy-mix 0,12kWh/h 4,1 kWh 1,9 5,7320E+00 0,55% 2,8808E-01 0,54% 6,0201E+00 0,55% 1,3219E+00 0,79% 2,1851E-07 4,10% 2,2598E-03 0,84% 1,7331E-04 0,14% 1,5277E-04 0,47%
End of Life Polypropylen M kg 3,7 -1,0639E+02 -10,28% -4,8100E+00 -9,07% -1,1120E+02 -10,22% 3,6552E+00 2,19% -7,3996E-07 -13,88% -4,2204E-02 -15,62% -1,7295E-03 -1,38% -2,3748E-03 -7,24%
Rubble-recyclate ** M kg 1019,2 4,8422E+01 4,68% -1,6511E+00 -3,11% 4,6771E+01 4,30% 3,5468E+01 21,27% -3,8394E-07 -7,20% 6,9395E-02 25,69% 9,7272E-02 77,72% 5,1631E-03 15,74%
Sum reinforced concrete slab Cobiax per m² 1,0353E+03 100,00% 5,3018E+01 100,00% 1,0884E+03 100,00% 1,6678E+02 100,00% 5,3308E-06 100,00% 2,7011E-01 100,00% 1,2516E-01 100,00% 3,2801E-02 100,00%
%-proportion to reinforced steel 76,77% 79,83% 76,91% 84,72% 77,54% 71,60% 79,86% 77,79%
AmountUni
t
Dim
ensi
ons
Flow data set
ERS
EOL
Reinforced concrete slab Cobiaxsystem,Cobiax-proportion 65 %,Bearing load 5 kN/m²Void former module: E360
Solid reinforced concrete slab,Bearing load 5 kN/m²
EOL
ERS
17/22 BN00.100.100_SWN

18/22 BN00.100.100_SWN
LCA-Analysis comparison of slab systemsslab depth 50 cm
100,00%
100,00%
100,00%
100,00%
100,00%
100,00%
100,00%
100,00%
76,77%
79,83%
76,91%
84,72%77,54%
71,60%
79,86%
77,79%
0,00%
10,00%
20,00%
30,00%
40,00%
50,00%
60,00%
70,00%
80,00%
90,00%
100,00%PEnr
PEr
PEtot
GWP
ODP
AP
EP
POCP
Solid reinforced concrete slab,Bearing load 5 kN/m²
Reinforced concrete slab Cobiaxsystem,Cobiax-proportion 65 %,Bearing load 5 kN/m²Void former module: S180

Appendix ATable 10
LCA AnalysisSlab system Cobiax
Analysis slab depth 55 cm
Indicator Indicator Indicator Indicator Indicator Indicator Indicator Indicator
EOL-End of liveERS-Fabrication
Phas
e * declaration Cobiax** bulk density concrete 2400 kg/m³
Non
-ren
ewab
lePr
imar
yEn
ergy
Prop
ortio
nals
avin
gsco
mpa
red
toin
italp
ositi
on
Rene
wab
lePr
imar
yEn
ergy
Prop
ortio
nals
avin
gsco
mpa
red
toin
italp
ositi
on
Tota
lPrim
ary
Ener
gy
Prop
ortio
nals
avin
gsco
mpa
red
toin
italp
ositi
on
Glo
balW
arm
ing
Pote
ntia
l
Prop
ortio
nals
avin
gsco
mpa
red
toin
italp
ositi
on
Ozo
neD
eple
tion
Pote
ntia
l
Prop
ortio
nals
avin
gsco
mpa
red
toin
italp
ositi
on
Aci
dific
atio
nPo
tent
ial
Prop
ortio
nals
avin
gsco
mpa
red
toin
italp
ositi
on
Eutr
ophi
catio
nPo
tent
ial
Prop
ortio
nals
avin
gsco
mpa
red
toin
italp
ositi
on
Phot
oche
mic
alO
zone
Cre
atio
nPo
tent
ial
Prop
ortio
nals
avin
gsco
mpa
red
toin
italp
ositi
on
No. Hemis-pheres
[kWh] [kWh] [kWh] kg CO2-Eq compared to inital positionkg CFC11-Eq kg SO2-Eq kg PO4-Eq kg C2H4-Eq
Piece./m² PEnr PEr PEtot GWP ODP AP EP POCP
Slab depth 55 cm concrete C20/25 [kg] M kg 1320
concrete C20/25 [m3] V m3 0,550 5,6320E+02 37,92% 1,0615E+01 14,51% 5,7382E+02 36,82% 1,0797E+02 49,83% 2,9315E-06 38,72% 1,9580E-01 47,16% 2,7555E-02 15,98% 1,9910E-02 42,89%
reinforcement steel* M kg 72,3 8,1647E+02 54,98% 6,4767E+01 88,51% 8,8124E+02 56,55% 5,7469E+01 26,53% 5,1596E-06 68,14% 1,0795E-01 26,00% 9,1076E-03 5,28% 1,8009E-02 38,80%transport lorry steel km 30,0 2,0393E+00 0,14% 2,6028E-03 0,00% 2,0419E+00 0,13% 1,4362E-01 0,07% 2,6974E-10 0,00% 8,6433E-04 0,21% 1,5041E-04 0,09% 7,4162E-05 0,16%
transport lorry concrete/ lorry 6,5 m³/ 15,6 t per load km 30,0 3,7232E+01 2,51% 4,7520E-02 0,06% 3,7279E+01 2,39% 2,6220E+00 1,21% 4,9247E-09 0,07% 1,5780E-02 3,80% 2,7461E-03 1,59% 1,3709E-03 2,95%
Rubble-recyclate ** M kg 1392,3 6,6148E+01 4,45% -2,2555E+00 -3,08% 6,3893E+01 4,10% 4,8452E+01 22,36% -5,2449E-07 -6,93% 9,4799E-02 22,83% 1,3288E-01 77,06% 7,0531E-03 15,19%
Sum solid reinforced concrete slab per m² 1,4851E+03 100,00% 7,3177E+01 100,00% 1,5583E+03 100,00% 2,1665E+02 100,00% 7,5718E-06 100,00% 4,1519E-01 100,00% 1,7244E-01 100,00% 4,6418E-02 100,00%
[kg] [kg] [kg] [kg] [kg]
concrete C20/25 [kg] M kg 1052
concrete C20/25 [m3] V m3 0,438 4,4885E+02 39,93% 8,4598E+00 14,75% 4,5731E+02 38,71% 8,6045E+01 47,24% 2,3363E-06 40,21% 1,5605E-01 53,05% 2,1961E-02 16,06% 1,5868E-02 44,45%reinforcement steel* M kg 62,1 7,0128E+02 62,38% 5,5630E+01 96,98% 7,5691E+02 64,06% 4,9361E+01 27,10% 4,4317E-06 76,27% 9,2718E-02 31,52% 7,8227E-03 5,72% 1,5469E-02 43,34%transport lorry steel km 30,0 1,7516E+00 0,16% 2,2356E-03 0,00% 1,7538E+00 0,15% 1,2335E-01 0,07% 2,3168E-10 0,00% 7,4239E-04 0,25% 1,2919E-04 0,09% 6,3699E-05 0,18%transport lorry concrete/ lorry 6,5 m³ per load km 30,0 2,9673E+01 2,64% 3,7872E-02 0,07% 2,9711E+01 2,51% 2,0897E+00 1,15% 3,9248E-09 0,07% 1,2576E-02 4,28% 2,1886E-03 1,60% 1,0791E-03 3,02%transport lorry Cobiax load km 200,0 2,5480E-01 0,02% 3,2520E-04 0,00% 2,5512E-01 0,02% 1,7944E-02 0,01% 3,3702E-11 0,00% 1,0799E-04 0,04% 1,8793E-05 0,01% 9,2660E-06 0,03%fabrication energy void formers, energy-mix 0,12kWh/h 3,2 kWh 2,4 7,2905E+00 0,65% 3,6641E-01 0,64% 7,6569E+00 0,65% 1,6813E+00 0,92% 2,7792E-07 4,78% 2,8742E-03 0,98% 2,2044E-04 0,16% 1,9431E-04 0,54%
End of Life Polypropylen M kg 4,1 -1,1789E+02 -10,49% -5,3300E+00 -9,29% -1,2322E+02 -10,43% 4,0503E+00 2,22% -8,2000E-07 -14,11% -4,6767E-02 -15,90% -1,9165E-03 -1,40% -2,6316E-03 -7,37%
Rubble-recyclate ** M kg 1114,1 5,2931E+01 4,71% -1,8048E+00 -3,15% 5,1126E+01 4,33% 3,8771E+01 21,29% -4,1969E-07 -7,22% 7,5857E-02 25,79% 1,0633E-01 77,75% 5,6438E-03 15,81%
Sum reinforced concrete slab Cobiax per m² 1,1241E+03 100,00% 5,7362E+01 100,00% 1,1815E+03 100,00% 1,8214E+02 100,00% 5,8105E-06 100,00% 2,9416E-01 100,00% 1,3675E-01 100,00% 3,5695E-02 100,00%
%-proportion to reinforced steel 75,70% 78,39% 75,82% 84,07% 76,74% 70,85% 79,30% 76,90%
ERS
EOL
Reinforced concrete slab Cobiaxsystem,Cobiax-proportion 65 %,Bearing load 5 kN/m²Void former module: E405
Solid reinforced concrete slab,Bearing load 5 kN/m²
EOL
ERS
AmountUni
t
Dim
ensi
ons
Flow data set
19/22 BN00.100.100_SWN

20/22 BN00.100.100_SWN
LCA-Analysis comparison of slab systemsslab depth 55 cm
100,00%
100,00%
100,00%
100,00%
100,00%
100,00%
100,00%
100,00%
75,70%
78,39%
75,82%
84,07%76,74%
70,85%
79,30%
76,90%
0,00%
20,00%
40,00%
60,00%
80,00%
100,00%PEnr
PEr
PEtot
GWP
ODP
AP
EP
POCP
Solid reinforced concrete slab,Bearing load 5 kN/m²
Reinforced concrete slab Cobiaxsystem,Cobiax-proportion 65 %,Bearing load 5 kN/m²Void former module: S180

D:\002_CSD_Projekte\1_Berlin\BN00100_Cobiax\100_LCA_Bewertung\Übersetzungen\Bericht _Cobiaxbewertung_English.doc
APPENDIX B

Slab depth cm 18 20 25 28 30 35 40 45 50 55 60
Solid reinforced concrete slabm³/m² 0,18 0,20 0,25 0,28 0,30 0,35 0,40 0,45 0,50 0,55 0,60
2.400 kg/m³Concrete proportion kg/m² 432,0 480,0 600,0 672,0 720,0 840,0 960,0 1080,0 1200,0 1320,0 1440,0
Reinforcement rate 125 kg/m³Bending reinforcement kg/m² 22,5 25,0 31,3 35,0 37,5 43,8 50,0 56,3 62,5 68,8 75,0Wire chairs upper reinforcement layer kg/m² 0,7 0,9 1,3 1,5 1,6 2,0 2,4 2,7 3,1 3,5 3,9Proportion 100% kg/m² 0,7 0,9 1,3 1,5 1,6 2,0 2,4 2,7 3,1 3,5 3,9Steel proportion kg/m² 23,2 25,9 32,6 36,5 39,1 45,8 52,4 59,0 65,6 72,3 78,9
Cobiax slabVoid former module S-80* S-100* S-140 S-160 S-180 E-225 E-270 E-315 E-360 E-405 E-450Volume reduction (in allocated area) m³/m² -0,0444 -0,0532 -0,0752 -0,0840 -0,0929 -0,0954 -0,1145 -0,1336 -0,1527 -0,1718 -0,1909
2.400 kg/m³Allocation rate void formers 65%Concrete reduction kg/m² -69,3 -83,0 -117,3 -131,0 -144,9 -148,8 -178,6 -208,4 -238,2 -268,0 -297,8Concrete proportion kg/m² 362,7 397,0 482,7 541,0 575,1 691,2 781,4 871,6 961,8 1052,0 1142,2
-16,0% -17,3% -19,6% -19,5% -20,1% -17,7% -18,6% -19,3% -19,9% -20,3% -20,7%
Reinforcement reduction -7,6% -8,6% -10,9% -11,4% -12,1% -11,3% -12,4% -13,4% -14,2% -14,9% -15,5%kg/m² -1,7 -2,2 -3,4 -4,0 -4,5 -4,9 -6,2 -7,5 -8,9 -10,2 -11,6
Bending reinforcement kg/m² 20,8 22,9 27,8 31,0 33,0 38,8 43,8 48,7 53,6 58,5 63,4Wire chairs upper reinforcement layer kg/m² 0,7 0,9 1,3 1,5 1,6 2,0 2,4 2,7 3,1 3,5 3,9Proportion 35% kg/m² 0,2 0,3 0,5 0,5 0,6 0,7 0,8 0,9 1,1 1,2 1,4Cobiax cage kg/m² 2,7 2,9 3,3 3,5 3,7 4,5 3,8 3,2 4,1 3,7 4,2Proportion 65% kg/m² 1,8 1,9 2,1 2,3 2,4 2,9 2,5 2,1 2,7 2,4 2,7Steel proportion kg/m² 22,8 25,1 30,4 33,8 35,9 42,4 47,1 51,7 57,4 62,1 67,5
-2% -3% -6% -7% -8% -7% -10% -12% -13% -14% -14%
Weight Cobiax void formers kg/m² 3,45 3,45 3,45 3,45 3,45 3,70 4,40 5,03 5,64 6,30 6,91Allocation rate void formers 65%Proportion plastics (Recyclate; PEHD/ PP) kg/m² 2,2 2,2 2,2 2,2 2,2 2,4 2,9 3,3 3,7 4,1 4,5

D:\002_CSD_Projekte\1_Berlin\BN00100_Cobiax\100_LCA_Bewertung\Übersetzungen\Bericht _Cobiaxbewertung_English.doc
APPENDIX C

Appendix CTable 13
Calculation of allocations
Slab depth Void former module
Max. Numberof
void formersMax. No.
hemispheres
No. hemispheres withallocation rate
65%Machine No. Connected
loadPower
consumptionEnergydemand
Productionoutput
Energydemand
[cm] [Piece/m²] [Piece/m²] [Piece/m²] [kW/h] [kW/h] [Piece/h] kW/Piece18 S-80 8,16 16,32 10,61 93,00 30,00% 27,90 225,00 0,1220 S-100 8,16 16,32 10,61 93,00 30,00% 27,90 225,00 0,1225 S-140 8,16 16,32 10,61 93,00 30,00% 27,90 225,00 0,1228 S-160 8,16 16,32 10,61 93,00 30,00% 27,90 225,00 0,1230 S-180 8,16 16,32 10,61 93,00 30,00% 27,90 225,00 0,1235 E-225 16,00 10,40 B9 40,00 208,00 0,1940 E-270 11,11 7,22 B11 62,00 83,00 0,7545 E-315 8,16 5,30 B11 62,00 66,00 0,9450 E-360 6,25 4,06 B8 30,50 66,00 0,4655 E-405 4,94 3,21 B8 30,50 41,00 0,7460 E-450 4,00 2,60 B8 30,50 33,00 0,92
1/1 BN00.100.100_SWN

D:\002_CSD_Projekte\1_Berlin\BN00100_Cobiax\100_LCA_Bewertung\Übersetzungen\Bericht _Cobiaxbewertung_English.doc
APPENDIX D

Appendix DTable 14
Data Ökobau.dat
Components Flow data set Dimension Unit AmountNon-renewablePrimary Energy
RenewablePrimaryEnergy
GlobalWarmingPotential(GWP 100)
OzoneDepletionPotential(ODP)
AcidificationPotential (AP)
EutrophicationPotential (EP)
PhotochemicalOzone Creation
GWP ODP AP EP Potential[MJ] [MJ] [kg] [kg] [kg] [kg] [kg]
1.4.1 Concrete C20/25 Concrete C20/25 [m3] Volume m3 1 1,02E+03 1,93E+01 1,96E+02 5,33E-06 3,56E-01 5,01E-02 3,62E-024.1.2 Reinforcement steel Reinforcement steel Mass kg 1 1,13E+01 8,96E-01 7,95E-01 7,14E-08 1,49E-03 1,26E-04 2,49E-049.2.5 Electricity-mix Electricity [energy] (MJ) Energy (lower heating value) MJ 3,6 1,10E+01 5,55E-01 7,08E-01 1,17E-07 1,21E-03 9,28E-05 8,18E-059.3.1 Transport- Lorry Transport [other] (kg*km) Transport expenditures kg*km 1000 9,40E-01 1,20E-03 6,62E-02 1,24E-10 3,98E-04 6,93E-05 3,42E-059.5.1 Rubble processing Rubble-recyclate [other building processes] (kg) Mass kg 1 4,75E-02 -1,62E-03 3,48E-02 -3,77E-10 6,81E-05 9,54E-05 5,07E-06End of life - Polypropylen-pipe (PP) Building services recycling Mass kg 1 -2,88E+01 -1,30E+00 9,88E-01 -2,00E-07 -1,14E-02 -4,67E-04 -6,42E-04
15.04.2010 1/1 BN00.100.100_SWN

D:\002_CSD_Projekte\1_Berlin\BN00100_Cobiax\100_LCA_Bewertung\Übersetzungen\Bericht _Cobiaxbewertung_English.doc
CONCRETE 20/25
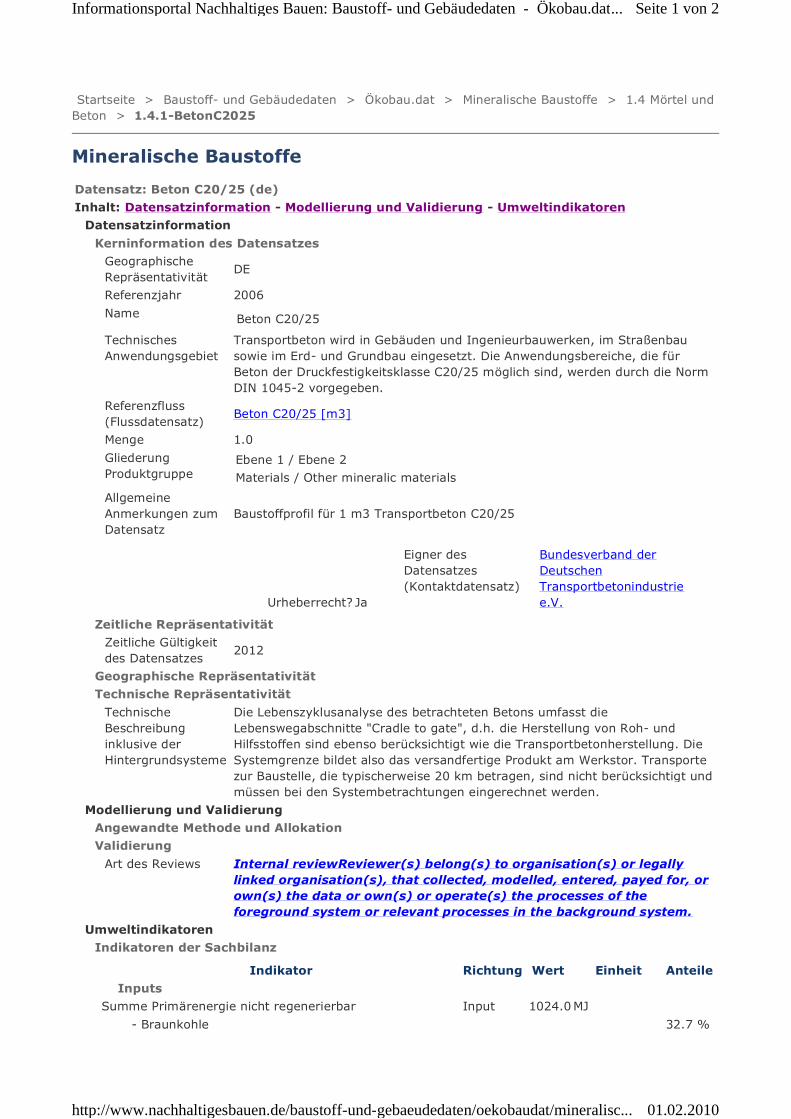
Startseite > Baustoff- und Gebäudedaten > Ökobau.dat > Mineralische Baustoffe > 1.4 Mörtel undBeton > 1.4.1-BetonC2025
Mineralische Baustoffe
Datensatz: Beton C20/25 (de)
Inhalt: Datensatzinformation - Modellierung und Validierung - Umweltindikatoren
Datensatzinformation
Kerninformation des Datensatzes
DE
2006
Beton C20/25
Transportbeton wird in Gebäuden und Ingenieurbauwerken, im Straßenbausowie im Erd- und Grundbau eingesetzt. Die Anwendungsbereiche, die fürBeton der Druckfestigkeitsklasse C20/25 möglich sind, werden durch die NormDIN 1045-2 vorgegeben.
Beton C20/25 [m3]
1.0
Materials / Other mineralic materials
Baustoffprofil für 1 m3 Transportbeton C20/25
Ja
Bundesverband derDeutschenTransportbetonindustriee.V.
Zeitliche Repräsentativität
2012
Geographische Repräsentativität
Technische Repräsentativität
Die Lebenszyklusanalyse des betrachteten Betons umfasst dieLebenswegabschnitte "Cradle to gate", d.h. die Herstellung von Roh- undHilfsstoffen sind ebenso berücksichtigt wie die Transportbetonherstellung. DieSystemgrenze bildet also das versandfertige Produkt am Werkstor. Transportezur Baustelle, die typischerweise 20 km betragen, sind nicht berücksichtigt undmüssen bei den Systembetrachtungen eingerechnet werden.
Modellierung und Validierung
Angewandte Methode und Allokation
Validierung
Internal reviewReviewer(s) belong(s) to organisation(s) or legallylinked organisation(s), that collected, modelled, entered, payed for, orown(s) the data or own(s) or operate(s) the processes of theforeground system or relevant processes in the background system.
Umweltindikatoren
Indikatoren der Sachbilanz
Indikator Richtung Wert Einheit Anteile
Inputs
Summe Primärenergie nicht regenerierbar Input 1024.0 MJ
- Braunkohle 32.7 %
Art des Reviews
TechnischeBeschreibunginklusive derHintergrundsysteme
Zeitliche Gültigkeitdes Datensatzes
Eigner desDatensatzes(Kontaktdatensatz)
Urheberrecht?
AllgemeineAnmerkungen zumDatensatz
/ Ebene 2Ebene 1GliederungProduktgruppe
Menge
Referenzfluss(Flussdatensatz)
TechnischesAnwendungsgebiet
Name
Referenzjahr
GeographischeRepräsentativität
Seite 1 von 2Informationsportal Nachhaltiges Bauen: Baustoff- und Gebäudedaten - Ökobau.dat...
01.02.2010http://www.nachhaltigesbauen.de/baustoff-und-gebaeudedaten/oekobaudat/mineralisc...

- Steinkohle 17.9 %
- Erdgas 5.7 %
- Erdöl 27.8 %
- Uran 15.9 %
Summe Primärenergie regenerierbar Input 19.3 MJ
- Wasserkraft 47.8 %
- Windkraft 46.0 %
- Sonnennutzung (Solarenergie) 3.0 %
- Sonnennutzung (Biomasse) 3.2 %
Summe Sekundärbrennstoffe Input 343.0 MJ
Wassernutzung Input 1124.0 kg
Outputs
Abraum und Erzaufbereitungsrückstände Output 687.0 kg
Hausmüll und Gewerbeabfälle Output 0.0025 kg
Sonderabfälle Output 0.136 kg
Indikatoren der Wirkbilanz
Indikator Wert Einheit
Abiotischer Ressourcenverbrauch 0.0kg Sb-Äquivalente
Treibhauspotential 196.3kg CO2-Äquivalente
Ozonabbaupotential 5.33E-6kg R11-Äquivalente
Versauerungspotential 0.356kg SO2-Äquivalente
Eutrophierungspotential 0.0501kg PO4-Äquivalente
Bodennahe Ozonbildung 0.0362kg C2H4-Äquivalente
© Informationsportal Nachhaltiges Bauen des BMVBS
Seite 2 von 2Informationsportal Nachhaltiges Bauen: Baustoff- und Gebäudedaten - Ökobau.dat...
01.02.2010http://www.nachhaltigesbauen.de/baustoff-und-gebaeudedaten/oekobaudat/mineralisc...

D:\002_CSD_Projekte\1_Berlin\BN00100_Cobiax\100_LCA_Bewertung\Übersetzungen\Bericht _Cobiaxbewertung_English.doc
REINFORCEMENT STEEL

Datensatz: 4.1.2 Bewehrungsstahl (de)
Inhalt: Datensatzinformation - Modellierung und Validierung - Umweltindikatoren
Datensatzinformation
Kerninformation des Datensatzes
DE
2002
4.1.2 Bewehrungsstahl
Bewehrungsstahl, Betonstabstahl, BSt 500
Bewehrungsstahl
1 kg (Masse)
Das vorliegende Umweltprofil beinhaltet die Aufwendungen für die Lebenszyklus-Stadien "Cradle to Gate". Es basiert hauptsächlich auf Literaturrecherchen unddirekten Datenerhebungen der Industrie. Für die Lebenszyklusbetrachtung musszwingend der entsprechende Recyclingprozess einbezogen werden.
4 Metalle / 4.1 Stahl / 4.1.2 Bewehrungsstahl
JaPEINTERNATIONAL
Quantitative Referenz
Bewehrungsstahl [Wertgüter] - [Wertstoffe] - [Metalle] - kg (Masse)
Zeitliche Repräsentativität
jährlicher Durchschnitt
Technische Repräsentativität
Der Datensatz repräsentiert die Stahlproduktion in Deutschland. Er basiert auf denwesentlichen Prozessen innerhalb eines Elektrostahlwerks. Hauptprozess hierbei istdas Schmelzen von Schrott in einem Elektroofen (EAF) unter Energiezufuhr(Stromverbrauch). Wesentlichstes Rohmaterial des EAF ist Eisenschrott, welchersowohl innerhalb der Produktion im Werk anfällt (Verschnitt) aber auch ausVerschnitten von Stahlherstellern stammt (z. B. aus dem Fahrzeugbau) oder Schrottvon Endnutzern (End-of-Life Produkte) darstellt. Wie im gemischten Stahlwerk mitHochofen und Konverter dient Kalkstein zur Aufnahme von ungewünschtenStahlkomponenten. Kalkstein dient als ein Zusatzstoff zur Schlackebildung, ebensowird Kohle (Kohlenstoff) als Reduktionsmittel verwendet. Transporte jeglicherMaterialfraktionen sind im Datensatz berücksichtigt. Zur Herstellung vonKohlenstoffstahl und niedrig legiertem Stahl werden die folgenden Prozessschrittedurchlaufen: Rohmaterialhandhabung und Lagerung, Ofenbeschicktung mit undohne Schrottvorheizung, EAF Schrottschmelzen, ?Stahl- und Schlackenabstich,Pfannenofenbehandlung zur Qualitätssicherung, Ascheverwertung/Entsorgung undschließlich das Stranggießen. Output des Stranggießens ist Bramme aus Stahl. Diesewird anschließend weiterverarbeitet zu Stahlstäben mit Hilfe eines Ziehvorgangs. DerVerbund des Bewehrungsstahls mit dem umgebenden Beton bestimmt maßgeblichdie Qualität von Stahlbeton. Zur Verbesserung des Verbundes ist derBewehrungsstahl gerippt.
Modellierung und Validierung
EPD
Datenquellen und Repräsentativität
GaBi4 Software und DatenbankDatenquellen(Quelle)
Art des Datensatzes
TechnischeBeschreibunginklusive derHintergrundsysteme
Erläuterungen zurzeitlichenRepräsentativität
Referenzfluss (Nameund Einheit)
Eigner des Datensatzes(Kontaktdatensatz)Urheberrecht?
GliederungProduktgruppe
Anwendungshinweisfür Datensatz
Menge
Referenzfluss(Flussdatensatz)
TechnischesAnwendungsgebiet
BasisnameName
Referenzjahr
GeographischeRepräsentativität
Seite 1 von 2Datensatz: 4.1.2 Bewehrungsstahl (de)
01.02.2010file://D:\CSD\DGNB\Zertifizierungunterlagen_Unterlagen\Büro_Neubau\Unterlagen ...

Validierung
PE INTERNATIONAL
PE INTERNATIONAL
Administrative Information
Dateneingabe
2008-11-05 15:05:31 +01:00
Kennung
6d8326e8-478d-4650-80d4-0a050a238b75
PE INTERNATIONAL
Umweltindikatoren
Indikatoren der Sachbilanz
Indikator Richtung Wert Einheit Anteile
InputsPrimärenergie nicht regenerierbar Input 11,3 MJ
- Braunkohle 15 %
- Steinkohle 36 %
- Erdgas 20 %
- Erdöl 5 %
- Uran 23 %
Primärenergie regenerierbar Input 0,896 MJ
- Wasserkraft 38 %
- Windkraft 18 %
- Sonnennutzung (Solarenergie) 44 %
- Sonnennutzung (Biomasse) 0 %
Sekundärbrennstoffe Input 0 MJ
Wassernutzung Input 4,78 kg
OutputsAbraum und Erzaufbereitungsrückstände Output 3,33 kg
Hausmüll und Gewerbeabfälle Output 0,0357 kg
Sonderabfälle Output 0,00499 kg
Indikatoren der Wirkbilanz
Indikator Wert EinheitAbiotischer Ressourcenverbrauch (ADP) Input 0,00416 kg Sb-Äqv.
Eutrophierungspotential (EP) Output 0,000126 kg Phosphat-Äqv.
Ozonabbaupotential (ODP) Output 7,14E-8 kg R11-Äqv.
Treibhauspotential (GWP 100) Output 0,795 kg CO2-Äqv.
Versauerungspotential (AP) Output 0,00149 kg SO2-Äqv.
Photochem. Oxidantienbildungspot. (POCP) Output 0,000249 kg Ethen-Äqv.
Eigner desDatensatzes(Kontaktdatensatz)
UUID desDatensatzes
Zeitpunkt derDateneingabe
Reviewer (Nameund Institution)(Kontaktdatensatz)
Internal reviewArt des Reviews
Seite 2 von 2Datensatz: 4.1.2 Bewehrungsstahl (de)
01.02.2010file://D:\CSD\DGNB\Zertifizierungunterlagen_Unterlagen\Büro_Neubau\Unterlagen ...

D:\002_CSD_Projekte\1_Berlin\BN00100_Cobiax\100_LCA_Bewertung\Übersetzungen\Bericht _Cobiaxbewertung_English.doc
ELECTRICITY-MIX, GERMANY
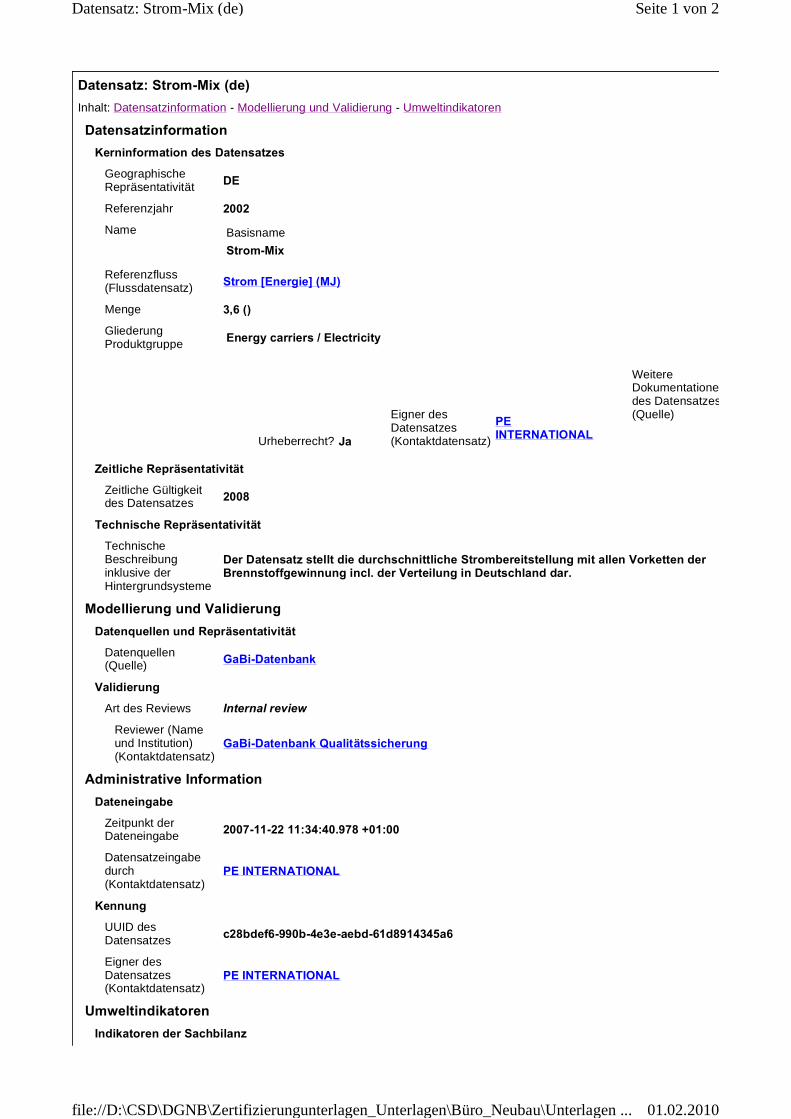
Datensatz: Strom-Mix (de)
Inhalt: Datensatzinformation - Modellierung und Validierung - Umweltindikatoren
Datensatzinformation
Kerninformation des Datensatzes
DE
2002
Strom-Mix
Strom [Energie] (MJ)
3,6 ()
Energy carriers / Electricity
Ja
PEINTERNATIONAL
Zeitliche Repräsentativität
2008
Technische Repräsentativität
Der Datensatz stellt die durchschnittliche Strombereitstellung mit allen Vorketten derBrennstoffgewinnung incl. der Verteilung in Deutschland dar.
Modellierung und Validierung
Datenquellen und Repräsentativität
GaBi-Datenbank
Validierung
GaBi-Datenbank Qualitätssicherung
Administrative Information
Dateneingabe
2007-11-22 11:34:40.978 +01:00
PE INTERNATIONAL
Kennung
c28bdef6-990b-4e3e-aebd-61d8914345a6
PE INTERNATIONAL
Umweltindikatoren
Indikatoren der Sachbilanz
Eigner desDatensatzes(Kontaktdatensatz)
UUID desDatensatzes
Datensatzeingabedurch(Kontaktdatensatz)
Zeitpunkt derDateneingabe
Reviewer (Nameund Institution)(Kontaktdatensatz)
Internal reviewArt des Reviews
Datenquellen(Quelle)
TechnischeBeschreibunginklusive derHintergrundsysteme
Zeitliche Gültigkeitdes Datensatzes
WeitereDokumentationendes Datensatzes(Quelle)Eigner des
Datensatzes(Kontaktdatensatz)Urheberrecht?
GliederungProduktgruppe
Menge
Referenzfluss(Flussdatensatz)
BasisnameName
Referenzjahr
GeographischeRepräsentativität
Seite 1 von 2Datensatz: Strom-Mix (de)
01.02.2010file://D:\CSD\DGNB\Zertifizierungunterlagen_Unterlagen\Büro_Neubau\Unterlagen ...

Indikator Richtung Wert Einheit
InputsSumme Primärenergie nicht regenerierbar Input 11,05 MJ
- Braunkohle
- Steinkohle
- Erdgas
- Erdöl
- Uran
Summe Primärenergie regenerierbar Input 0,555 MJ
- Wasserkraft
- Windkraft
- Sonnennutzung (Solarenergie)
- Sonnennutzung (Biomasse)
Summe Sekundärbrennstoffe Input 0 MJ
Wassernutzung Input 7,41 kg
OutputsAbraum und Erzaufbereitungsrückstände Output 3,87 kg
Hausmüll und Gewerbeabfälle Output 0 kg
Sonderabfälle Output 0,00156 kg
Indikatoren der Wirkbilanz
Indikator Wert EinheitAbiotischer Ressourcenverbrauch 0,00321 kg Sb-Äquivalente
Treibhauspotential 0,708 kg CO2-Äquivalente
Ozonabbaupotential 1,17E-7 kg R11-Äquivalente
Versauerungspotential 0,00121 kg SO2-Äquivalente
Eutrophierungspotential 9,28E-5 kg PO4-Äquivalente
Bodennahe Ozonbildung 8,18E-5 kg C2H4-Äquivalente
Seite 2 von 2Datensatz: Strom-Mix (de)
01.02.2010file://D:\CSD\DGNB\Zertifizierungunterlagen_Unterlagen\Büro_Neubau\Unterlagen ...
D:\002_CSD_Projekte\1_Berlin\BN00100_Cobiax\100_LCA_Bewertung\Übersetzungen\Bericht _Cobiaxbewertung_English.doc
TRANSPORT - LORRY

Datensatz: LKW (de)
Inhalt: Datensatzinformation - Modellierung und Validierung - Umweltindikatoren
Datensatzinformation
Kerninformation des Datensatzes
DE
2005
LKW
Transport [Sonstige] (kg*km)
1000,0 ()
Transport services / Road
Ja
PEINTERNATIONAL
Zeitliche Repräsentativität
2010
Technische Repräsentativität
Der Datensatz bezieht sich auf den Transport von 1000 kg Transportgut über eine Distanz von 1 kmmittels LKW (EURO 3) mit 22 t Gesamtgewicht und 17,3 t Nutzlast im Speditionsverkehr mit 85%Auslastung. Die Gewinnung und Aufbereitung des Treibstoffes ist einbezogen. Die Herstellung desFahrzeugs ist nicht in der Bilanz enthalten.
Modellierung und Validierung
Datenquellen und Repräsentativität
GaBi-Datenbank
Validierung
GaBi-Datenbank Qualitätssicherung
Administrative Information
Dateneingabe
2008-05-15 16:54:56.258 +02:00
PE INTERNATIONAL
Kennung
cd81643f-0c48-4a50-91ea-614f799e929e
PE INTERNATIONAL
Umweltindikatoren
Indikatoren der Sachbilanz
Eigner desDatensatzes(Kontaktdatensatz)
UUID desDatensatzes
Datensatzeingabedurch(Kontaktdatensatz)
Zeitpunkt derDateneingabe
Reviewer (Nameund Institution)(Kontaktdatensatz)
Internal reviewArt des Reviews
Datenquellen(Quelle)
TechnischeBeschreibunginklusive derHintergrundsysteme
Zeitliche Gültigkeitdes Datensatzes
WeitereDokumentationendes Datensatzes(Quelle)Eigner des
Datensatzes(Kontaktdatensatz)Urheberrecht?
GliederungProduktgruppe
Menge
Referenzfluss(Flussdatensatz)
BasisnameName
Referenzjahr
GeographischeRepräsentativität
Seite 1 von 2Datensatz: LKW (de)
01.02.2010file://D:\CSD\DGNB\Zertifizierungunterlagen_Unterlagen\Büro_Neubau\Unterlagen ...

Indikator Richtung Wert Einheit
InputsSumme Primärenergie nicht regenerierbar Input 0,94 MJ
- Braunkohle
- Steinkohle
- Erdgas
- Erdöl
- Uran
Summe Primärenergie regenerierbar Input 0,0012 MJ
- Wasserkraft
- Windkraft
- Sonnennutzung (Solarenergie)
- Sonnennutzung (Biomasse)
Summe Sekundärbrennstoffe Input 0 MJ
Wassernutzung Input 0,0176 kg
OutputsAbraum und Erzaufbereitungsrückstände Output 0,00232 kg
Hausmüll und Gewerbeabfälle Output 0 kg
Sonderabfälle Output 1,6600000000000001E-6 kg
Indikatoren der Wirkbilanz
Indikator Wert EinheitAbiotischer Ressourcenverbrauch 4,5E-4 kg Sb-Äquivalente
Treibhauspotential 0,0662 kg CO2-Äquivalente
Ozonabbaupotential 1,24E-10 kg R11-Äquivalente
Versauerungspotential 3,98E-4 kg SO2-Äquivalente
Eutrophierungspotential 6,93E-5 kg PO4-Äquivalente
Bodennahe Ozonbildung 3,42E-5 kg C2H4-Äquivalente
Seite 2 von 2Datensatz: LKW (de)
01.02.2010file://D:\CSD\DGNB\Zertifizierungunterlagen_Unterlagen\Büro_Neubau\Unterlagen ...

D:\002_CSD_Projekte\1_Berlin\BN00100_Cobiax\100_LCA_Bewertung\Übersetzungen\Bericht _Cobiaxbewertung_English.doc
RUBBLE PROCESSING

Startseite > Baustoff- und Gebäudedaten > Ökobau.dat > Sonstiges > 9.5 Abfallaufbereitung und-entsorgung > 9.5.1-Bauschuttaufbereitung
Sonstiges
Datensatz: Bauschutt Aufbereitung (de)
Inhalt: Datensatzinformation - Modellierung und Validierung - Umweltindikatoren
Datensatzinformation
Kerninformation des Datensatzes
DE
2006
Bauschutt Aufbereitung
Bauschutt-Rezyklat [Sonstige Bauprozesse] (kg)
1.0
End-of-life treatment / Material recycling
Ja
PEINTERNATIONAL
Zeitliche Repräsentativität
2010
Geographische Repräsentativität
Technische Repräsentativität
Der Datensatz beschreibt die durchschnittliche Aufbereitung von 1,03 kg Bauschutt zu 1 kgBauschuttrezyklat in stationären und mobilen Anlagen. Es erfolgt eine Energiegutschrift durch diethermische Verwertung von einzelnen Abfallfraktionen (u. a. Kunststoffen).
Modellierung und Validierung
Angewandte Methode und Allokation
Datenquellen und Repräsentativität
GaBi-Datenbank
Validierung
Internal reviewReviewer(s) belong(s) to organisation(s) or legally linked organisation(s), that collected, modelled, entered, payed for, or own(s) the data or own(s) oroperate(s) the processes of the foreground system or relevant processes inbackground system.
GaBi-Datenbank Qualitätssicherung
Umweltindikatoren
Indikatoren der Sachbilanz
Indikator Richtung Wert Einheit
Inputs
Summe Primärenergie nicht regenerierbar Input 0.04751 MJ
- Braunkohle
Reviewer (Nameund Institution)(Kontaktdatensatz)
Art des Reviews
Datenquellen(Quelle)
TechnischeBeschreibunginklusive derHintergrundsysteme
Zeitliche Gültigkeitdes Datensatzes
WeitereDokumentationendes Datensatzes(Quelle)Eigner des
Datensatzes(Kontaktdatensatz)Urheberrecht?
/ Ebene 2Ebene 1GliederungProduktgruppe
Menge
Referenzfluss(Flussdatensatz)
Name
Referenzjahr
GeographischeRepräsentativität
Seite 1 von 2Informationsportal Nachhaltiges Bauen: Baustoff- und Gebäudedaten - Ökobau.dat...
01.02.2010http://www.nachhaltigesbauen.de/baustoff-und-gebaeudedaten/oekobaudat/sonstiges/9...

- Steinkohle
- Erdgas
- Erdöl
- Uran
Summe Primärenergie regenerierbar Input -0.00162 MJ
- Wasserkraft
- Windkraft
- Sonnennutzung (Solarenergie)
- Sonnennutzung (Biomasse)
Summe Sekundärbrennstoffe Input 0.0 MJ
Wassernutzung Input 0.02739 kg
Outputs
Abraum und Erzaufbereitungsrückstände Output -0.0104 kg
Hausmüll und Gewerbeabfälle Output4.7061E-
7kg
Sonderabfälle Output 0.00303 kg
Indikatoren der Wirkbilanz
Indikator Wert Einheit
Abiotischer Ressourcenverbrauch 2.9563E-5kg Sb-Ä
Treibhauspotential 0.0348 kg CO2-
Ozonabbaupotential-3.7671E-
10kg R11-
Versauerungspotential 6.8088E-5kg SO2-
Eutrophierungspotential 9.544E-5kg PO4-
Bodennahe Ozonbildung 5.0658E-6kg C2H4Äquivalente
© Informationsportal Nachhaltiges Bauen des BMVBS
Seite 2 von 2Informationsportal Nachhaltiges Bauen: Baustoff- und Gebäudedaten - Ökobau.dat...
01.02.2010http://www.nachhaltigesbauen.de/baustoff-und-gebaeudedaten/oekobaudat/sonstiges/9...

D:\002_CSD_Projekte\1_Berlin\BN00100_Cobiax\100_LCA_Bewertung\Übersetzungen\Bericht _Cobiaxbewertung_English.doc
END OF LIVE POLYPROPYLEN

Datensatz: End of life - Polypropylen-Rohr (PP) (de)
Inhalt: Datensatzinformation - Modellierung und Validierung - Umweltindikatoren
Datensatzinformation
Kerninformation des Datensatzes
DE
2008
End of life - Polypropylen-Rohr (PP)
Datensatz wird zur Verwertung von ausgedienter Haustechnick verwendet.
Haustechnik zur Verwertung
1 kg (Masse)
Für jeden Herstellungsdatensatz wurde ein korrespondierender #End-of-Life#Datensatz modelliert. In Abhängigkeit der Funktionellen Einheit desHerstellungsdatensatzes ist auch der Input-Fluss bzw. die funktionelle Einheit desEnd-of-life (EoL) Datensatzes skaliert. Hat der korrespondierendeHerstellungsdatensatz die funktionelle Einheit #Herstellung von einem KilogrammProdukt# mit einer bestimmten Materialzusammensetzung, so ist der Input des EoL-Datensatzes ebenfalls auf ein Kilogramm des entsprechenden Produktes skaliert.Die sich aus der Materialzusammensetzung des Herstellungsdatensatz ergebendenMenge an Metall, Kunstsoffen, inerten Materialien und Sonstigem wird denentsprechenden Verwertungs- und Entsorgungsprozessen zugeführt.
Verwertung / 8. Gebäudetechnik / 8.1 Heizung / 8.1.2 Wärmeverteilung undWärmeabgabe / Rohre
JaPEINTERNATIONAL
Quantitative Referenz
Haustechnik zur Verwertung [Produktionsrückstände im Lebensfluss] - [Abfälle zurVerwertung] - kg (Masse)
Zeitliche Repräsentativität
Technische Repräsentativität
Es wurde davon ausgegangen, dass große Geräte wie Heizkessel, Klima- undLüftungsanlagen oder Fahrstühle zu 95% einem Recycling zugeführt werden. FürRohre oder Kabel, die oft unterputzt sind wurde eine Recyclingrate von 90%angenommen. Die Recyclingquoten beziehen sich ausschließlich auf Metalle undKunststoffe. Für mineralische Materialien wie Mineralwolle, Beton oder Keramikwurde eine Ablagerung auf einer Inertstoffdeponie angenommen. Es wurdeangenommen das der Anteil an Metallen und Kunststoffen, der nicht einem Recyclingzugeführt wird (5-10%) ebenfalls auf einer Inertstoffdeponie entsorgt wird (z.B.Kabelreste oder Rohrstücke im Bauschutt). Für die Kunststoffe wird davonausgegangen, dass aufgrund der oft langen Lebensdauer und den verbundenenVerunreinigung nicht von einer stofflichen Verwertung ausgegangen werden kannund daher die Kunststoffe einer energetischen Verwertung inMüllverbrennungsanlagen (MVA) zugeführt werden. Für die Müllverbrennung wurdeein MVA-Modell mit durchschnittlichen europäischen Emissionswerten undEnergieproduktion verwendet. In Abhängigkeit des zu verbrennenden Kunststoffeswurden unterschiedliche Prozesse mit den entsprechendenElementarzusammensetzungen verwendet. Die Datensätze wurden inZusammenarbeit mit der Confederation of European Waste-to-Energy Plants(CEWEP) erstellt und sind auf der Homepage der European Platform on LCA [EC2008] verfügbar. Der aus der Kunststoffverbrennung erzeugte Strom sowie dieerzeugte thermische Energie wurden mit dem europäischen Strom-bzw. Wärmemixgutgeschrieben. Die Gutschriften für das Recycling von Metallen oder derenergetischen Verwertung von Kunststoffen, sowie die mit der Verwertungverbundenen Emissionen und Ressourcenverbräuche (Energie für Einschmelzen,Verbrennungsemissionen, Deponie) sind in den Datensätzen enthalten. Bei
TechnischeBeschreibunginklusive derHintergrundsysteme
Referenzfluss(Name und Einheit)
Eigner des Datensatzes(Kontaktdatensatz)Urheberrecht?
GliederungProduktgruppe
Anwendungshinweisfür Datensatz
Menge
Referenzfluss(Flussdatensatz)
TechnischesAnwendungsgebiet
BasisnameName
Referenzjahr
GeographischeRepräsentativität
Seite 1 von 3Datensatz: End of life - Polypropylen-Rohr (PP) (de)
01.02.2010file://D:\CSD\DGNB\Zertifizierungunterlagen_Unterlagen\Büro_Neubau\Unterlagen ...

Materialen aus Eisen (Stahlbleche, Rohre, Grauguss) werden bei der Herstellung derMaterialien bereits unterschiedliche Mengen an Stahlschrott eingesetzt. DieseMengen wurden der recycelten Stahlmenge vor Zuführung in die Einschmelzungabgezogen, um keine Überwertung der Gutschriften zu erzeugen. Die Gutschriftwurde dann entsprechend mit primärem Stahl durchgeführt. Gutschriften für dasRecycling von seltenen Erden oder Quecksilberemissionen aus Leuchtstofflampenkonnten wegen fehlenden Daten nicht berücksichtigt werden. Als Transportdistanzzwischen Gebäude und Recyclinghof bzw. Deponie oder Müllverbrennungsanlagewurden 50 km mit dem Lkw angenommen, für die Zuführung zum Stahl-, Kupfer- oderAluminiumwerk wurde eine Distanz von 200 km mit dem Zug angenommen.
Modellierung und Validierung
EPD
Datenquellen und Repräsentativität
GABI 2006
Validierung
PE INTERNATIONAL
Administrative Information
Dateneingabe
2008-11-06 14:42:08 +01:00
Kennung
ea609dc8-11ce-4ad5-ab83-73e927b4640d
PE INTERNATIONAL
Umweltindikatoren
Indikatoren der Sachbilanz
Indikator Richtung Wert Einheit Anteile
InputsPrimärenergie nicht regenerierbar Input -28 MJ
- Braunkohle 10 %
- Steinkohle 30 %
- Erdgas 35 %
- Erdöl 3 %
- Uran 23 %
Primärenergie regenerierbar Input -1,3 MJ
- Wasserkraft 29 %
- Windkraft 6 %
- Sonnennutzung (Solarenergie) 65 %
- Sonnennutzung (Biomasse) 0 %
Sekundärbrennstoffe Input 9,55E-7 MJ
Wassernutzung Input 3,31 kg
OutputsAbraum und Erzaufbereitungsrückstände Output -3,3 kg
Hausmüll und Gewerbeabfälle Output 5,78E-6 kg
Sonderabfälle Output 0,002 kg
Indikatoren der Wirkbilanz
Indikator Wert EinheitAbiotischer Ressourcenverbrauch (ADP) Input 0,01 kg Sb-Äqv.
Eutrophierungspotential (EP) Output 0,0005 kg Phosphat-Äqv.
Ozonabbaupotential (ODP) Output -0,19999999999999995E-
kg R11-Äqv.
Eigner desDatensatzes(Kontaktdatensatz)
UUID desDatensatzes
Zeitpunkt derDateneingabe
Reviewer (Nameund Institution)(Kontaktdatensatz)
Internal reviewArt des Reviews
Datenquellen(Quelle)
Art des Datensatzes
Seite 2 von 3Datensatz: End of life - Polypropylen-Rohr (PP) (de)
01.02.2010file://D:\CSD\DGNB\Zertifizierungunterlagen_Unterlagen\Büro_Neubau\Unterlagen ...

7
Treibhauspotential (GWP 100) Output 0,988 kg CO2-Äqv.
Versauerungspotential (AP) Output 0,01 kg SO2-Äqv.
Photochem. Oxidantienbildungspot. (POCP) Output 0,0006 kg Ethen-Äqv.
Seite 3 von 3Datensatz: End of life - Polypropylen-Rohr (PP) (de)
01.02.2010file://D:\CSD\DGNB\Zertifizierungunterlagen_Unterlagen\Büro_Neubau\Unterlagen ...