Coastal Vulnerability Assessment of Olympic National Park ... · results of a vulnerability...
22
USGS Woods Hole Science Center Coastal and Marine Program Coastal Vulnerability Assessment of Olympic National Park to Sea-Level Rise Elizabeth A. Pendleton, Erika S. Hammar-Klose, E. Robert Thieler, S. Jeffress Williams U.S. Geological Survey Open-File Report 04-1021, Electronic Book 2004 For Additional Information: See the National Park Unit Coastal Vulnerability study at http://woodshole.er.usgs.gov/project- pages/nps-cvi/ , the National Coastal Vulnerability study at http://woodshole.er.usgs.gov/project-pages/cvi /, or view the USGS online fact sheet for this project in PDF format at http://pubs.usgs.gov/fs/fs095- 02/ . To visit Olympic National Park go to http://www.nps.gov/olym/index.htm . Contact: Elizabeth A. Pendleton, Erika S. Hammar-Klose, E. Robert Thieler, and S. Jeffress Williams U.S. Geological Survey 384 Woods Hole Road Woods Hole, MA 02543 E-mail: [email protected] , [email protected] , [email protected] , [email protected] , Telephone: 508-457-2259 or 508-548-8700 Rebecca Beavers National Park Service Natural Resource Program Center Geologic Resources Division P.O. Box 25287 Denver, CO 80225-0287
Transcript of Coastal Vulnerability Assessment of Olympic National Park ... · results of a vulnerability...

USGS Woods Hole Science Center Coastal and Marine Program
Coastal Vulnerability Assessment of Olympic National Park to Sea-Level Rise
Elizabeth A. Pendleton, Erika S. Hammar-Klose, E. Robert Thieler, S.
Jeffress Williams
U.S. Geological Survey Open-File Report 04-1021, Electronic Book
2004
For Additional Information:
See the National Park Unit Coastal Vulnerability study at http://woodshole.er.usgs.gov/project-
pages/nps-cvi/,
the National Coastal Vulnerability study at http://woodshole.er.usgs.gov/project-pages/cvi/,
or view the USGS online fact sheet for this project in PDF format at http://pubs.usgs.gov/fs/fs095-
02/.
To visit Olympic National Park go to http://www.nps.gov/olym/index.htm.
Contact:
Elizabeth A. Pendleton, Erika S. Hammar-Klose, E. Robert Thieler, and S. Jeffress Williams
U.S. Geological Survey
384 Woods Hole Road
Woods Hole, MA 02543
E-mail: [email protected], [email protected], [email protected], [email protected],
Telephone: 508-457-2259 or 508-548-8700
Rebecca Beavers
National Park Service
Natural Resource Program Center
Geologic Resources Division
P.O. Box 25287
Denver, CO 80225-0287

E-mail: [email protected]
Telephone: 303-987-6945
ABSTRACT
A coastal vulnerability index (CVI) was used to map the relative vulnerability of the
coast to future sea-level rise within Olympic National Park (OLYM), Washington. The
CVI scores the following in terms of their physical contribution to sea-level rise-
related coastal change: geomorphology, regional coastal slope, rate of relative sea-
level rise, shoreline change rates, mean tidal range and mean wave height. The
rankings for each variable were combined and an index value calculated for 1-minute
grid cells covering the park. The CVI highlights those regions where the physical
effects of sea-level rise might be the greatest. This approach combines the coastal
system's susceptibility to change with its natural ability to adapt to changing
environmental conditions, yielding a quantitative, although relative, measure of the
park's natural vulnerability to the effects of sea-level rise. The CVI provides an
objective technique for evaluation and long-term planning by scientists and park
managers. The Olympic National Park coast consists of rocky headlands, pocket
beaches, glacial-fluvial features, and sand and gravel beaches. The Olympic
coastline that is most vulnerable to sea-level rise are beaches in gently sloping areas.
INTRODUCTION
The National Park Service (NPS) is responsible for managing nearly 12,000 km
(7,500 miles) of shoreline along oceans and lakes. In 2001, the U.S. Geological
Survey (USGS), in partnership with the NPS Geologic Resources Division, began
conducting hazard assessments of future sea-level change by creating maps to
assist NPS in managing its valuable coastal resources. This report presents the
results of a vulnerability assessment for Olympic National Park (OLYM), highlighting
areas that are likely to be most affected by future sea-level rise.
Global sea level has risen approximately 18 centimeters (7.1 inches) in the past
2

century (Douglas, 1997). Climate models predict an additional rise of 48 cm (18.9 in.)
by 2100 (IPCC, 2002), which is more than double the rate of rise for the 20th century.
Potential coastal impacts of sea-level rise include shoreline erosion, saltwater
intrusion into groundwater aquifers, inundation of wetlands and estuaries, and threats
to cultural and historic resources as well as infrastructure. Predicted accelerated
global sea-level rise has generated a need in coastal geology to determine the
response of a coastline to sea-level rise. However, an accurate and quantitative
approach to predicting coastal change is difficult to establish. Even the kinds of data
necessary to make shoreline response predictions are the subject of scientific
debate. A number of predictive approaches have been proposed (National Research
Council, 1990), including: 1) extrapolation of historical data (e.g., coastal erosion
rates), 2) static inundation modeling, 3) application of a simple geometric model (e.g.,
the Bruun Rule), 4) application of a sediment dynamics/budget model, or 5) Monte
Carlo (probabilistic) simulation based on parameterized physical forcing variables.
However, each of these approaches has inadequacies or can be invalid for certain
applications (National Research Council, 1990). Additionally, shoreline response to
sea-level change is further complicated by human modification of the natural coast
such as beach nourishment projects, and engineered structures such as seawalls,
revetments, groins, and jetties. Understanding how a natural or modified coast will
respond to sea-level change is essential to preserving vulnerable coastal resources.
The primary challenge in predicting shoreline response to sea-level rise is quantifying
the important variables that contribute to coastal evolution in a given area. In order to
address the multi-faceted task of predicting sea-level rise impact, the USGS has
implemented a methodology to identify areas that may be most vulnerable to future
sea-level rise (see Hammar-Klose and Thieler, 2001). In this application, different
ranges of vulnerability (low to very high) describe a coast's susceptibility to physical
change as sea level rises. This technique focuses on six variables which strongly
influence coastal evolution:
1) Geomorphology
2) Histroical shoreline change rate
3) Regional coastal slope
3

4) Relative sea-level change
5) Mean significant wave height
6) Mean tidal range
These variables can be divided into two groups: 1) geologic variables and 2) physical
process variables. The geologic variables are geomorphology, historic shoreline
change rate, and coastal slope; they account for a shoreline's relative resistance to
erosion, long-term erosion/accretion trend, and its susceptibility to flooding,
respectively. The physical process variables include significant wave height, tidal
range, and sea-level change, all of which contribute to the inundation hazards of a
particular section of coastline over time scales from hours to centuries. A relatively
simple vulnerability ranking system (Table 1) allows the six variables to be
incorporated into an equation that produces a coastal vulnerability index (CVI). The
CVI can be used by scientists and park managers to evaluate the likelihood that
physical change may occur along a shoreline as sea level continues to rise.
Additionally, NPS staff will be able to incorporate information provided by this
vulnerability assessment technique into general management plans.
DATA RANKING
Table 1 shows the six variables described in the Introduction, which include both
quantitative and qualitative information. Actual variable values are assigned a
vulnerability ranking based on value ranges, whereas the non-numerical
geomorphology variable is ranked qualitatively according to the relative resistance of
a given landform to erosion. Shorelines with erosion/accretion rates between -1.0
and +1.0 m/yr are ranked as moderately vulnerable with increasingly higher rates of
erosion or accretion given correspondingly higher or lower vulnerability rankings.
Regional coastal slopes range from very high vulnerability, <4.56 percent to very low
vulnerability at values > 14.7 percent. The rate of relative sea-level change is ranked
using the modern rate of eustatic rise (1.8 mm/yr) as very low vulnerability. Since
this is a global or "background" rate common to all shorelines, the sea-level rise
ranking reflects primarily local to regional isostatic or tectonic adjustment. Mean
4

wave height rankings range from very low (<1.1 m) to very high (>2.6 m). Tidal
range is ranked such that microtidal (<1 m) coasts have very high vulnerability and
macrotidal (>6 m) coasts have very low vulnerability.
OLYMPIC NATIONAL PARK
The rugged landscape of Olympic National Park (Figure 1) is a result of the
subduction of the Juan de Fuca oceanic plate below the North American plate
beginning about 35 million years ago. The mountains within Olympic National Park
are geologically very young, and as a consequence the surrounding landscape is
young and varies widely in morphology. Large ice sheets during Pleistocene
glaciations (2 million - 13,000 years ago) further modified the geomorphology of the
park by carving deep U-shaped valleys dipping toward a sediment-starved collision
coast. The park shoreline is over 100 km (~ 65 miles) of primarily rocky and cliffed
coast with intermittent sand or gravel pocket beaches. Approximately 95% of the park
is designated as wilderness making it a very beautiful and pristine shore. Seaward of
the Olympic shoreline lies the Olympic Coast National Marine Sanctuary
administered by the National Oceanic and Atmospheric Administration.
In addition to the coastal impacts associated with predicted sea-level rise, Olympic is
also susceptible to tsunamis generated both locally and distant. The presence of the
subduction zone a few hundred miles offshore poses a constant threat to earthquake-
generated tsunamis. The Northwest Washington coast is also periodically impacted
with increased storminess, shoreline erosion, large wind driven waves, and elevated
sea levels associated with El Niño events (Komar, 1997).
METHODOLOGY
Data for each of the six variables mentioned above were gathered from state and
federal agencies to develop a database for a park-wide assessment of coastal
vulnerability (Table 2). The database is based on that used by Thieler and Hammar-
Klose (1999) and loosely follows an earlier database developed by Gornitz and White
5

(1992). A comparable assessment of the sensitivity of the Canadian coast to sea-
level rise is presented by Shaw and others (1998). The database was constructed
using a 1:70,000-scale shoreline for the Olympic Peninsula that was produced from
the medium resolution digital vector U.S. shoreline provided by the Strategic
Environmental Assessments (SEA) Division of NOAA's Office of Ocean Resources
Conservation and Assessment (ORCA)
(http://spo.nos.gov/project/shoreline/shoreline.html). Data for each of the six variables
(geomorphology, shoreline change, coastal slope, relative sea-level rise, significant
wave height, and tidal range) were added to the shoreline attribute table using a 1-
minute (approximately 1.5 km) grid (Figure 2). Next the data were assigned a relative
vulnerability value from 1-5 (1 is very low vulnerability, 5 is very high vulnerability)
based on the potential magnitude of its contribution to physical changes on the coast
as sea level rises (Table1).
GEOLOGIC VARIABLES
The geomorphology variable expresses the relative erodibility of different landform
types (Table 1). The geomorphology of the Olympic coast varies from sandy beaches
(5 - very high vulnerability) to rocky cliffs (1 - very low vulnerability) (Figure 3 - 10).
These data were derived primarily from the Washington Department of Ecology
database of shoreline aerial photos,
(http://www.ecy.wa.gov/apps/shorephotos/) and were supplemented with data from
USGS 1:250,000-scale topographic maps, the Cascadia beach - shoreline database,
Pacific Northwest region (Peterson and others, 1994), and with the book, The Pacific
Northwest Coast: Living with the shores of Oregon and Washington (Komar, 1997).
In addition, field visits were made within the park to ground-truth the geomorphologic
classification.
Historical shoreline change data for the ocean coast of Washington State were
provided by the Coastal Monitoring and Analysis Program, Washington Department
of Ecology, Olympia, Washington (R. C. Daniels, oral pers. comm., 2000). These long-
term annual erosion rates for the ocean coast are derived from NOS T-Sheets for the
years 1926 - 30 and orthophotoquads for the years 1994 - 96; rates for the bays are
6

derived from NOS T-Sheets from 1950 and orthophotoquads for the years 1994 - 96.
Shoreline-change rates for the Olympic coast all fall within 1 meter of erosion or
accretion for the 1 minute cells generated here.
The determination of regional coastal slope identifies the relative vulnerability of
inundation and the potential rapidity of shoreline retreat because low-sloping coastal
regions should retreat faster than steeper regions (Pilkey and Davis, 1987). The regionalslope of the coastal zone was calculated from a grid of topographic and bathymetric elevations extending landward and seaward of the shoreline. For Olympic National Park, elevation data were obtained from the National Geophysical Data Center (NGDC) as gridded topographic and bathymetric elevations for 90-meter grid cells. Coastal slope was calculated for a 10-km (6.2 mile) radius (landward and seaward of the barrier) and then resampled to 1-minute resolution (Figure 2). The regional coastal slope for Olympic ranged from very high vulnerability (<4.55 %) to moderate vulnerability (7.75 - 10.85 %) (Figure 11 A-C).
PHYSICAL PROCESS VARIABLES
The relative sea-level change variable is derived from the increase or decrease in
annual mean water elevation over time as measured at tide gauge stations along the
coast. The rate of sea-level rise at Neah Bay and Astoria were used for Olympic
National Park (Zervas, 2001). Water level records from Toke Point in Willapa Bay
were not used because the record is less than 50 years and the sea-level rise signal
is likely affected by events such as El Niño. The sea-level rise variable inherently
includes both global sea-level rise as well as regional sea-level rise due to isostatic
and tectonic adjustments. Relative sea-level change data are a historical record, and
thus only portray the recent sea-level trend (<150 years). The rate of relative sea-
level change within Olympic is very low (<1.8 mm/yr)
Mean significant wave height is used here as a proxy for wave energy which drives
7

the coastal sediment budget. Wave energy is directly related to the square of wave
height;
E = 1/8 ρgH2
where E is energy density, H is wave height, ρ is water density and g is acceleration
due to gravity. Thus, the ability to mobilize and transport beach material is a function
of wave height squared. In this report, we use hindcast nearshore mean significant
wave height data for the period 1976-95 obtained from the U.S. Army Corps of
Engineers Wave Information Study (WIS) (Hubertz and others, 1996). The model
wave heights were compared to historical measured wave height data obtained from
the NOAA National Data Buoy Center to ensure that model values were
representative of the study area. For Olympic National Park mean significant wave
heights range from moderate (2.0 - 2.25 m) to high vulnerability (2.25 - 2.60 m).
Tidal range is linked to both permanent and episodic inundation hazards. Tide range
data were obtained from the National Ocean Service (NOS) for two ocean tide
stations near Olympic National Park; the values were contoured along the park
shoreline and mapped to the 1-minute grid cells. All of Olympic has a tide range
between 2 and 4 meters suggesting moderate vulnerability.
THE COASTAL VULNERABILITY INDEX
The coastal vulnerability index (CVI) presented here is the same as that used in
Thieler and Hammar-Klose (1999) and is similar to that used in Gornitz and others
(1994), as well as to the sensitivity index employed by Shaw and others (1998). The
CVI allows the six variables to be related in a quantifiable manner that expresses the
relative vulnerability of the coast to physical changes due to future sea-level rise. This
method yields numerical data that cannot be equated directly with particular physical
effects. It does, however, highlight areas where the various effects of sea-level rise
may be the greatest. Once each section of coastline is assigned a vulnerability value
for each specific data variable, the coastal vulnerability index (CVI) is calculated as
the square root of the product of the ranked variables divided by the total number of
8

variables;
where, a = geomorphology, b = shoreline erosion/accretion rate, c = coastal slope, d
=relative sea-level rise rate, e = mean significant wave height, and f = mean tide
range. The calculated CVI value is divided into quartile ranges to highlight different
vulnerabilities within the park. The CVI ranges (low – very high) reported here apply
specifically to Olympic National Park, and are not comparable to CVI ranges in other
parks where the CVI has been employed (i.e. very high vulnerability means the same
among park units; it's the numeric values that differ, such that a numeric value that is
very high vulnerability in one park may be moderate vulnerability in another). To
compare vulnerability between coastal parks, the national-scale studies should be
used (Thieler and Hammar-Klose, 1999, 2000a, and 2000b). We feel this approach
best describes and highlights the vulnerability specific to each park.
RESULTS
The calculated CVI values for Olympic National Park range from 4.24 - 12.25. The
mean CVI value is 8.23; the mode is 10.95; and the median is 8.49. The standard
deviation is 1.1. The 25th, 50th, and 75th percentiles are 6.5, 8.0, and 9.5,
respectively.
Figure 12 shows a map of the coastal vulnerability index for the Olympic National
Park. The CVI scores are divided into low, moderate, high, and very high-vulnerability
categories based on the quartile ranges and visual inspection of the data. CVI values
below 6.5 are assigned to the low vulnerability category. Values from 6.5 - 8.0 are
considered moderate vulnerability. High-vulnerability values lie between 8.01 and 9.5.
CVI values above 9.5 are classified as very high vulnerability. Figure 13 shows a
histogram of the percentage of Olympic National Park shoreline in each vulnerability
category. A total of 55 km (32 miles) of shoreline is evaluated along the national
9
seashore. Of this total, 30 percent of the mapped shoreline is classified as being at
very high vulnerability due to future sea-level rise. Twenty-four percent is classified
as high vulnerability, 22 percent as moderate vulnerability, and 24 percent as low
vulnerability.
DISCUSSION
The data within the coastal vulnerability index (CVI) show variability at several spatial
scales. However, the physical process variables maintain the most consistency over
the extent of the park. The vulnerability of relative sea-level rise is very low over the
length of the shoreline. The wave data are essentially high for the entire park except
for two embayments south of Rialto Beach where wave heights are moderate
because headlands provide a measure of protection from the dominant northwesterly
winds. Tidal range vulnerability is moderate throughout the park.
The geologic variables show the most variability and thus have the most influence on
the relative coastal vulnerability. Geomorphology in the park includes very low
vulnerability rocky cliffs, very high vulnerability sandy beaches, as well as
intermediate vulnerability landform types. Shoreline position within the park is stable
with all erosion/accretions rates falling between -1-+1 meter per year making the
entire Olympic shoreline moderately vulnerable with respect to shoreline change.
Regional coastal slope varies from moderate vulnerability in small areas in the
southern portion of the park to high vulnerability near Shi Shi Beach and Ruby Beach
to very high vulnerability in the central portion of the park from north of Ozette Lake to
south of Rialto Beach (Figure 12). The single most influential variable in the CVI is
geomorphology; therefore it can be considered the dominant factor controlling how
the Olympic shoreline will evolve as sea level rises. The geomorphology variable
controls CVI changes on small spatial scales (~ 5 km). However, variability within the
coastal slope and significant wave height variables provide a larger-scale control (25-
30 km) on the CVI value. This results in an overall higher vulnerability shoreline
within the central and northern portion of the park.
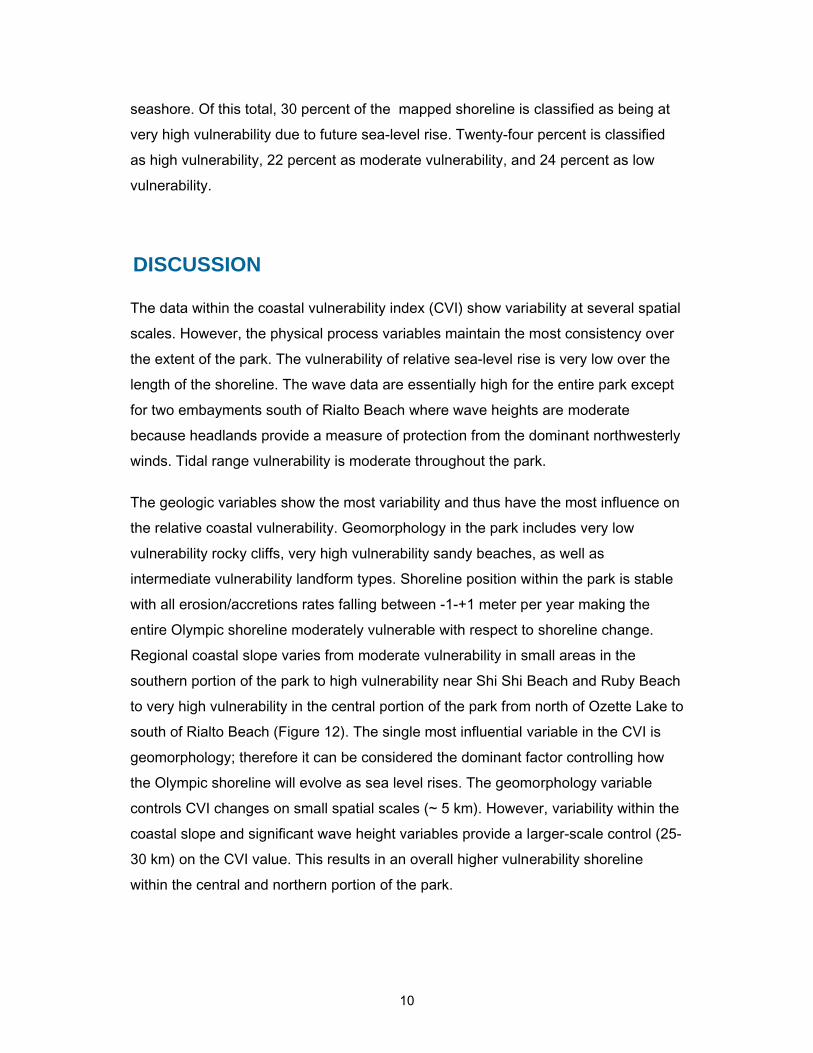
10

Some park resources could be threatened with the likelihood of accelerated sea-level
rise. A few examples of cultural resources that could be impacted within Olympic
National Park include petroglyphs carved into rocks along the shore, shell middens,
and Kalaloch Lodge (Figure 14). With the exception of the petroglyphs, the cultural
resources mentioned here are located within regions that have been classified as
very high vulnerability.
CONCLUSIONS
The coastal vulnerability index (CVI) provides insight into the relative potential of
coastal change due to future sea-level rise. The maps and data presented here can
be viewed in at least two ways:
1) to show where physical changes are most likely to occur as sea-level rises; and
2) as a planning tool for Olympic National Park.
As ranked in this study, geomorphology is the most important variable in determining
the CVI for Olympic. However, regional coastal slope and significant wave height
produce regional scale variations in the coastal vulnerability index. Olympic National
Park preserves a dynamic natural environment that must be understood in order to
be managed properly. The CVI is one way that a park can assess objectively the
natural factors that contribute to the evolution of the coastal zone, and thus how the
park may evolve in the future.
11

REFERENCES
Douglas, B.C., 1997, Global sea rise, a redetermination: Surveys in Geophysics, v.
18, p. 279-292.
Gornitz, V. and White, T.W., 1992, A coastal hazards database for the U.S. West
Coast; ORNL/CDIAC-81, NDP-043C: Oak Ridge National Laboratory, Oak Ridge,
Tennessee.
Gornitz, V.M., Daniels, R.C., White, T.W., and Birdwell, K.R., 1994, The
development of a coastal vulnerability assessment database; vulnerability to sea-
level rise in the U.S. southeast: Journal of Coastal Research, Special Issue No. 12,
p. 327-338.
Hammar-Klose, E.S., and Thieler, E.R., 2001, Coastal vulnerability to sea-level rise;
a preliminary database for the U.S. Atlantic, Pacific, and Gulf of Mexico coasts: U.S.
Geological Survey, Digital Data Series, DDS-68, 1 CD.
Hubertz, J.M., Thompson, E.F., and Wang, H.V., 1996, Wave information studies of
U.S. coastlines: Annotated bibliography on coastal and ocean data assimilation,
U.S. Army Engineer Waterways Experiment Station, WIS Report 36, Vicksburg, 31
p.
IPCC, 2002, Climate change 2001, the scientific basis: Contribution of Working
Group I to the Third Assessment Report of the Intergovernmental Panel on Climate
Change, IPCC, , Geneva, Switzerland, 563 p. (Also available on the web at
www.ipcc.ch)
Komar, P., 1997, The Pacific northwest coast: Living with the Shores of Oregon and
Washington, Durham, Duke University Press, 196 p.
National Research Council, 1990, Managing coastal erosion, Washington: National
Academy Press, 163 p.
12

National Research Council, 1995, Beach nourishment and protection: Washington:
National Academy Press, 334 p.
Peterson, C.D., Darienzo, M.E., Hamilton, D., Pettit, D., Yeager, R.K., Jackson, P.L.,
Rosenfeld, C.L., and Terich, T.T., 1994, Cascadia beach-shoreline database, Pacific
northwest region, USA: State of Oregon, Department of Geology and Mineral
Industries, Open-File Report 0-94-2.
Pilkey, O.H., and Davis, T.W., 1987, An analysis of coastal recession models, North
Carolina coast, in Nummedal, D., Pilkey, D.H., and Howard, J.D., eds., Sea-level
Fluctuation and Coastal Evolution: SEPM (Society for Sedimentary Geology) Special
Publications No. 41, Tulsa, Oklahoma, p. 59-68.
Shaw, J., Taylor, R.B., Forbes, D.L., Ruz, M.H., and Solomon, S., 1998, Sensitivity
of the Canadian coast to sea-level rise: Geological Survey of Canada Bulletin 505,
114 p.
Thieler, E.R., and Hammar-Klose, E.S., 1999, National assessment of coastal
vulnerability to sea-level rise, U.S. Atlantic coast: U.S. Geological Survey, Open-File
Report 99-593, 1 sheet. Online
Thieler, E.R., and Hammar-Klose, E.S., 2000a, National assessment of coastal
vulnerability to sea-level rise, U.S. Pacific coast: U.S. Geological Survey, Open-File
Report 00-178, 1 sheet. Online
Thieler, E.R., and Hammar-Klose, E.S., 2000b, National assessment of coastal
vulnerability to sea-level rise, U.S. Gulf of Mexico coast: U.S. Geological Survey,
Open-File Report 00-179, 1 sheet. Online
Zervas, C., 2001, Sea level variations of the United States 1854-1999: NOAA Technical Report NOS CO-OPS 36, 201 p.
13

Figure 1. Location of Olympic National Park in Northwest Washington.
15

Figure 2. Shoreline grid for Olympic National Park.
16

Figure 3: Shi Shi Beach in the north end of the park is classified as very high vulnerability. Washington Dept. of Ecology Photo. Figure 4: Area north of Rialto Beach where geomorphology transitions from moderate to low vulnerability. Washington Dept. of Ecology Photo. Figure 5: Hoh Head north of Hoh Indian Reservation is a rocky cliff at very low vulnerability. Washington Dept. of Ecology Photo. Figure 6: Ruby Beach near Kalaloch is a gravel beach and considered high vulnerability. Washington Dept. of Ecology Photo. Figure 7: Shore parallel oblique view showing the diverse geomorphology, including river mouths, pocket beaches, and rocky headlands. NPS photo. Figure 8: Rialto Beach near the Quileute Reservation is a cobble beach (high vulnerability). NPS photo. Figure 9: Hole in the Wall north of Rialto Beach (low vulnerability). NPS photo. Figure 10: Point of Arches (very low vulnerability). NPS photo.
17

Figure 11. Regional coastal slope cross-sections for A) Shi Shi Beach (4 - high vulnerability) B) Rialto Beach (5 - very high vulnerability) and C) Kalaloch (3 - moderate vulnerability).
18

Figure 12. Relative Coastal Vulnerability for Olympic National Park. The innermost color bar is the relative coastal vulnerability index (CVI). The remaining color bars are separated into the geologic variables (1-3) and physical process variables (4 - 6). The very high vulnerability shoreline is generally located along sandy and gravel beaches where regional coastal slope is low. High vulnerability shoreline is concentrated north of Mora. Moderate vulnerability and low vulnerability coastline is mostly south of Mora.
19

Figure 13. Percentage of Olympic National Park shoreline in each CVI vulnerability category.
20
Figure 14. Location of selected cultural resources along the Olympic coast that may be affected by sea-level rise.
21

Table 1: Ranges for Vulnerability Ranking of Variables on the Pacific Coast.
Variables Very Low 1
Low 2
Moderate3
High 4
Very High 5
GEOMORPHOLOGY Rocky cliffed coasts, Fjords
Medium cliffs,
Indented coasts
Low cliffs, Glacial drift,
Alluvial plains
Cobble Beaches, Estuary, Lagoon
Barrier beaches, Sand beaches, Salt marsh, Mud flats, Deltas, Mangrove,
Coral reefs SHORELINE
EROSION/ACCRETION (m/yr)
> 2.0 1.0 - 2.0 -1.0 - 1.0 -2.0 - -1.0 < -2.0
COASTAL SLOPE (%) > 14.7 10.9 – 14.65 7.75 – 10.85 4.6 –7.7 < 4.55
RELATIVE SEA-LEVEL CHANGE
(mm/yr) < 1.8 1.8 - 2.5 2.5 - 3.0 3.0 - 3.4 > 3.4
MEAN WAVE HEIGHT (m) < 1.1 1.1 – 2.0 2.0 – 2.25 2.25 – 2.60 > 2.6
MEAN TIDE RANGE (m) > 6.0 4.0 - 6.0 2.0 - 4.0 1.0 - 2.0 < 1.0
22

Table 2: Sources of Data
Variables Source URL
GEOMORPHOLOGY
Aerial Photography
from USGS and Washington
Department of Ecology http://www.ecy.wa.gov/apps/shorephotos/index.html
SHORELINE EROSION/ACCRETION
(m/yr)
Coastal Monitoring and
Analysis Program,
Washington Department of
Ecology http://www.ecy.wa.gov/ecyhome.html
COASTAL SLOPE (%)
NGDC Coastal Relief Model Vol
01 12/17/1998 http://www.ngdc.noaa.gov/mgg/coastal/coastal.html
RELATIVE SEA-LEVEL CHANGE (mm/yr)
NOAA Technical Report NOS CO-
OPS 36 SEA LEVEL
VARIATIONS OF THE UNITED
STATES 1854-1999 (Zervas,
2001) http://www.co-ops.nos.noaa.gov/publications/techrpt36doc.pdf
MEAN WAVE HEIGHT (m)
Pacific Coast WIS
Data and
National Data
Buoy Center
http://bigfoot.wes.army.mil/
http://seaboard.ndbc.noaa.gov/
MEAN TIDE RANGE (m)
NOAA/NOS CO-OPS Historical
Water Level Station Index http://www.co-ops.nos.noaa.gov/usmap.html
23