Coastal Resilience in Cordova, Alaska Marie Esguerra ... Resilience in Cordova, AK Abstract Alaska...
13
Coastal Resilience in Cordova, Alaska Marie Esguerra, Travis Glasen, Cori Pegau, Ben Wray Cordova Jr/Sr High School 100 Fishermans Ave. Cordova, AK 99574 Lauren Bien, [email protected] Disclaimer: “This paper was written as part of the Alaska Ocean Sciences Bowl high school competition. The conclusions in this report are solely those of the student authors.”
-
Upload
truongliem -
Category
Documents
-
view
215 -
download
1
Transcript of Coastal Resilience in Cordova, Alaska Marie Esguerra ... Resilience in Cordova, AK Abstract Alaska...
Coastal Resilience in Cordova, Alaska
Marie Esguerra, Travis Glasen, Cori Pegau, Ben Wray
Cordova Jr/Sr High School
100 Fishermans Ave.
Cordova, AK 99574
Lauren Bien, [email protected]
Disclaimer: “This paper was written as part of the Alaska Ocean Sciences Bowl high school
competition. The conclusions in this report are solely those of the student authors.”

Coastal Resilience in Cordova, AK
Abstract
Alaska is an earthquake prone state, due to its location on the subducting Pacific Plate.
Some of the largest earthquakes in the United States have occurred in Alaska. This means that
we must be ready and prepared for an earthquake to happen here. To do this we must be
resilient- able to bounce back after disaster, in this case an earthquake. The Prince William
Sound was the location of the 1964 earthquake and an area that is specifically vulnerable to the
effects of another large quake. As a community located in the Sound, we will use mapping and
modeling tools to assess our vulnerability, natural vegetation to prevent against tsunami
damages, and a variety of education tools to engage our city in becoming a resilient coastal
community.

1
Introduction
Out of all of the states in the U.S., Alaska has the most earthquakes recorded. 3 of the 7
largest earthquakes in the 20th
century happened in Alaska (Earthquake Information Bulletin,
1970), the biggest being the one that happened in 1964. On March 27, 1964, at 5:36 p.m. A great
earthquake, with a magnitude of 9.2, hit the Prince William Sound region of Alaska (Figure 1).
The northwest motion of the Pacific Plate, moving at 5 to 7 cm per year, causes the crust of
southern Alaska to be compressed and warped, with some areas along the coast being depressed
and other areas inland being uplifted (Neall & Trewick, 2008). After periods of tens to hundreds
of years, a sudden southeastern motion of portions of coastal Alaska relieves this compression as
they move back over the subducting Pacific plate (Christensen & Beck, 1994).
Fig 1. The location of the 1964 earthquake is shown on this map, with the star representing the epicenter. The white,
open circles represent areas where aftershock was felt within one month. Red lines are faults and the black line is
the extent of the ruptured fault (Christensen and Beck, 1994).

2
Since the 1964 earthquake, Prince William Sound hasn’t experienced an earthquake of
that magnitude in the past 51 years.
Fig 2. The map) is a 2007 seismic hazard map created by the United States Geological Survey, USGS.
http://earthquake.usgs.gov/earthquakes/states/alaska/hazards.php
One can observe that the place with the highest risk of an earthquake is the area around
the Yakataga area, putting Prince William Sound, and Cordova, right in the vicinity of being hit
by an earthquake (Schnell & Herd, 1983). This seismic gap could possibly lead to an earthquake
larger than the one in 1964, which was a magnitude of 9.2.
Why is this important? It is important because if we can make a good estimate of when
places in Prince William Sound would be hit by an earthquake, the communities can make plans
on how to bounce back from the disaster, known as being resilient.

3
Resilience is the ability for a community to bounce back from any natural disaster that
may happen, instead of just reacting to it. It is an approach that communities can use to help
reduce the damage of ecological and socioeconomic elements. The idea of resilience has become
an increasingly popular concept in planning and/or making policy in the U.S., particularly in the
wake of natural disasters (Ahern, 2011).
Assessing Risk
There are many different tools that you can use to assess the risk and vulnerability of
your region, Cordova, AK in this case. In these pages we will show you 2 different types of tools
that assess this. Mapping tools are very useful when you are trying to assess the risk of your
topic region, so what do they do? Well, there are many different types of mapping tools, two of
which are the US Geological Survey (USGS) earthquake hazard program and the National
Earthquakes Hazard Reduction program. USGS is a mapping tool which records earthquakes on
a map of a selected topic region. USGS also records past earthquakes from one date to another,
the earthquakes are recorded as small/large dots with different colors showing the magnitude of
the earthquake. Knowing where past earthquakes have occurred, where they might occur in the
future, and the possible magnitude allows communities to better prepare for an inevitable
earthquake (Lam et al., 2015). Mapping tools allow us to predict where earthquakes could occur
and which areas will be affected by the quake, the aftershock, and possible tsunamis (Shepard et
al., 2014).
Another good thing that mapping tools show us is our topographic location so we are able
to better foresee which areas are more vulnerable to earthquake effects. If we are to better
foresee what areas are more vulnerable it would help us to be able to know what we need in

4
order to make this area safer/less vulnerable and more resilient which is why using mapping
tools are a good addition for you to assess vulnerability.
A community must develop Modeling tools to assess risk and to show scenarios on what
they need in order to become more resilient. Modeling tools look at long term impact of what
could happen with a certain scenario whether it’s earthquake or tsunami. Scenarios are an
extremely useful modeling tool they are able to show what areas of land are vulnerable to risk. A
scenario can simulate what happens when an earthquake happens, this can show if you would
feel it from how far? Or from where? Also it is able to simulate if there will be a tsunami and
what height is at the safe zone from where the tsunami hits.
Potential Solutions and Taking Action
There are many ways we can take action with our plans. However, our chosen solution is
to plant a barrier of vegetation to lessen the force of waves that may come after an earthquake
(Table 1). Educating the people of Cordova, though, must come first. While the people of
Cordova are well accustomed to the idea of earthquakes, teaching them of our plans to make our
community safer, along with ways to prepare themselves in case of a disaster, are important.
Infrastructure type Strengths
Weaknesses
Built (seawalls, levees, bulkheads, etc.)
• Significant expertise already exist on how to design and build such approaches • Decades of experience with implementing this approach • Excellent understanding of how these approaches function and what
• Does not adapt with changing conditions such as sea-level rise • Weakens with time and has a built-in lifetime • Can cause coastal habitat loss and have negative impacts on the ecosystem services provided by

5
level of protection will be provided by different types of structures built to specific engineering standards • Ready to withstand a storm event as soon as they are constructed
nearby coastal ecosystems • Can lull communities into thinking they are safe from all disasters leading to increased loss of life or property • May sustain more damage during small storm events than natural approaches • Only provides storm protection benefits when a storm is approaching; no co-benefits accrue in good weather
Natural (salt marsh, mangrove, beach, dune, oyster and coral reefs, etc.)
• Provides many co-benefits in addition to coastal protection including fishery habitat, water quality improvements, carbon sequestration and storage, and recreational use, and can provide these benefits to coastal communities all the time, not just during storm events • In the case of ecosystem restoration, the ecosystem grows stronger with time as it gets established • Has the potential to self-recover after a storm or forcing event • Can keep pace with sea-level rise • Can be cheaper to construct • Can survive smaller storms with less damage than built infrastructure, and can self-repair
• Need to develop best practices for how to restore ecosystems • Provides variable levels of coastal protection (non-linearity of the provisioning of coastal protection benefits) depending on the ecosystem, geography and also on the type and severity of storm; need more research to better understand how to estimate or predict the coastal protection provided • In the case of restored ecosystems, it can take a long time for ecosystems to get established for the natural systems to provide the necessary level of coastal protection • Likely requires a substantial amount of space to implement natural approaches (such as ecosystem restoration or protection of existing ecosystems) which may not be possible • Few data on the cost to benefit ratio for projects • Permitting for natural projects can be a more difficult process than for built projects • Growing but still limited expertise in the coastal planning and development community on which approaches to use where and when
Hybrid(combination of built and natural)
• Capitalizes on best characteristics of built and natural • Allows for innovation in designing coastal protection systems • Provides some co-benefits besides coastal protection • Can provide a greater level of confidence than natural approaches alone • Can be used in areas where there is little space to implement natural approaches alone
• Little data on how well these systems perform to date • Does not provide all the same benefits that natural systems provide • Need more research to design the best hybrid systems • Growing but still limited expertise in the coastal planning and development community on which approaches to use where and when • Hybrid systems, due to the built part of them, can still have some negative impacts on species diversity • Few data on the cost to benefit ratio
6
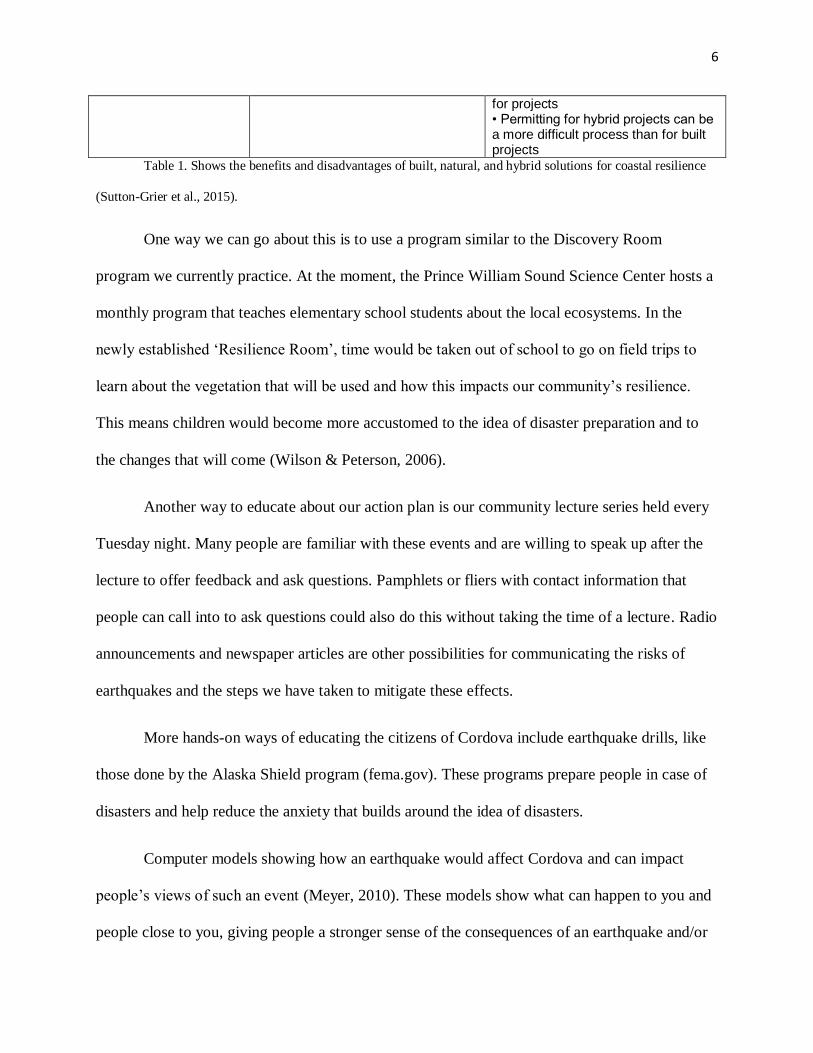
for projects • Permitting for hybrid projects can be a more difficult process than for built projects
Table 1. Shows the benefits and disadvantages of built, natural, and hybrid solutions for coastal resilience
(Sutton-Grier et al., 2015).
One way we can go about this is to use a program similar to the Discovery Room
program we currently practice. At the moment, the Prince William Sound Science Center hosts a
monthly program that teaches elementary school students about the local ecosystems. In the
newly established ‘Resilience Room’, time would be taken out of school to go on field trips to
learn about the vegetation that will be used and how this impacts our community’s resilience.
This means children would become more accustomed to the idea of disaster preparation and to
the changes that will come (Wilson & Peterson, 2006).
Another way to educate about our action plan is our community lecture series held every
Tuesday night. Many people are familiar with these events and are willing to speak up after the
lecture to offer feedback and ask questions. Pamphlets or fliers with contact information that
people can call into to ask questions could also do this without taking the time of a lecture. Radio
announcements and newspaper articles are other possibilities for communicating the risks of
earthquakes and the steps we have taken to mitigate these effects.
More hands-on ways of educating the citizens of Cordova include earthquake drills, like
those done by the Alaska Shield program (fema.gov). These programs prepare people in case of
disasters and help reduce the anxiety that builds around the idea of disasters.
Computer models showing how an earthquake would affect Cordova and can impact
people’s views of such an event (Meyer, 2010). These models show what can happen to you and
people close to you, giving people a stronger sense of the consequences of an earthquake and/or

7
the tsunami that may come after. Models also show how said disasters would impact Cordova
and the fishing industry that holds up our economy.
Of course, before we begin educating the public, we must decide what plants to use for
our natural barrier. While many salt-tolerant plants live best in hot and humid conditions, native
Alaskan plants can do equally well (Rauser & Cole, 1962). Beach wildrye grass (Leymus mollis)
is one species that lives in Alaska. Wildrye grass also has cultural purposes; it is used in Yup’ik
coil weaving (Wright, 1994). Kelp can make an underwater barrier and is easily grown and
maintained (Buschmann et al., 2014). With a growing sea otter population controlling the kelp-
eating sea urchin population, the kelp can make an easy comeback.
Once we decide which plants to use, the next step is to gather plants and seeds. As many
species are readily available in nurseries or live near Cordova, this should be fairly easy. The
plants will be placed strategically based on where the natural barrier would be most effective.
This can be determined by use of sonar (Greene et al., 2005) such as the kind used to see where
tsunamis are most likely to begin or hit.
Funding can be done by way of grants, as well as fundraising efforts. Volunteers are
easily found, as has been demonstrated in multiple community events in Cordova. Since Cordova
is a very community-minded town, citizens are willing to spend some effort if they believe it will
help the town at large. For example, moving the books from the old library to the new one, ‘The
Book Brigade,’ took only one day, and would have taken much longer had the citizens not been
willing to move the books.
Permits will need to be acquired from both the state of Alaska and the City of Cordova.
Permit forms from the state can be found at the Alaska Department of Natural Resources and

8
permits from the city are available at the city office. The most important of these is a Tidal
Wetlands Permit, which applies for any modification of tidal wetlands.
A year or so after the implementation, we can compare the effects of earthquakes- mostly
small ones, as earthquakes that register around 1 on the Richter scale occur occasionally in
Cordova- to the effects of earthquakes from before the vegetation was added to the coastline.
This idea has been proposed in the past, but has not been executed due to lack of opportunities
and limited time. (Kerr & Baird, 2007). This and the results of other ecosystem impact surveys
will be shared at a community event so that the community knows that the hard word of
everyone involved was well worth it.
Measuring Effectiveness
The key to knowing how prepared we are is the numbers. With the use of quantitative
data, we can compare Cordova’s theoretical resilience before and after revegetation. Computer
simulations can be used to measure the force of waves before natural barriers were instated, and
then compare the force of the same wave with vegetation (NOAA Tsunami Forecasting System,
2015). To prevent major damages (largely those that come from L waves, the most destructive
form of earthquake-resultant waves, waves should not be over a level six on the Imamura-Iida
scale (Papadopoulos & Imamura, 2001). If the waves after revegetation are still above that
threshold, tests should be done in simulation to see if there are more strategic places to grow
plants to reduce damage. While there should be enough vegetation to make a strong barrier, there
should not be so much as to choke native species. We must determine how many plants, based
on the geography of the sound, is the correct amount and compare.

9
Miles of coastline covered also impact the results. One estimate from Louisiana showed
that a 0.1 increase in the ratio of wetland to open water would save anywhere between $590,000
and $792,000, or about three to five properties. A related computer model showed that each
hectare grown saves the government around $33,000 of storm damage money. (Sutton-Grier et
al., 2015). Hopefully once Prince William Sound has completed revegetation, other coastal
communities will follow suit, creating more natural barriers and thus increasing the miles of
coastline protected.
One more quantitative measurement of success is the amount of volunteers recruited, as
well as how many plants were cultivated. More volunteers suggests a greater public interest in
resilience and also speeds along the progress (and often quality) of work.
To test the knowledge of the public, a short survey will be sent out before educational
programs begin. This will act as a pre-test, and the results of the completed surveys (not to be
disclosed to the public or individuals) will be averaged, then compared to results from the same
survey sent out again after educational measures are taken. If scores do not significantly increase,
then more efforts to educate must be undertaken. Moreover, we must give the community
sufficient opportunities to learn. If there have only been one or two lectures, or a couple of
Resilience Rooms, then we have not properly followed through and given citizens adequate
opportunities.
Lastly, we must go over our action plan to make sure we have completed every step. If
we skipped over something, we must go back and finish it to prevent possible consequences that
could come with missing said step. For instance, if we had forgotten to educate the public before
starting the project, though we cannot turn back time, we should begin education as soon as
possible. This will improve the quality of our actions

10
Literature Cited
Ahern, J., (2011). From Fail-Safe to Safe-to-Fail: Sustainability and Resilience in the New Urban
World. Landsc. Urban Plan. 100, 341-343.
Buschmann, A., Prescott, S., Potin, P., Faugaron, S., Vásquez, J., Camus, C., … Varela, D.
(2014). The Status of Kelp Exploitation and Marine Agronomy, with Emphasis on
Macrocytis pyrifera, in Chile. Advances in Botanical Research, 71, 162-181.
Christensen, D. H., & Beck, S. L. (1994). The Rupture Process and Tectonic Implications of the
Great 1964 Prince William Sound Earthquake. PAGEOPH, 29-53.
Earthquake Information Bulletin, Volume 2, Number 2, March - April 1970.
Greene, G., Bizzarro, J., Tilden, J., Lopez, H., & Erdey, M. (2005). The Benefits and Pitfalls of
Geographic Information Systems in Marine Benthic Habitat Mapping.
Henley-Shepard, S., Gray, S. A., Cox, L. J. (2015) The Use of Participatory modeling to Promote
Social Learning and Facilitate Community Disaster Planning. Enviro. Sci. & Policy, 45,
109-122.
Kerr, A. M., & Baird, A. H. (2007). Natural Barriers to Natural Disasters. BioScience, 57 (2),
102-103.
Lam, S. N., Qiang, Y., Arenas, H., Brito, P., Liu, K. (2015) Mapping and Assessing Coastal
Resilience in the Caribbean Region. Cartography and Geographic Information Science,
42 (4), 315-322.
Meyer, R. J. (2010). Development and Pilot testing of a Dynamic Hurricane Simulator for the
Laboratory Study of Hurricane Preparedness and Mitigation Decisions. University of
Pennsylvania, Center for Risk Management and Decision Processes.
Neall, V. E., & Trewick, S. A. (2008). The Age and Origin of the Pacific Islands: a Geologic
Overview. Phil. Trans. R. Soc. B., 363 (1508), 3293-3308.
NOAA Tsunami Forecasting System: Sift Overview, 2015.
Papadopolous, G. A., & Imamura, F. (2001) A Proposal for a New Tsunami Intensity Scale. ITS
Proceedings, 5 (5), 569-577.
Rauser, W. E., & Crowle, W. L. (1962). Salt Tolerance of Russian Wild Ryegrass in Relation to
Tall Wheatgrass and Slender Wheatgrass. Can. J. Plant Sci., 43, 397-407.
Schnell, M. L. & Herd, D.G. (1983). National Earthquake Hazards Reduction Program: Report to
the United States Congress.
Sutton-Grier, A. E., Wowk, K., & Bamford, H. (2015) Future of Our Coasts: The Potential for
Natural and Hybrid Infrastructure to Enhance the Resilience of our Coastal Communities,
Economies, and Ecosystems. Enviro. Sci. & Policy, 51, 137-148.
Wilson, S. M., & Peterson, P. L. (2006). Theories of Learning and Teaching: What Do They
Mean for Educators? National Education Association, Best Practices NER Research

11
Wright, S. (1994). Beach Wildrye: Planting Guide for Alaska. Alaska Department of Natural
Resources: Division of Agriculture.


![The Cordova daily times. (Cordova, Alaska). 1922-02-01 [p 2]....Title The Cordova daily times. (Cordova, Alaska). 1922-02-01 [p 2]. Subject Page from The Cordova daily times. (Cordova,](https://static.fdocuments.net/doc/165x107/5f8f03bfcfa04450ab46065f/the-cordova-daily-times-cordova-alaska-1922-02-01-p-2-title-the-cordova.jpg)