Coastal Adaptation to Climate Change: Mapping a New Zealand Coastal Sensitivity Index ·...
43
Coastal Adaptation to Climate Change: Mapping a New Zealand Coastal Sensitivity Index Prepared for MBIE contract C01X0802 September 2012
Transcript of Coastal Adaptation to Climate Change: Mapping a New Zealand Coastal Sensitivity Index ·...
Coastal Adaptation to Climate Change:
Mapping a New Zealand Coastal Sensitivity Index
Prepared for MBIE contract C01X0802
September 2012
© All rights reserved. This publication may not be reproduced or copied in any form without the permission of the copyright owner(s). Such permission is only to be given in accordance with the terms of the client’s contract with NIWA. This copyright extends to all forms of copying and any storage of material in any kind of information retrieval system.
Whilst NIWA has used all reasonable endeavours to ensure that the information contained in this document is accurate, NIWA does not give any express or implied warranty as to the completeness of the information contained herein, or that it will be suitable for any purpose(s) other than those specifically contemplated during the Project or agreed by NIWA and the Client.
Authors/Contributors : Nigel Goodhue Helen Rouse Doug Ramsay Rob Bell Terry Hume Murray Hicks
For any information regarding this report please co ntact: Helen Rouse Resource Management Consultant +64-3-343 8037 [email protected] National Institute of Water & Atmospheric Research Ltd Gate 10, Silverdale Road Hillcrest, Hamilton 3216 PO Box 11115, Hillcrest Hamilton 3251 New Zealand Phone +64-7-856 7026 Fax +64-7-856 0151
NIWA Client Report No: HAM2013-011 Report date: September 2012 NIWA Project: CACC135

Coastal Adaptation to Climate Change:
Contents
Executive summary ................................. ............................................................................. 5
1 Introduction and project background ............... ......................................................... 7
2 Coastal vulnerability and sensitivity ............. ............................................................. 9
2.1 Vulnerability assessments .................................................................................... 9
2.2 Vulnerability and sensitivity indices ...................................................................... 9
2.3 Earlier coastal sensitivity index for New Zealand ................................................ 12
3 Development of a future coastal sensitivity index f or New Zealand ...................... 13
3.1 Selection and development of variables ............................................................. 13
3.2 Building the CSI ................................................................................................. 17
4 Discussion of methodology ......................... ............................................................ 24
4.1 Application of the CSI, limitations and assumptions ........................................... 24
4.2 Potential for development of the CSI tool ........................................................... 24
5 Acknowledgements .................................. ................................................................. 30
6 References ........................................ ......................................................................... 31
Appendix A International vulnerability index studies ......... ........................................... 35
Appendix B Attribute scores .................................. ......................................................... 36
Appendix C Variable and attribute definitions ................ ............................................... 39
Appendix D Variable weightings ............................... ...................................................... 43
Tables Table 2-1: Summary of physical variables used in studies to construct a coastal
hazard related index. 11
Table 3-1: Summary of the length of New Zealand’s coastline mapped as part of the coastal classification project and a summary of selected foreshore sediment types. 16
Table 3-2: Variables used in the CSI and their associated formats. 18
Table 3-3: Worked example for calculating the CSI for coastal erosion for the northern section of Waihi Beach, Bay of Plenty. 20
Coastal Adaptation to Climate Change:
Figures Figure 2-1: Example of Coastal Sensitivity Index ratings for selected beaches between
Whakatane and East Cape (Gibb et al. 1992). 12
Figure 3-1: Outline of New Zealand coastline illustrating the data collected for the four geomorphic variables used in this study. 15
Figure 3-2: Histogram of the CSI scores for the inundation and coastal erosion indices. 21
Figure 3-3: New Zealand coastal sensitivity index for inundation (flooding from the sea). 22
Figure 3-4: New Zealand coastal sensitivity index for coastal erosion. 23
Figure 4-1: Illustrated aerial photo of Cooks Beach on the Coromandel Peninsula showing: (A) the national CSI for coastal erosion which was developed as part of this project; (B) The additional variables that could be included in more detailed regional mapping of coastal sensitivity. 27
Figure 4-2: Illustrated aerial photo of Raglan Harbour entrance on the Waikato’s west coast showing: (A) the CSI for coastal erosion which was developed as part of this project; (B) The additional variables that could be included in more detailed regional mapping of coastal sensitivity. 28
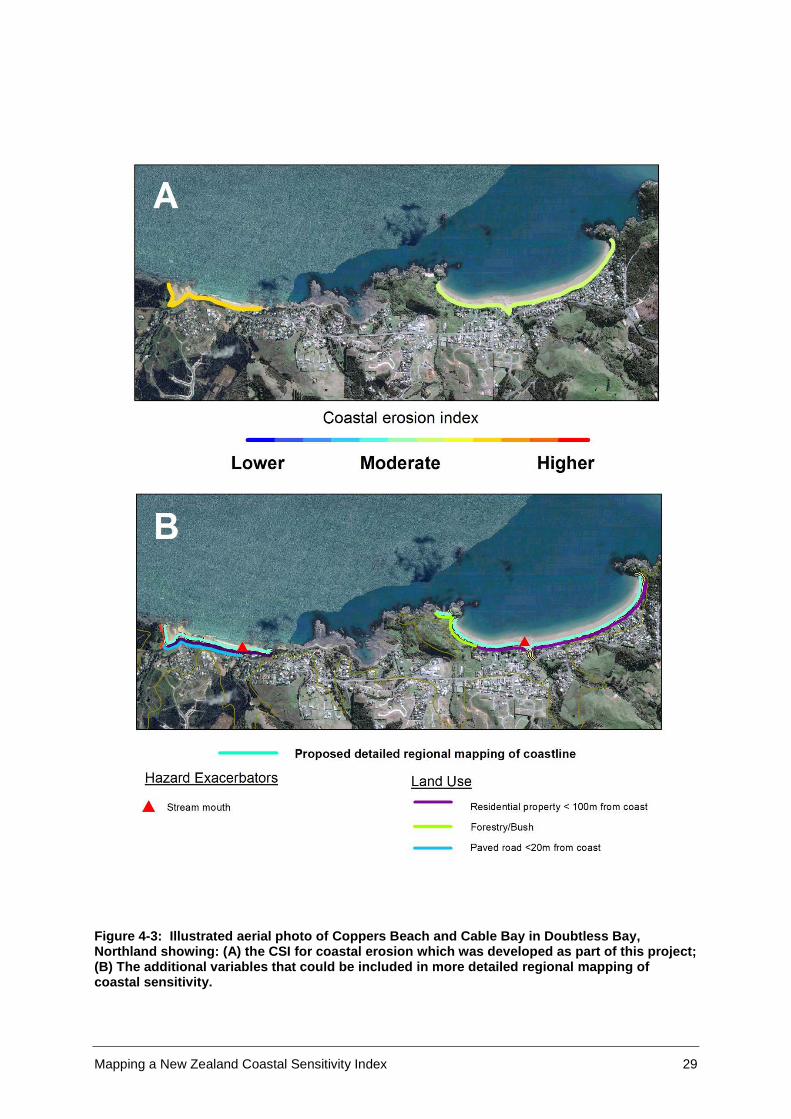
Figure 4-3: Illustrated aerial photo of Coppers Beach and Cable Bay in Doubtless Bay, Northland showing: (A) the CSI for coastal erosion which was developed as part of this project; (B) The additional variables that could be included in more detailed regional mapping of coastal sensitivity. 29
Reviewed by Approved for release by
Darren N King R. Gorman Group Manager - Climate Formatting checked by
Mapping a New Zealand Coastal Sensitivity Index 5
Executive summary Currently New Zealand does not have a national picture of how the relative sensitivity to present day coastal hazards varies around New Zealand, or how sensitive the coast may be to the potential impacts of climate change on coastal margins. Identifying and describing the physical sensitivity in a nationally consistent manner is a first step in understanding where the impacts of climate change on coastal margins may be most significant and where potential adaptation activities may most usefully be targeted. This report details work undertaken to build such a national picture of physical coastal sensitivity for New Zealand.
As a first task we reviewed international studies of coastal sensitivity, and identified the key parameters used to develop coastal sensitivity indices. In conjunction with available geomorphic and oceanographic information, we developed Coastal Sensitivity Indices (CSI) for inundation and coastal erosion for New Zealand’s soft shore coastline. These indices were created by combining four geomorphic (exposure, hinterland, sediment type and landform type) and three oceanographic (high tide range and change in storm surge and wave height) variables. An expert panel then assigned relative scores and weightings to the geomorphic and oceanographic variables based on how they are likely to be affected by climate change.
1. The following steps were taken: Each of the variable’s attributes was scored on a scale 1-5 based on its sensitivity to climate change.
2. The seven variables were weighted on a scale of 6-30 based on their relative importance to each other in contributing to sensitivity.
3. Each of the 1811 shoreline ‘segments’ was assigned a rating (1-5) for all seven variables based on the segment’s attributes.
4. A CSI score was produced for each segment by summing all seven ratings by their respective weightings.
5. The CSI’s were mapped and checked for consistency.
This undertaking has resulted in two interactive maps, which can be used to identify coastal areas which are more sensitive than others to the potential impacts of climate change-induced coastal inundation and erosion. The maps are hosted on the Coastal Explorer website: http://wrenz.niwa.co.nz/webmodel/coastal. This information is expected to assist councils and government bodies to ‘home in on’ areas of increased sensitivity for adaptation planning and response. Further, the CSI is expected to contribute to raising the levels of political and community awareness of coastal hazards and how such hazards might alter with climate change.
Notwithstanding these potential contributions the CSI is not an absolute measure of potential risk of future inundation or erosion under climate change; and consequently it should not be used as a replacement for local (beach scale) risk assessments. Rather the CSI has been designed to provide a high level scoping and comparison of the relative (higher or lower) sensitivity to climate change of one part of the coast to another.
6 Coastal Adaptation to Climate Change:
Future additions to the CSI to help improve the accuracy and resolution have been identified. These improvements include the addition of current day shoreline stability information, socio-economic variables from the Deprivation Index, and more detailed regional level indices.
It is envisaged that the approaches and maps produced through this work will ultimately contribute to an improved strategic and long-term approach for coastal adaptation to climate change.
Mapping a New Zealand Coastal Sensitivity Index 7
1 Introduction and project background Currently New Zealand does not have a good national picture of how the relative sensitivity to present day erosion and storm inundation varies around New Zealand, nor how that sensitivity may be affected by climate change. Identifying and describing indicative relative physical sensitivity in a nationally consistent manner is a first step in understanding where the impacts of climate change on coastal margins may be most significant and where potential adaptation activities may most usefully be targeted.
The Coastal Adaptation to Climate Change (CACC) project is a four-year Ministry of Business, Innovation & Employment1 (MBIE) funded project, intended to create the necessary information and tools to enable adaptation by central and local government and communities to the impacts of climate-induced change on the coastal environment.
The intended outcome of the CACC project is:
More informed proactive communities and councils developing local adaptation strategies to climate change, the inclusion of these strategies in regional and community coastal planning documents and evaluation and monitoring of the uptake and performance of adaptation strategies.
The project has three key components or work streams:
1. Building a national coastal sensitivity profile.
2. Engaging communities and institutional decision-makers.
3. Encouraging best practice planning.
This report describes the process of building a national coastal sensitivity profile for New Zealand’s soft shore coast (component 1). Other aspects of the CACC project have been completed and reported on, with key outputs available on the project website2.
The key objective of this component was to:
Extend basic mapping of coastal vulnerability to all regions of New Zealand, excluding hard rock coasts, using parameters derived from the existing New Zealand Coastal Classification.
Once the key objective was completed the component outlined further work, to:
Undertake a comparison of this national scoping tool with more detailed vulnerability mapping already undertaken for the Northland, Auckland and Coromandel coasts.
To achieve the objectives this report evaluates coastal sensitivity mapping methodologies from the international studies. A New Zealand-specific methodology is developed and applied to build a national picture of potential future coastal sensitivity. The methodology uses coastal physical variables to build GIS-based layers that are then integrated to map a Coastal Sensitivity Index (CSI) for New Zealand’s soft shore coastline. The CSI can be
1 Formerly the Foundation for Research, Science & Technology (FRST) then the Ministry for Science and Innovation (MSI). 2 www.niwa.co.nz/our-science/coasts/research-projects/all/coastal-adaption-to-climate-change
8 Coastal Adaptation to Climate Change:
viewed via NIWA’s Coastal Explorer web tool3. The CSI provides maps showing the relative potential future sensitivity to coastal inundation (storm flooding from the sea) and coastal shoreline change (erosion and accretion).
It is envisaged that the maps on Coastal Explorer will assist councils to identify areas of their coasts which are relatively more sensitive than others to the exacerbating influences of climate change on inundation and erosion hazards. The CSI is also intended to assist with raising the levels of political and community awareness and knowledge of how coastal hazards might alter with climate change at regional to local scales. The hope is that this will ultimately contribute to an improved strategic and long-term approach to coastal adaptation to climate change.
The first section of this report provides an introduction to vulnerability assessments and indices, an overview of vulnerability indices used internationally and previously in New Zealand, and the type of variables used to derive them. Specific methodology on how this New Zealand coastal sensitivity index was developed is then described. Finally, the report discusses key uses, limitations and assumptions underlying the CSI maps and concludes with potential future opportunities to improve the CSI as a tool for coastal hazard management and adaptation to climate change.
3 http://wrenz.niwa.co.nz/webmodel/coastal
Mapping a New Zealand Coastal Sensitivity Index 9
2 Coastal vulnerability and sensitivity
2.1 Vulnerability assessments In a general sense, vulnerability to natural hazards is the predisposition of different systems, sectors and groups to be adversely affected or unable to cope with extreme events. This concept has been widely used when looking at hazards and disaster management.
In the context of hazards and disaster management, vulnerability assessments look at the threats from potential hazards to the population and to the infrastructure developed in that particular location. For coastal environments, vulnerability assessments have been used to identify the susceptibility of coastal areas to storm surge (e.g., Clark et al. 1998), hurricanes (e.g., Gray et al. 2003), and sea level rise (e.g., Thieler & Hammar-Klose 1999), among others.
In the context of climate change, vulnerability assessments look at the threats arising from climate change, both in an average sense and from changing extremes. There are two dominant ways used to ‘frame’ climate change vulnerability (O’Brien et al. 2007) with this study being an example of an ‘end-point’ approach in that it considers the impacts of climate change on a particular exposure unit. The alternative frame is the ‘starting point approach’ where the focus is more on climate-society interaction and attention is focused on the socio-economic and political context.
The realm of climate change related vulnerability assessments has evolved rapidly over the last 20 years or so, and many organisations (e.g., United Nations Framework Convention on Climate Change (UNFCCC) 2008) offer guidance on how to carry out these assessments.
Kay & Travers (2008) provide a useful overview of a number of Coastal Vulnerability and Adaptation Assessment tools and methodologies4.This summarises a variety of methods and lists their comparative strengths and weaknesses. A summary is provided in Appendix A with readers recommended to refer to this work for more information. A Coastal Sensitivity Index (CSI) is the approach that has been used to develop a national picture of coastal vulnerability to climate change in this study. Coastal sensitivity indexes are described in more detail in the following sections.
2.2 Vulnerability and sensitivity indices The methodology developed enables a ‘sensitivity index’ to be mapped for the coast. Whilst many comparable international studies use a ‘vulnerability index’, in the context of this study, ‘coastal sensitivity’ is defined as the extent to which a soft shore coastline will respond, in terms of erosion and inundation, to physical processes acting on the shoreline. The difference between vulnerability and sensitivity indices are described briefly below.
Vulnerability indices have been developed as a rapid and consistent method for characterising the relative vulnerability of different coasts (Kay & Travers 2008). The simplest of these are assessments of the physical vulnerability of the coast, while the more complex also examine aspects of economic and social vulnerability.
4 Updated from a previous source (Abhouda & Woodroffe 2006).

10 Coastal Adaptation to Climate Change:
From a climate change perspective, vulnerability is the degree to which a system (including physical and social aspects) is susceptible to, and unable to cope with, adverse effects of climate change. This current study only includes physical variables and has not included any socio-economic aspects relating to the New Zealand coastline. Consequently, ‘sensitivity’ was chosen as a better description of this index. Abuodha & Woodroffe (2010) also made this distinction when deriving a CSI for the south-east coast of Australia which did not include any socio-economic variables. However, despite the difference in terminology, both CSI and CVI follow similar methodology.
2.2.1 Commonly used variables for vulnerability/sen sitivity indices A number of studies reporting CVI’s are based on the approaches developed by Gornitz & Kanciruk (1989) and Gornitz (1991). These typically combine a number of variables ranked or scored in a particular manner. The seven variables used by Gornitz are: mean elevation, local subsidence trend, geology, geomorphology, mean shoreline displacement, maximum wave height and mean tidal range. Similarly, the CVI used by Thieler & Hammer-Klose (1999, 2000) includes: coastal slope, geomorphology, shoreline erosion rates, wave height, tidal range and historic sea level rise. Boruff et al. (2005) used these same variables, and recent studies (e.g., Kumar et al. 2010; Pendleton et al. 2010) used the same fundamental variables.
Table 2-1 summarises the most commonly used variables in 12 studies. Variables include elevation of the immediate coastline, gradient of the coastal hinterland, geomorphic landform, rate of shoreline erosion, tidal range, wave height, and the relative rate of sea level rise.
An important aspect when developing a CSI is being able to convey the index clearly and concisely. To achieve this CSIs are often presented as a coloured line/shape overlaying an aerial map/photo or coastal outline of the study area. The line/shape is then coloured into bins dependant on the level of vulnerability/sensitivity, for example Özyurt & Ergin (2010); Abuodha & Woodroffe (2010); Gibb et al. (1992). The incorporation of Digital Elevation Models (DEMs) in mapping an area’s vulnerability to inundation allows more detailed two dimensional spatial maps of flood risk zones to be presented, for example Wu et al. 2002; Snoussi et al. 2008 and Bryan et al. 2001. Other examples of presentation include radarscope (Meur-Ferec et al. 2008) or providing a summary of the CVI/CSI in table format.

Mapping a New Zealand Coastal Sensitivity Index 11
Table 2-1: Summary of physical variables used in st udies to construct a coastal hazard related index. The last four studies (in blue font) also included socio-economic parameters not listed here.
Parameter
Gor
nitz
& K
anci
ruk
(198
9) /
Gor
nitz
(19
91)
Gib
b et
al.
(199
2)
Thi
eler
& H
amm
er-
Klo
se (
1999
, 200
0)
For
bes
et a
l. (2
003)
Bry
an e
t al.
(200
1)
Heg
de &
Rej
u (
2007
)
Dou
kaki
s (2
005)
Pen
dlet
on e
t al.
(201
0)
Bor
uff e
t al.
(200
5)
Sno
ussi
et a
l. (2
008)
Ste
rr (
2008
)
Dev
oy (
2008
)
Coastal exposure ���� ���� ����
Elevation of the immediate coastline ���� ���� ���� ���� ���� ����
Max storm wave run-up above MHWS ����
Gradient of the coastal hinterland ���� ���� ���� ���� ���� ���� ����
Max tsunami wave height
����
Lithology/ Geomorphology
���� ���� ���� ���� ���� ���� ���� ����
Natural landform ���� ���� ���� ����
Erosion trend rates ���� ���� ���� ���� ���� ���� ���� ���� ���� ���� ����
Short term fluctuation in shoreline position ����
Vertical land movement
���� ����
Tide range ���� ���� ���� ���� ���� ���� ����
Wave height ���� ���� ���� ���� ���� ���� ����
Storm surge water level
���� ���� ����
Relative rate of sea-level rise
���� ���� ���� ���� ���� ����
Morphodynamics ���� ����
Mean high water level
����
Length of shoreline protection structures ����

12 Coastal Adaptation to Climate Change:
2.3 Earlier coastal sensitivity index for New Zeala nd The only previous approach that has attempted to rank sections of the New Zealand coast susceptible to coastal hazards in a standardised way was the Coastal Sensitivity Index (CSI) developed by Gibb et al. (1992). This was a relative index of current sensitivity based on eight variables, derived from initial consideration of the CSI developed by Gornitz & Kanciruk (1989), Gornitz (1991) and Gornitz et al. (1991). Gibb ranked eight parameters for sections of the coast based on their susceptibility to coastal hazards on a scale of 1 to 5 corresponding to very low, low, medium, high and very high sensitivity to coastal hazards.
The methodology used to combine the variables differed from that of Gornitz (1991) in that it used a straight-forward additive approach giving a score out of 40 (40 indicating very high sensitivity to coastal hazards). The CSI was defined as:
CSI = elevation + storm wave run-up + gradient + tsunami + lithology + landform + horizontal trend + short-term fluctuation
The CSI approach was tested and applied at about 110 locations around New Zealand. An example of the index is shown in Figure 2-1, where the size of the circle indicates the relative score (0-40). The parameters used in Gibb’s study are very similar to the commonly used physical parameters identified in Table 2-1.
Figure 2-1: Example of Coastal Sensitivity Index ra tings for selected beaches between Whakatane and East Cape (Gibb et al. 1992). The size of the round marker represents the beach’s sensitivity where a larger marker indicates a higher sensitivity. For this example the beaches are rated from medium to very high.
Mapping a New Zealand Coastal Sensitivity Index 13
3 Development of a future coastal sensitivity index for New Zealand
3.1 Selection and development of variables Based on the variables identified from the literature review, and available nationally-consistent coastal data for the New Zealand coast, seven geomorphic and oceanographic variables were used to develop the New Zealand CSI. These are: exposure, coastal landform type, foreshore sediment type, hinterland characteristics, high-tide range, future change in storm surge and future change in wave height. A number of these variables were mapped previously for a New Zealand coastal classification5, the precursor to the CSI development.
The New Zealand coastal classification scheme and GIS mapping procedures were originally created for Coastal Explorer using advice from expert panels including regional council staff, knowledgeable locals, university staff and consultants from throughout New Zealand. The coast was mapped and referenced against panel knowledge using information from a wide variety of sources including: 1:50,000 topographic maps, aerial photographs, RNZN hydrographic charts, various publications and reports, New Zealand Land Resources Inventory (NZLRI), the National Land Cover Data Base (LCDB), and the Estuarine Environment Classification database (Hume et al. 2007) In assembling the coastal and beach type information, site visits were made to many beaches to obtain information that could not be collected from existing sources, and parts of the coast were flown by light aircraft to obtain oblique aerial photographs.
The primary focus of the New Zealand coastal classification was to provide layers of coastal information that could be used to assess and map hazards around the New Zealand coast. It was envisaged that a key aspect of the hazard mapping would be to estimate the future susceptibility of different parts of the coast and different coastal systems to coastal erosion, coastal inundation and the potential effects of climate change. The coast information is displayed as polylines in Coastal Explorer and as report cards showing the characteristics of beaches. Accessing the Coastal Explorer website launches a map of New Zealand and tools that enable the user to navigate around New Zealand, zoom into parts of the coast for more detail and select and display various switchable layers of information. The information can be overlaid on Google maps, satellite images, or terrain. A split screen provides legend information. Clicking on "Show Legend" brings up the list of attributes. Clicking on “Definitions” brings up explanations/definitions of the coastal terms used in the legend.
3.1.1 Geomorphic variables Four geomorphic variables for soft shorelines on the open coast (i.e., excluding estuarine shores) were selected for use in the CSI:
� Exposure – describes the alignment of the shoreline to open coastal water where it is either exposed to, or sheltered from, incoming swell wave energy. This variable is further categorised into ‘pocket beach’ for small segments of coastline. This variable has four attributes: sheltered, exposed, sheltered pocket beach and exposed pocket beach.
5 The coastal classification can be viewed online via the Coastal Explorer webtool at: http://wrenz.niwa.co.nz/webmodel/coastal. Supporting information is available via the NZCoast website at: http://www.niwa.co.nz/coasts/nzcoast.
14 Coastal Adaptation to Climate Change:
� Coastal landform type – describes the different geomorphological components that occur along the shore. This variable has in total twenty five attributes such as beach ridges, foredune barriers, deltas, spits and tombolos.
� Foreshore sediment type – provides a description of the type of sediment and grain size of material making up the beach. This variable has eleven attributes such as gravel, sand and mud.
� Hinterland characteristics. – describes the nature of the hinterland with respect to its geomorphology and topography. This variable has seven attributes such as lagoons, plains, rising ground and sea cliffs.
A full list of each variable’s attributes is included in Appendix B of this report. The geomorphic variables and their attributes as they had been defined in the coastal classification were re-assessed and in some cases updated, for example an additional attribute or beach type, the ‘incipient barrier beach’ was added (see Appendix C for the definition).
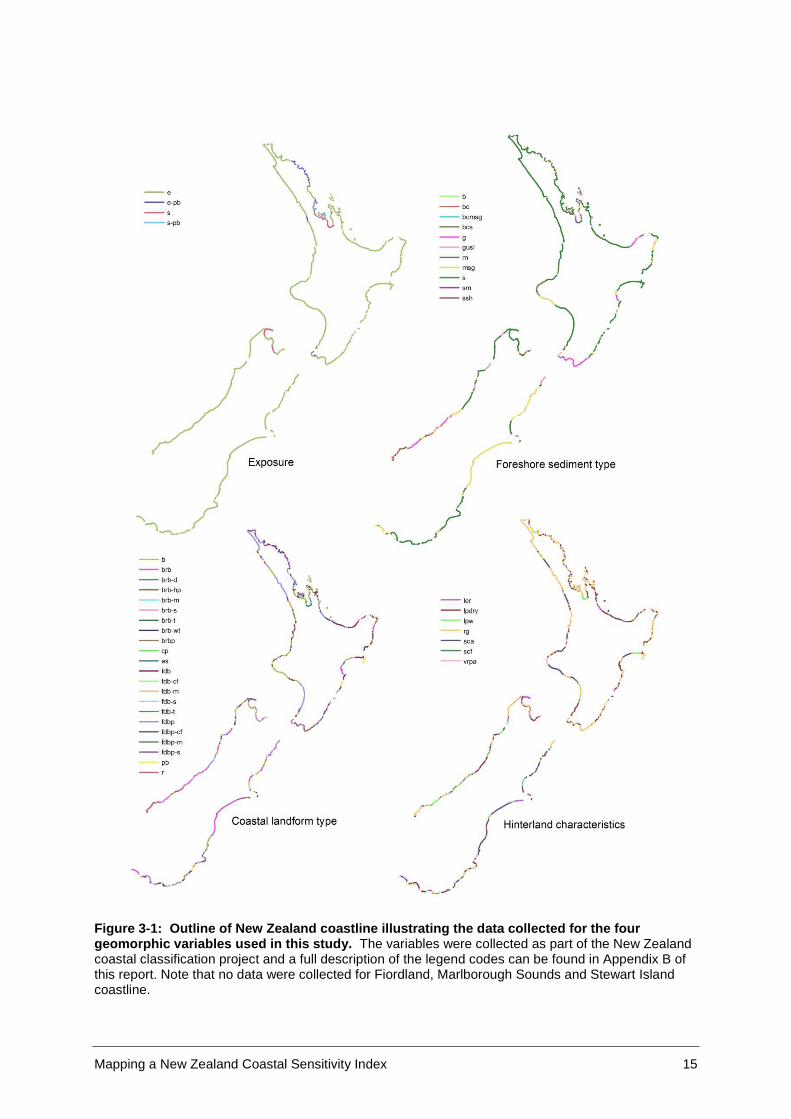
Figure 3-1 illustrates how the four geomorphic variables are mapped in Coastal Explorer. Each variable (e.g., foreshore sediment type) is mapped in GIS as polylines around the coast. The polylines are made up of line-segments, each corresponding to specific attributes of that part of the shoreline (e.g., sand or gravel beach). The information covers most of New Zealand’s coastline including islands offshore, with the notable exceptions being Fiordland, the Marlborough Sounds and Stewart Island.
Mapping a New Zealand Coastal Sensitivity Index 15
Figure 3-1: Outline of New Zealand coastline illust rating the data collected for the four geomorphic variables used in this study. The variables were collected as part of the New Zealand coastal classification project and a full description of the legend codes can be found in Appendix B of this report. Note that no data were collected for Fiordland, Marlborough Sounds and Stewart Island coastline.
16 Coastal Adaptation to Climate Change:
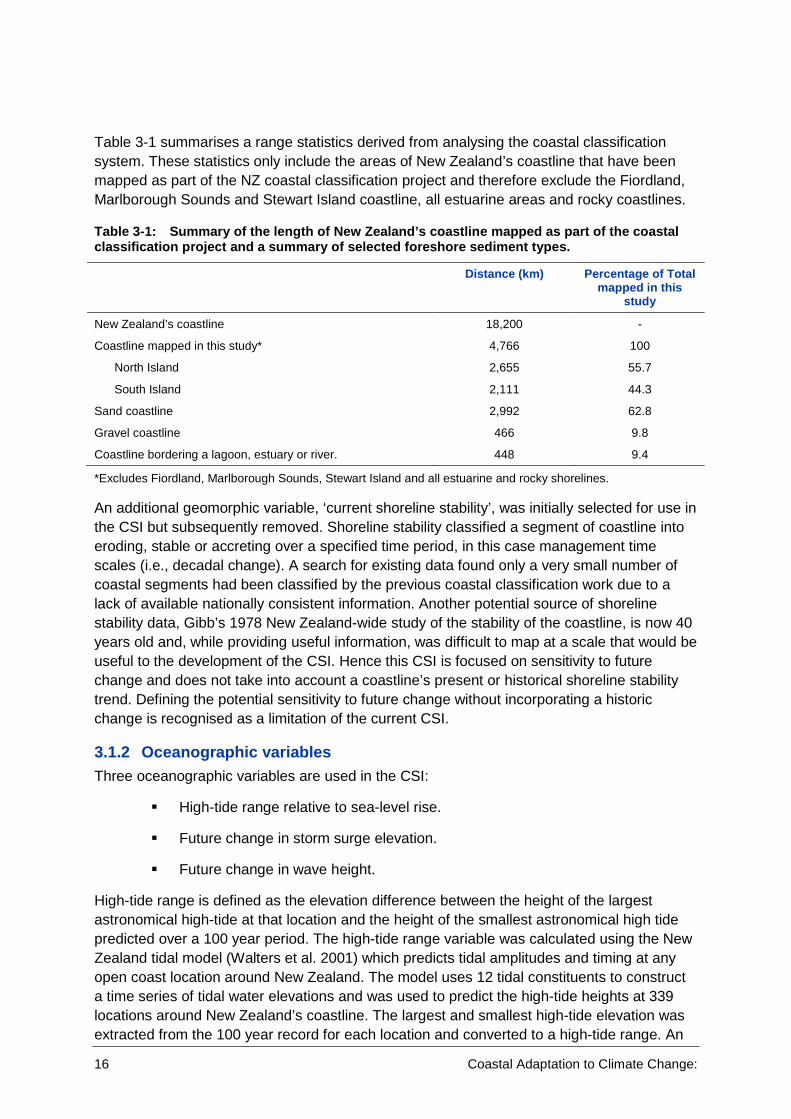
Table 3-1 summarises a range statistics derived from analysing the coastal classification system. These statistics only include the areas of New Zealand’s coastline that have been mapped as part of the NZ coastal classification project and therefore exclude the Fiordland, Marlborough Sounds and Stewart Island coastline, all estuarine areas and rocky coastlines.
Table 3-1: Summary of the length of New Zealand’s c oastline mapped as part of the coastal classification project and a summary of selected fo reshore sediment types.
Distance (km) Percentage of Total mapped in this
study
New Zealand’s coastline 18,200 -
Coastline mapped in this study* 4,766 100
North Island 2,655 55.7
South Island 2,111 44.3
Sand coastline 2,992 62.8
Gravel coastline 466 9.8
Coastline bordering a lagoon, estuary or river. 448 9.4
*Excludes Fiordland, Marlborough Sounds, Stewart Island and all estuarine and rocky shorelines.
An additional geomorphic variable, ‘current shoreline stability’, was initially selected for use in the CSI but subsequently removed. Shoreline stability classified a segment of coastline into eroding, stable or accreting over a specified time period, in this case management time scales (i.e., decadal change). A search for existing data found only a very small number of coastal segments had been classified by the previous coastal classification work due to a lack of available nationally consistent information. Another potential source of shoreline stability data, Gibb’s 1978 New Zealand-wide study of the stability of the coastline, is now 40 years old and, while providing useful information, was difficult to map at a scale that would be useful to the development of the CSI. Hence this CSI is focused on sensitivity to future change and does not take into account a coastline’s present or historical shoreline stability trend. Defining the potential sensitivity to future change without incorporating a historic change is recognised as a limitation of the current CSI.
3.1.2 Oceanographic variables Three oceanographic variables are used in the CSI:
� High-tide range relative to sea-level rise.
� Future change in storm surge elevation.
� Future change in wave height.
High-tide range is defined as the elevation difference between the height of the largest astronomical high-tide at that location and the height of the smallest astronomical high tide predicted over a 100 year period. The high-tide range variable was calculated using the New Zealand tidal model (Walters et al. 2001) which predicts tidal amplitudes and timing at any open coast location around New Zealand. The model uses 12 tidal constituents to construct a time series of tidal water elevations and was used to predict the high-tide heights at 339 locations around New Zealand’s coastline. The largest and smallest high-tide elevation was extracted from the 100 year record for each location and converted to a high-tide range. An
Mapping a New Zealand Coastal Sensitivity Index 17
indicative potential future sea-level rise (SLR) of 0.8 m was then divided by the high-tide range for each site. The 0.8 m sea-level rise by the 2090s is in line with current national guidance (MfE 2008). By including a nominated SLR it demonstrates how each location’s high-tide range would be affected by SLR as a result of climate change (Bell, 2010). Generally a shoreline will be more susceptible to erosion and inundation hazards (through higher frequency of events) if the local high-tide range is small relative to SLR.
Storm surge and wave height variables were derived from a wave and storm surge hind-cast and future-cast made recently for the New Zealand coast under NIWA's MBIE funded Wave And Storm surge Projections (WASP) project6. The project’s hind-cast was undertaken for a 30 year period (1970-2000) and the future-cast was based on climate change scenarios for a 30 year period at the end of this century (2070-2100).
To calculate a storm surge variable for the CSI the difference in elevation between the hind-cast and the future-cast storm surge climate was calculated at the 95%ile height (i.e., the top 5% of storm surges). This difference was then converted into a percentage change relative to the hind-cast (present-day) storm surge climate. This method was undertaken at 339 offshore sites around the New Zealand’s coastline. Section 3.2.1 describes how the percentage change at the 339 sites was applied to the CSI.
The wave height variable was calculated in a similar manner. The wave height variable refers to the difference in significant wave height between the present-day and future-cast climate change scenarios. The expected percentage change between present-day and future-cast in the 95%ile significant wave height for 339 locations around New Zealand’s coastline was calculated.
3.2 Building the CSI Separate CSI’s were developed for coastal inundation and coastal erosion using the same expert panel process to assign scores and weight the relative manner in which the geomorphic and oceanographic attributes are likely to be affected by climate change. For instance, will a gravel beach be relatively more sensitive to erosion than a sand beach with increased storminess accompanying climate change?
The steps in the process were:
1. Each of the four geomorphic variables’ attributes were scored on a scale 1-5 based on their sensitivity to climate change (5 being the most sensitive).
The oceanographic variables were also scored to a 1-5 index.
2. The seven variables were weighted on a scale of 6-30 based on their relative importance in contributing to sensitivity.
3. Each of the 1811 shoreline ‘segments’ was assigned a rating (1-5) for all seven variables based on the segment’s attributes.
4. A CSI score was produced for each segment by summing all seven ratings multiplied by their respective weightings.
6 http://wrenz.niwa.co.nz/webmodel/coastal and http://www.niwa.co.nz/our-science/coasts/research-projects/wasp

18 Coastal Adaptation to Climate Change:
5. The CSI’s were mapped and checked for consistency.
These steps are explained in more detail in the following sections.
3.2.1 Step 1: Scoring the attributes The geomorphic and oceanographic variables were defined in a number of raw formats including text, dimensionless indices and percentage changes (Table 3-2). To enable a single dimensionless CSI to be calculated it was necessary to convert the variables associated attributes into the same comparable format. This was achieved by converting each attribute to a 1-5 scale, where 5 is the most sensitive to future change and 1 is the least sensitive. Table 3-2 lists the variables, their raw formats and the modified scale used for the SCI.
Table 3-2: Variables used in the CSI and their asso ciated formats. The first four variables are geomorphic and last three are oceanographic.
Variable Format of attributes Number of attributes
Scaling for SCI
Hinterland characteristics text 7 1 -5 (0.1 intervals)
Foreshore sediment type text 11 1 -5 (0.1 intervals)
Coastal landform type text 25 1 -5 (0.1 intervals)
Exposure text 4 1 -5 (0.1 intervals)
High-tide range relative to SLR index (dimensionless) N/A 1 -5 (whole integers)
Future change in storm surge percentage N/A 1 -5 (whole integers)
Future change in wave height percentage N/A 1 -5 (whole integers)
For the geomorphic variables, each attribute was rated independently by a panel of five senior NIWA coastal scientists. Each attribute’s sensitivity was rated on a scale of 1-5 (five being the most sensitive) and the rating scaled relatively within each variable.
For high-tide range relative to sea-level rise the values were scaled to a new index from 1-5, where 5 (most sensitive) represented the lowest high tide range relative to SLR and 1 (least sensitive) represented the highest high-tide range relative to SLR with the values being linearly interpolated.
With a lower high-tide range, a rise in sea level would result in more tides exceeding a given present day elevation than would the same rise in sea level in an area with a more extensive high-tide range. Compounding this, with a low high-tide range, a storm surge event has a greater probability of coinciding with a high tide that would cause the resulting storm-tide to exceed a given present day elevation. Relating this back to our index, the underlying assumption is that an increase in the frequency/duration and magnitude of elevated water levels will increase the risk of shoreline inundation and instability and erosion. Using a lower high-tide range to represent a higher sensitivity is common practice for vulnerability indices (for examples refer to Table 2-1).
Wave height and storm surge percentage changes (Section 3.1.2) were linearly scaled to 1-5 where 5, the most sensitive, represented the greatest positive change or increase in storm surge and wave height and 1, the least sensitive, represented the smallest change. Several

Mapping a New Zealand Coastal Sensitivity Index 19
areas of coastline around New Zealand had a slight negative percentage change, which means that the model predicts a small decrease in wave height or storm surge. These negative values were included in the linear scaling.
The scoring was repeated twice, once for the inundation index and once for the coastal erosion index. The scoring of these attributes is shown in Appendix B.
3.2.2 Step 2: Weighting the variables The five panellists also weighted the seven variables according to their importance in determining a CSI. A scale of 1-5 was used where 1 is much less important and 5 is much more important. Each variable’s score was calculated by summing its total score over the other variables. As there were seven variables with each variable given a rating of 1 (least important) to 5 (most important) over the other six variables, the final weighting score could potentially range from 6 to 30. These scores were used as the weighting for each variable and did not undergo any rescaling.
The weighting was repeated twice, once for the inundation index and once for the coastal shoreline change index. On completion of the scoring and weighting, the results were collated and reviewed. Where discrepancies in approach or logic were apparent from this review, minor adjustments in the scores were made. This was mainly in cases where a score for an attribute varied significantly amongst the panel, usually on account of differences in expert knowledge on specific topics. Following these adjustments the final scores were taken as an average from across the five panellists. A list of the final ratings and weightings is provided in Appendix D.
3.2.3 Step 3: Defining coastline segments The four geomorphic variables were combined into a GIS shapefile made up of multiple line segments around the New Zealand shoreline, wherein each line segment represents a unique combination of the variables and their attributes. The resulting polyline was made up of 1811 line-segments. The segments begin or finish where any one of the four geomorphic variables changes, or where a soft shore abuts a rocky coast (rocky coastlines are not included in the CSI), or at a major river or estuary mouth. The oceanographic variables were then combined with the geomorphic variables by applying the nearest offshore prediction of high-tide range/SLR and changes in storm-surge and wave height predictions (made at 339 sites) to the nearest geomorphic line segment.
3.2.4 Step 4: Calculating the CSI A higher score for an attribute indicated a higher sensitivity than a lower score, and similarly a higher weighting for a variable indicated a higher sensitivity. The CSI was calculated by summing a shoreline segment’s score times its weighting across each variable as shown in Equation 3-1.Equation 3-1Equation 3-1: Formula used to calculate the Coastal Sensitivity Index. The formula was applied individually to the inundation and coastal erosion CSI’s using their respective scores and weightings.
��� =�A��
� .W�
���: coastal sensitivity index

20 Coastal Adaptation to Climate Change:
A: attribute score
W: variable weighting
�: variable
This calculation was repeated for both the inundation and the coastal erosion index. A worked example based on the coastal erosion index score for the northern section of Waihi Beach in the Bay of Plenty is provided in Table 3-3.
Table 3-3: Worked example for calculating the CSI f or coastal erosion for the northern section of Waihi Beach, Bay of Plenty.
Variable Attribute Attribute score (scale 1 – 5)
Variable weighting
Subtotal
Hinterland characteristics low plain dry 3.2 12.8 40.96
Foreshore sediment type Sand 3.6 18 64.8
Coastal landform type Foredune barrier 3 19.4 58.2
Exposure Exposed 2.8 17.6 49.28
High-tide range relative to SLR 0.714 (dimensionless) 3 17.8 53.4
Future change in storm surge -0.5 (%) 2 15.6 31.2
Future change in wave height 1.74 (%) 4 15.6 62.4
Total Score 313.4
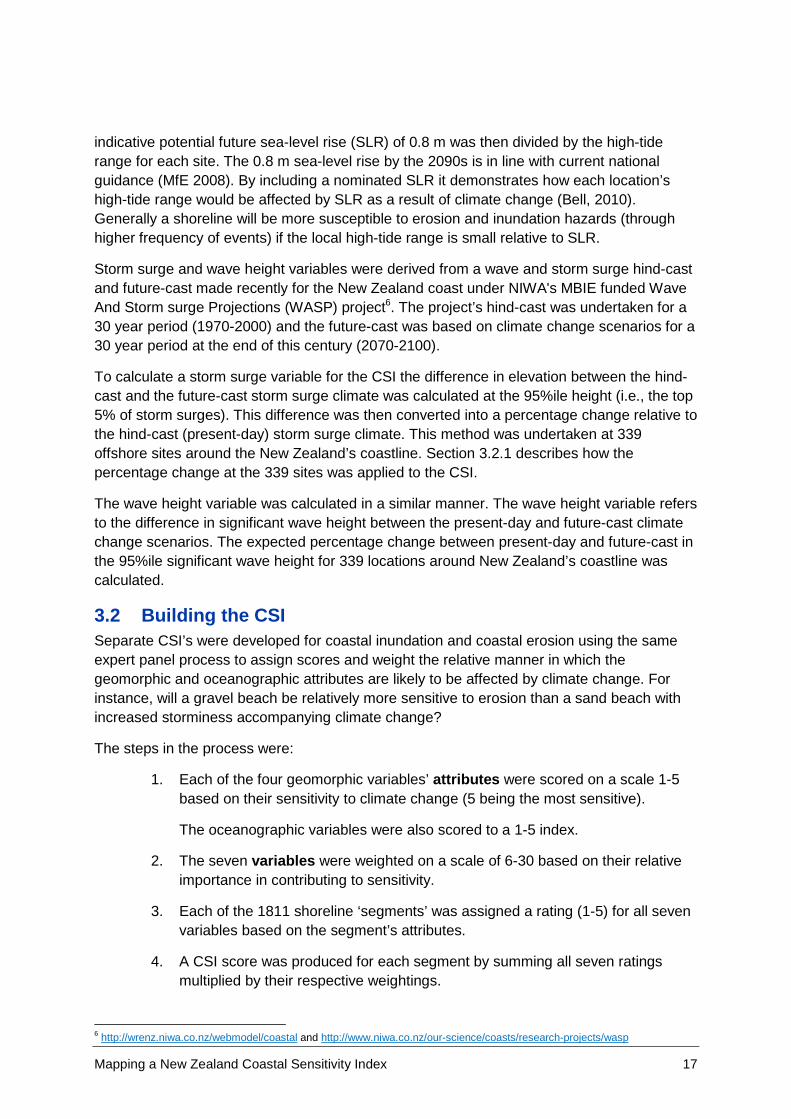
The inundation CSI scores ranged from 211 – 467 with a mean score of 322 while the coastal erosion CSI scores had a lower range (183-393) and a lower mean of 310. The distribution of the two indices is shown in Figure 3-2. As demonstrated in the worked example in Table 3-3, Waihi Beach’s calculated CSI is 313.4 which places it slightly above the mean CSI value for future coastal erosion (see Figure 3.2).
Mapping a New Zealand Coastal Sensitivity Index 21
Figure 3-2: Histogram of the CSI scores for the inu ndation and coastal erosion indices. The 12 bins in the histogram represent each of the coloured bins in the CSI maps. Red dashed line indicates the mean score.
3.2.5 Step 5: Mapping the CSI Equation 3-1 was applied to each coastal segment and the CSI score for all segments was distributed into 12 equal bins spanning the full range of CSI scores as demonstrated in Figure 3-2. The 12 bins were then assigned a graduated colour from blue to red, where blue had the lower scores, greens and yellows are moderate, and oranges and reds are higher. Both inundation and coastal erosion CSI’s were completed independently using this process.
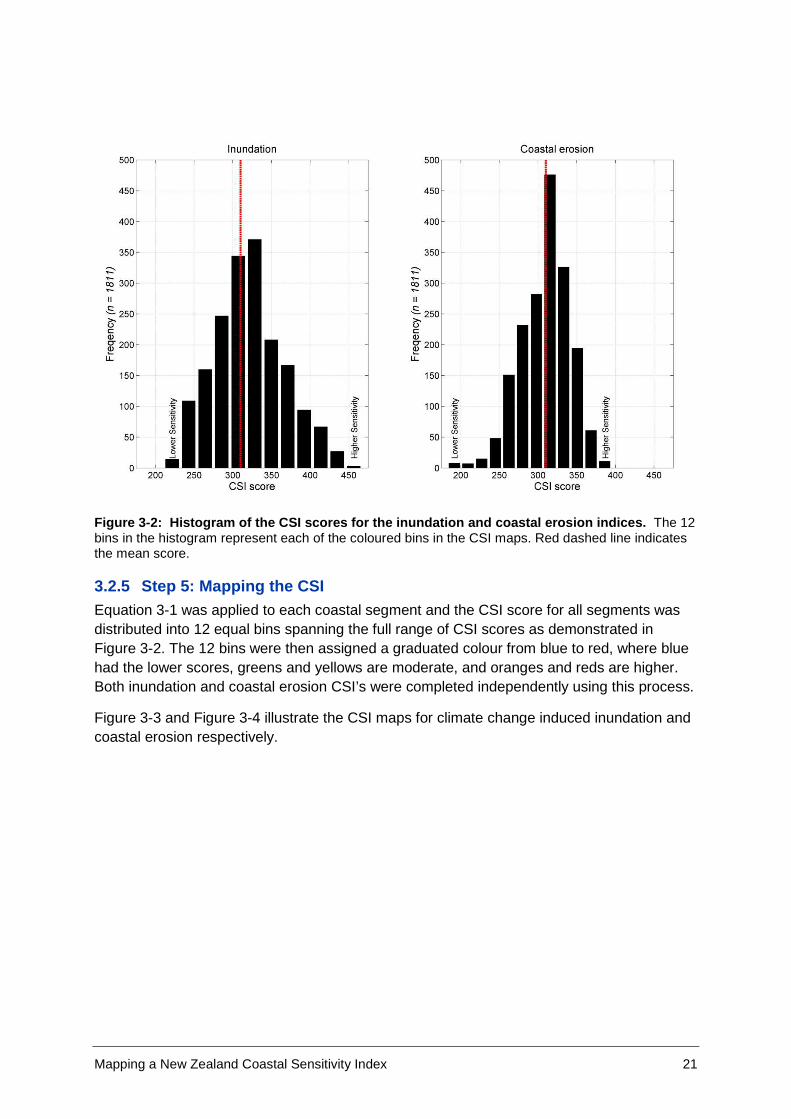
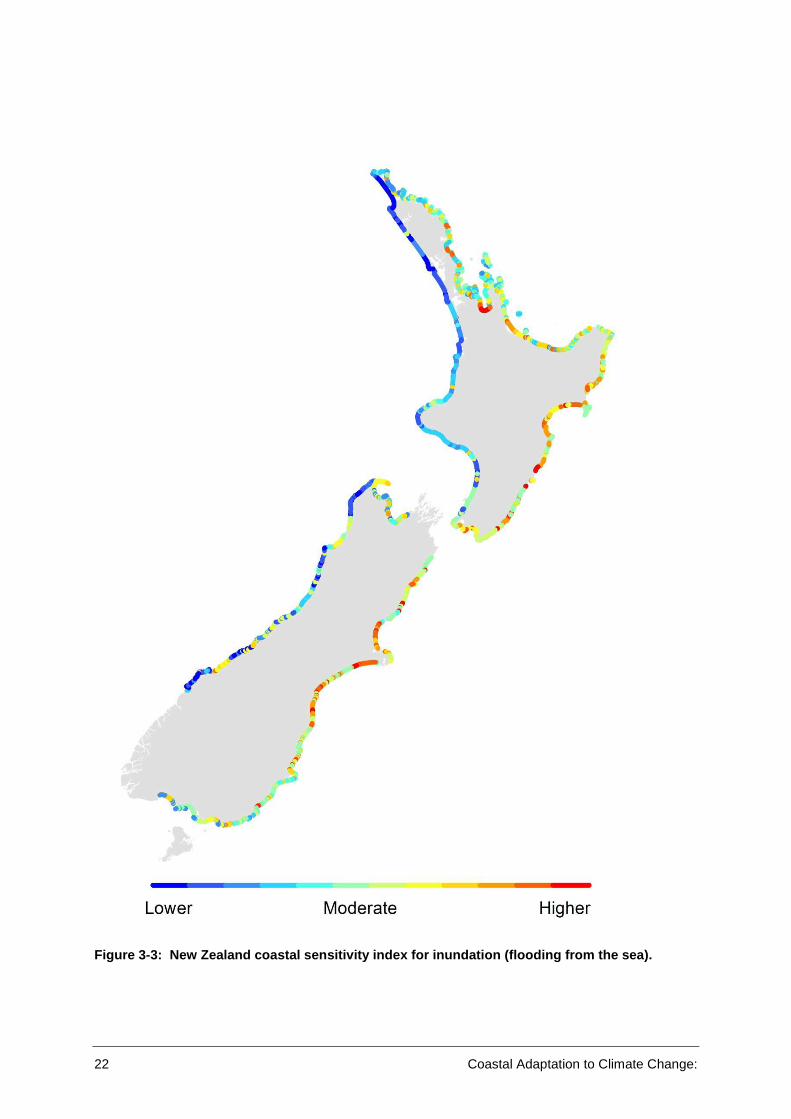
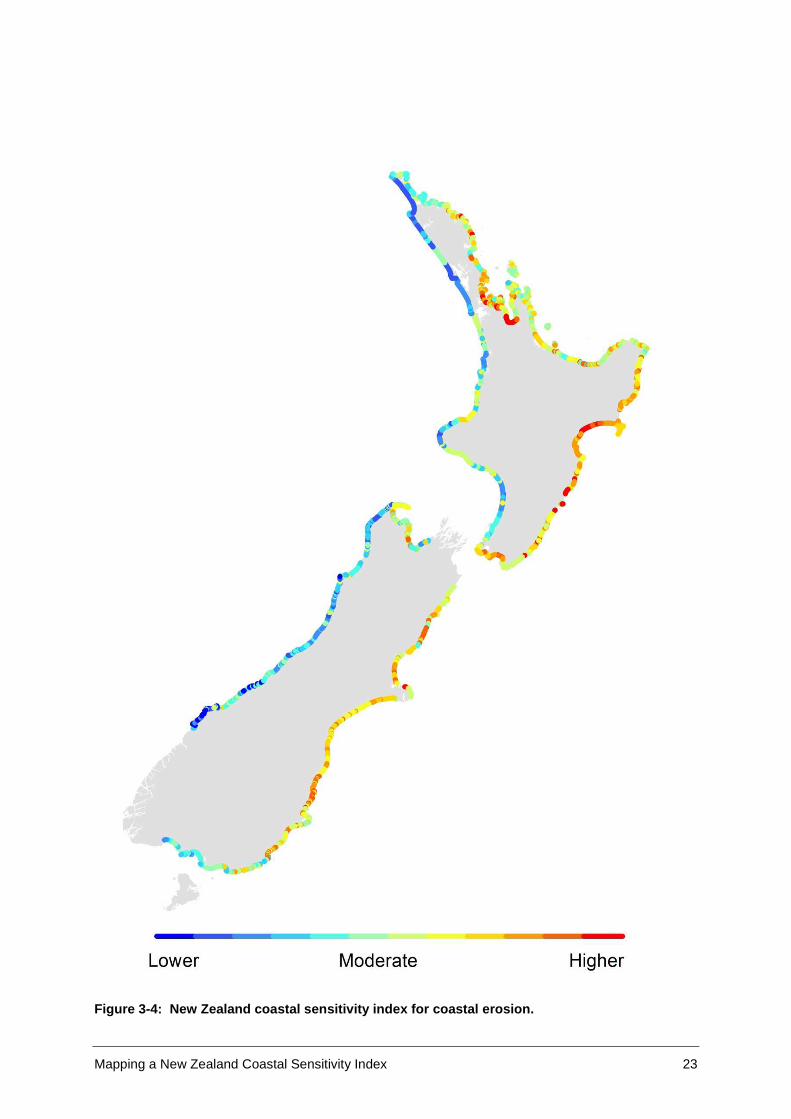
Figure 3-3 and Figure 3-4 illustrate the CSI maps for climate change induced inundation and coastal erosion respectively.
22 Coastal Adaptation to Climate Change:
Figure 3-3: New Zealand coastal sensitivity index f or inundation (flooding from the sea).
Mapping a New Zealand Coastal Sensitivity Index 23
Figure 3-4: New Zealand coastal sensitivity index f or coastal erosion.
Mapping a New Zealand Coastal Sensitivity Index 24
4 Discussion of methodology
4.1 Application of the CSI, limitations and assumpt ions The Coastal Sensitivity Index for New Zealand’s soft shore has been developed to assist identification of areas of coast which will be relatively more sensitive than others to potential impacts of climate change induced inundation and coastal erosion. The CSI is also intended to assist in raising the levels of political, resource management and community awareness and knowledge of coastal hazards and how they might alter with climate change.
Although every care has been taken to ensure the integrity of the information presented in this work, there are limitations to this tool which need to be understood.
The CSI is limited by the broad national scale of the mapping and therefore its application should be limited to providing a high level scoping and comparison of the relative (higher or lower) sensitivity to climate change of one part of the coast to another. Consequently, the CSI is not a substitute for independent professional advice on local (beach scale) hazard and risk assessments, and users of the CSI should obtain appropriate professional advice relevant to their particular circumstances. Furthermore, the CSI is not a map of present or historic inundation or erosion risk, nor does it provide an absolute measure of potential risk of future inundation or erosion under climate change.
Certain assumptions, by a small panel of coastal experts, have been made in developing the CSI as follows:
� The four geomorphic and three oceanographic variables and their associated attributes respond in a predictable and generic manner to effects of climate change induced coastal inundation and coastal erosion.
� The geomorphic variables will not change from one type to another as a consequence of climate change (at least on management/decadal time scales).
� When undertaking the scoring, each variable was treated as being independent with no interaction between variables. In reality, there can be strong relationships between variables for example, coastal landform type and foreshore sediment type.
4.2 Potential for development of the CSI tool There are a number of ways that the two CSIs developed in our study could be improved. These are outlined below.
4.2.1 Inclusion of a New Zealand-wide coastal stabi lity assessment It was discussed previously that the CSI for coastal erosion could be improved by incorporating information on present and/or historic ‘rates of coastal erosion/accretion’ if such metrics were available for the coast. Unfortunately the only New Zealand-wide information on the stability of the coastline is 40 years old (Gibb 1978) and because of its age and mapping scale we considered it unsuitable to use in the present CSI. Up-to-date mapping of the current and past rates of coastal erosion/accretion around New Zealand would benefit the CSI and also provide very valuable baseline information for other decision making. However

Mapping a New Zealand Coastal Sensitivity Index 25
this will require a concerted research and mapping effort to provide a consistent updated database which was beyond the resources of this current project.
4.2.2 Inclusion of socio-economic variables As described in Section 2 of this report, a number of coastal vulnerability studies have investigated using socio-economic parameters as well as physical ones. Boruff et al. (2005) developed a social vulnerability index (SVI) based on a principal components analysis of Census-derived social data. Other workers have investigated using issues around loss of land of certain types or value (e.g., urban vs agricultural, Snoussi et al. 2008; Sterr 2008), costs of coastal protection (e.g., Devoy 2008) and a community’s social vulnerability to natural hazards (Cutter et al. 2003). The review of these studies identified the following most commonly used parameters: population information such as age, income and race for social aspects, and infrastructure information such as intensity of land-use, land-use and associated value, or cost of protection of certain assets at the coast.
In the present study some consideration was initially given to using the New Zealand Deprivation Index (DVI) as a source of socio-economic information for development of a national scale vulnerability index. The DVI is an index of socio-economic deprivation based on the 2006 census mesh blocks from Statistics NZ and developed by the University of Otago and the New Zealand Ministry of Health (Salmond et al. 2007; White et al. 2007). It combines nine variables from the 2006 census into a deprivation score for each mesh block. Variables include: income, home ownership, family support, employment, qualifications, living space, communication and transport. The Index provides a graduated scale from 1 to 10, where 1 represents the areas with least deprived scores and 10 the most deprived scores regarding socio-economic deprivation. Our investigations suggest that there is potential to usefully incorporate DVI information into the CSI, although it’s not a trivial task and considerable thought would need to go into method development. For instance, the granularity and uniformity of the data is determined by the mesh block size that is highly variable in geographical extent between different coastal areas e.g., some coastal mesh blocks in rural areas can extend well inland. Another example of the potential issues is in coastal communities with a large percentage of holiday homes. These areas may have a lower DVI rating based on low incomes, employment and communications. In reality, these beach homes are second dwellings and the low score would not accurately reflect the community’s potential financial status.
4.2.3 Inclusion of more detailed mapping of beach u nits During this study, mapping of variables at a higher level of detail to build a regional CSI was also explored. The method incorporated additional variables to quantify social-economic aspects of sensitivity to climate change and also expanded on the physical parameters used in this study. Preliminary method development and mapping were trialled for stretches of the Northland, western Waikato and Coromandel Peninsula coastlines.
The proposed regional CSI used the geomorphic coastal classification database (refer Section 3.1.1) but in many cases expanded on the level of detail for these variables. For example, information on the type of headland at either end of the shoreline, the shoreline’s orientation, and the land and seaward slope of the shoreline was mapped. An expansion of the number of attributes for hinterland characteristics and coastal landform type could also
26 Coastal Adaptation to Climate Change:
be implemented, although we did not do this in our trial. Oceanographic variables used in the current national mapping would be included in the regional mapping.
For coastal landform type, the trialled regional mapping also differed from that undertaken in the national CSI. In the proposed regional mapping the coastal landform type has been split into two variables, the first variable defines its immediate feature (i.e., foredune barrier) and the second variable defines its wider setting (i.e., if it is part of a spit, tombolo, hapua or waituna). This split would allow a less restrictive weighting system for coastal landform type than that used in the national CSI.
In conjunction with the expansion and modification of the existing variables as described above, additional variables including both physical and ‘human’ variables were included. These variables are described below:
� Factors that can exacerbate coastal hazard impacts such as the presence of stream mouths, vehicle and pedestrian access, or storm water outfalls, and hazard reducers such as artificial beach nourishment, or beach control structures (groynes and seawalls).
� Land-use on the landward side of the shoreline up to the 20 metre contour or within 100 meters of the shoreline. This included allocation for roads, buildings, utilities (e.g., airports, railway lines) and type of land cover.
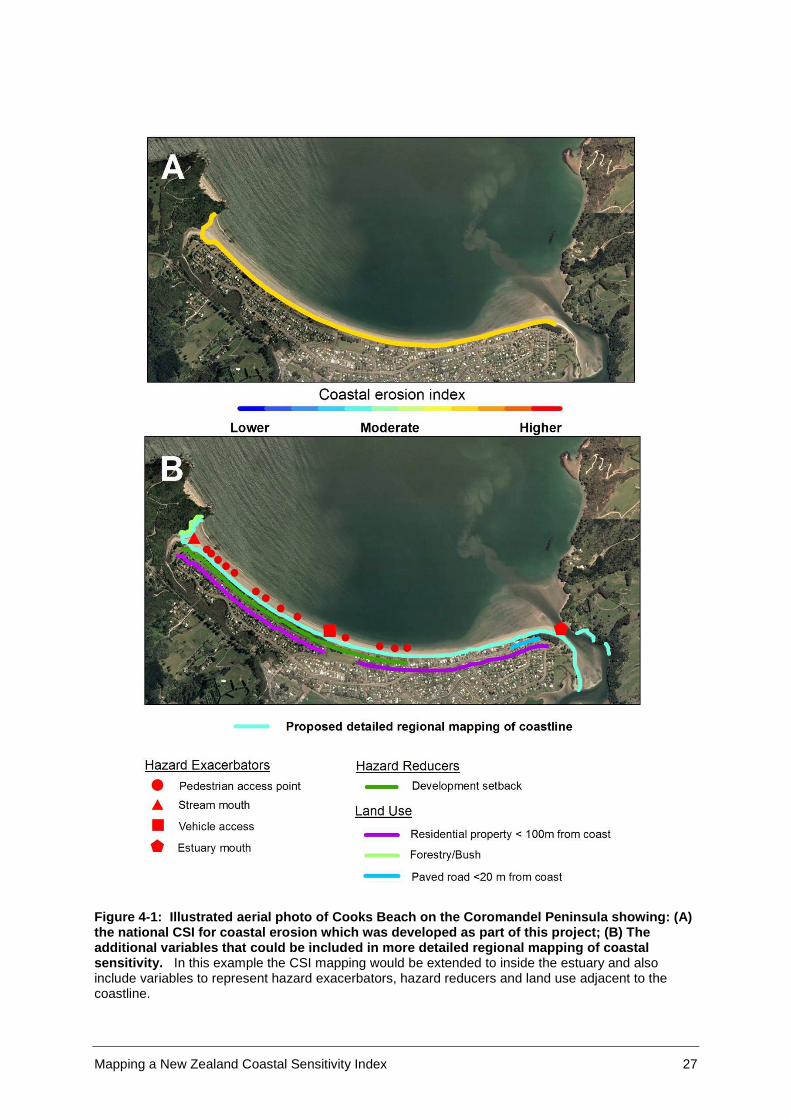
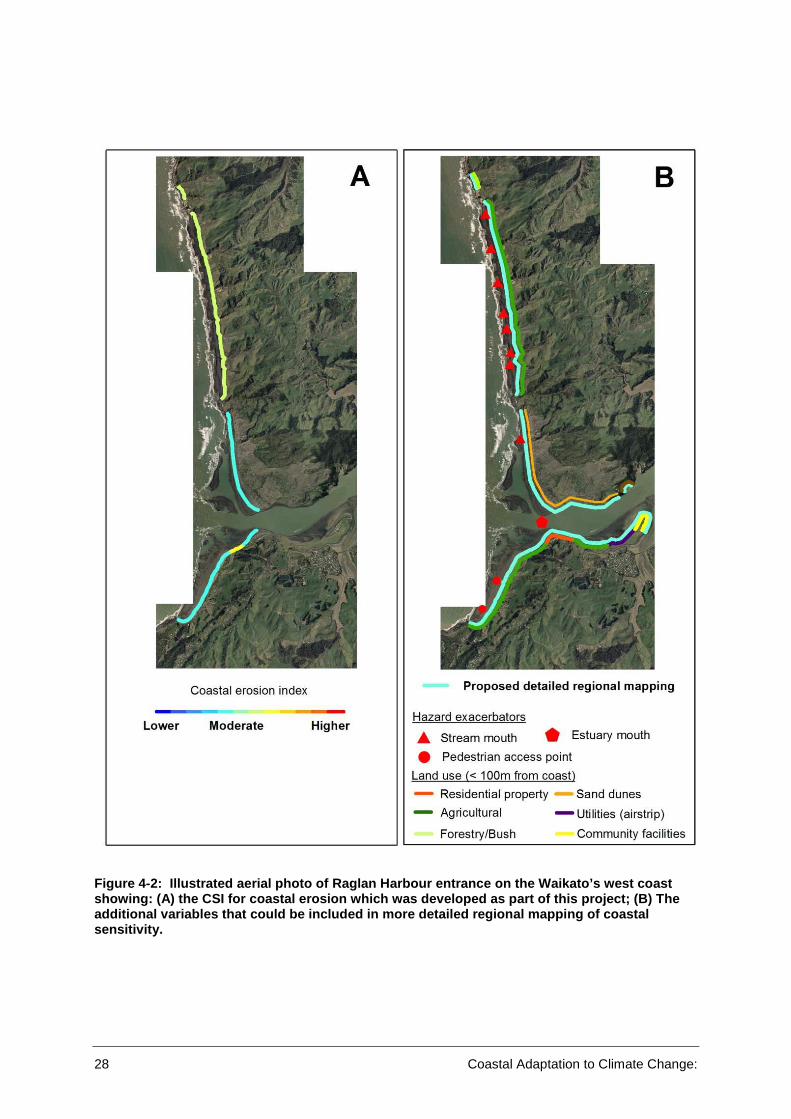
Figure 4-1 to 4-3 compare the current national CSI for coastal erosion to the proposed level of detail in the regional mapping for a section of coastline from the Coromandel Peninsula, Waikato and Northland respectively. While increasing the number of variables could result in a more accurate picture of coastal sensitivity, it would also require a more complex scoring and weighting system than used for our national CSI. It is envisaged that the regional CSIs would be calculated in a similar manner to the national CSI presented in this report. However, it would also include ‘human use’ weightings for the land use adjacent to the coast and a weighting factor relating to the trade-off between any present hazard exacerbators and hazard reducers.
Such a mapping and scoring scheme requires a high level of detailed information and local expertise which was beyond the available resources for the current project, but such an approach would be worth exploring further by councils seeking to form a fuller regional appreciation of coastal vulnerability. This might be carried out in areas where the national CSI has identified a relatively higher sensitivity to future coastal change and inundation. It is apparent in (B) of Figure 4-1 to 4-3 that any resulting sensitivity index calculated at this detailed scale would vary considerably within this one stretch of beach, which at a national scale ((A) of Figure 4-1 to 4-3) is not intended to be illustrated.
Mapping a New Zealand Coastal Sensitivity Index 27
Figure 4-1: Illustrated aerial photo of Cooks Beach on the Coromandel Peninsula showing: (A) the national CSI for coastal erosion which was deve loped as part of this project; (B) The additional variables that could be included in more detailed regional mapping of coastal sensitivity. In this example the CSI mapping would be extended to inside the estuary and also include variables to represent hazard exacerbators, hazard reducers and land use adjacent to the coastline.
28 Coastal Adaptation to Climate Change:
Figure 4-2: Illustrated aerial photo of Raglan Harb our entrance on the Waikato’s west coast showing: (A) the CSI for coastal erosion which was developed as part of this project; (B) The additional variables that could be included in more detailed regional mapping of coastal sensitivity.
Mapping a New Zealand Coastal Sensitivity Index 29
Figure 4-3: Illustrated aerial photo of Coppers Bea ch and Cable Bay in Doubtless Bay, Northland showing: (A) the CSI for coastal erosion which was developed as part of this project; (B) The additional variables that could be included in more detailed regional mapping of coastal sensitivity.
30 Coastal Adaptation to Climate Change:
5 Acknowledgements The authors would like to thank:
• Members of the CACC team who have contributed to this work, particularly Darcel Rickard who undertook early reviews of coastal vulnerability assessments.
• All those who contributed to the development of the original New Zealand Coastal Classification system.
Mapping a New Zealand Coastal Sensitivity Index 31
6 References Abuodha, P.; Woodroffe, C. (2006). International assessments of the vulnerability of
the coastal zone to climate change, including an Australian perspective, University of Wollongong. 69 p.
Abuodha, P.; Woodroffe, C. (2010). Assessing vulnerability to sea-level rise using a coastal sensitivity index: a case study from southeast Australia. Journal of Coastal Conservation 14: 189–205.
Bell, R.G. (2010). Tidal exceedances, storm tides and the effect of sea-level rise. Proceedings of 17th Congress of the Asia and Pacific Division of the IAHR, Auckland. 21-24.Boruff, B.J.; Emrich, C.; Cutter, S.L. (2005). Erosion hazard vulnerability of US coastal counties. Journal of Coastal Research 21(5): 932–942.
Boruff, B.J.; Emrich, C.; Cutter, S.L. (2005). Erosion hazard vulnerability of US coastal counties. Journal of Coastal research 21(5): 932–942.
Bryan, B.; Harvey, N.; Belperio, T.; Bourman, B. (2001). Distributed process modelling for regional assessment of coastal vulnerability to sea-level rise. Environmental Modelling and Assessment 6: 57–65.
Carter, R.W.G. (1990). The impact on Ireland of changes in mean sea level; programme of expert studies in climate change, No 2. Department of the Environment, Dublin, 128 p.
Clark, G.; Moser, S.; Ratick, S.; Dow, K.; Meyer, W.; Emani, S.; Jin, W.; Kasperson, J.; Kasperson, R.; Schwarz, H. (1998). Assessing the vulnerability of coastal communities to extreme storms: The case of Revere, MA., USA. Mitigation and Adaptation Strategies for Global Change 3: 59–82.
Cutter, S.L.; Boruff, B.J.; Shirley, W. (2003). Social vulnerability to environmental hazards. Social Science Quarterly 84(2): 242–261.
Devoy, R. (2008). Coastal vulnerability and the implications of sea-level rise for Ireland. Journal of Coastal research 24(2): 325–341.
Doukakis, E. (2005). Coastal vulnerability and risk parameters. European Water 11/12: 3–7.
Forbes, D.L.; Taylor, R.B.; Solomon, S.M.; Craymer, M.; Manson, G.K.; Dyke, A.S.; Hodgson, D.A. (2003). Crustal motion, climate change and coastal morphodynamics in the western Canadian Arctic. International Conference on Arctic margins, September 30-October 3, 2003, Geological Survey of Canada (Atlantic), Dartmouth, Nova Scotia, Canada, Abstract, p. 3.
Gibb, J. (1978). Rates of coastal erosion and accretion in New Zealand. New Zealand Journal of Marine and Freshwater Research 12(4): 429–56.
32 Coastal Adaptation to Climate Change:
Gibb, J.; Sheffield, A.; Foster, G. (1992). A Standardised Coastal Sensitivity Index Based on an Initial Framework for Physical Coastal Hazards Information. Science & Research Series No. 55. Department of Conservation
Gornitz, V. (1991). Global coastal hazards from future sea level rise. Palaeogeography, Palaeoclimatology. Palaeoecology 89: 379–398.
Gornitz, V.; Kanciruk, P. (1989). Assessment of global coastal hazards from sea-level rise. Proceedings of the 6th Symposium on Coastal and Ocean management, ASCE, July 11-14 1989, Charleston, SC.
Gornitz, V.; White, T.W.; Cushman, R.M. (1991). Vulnerability of the US to future sea level rise, Coastal Zone '91, Proceedings of the 7th Symposium on Coastal and Ocean Management, American Society of Civil Engineers, pp. 1345–1359.
Gray, W.M.; Klotzbach, P.J.; Landsea, C.W. (2003).Extended range forecast of Atlantic seasonal hurricane activity and US landfall strike probability for 2003. Fort Collins, Colarado State University, Department of Atmospheric Science, 21 p.
Hegde, A.V.; Reju, V.R. (2007). Development of coastal vulnerability index for Mangalore Coast, India. Journal of Coastal Research 23(5): 1106–1111.
Hughes, P.; Brundrit, G.B. (1992). An index to assess South Africa's vulnerability to sea-level rise. South African Journal of Science 88: 308–311.
Hume, T.; Snelder, T.; Weatherhead, M.; Liefting, R. (2007). A controlling factor approach to estuary classification. Journal of Ocean and Coastal Management 50(11–12): 905–929.
Kay, R.C.; Travers, A. (2008). Coastal Vulnerability and Adaptation Assessment: Compendium of Coastal Resources Tools & Methodologies. CZM Pty Ltd and the University of Wollangong, 35 p.
Kumar, T.S.; Mahendra, R.S.; Nayak, S.; Radhakrishnan, K.; Sahu, K.C. (2010). Coastal vulnerability assessment for Orissa State, east coast of India. Journal of Coastal Research 26(3): 523–534.
Meur-Férec, C.; Deboudt, P.; Morel, V. (2008). Coastal risks in France: An integrated method for evaluating vulnerability. Journal of Coastal Research 24(2B): 178–189.
MfE (2008). Coastal Hazards and Climate Change. A Guidance Manual for Local Government in New Zealand. 2nd edition. Revised by Ramsay, D. and Bell, R. (NIWA). Ministry for the Environment Report. VIII+127 p.
O’Brien, K.L.; Eriksen, S.; Nygaard, l.; Schjolden, A. (2007) Why different interpretations of Vulnerability matter in climate change discourses. Climate Policy 7: 73:88.
Mapping a New Zealand Coastal Sensitivity Index 33
Özyurt, G.; Ergin, A. (2010). Improving coastal vulnerability assessments to sea-level rise: a new indicator based methodology for decision makers. Journal of Coastal Research 26(2): 265–273.
Pendleton, E.A.; Thieler, E.R.; Williams, S.J. (2010). Importance of coastal change variables in determining vulnerability to sea- and lake-level change. Journal of Coastal Research 26(1): 176–183.
Pethick, J.; Crooks, S. (2000). Development of a coastal vulnerability index: a geomorphological perspective. Environmental Conservation 27: 359–367.
Salmond, C.; Crampton, P.; Atkinson, J. (2007). NZDep2006 Index of Deprivation. Department of Public Health, University of Otago, Wellington. Sourced online: http://www.wnmeds.ac.nz/NZDep-info.html
Shaw, J.; Taylor, R.B.; Forbes, D.L.; Ruz, M.; Solomon, S. (1998). Sensitivity of the coast of Canada to sea-level rise. Geological Survey of Canada Bulletin 505. p.
Snoussi, M.; Ouchani, T.; Niazi, S. (2008). Vulnerability assessment of the impact of sea-level rise and flooding on the Moroccan coast: The case of the Mediterranean eastern zone. Estuarine, Coastal and Shelf Science 77: 206–213.
Sterr, H. (2008). Assessment of vulnerability and adaptation to sea-level rise for the coastal zone of Germany. Journal of Coastal Research 24(2): 380–393.
Thieler, E.R.; Hammar-Klose, E.S. (1999). National Assessment of Coastal Vulnerability to Future Sea-Level Rise: Preliminary Results for the U.S. Atlantic Coast. U.S. Geological Survey, Open-File Report 99-593, 1 sheet. Sourced online at: http://pubs.usgs.gov/of/of99-593/
Thieler, E.R.; Hammar-Klose, E.S. (2000). National Assessment of Coastal Vulnerability to Future Sea-Level Rise: Preliminary Results for the U.S. Atlantic Coast. U.S. Geological Survey, Open File Report, pp. 99–593.
UNFCCC (2008). UNFCCC Resource Guide for preparing the National Communications of Non-Annex 1 parties, Module 2: Vulnerability and adaptation to climate change. UNFCCC, 31 p.
Walters, R.A.; Goring, D.G.; Bell, R.G. (2001). Ocean tides around New Zealand. New Zealand Journal of Marine & Freshwater Research 35: 567–779.
White, P.; Gunston, J.; Salmond, C.; Atkinson, J.; Crampton, P. (2008). Atlas of Socioeconomic Deprivation in New Zealand NZDep2006. Public Health Intelligence Occasional Bulletin No. 50, Ministry of Health, Wellington. Sourced online at: http://www.moh.govt.nz/moh.nsf/indexmh/dhb-maps-and-background-information-atlas-of-socioeconomic-deprivation-in-nz-nzdep2006.
Wu, S.; Yarnal, B.; Fisher, A. (2002). Vulnerability of coastal communities to sea-level rise: a case study of Cape May County, New Jersey, USA. Climate Research 22: 255–270.
34 Coastal Adaptation to Climate Change:
Yamada, K.; Nunn, P.D.; Mimura, N.; Machida, S.; Yamamoto, M. (1995). Methodology for the assessment of vulnerability of South Pacific island countries to sea-level rise and climate change. Journal of Global Environmental Engineering 1: 101–125.
Mapping a New Zealand Coastal Sensitivity Index 35
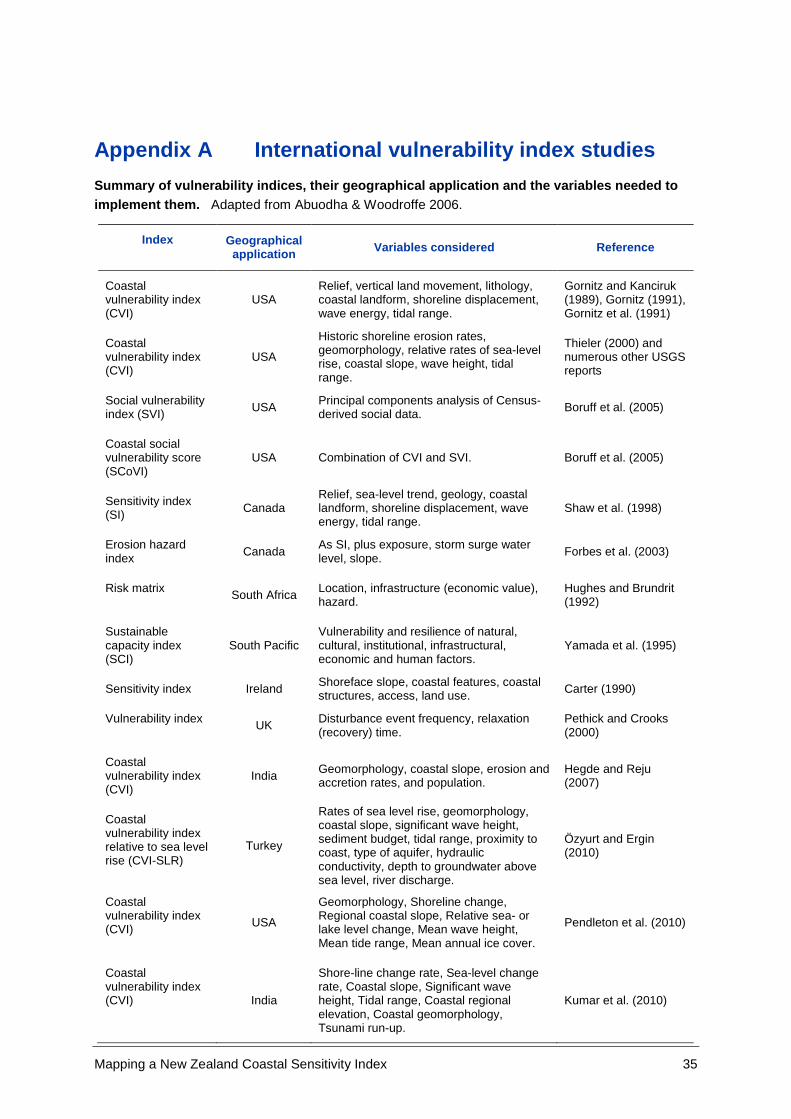
Appendix A International vulnerability index studie s
Summary of vulnerability indices, their geographica l application and the variables needed to implement them. Adapted from Abuodha & Woodroffe 2006.
Index Geographical application Variables considered Reference
Coastal vulnerability index (CVI)
USA Relief, vertical land movement, lithology, coastal landform, shoreline displacement, wave energy, tidal range.
Gornitz and Kanciruk (1989), Gornitz (1991), Gornitz et al. (1991)
Coastal vulnerability index (CVI)
USA
Historic shoreline erosion rates, geomorphology, relative rates of sea-level rise, coastal slope, wave height, tidal range.
Thieler (2000) and numerous other USGS reports
Social vulnerability index (SVI) USA Principal components analysis of Census-
derived social data. Boruff et al. (2005)
Coastal social vulnerability score (SCoVI)
USA Combination of CVI and SVI. Boruff et al. (2005)
Sensitivity index (SI) Canada
Relief, sea-level trend, geology, coastal landform, shoreline displacement, wave energy, tidal range.
Shaw et al. (1998)
Erosion hazard index Canada
As SI, plus exposure, storm surge water level, slope. Forbes et al. (2003)
Risk matrix South Africa Location, infrastructure (economic value), hazard.
Hughes and Brundrit (1992)
Sustainable capacity index (SCI)
South Pacific Vulnerability and resilience of natural, cultural, institutional, infrastructural, economic and human factors.
Yamada et al. (1995)
Sensitivity index Ireland Shoreface slope, coastal features, coastal structures, access, land use. Carter (1990)
Vulnerability index UK Disturbance event frequency, relaxation (recovery) time.
Pethick and Crooks (2000)
Coastal vulnerability index (CVI)
India Geomorphology, coastal slope, erosion and accretion rates, and population.
Hegde and Reju (2007)
Coastal vulnerability index relative to sea level rise (CVI-SLR)
Turkey
Rates of sea level rise, geomorphology, coastal slope, significant wave height, sediment budget, tidal range, proximity to coast, type of aquifer, hydraulic conductivity, depth to groundwater above sea level, river discharge.
Özyurt and Ergin (2010)
Coastal vulnerability index (CVI) USA
Geomorphology, Shoreline change, Regional coastal slope, Relative sea- or lake level change, Mean wave height, Mean tide range, Mean annual ice cover.
Pendleton et al. (2010)
Coastal vulnerability index (CVI) India
Shore-line change rate, Sea-level change rate, Coastal slope, Significant wave height, Tidal range, Coastal regional elevation, Coastal geomorphology, Tsunami run-up.
Kumar et al. (2010)
36 Coastal Adaptation to Climate Change:
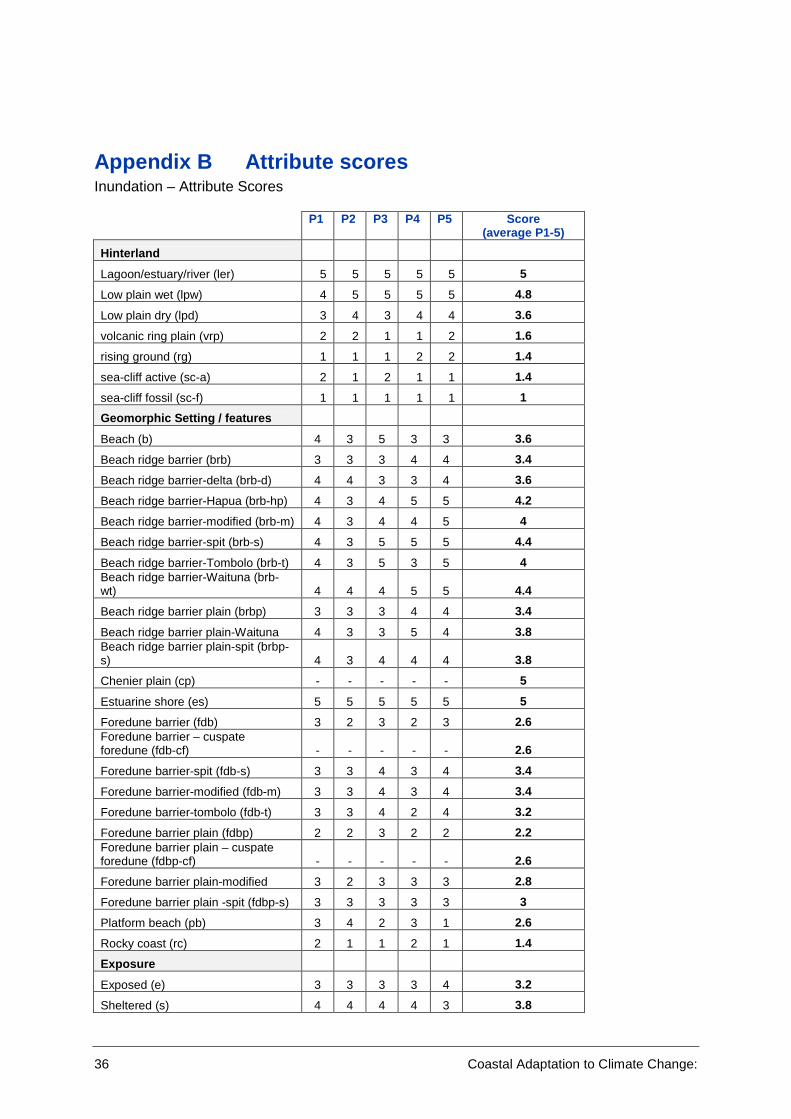
Appendix B Attribute scores Inundation – Attribute Scores
P1 P2 P3 P4 P5 Score (average P1-5)
Hinterland
Lagoon/estuary/river (ler) 5 5 5 5 5 5
Low plain wet (lpw) 4 5 5 5 5 4.8
Low plain dry (lpd) 3 4 3 4 4 3.6
volcanic ring plain (vrp) 2 2 1 1 2 1.6
rising ground (rg) 1 1 1 2 2 1.4
sea-cliff active (sc-a) 2 1 2 1 1 1.4
sea-cliff fossil (sc-f) 1 1 1 1 1 1
Geomorphic Setting / features
Beach (b) 4 3 5 3 3 3.6
Beach ridge barrier (brb) 3 3 3 4 4 3.4
Beach ridge barrier-delta (brb-d) 4 4 3 3 4 3.6
Beach ridge barrier-Hapua (brb-hp) 4 3 4 5 5 4.2
Beach ridge barrier-modified (brb-m) 4 3 4 4 5 4
Beach ridge barrier-spit (brb-s) 4 3 5 5 5 4.4
Beach ridge barrier-Tombolo (brb-t) 4 3 5 3 5 4 Beach ridge barrier-Waituna (brb-wt) 4 4 4 5 5 4.4
Beach ridge barrier plain (brbp) 3 3 3 4 4 3.4
Beach ridge barrier plain-Waituna 4 3 3 5 4 3.8 Beach ridge barrier plain-spit (brbp-s) 4 3 4 4 4 3.8
Chenier plain (cp) - - - - - 5
Estuarine shore (es) 5 5 5 5 5 5
Foredune barrier (fdb) 3 2 3 2 3 2.6 Foredune barrier – cuspate foredune (fdb-cf) - - - - - 2.6
Foredune barrier-spit (fdb-s) 3 3 4 3 4 3.4
Foredune barrier-modified (fdb-m) 3 3 4 3 4 3.4
Foredune barrier-tombolo (fdb-t) 3 3 4 2 4 3.2
Foredune barrier plain (fdbp) 2 2 3 2 2 2.2 Foredune barrier plain – cuspate foredune (fdbp-cf) - - - - - 2.6
Foredune barrier plain-modified 3 2 3 3 3 2.8
Foredune barrier plain -spit (fdbp-s) 3 3 3 3 3 3
Platform beach (pb) 3 4 2 3 1 2.6
Rocky coast (rc) 2 1 1 2 1 1.4
Exposure
Exposed (e) 3 3 3 3 4 3.2
Sheltered (s) 4 4 4 4 3 3.8

Mapping a New Zealand Coastal Sensitivity Index 37
P1 P2 P3 P4 P5 Score (average P1-5)
Sheltered - Pocket Beach (s-pb) 4 4 3 3 3 3.4
Exposed - Pocket Beach (e-pb) 3 3 3 3 4 3.2
Sediment
Boulder (b) 1 1 2 2 2 1.6
Boulder/cobble (bc) 1 1 2 2 2 1.6 Boulders/cobbles/ mixed sand gravels (bcmsg) 1 1 2 2 2 1.6
Boulders/cobbles/sand (bcs) 1 1 2 2 2 1.6
Gravel (g) 2 1 3 3 4 2.6
Gravel upper/sand lower (gusl) 2 2 3 3 4 2.8
Mud (m) 4 5 5 4 5 4.6
Mixed sand gravel (msg) 3 3 3 3 4 3.2
Sand (s) 3 3 3 3 4 3.2
Sand/mud (sm) 4 3 5 3 4 3.8
Sand/shell (ssh) 3 2 4 3 4 3.2
P1-5 = panellist 1-5
Coastal erosion – Attribute Scores
P1 P2 P3 P4 P5 Score
(average P1-5)
Hinterland
Lagoon/estuary/river (ler) 5 4 5 4 5 4.6
Low plain wet (lpw) 3 4 4 3 5 3.8
Low plain dry (lpd) 3 3 3 3 4 3.2
Volcanic ring plain (vrp) 1 3 1 4 3 2.4
Rising ground (rg) 1 1 2 3 2 1.8
Sea-cliff active (sc-a) 4 3 2 3 2 2.8
Sea-cliff fossil (sc-f) 1 1 1 1 1 1
Geomorphic Setting/features
Beach (b) 5 5 5 4 5 4.8
Beach ridge barrier (brb) 3 3 3 4 4 3.4
Beach ridge barrier-delta (brb-d) 4 3 3 3 3 3.2
Beach ridge barrier-Hapua (brb-hp) 4 4 2 5 4 3.8
Beach ridge barrier-modified (brb-m) 4 3 3 4 5 3.8
Beach ridge barrier-spit (brb-s) 4 4 4 5 5 4.4
Beach ridge barrier-Tombolo (brb-t) 4 2 4 3 5 3.6 Beach ridge barrier-Waituna (brb-wt) 4 4 3 5 5 4.2
Beach ridge barrier plain (brbp) 3 2 2 3 4 2.8 Beach ridge barrier plain-Waituna (brbp-wt) 3 2 3 5 4 3.4 Beach ridge barrier plain-spit (brbp-s) 3 3 3 4 4 3.4

38 Coastal Adaptation to Climate Change:
P1 P2 P3 P4 P5 Score (average P1-5)
Chenier plain (cp) - - - - - 4
Estuarine shore (es) 3 4 5 5 5 4.4
Foredune barrier (fdb) 2 3 4 4 2 3 Foredune barrier – cuspate foreland (fdb-cf) - - - - - 2.9
Foredune barrier-spit (fdb-s) 3 4 5 5 4 4.2
Foredune barrier-modified (fdb-m) 3 4 5 4 4 4
Foredune barrier-tombolo (fdb-t) 3 3 4 3 4 3.4
Foredune barrier plain (fdbp) 2 2 4 3 3 2.8 Foredune barrier plain – cuspate foredune (fdbp-cf) - - - - - 2.9 Foredune barrier plain-modified (fdbp-m) 3 2 4 4 3 3.2
Foredune barrier plain -spit (fdbp-s) 3 3 4 4 3 3.4
Platform beach (pb) 4 4 2 3 4 3.4
Rocky coast (rc) 1 1 1 1 1 1
Exposure
Exposed (e) 3 2 3 3 3 2.8
Sheltered (s) 4 4 4 4 4 4.0
Sheltered - pocket beach (s-pb) 4 5 4 3 5 4.2
Exposed - pocket beach (e-pb) 3 2 3 3 4 3.0
Sediment
Boulder (b) 1 1 1 2 1 1.2
Boulder/cobble (bc) 2 1 2 2 2 1.8 Boulders/cobbles mixed sand gravels (bcmsg) 2 2 3 2 3 2.4
Boulders/cobbles/sand (bcs) 2 2 3 2 3 2.4
Gravel (g) 3 3 3 3 4 3.2
Gravel upper/sand lower (gusl) 3 3 3 3 4 3.2
Mud (m) 5 4 5 3 4 4.2
Mixed sand gravel (msg) 3 3 3 3 4 3.2
Sand (s) 4 3 4 3 4 3.6
Sand/mud (sm) 5 3 5 4 5 4.4
Sand/shell (ssh) 4 4 5 4 5 4.4
P1-5 = panellist 1-5
Mapping a New Zealand Coastal Sensitivity Index 39
Appendix C Variable and attribute definitions
Beach: A deposit of sand that consists of a narrow backshore and foreshore (the part of the beach affected/largely built by waves) in front of a sea cliff or man-made structure such as a seawall. The deposit of sand is often thin and sits on a rocky wave cut shore platform, with the rock outcropping in the low tide and/or shallow intertidal area. Occur in locations of low sediment supply and/or where there is limited accommodation space for a dune to form because of the backing cliffs and wave reflection off the cliffs at high tides and storms do not permit sediment to accumulate.
Beach ridge barrier: A single low, essentially continuous mound or ridge of beach material predominantly built by the action of waves (swash) on the backshore of a beach, and occurring singly or as one of a series of approximately parallel deposits. The barrier is generally composed of coarse sandy, pebbly, cobbley and/or shelly material.
Beach ridge barrier plain: A sequence of (relict) ridges separated from the shoreline by progradation representing successive positions of an advancing shoreline (also called a strandplain ).
Boulders: Rock fragments with grain size of usually no less than 256 mm (10 inches) diameter, which makes it larger than a cobble.
Chenier plain: An accretionary feature consisting of a long, low lying, narrow strip of gravely sand (typically up to 3 m high and 40 to 400 m wide), often shelly, deposited in the form of a wave-built beach ridge on a swampy, deltaic, or alluvial coastal plain of fine sediment.
Coastal erosion: The wearing away of land and the removal of beach or dune sediments by wave action, tidal currents, wave currents, or drainage. Coastal accretion is the process of coastal sediment returning to the visible portion of a beach or foreshore to raise the level of the beach and make it wider.
Cobble: Rock fragment with grain size of between 64 and 256 mm in diameter, which makes it smaller than a boulder. Cobbles have often been naturally rounded.
Cuspate foreland: An accretionary feature consisting of a triangular accumulation of sand or shingle projecting seawards from the shoreline. It can have straight or concave shores and multiple beach ridges marking stages in progradation.
Delta: An alluvial deposit, usually triangular in planform, at the mouth of a river or stream. It is normally built up only where there is no tidal or current action capable of removing the sediment as fast as it is deposited, and hence the delta builds seaward.
Estuarine coast: A shoreline inside an estuary. Estuary: A partially enclosed coastal body of water that is either permanently or periodically open to the sea in which the aquatic ecosystem is affected by the physical and chemical characteristics of both runoff from the land and inflow from the sea.
Exposed coast: A shoreline that faces the open sea and is subject to ocean swell.

40 Coastal Adaptation to Climate Change:
Exposure: The degree to which the shoreline is exposed to wave and swell energy and is classified as either sheltered, exposed, sheltered pocket beach or exposed pocket beach.
Foredune barrier: Shore-parallel dune ridges formed on the top of the backshore by wind and sand deposition within vegetation. Actively forming foredunes occupy a foremost seaward position in a dune system. Foredunes generally fall into two main types, incipient or established foredunes, within which there can be wide morphological and ecological variations. Also known as foredunes.
Foredune barrier plains: Systematic beach progradation over time frames of 10s to 1000s of years may lead to the development of wide foredune plains. Such plains may also develop during sea level regression and during sea level transgression as long as there is a significant sediment supply.
Foreshore sediment type: The type of sediment and grain size of material making up the beach such as gravel, sand and mud.
Coastal landform type: The different geomorphological components that occur along the shore such as beach ridges, foredune barriers, deltas, spits and tombolos.
Gravel: Unconsolidated sediment of particle sizes that includes granule 2 to 4 mm, pebbles 4 to 64 mm and cobbles 64 to 256 mm, and boulders >264 mm particle sizes.
Hapua: An elongated lagoon separated from the sea by a narrow barrier and situated at the mouth of large rivers that are usually braided. They form on mixed sand/gravel coasts, where the hinterland is a steep alluvial fan and are indicative of a coast being continually reshaped, by wave- and river-dominated processes (waves being most important).
Hinterland: The nature of the hinterland with respect to its geomorphology and topography such as lagoons, plains, rising ground and sea cliffs. This is mainly for the purpose of making assessments of coastal inundation.
Incipient barrier beach: A deposit of sand that consists of a backshore and foreshore and a low incipient dune (sand) or beach ridge (gravel) (generally less than 1 m in height), in front of rising ground. Compared to a ‘beach’ they occur in areas of greater sediment supply and therefore the nearshore is mostly sandy with some rock outcrops.
Lagoon: A shallow, often elongated body of water separated from a larger body of water by a sand or gravel barrier or similar feature, and generally have some degree of salinity. There is an overlap between bodies of water classified as coastal lagoons and bodies of water classified as estuaries
Lagoon/estuary/river: The area behind the beach is a lagoon, estuary or river.
Low lying plain – Dry: The land backing the beach is very low lying (near or below sea level) but is dry.
Low lying plain – Wet The land backing the beach is very low lying (near or below sea level) where water saturation is the dominant factor determining the nature of soil development and the types of plant and animal communities living in the surrounding environment. These areas may commonly be referred to as wetlands, bogs, swamps and marshes.
Mapping a New Zealand Coastal Sensitivity Index 41
Mixed sand/gravel beach: Consists of: (1) poorly sorted mixtures of sandy and gravelly sediment, or alternatively (2) there is a clear distinction between the textural type between the upper (usually gravel) and lower foreshore (usually sand).
Mud: A sticky fine-grained material comprised of unconsolidated sediment of particle sizes that includes silt 0.063 to 0.004 mm and clay <0.063 mm.
Modified: Has undergone human modification. For example flattened/raised dunes for roading/buildings or structures have been erected to reduce erosion (seawall).
Pocket beach: Small beach (in length) between two headlands that generally experience no or little sediment connection adjacent beaches (if present).
Rising ground: The land backing the beach is land that is rising inland. In terms of its topography it is somewhere between low lying land and a cliff.
River mouth: Location where a river emerges on the coast.
Rocky coast: Resistant to erosion at management timescales.
Sand: Rock fragments with grain size of 0.062 to 2.0 mm.
Sea cliff – Active: The area backing the beach is a sea cliff comprising hard rock that is actively being eroded.
Sea cliff – Fossil: The area backing the beach is a sea cliff comprising hard rock that is not actively eroding.
Sheltered coast: A shoreline inside an estuary or embayment that is sheltered from the open sea and ocean swell.
Spit: An accretionary feature formed by waves, consisting of a long narrow accumulation of sand or shingle, lying generally in line with the coast, with one end attached to the land the other projecting into the sea or across the mouth of an estuary.
Storm Surge: Storm surge is the response of the ocean to changing atmospheric pressure and wind. In New Zealand, changing atmospheric pressure is the dominant cause of storm surge, but adverse winds can cause additional set-up in sea level.
Tides: The periodic variation in the surface level of the oceans and of bays, gulfs, inlets, and estuaries, caused by gravitational attraction of the moon and sun. King tide is a popular term used to refer to an especially high tide. They are simply the very highest tides. Conversely, the low tides that occur at this time are the very lowest tides. They are naturally occurring, predictable events.
Tombolo: An accretionary feature comprising sand or gravel beach sediment developed by wave refraction, diffraction and longshore drift to form a 'neck' of land connecting a coast to an offshore island or breakwater.
Volcanic ring plain: The area immediately surrounding the volcano, but not including the constructional edifice itself. Lithofacies of the ring plain are dominated by fall tephra and by the tephra that has been rapidly reworked from the cone. Interbedded with fall tephra are the
42 Coastal Adaptation to Climate Change:
fluvial and laharic deposits, which may form the distal edges of wedge-like fans of debris from the lower cone slopes or may be concentrated along well-established drainage channels through the ring plain. The distal edges of the most extensive of flows (lava and pyroclastic) from the cone may also reach as far as the ring plain.
Waituna: A type of estuary and similar to a hapua but has a wider brackish lagoon separated from the sea by a narrow barrier and located at the mouth of smaller rivers. They form on mixed sand/gravel coasts, where the hinterland is a steep alluvial fan and are indicative of a coast being continually reshaped, by wave- and river-dominated processes (waves being most important).
Significant wave height: The mean wave height (trough to crest) of the highest third of the waves.
Shell: A composite of the discarded calcium carbonate shells of animals such as gastropods and clams that lived in the seabed.
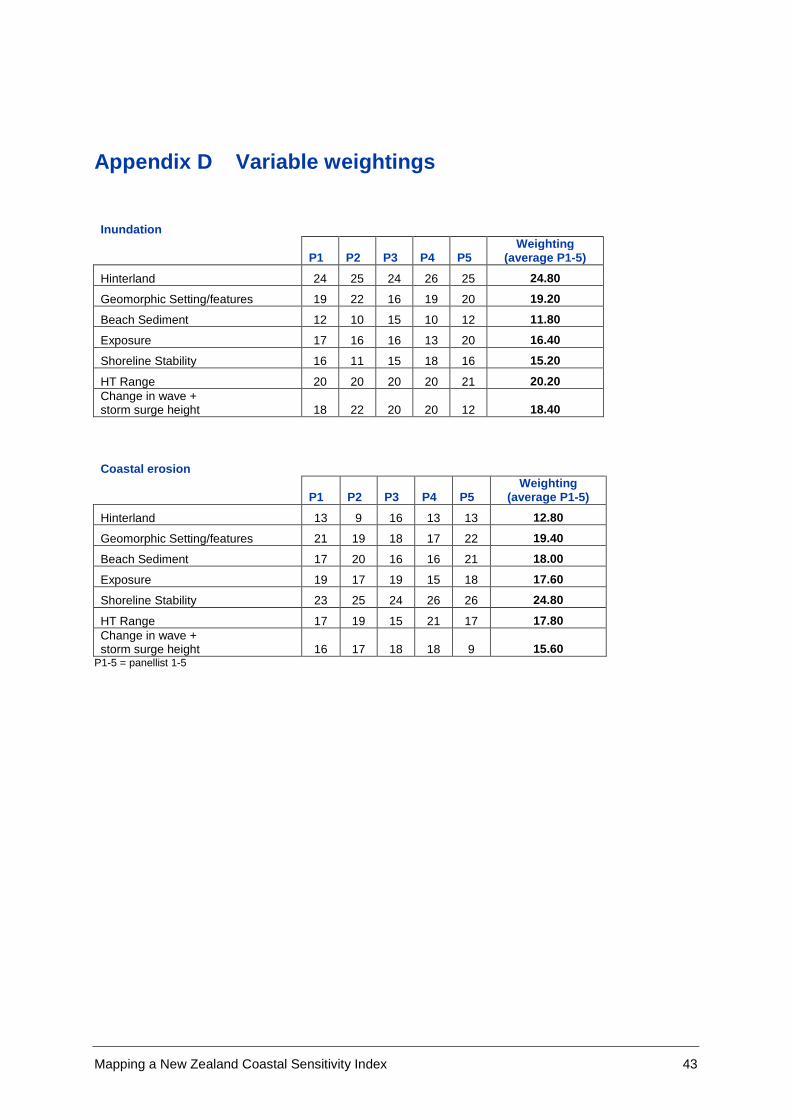
Mapping a New Zealand Coastal Sensitivity Index 43
Appendix D Variable weightings
Inundation
P1 P2 P3 P4 P5
Weighting (average P1-5)
Hinterland 24 25 24 26 25 24.80
Geomorphic Setting/features 19 22 16 19 20 19.20
Beach Sediment 12 10 15 10 12 11.80
Exposure 17 16 16 13 20 16.40
Shoreline Stability 16 11 15 18 16 15.20
HT Range 20 20 20 20 21 20.20 Change in wave + storm surge height 18 22 20 20 12 18.40
Coastal erosion
P1 P2 P3 P4 P5
Weighting (average P1-5)
Hinterland 13 9 16 13 13 12.80
Geomorphic Setting/features 21 19 18 17 22 19.40
Beach Sediment 17 20 16 16 21 18.00
Exposure 19 17 19 15 18 17.60
Shoreline Stability 23 25 24 26 26 24.80
HT Range 17 19 15 21 17 17.80 Change in wave + storm surge height 16 17 18 18 9 15.60
P1-5 = panellist 1-5