Coarticulatory influences of liquids on vowels in English · Coarticulatory influences of liquids...
170
Coarticulatory influences of liquids on vowels in English Alison Tunley King’s College A dissertation submitted in candidature for the degree of Doctor of Philosophy Department of Linguistics University of Cambridge April 1999
Transcript of Coarticulatory influences of liquids on vowels in English · Coarticulatory influences of liquids...
Coarticulatory influences of liquids on vowels in English
Alison Tunley
King’s College
A dissertation submitted in candidature for the degree of
Doctor of Philosophy
Department of Linguistics
University of Cambridge
April 1999
ii
Declaration
I hereby declare that this thesis is not substantially the same as any that I have submitted
for a degree or diploma or other qualification at any other university.
I further state that no part of my thesis has already been or is being currently submitted
for any such degree, diploma or other qualification.
This thesis is the result of my own work and includes nothing which is the outcome of work
done in collaboration.
This thesis does not exceed 80,000 words, including footnotes, references and appendices,
but excluding bibliographies.
iii
Summary
This thesis explores the coarticulatory influence of /r/ and /l/ on vowels, locally in VC and
CV sequences and over a longer domain where the vowel is separated from the influencing
consonant by two other segments. The primary motivation behind the production studies
is to improve the quality of rule-generated synthetic speech. Even high quality synthetic
speech is immediately recognizable as being computer-generated; such speech is hard to
understand in noisy listening conditions and requires significantly more cognitive processing
effort than natural speech. One contributor to this inferior quality is the absence in the
synthetic speech signal of subtle but systematic context-induced acoustic detail. Although
a great deal of work has been done on coarticulatory variation, there has been rather little
exploration of long-domain coarticulatory effects or of the interaction between metrical and
segmental factors which influence patterns of coarticulatory variation.
The production studies in this thesis provide detailed information regarding the influence of
liquids on surrounding vowels and thus are a starting point for perceptual studies assessing
the contribution of such acoustic detail to the quality of synthetic speech. Factors such
as stress and vowel quality are varied to establish criteria which favour or discourage the
spread of coarticulatory influence. The interaction between metrical and segmental factors
is explored by looking at stressed and unstressed CV sequences in feet of different lengths
and in different positions in the foot. More complex segmental influences on coarticulatory
behaviour are examined by incorporating /r/s and /l/s in consonant clusters.
A perceptual experiment is conducted to assess the salience of some of the coarticulatory
variation described in the thesis. The experiment shows that incorporating coarticulatory
detail in synthetic speech spread over /@ r V C @/ sequences can improve segmental intelligi-
bility by 7–28%. The degree to which such coarticulatory detail contributes to intelligibility
is partially dependent on lexical effects, in that the biggest improvements in intelligibility
after including coarticulatory detail were found for nonsense words, with rather smaller
improvements for monosyllabic and polysyllabic real words.
iv
Thanks
For financial support I am grateful to the British Academy, the Newton Trust and King’s
College.
I am grateful to my supervisor, Sarah Hawkins for her guidance in all aspects of this project.
Thanks also to Geoffrey Potter, the Phonetics Laboratory technician, for his enduring
patience and good humour and help with a variety of technical problems.
Without the support of the Phonetics lab posse this thesis would never have been finished.
In particular, thanks to Jonathan Rodgers for guru tricks, the LATEX books and many
laughs, and to Kimberley Farrar, Eric Fixmer and Elinor Payne for great coffee breaks.
Many other friends have also kept me going; they know who they are and I owe them all a
lot of beer. Finally, thanks go to Daniel for keeping me sane and reminding me constantly
about what’s really important in life.

v
Note
SSBE stands for Standard Southern British English
Statistical significance is taken to be p ≤ 0.05
vi
Detail matters
“You need a certain amount of complexity to do any particular job. A Saturn V rocket
is said to have had seven million parts, all of which had to work. That’s not entirely true.
Many of those parts were redundant. But that redundancy was absolutely necessary to
achieve the goal of putting someone on the moon in 1969. So if some of those rocket parts
had the job of being redundant, then each of those parts still had to do their part. So to
speak. They also serve who only stand and wait.
We betray ourselves when we say That’s redundant, meaning That’s useless. Redundancy
is not always redundant, whether you’re talking about rockets or human languages or com-
puter languages. In short, simplicity is often the enemy of success.”
Larry Wall, August 25th 1998
2nd State of the Onion
at http://www.perl.com
vii
Contents
List of Figures x
List of Tables xii
1 Introduction 11.1 Background . . . . . . . . . . . . . . . . . . . . . . . . . . . . . . . . . . . . 11.2 Acoustic variation and speech perception . . . . . . . . . . . . . . . . . . . 21.3 Speech synthesis . . . . . . . . . . . . . . . . . . . . . . . . . . . . . . . . . 4
1.3.1 Processing problems in synthetic speech . . . . . . . . . . . . . . . . 51.3.2 Relating naturalness, intelligibility and comprehension . . . . . . . . 9
1.4 Overview of thesis . . . . . . . . . . . . . . . . . . . . . . . . . . . . . . . . 11
2 Influence of liquids on following vowels 142.1 Introduction . . . . . . . . . . . . . . . . . . . . . . . . . . . . . . . . . . . . 14
2.1.1 On the coarticulatory resistance of /i/ . . . . . . . . . . . . . . . . . 142.1.2 Language- and accent-specific differences . . . . . . . . . . . . . . . 162.1.3 Resolving contradictions over variability of /i/ . . . . . . . . . . . . 18
2.2 Research Questions . . . . . . . . . . . . . . . . . . . . . . . . . . . . . . . . 192.3 Materials . . . . . . . . . . . . . . . . . . . . . . . . . . . . . . . . . . . . . 192.4 Recording . . . . . . . . . . . . . . . . . . . . . . . . . . . . . . . . . . . . . 212.5 Measurements and statistical analysis . . . . . . . . . . . . . . . . . . . . . 22
2.5.1 Measuring formant frequencies in vowels . . . . . . . . . . . . . . . . 222.5.2 Measuring formant frequencies in consonants . . . . . . . . . . . . . 242.5.3 Measuring formant frequencies in schwa . . . . . . . . . . . . . . . . 24
2.6 Results and Discussion . . . . . . . . . . . . . . . . . . . . . . . . . . . . . . 252.6.1 Consonant to vowel coarticulation in CV sequences . . . . . . . . . . 252.6.2 Anticipatory vowel coarticulation in consonants in CV sequences . . 282.6.3 Spread of consonant-induced coarticulation to non-adjacent schwa . 31
2.7 Summary and conclusions . . . . . . . . . . . . . . . . . . . . . . . . . . . . 33
3 Intelligibility of synthetic speech 363.1 Introduction to Perceptual Testing . . . . . . . . . . . . . . . . . . . . . . . 363.2 Hypotheses and sentence design . . . . . . . . . . . . . . . . . . . . . . . . . 383.3 Synthesis of the test sentences . . . . . . . . . . . . . . . . . . . . . . . . . . 41
CONTENTS viii
3.3.1 Background to synthesis process . . . . . . . . . . . . . . . . . . . . 413.3.2 Incorporating coarticulatory detail in vowels in Set B . . . . . . . . 423.3.3 Incorporating coarticulatory detail in schwas in Set B . . . . . . . . 443.3.4 Incorporating coarticulatory detail in consonants in Set B . . . . . . 453.3.5 Incorporating coarticulatory detail in Sets A and C . . . . . . . . . . 46
3.4 Filler sentences . . . . . . . . . . . . . . . . . . . . . . . . . . . . . . . . . . 473.5 Adding noise to the speech stimuli . . . . . . . . . . . . . . . . . . . . . . . 473.6 Experimental tapes: design considerations . . . . . . . . . . . . . . . . . . . 49
3.6.1 Statistical Analysis . . . . . . . . . . . . . . . . . . . . . . . . . . . . 503.7 Subjects . . . . . . . . . . . . . . . . . . . . . . . . . . . . . . . . . . . . . . 523.8 Procedure . . . . . . . . . . . . . . . . . . . . . . . . . . . . . . . . . . . . . 523.9 Results and Discussion . . . . . . . . . . . . . . . . . . . . . . . . . . . . . . 52
3.9.1 The r-syllable results . . . . . . . . . . . . . . . . . . . . . . . . . . . 553.10 Summary and conclusions . . . . . . . . . . . . . . . . . . . . . . . . . . . . 57
3.10.1 Speech style . . . . . . . . . . . . . . . . . . . . . . . . . . . . . . . . 583.10.2 Implications for synthesis applications . . . . . . . . . . . . . . . . . 59
4 Temporal course of rhotic resonance effects 624.1 Introduction . . . . . . . . . . . . . . . . . . . . . . . . . . . . . . . . . . . . 624.2 Experimental Design . . . . . . . . . . . . . . . . . . . . . . . . . . . . . . . 63
4.2.1 Independent variables . . . . . . . . . . . . . . . . . . . . . . . . . . 634.2.2 Hypotheses and Questions . . . . . . . . . . . . . . . . . . . . . . . . 654.2.3 Sentences . . . . . . . . . . . . . . . . . . . . . . . . . . . . . . . . . 65
4.3 Recording . . . . . . . . . . . . . . . . . . . . . . . . . . . . . . . . . . . . . 694.4 Measurements and statistical analysis . . . . . . . . . . . . . . . . . . . . . 694.5 Results and Discussion . . . . . . . . . . . . . . . . . . . . . . . . . . . . . . 70
4.5.1 r-colouring in adjacent vowels . . . . . . . . . . . . . . . . . . . . . . 704.5.2 Vowel-to-vowel coarticulation . . . . . . . . . . . . . . . . . . . . . . 724.5.3 r-colouring in non-adjacent stressed vowels . . . . . . . . . . . . . . 744.5.4 r-colouring in non-adjacent unstressed vowels . . . . . . . . . . . . . 75
4.6 Summary and conclusions . . . . . . . . . . . . . . . . . . . . . . . . . . . . 78
5 Coarticulation after consonant clusters 845.1 Introduction . . . . . . . . . . . . . . . . . . . . . . . . . . . . . . . . . . . . 845.2 Research Questions . . . . . . . . . . . . . . . . . . . . . . . . . . . . . . . . 855.3 Materials . . . . . . . . . . . . . . . . . . . . . . . . . . . . . . . . . . . . . 865.4 Recording . . . . . . . . . . . . . . . . . . . . . . . . . . . . . . . . . . . . . 865.5 Measurements and statistical analysis . . . . . . . . . . . . . . . . . . . . . 865.6 Results and Discussion . . . . . . . . . . . . . . . . . . . . . . . . . . . . . . 88
5.6.1 Spectral characteristics of vowels after a variety of syllable onsets . . 885.6.2 Durational properties of vowels after a variety of syllable onsets . . . 915.6.3 Conclusions for vowel data . . . . . . . . . . . . . . . . . . . . . . . 93
5.7 Realization of consonants in clusters . . . . . . . . . . . . . . . . . . . . . . 955.7.1 Realization of /r/ in consonant clusters . . . . . . . . . . . . . . . . 955.7.2 Realization of alveolars and velars in /Cr/ and /sCr/ sequences . . . 100
CONTENTS ix
5.7.3 Realization of /l/ in consonant clusters . . . . . . . . . . . . . . . . 1035.7.4 Summary of EPG and acoustic data for consonants . . . . . . . . . . 104
5.8 Summary and conclusions . . . . . . . . . . . . . . . . . . . . . . . . . . . . 105
6 Metrical influences on liquid coarticulation 1076.1 Introduction . . . . . . . . . . . . . . . . . . . . . . . . . . . . . . . . . . . . 1076.2 Research Questions . . . . . . . . . . . . . . . . . . . . . . . . . . . . . . . . 109
6.2.1 Hypotheses relating to foot-length . . . . . . . . . . . . . . . . . . . 1096.2.2 Hypotheses relating to syllable’s position in the foot . . . . . . . . . 110
6.3 Materials . . . . . . . . . . . . . . . . . . . . . . . . . . . . . . . . . . . . . 1106.3.1 Exploring foot-length and syllable compression . . . . . . . . . . . . 1106.3.2 Exploring the impact of syllable position in the foot . . . . . . . . . 111
6.4 Recording . . . . . . . . . . . . . . . . . . . . . . . . . . . . . . . . . . . . . 1116.5 Measurements and Analysis . . . . . . . . . . . . . . . . . . . . . . . . . . . 1156.6 Results and Discussion . . . . . . . . . . . . . . . . . . . . . . . . . . . . . . 115
6.6.1 The effect of foot-length on vowel durations . . . . . . . . . . . . . . 1156.6.2 The effect of foot-length on spectral properties of vowels . . . . . . . 1166.6.3 The effect of syllable position in the foot on coarticulation . . . . . . 121
6.7 Summary and Conclusions . . . . . . . . . . . . . . . . . . . . . . . . . . . . 122
7 Concluding Remarks 1257.1 Susceptibility to coarticulatory influence . . . . . . . . . . . . . . . . . . . . 1267.2 Long-domain rhotic resonance effects . . . . . . . . . . . . . . . . . . . . . . 1277.3 Temporal variation and coarticulatory effects . . . . . . . . . . . . . . . . . 130
7.3.1 Segmental influences on timing . . . . . . . . . . . . . . . . . . . . . 1307.3.2 Metrical influences on timing . . . . . . . . . . . . . . . . . . . . . . 1307.3.3 Summary: Temporal variation and coarticulatory effects . . . . . . . 131
7.4 Perceptual salience of coarticulatory detail . . . . . . . . . . . . . . . . . . . 1327.4.1 Lexical influences on the salience of coarticulatory detail . . . . . . . 1327.4.2 Perceptual coherence and perceptual testing . . . . . . . . . . . . . . 1337.4.3 Importance of sensitive and application-oriented perceptual testing . 136
7.5 Afterword: Combined influences on r-colouring . . . . . . . . . . . . . . . . 137
A Pre-synthesis production study 139A.1 Background to recording . . . . . . . . . . . . . . . . . . . . . . . . . . . . . 139A.2 Measurements . . . . . . . . . . . . . . . . . . . . . . . . . . . . . . . . . . . 140A.3 Results . . . . . . . . . . . . . . . . . . . . . . . . . . . . . . . . . . . . . . . 140
B Acoustic data for isolated vowels 144B.1 Background . . . . . . . . . . . . . . . . . . . . . . . . . . . . . . . . . . . . 144B.2 Results . . . . . . . . . . . . . . . . . . . . . . . . . . . . . . . . . . . . . . . 145
x
List of Figures
1.1 Intelligibility of natural and synthetic speech in noise . . . . . . . . . . . . . 6
2.1 Schematized outline of experiment . . . . . . . . . . . . . . . . . . . . . . . 202.2 Spectrogram of the utterance the reap . . . . . . . . . . . . . . . . . . . . . 232.3 F2 and F3 in vowels in /h/, /l/ and /r/ contexts . . . . . . . . . . . . . . . 252.4 F2 and F3 in vowels in /hV/ and /rV/ . . . . . . . . . . . . . . . . . . . . . 262.5 F2 and F3 in vowels in /hV/ and /lV/ . . . . . . . . . . . . . . . . . . . . . 282.6 F2 and F3 in /h/, /l/ and /r/ . . . . . . . . . . . . . . . . . . . . . . . . . . 292.7 F2 in schwa in preceding vowel contexts . . . . . . . . . . . . . . . . . . . . 322.8 Schematized spectrograms of /hV/, /lV/ and /rV/ . . . . . . . . . . . . . . 342.9 Schematized spectrograms of /ri, rI, rE, ræ/ . . . . . . . . . . . . . . . . . . 35
3.1 Schematized outline of sequence of interest . . . . . . . . . . . . . . . . . . 383.2 Schema for design of perceptual experiment . . . . . . . . . . . . . . . . . . 513.3 % phonemes correct for rule and edited forms . . . . . . . . . . . . . . . . . 533.4 % phonemes correct for rule and edited forms of r-context words . . . . . . 553.5 % phonemes correct for rule and edited forms of r-context words for each
word set . . . . . . . . . . . . . . . . . . . . . . . . . . . . . . . . . . . . . . 56
4.1 Schematized outline of sequences of interest in long-domain experiment . . 634.2 F2, F3 and F4 in vowels in /Vr/, /rV/, /Vh/ and /hV/ . . . . . . . . . . . 714.3 F2, F3 and F4 in vowels adjacent to /r/ or /h/ in stressed or unstressed
neighbouring contexts . . . . . . . . . . . . . . . . . . . . . . . . . . . . . . 734.4 Schematized spectrograms of vowels adjacent to /r/ or /h/ . . . . . . . . . 744.5 F2, F3 and F4 in unstressed vowels in non-adjacent /r/ and /h/ contexts . 754.6 F2, F3 and F4 in unstressed /i I @/ in non-adjacent /r/ and /h/ contexts . 774.7 F2, F3 and F4 in non-adj. unstr. vowels by stress of influencing syllable . . 784.8 F2, F3 and F4 in non-adj. unstr. vowels by direction of influence . . . . . . 79
5.1 F2, F3 and F4 in Hz in vowels after consonant clusters . . . . . . . . . . . . 885.2 F2, F3 and F4 in ERBs in vowels after consonant clusters . . . . . . . . . . 905.3 Vowel duration after various syllable onsets . . . . . . . . . . . . . . . . . . 925.4 Controlled words: vowel durations after various syllable onsets . . . . . . . 945.5 Spectrograms of /ri:/, /kri:/ and /skri:/ . . . . . . . . . . . . . . . . . . . . 96
LIST OF FIGURES xi
5.6 Layout of palate used in EPG data collection. . . . . . . . . . . . . . . . . . 975.7 EPG patterns for /r/ in different syllable onsets . . . . . . . . . . . . . . . . 985.8 EPG patterns for /r/ in different syllable onsets . . . . . . . . . . . . . . . . 995.9 EPG patterns for /t/ in different syllable onsets . . . . . . . . . . . . . . . . 1005.10 EPG patterns for /k/ in different syllable onsets . . . . . . . . . . . . . . . 1015.11 EPG patterns for /l/ in different syllable onsets . . . . . . . . . . . . . . . . 104
6.1 Stressed and unstressed sequences of interest in foot-length experiment . . . 1116.2 Duration of syllable nuclei in feet of different lengths. . . . . . . . . . . . . . 1166.3 F2, F3 and F4 in unstressed /rV/ and /lV/ in feet of different lengths . . . 1186.4 F2, F3 and F4 in syllables in different positions in the foot . . . . . . . . . 121
7.1 Sequences which differ in their propensity to allow r-colouring to spread. . . 138
A.1 Schematized outline of sequence of interest . . . . . . . . . . . . . . . . . . 140

xii
List of Tables
2.1 Sentences . . . . . . . . . . . . . . . . . . . . . . . . . . . . . . . . . . . . . 212.2 Fillers . . . . . . . . . . . . . . . . . . . . . . . . . . . . . . . . . . . . . . . 222.3 Planned comparisons for factor consonant . . . . . . . . . . . . . . . . . . . 262.4 Planned comparisons for F2 and F3 in vowels in /h/ and /r/ contexts . . . 272.5 Planned comparisons for F2 and F3 for vowels in /h/ and /l/ contexts . . . 292.6 Planned comparisons for F2 and F3 in /h, l/ and /r/ in each vowel context 302.7 Planned comparisons for F2 and F3 in schwa in /h/ and /r/ contexts . . . . 312.8 Planned comparisons for F2 in schwa . . . . . . . . . . . . . . . . . . . . . . 322.9 F2 & F3 in schwa in /h/ and /r/ contexts, individual speakers . . . . . . . 33
3.1 Sentences used in perceptual experiment . . . . . . . . . . . . . . . . . . . . 403.2 Calculation of ‘coarticulated’ formant frequencies . . . . . . . . . . . . . . . 433.3 Fillers for perceptual experiment . . . . . . . . . . . . . . . . . . . . . . . . 483.4 Practice sentences for perceptual experiment. . . . . . . . . . . . . . . . . . 533.5 % phonemes correct for individual rule and edited l-context words . . . . . 543.6 % difference phonemes correct for individual words . . . . . . . . . . . . . . 56
4.1 Independent variables for long-domain experiment . . . . . . . . . . . . . . 644.2 Stress patterns for anticipatory r-colouring sequences . . . . . . . . . . . . . 644.3 Sentences for long-domain experiment: Anticipatory effects . . . . . . . . . 674.4 Sentences for long-domain experiment: Perseverative effects . . . . . . . . . 684.5 Difference in F2, F3 and F4 in /I/ and /@/ between /h/ and /r/ contexts . 724.6 F2, F3 and F4 for stressed non-adjacent vowels . . . . . . . . . . . . . . . . 75
5.1 Sentences for cluster experiment . . . . . . . . . . . . . . . . . . . . . . . . 875.2 Planned comparisons for F2, F3 and F4 in vowels after consonant clusters . 895.3 Comparison of formant frequency variation in synthesis and natural speech 915.4 Planned comparisons for vowel durations after consonant clusters . . . . . . 925.5 Subset of controlled words from cluster experiment . . . . . . . . . . . . . . 935.6 Words recorded for EPG analysis of /r/ . . . . . . . . . . . . . . . . . . . . 975.7 F2 at velar burst in different contexts . . . . . . . . . . . . . . . . . . . . . 1025.8 Words recorded for EPG analysis of /l/ . . . . . . . . . . . . . . . . . . . . 103
6.1 Sentences: Foot-length and stressed syllables . . . . . . . . . . . . . . . . . 112
LIST OF TABLES xiii
6.2 Sentences: Foot-length and unstressed syllables . . . . . . . . . . . . . . . . 1136.3 Sentences: Position of syllable in foot . . . . . . . . . . . . . . . . . . . . . . 1146.4 F2, F3 and F4 in stressed vowels in feet of different lengths . . . . . . . . . 1176.5 F2 in individual vowels in different positions in the foot . . . . . . . . . . . 122
A.1 Fillers used in pre-synthesis production study . . . . . . . . . . . . . . . . . 139A.2 F2 and F3 in vowels in /h/, /l/ and /r/ contexts . . . . . . . . . . . . . . . 141A.3 F2 and F3 in /h/, /l/ and /r/ in different vowel contexts . . . . . . . . . . 142A.4 F2 and F3 in /@1/ in different vowel and consonant contexts . . . . . . . . . 142A.5 F2 and F3 in /@2/ in different vowel and consonant contexts . . . . . . . . . 143
B.1 F1, F2 and F3 in isolated vowels from a single speaker . . . . . . . . . . . . 145B.2 F1, F2 and F3 in vowels in real words from a single speaker . . . . . . . . . 145
1
Chapter 1
Introduction
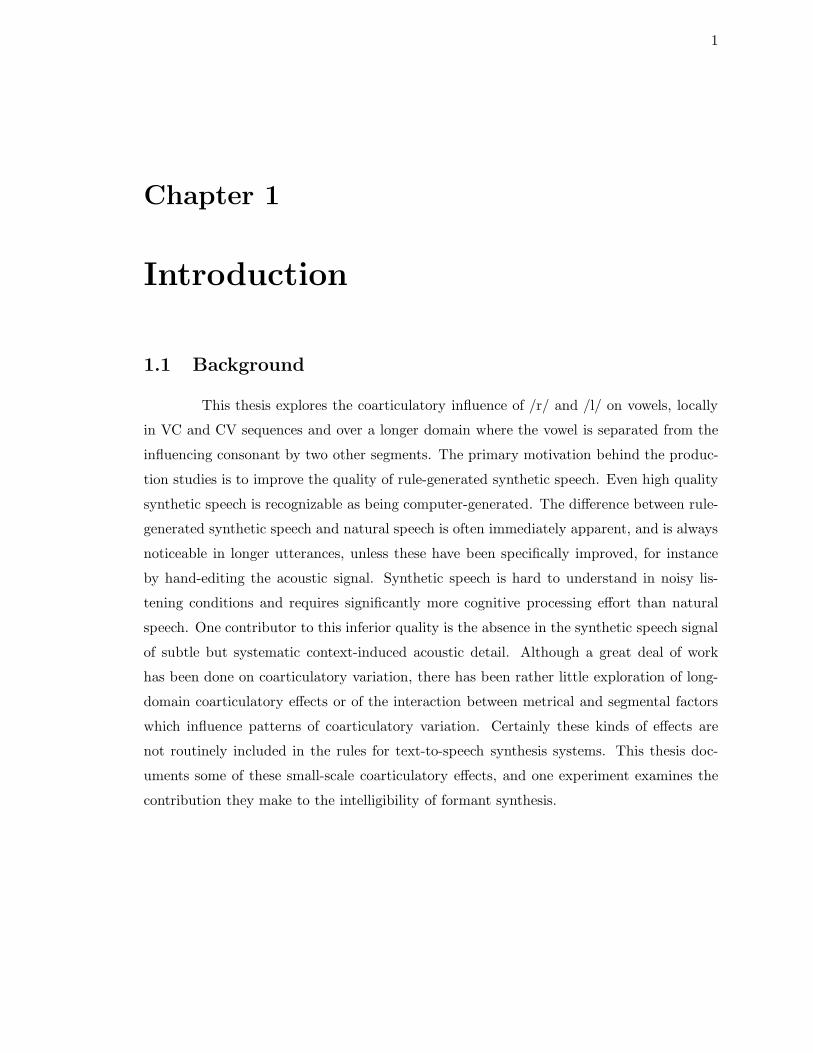
1.1 Background
This thesis explores the coarticulatory influence of /r/ and /l/ on vowels, locally
in VC and CV sequences and over a longer domain where the vowel is separated from the
influencing consonant by two other segments. The primary motivation behind the produc-
tion studies is to improve the quality of rule-generated synthetic speech. Even high quality
synthetic speech is recognizable as being computer-generated. The difference between rule-
generated synthetic speech and natural speech is often immediately apparent, and is always
noticeable in longer utterances, unless these have been specifically improved, for instance
by hand-editing the acoustic signal. Synthetic speech is hard to understand in noisy lis-
tening conditions and requires significantly more cognitive processing effort than natural
speech. One contributor to this inferior quality is the absence in the synthetic speech signal
of subtle but systematic context-induced acoustic detail. Although a great deal of work
has been done on coarticulatory variation, there has been rather little exploration of long-
domain coarticulatory effects or of the interaction between metrical and segmental factors
which influence patterns of coarticulatory variation. Certainly these kinds of effects are
not routinely included in the rules for text-to-speech synthesis systems. This thesis doc-
uments some of these small-scale coarticulatory effects, and one experiment examines the
contribution they make to the intelligibility of formant synthesis.
CHAPTER 1. INTRODUCTION 2
1.2 Acoustic variation and speech perception
Acoustic variability has traditionally been regarded as posing a problem for the
process of speech perception (cf. Stevens and Blumstein 1978, Klatt 1986). The question has
been: how do listeners get from the variable acoustic signal to a set of invariant phonemes,
or features, or words, or whatever the unit of perception might be? Variation in speech was
seen as noise, a hindrance to the successful decoding of the signal. Researchers sought to
establish how listeners simplified the complex acoustic signal to achieve lexical access. As
Goldinger (1997, p34) puts it, “perception was theorized to entail information reduction,
such that successive stages of information processing derive progressively more abstract
representations of analog inputs”. Nowadays a number of researchers believe that quite the
opposite of this is true; that systematic variability in the speech signal actually contributes
to successful lexical access (cf. Warren and Marslen-Wilson 1987). Miller (1994) claims
that listeners’ representation of phonetic forms includes, not only categorical information,
but also fine-grained information about the detailed acoustic phonetic characteristics of the
language.
The role of acoustic cue-trading in speech perception is perhaps most famously
demonstrated in an experiment by Lisker, who finds 16 potential cues to voicing in English,
although a subset of these carry greatest significance (Lisker 1986). Similarly Elman and
McClelland (1986) emphasise the role that acoustic variation has in aiding lexical access in
their TRACE model of speech perception. This allows for knowledge about one phoneme to
help identify another, directly taking advantage of context-induced variation in the signal.
Oden and Massaro (1978) adopt an approach from outside the speech domain to cope with
this abundance of acoustic (and other) information in their model of speech perception,
favouring what is described as a fuzzy-logical approach. The most important feature of such
a model for our purposes is that it allows for the simultaneous evaluation and integration
of multiple cues. The model explicitly embraces all potentially useful pieces of information
from visual, to acoustic to contextual cues (cf. also Massaro and Oden 1980, Massaro 1987).
Pisoni (1997b) is among several researchers to argue for a non-analytic approach to speech
perception, which accommodates stimulus variability by assuming that it is a lawful and
highly informative source of information for the perception process.
This kind of approach to speech perception suggests that the most intelligible
speech is precisely that which is produced by a human vocal tract, complete with all the
CHAPTER 1. INTRODUCTION 3
variation that is an inevitable consequence of connected speech processes. The detail in the
acoustic signal which has been shown to be perceptually useful is the systematic variability
which arises due to properties of the vocal tract and which, therefore, provides a link between
the continuously varying speech signal and the linguistic message which is the end-product
of the perception process.
Individual languages differ in the degree of context-induced variation they permit
(Manuel 1990) and language-specific coarticulatory effects such as these may contribute to
perception, inasmuch as they are systematic and therefore ‘expected’ by listeners. Individ-
ual speakers also have a great deal of control over coarticulatory behaviour (Lubker and
Gay 1982, Nolan 1985, Keating 1990). Whilst this kind of unsystematic variation in the
acoustic signal may also be perceptually salient, it is not clear how speaker-specific coartic-
ulatory detail could be linguistically relevant, though it may serve other purposes, such as
speaker recognition (cf. Su, Li, and Fu 1974 on identification of speakers by degree of nasal
coarticulation). A variety of researchers (see review in Goldinger 1997) have shown that
voice quality information is encoded in long-term memory, and furthermore that lexical
and voice quality information are processed as integral dimensions of spoken words: neither
dimension can be ignored in favour of the other. So, the difference between systematic and
unsystematic acoustic variability may not always be straightforward, but the distinction
should be maintained at least as a theoretical framework.
The extent to which even systematic variability is perceptually salient is also un-
clear. Some phoneticians are presently distancing themselves from traditional assumptions
of the primacy of the phoneme and canonical forms. Instead there is a growing interest
in the importance of small-scale allophonic variation in both production and perception.
There is perhaps a temptation to assume that all such sub-phonemic detail is important.
Thus Lofqvist (1985) claims that listeners are sensitive to all acoustic variations that a
vocal tract can produce. This may not be so far from the truth, but data is needed to
substantiate such claims. Klatt (1979), for instance, suggests that not all rule-governed
segment duration changes are perceptually discriminable. The production studies in this
thesis aim to document systematic acoustic variation associated with /r/ and /l/ and to
establish factors which influence patterns of coarticulatory behaviour. Statistical analysis
provides a first measure of the significance of effects, but it is primarily an indication of
where perceptual testing might best begin. The perceptual study in Chapter 3 examines
the extent to which specific subphonemic spectral details are perceptually significant, and
CHAPTER 1. INTRODUCTION 4
in particular assesses whether such detail can aid lexical access.
1.3 Speech synthesis
In early work on synthetic speech the necessity of simplifying the task at hand
meant that only the most important acoustic features were reproduced. Small-scale, longer
term context induced variation was overlooked, whilst attention was focused on improving
synthetic speech in other ways. The basic premise was one of canonical phonemes which
could be modified in certain relatively limited ways (cf. Klatt 1987) and substantial progress
was made in this way, especially as more and more detail was incorporated into synthesis
systems. The inclusion in synthesis systems of a number of context-sensitive allophones
allows the modelling of coarticulatory detail which affects the target formant frequencies of
a sound. But perhaps most successful is the modelling of transitional coarticulatory effects,
by means of algorithms which smooth transitions between adjacent acoustic segments. For
instance in the MITalk system (Allen, Hunnicutt, and Klatt 1987, pp116–7) the generation
of control parameters is described as follows:
1. Draw the target value for the first segment
2. Draw the target value for the next segment
3. Smooth the boundary between the segments using one of four smoothing algorithms
So contextual variation at segment boundaries is relatively well modelled by means of inter-
polation algorithms, but target values for vowels are calculated from natural productions
of a large set of CV syllables. That is to say, consonant-induced variation at the midpoint
of most vowels is averaged out across tokens.
The most obvious fault with current rule-generated synthetic speech is its ‘robotic’
and rather ‘lifeless’ sound quality. Docherty and Shockey (1988) state that the problems of
producing natural-sounding speech synthesis are not primarily due to engineering problems,
but are due instead to the failure to adequately model systematic, detailed acoustic features
of the speech signal. This claim is reinforced by experience with copy synthesis. During the
1960s and 70s John Holmes, amongst others, used copy synthesis to produce synthesized
sentences which, by the 70s, were virtually indistinguishable from the naturally produced
originals. Allen et al. (1987) recognize that this technique was successful “. . . in part because
CHAPTER 1. INTRODUCTION 5
it reproduces all of the potential cues present in the spectrum, even though we may not know
which cues are most important.” They go on to say that, “the speech perception apparatus
appears to be aware of any and all (perceptually discriminable) regularities present in the
acoustic signal generated by the speech production apparatus, and these regularities should
be included in synthetic stimuli if possible”(p109).
The richness of the natural speech signal seems to contribute to its coherence
(cf. work on auditory streaming by Bregman 1978, 1990, Summerfield and Culling 1994)
and lack of acoustic coherence in synthetic speech has been claimed to be a factor in its
fragility in difficult listening conditions and in its unnatural sound quality (Hawkins and
Slater 1994, Hawkins 1995). In the following sections I examine some other consequences
of this lack of coherence for the quality of synthetic speech.
In the early development of synthetic speech, when quality was relatively poor,
intelligibility tests did not have to be particularly sophisticated to highlight differences be-
tween synthetic and natural speech. There was an overwhelming focus on segmental or
word intelligibility, often of nonsense sequences using semantically anomalous sentences,
often with a closed response-format and usually in optimal laboratory listening conditions
(cf. Fairbanks 1958, House, Williams, Hecker, and Kryter 1965, Nye and Gaitenby 1973).
The quality of synthetic speech has now improved to the point where it can match the per-
formance of natural speech in these kinds of tests (Pratt 1986) and researchers have perhaps
been rather too ready to describe synthetic speech as being ‘perfectly intelligible’, stating
that what remains to be improved is its naturalness (cf. Pols 1989). Experimental work is
cited here which shows that synthetic speech lacking acoustic detail is far from matching
natural speech in a whole range of tests: it is disproportionately harder to understand in
difficult listening conditions and is harder to process than natural speech, to the detriment
of other cognitive processes.
1.3.1 Processing problems in synthetic speech
A wide variety of tests demonstrate that, even where the segmental intelligibility
of a synthesis system appears to match that of natural speech, it is to the detriment of
other comprehension processes or has a knock-on effect on other cognitive tasks. Manous
and Pisoni (1984, cited in Duffy and Pisoni 1992) use the gating paradigm to show that
subjects need only the first 361ms of a word to identify it in natural speech, whereas
CHAPTER 1. INTRODUCTION 6
417ms are required for synthesised versions of the words. Clark, Dermody, and Palethorpe
(1985) conducted an experiment in which subjects heard five repetitions of natural and
synthesised CV syllables in background noise. They found that identification accuracy for
natural speech increased over the repetitions, whereas no such improvements were found
for synthetic speech. They claim that listeners were picking up on the extra, ‘redundant’
acoustic cues in natural speech, whereas these cues were unavailable in the synthesised
versions.
An everyday example of the inferior quality of synthetic speech is demonstrated by
Spiegel, Altom, and Macchi (1990). They assessed the intelligibility of natural and synthetic
speech over the telephone, which imposes bandlimiting conditions and circuit noise. In an
open-response intelligibility test over the phone using both real and non-words, natural
speech was 88% intelligible, whereas the Orator speech synthesis system was just 72%
intelligible. Similarly, synthetic speech is disproportionately fragile in background noise.
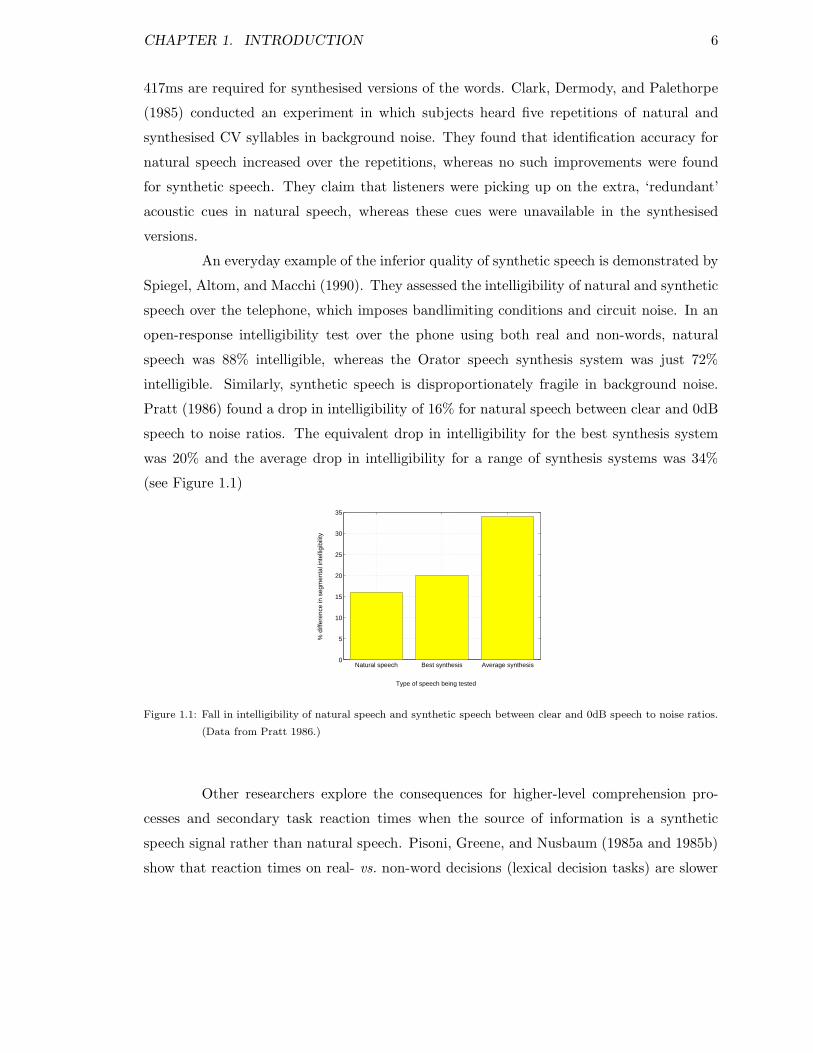
Pratt (1986) found a drop in intelligibility of 16% for natural speech between clear and 0dB
speech to noise ratios. The equivalent drop in intelligibility for the best synthesis system
was 20% and the average drop in intelligibility for a range of synthesis systems was 34%
(see Figure 1.1)
Type of speech being tested
% d
iffer
ence
in s
egm
enta
l int
ellig
ibili
ty
Natural speech Best synthesis Average synthesis0
5
10
15
20
25
30
35
Figure 1.1: Fall in intelligibility of natural speech and synthetic speech between clear and 0dB speech to noise ratios.
(Data from Pratt 1986.)
Other researchers explore the consequences for higher-level comprehension pro-
cesses and secondary task reaction times when the source of information is a synthetic
speech signal rather than natural speech. Pisoni, Greene, and Nusbaum (1985a and 1985b)
show that reaction times on real- vs. non-word decisions (lexical decision tasks) are slower
CHAPTER 1. INTRODUCTION 7
for synthetic speech than for natural speech. This is taken as evidence that the phonolog-
ical encoding of synthetic speech requires more cognitive effort. Duffy and Pisoni (1992)
take up this idea again, beginning with the assumption that limited cognitive resources are
available for carrying out the various processes involved in spoken language comprehension.
They draw an analogy between speech perception and visual word-recognition and models
of reading comprehension. Stanovich and Perfetti (cited in Duffy and Pisoni 1992) suggest
that when lower-level word recognition processes are not highly automated, as is the case
for poor readers, then their operation drains needed resources away from higher-level com-
prehension processes. Similar effects are claimed for synthetic speech by Duffy and Pisoni.
In synthetic speech, they say, lower-level phoneme and word identification processes require
more resources than for natural speech due to the impoverished nature of the synthetic stim-
ulus. The result is a draining away of resources from higher-level comprehension processes.
Thus, whilst we may succeed in redirecting sufficient cognitive resources to obtain similar
scores in intelligibility tests for the lower levels of comprehension, this is to the detriment
of higher-level comprehension processes.
What is claimed is that there is a kind of knock-on effect from difficulties at
the lower levels of spoken language processing to higher levels. Concurrent load measures
provide another indicator of such problems. The effects on memory of listening to synthetic
speech are well documented. Luce, Feustel, and Pisoni (1983) show that straightforward
recall and recall in order of presentation of lists of words is worse for synthetic speech than
for natural speech, indicating a reduced capacity for transferring information from working
memory into long-term memory.
Other studies suggest that natural speech can be comprehended at much higher
speaking-rates than synthetic speech. Comprehension is fairly constant for natural speech
at up to about 300 words per minute (Fairbanks, Guttman, and Miron 1957). Hersh and
Tartaglia (1983, cited in Duffy and Pisoni 1992) find that synthetic speech comprehension
remains constant at 150 and 180 wpm, but it drops off drastically in intelligibility well before
300 wpm. This is taken as an indication that synthetic speech takes up more processing time;
something that might not be revealed in the normal course of an utterance, but which is
obviously critical once the speech is delivered more rapidly. In similar work Ralston, Pisoni,
Lively, Greene, and Mullennix (1991) allow subjects to control the rate of presentation of
sentences in passages of varying difficulty in both natural and synthetic speech. They find
significantly slower rates for synthetic speech and for more difficult passages.
CHAPTER 1. INTRODUCTION 8
Further indicators of the extra load which synthetic speech imposes on cognitive
processing capacity come from experiments using the secondary task paradigm. In one kind
of experiment in this category listeners are required to comprehend a passage presented in
either natural or synthetic speech, whilst also monitoring for a particular target word.
Ralston et al. (1991) show that responses are much slower for subjects listening to synthetic
speech. In another experiment (Ralston, Lively, Pisoni, and Rivera 1990) subjects had
to monitor for a non-speech sound; a click. The same results were obtained, but this
time they cannot be attributed to differences in the ease of identifying the target stimulus.
Instead Ralston et al. claim that listening to synthetic speech uses up, not only more of
the linguistically-oriented cognitive resources, but also non-linguistic resources.
This effect on non-speech tasks has obvious implications for many text-to-speech
applications. Multi-task situations are common; the user may be required to process audi-
tory information while simultaneously performing another task involving hands or eyes, for
instance to write down a telephone number or land an aircraft. Poor performance on any
of these secondary tasks will detract from the usefulness of synthetic speech.
Sentence verification tasks also highlight interesting differences in speed of com-
prehension between natural and synthetic speech. When subjects are required to indicate
whether a sentence is true or false (e.g. “Mud is dirty”) and then transcribe it, reponse
times, response accuracy and transcription accuracy are all significantly higher for natural
compared with synthetic speech (Manous, Dedina, Nusbaum, and Pisoni 1985).
Further experiments show that listeners to synthetic speech appear to devote more
attention to ‘surface details’ of the acoustic signal than is the case for natural speech. In
a comprehension study, Luce (1981) finds that synthetic speech performs less well than
natural speech on measures that directly assess meaning. However, synthetic speech is
better than natural speech on the measure that assesses memory for exact words used
in the text. Duffy and Pisoni (1992) report anecdotal comments from subjects that the
synthetic voice sounded as though it had a foreign accent. Thus for synthetic speech the
processing system seems to devote a disproportionate amount of resources to lower-level
acoustic processing, with the result that comprehension as a whole suffers in comparison
with natural speech perception.
Duffy and Pisoni (1992) conclude that the end-product of the comprehension pro-
cess for synthetic speech is more impoverished, fragmented and less robust than for natural
speech. They say this will occur even when “synthetic words are perfectly identifiable”
CHAPTER 1. INTRODUCTION 9
(p368) and they attribute this to the fact that “more processing time is spent on word
recognition, leaving less time for the integration and inferencing necessary for normal com-
prehension and retention of what was comprehended” (page 375).
1.3.2 Relating naturalness, intelligibility and comprehension
The interesting thing about all these tests is that they demonstrate the fallacy of
so-called ‘perfect intelligibility’. They also give a new angle on the traditional dichotomy
between naturalness and intelligibility. Researchers still tend to talk about these two as-
pects of quality as if they were separate things entirely. There are frequent comments in
the literature saying that synthetic speech is perfectly intelligible even though it sounds
unnatural. Or even, as in the Duffy and Pisoni quotation above, that “words are perfectly
identifiable” but “comprehension” is impaired. This kind of statement depends crucially
on what one means by intelligibility. And for most researchers intelligibility seems to be
equated with segmental intelligibility, often of very simple monosyllables. I suggest that,
even if a subject can transcribe a synthetic sentence perfectly phoneme for phoneme, if it
slows the subject’s response on secondary tasks, or affects their recall or comprehension,
then that speech should not be described as perfectly intelligible.
Some researchers now explicitly differentiate between intelligibility and compre-
hension (cf. Sonntag, Portele, and Haas 1998). There are certainly grounds for such dif-
ferentiation, but this should not result in the misleading conclusion that intelligibility and
comprehension are unrelated. It is possible that, in turning attention to the ‘new’ problem
of comprehensibility, researchers may assume that segmental intelligibility is fine. In fact I
think it is unlikely that synthetic speech which is hard to comprehend would perform well
in intelligibility tests. Once again the danger is that many of the standard tests of seg-
mental intelligibility are simply not sensitive enough and are prone to ceiling effects. With
more demanding perceptual tests, focussing on longer utterances than isolated monosylla-
bles and imposing noisy listening conditions or a multitask environment, it seems likely that
differences will still be found between the segmental intelligibility of even the best synthetic
speech and that of natural speech.
What I have called the fallacy of perfect intelligibility may find its origin in various
assumptions of traditional phonetic theory which are now being questioned. One source of
the misleading conclusions about the intelligibility of synthetic speech lies in traditional
CHAPTER 1. INTRODUCTION 10
theories of speech perception (see Section 1.2). These have assumed that listeners discard
all but the ‘distinctive’ acoustic properties necessary for perception of a particular sound.
Given such a view of perception it is possible to conclude that the reduced array of acoustic
cues available in synthetic speech might suffice to make the signal perfectly intelligible.
But the general consensus in current speech perception research is that the human
perceptual system is sensitive to a wide variety of acoustic detail. Indeed, listeners seem
to require such information if speech perception is to proceed smoothly. Recent models
of speech perception allow for the simultaneous processing of a wide range of acoustic
(and other) cues and stress the importance of what would previously have been regarded
as redundant acoustic detail. Adopting this view of speech perception, it seems unlikely
that the acoustically impoverished signal generated by text-to-speech systems could be as
intelligible as the acoustically rich, robust signal that is produced by the human vocal tract.
Many researchers emphasise the importance of devising more sophisticated tests
to assess the quality of synthetic speech (cf. Duffy and Pisoni 1992 and van Bezooijen and
van Heuven 1997). Despite such progress there is still a tendency to separate segmental
intelligibility from other measures of comprehension and from the assessment of natural-
ness. Thus Pisoni (1997a) argues that researchers should turn their attention away from
attempts to improve segmental intelligibility and instead focus on improving the natural-
ness of synthetic speech. Similarly (Pols 1989, page 146) describes how “once the barrier
of intelligibility is overcome” the next challenge for researchers is to improve naturalness.
Whilst acknowledging that naturalness and intelligibility can be assessed independently of
each other, the data to be presented here will show that they do not necessarily arise from
different aspects of the speech signal. It is argued that the rigid separation of naturalness
from intelligibility has sometimes obscured the best way to proceed in improving the quality
of synthetic speech.
The survey of experiments in this section shows that synthetic speech fails to match
natural speech in a wide variety of tests. This evidence is used to motivate a redefinition
of intelligibility to include higher-level comprehension processes and other cognitive tasks.
Whilst not equating intelligibility and naturalness, it is suggested that progress will be more
rapid if attention is paid to both simultaneously. Furthermore, it is suggested that if we
redefine intelligibility as proposed above, then the ‘barrier of intelligibility’ is a long way
from being overcome. One factor contributing to the unnaturalness and fragility of synthetic
speech is the inadequate modelling of systematic acoustic variation and it is argued that now
CHAPTER 1. INTRODUCTION 11
that the quality of the best text-to-speech systems is relatively good, it is appropriate to
begin incorporating such detail. The production studies in this thesis set out to document
some of this subtle but systematic acoustic detail that may improve the quality of synthetic
speech.
1.4 Overview of thesis
I have described some of the consequences of lack of fine acoustic detail for speech
synthesis and have highlighted the importance of the richness of the speech signal for suc-
cessful speech perception. The next question was where best to begin documenting fine
context-induced acoustic variation in the speech signal, in order to assess its potential con-
tribution to speech perception and to the quality of synthetic speech.
An enormous body of literature exists both on the concept of coarticulation (cf.
Daniloff and Hammarberg 1973, Hammarberg 1976, 1982, Kent and Minifie 1977 and
Kuhnert and Nolan 1997) and on empirical work describing the ways in which phonological
segments vary in their realization under the influence of other segments (cf. MacNeilage
and DeClerk 1969, Carney and Moll 1971 on articulatory variation, and Lindblom 1963,
Ohman 1966 on acoustic variation). Whilst the notion of coarticulation is well-established,
discussion has tended to focus on the influence of adjacent phones on each other, and partic-
ularly on the transitions between sounds. Where research has been done on longer domain
effects it has almost exclusively been on either vowel-to-vowel coarticulation (cf. Ohman
1966) or on the spread of consonantal features to sounds which can be described as being
unspecified for the feature concerned (cf. Benguerel and Cowan 1974 on labiality, Moll and
Daniloff 1971 on nasality). Indeed Laver (1994) suggests a hierarchy of coarticulatory ef-
fects in terms of the typical time-span of influence, such that labial effects may spread over
the greatest number of segments, followed by nasality and with lingual effects having the
smallest temporal extent, operating chiefly within the syllable.
Other researchers claim that rhotic and lateral consonants can influence long
stretches of the speech signal (cf. Kelly 1989). Such effects would seem to be primarily
lingual, although rhotic consonants may also involve some lip-rounding. At any rate, lit-
tle empirical work has been done in this area and these coarticulatory effects are less well
understood than effects such as nasalisation and labialisation.
The experiments in this thesis focus on the influence of the liquids /r/ and /l/ on a
CHAPTER 1. INTRODUCTION 12
series of front vowels. The choice of vowels stems from what appears to be a contradiction in
the coarticulation literature. Work by prosodic phonologists refers to /i/ as being auditorily
very different in /r/ and /l/ contexts (cf. Kelly 1989). Other researchers, in contrast,
present data which suggest that /i/ is a highly stable sound, which is relatively impervious
to coarticulatory influence and which, in turn, may significantly affect the realization of
surrounding sounds (cf. Recasens 1987). These issues are discussed further in Chapter 2.
The experiment in Chapter 2 documents coarticulatory effects within a single syl-
lable, focussing on the influence of the liquids /r/ and /l/ on /i I E æ/. For each vowel /h/
is used as a neutral context for comparison with the /r/ and /l/ contexts. The experiment
explores differences in the susceptibility of vowels to rhotic and lateral influence. A pre-
liminary investigation is also undertaken of the spread of consonantal resonance effects to
non-adjacent segments.
The acoustic data from Chapter 2 form the basis of the perceptual study reported
in Chapter 3. This experiment investigates the importance of small-scale coarticulatory
detail spread over several segments to the perception of synthetic speech. As well as a
straightforward test of the perceptual salience of the coarticulatory detail, this experiment
investigates whether lexical or contextual cues affect the degree to which systematic acoustic
variation contributes to intelligibility.
Having established the perceptual salience of fine acoustic detail in synthetic
speech, the remaining chapters document other coarticulatory effects which are not rou-
tinely captured in the rules for text-to-speech systems. These experiments provide a basis
for further perceptual testing and indicate some promising areas of research into improving
the quality of rule-generated synthetic speech. Chapter 4 expands on the findings of Chap-
ter 2 by exploring in greater detail coarticulatory effects spreading over several segments in
the speech signal. The chapter focuses exclusively on rhotic resonance effects, and investi-
gates anticipatory coarticulation in vowels in /VCVr/ sequences and perseverative effects
in /rVCV/ sequences. Stress and vowel quality are varied in order to establish some of the
factors which influence the spread of long-domain coarticulatory effects.
Chapter 5 examines the effects of /r/ and /l/ on vowels when the liquids occur as
single syllable-onset constituents or as part of onset clusters. The temporal and spectral
properties of vowels after a variety of clusters are examined, and some articulatory data are
presented for the consonants in the onset clusters.
Chapter 6 examines poorly understood interactions between suprasegmental struc-

CHAPTER 1. INTRODUCTION 13
ture and coarticulatory behaviour. As in previous experiments, the influence of /r/ and /l/
on vowels in CV sequences is examined. There are two strands to the experimental work.
The first is to explore the influence of foot-length on the duration and spectral properties of
both stressed and unstressed syllables. English is described as being a stress-timed language,
having approximately equal intervals between stressed syllables (Abercrombie 1964). This
means that as you add unstressed syllables to a foot, compression of both stressed and un-
stressed syllables occurs. The temporal aspects of syllable compression have been described
in detail by Ogden and Local and modelled in the Yorktalk synthesis system (1992, 1996).
Chapter 6 explores some of the spectral consequences of these rhythmic effects.
The second part of the experiment in Chapter 6 assesses the impact of the position
of a syllable in a foot on the coarticulatory behaviour of that syllable. There is evidence
from work on vowel-devoicing (Rodgers 1998) that the three unstressed syllables in a four
syllable foot are not identical, but that the middle one is ‘stronger’ and less prone to vowel-
devoicing. Chapter 6 explores whether similar resistance to context-induced effects is found
for rhotic and lateral coarticulation in vowels.
14
Chapter 2
Influence of liquids on following
vowels
2.1 Introduction
The aim of all the production experiments in this thesis is to document poorly
understood patterns of coarticulatory variation in English. Such context-induced effects
are not routinely modelled in the rules for text-to-speech synthesis and it is suggested
that the lack of such detail in synthetic speech may be a contributing factor in its lower
intelligibility and unnatural sound quality. The experiment in this chapter explores what
appears to be a contradiction in the literature, regarding the susceptibility of vowels to
coarticulatory influence.
2.1.1 On the coarticulatory resistance of /i/
Work by prosodic phonologists emphasises that coarticulatory effects are not re-
stricted to the transitions between sounds, but may spread throughout the syllable and
beyond. Such long-term coarticulatory effects are referred to as resonances and a classic
example given is the effect /l/ and /r/ have on the vowel /i/. In words like Terry vs. telly
and Henry vs. Henley, the prosodic phonologists claim that the final /i/ sound is audibly
different in many accents of English (Kelly 1989, Kelly and Local 1989).
In contrast to suggestions by the prosodic phonologists that /i/ is audibly differ-
ent in different phonetic contexts, other researchers claim that /i/ is the most stable of all
CHAPTER 2. INFLUENCE OF LIQUIDS ON FOLLOWING VOWELS 15
vowels and is unlikely to vary much between different contexts. Quantal Theory, for ex-
ample, proposes that variation in the precise constriction location for /i/ does not produce
significant acoustic variation (Stevens 1989). A caveat to this is raised by Fant, who states
that the preferred high point of the tongue for /i/ in most languages is actually 1–2cm
further back than Quantal Theory would predict (Fant 1989). The constriction thus occurs
at a point where F2 and F3 frequencies are rather more sensitive to variations in the pre-
cise articulatory configuration than they would be with a more fronted articulation. Fant
suggests that the more backed articulation provides a firmer anchoring point for the tongue
using kinaesthetic feedback. This concurs with Recasens’ (1987) suggestion that /i/, with
its high degree of tongue-palate contact, should, in articulatory terms at least, be relatively
stable. Of course stability in constriction location does not rule out changes in tongue-body
configuration which could change the acoustic properties of the sound.
Quantal theory’s predictions are borne out by various empirical studies which sug-
gest that /i/ is a very stable vowel both in acoustic and articulatory terms. In work on
American English, Gay (1974, 1977) finds /i/ to be more resistant than /æ/ to differences
in jaw opening and tongue body height caused by contrasting consonants and vowels. Ma-
gen (1984) finds /i/ to be more resistant than /æ/ to V-to-V coarticulatory effects in the
frequency of F2 in Japanese, and Manuel and Krakow (1984) find the same for Swahili and
Shona. Butcher and Weiher (1976) provide EPG data from nonsense sequences in Ger-
man showing a coarticulatory hierarchy amongst vowels, such that /i/ exerts the greatest
coarticulatory influence, and /a/ the least.
In an acoustic study on Catalan CV sequences Recasens (1985) shows that /i/ is
the vowel with the highest degree of resistance to consonantal resonance effects. In the same
study he finds that palatal consonants are very resistant to coarticulatory influence, and
he concludes that articulations involving a large tongue-dorsum raising gesture towards the
palate block coarticulation on tongue-body activity. This theme is taken up in Recasens’
(1987) discussion of articulatory constraints on coarticulation. Here he finds that the degree
of vowel-to-vowel coarticulatory effects in VCV sequences is inversely related to the degree
of tongue dorsum constraint during the production of the intervocalic consonant and the
second vowel. That is to say, the higher the tongue body position for a particular sound
the more likely it is to block the spread of lingual coarticulatory effects.
This finding is supported by EPG and acoustic data from one Catalan and two
American English speakers (Recasens 1989). In this work Recasens finds much larger con-
CHAPTER 2. INFLUENCE OF LIQUIDS ON FOLLOWING VOWELS 16
sonant dependent effects of /S/ and /t/ on /æ/ than on /i/. He concludes that /i/ is more
resistant to coarticulation than /æ/ because it is produced with more palatal contact. The
idea is that kinaesthetic feedback due to the high degree of contact between tongue and
palate makes such sounds less susceptible to articulatory variability and also means that
these sounds exert the greatest coarticulatory influence over other sounds. Farnetani (1990)
finds similar results for Italian consonants, showing that coarticulation of tongue body varies
inversely with the degree of tongue dorsum elevation. Finally, in work on American En-
glish, Huffman (1986) claims that constraints on tongue body movement in /d/ and /l/ are
crucial in determining the degree of vowel-to-vowel coarticulation across these consonants.
Interestingly, work in the audio-visual domain reinforces these findings of articu-
latory and acoustic stability for /i/. In experiments involving the McGurk effect (McGurk
and MacDonald 1976) a smaller range of visual articulations seem to be tolerated for /i/
than for the open vowel /a/. Green and Gerdeman (1995) find that auditory /i/ tokens
dubbed onto visual /a/ articulations were considered by subjects to be less compatible
than the reverse. Similarly, an incongruency between an auditory /i/ and a visual /a/
significantly slowed the identification of the initial consonant in a CV stimulus, whereas the
reverse pairing did not. They suggest that /a/ can be produced with a rather wide variety
of articulations, including degree of jaw-opening, whereas /i/ demands a relatively precise
articulatory configuration.
2.1.2 Language- and accent-specific differences
The studies just described encompass a wide variety of languages and it is possible
that this is the source of the discrepancy between the prosodic phonologists’ claims of
variability in /i/ and other reports of /i/’s stability. Kelly’s telly vs. Terry data come from
the North-West Midlands accent of English, whereas many of the studies showing /i/ to be
stable are from languages with quite different realizations of the phoneme and with quite
different phonological vowel systems.
However, there is some evidence from cross-linguistic work to suggest that we
might expect less coarticulatory variability in English, rather than more. It was mentioned
earlier that Manuel and Krakow find greater susceptibility to coarticulatory variation in /i/
than in /æ/ in the two Bantu languages Swahili and Shona. In the same study (1984) they
compare vowel-to-vowel coarticulation in English, a language with a relatively crowded
CHAPTER 2. INFLUENCE OF LIQUIDS ON FOLLOWING VOWELS 17
vowel space (13–15 vowels, depending on dialect) with Shona and Swahili, which have
relatively small and well-spaced vowel systems (both have the phonemic vowels /i e a o u/).
The prediction is that languages with small and very well-spaced phonological inventories
allow more coarticulation than languages with large and crowded inventories (cf. Manuel
1990). In accordance with their predictions, they find greater coarticulatory variability in
the vowels of Shona and Swahili than in English. The Manuel and Krakow data come from
American English, but if their theory is correct, and coarticulatory variability in vowels is
dependent on relative crowding of the vowel space, then the same should hold for British
English, since it has a very similar phonological inventory to American English.
Manuel and Krakow acknowledge that the relationship between the size and rela-
tive crowding of a language’s phonological inventory and the degree of coarticulatory vari-
ation allowed by that language is not straightforward. Farnetani (1990) points out that
context-induced nasalisation is very restricted in standard Italian, although the language
has only seven vowel phonemes and no nasal vowels. In the other direction, English, with
its very crowded vowel inventory, is often described as permitting a great deal of variation
in the realization of vowels, particularly in unstressed syllables. Delattre (1965) compares
American English with French, German and Spanish and states that 90% of unstressed
vowels in English are realized as some variety of schwa, whereas a far smaller proportion of
centred vowels is found for the other languages. Furthermore, he suggests that “distortion of
vowel colour” by consonant anticipation is far more pronounced in English than in the other
languages. This comment is particularly interesting, given that Spanish has a very small
and uncrowded vowel inventory (/i e a o u/) compared with English. Farnetani (1990) does
suggest that most vowel variation in English is in the front-back dimension and English has
fewer vowels distributed along this horizontal plane than vowels which are distinguished by
height. But clearly the factors determining a language’s propensity to allow coarticulatory
variability are highly complex.
As well as encompassing a wide variety of languages, the studies under discussion
in Section 2.1.1 also differ in the particular sounds they investigate. Only the prosodic
phonologists look at /i/ in the context of /r/ and /l/. The experiments showing /i/ to be a
stable sound focus on vowel-to-vowel coarticulation or on the influence of stops and fricatives
on vowels. A further difference is that the prosodic phonologists’ examples discussed here
tend to involve unstressed vowels, whereas the other studies predominantly focus on stressed
syllables. Using the Bladon and Al-Bamerni (1976) notion of coarticulatory resistance (CR),
CHAPTER 2. INFLUENCE OF LIQUIDS ON FOLLOWING VOWELS 18
it seems unlikely that a sound would have a single CR value across all stress conditions and
phonetic contexts. It is quite possible that stressed /i/ generally varies little in its realization
(i.e. has a high CR value), but that in the specific contexts of /r/ and /l/ or when unstressed,
it can vary a lot (i.e. has a low CR value).
2.1.3 Resolving contradictions over variability of /i/
In his work on the West Midlands accent of English, Kelly (1989) presents EPG
data showing that a velar plosive after /ri/ is produced with a more fronted articulation
than the same consonant after /li/ (note that these resonances are the reverse of what is
found for SSBE). He also claims that the intervening vowels are auditorily different between
the two contexts, but provides no empirical evidence to back up these impressionistic claims.
Providing such data is clearly necessary if such contextual information is to be incorporated
in synthetic speech.
In previous work I investigated the acoustic characteristics of the vowels /i:/ and
/E:/ in the context of /r/ and /l/ in SSBE (Tunley 1995). That experiment showed that F2
and F3 frequencies in /i:/ varied more between /r/ and /l/ contexts than did F2 and F3 in
/E:/. This seems to contradict the predictions of Quantal Theory and the articulatory and
acoustic data of Recasens and others and it lends support to the prosodic phonologists.
In order to explain the apparent discrepancy between this finding and Recasens’
data, I suggested that there is something specific to the type of coarticulatory influence
exerted by rhotic consonants that affects /i/ more than other vowels and thus goes against
the general trend of stability for this vowel in other contexts. One suggestion is that it is
possible to articulate an /i/ whilst keeping the tongue in a position not far removed from
that for the retroflex or rhotic /r/. Such an articulation is perhaps less likely, for the more
open vowel /E/, since, in order to articulate /E/, the tongue has to come a long way out of
the configuration for /r/. Alternatively there may not be a straightforward physiological
explanation for the pattern. The detailed patterns of coarticulation are largely language-
and dialect-specific, and so cannot entirely be explained in terms of production strategies.
Extreme rhotic colouring of /i/ may simply be a convention adopted at least by SSBE
speakers.
Articulatory data may shed light on the precise patterns of variation found. But
the key interest here is to document fine acoustic detail and to assess its potential contri-
CHAPTER 2. INFLUENCE OF LIQUIDS ON FOLLOWING VOWELS 19
bution to the quality of synthetic speech. The focus in my earlier work was primarily on
/r/, as predictions about the acoustic influence of this sound are much more straightforward
than for /l/. Gimson (1970) describes RP English /r/ as being generally realised as a voiced
frictionless continuant, and this seems to be approximately equivalent to a contemporary
SSBE realization. Most importantly for present purposes the sound is characterised by
having low F3 and F4 frequencies (Fant 1973). The consonant has a predictable effect on
vowels, in that it lowers the frequency of F2, F3 and possibly F4. On the other hand, the
realization of /l/, and especially the frequency of F2, is heavily dependent on surrounding
vowels (Bladon and Al-Bamerni 1976). Given this contextual variation it is difficult to
predict how /l/ will affect the realization of surrounding vowels.
This chapter describes an experiment which expands on the findings of Tunley
(1995) and which examines more closely some of the unresolved issues of that work. Specif-
ically the inclusion of /h/ as a neutral context for comparison with the /r/ and /l/ contexts
facilitates the discussion of the coarticulatory influence of these sounds.
2.2 Research Questions
Following the findings of Tunley (1995) it is predicted that the rhotic approximant
/r/ will exert the greatest coarticulatory influence on high vowels and the least influence
on low vowels. This is measured in terms of the shift in F2 and F3 frequency in vowels
in the context of /r/ relative to their frequency in the context of /h/, a lingually neutral
articulation. /l/ is included here since it was used as a comparison for the /r/ context
vowels in the 1995 study. In that experiment it was not clear precisely what coarticulatory
effects were exerted by /l/ on vowels, and it is hoped that this will be easier to assess in
the three-way consonant context design proposed here.
Anticipatory V-to-C effects in the consonants are also explored here and a prelim-
inary investigation is undertaken into the perseverative spread of consonant to schwa effects
across intervening segments in /CVC@/ sequences.
2.3 Materials
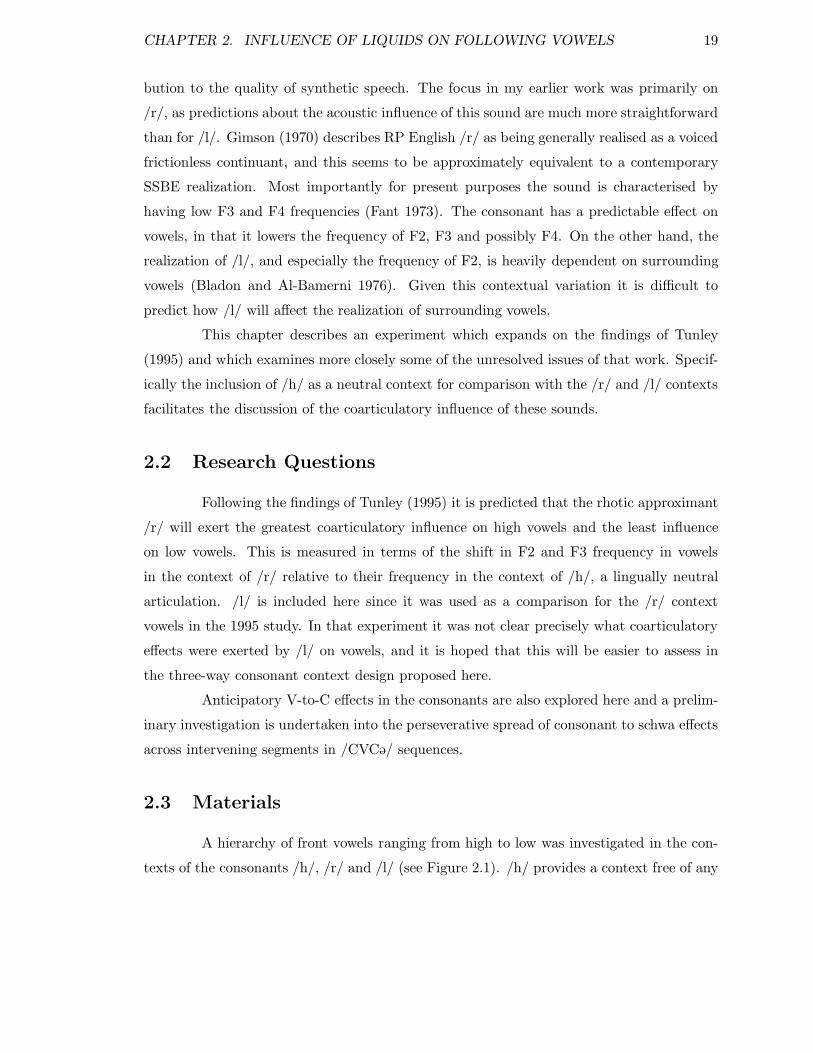
A hierarchy of front vowels ranging from high to low was investigated in the con-
texts of the consonants /h/, /r/ and /l/ (see Figure 2.1). /h/ provides a context free of any
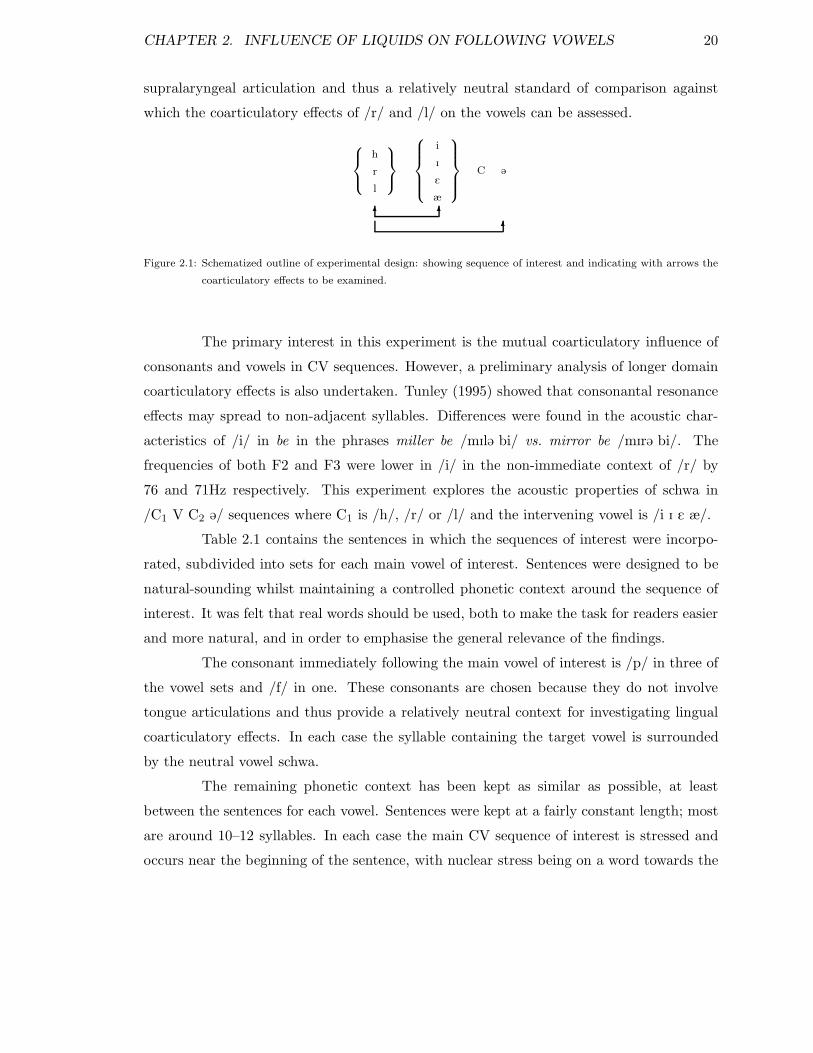
CHAPTER 2. INFLUENCE OF LIQUIDS ON FOLLOWING VOWELS 20
supralaryngeal articulation and thus a relatively neutral standard of comparison against
which the coarticulatory effects of /r/ and /l/ on the vowels can be assessed.
h
r
l
i
I
E
æ
C @
6 66
Figure 2.1: Schematized outline of experimental design: showing sequence of interest and indicating with arrows the
coarticulatory effects to be examined.
The primary interest in this experiment is the mutual coarticulatory influence of
consonants and vowels in CV sequences. However, a preliminary analysis of longer domain
coarticulatory effects is also undertaken. Tunley (1995) showed that consonantal resonance
effects may spread to non-adjacent syllables. Differences were found in the acoustic char-
acteristics of /i/ in be in the phrases miller be /mIl@ bi/ vs. mirror be /mIr@ bi/. The
frequencies of both F2 and F3 were lower in /i/ in the non-immediate context of /r/ by
76 and 71Hz respectively. This experiment explores the acoustic properties of schwa in
/C1 V C2 @/ sequences where C1 is /h/, /r/ or /l/ and the intervening vowel is /i I E æ/.
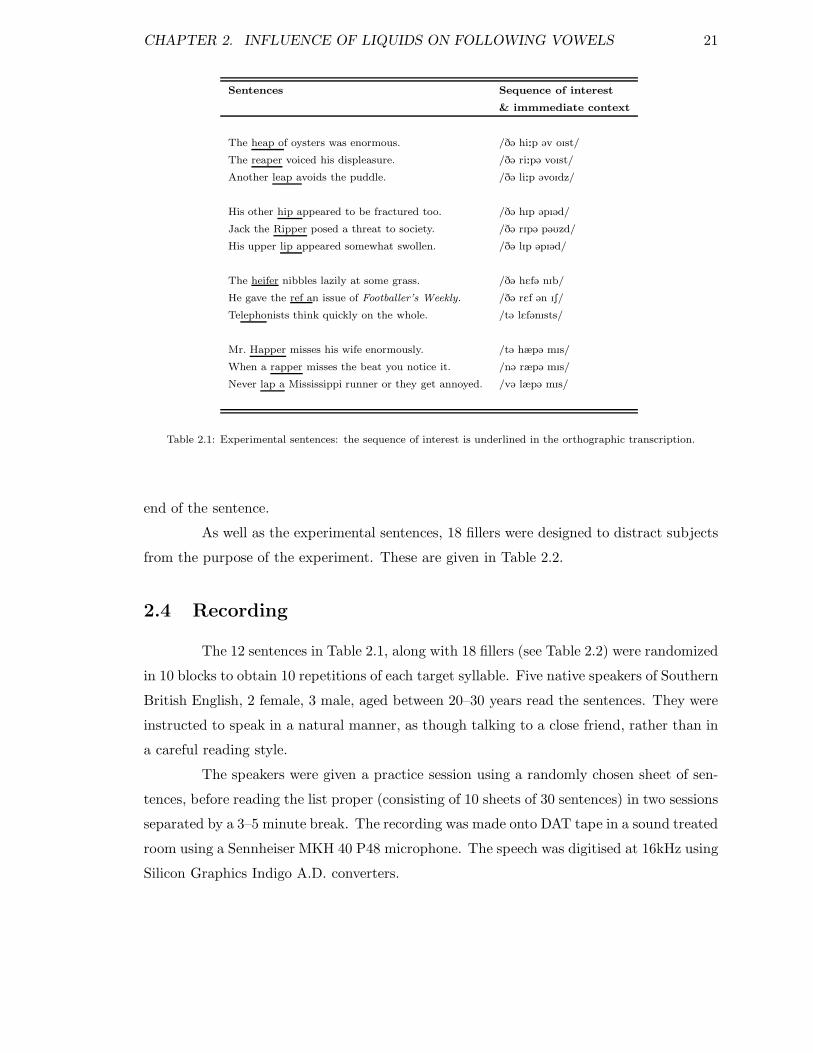
Table 2.1 contains the sentences in which the sequences of interest were incorpo-
rated, subdivided into sets for each main vowel of interest. Sentences were designed to be
natural-sounding whilst maintaining a controlled phonetic context around the sequence of
interest. It was felt that real words should be used, both to make the task for readers easier
and more natural, and in order to emphasise the general relevance of the findings.
The consonant immediately following the main vowel of interest is /p/ in three of
the vowel sets and /f/ in one. These consonants are chosen because they do not involve
tongue articulations and thus provide a relatively neutral context for investigating lingual
coarticulatory effects. In each case the syllable containing the target vowel is surrounded
by the neutral vowel schwa.
The remaining phonetic context has been kept as similar as possible, at least
between the sentences for each vowel. Sentences were kept at a fairly constant length; most
are around 10–12 syllables. In each case the main CV sequence of interest is stressed and
occurs near the beginning of the sentence, with nuclear stress being on a word towards the
CHAPTER 2. INFLUENCE OF LIQUIDS ON FOLLOWING VOWELS 21
Sentences Sequence of interest
& immmediate context
The heap of oysters was enormous. /D@ hi:p @v oIst/
The reaper voiced his displeasure. /D@ ri:p@ voIst/
Another leap avoids the puddle. /D@ li:p @voIdz/
His other hip appeared to be fractured too. /D@ hIp @pI@d/
Jack the Ripper posed a threat to society. /D@ rIp@ p@Uzd/
His upper lip appeared somewhat swollen. /D@ lIp @pI@d/
The heifer nibbles lazily at some grass. /D@ hEf@ nIb/
He gave the ref an issue of Footballer’s Weekly. /D@ rEf @n IS/
Telephonists think quickly on the whole. /t@ lEf@nIsts/
Mr. Happer misses his wife enormously. /t@ hæp@ mIs/
When a rapper misses the beat you notice it. /n@ ræp@ mIs/
Never lap a Mississippi runner or they get annoyed. /v@ læp@ mIs/
Table 2.1: Experimental sentences: the sequence of interest is underlined in the orthographic transcription.
end of the sentence.
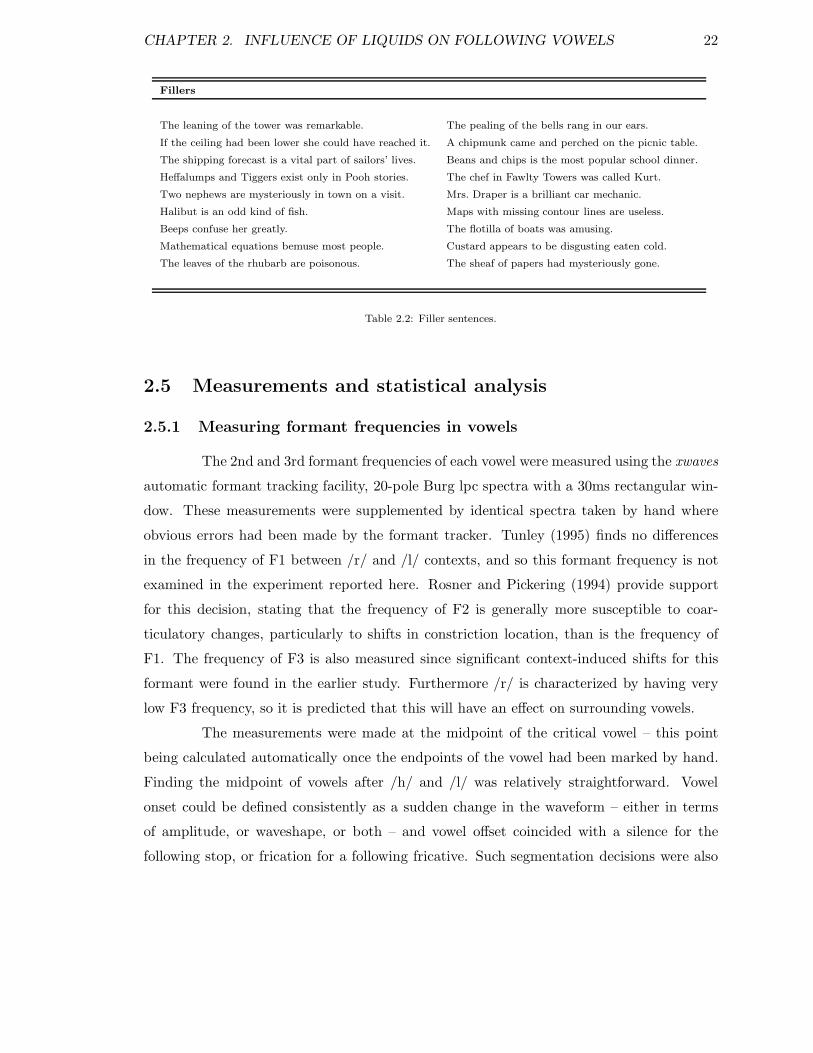
As well as the experimental sentences, 18 fillers were designed to distract subjects
from the purpose of the experiment. These are given in Table 2.2.
2.4 Recording
The 12 sentences in Table 2.1, along with 18 fillers (see Table 2.2) were randomized
in 10 blocks to obtain 10 repetitions of each target syllable. Five native speakers of Southern
British English, 2 female, 3 male, aged between 20–30 years read the sentences. They were
instructed to speak in a natural manner, as though talking to a close friend, rather than in
a careful reading style.
The speakers were given a practice session using a randomly chosen sheet of sen-
tences, before reading the list proper (consisting of 10 sheets of 30 sentences) in two sessions
separated by a 3–5 minute break. The recording was made onto DAT tape in a sound treated
room using a Sennheiser MKH 40 P48 microphone. The speech was digitised at 16kHz using
Silicon Graphics Indigo A.D. converters.
CHAPTER 2. INFLUENCE OF LIQUIDS ON FOLLOWING VOWELS 22
Fillers
The leaning of the tower was remarkable. The pealing of the bells rang in our ears.
If the ceiling had been lower she could have reached it. A chipmunk came and perched on the picnic table.
The shipping forecast is a vital part of sailors’ lives. Beans and chips is the most popular school dinner.
Heffalumps and Tiggers exist only in Pooh stories. The chef in Fawlty Towers was called Kurt.
Two nephews are mysteriously in town on a visit. Mrs. Draper is a brilliant car mechanic.
Halibut is an odd kind of fish. Maps with missing contour lines are useless.
Beeps confuse her greatly. The flotilla of boats was amusing.
Mathematical equations bemuse most people. Custard appears to be disgusting eaten cold.
The leaves of the rhubarb are poisonous. The sheaf of papers had mysteriously gone.
Table 2.2: Filler sentences.
2.5 Measurements and statistical analysis
2.5.1 Measuring formant frequencies in vowels
The 2nd and 3rd formant frequencies of each vowel were measured using the xwaves
automatic formant tracking facility, 20-pole Burg lpc spectra with a 30ms rectangular win-
dow. These measurements were supplemented by identical spectra taken by hand where
obvious errors had been made by the formant tracker. Tunley (1995) finds no differences
in the frequency of F1 between /r/ and /l/ contexts, and so this formant frequency is not
examined in the experiment reported here. Rosner and Pickering (1994) provide support
for this decision, stating that the frequency of F2 is generally more susceptible to coar-
ticulatory changes, particularly to shifts in constriction location, than is the frequency of
F1. The frequency of F3 is also measured since significant context-induced shifts for this
formant were found in the earlier study. Furthermore /r/ is characterized by having very
low F3 frequency, so it is predicted that this will have an effect on surrounding vowels.
The measurements were made at the midpoint of the critical vowel – this point
being calculated automatically once the endpoints of the vowel had been marked by hand.
Finding the midpoint of vowels after /h/ and /l/ was relatively straightforward. Vowel
onset could be defined consistently as a sudden change in the waveform – either in terms
of amplitude, or waveshape, or both – and vowel offset coincided with a silence for the
following stop, or frication for a following fricative. Such segmentation decisions were also
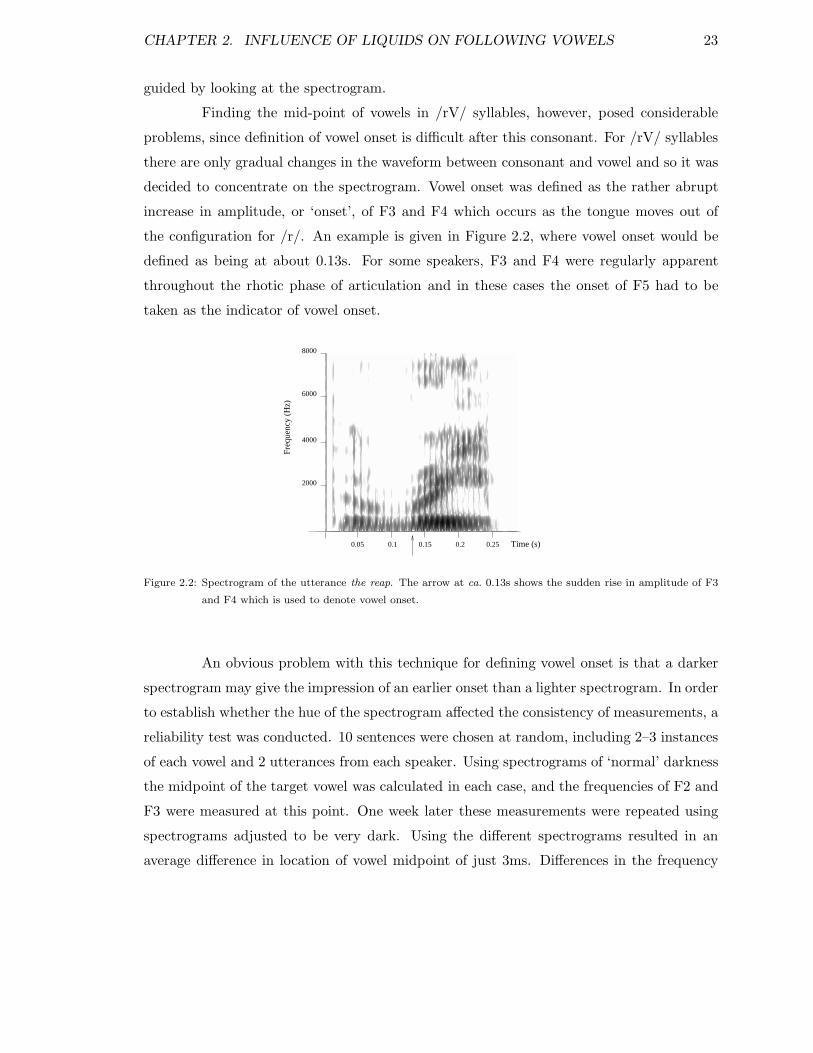
CHAPTER 2. INFLUENCE OF LIQUIDS ON FOLLOWING VOWELS 23
guided by looking at the spectrogram.
Finding the mid-point of vowels in /rV/ syllables, however, posed considerable
problems, since definition of vowel onset is difficult after this consonant. For /rV/ syllables
there are only gradual changes in the waveform between consonant and vowel and so it was
decided to concentrate on the spectrogram. Vowel onset was defined as the rather abrupt
increase in amplitude, or ‘onset’, of F3 and F4 which occurs as the tongue moves out of
the configuration for /r/. An example is given in Figure 2.2, where vowel onset would be
defined as being at about 0.13s. For some speakers, F3 and F4 were regularly apparent
throughout the rhotic phase of articulation and in these cases the onset of F5 had to be
taken as the indicator of vowel onset.
Time: 2.5530 Freq: 0.00 Value: 55 D: 0.28819 L: 2.55050 R: 2.83869 (F: 3.47)
0.05
2000
4000
6000
0.25 Time (s)
Freq
uenc
y (H
z)
0.15 0.20.1
8000
Figure 2.2: Spectrogram of the utterance the reap. The arrow at ca. 0.13s shows the sudden rise in amplitude of F3
and F4 which is used to denote vowel onset.
An obvious problem with this technique for defining vowel onset is that a darker
spectrogram may give the impression of an earlier onset than a lighter spectrogram. In order
to establish whether the hue of the spectrogram affected the consistency of measurements, a
reliability test was conducted. 10 sentences were chosen at random, including 2–3 instances
of each vowel and 2 utterances from each speaker. Using spectrograms of ‘normal’ darkness
the midpoint of the target vowel was calculated in each case, and the frequencies of F2 and
F3 were measured at this point. One week later these measurements were repeated using
spectrograms adjusted to be very dark. Using the different spectrograms resulted in an
average difference in location of vowel midpoint of just 3ms. Differences in the frequency
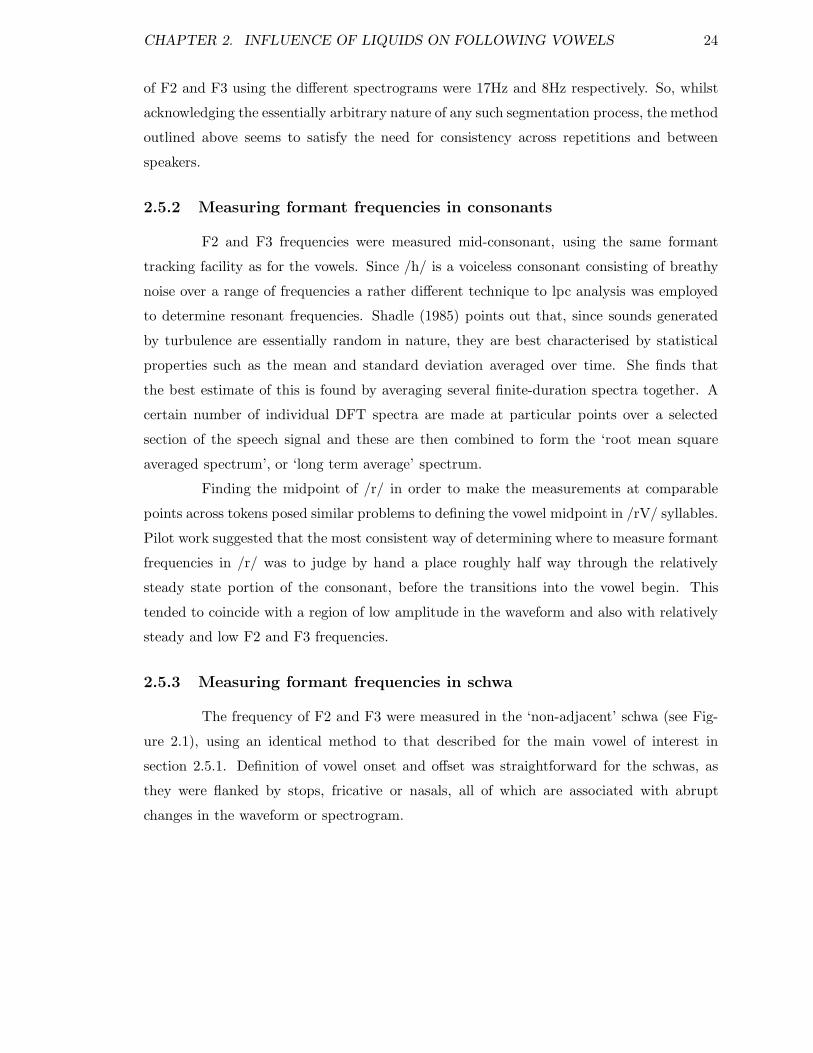
CHAPTER 2. INFLUENCE OF LIQUIDS ON FOLLOWING VOWELS 24
of F2 and F3 using the different spectrograms were 17Hz and 8Hz respectively. So, whilst
acknowledging the essentially arbitrary nature of any such segmentation process, the method
outlined above seems to satisfy the need for consistency across repetitions and between
speakers.
2.5.2 Measuring formant frequencies in consonants
F2 and F3 frequencies were measured mid-consonant, using the same formant
tracking facility as for the vowels. Since /h/ is a voiceless consonant consisting of breathy
noise over a range of frequencies a rather different technique to lpc analysis was employed
to determine resonant frequencies. Shadle (1985) points out that, since sounds generated
by turbulence are essentially random in nature, they are best characterised by statistical
properties such as the mean and standard deviation averaged over time. She finds that
the best estimate of this is found by averaging several finite-duration spectra together. A
certain number of individual DFT spectra are made at particular points over a selected
section of the speech signal and these are then combined to form the ‘root mean square
averaged spectrum’, or ‘long term average’ spectrum.
Finding the midpoint of /r/ in order to make the measurements at comparable
points across tokens posed similar problems to defining the vowel midpoint in /rV/ syllables.
Pilot work suggested that the most consistent way of determining where to measure formant
frequencies in /r/ was to judge by hand a place roughly half way through the relatively
steady state portion of the consonant, before the transitions into the vowel begin. This
tended to coincide with a region of low amplitude in the waveform and also with relatively
steady and low F2 and F3 frequencies.
2.5.3 Measuring formant frequencies in schwa
The frequency of F2 and F3 were measured in the ‘non-adjacent’ schwa (see Fig-
ure 2.1), using an identical method to that described for the main vowel of interest in
section 2.5.1. Definition of vowel onset and offset was straightforward for the schwas, as
they were flanked by stops, fricative or nasals, all of which are associated with abrupt
changes in the waveform or spectrogram.
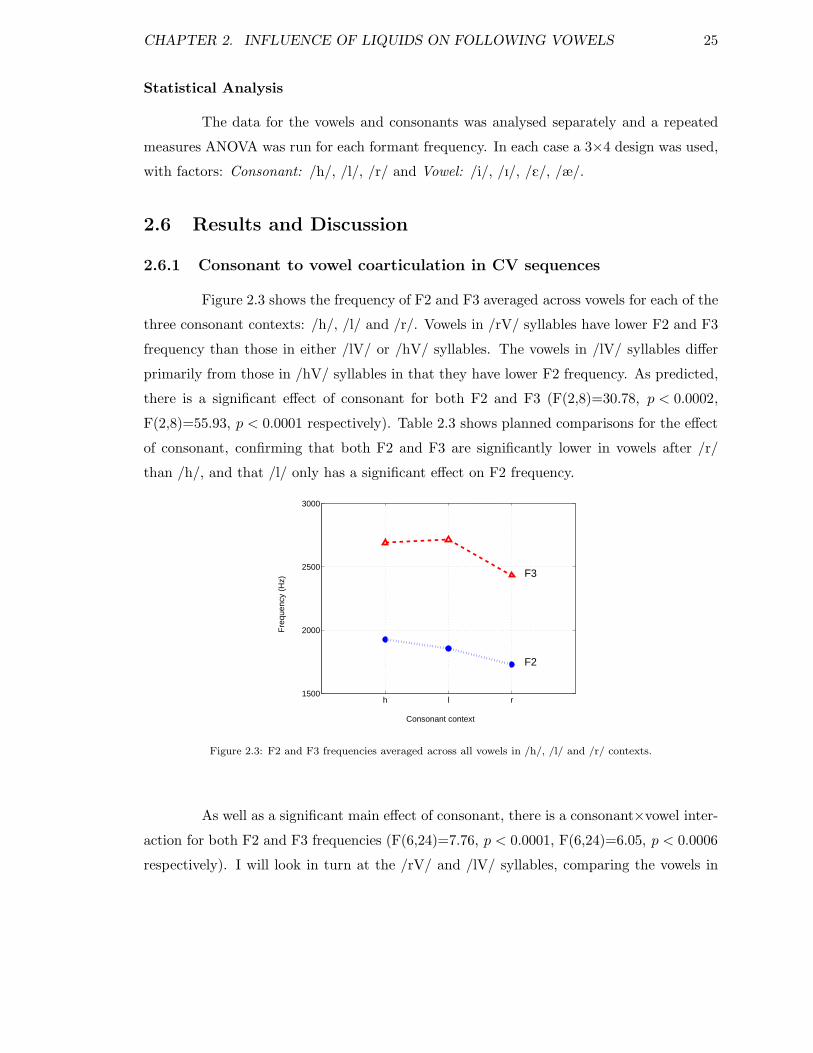
CHAPTER 2. INFLUENCE OF LIQUIDS ON FOLLOWING VOWELS 25
Statistical Analysis
The data for the vowels and consonants was analysed separately and a repeated
measures ANOVA was run for each formant frequency. In each case a 3×4 design was used,
with factors: Consonant: /h/, /l/, /r/ and Vowel: /i/, /I/, /E/, /æ/.
2.6 Results and Discussion
2.6.1 Consonant to vowel coarticulation in CV sequences
Figure 2.3 shows the frequency of F2 and F3 averaged across vowels for each of the
three consonant contexts: /h/, /l/ and /r/. Vowels in /rV/ syllables have lower F2 and F3
frequency than those in either /lV/ or /hV/ syllables. The vowels in /lV/ syllables differ
primarily from those in /hV/ syllables in that they have lower F2 frequency. As predicted,
there is a significant effect of consonant for both F2 and F3 (F(2,8)=30.78, p < 0.0002,
F(2,8)=55.93, p < 0.0001 respectively). Table 2.3 shows planned comparisons for the effect
of consonant, confirming that both F2 and F3 are significantly lower in vowels after /r/
than /h/, and that /l/ only has a significant effect on F2 frequency.
Consonant context
Fre
quen
cy (
Hz)
h l r1500
2000
2500
3000
F3
F2
Figure 2.3: F2 and F3 frequencies averaged across all vowels in /h/, /l/ and /r/ contexts.
As well as a significant main effect of consonant, there is a consonant×vowel inter-
action for both F2 and F3 frequencies (F(6,24)=7.76, p < 0.0001, F(6,24)=6.05, p < 0.0006
respectively). I will look in turn at the /rV/ and /lV/ syllables, comparing the vowels in
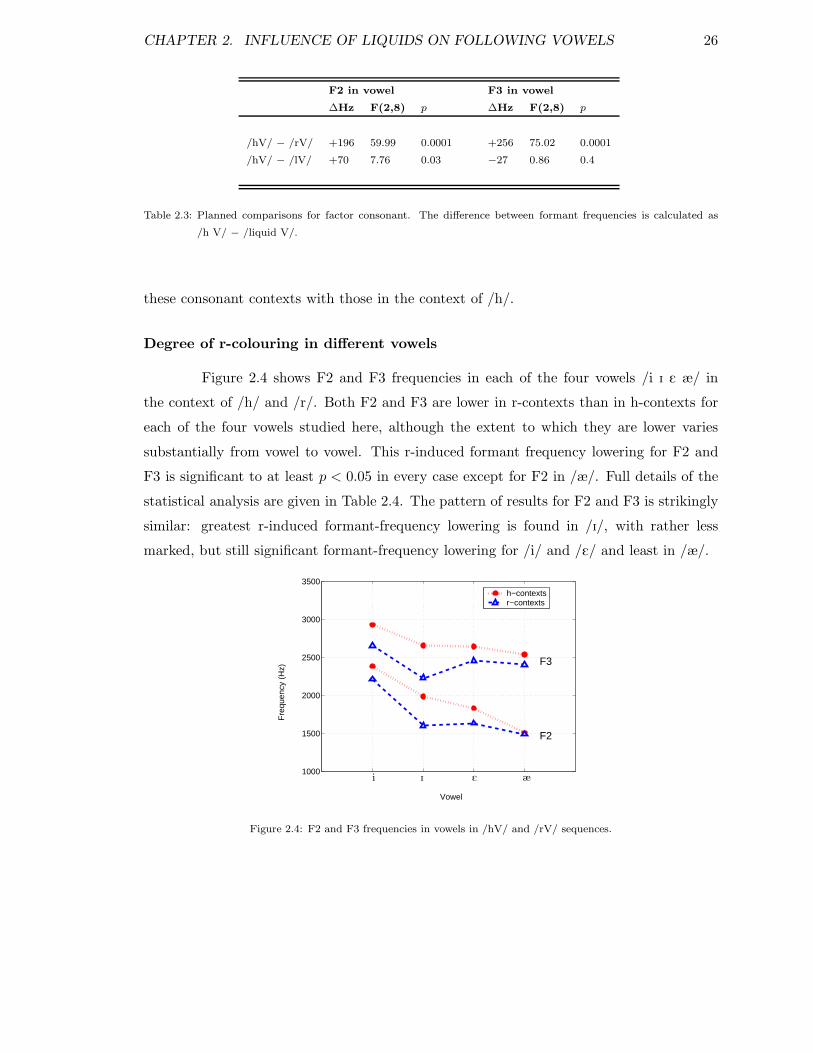
CHAPTER 2. INFLUENCE OF LIQUIDS ON FOLLOWING VOWELS 26
F2 in vowel F3 in vowel
∆Hz F(2,8) p ∆Hz F(2,8) p
/hV/ − /rV/ +196 59.99 0.0001 +256 75.02 0.0001
/hV/ − /lV/ +70 7.76 0.03 −27 0.86 0.4
Table 2.3: Planned comparisons for factor consonant. The difference between formant frequencies is calculated as
/h V/ − /liquid V/.
these consonant contexts with those in the context of /h/.
Degree of r-colouring in different vowels
Figure 2.4 shows F2 and F3 frequencies in each of the four vowels /i I E æ/ in
the context of /h/ and /r/. Both F2 and F3 are lower in r-contexts than in h-contexts for
each of the four vowels studied here, although the extent to which they are lower varies
substantially from vowel to vowel. This r-induced formant frequency lowering for F2 and
F3 is significant to at least p < 0.05 in every case except for F2 in /æ/. Full details of the
statistical analysis are given in Table 2.4. The pattern of results for F2 and F3 is strikingly
similar: greatest r-induced formant-frequency lowering is found in /I/, with rather less
marked, but still significant formant-frequency lowering for /i/ and /E/ and least in /æ/.
Vowel
Fre
quen
cy (
Hz)
1000
1500
2000
2500
3000
3500
F3
F2
h−contextsr−contexts
i I E æ
Figure 2.4: F2 and F3 frequencies in vowels in /hV/ and /rV/ sequences.
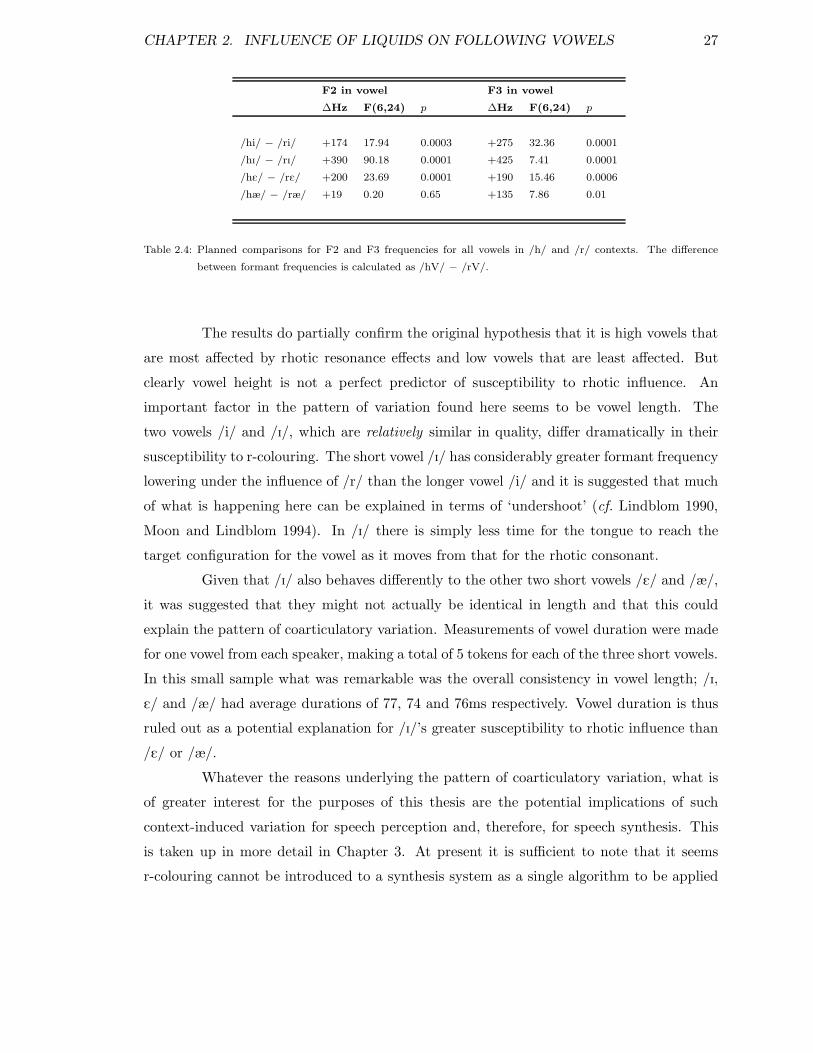
CHAPTER 2. INFLUENCE OF LIQUIDS ON FOLLOWING VOWELS 27
F2 in vowel F3 in vowel
∆Hz F(6,24) p ∆Hz F(6,24) p
/hi/ − /ri/ +174 17.94 0.0003 +275 32.36 0.0001
/hI/ − /rI/ +390 90.18 0.0001 +425 7.41 0.0001
/hE/ − /rE/ +200 23.69 0.0001 +190 15.46 0.0006
/hæ/ − /ræ/ +19 0.20 0.65 +135 7.86 0.01
Table 2.4: Planned comparisons for F2 and F3 frequencies for all vowels in /h/ and /r/ contexts. The difference
between formant frequencies is calculated as /hV/ − /rV/.
The results do partially confirm the original hypothesis that it is high vowels that
are most affected by rhotic resonance effects and low vowels that are least affected. But
clearly vowel height is not a perfect predictor of susceptibility to rhotic influence. An
important factor in the pattern of variation found here seems to be vowel length. The
two vowels /i/ and /I/, which are relatively similar in quality, differ dramatically in their
susceptibility to r-colouring. The short vowel /I/ has considerably greater formant frequency
lowering under the influence of /r/ than the longer vowel /i/ and it is suggested that much
of what is happening here can be explained in terms of ‘undershoot’ (cf. Lindblom 1990,
Moon and Lindblom 1994). In /I/ there is simply less time for the tongue to reach the
target configuration for the vowel as it moves from that for the rhotic consonant.
Given that /I/ also behaves differently to the other two short vowels /E/ and /æ/,
it was suggested that they might not actually be identical in length and that this could
explain the pattern of coarticulatory variation. Measurements of vowel duration were made
for one vowel from each speaker, making a total of 5 tokens for each of the three short vowels.
In this small sample what was remarkable was the overall consistency in vowel length; /I,
E/ and /æ/ had average durations of 77, 74 and 76ms respectively. Vowel duration is thus
ruled out as a potential explanation for /I/’s greater susceptibility to rhotic influence than
/E/ or /æ/.
Whatever the reasons underlying the pattern of coarticulatory variation, what is
of greater interest for the purposes of this thesis are the potential implications of such
context-induced variation for speech perception and, therefore, for speech synthesis. This
is taken up in more detail in Chapter 3. At present it is sufficient to note that it seems
r-colouring cannot be introduced to a synthesis system as a single algorithm to be applied
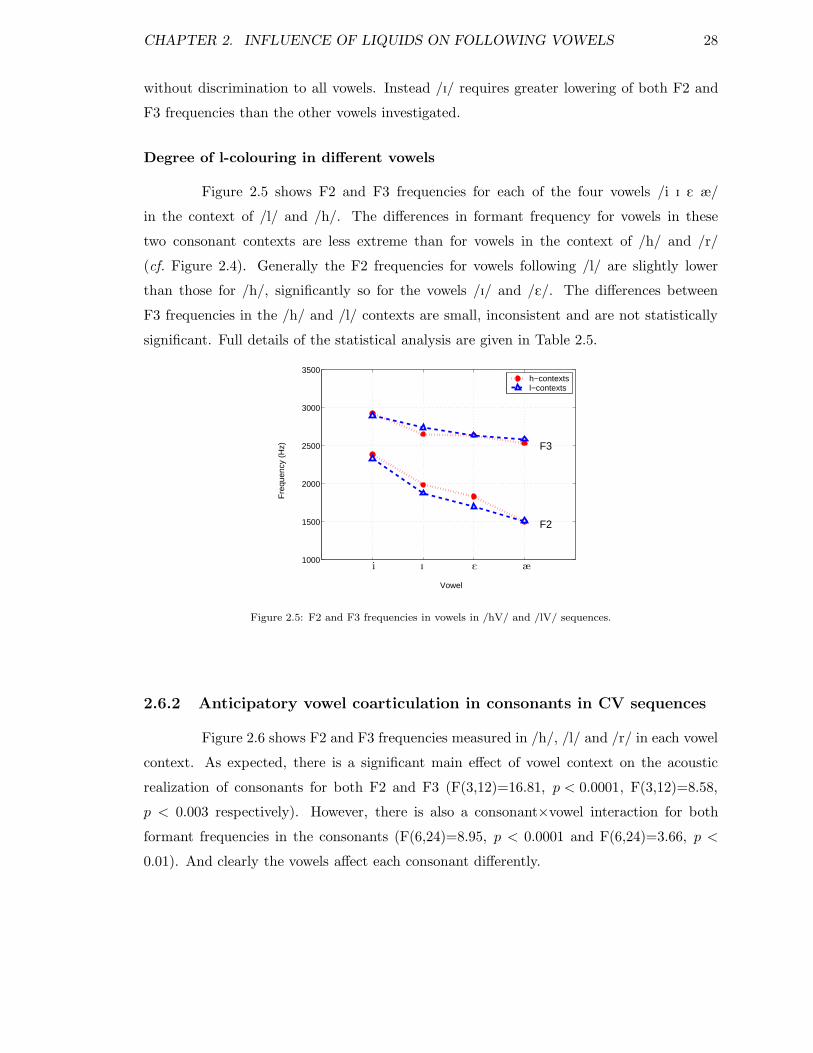
CHAPTER 2. INFLUENCE OF LIQUIDS ON FOLLOWING VOWELS 28
without discrimination to all vowels. Instead /I/ requires greater lowering of both F2 and
F3 frequencies than the other vowels investigated.
Degree of l-colouring in different vowels
Figure 2.5 shows F2 and F3 frequencies for each of the four vowels /i I E æ/
in the context of /l/ and /h/. The differences in formant frequency for vowels in these
two consonant contexts are less extreme than for vowels in the context of /h/ and /r/
(cf. Figure 2.4). Generally the F2 frequencies for vowels following /l/ are slightly lower
than those for /h/, significantly so for the vowels /I/ and /E/. The differences between
F3 frequencies in the /h/ and /l/ contexts are small, inconsistent and are not statistically
significant. Full details of the statistical analysis are given in Table 2.5.
Vowel
Fre
quen
cy (
Hz)
1000
1500
2000
2500
3000
3500
F3
F2
h−contextsl−contexts
i I E æ
Figure 2.5: F2 and F3 frequencies in vowels in /hV/ and /lV/ sequences.
2.6.2 Anticipatory vowel coarticulation in consonants in CV sequences
Figure 2.6 shows F2 and F3 frequencies measured in /h/, /l/ and /r/ in each vowel
context. As expected, there is a significant main effect of vowel context on the acoustic
realization of consonants for both F2 and F3 (F(3,12)=16.81, p < 0.0001, F(3,12)=8.58,
p < 0.003 respectively). However, there is also a consonant×vowel interaction for both
formant frequencies in the consonants (F(6,24)=8.95, p < 0.0001 and F(6,24)=3.66, p <
0.01). And clearly the vowels affect each consonant differently.
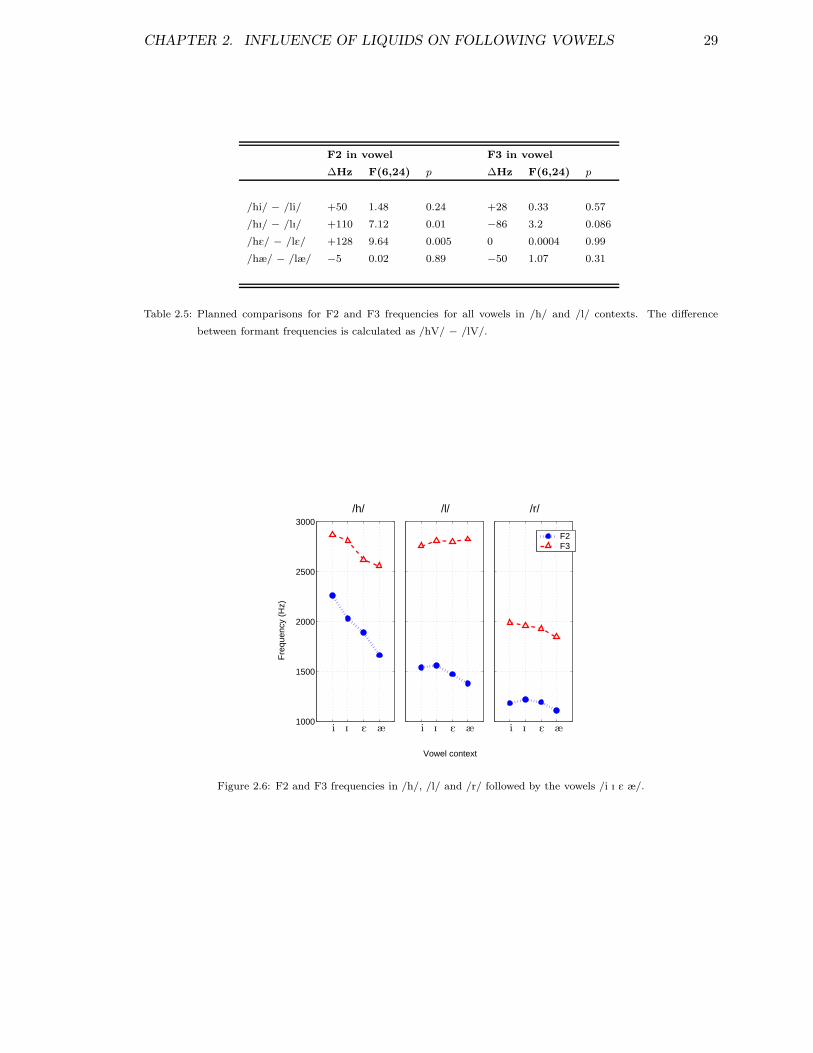
CHAPTER 2. INFLUENCE OF LIQUIDS ON FOLLOWING VOWELS 29
F2 in vowel F3 in vowel
∆Hz F(6,24) p ∆Hz F(6,24) p
/hi/ − /li/ +50 1.48 0.24 +28 0.33 0.57
/hI/ − /lI/ +110 7.12 0.01 −86 3.2 0.086
/hE/ − /lE/ +128 9.64 0.005 0 0.0004 0.99
/hæ/ − /læ/ −5 0.02 0.89 −50 1.07 0.31
Table 2.5: Planned comparisons for F2 and F3 frequencies for all vowels in /h/ and /l/ contexts. The difference
between formant frequencies is calculated as /hV/ − /lV/.
Vowel context
Fre
quen
cy (
Hz)
/h/ /l/ /r/
1000
1500
2000
2500
3000
F2F3
iii III EEE æææ
Figure 2.6: F2 and F3 frequencies in /h/, /l/ and /r/ followed by the vowels /i I E æ/.
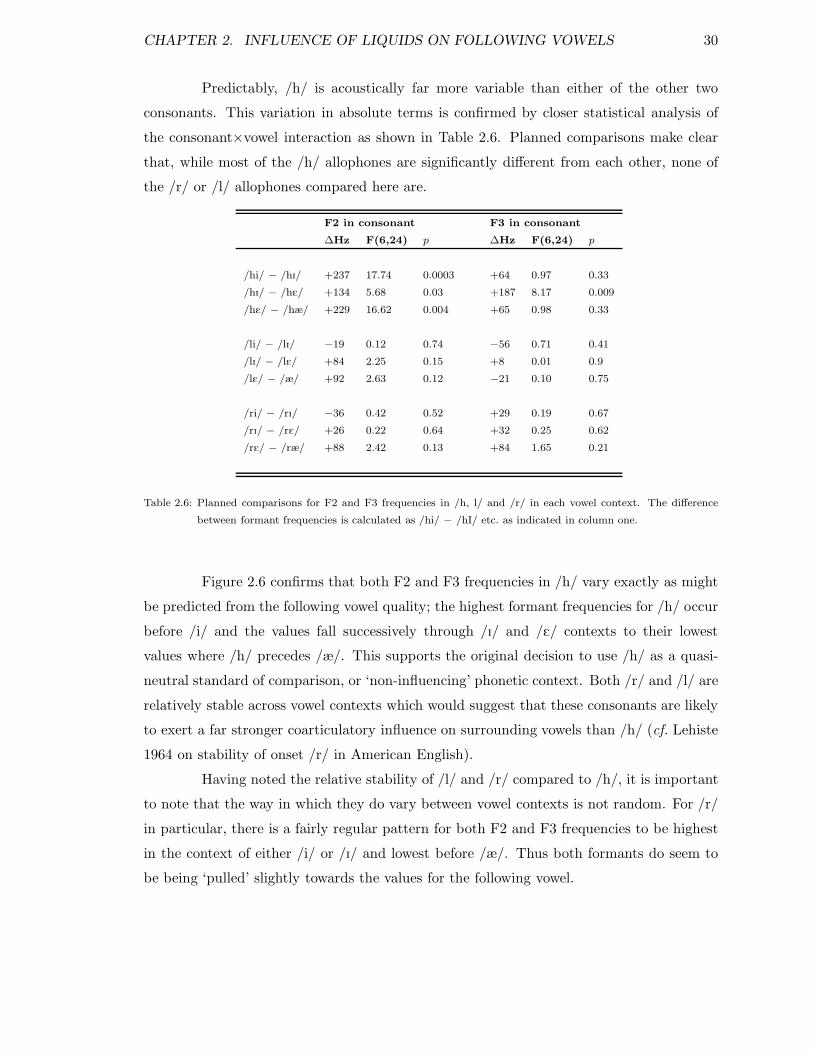
CHAPTER 2. INFLUENCE OF LIQUIDS ON FOLLOWING VOWELS 30
Predictably, /h/ is acoustically far more variable than either of the other two
consonants. This variation in absolute terms is confirmed by closer statistical analysis of
the consonant×vowel interaction as shown in Table 2.6. Planned comparisons make clear
that, while most of the /h/ allophones are significantly different from each other, none of
the /r/ or /l/ allophones compared here are.
F2 in consonant F3 in consonant
∆Hz F(6,24) p ∆Hz F(6,24) p
/hi/ − /hI/ +237 17.74 0.0003 +64 0.97 0.33
/hI/ − /hE/ +134 5.68 0.03 +187 8.17 0.009
/hE/ − /hæ/ +229 16.62 0.004 +65 0.98 0.33
/li/ − /lI/ −19 0.12 0.74 −56 0.71 0.41
/lI/ − /lE/ +84 2.25 0.15 +8 0.01 0.9
/lE/ − /æ/ +92 2.63 0.12 −21 0.10 0.75
/ri/ − /rI/ −36 0.42 0.52 +29 0.19 0.67
/rI/ − /rE/ +26 0.22 0.64 +32 0.25 0.62
/rE/ − /ræ/ +88 2.42 0.13 +84 1.65 0.21
Table 2.6: Planned comparisons for F2 and F3 frequencies in /h, l/ and /r/ in each vowel context. The difference
between formant frequencies is calculated as /hi/ − /hI/ etc. as indicated in column one.
Figure 2.6 confirms that both F2 and F3 frequencies in /h/ vary exactly as might
be predicted from the following vowel quality; the highest formant frequencies for /h/ occur
before /i/ and the values fall successively through /I/ and /E/ contexts to their lowest
values where /h/ precedes /æ/. This supports the original decision to use /h/ as a quasi-
neutral standard of comparison, or ‘non-influencing’ phonetic context. Both /r/ and /l/ are
relatively stable across vowel contexts which would suggest that these consonants are likely
to exert a far stronger coarticulatory influence on surrounding vowels than /h/ (cf. Lehiste
1964 on stability of onset /r/ in American English).
Having noted the relative stability of /l/ and /r/ compared to /h/, it is important
to note that the way in which they do vary between vowel contexts is not random. For /r/
in particular, there is a fairly regular pattern for both F2 and F3 frequencies to be highest
in the context of either /i/ or /I/ and lowest before /æ/. Thus both formants do seem to
be being ‘pulled’ slightly towards the values for the following vowel.
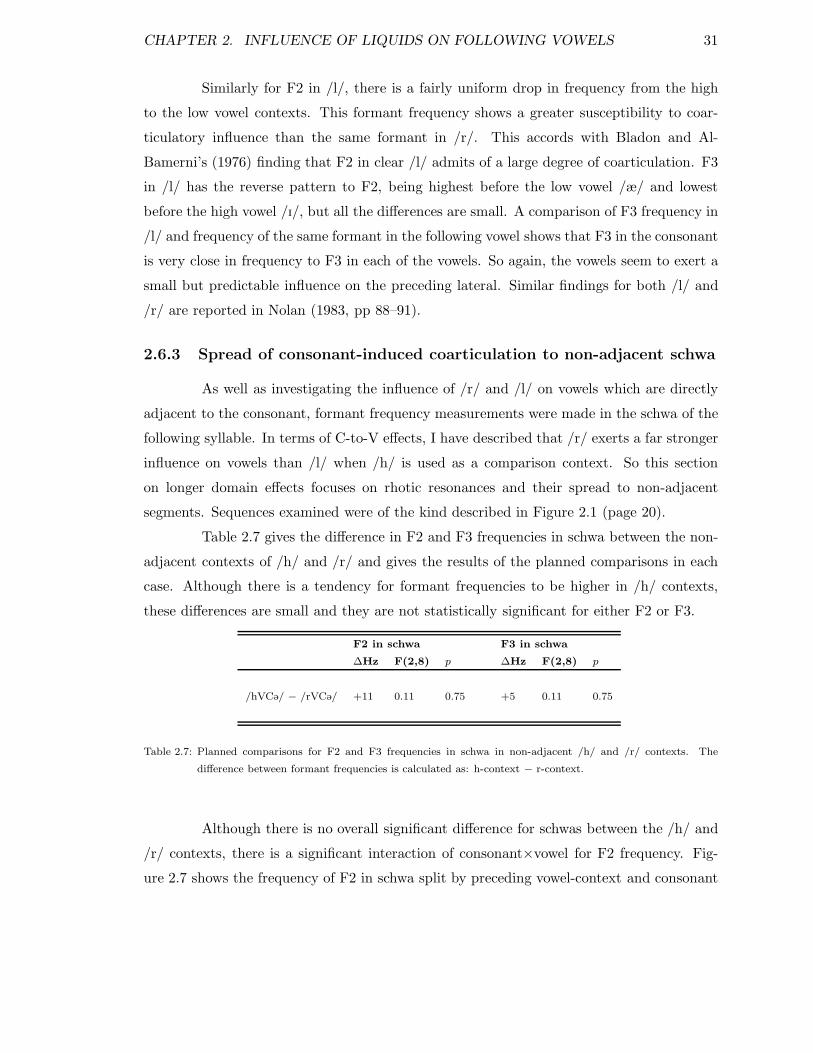
CHAPTER 2. INFLUENCE OF LIQUIDS ON FOLLOWING VOWELS 31
Similarly for F2 in /l/, there is a fairly uniform drop in frequency from the high
to the low vowel contexts. This formant frequency shows a greater susceptibility to coar-
ticulatory influence than the same formant in /r/. This accords with Bladon and Al-
Bamerni’s (1976) finding that F2 in clear /l/ admits of a large degree of coarticulation. F3
in /l/ has the reverse pattern to F2, being highest before the low vowel /æ/ and lowest
before the high vowel /I/, but all the differences are small. A comparison of F3 frequency in
/l/ and frequency of the same formant in the following vowel shows that F3 in the consonant
is very close in frequency to F3 in each of the vowels. So again, the vowels seem to exert a
small but predictable influence on the preceding lateral. Similar findings for both /l/ and
/r/ are reported in Nolan (1983, pp 88–91).
2.6.3 Spread of consonant-induced coarticulation to non-adjacent schwa
As well as investigating the influence of /r/ and /l/ on vowels which are directly
adjacent to the consonant, formant frequency measurements were made in the schwa of the
following syllable. In terms of C-to-V effects, I have described that /r/ exerts a far stronger
influence on vowels than /l/ when /h/ is used as a comparison context. So this section
on longer domain effects focuses on rhotic resonances and their spread to non-adjacent
segments. Sequences examined were of the kind described in Figure 2.1 (page 20).
Table 2.7 gives the difference in F2 and F3 frequencies in schwa between the non-
adjacent contexts of /h/ and /r/ and gives the results of the planned comparisons in each
case. Although there is a tendency for formant frequencies to be higher in /h/ contexts,
these differences are small and they are not statistically significant for either F2 or F3.
F2 in schwa F3 in schwa
∆Hz F(2,8) p ∆Hz F(2,8) p
/hVC@/ − /rVC@/ +11 0.11 0.75 +5 0.11 0.75
Table 2.7: Planned comparisons for F2 and F3 frequencies in schwa in non-adjacent /h/ and /r/ contexts. The
difference between formant frequencies is calculated as: h-context − r-context.
Although there is no overall significant difference for schwas between the /h/ and
/r/ contexts, there is a significant interaction of consonant×vowel for F2 frequency. Fig-
ure 2.7 shows the frequency of F2 in schwa split by preceding vowel-context and consonant
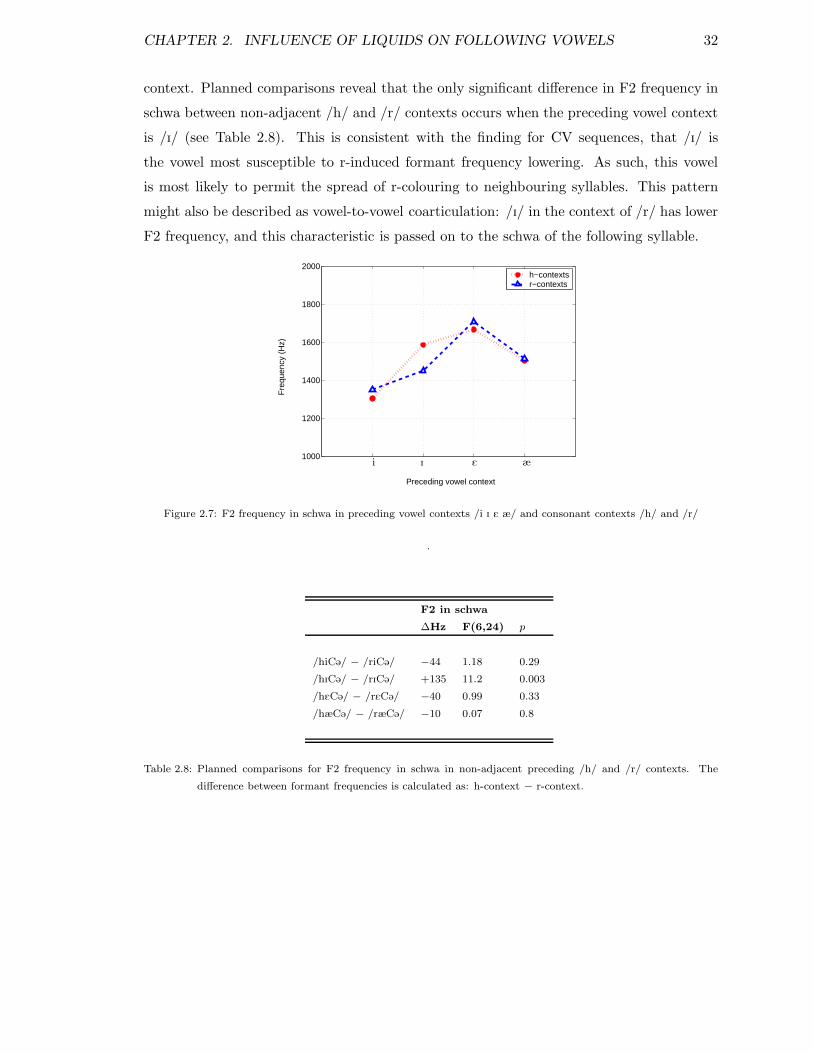
CHAPTER 2. INFLUENCE OF LIQUIDS ON FOLLOWING VOWELS 32
context. Planned comparisons reveal that the only significant difference in F2 frequency in
schwa between non-adjacent /h/ and /r/ contexts occurs when the preceding vowel context
is /I/ (see Table 2.8). This is consistent with the finding for CV sequences, that /I/ is
the vowel most susceptible to r-induced formant frequency lowering. As such, this vowel
is most likely to permit the spread of r-colouring to neighbouring syllables. This pattern
might also be described as vowel-to-vowel coarticulation: /I/ in the context of /r/ has lower
F2 frequency, and this characteristic is passed on to the schwa of the following syllable.
Preceding vowel context
Fre
quen
cy (
Hz)
1000
1200
1400
1600
1800
2000h−contextsr−contexts
i I E æ
Figure 2.7: F2 frequency in schwa in preceding vowel contexts /i I E æ/ and consonant contexts /h/ and /r/
.
F2 in schwa
∆Hz F(6,24) p
/hiC@/ − /riC@/ −44 1.18 0.29
/hIC@/ − /rIC@/ +135 11.2 0.003
/hEC@/ − /rEC@/ −40 0.99 0.33
/hæC@/ − /ræC@/ −10 0.07 0.8
Table 2.8: Planned comparisons for F2 frequency in schwa in non-adjacent preceding /h/ and /r/ contexts. The
difference between formant frequencies is calculated as: h-context − r-context.
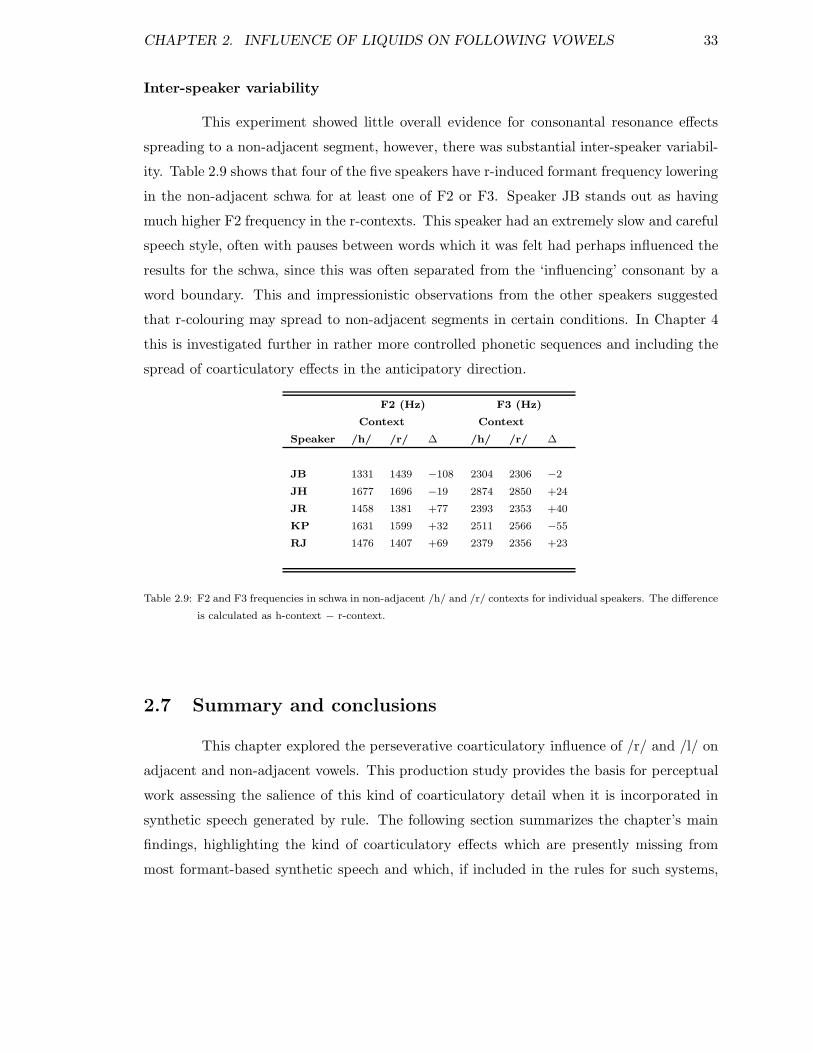
CHAPTER 2. INFLUENCE OF LIQUIDS ON FOLLOWING VOWELS 33
Inter-speaker variability
This experiment showed little overall evidence for consonantal resonance effects
spreading to a non-adjacent segment, however, there was substantial inter-speaker variabil-
ity. Table 2.9 shows that four of the five speakers have r-induced formant frequency lowering
in the non-adjacent schwa for at least one of F2 or F3. Speaker JB stands out as having
much higher F2 frequency in the r-contexts. This speaker had an extremely slow and careful
speech style, often with pauses between words which it was felt had perhaps influenced the
results for the schwa, since this was often separated from the ‘influencing’ consonant by a
word boundary. This and impressionistic observations from the other speakers suggested
that r-colouring may spread to non-adjacent segments in certain conditions. In Chapter 4
this is investigated further in rather more controlled phonetic sequences and including the
spread of coarticulatory effects in the anticipatory direction.
F2 (Hz) F3 (Hz)
Context Context
Speaker /h/ /r/ ∆ /h/ /r/ ∆
JB 1331 1439 −108 2304 2306 −2
JH 1677 1696 −19 2874 2850 +24
JR 1458 1381 +77 2393 2353 +40
KP 1631 1599 +32 2511 2566 −55
RJ 1476 1407 +69 2379 2356 +23
Table 2.9: F2 and F3 frequencies in schwa in non-adjacent /h/ and /r/ contexts for individual speakers. The difference
is calculated as h-context − r-context.
2.7 Summary and conclusions
This chapter explored the perseverative coarticulatory influence of /r/ and /l/ on
adjacent and non-adjacent vowels. This production study provides the basis for perceptual
work assessing the salience of this kind of coarticulatory detail when it is incorporated in
synthetic speech generated by rule. The following section summarizes the chapter’s main
findings, highlighting the kind of coarticulatory effects which are presently missing from
most formant-based synthetic speech and which, if included in the rules for such systems,
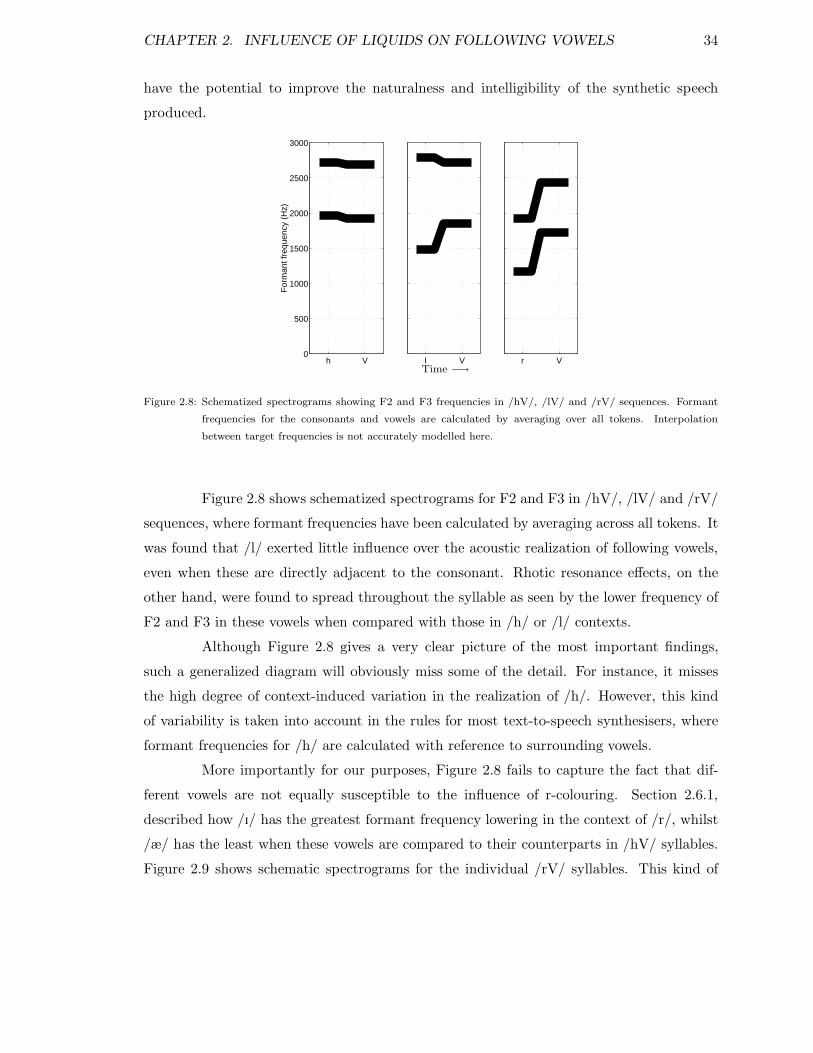
CHAPTER 2. INFLUENCE OF LIQUIDS ON FOLLOWING VOWELS 34
have the potential to improve the naturalness and intelligibility of the synthetic speech
produced.
h V0
500
1000
1500
2000
2500
3000
For
man
t fre
quen
cy (
Hz)
l V r VTime −→
Figure 2.8: Schematized spectrograms showing F2 and F3 frequencies in /hV/, /lV/ and /rV/ sequences. Formant
frequencies for the consonants and vowels are calculated by averaging over all tokens. Interpolation
between target frequencies is not accurately modelled here.
Figure 2.8 shows schematized spectrograms for F2 and F3 in /hV/, /lV/ and /rV/
sequences, where formant frequencies have been calculated by averaging across all tokens. It
was found that /l/ exerted little influence over the acoustic realization of following vowels,
even when these are directly adjacent to the consonant. Rhotic resonance effects, on the
other hand, were found to spread throughout the syllable as seen by the lower frequency of
F2 and F3 in these vowels when compared with those in /h/ or /l/ contexts.
Although Figure 2.8 gives a very clear picture of the most important findings,
such a generalized diagram will obviously miss some of the detail. For instance, it misses
the high degree of context-induced variation in the realization of /h/. However, this kind
of variability is taken into account in the rules for most text-to-speech synthesisers, where
formant frequencies for /h/ are calculated with reference to surrounding vowels.
More importantly for our purposes, Figure 2.8 fails to capture the fact that dif-
ferent vowels are not equally susceptible to the influence of r-colouring. Section 2.6.1,
described how /I/ has the greatest formant frequency lowering in the context of /r/, whilst
/æ/ has the least when these vowels are compared to their counterparts in /hV/ syllables.
Figure 2.9 shows schematic spectrograms for the individual /rV/ syllables. This kind of
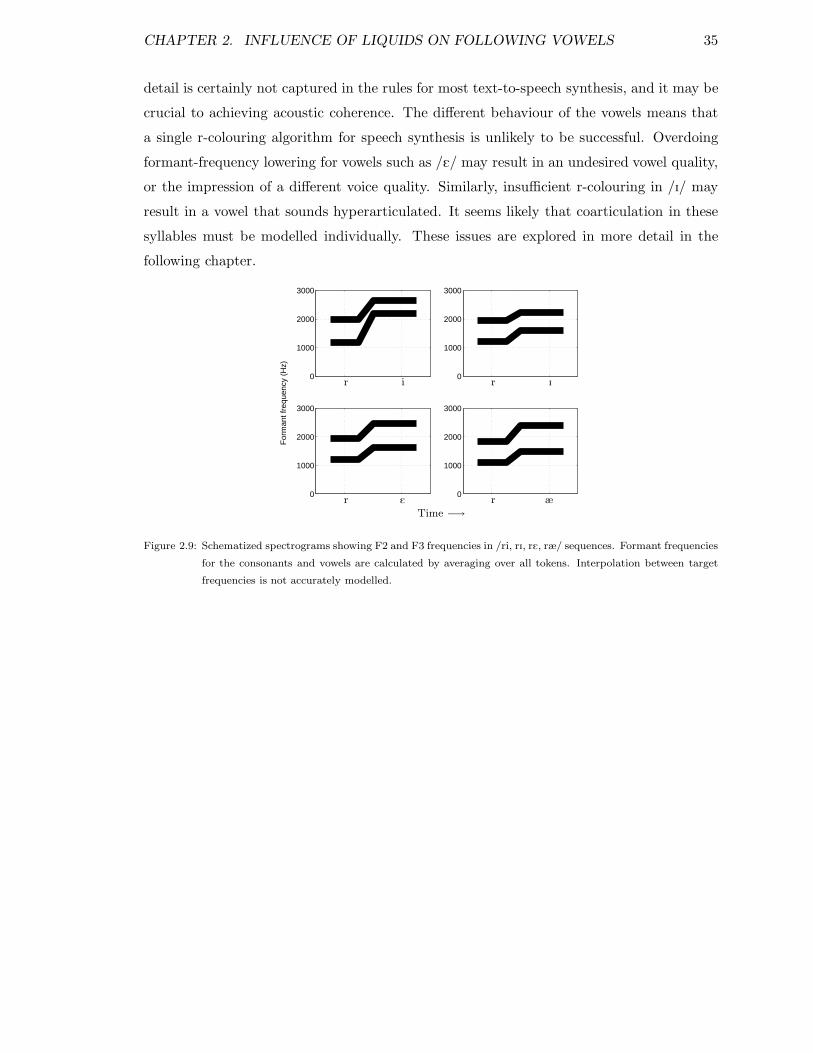
CHAPTER 2. INFLUENCE OF LIQUIDS ON FOLLOWING VOWELS 35
detail is certainly not captured in the rules for most text-to-speech synthesis, and it may be
crucial to achieving acoustic coherence. The different behaviour of the vowels means that
a single r-colouring algorithm for speech synthesis is unlikely to be successful. Overdoing
formant-frequency lowering for vowels such as /E/ may result in an undesired vowel quality,
or the impression of a different voice quality. Similarly, insufficient r-colouring in /I/ may
result in a vowel that sounds hyperarticulated. It seems likely that coarticulation in these
syllables must be modelled individually. These issues are explored in more detail in the
following chapter.
For
man
t fre
quen
cy (
Hz)
0
1000
2000
3000
0
1000
2000
3000
0
1000
2000
3000
0
1000
2000
3000
Time −→
rr
rr i I
E æ
Figure 2.9: Schematized spectrograms showing F2 and F3 frequencies in /ri, rI, rE, ræ/ sequences. Formant frequencies
for the consonants and vowels are calculated by averaging over all tokens. Interpolation between target
frequencies is not accurately modelled.
36
Chapter 3
Contribution of liquid
coarticulation to the intelligibility
of synthetic speech
3.1 Introduction to Perceptual Testing
The motivation behind the production work described in Chapter 2 was a desire
to improve the naturalness and intelligibility of rule-generated formant synthesis. Many of
the contextually determined acoustic differences described in Chapter 2 were statistically
significant, but this should primarily be taken as an indicator of where one might most
profitably begin perceptual testing. The next stage is to demonstrate that listeners are
sensitive to this acoustic detail and that it facilitates lexical access when it is incorporated
in rule-generated synthetic speech.
In this experiment context-induced acoustic variation was incorporated by hand
in synthetic speech generated by rule on the Infovox Text-to-Speech system. This new
acoustically rich synthetic speech was compared in perceptual tests with the old rule-based
version, which lacks the coarticulatory variation. The perceptual tests involved subjects
listening to the synthetic speech in background noise. Subjects were asked to fill in the
blank in each of a series of sentences, where the word omitted was that containing the
syllable of interest.
When coarticulatory variation based on data from the production study in Chap-
CHAPTER 3. INTELLIGIBILITY OF SYNTHETIC SPEECH 37
ter 2 was incorporated in a selection of words in Infovox-generated sentences the speech
style of the manipulated words did not match the speech style of the remainder of the
sentence. It was thought that the speech elicited in the production study was rather too
casual for the kind of speech being generated by the Infovox system. Furthermore, the
primary interest here is not in coarticulatory detail that arises from relatively rapid, casual
speech; instead I am interested in the kind of coarticulatory effects which are intrinsic to
the speech signal even in careful speech styles. By this I mean those effects which are an
inevitable consequence of the dynamics of speech production, or at least which are common
for speakers of SSBE. It is this kind of detail which may provide invaluable information for
the perceiver of the speech signal, although, of course, coarticulatory effects characteristic
of rapid or casual speech may well prove invaluable in synthetic speech which attempts to
mimic such speech styles.
Given the problems with attempting to use the recordings made for the experiment
in Chapter 2 as the model for adjustments to synthetic speech, a second recording was made.
In this recording one male speaker, subject RJ, was selected from those who took part in
the initial production study. RJ’s accent is perhaps best described as “educated Northern”
but with substantial levelling towards the SBE standard. Particularly in formal recording
conditions RJ’s speech closely approximates an SSBE accent. RJ was instructed to speak
in a clear and fairly careful manner, at a rate that he found comfortable. The aim was to
elicit maximally clear speech which would provide a good basis on which to model synthetic
speech in order to improve its intelligibility. All other aspects of the recording were as
described in Section 2.4 of Chapter 2.
The sentences for this second recording differ from those in Chapter 2, as by this
time the sentences for perceptual testing had been designed and it made sense to use these
in the new recording. The sentences accommodate various requirements for the perceptual
tests such as controlling word-frequency, contextual cues etc. Also, in the initial production
study no measurements were made in the sounds immediately preceding the consonant of
interest. This is rectified here where measurements were made in all vowels and in the
first consonant in the sequence in Figure 3.1, thus allowing ‘long-domain’ coarticulatory
variation to be modelled.
A full description of the 36 sentences recorded follows in Section 3.2, with details
of the sentences themselves in Table 3.1 (p 40). As in the experiment in Chapter 2, 10
repetitions of each sentence were elicited. Predictably, the coarticulatory effects found in
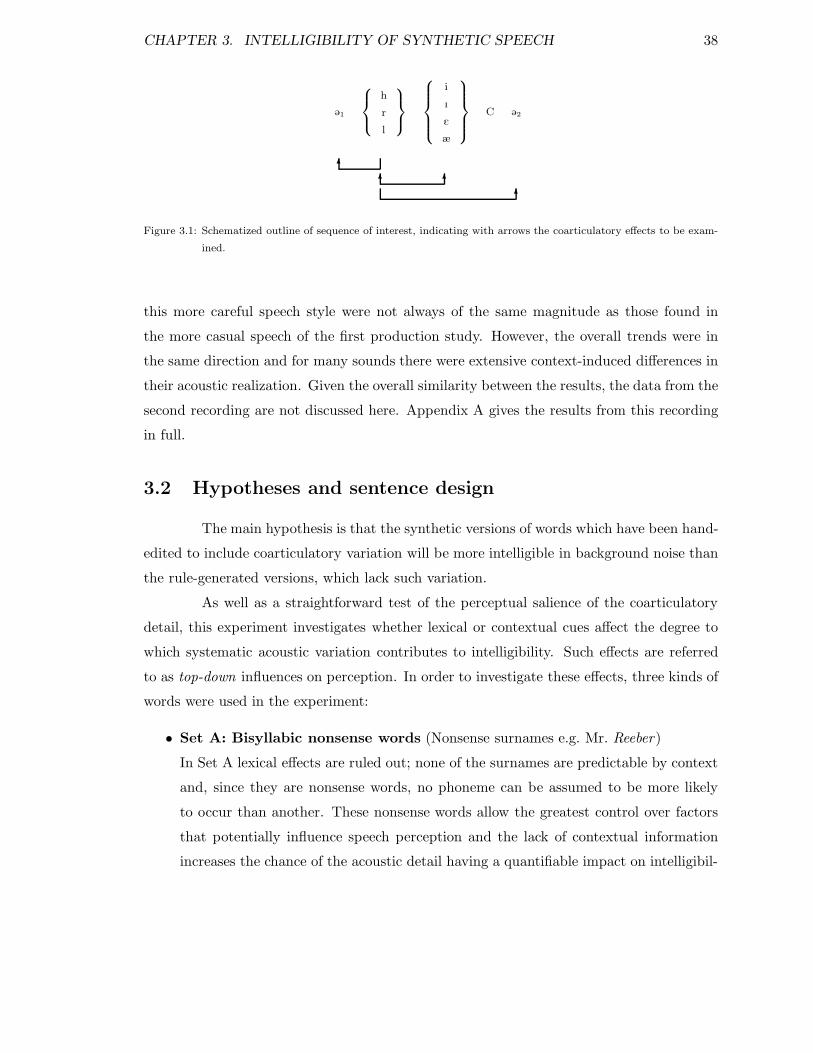
CHAPTER 3. INTELLIGIBILITY OF SYNTHETIC SPEECH 38
@1
h
r
l
i
I
E
æ
C @2
66 6
6
Figure 3.1: Schematized outline of sequence of interest, indicating with arrows the coarticulatory effects to be exam-
ined.
this more careful speech style were not always of the same magnitude as those found in
the more casual speech of the first production study. However, the overall trends were in
the same direction and for many sounds there were extensive context-induced differences in
their acoustic realization. Given the overall similarity between the results, the data from the
second recording are not discussed here. Appendix A gives the results from this recording
in full.
3.2 Hypotheses and sentence design
The main hypothesis is that the synthetic versions of words which have been hand-
edited to include coarticulatory variation will be more intelligible in background noise than
the rule-generated versions, which lack such variation.
As well as a straightforward test of the perceptual salience of the coarticulatory
detail, this experiment investigates whether lexical or contextual cues affect the degree to
which systematic acoustic variation contributes to intelligibility. Such effects are referred
to as top-down influences on perception. In order to investigate these effects, three kinds of
words were used in the experiment:
• Set A: Bisyllabic nonsense words (Nonsense surnames e.g. Mr. Reeber)
In Set A lexical effects are ruled out; none of the surnames are predictable by context
and, since they are nonsense words, no phoneme can be assumed to be more likely
to occur than another. These nonsense words allow the greatest control over factors
that potentially influence speech perception and the lack of contextual information
increases the chance of the acoustic detail having a quantifiable impact on intelligibil-
CHAPTER 3. INTELLIGIBILITY OF SYNTHETIC SPEECH 39
ity. It is predicted that the greatest perceptual effect of incorporating coarticulatory
variation will be found for the nonsense words. This is the base-line against which
other effects can be judged.
• Set B: Monosyllabic real words (e.g. reef )
The monosyllabic real words in Set B are contained in semantically neutral sentences.
Although these sentences offer minimal semantic help to the listener, they do give
clues as to the syntactic category of the word (e.g. noun or verb). Harley (1995)
argues that the role of sentential context in assisting on-line perceptual processes is
very limited (cf. Connine 1990 and Samuel 1990). However, since the task in this
experiment is more post-perceptual in nature, it might be expected that the limited
contextual cues will play some role. The prediction is that coarticulatory detail will
be less useful to the listener for these words than for the nonsense words, as there are
certain other clues to aid lexical access. However, subjects were also told that some
sentences would contain nonsense words, and they were not informed that such words
are restricted to the surname category, i.e. Set A and its related fillers. This greatly
expands the possible response set, and should allow the detection of all potential
phoneme confusions.
• Set C: Polysyllabic real words (e.g. bereavement)
In Set C the syllables of interest are incorporated in polysyllabic real words. This
provides an even sterner test of the potential influence of small-scale acoustic cues on
intelligibility, as the set of words which might be confused with the target word is far
smaller than for the monosyllabic target words in Set B. Luce, Pisoni, and Goldinger
(1990) describe such polysyllabic words as having low neighbourhood densities, i.e. a
small set of phonetically similar neighbours. In order to maximise any potential con-
fusions that might remain between words, and thus increase the chance that acoustic
cues might influence the outcome, the carrier sentences are once again designed to
provide minimal contextual information. It is predicted that coarticulatory detail will
be least useful to the listener for this category of words.
Details of the sentences used for perceptual testing are given in Table 3.1. As de-
scribed, the sentences fall into three groups. Set A are sentences beginning with a forename
or a title of address followed by a nonsense surname containing the main syllable of inter-
est. Set B are sentences in which the syllable of interest is contained in a monosyllabic real
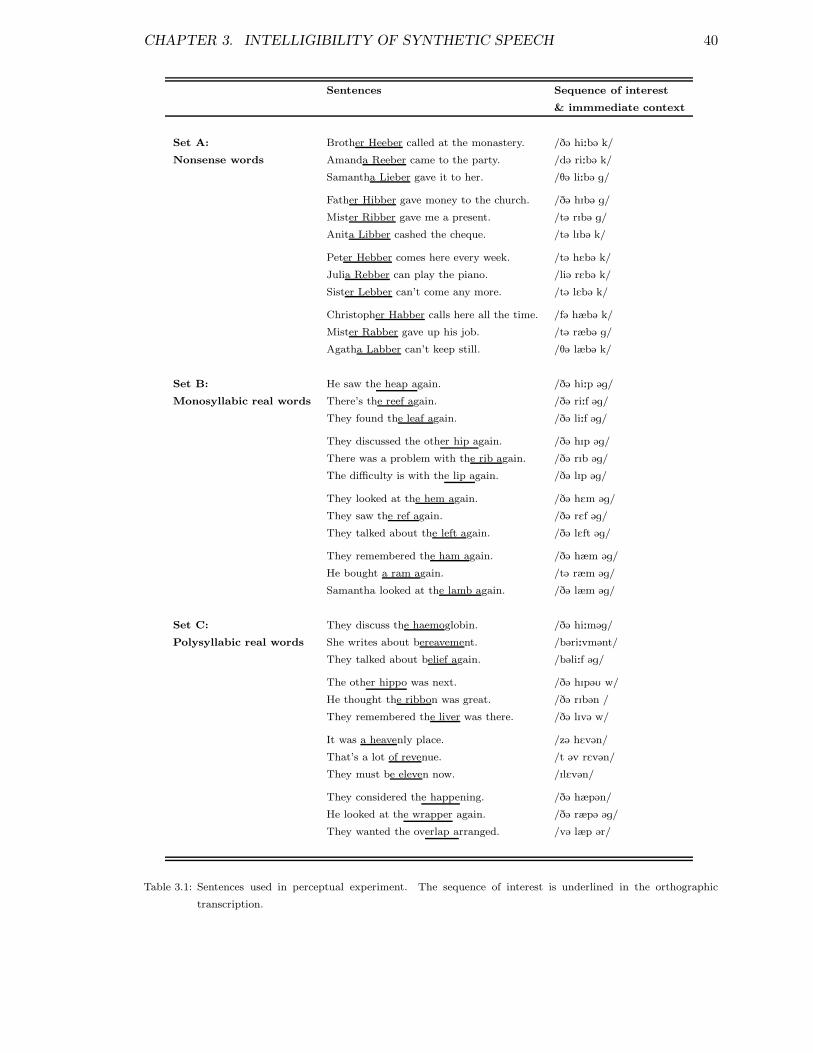
CHAPTER 3. INTELLIGIBILITY OF SYNTHETIC SPEECH 40
Sentences Sequence of interest
& immmediate context
Set A: Brother Heeber called at the monastery. /D@ hi:b@ k/
Nonsense words Amanda Reeber came to the party. /d@ ri:b@ k/
Samantha Lieber gave it to her. /T@ li:b@ g/
Father Hibber gave money to the church. /D@ hIb@ g/
Mister Ribber gave me a present. /t@ rIb@ g/
Anita Libber cashed the cheque. /t@ lIb@ k/
Peter Hebber comes here every week. /t@ hEb@ k/
Julia Rebber can play the piano. /li@ rEb@ k/
Sister Lebber can’t come any more. /t@ lEb@ k/
Christopher Habber calls here all the time. /f@ hæb@ k/
Mister Rabber gave up his job. /t@ ræb@ g/
Agatha Labber can’t keep still. /T@ læb@ k/
Set B: He saw the heap again. /D@ hi:p @g/
Monosyllabic real words There’s the reef again. /D@ ri:f @g/
They found the leaf again. /D@ li:f @g/
They discussed the other hip again. /D@ hIp @g/
There was a problem with the rib again. /D@ rIb @g/
The difficulty is with the lip again. /D@ lIp @g/
They looked at the hem again. /D@ hEm @g/
They saw the ref again. /D@ rEf @g/
They talked about the left again. /D@ lEft @g/
They remembered the ham again. /D@ hæm @g/
He bought a ram again. /t@ ræm @g/
Samantha looked at the lamb again. /D@ læm @g/
Set C: They discuss the haemoglobin. /D@ hi:m@g/
Polysyllabic real words She writes about bereavement. /b@ri:vm@nt/
They talked about belief again. /b@li:f @g/
The other hippo was next. /D@ hIp@U w/
He thought the ribbon was great. /D@ rIb@n /
They remembered the liver was there. /D@ lIv@ w/
It was a heavenly place. /z@ hEv@n/
That’s a lot of revenue. /t @v rEv@n/
They must be eleven now. /IlEv@n/
They considered the happening. /D@ hæp@n/
He looked at the wrapper again. /D@ ræp@ @g/
They wanted the overlap arranged. /v@ læp @r/
Table 3.1: Sentences used in perceptual experiment. The sequence of interest is underlined in the orthographic
transcription.
CHAPTER 3. INTELLIGIBILITY OF SYNTHETIC SPEECH 41
word. In Set C the crucial syllable is contained in a polysyllabic real word. The sequence
of interest is underlined in the orthography in Table 3.1 (see also Figure 3.1, page 38) and
a phonetic transcription of this sequence and its immediate context follows each sentence.
The h-context sentences are included here as they were recorded in the production experi-
ment (reported in Appendix A) and they provided a basis for comparison with the r- and
l-context acoustic data. In the perceptual experiment the h-sentences function merely as
fillers, since the Infovox system already incorporates rules for varying /h/ according to vowel
context, and so neither the consonant nor the vowel in these sentences are modified in any
way.
3.3 Synthesis of the test sentences
3.3.1 Background to synthesis process
The r- and l-context sentences in Table 3.1 were typed individually into the Infovox
Text-to-Speech system (Version 3.1), which at that stage of development was a formant
synthesis system. Infovox was fairly typical of formant-based synthesis systems in that
some context-induced variation in the target values for schwa is captured in the rules,
but most other vowels have just a single canonical target form. The major variation in the
realization of vowels, therefore, occurs in the formant transitions before and after they reach
their targets. Context-induced phoneme boundary effects are relatively well-modelled, for
instance differences in direction of formant transitions between vowels in different consonant
contexts and differences in rates of formant transitions depending on whether the vowel is
long or short are effectively captured. However, variation which spreads throughout a whole
syllable, affecting the target formant frequencies of the vowel, as described in Chapter 2, is
not captured by the synthesis rules. Certainly context-induced acoustic variation spreading
to non-adjacent segments is not modelled in standard text-to-speech systems.
Having generated a synthesised version of each r- and l-sentence on the Infovox
system, any obvious pronunciation errors were corrected and certain modifications were
made to intonation and to the duration of segments in order to make the sentences as
natural sounding as possible. These titivated versions of each sentence will be referred
to as the rule-forms and constituted the basis for any further improvements based on
coarticulatory-induced variation in the acoustic signal.

CHAPTER 3. INTELLIGIBILITY OF SYNTHETIC SPEECH 42
The next stage in the synthesis process was to incorporate in the rule-forms the
kind of coarticulatory detail described in Chapter 2. These new ‘coarticulatorily rich’ sen-
tences are referred to as the edited-forms. The coarticulatory detail is added to the synthetic
speech by hand-editing, guided very much by auditory analysis of the quality of the output.
The hand-editing process started with the monosyllabic real words (Set B), since it
was felt that it would be easiest to assess the appropriateness of any changes in these short
real words. The method used to incorporate coarticulatory detail in the vowel of the CV
sequences of interest is described for Set B in Section 3.3.2 below. Sections 3.3.3 and 3.3.4
outline the hand-editing process for the schwas surrounding the main syllable of interest
and for the consonants. Finally, Section 3.3.5 describes the method used to incorporate
coarticulatory variation in the sequences of interest in Sets A and C, the nonsense and
polysyllabic real words.
3.3.2 Incorporating coarticulatory detail in vowels in Set B
Obviously the ideal way of incorporating context-induced variation in a synthesis
system is to re-record the original ‘source’ speaker on whom the system’s formant frequency
targets are based. In this way it would be possible to measure context-induced variation in
formant frequencies and incorporate this directly in the rules for the system. This was not
an option here, so a careful comparison was made of RJ’s speech with that of the Infovox
system.
As well as the 12 sentences in Sets A to C in Table 3.1, RJ recorded a set of words
and vowels in isolation. The formant frequencies in these isolated words and vowels (see
Appendix B) were compared to those in equivalent vowels synthesised on the Infovox system.
Unsurprisingly this comparison revealed, not only that RJ’s formant frequencies differ from
those of the Infovox system, but also that his formant frequencies do not differ from Infovox’s
in the same way for each vowel. F2 and F3 frequencies in RJ’s /i/ are approximately 400
and 550 Hz higher respectively than for the Infovox /i/. For /U/, however, RJ and Infovox
have almost identical F2 and F3 frequencies. The general pattern is that high front vowels
in RJ’s speech have considerably higher F2 and F3 frequencies than in Infovox, whilst
differences in F2 and F3 frequencies for other vowels are smaller, indeed negligible for most
back vowels.
These differences are not surprising (cf. Chapter 4 in Fant (1973) on non-uniform
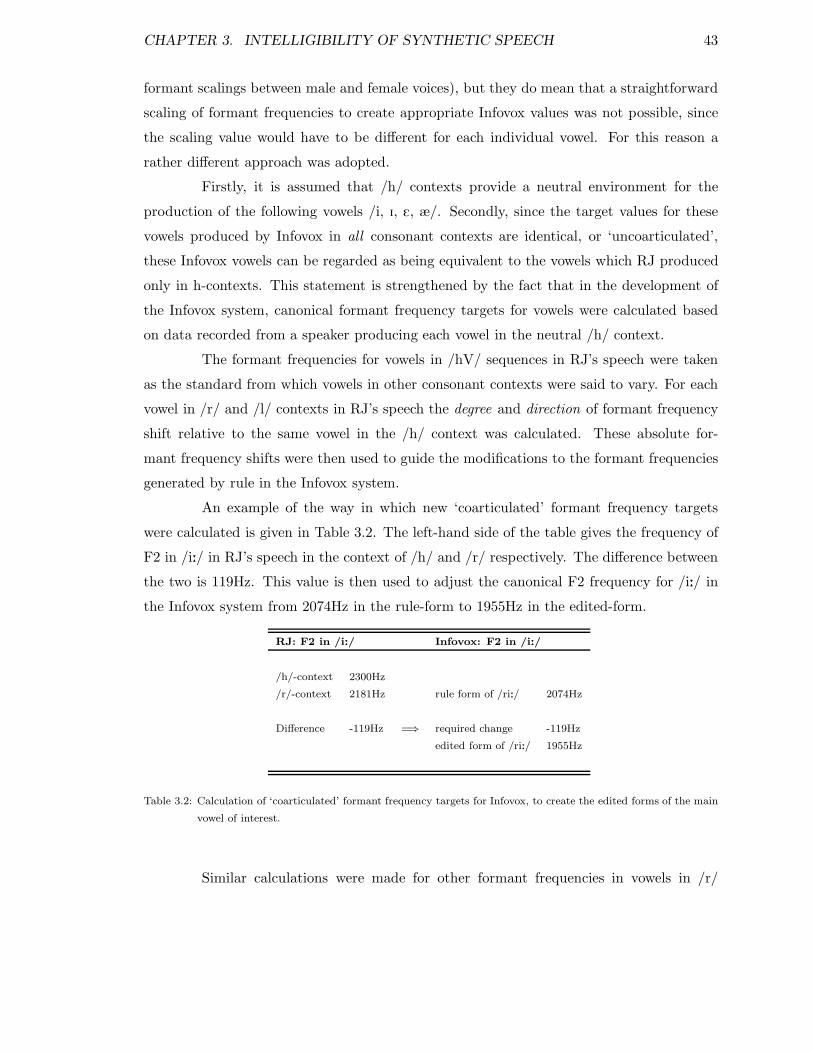
CHAPTER 3. INTELLIGIBILITY OF SYNTHETIC SPEECH 43
formant scalings between male and female voices), but they do mean that a straightforward
scaling of formant frequencies to create appropriate Infovox values was not possible, since
the scaling value would have to be different for each individual vowel. For this reason a
rather different approach was adopted.
Firstly, it is assumed that /h/ contexts provide a neutral environment for the
production of the following vowels /i, I, E, æ/. Secondly, since the target values for these
vowels produced by Infovox in all consonant contexts are identical, or ‘uncoarticulated’,
these Infovox vowels can be regarded as being equivalent to the vowels which RJ produced
only in h-contexts. This statement is strengthened by the fact that in the development of
the Infovox system, canonical formant frequency targets for vowels were calculated based
on data recorded from a speaker producing each vowel in the neutral /h/ context.
The formant frequencies for vowels in /hV/ sequences in RJ’s speech were taken
as the standard from which vowels in other consonant contexts were said to vary. For each
vowel in /r/ and /l/ contexts in RJ’s speech the degree and direction of formant frequency
shift relative to the same vowel in the /h/ context was calculated. These absolute for-
mant frequency shifts were then used to guide the modifications to the formant frequencies
generated by rule in the Infovox system.
An example of the way in which new ‘coarticulated’ formant frequency targets
were calculated is given in Table 3.2. The left-hand side of the table gives the frequency of
F2 in /i:/ in RJ’s speech in the context of /h/ and /r/ respectively. The difference between
the two is 119Hz. This value is then used to adjust the canonical F2 frequency for /i:/ in
the Infovox system from 2074Hz in the rule-form to 1955Hz in the edited-form.
RJ: F2 in /i:/ Infovox: F2 in /i:/
/h/-context 2300Hz
/r/-context 2181Hz rule form of /ri:/ 2074Hz
Difference -119Hz =⇒ required change -119Hz
edited form of /ri:/ 1955Hz
Table 3.2: Calculation of ‘coarticulated’ formant frequency targets for Infovox, to create the edited forms of the main
vowel of interest.
Similar calculations were made for other formant frequencies in vowels in /r/
CHAPTER 3. INTELLIGIBILITY OF SYNTHETIC SPEECH 44
and /l/ contexts and the appropriate alterations were made to formant frequencies in the
Infovox-generated speech. It must be emphasised that the measured contextual shifts in
RJ’s formant frequencies were not treated as a simple algorithm to be straightforwardly
imposed on the Infovox synthetic speech. Instead, the measured shifts in vowel formant
frequency were used as a rule of thumb for improving the Infovox-generated speech and
deviations from this were made if the experimenter felt that the resulting sound quality
was better. Spectra and spectrograms of RJ’s speech and the synthetic speech were also
compared to guide formant frequency alterations. Native speakers of SSBE were asked to
judge the naturalness of the different synthetic stimuli, and these informal judgments were
used to guide decisions about final formant frequency values in the hand-edited forms. All
changes to formant frequencies were in the same direction as for RJ’s speech, but in many
cases the changes made in the Infovox-generated speech were considerably smaller than the
effects found in RJ’s speech. Reasons for this are discussed in more detail in Section 3.10.1.
3.3.3 Incorporating coarticulatory detail in schwas in Set B
As well as changes to formant frequencies in the vowel of the main syllable of
interest, modifications were made to the schwas immediately surrounding this syllable. The
method adopted for such changes was identical to that used for the main vowel. Formant
frequencies were measured in RJ’s speech and the difference in frequency between the schwas
in /h/ contexts and in /r/ and /l/ contexts was calculated. These differences were used to
guide changes to formant frequencies in the synthetic speech.
This was felt to be a satisfactory approach for the first schwa in the sequences of
interest, given its position immediately prior to the consonant purported to be exerting the
coarticulatory influence (e.g. @1 in /@1 ræm @2gEn/, a ram again).
The method was rather less satisfactory for the second schwa, where coarticulatory
effects are likely to be attributable to the more immediate consonantal context. For instance,
for @2 in /@1 ræm @2gEn/, the acoustic realization of the schwa is influenced more by the /m/
and /g/ than by the /r/ of the preceding syllable. Various solutions to this problem were
considered. Implementing RJ’s formant frequencies for /@2/ directly in the Infovox speech
did not produce good results, probably because of the substantial differences between many
of his vowels and those of the Infovox system. A schwa in isolation was recorded for RJ’s
speech and compared with that for the Infovox system and the possibility of establishing

CHAPTER 3. INTELLIGIBILITY OF SYNTHETIC SPEECH 45
some kind of formant scaling algorithm based on these measurements was considered. But
schwa varies considerably in context, and the extent to which RJ’s formant frequencies differ
from those in the Infovox system depends greatly on the particular vowel involved. So it
was felt that a single scaling factor for schwa would not accurately translate between RJ’s
various schwas and those for the Infovox system.
Finally, it was decided to use exactly the same method of altering formant fre-
quencies as described for the main vowel of interest and for @1. So formant frequencies in @2
in RJ’s speech in the context of /h/ were compared to formant frequencies in the context
of /r/ and /l/, and the difference was used to guide modifications to the synthesised ver-
sions of each word. Again the decisive factor was auditory assessment of the hand-edited
stimuli, and this suggested that the method outlined in Section 3.3.2 produced satisfactory
improvements even for this schwa.
3.3.4 Incorporating coarticulatory detail in consonants in Set B
Having settled on a method of making alterations to vowel formant frequencies, the
next question was how to tackle consonantal variation. Formant frequencies were measured
in /r/ and /l/ in RJ’s speech (see Table A.3, Appendix A). In the Infovox system there
was a single canonical target form for /r/ and in RJ’s speech there was also relatively
little contextual variation in this sound. The formant frequencies in the Infovox /r/ were
very similar to those in RJ’s speech for /r/ in the context of /i/ and /I/ and so for those
vowel contexts the values were left as generated by the synthesis rules. This was judged to
generate natural-sounding tokens. In the /E/ and /æ/ contexts, however, the best sounding
results were obtained by lowering the frequencies of both F2 and F3 in /r/ slightly.
For /l/ the situation was more complex; the Infovox version of /l/ already incorpo-
rated some context-induced variation, in that the rules calculate the frequency of F2 in /l/
by a formula relating it to the frequency of F2 in the following vowel. However, the values
chosen were appropriate for an American English rather than a British English /l/. This in
fact resulted in a highly intelligible /l/ and was not modified in the initial development of
Infovox since there were many more pressing problems with the synthesis system. When an
attempt was made to incorporate formant frequency values for /l/ which are more typical
of the British English consonant, this resulted in a fall in intelligibility in perceptual tests
(Hawkins, personal communication) and so the American values were reintroduced.
CHAPTER 3. INTELLIGIBILITY OF SYNTHETIC SPEECH 46
The problem faced here was that once changes had been made to the vowels in the
context of /l/, as appropriate for a British English speaker, it seemed likely that the Amer-
ican English /l/ would detract from the perceptual coherence of the synthesised version.
American English /l/ is generally more velarized or pharyngealised than British English
/l/, even in the contexts where one would expect a relatively clear /l/ (cf. Jones 1972), and
so another attempt was made to introduce formant frequency values more appropriate for
British English.
Unsurprisingly, formant frequencies for RJ’s /l/ differ radically from those in the
Infovox system. After some experimentation it was felt that the best sounding versions of
words containing /l/ were obtained by simply incorporating RJ’s formant frequency values in
the synthetic speech. This had two advantages. Firstly, it improved the sound quality of the
/l/ by using formant frequencies more typical of an SSBE /l/. Secondly, any contextually
determined variation was automatically included in the new formant frequencies. One
disadvantage of this approach is that it is not possible to separate potentially different
perceptual consequences of these two factors. Any changes in intelligibility could be due
either to the introduction of a British /l/ or to the incorporation of coarticulatory variation
in the consonant or to a combination of these factors. However, the primary aim of this
experiment was to increase the intelligibility of synthetic speech, and the conflation of
various possible sources of improvements is not considered a problem.
3.3.5 Incorporating coarticulatory detail in Sets A and C
Having created hand-edited forms for the monosyllabic real words (Set B), the
next issue was how to go about synthesising the nonsense and polysyllabic real word sets.
Formant frequencies were also measured in RJ’s productions of these sentences and full
details are given in Appendix A. Inevitably, absolute formant frequencies varied slightly
between sets, presumably due to slight differences in the phonetic material surrounding the
sequences of interest. However, the general type of coarticulatory variation found in Sets A
and C was very similar to that found in Set B.
The question was whether to use the actual formant frequency measurements from
RJ’s production of Sets A and C as the basis for making modifications in these sets, or
whether to adopt piecemeal the same changes as implemented for Set B and described in
the previous sections. The first option might initially appear to be the most obvious, and
CHAPTER 3. INTELLIGIBILITY OF SYNTHETIC SPEECH 47
the one most in line with modifying the synthetic speech to approximate natural speech as
closely as possible. However, it creates a problem with regard to one of the major aims of
the perceptual testing: if different acoustic modifications are made to each of Sets A, B and
C then any differences highlighted in the perceptual tests between these sets cannot be said
to be exclusively due to differences in top-down influences. Instead such differences may
find their cause in the differences in the acoustic stimuli.
For this reason it was decided to implement the same acoustic changes in sets A
and C as in set B. Of course if these changes are inappropriate for sets A and C, then this in
itself creates a difference between the sets that is not exclusively top-down. However, using
the formant frequency values from Sets A and C to guide the editing process did not seem
to result in better quality edited forms than those produced using the values from set B.
Furthermore, auditory assessment by the experimenter and other SSBE speakers suggested
that the changes based on Set B were appropriate, and that the edited forms of words in
Sets A and C did sound more natural than the rule-forms and that they were as natural as
the edited Set B forms.
3.4 Filler sentences
In addition to the sentences in Table 3.1, 31 fillers (Table 3.3) were synthesised
by rule on the Infovox system and were also modified to improve intonation and timing.
Some of the fillers were designed to be similar to the target sentences, so as to distract from
the purpose of the experiment and the regularity of the sounds being investigated. Other
fillers were designed to break up the pattern of the sentences being investigated. The fillers
included both real and nonsense words, as in the main experiment.
3.5 Adding noise to the speech stimuli
The sentences were generated and hand-edited on the Infovox text-to-speech sys-
tem running on a Dell PC. In order to mix the sentences with background noise it was
necessary to transfer them to a Silicon Graphics Indigo machine so that amplitude scaling
of the speech files could be carried out. The sentences were recorded onto DAT tape and
then digitised again at 16kHz using Silicon Graphics Indigo A.D. converters. A 10 second
silence file was appended to each speech file and the length of the resulting file was calcu-
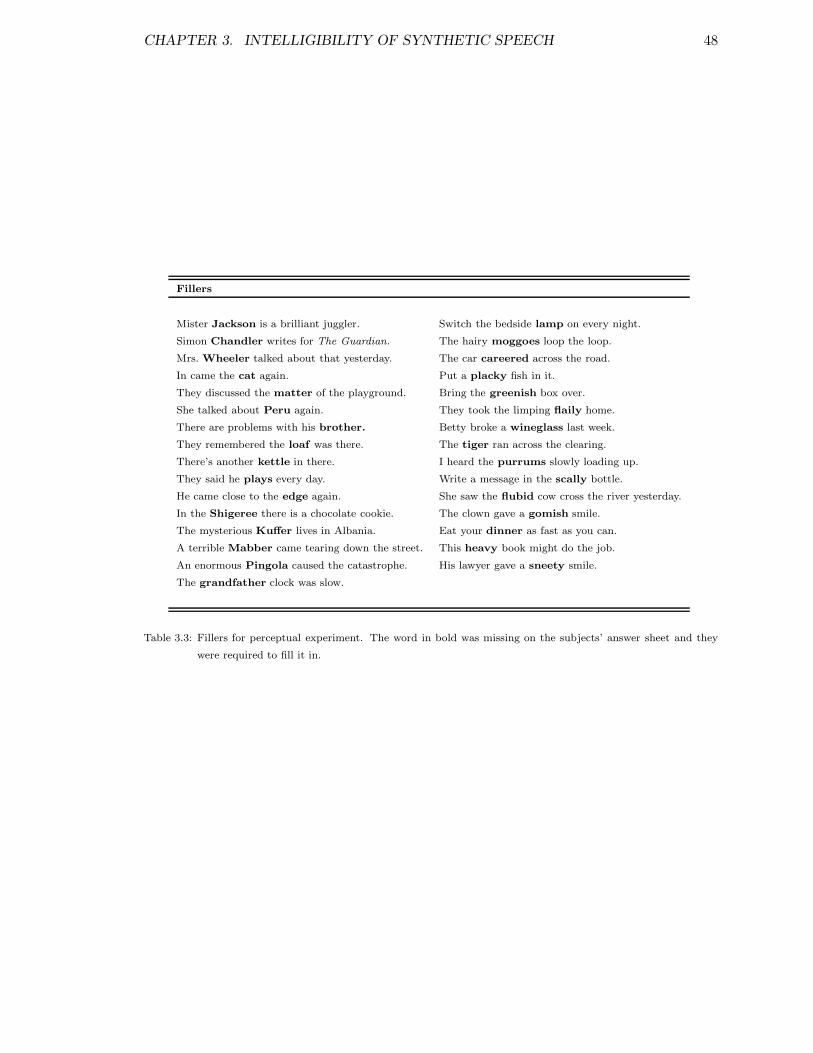
CHAPTER 3. INTELLIGIBILITY OF SYNTHETIC SPEECH 48
Fillers
Mister Jackson is a brilliant juggler. Switch the bedside lamp on every night.
Simon Chandler writes for The Guardian. The hairy moggoes loop the loop.
Mrs. Wheeler talked about that yesterday. The car careered across the road.
In came the cat again. Put a placky fish in it.
They discussed the matter of the playground. Bring the greenish box over.
She talked about Peru again. They took the limping flaily home.
There are problems with his brother. Betty broke a wineglass last week.
They remembered the loaf was there. The tiger ran across the clearing.
There’s another kettle in there. I heard the purrums slowly loading up.
They said he plays every day. Write a message in the scally bottle.
He came close to the edge again. She saw the flubid cow cross the river yesterday.
In the Shigeree there is a chocolate cookie. The clown gave a gomish smile.
The mysterious Kuffer lives in Albania. Eat your dinner as fast as you can.
A terrible Mabber came tearing down the street. This heavy book might do the job.
An enormous Pingola caused the catastrophe. His lawyer gave a sneety smile.
The grandfather clock was slow.
Table 3.3: Fillers for perceptual experiment. The word in bold was missing on the subjects’ answer sheet and they
were required to fill it in.
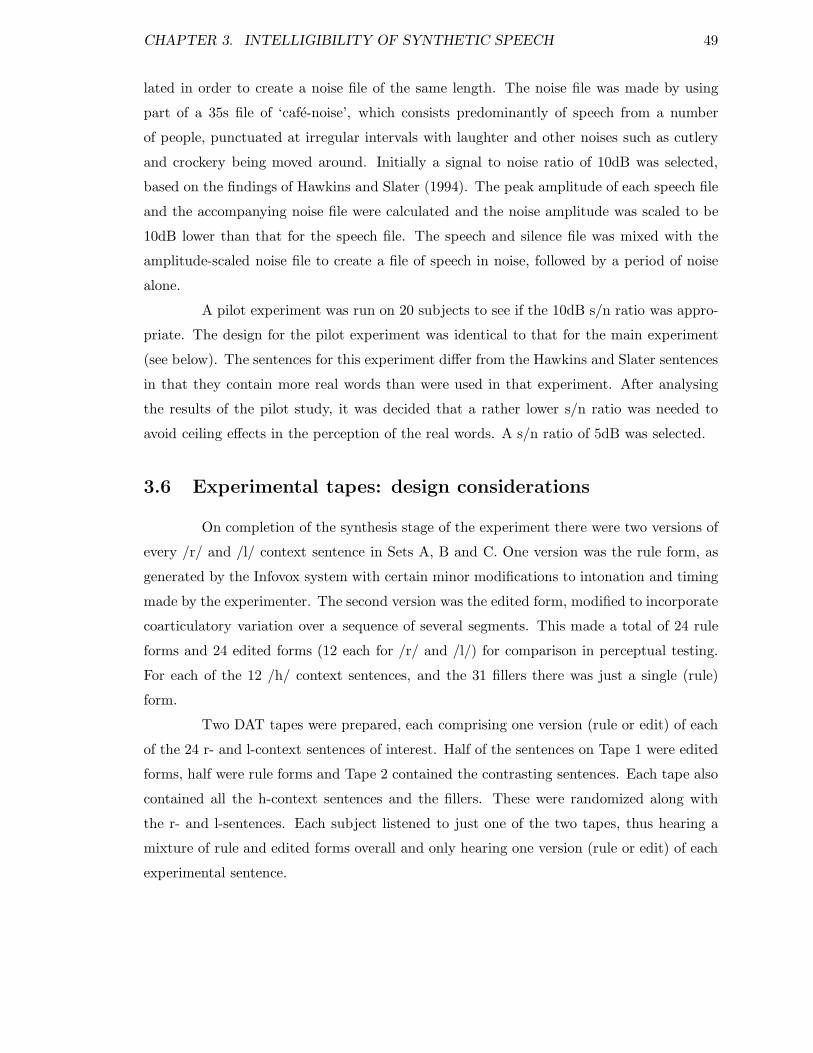
CHAPTER 3. INTELLIGIBILITY OF SYNTHETIC SPEECH 49
lated in order to create a noise file of the same length. The noise file was made by using
part of a 35s file of ‘cafe-noise’, which consists predominantly of speech from a number
of people, punctuated at irregular intervals with laughter and other noises such as cutlery
and crockery being moved around. Initially a signal to noise ratio of 10dB was selected,
based on the findings of Hawkins and Slater (1994). The peak amplitude of each speech file
and the accompanying noise file were calculated and the noise amplitude was scaled to be
10dB lower than that for the speech file. The speech and silence file was mixed with the
amplitude-scaled noise file to create a file of speech in noise, followed by a period of noise
alone.
A pilot experiment was run on 20 subjects to see if the 10dB s/n ratio was appro-
priate. The design for the pilot experiment was identical to that for the main experiment
(see below). The sentences for this experiment differ from the Hawkins and Slater sentences
in that they contain more real words than were used in that experiment. After analysing
the results of the pilot study, it was decided that a rather lower s/n ratio was needed to
avoid ceiling effects in the perception of the real words. A s/n ratio of 5dB was selected.
3.6 Experimental tapes: design considerations
On completion of the synthesis stage of the experiment there were two versions of
every /r/ and /l/ context sentence in Sets A, B and C. One version was the rule form, as
generated by the Infovox system with certain minor modifications to intonation and timing
made by the experimenter. The second version was the edited form, modified to incorporate
coarticulatory variation over a sequence of several segments. This made a total of 24 rule
forms and 24 edited forms (12 each for /r/ and /l/) for comparison in perceptual testing.
For each of the 12 /h/ context sentences, and the 31 fillers there was just a single (rule)
form.
Two DAT tapes were prepared, each comprising one version (rule or edit) of each
of the 24 r- and l-context sentences of interest. Half of the sentences on Tape 1 were edited
forms, half were rule forms and Tape 2 contained the contrasting sentences. Each tape also
contained all the h-context sentences and the fillers. These were randomized along with
the r- and l-sentences. Each subject listened to just one of the two tapes, thus hearing a
mixture of rule and edited forms overall and only hearing one version (rule or edit) of each
experimental sentence.

CHAPTER 3. INTELLIGIBILITY OF SYNTHETIC SPEECH 50
There were two main considerations which lead to this experimental design. Firstly,
it is well documented in the literature that significant learning effects are found as subjects
gain experience in listening to synthetic speech. Improvements in subjects’ performance are
found even after relatively little exposure to synthetic speech and without explicit training
(cf. Pisoni, Greene, and Nusbaum 1985a, 1985b and Boogaart and Silverman 1992). In
order to minimise such effects, the experiment is designed so that each subject hears either
the rule or the edited form of each sentence, not both.
Secondly, it was felt that having one group of subjects doing all the rule forms and
one doing all the edited forms might show artificial effects due to non-controlled differences
between the subject groups. This decision is supported by the findings of Hazan and Shi
(1993). They recruited a very homogeneous group of subjects: all aged between 18 and
32 years, all native speakers of English and students at University College London, all
with little or no previous experience of synthetic speech and all tested for normal hearing
(avarage pure tone thresholds of 20 dB HL or better from 0.25 to 8kHz in both ears). Yet
they find that intelligibility scores of meaningless VCV items ranged over 47%. So, in line
with Hawkins and Slater (1994), this experiment was designed such that each group heard
an equal mix of rule and edited forms.
3.6.1 Statistical Analysis
The design constraints described in the previous section resulted in a mixed between
groups and within groups design (see Figure 3.2 for a graphical representation of this). There
is one between groups factor: Tape; and four mixed between and within groups factors:
Word nonsense, monosyllabic-real and polysyllabic-real; Consonant /r, l/; Vowel /i, I, E,
æ/; and Type rule vs. edit. This design required different statistical analyses depending on
the factor of interest.
At the level of tape × word × consonant × vowel, type is confounded with tape
and so a between-groups analysis is required. However, once we go beyond a rule vs. edit
comparison for individual words it is no longer a simple between-groups analysis. For
instance when comparing the nonsense word rule-forms with the nonsense word edited-
forms, each of these contains a mixture of between and within groups data. In these cases
t-tests were performed. For t-tests it is necessary to stipulate whether the data are within
groups or between groups (paired vs. unpaired design). Clearly this was not possible for
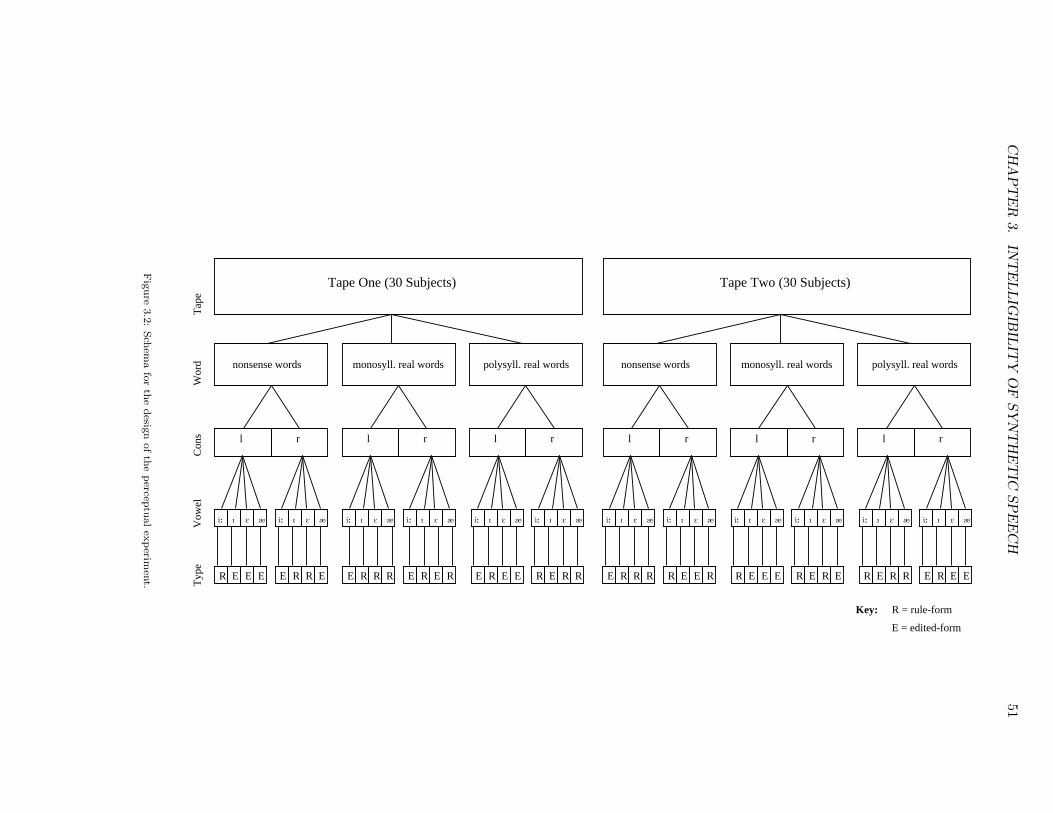
CH
AP
TE
R3.
INT
ELLIG
IBIL
ITY
OF
SY
NT
HE
TIC
SP
EE
CH
51
RRE ERERER R E E
nonsense words monosyll. real words polysyll. real wordsnonsense words
Tape One (30 Subjects) Tape Two (30 Subjects)
Key: R = rule-form
E = edited-form
Vow
elT
ype
polysyll. real wordsmonosyll. real words
Tap
eW
ord
Con
s
E ERREEER
lrrl lrl r rl rl
R E RRRE E E R EEERERRRE ERRERRRE RE
i:i:i: i:i: i: i:i: i:i:i:i: III II III I II I EEE EE E EEE EE E ææ æ ææ ææ ææ ææ æ
Fig
ure
3.2
:Sch
ema
for
the
desig
nofth
epercep
tualex
perim
ent.
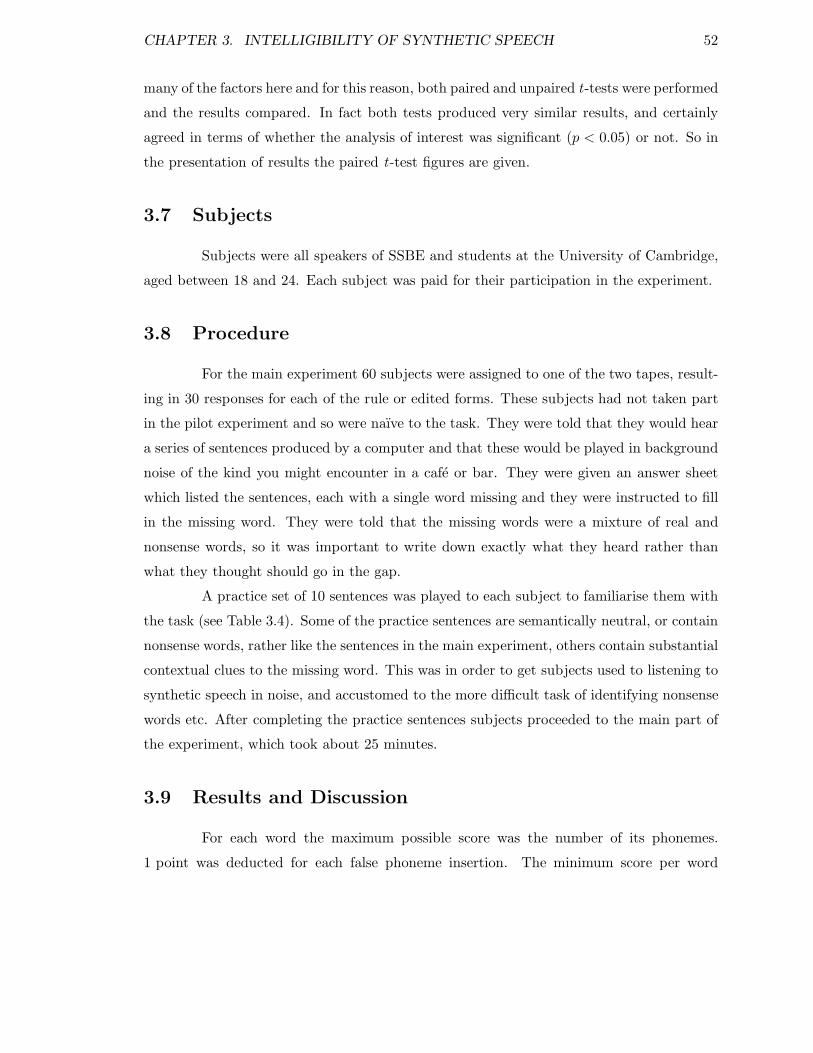
CHAPTER 3. INTELLIGIBILITY OF SYNTHETIC SPEECH 52
many of the factors here and for this reason, both paired and unpaired t-tests were performed
and the results compared. In fact both tests produced very similar results, and certainly
agreed in terms of whether the analysis of interest was significant (p < 0.05) or not. So in
the presentation of results the paired t-test figures are given.
3.7 Subjects
Subjects were all speakers of SSBE and students at the University of Cambridge,
aged between 18 and 24. Each subject was paid for their participation in the experiment.
3.8 Procedure
For the main experiment 60 subjects were assigned to one of the two tapes, result-
ing in 30 responses for each of the rule or edited forms. These subjects had not taken part
in the pilot experiment and so were naıve to the task. They were told that they would hear
a series of sentences produced by a computer and that these would be played in background
noise of the kind you might encounter in a cafe or bar. They were given an answer sheet
which listed the sentences, each with a single word missing and they were instructed to fill
in the missing word. They were told that the missing words were a mixture of real and
nonsense words, so it was important to write down exactly what they heard rather than
what they thought should go in the gap.
A practice set of 10 sentences was played to each subject to familiarise them with
the task (see Table 3.4). Some of the practice sentences are semantically neutral, or contain
nonsense words, rather like the sentences in the main experiment, others contain substantial
contextual clues to the missing word. This was in order to get subjects used to listening to
synthetic speech in noise, and accustomed to the more difficult task of identifying nonsense
words etc. After completing the practice sentences subjects proceeded to the main part of
the experiment, which took about 25 minutes.
3.9 Results and Discussion
For each word the maximum possible score was the number of its phonemes.
1 point was deducted for each false phoneme insertion. The minimum score per word
CHAPTER 3. INTELLIGIBILITY OF SYNTHETIC SPEECH 53
Practice sentences Missing word
You will need a . . . . . . and pencil. pen
Their favourite meal is beans and . . . . . . chips
On the shelf there is a . . . . . . about it. book
They found another . . . . . . yesterday. rat
Anthea . . . . . . is riding a moped. Millow
A large . . . . . . lives in my street. shooby
Ask your brother about the . . . . . . again. farm
There is a marvellous . . . . . . over there. Debbo
There were seven . . . . . . on the table. mugs
The sycamore . . . . . . is very tall. tree
Table 3.4: Practice sentences for perceptual experiment.
was 0. Raw scores were converted to percentage phonemes correct per word. A preliminary
analysis of the data showed that over all three word sets the edited forms scored slightly
less than the rule forms, 74% and 77% correct respectively (see Figure 3.3). This appears
at first sight to contradict the main hypothesis (see page 38). However, it appeared that
the attempts to improve intelligibility in the edited forms had been least successful for the
l-context syllables, and that this half of the data set might account for the majority of lower
scores on the edited forms, thus obscuring greater success for the r-context syllables.
Stimulus Type
% p
hone
mes
cor
rect
rule edit0
10
20
30
40
50
60
70
80
90
100
77% 74%
Figure 3.3: Percentage phonemes correct for rule and edited forms, averaged over all tokens.
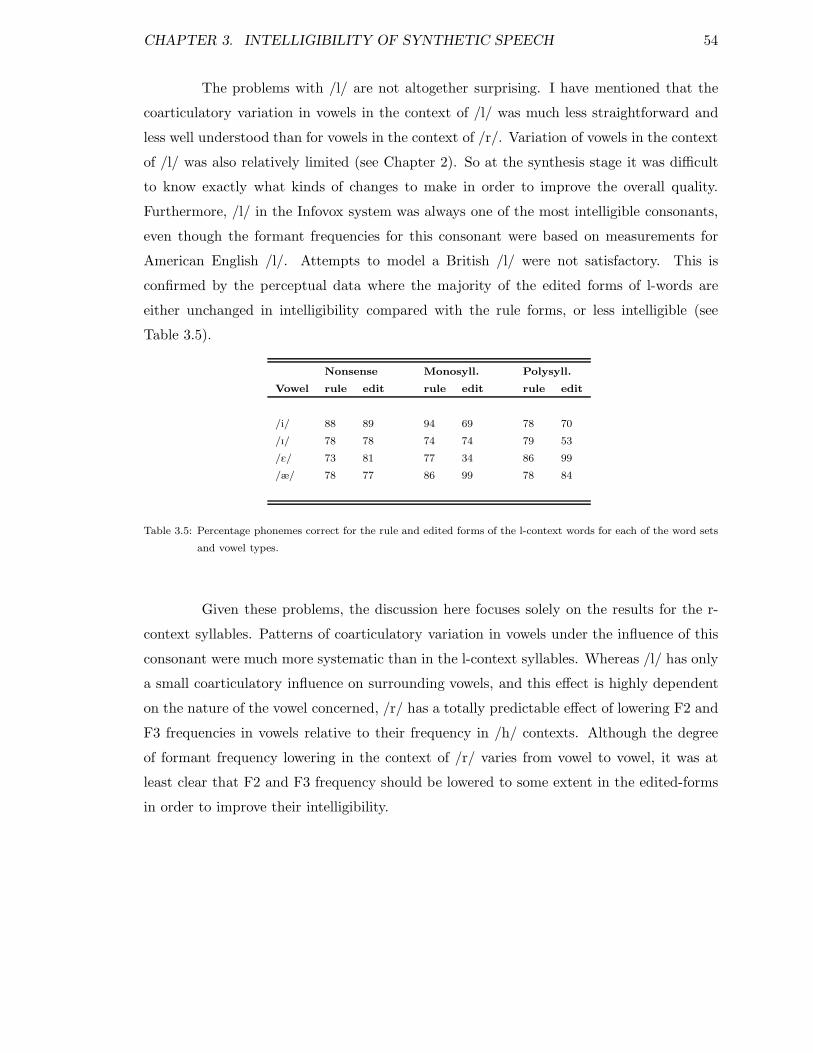
CHAPTER 3. INTELLIGIBILITY OF SYNTHETIC SPEECH 54
The problems with /l/ are not altogether surprising. I have mentioned that the
coarticulatory variation in vowels in the context of /l/ was much less straightforward and
less well understood than for vowels in the context of /r/. Variation of vowels in the context
of /l/ was also relatively limited (see Chapter 2). So at the synthesis stage it was difficult
to know exactly what kinds of changes to make in order to improve the overall quality.
Furthermore, /l/ in the Infovox system was always one of the most intelligible consonants,
even though the formant frequencies for this consonant were based on measurements for
American English /l/. Attempts to model a British /l/ were not satisfactory. This is
confirmed by the perceptual data where the majority of the edited forms of l-words are
either unchanged in intelligibility compared with the rule forms, or less intelligible (see
Table 3.5).
Nonsense Monosyll. Polysyll.
Vowel rule edit rule edit rule edit
/i/ 88 89 94 69 78 70
/I/ 78 78 74 74 79 53
/E/ 73 81 77 34 86 99
/æ/ 78 77 86 99 78 84
Table 3.5: Percentage phonemes correct for the rule and edited forms of the l-context words for each of the word sets
and vowel types.
Given these problems, the discussion here focuses solely on the results for the r-
context syllables. Patterns of coarticulatory variation in vowels under the influence of this
consonant were much more systematic than in the l-context syllables. Whereas /l/ has only
a small coarticulatory influence on surrounding vowels, and this effect is highly dependent
on the nature of the vowel concerned, /r/ has a totally predictable effect of lowering F2 and
F3 frequencies in vowels relative to their frequency in /h/ contexts. Although the degree
of formant frequency lowering in the context of /r/ varies from vowel to vowel, it was at
least clear that F2 and F3 frequency should be lowered to some extent in the edited-forms
in order to improve their intelligibility.
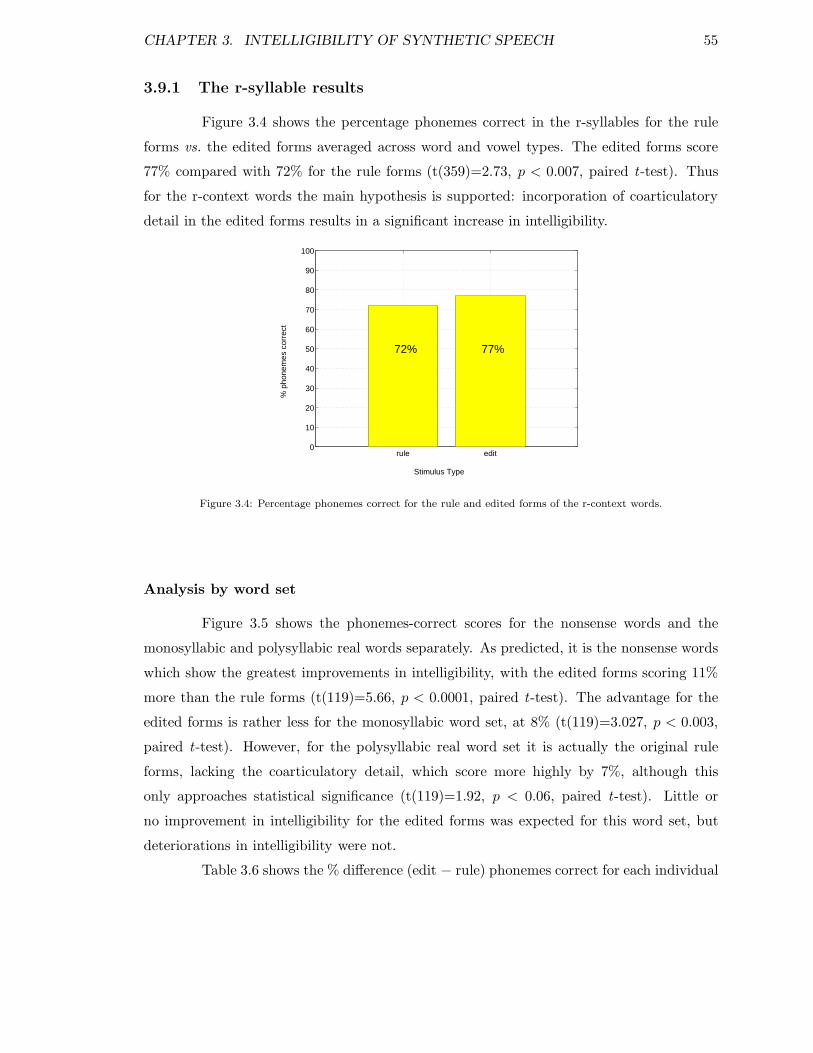
CHAPTER 3. INTELLIGIBILITY OF SYNTHETIC SPEECH 55
3.9.1 The r-syllable results
Figure 3.4 shows the percentage phonemes correct in the r-syllables for the rule
forms vs. the edited forms averaged across word and vowel types. The edited forms score
77% compared with 72% for the rule forms (t(359)=2.73, p < 0.007, paired t-test). Thus
for the r-context words the main hypothesis is supported: incorporation of coarticulatory
detail in the edited forms results in a significant increase in intelligibility.
Stimulus Type
% p
hone
mes
cor
rect
rule edit0
10
20
30
40
50
60
70
80
90
100
72% 77%
Figure 3.4: Percentage phonemes correct for the rule and edited forms of the r-context words.
Analysis by word set
Figure 3.5 shows the phonemes-correct scores for the nonsense words and the
monosyllabic and polysyllabic real words separately. As predicted, it is the nonsense words
which show the greatest improvements in intelligibility, with the edited forms scoring 11%
more than the rule forms (t(119)=5.66, p < 0.0001, paired t-test). The advantage for the
edited forms is rather less for the monosyllabic word set, at 8% (t(119)=3.027, p < 0.003,
paired t-test). However, for the polysyllabic real word set it is actually the original rule
forms, lacking the coarticulatory detail, which score more highly by 7%, although this
only approaches statistical significance (t(119)=1.92, p < 0.06, paired t-test). Little or
no improvement in intelligibility for the edited forms was expected for this word set, but
deteriorations in intelligibility were not.
Table 3.6 shows the % difference (edit − rule) phonemes correct for each individual
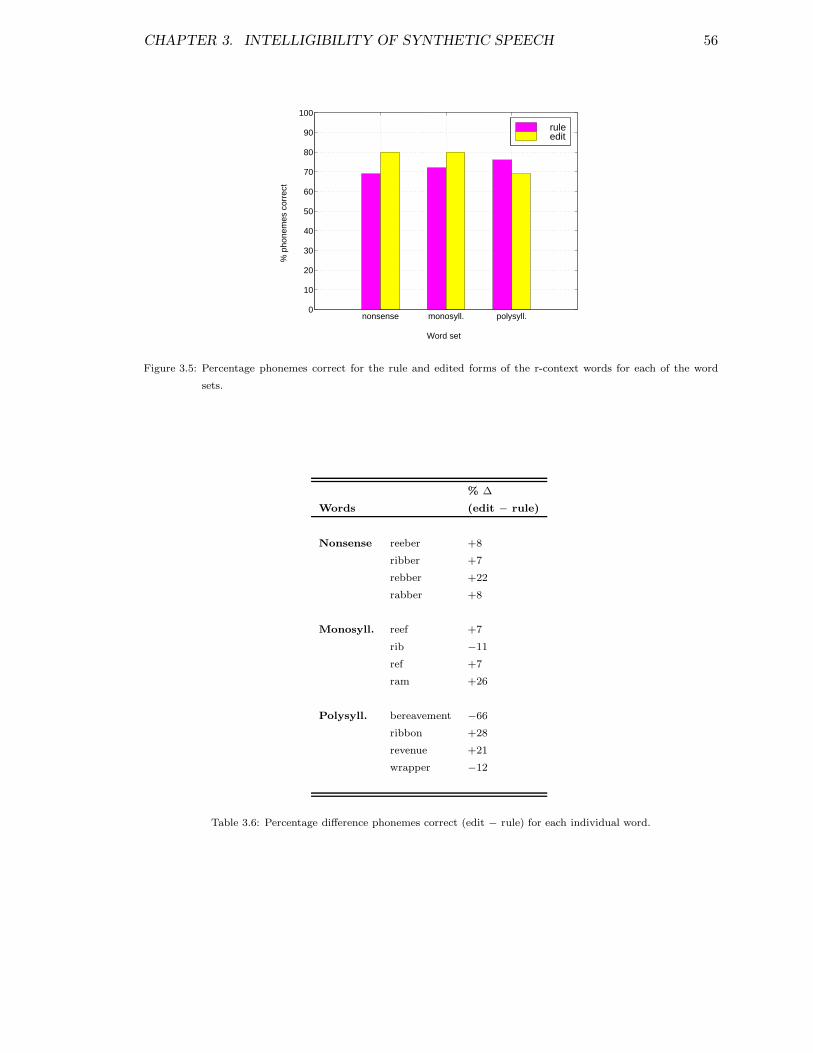
CHAPTER 3. INTELLIGIBILITY OF SYNTHETIC SPEECH 56
Word set
% p
hone
mes
cor
rect
nonsense monosyll. polysyll.0
10
20
30
40
50
60
70
80
90
100
ruleedit
Figure 3.5: Percentage phonemes correct for the rule and edited forms of the r-context words for each of the word
sets.
% ∆
Words (edit − rule)
Nonsense reeber +8
ribber +7
rebber +22
rabber +8
Monosyll. reef +7
rib −11
ref +7
ram +26
Polysyll. bereavement −66
ribbon +28
revenue +21
wrapper −12
Table 3.6: Percentage difference phonemes correct (edit − rule) for each individual word.
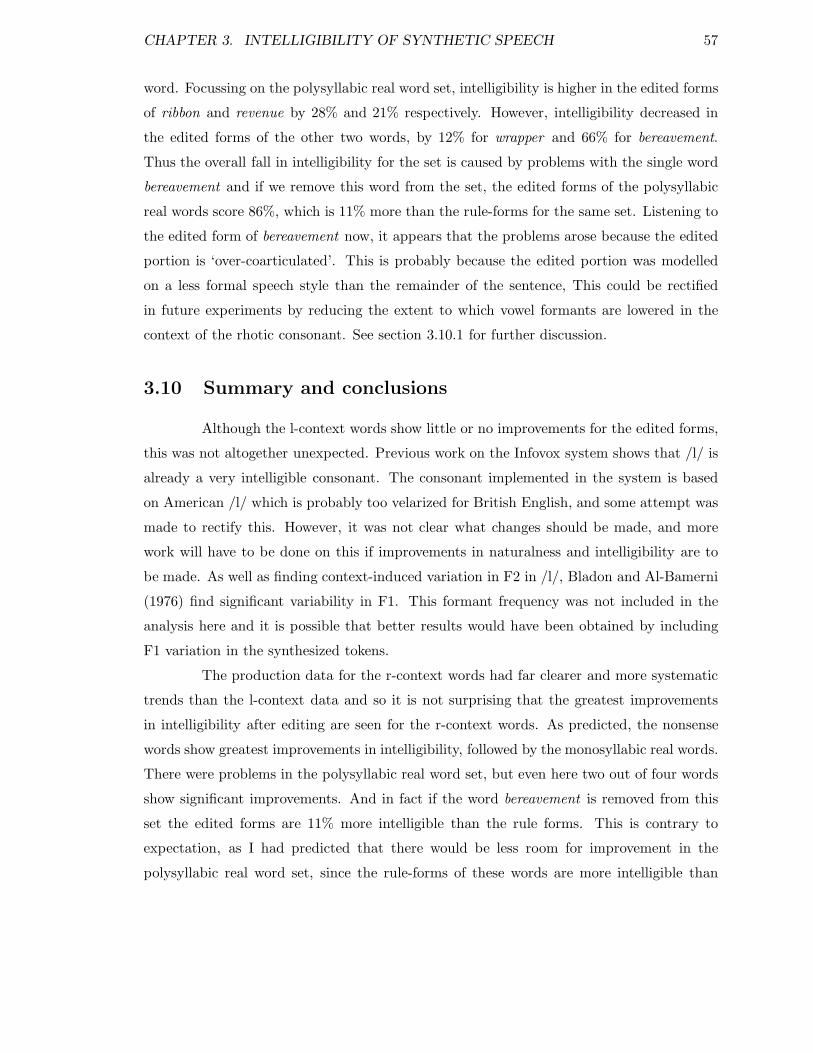
CHAPTER 3. INTELLIGIBILITY OF SYNTHETIC SPEECH 57
word. Focussing on the polysyllabic real word set, intelligibility is higher in the edited forms
of ribbon and revenue by 28% and 21% respectively. However, intelligibility decreased in
the edited forms of the other two words, by 12% for wrapper and 66% for bereavement.
Thus the overall fall in intelligibility for the set is caused by problems with the single word
bereavement and if we remove this word from the set, the edited forms of the polysyllabic
real words score 86%, which is 11% more than the rule-forms for the same set. Listening to
the edited form of bereavement now, it appears that the problems arose because the edited
portion is ‘over-coarticulated’. This is probably because the edited portion was modelled
on a less formal speech style than the remainder of the sentence, This could be rectified
in future experiments by reducing the extent to which vowel formants are lowered in the
context of the rhotic consonant. See section 3.10.1 for further discussion.
3.10 Summary and conclusions
Although the l-context words show little or no improvements for the edited forms,
this was not altogether unexpected. Previous work on the Infovox system shows that /l/ is
already a very intelligible consonant. The consonant implemented in the system is based
on American /l/ which is probably too velarized for British English, and some attempt was
made to rectify this. However, it was not clear what changes should be made, and more
work will have to be done on this if improvements in naturalness and intelligibility are to
be made. As well as finding context-induced variation in F2 in /l/, Bladon and Al-Bamerni
(1976) find significant variability in F1. This formant frequency was not included in the
analysis here and it is possible that better results would have been obtained by including
F1 variation in the synthesized tokens.
The production data for the r-context words had far clearer and more systematic
trends than the l-context data and so it is not surprising that the greatest improvements
in intelligibility after editing are seen for the r-context words. As predicted, the nonsense
words show greatest improvements in intelligibility, followed by the monosyllabic real words.
There were problems in the polysyllabic real word set, but even here two out of four words
show significant improvements. And in fact if the word bereavement is removed from this
set the edited forms are 11% more intelligible than the rule forms. This is contrary to
expectation, as I had predicted that there would be less room for improvement in the
polysyllabic real word set, since the rule-forms of these words are more intelligible than
CHAPTER 3. INTELLIGIBILITY OF SYNTHETIC SPEECH 58
the rule forms for either the nonsense or monosyllabic real words. It is interesting that
that polysyllabic words showed both the greatest individual improvements in intelligibility,
for the edited forms of ribbon and revenue, and the greatest fall in intelligibility when the
editing process is unsuccessful, as for bereavement.
It seems that if the acoustic detail for just a small portion of a word is wrong
perceptual coherence is lost and perceptual errors are made even for segments that were
unchanged in the editing process. There was no evidence in this experiment that lexical
neighbourhood densities (cf. Luce, Pisoni, and Goldinger 1990) had any impact on the
perceptual process. In fact longer words, with low neighbourhood densities were extremely
sensitive to changes in just a small portion of the acoustic signal. This emphasises the
importance of perceptual coherence and shows how easily intelligibility is lost if spectral
details are inappropriate. It would be interesting to examine whether the same finding holds
if the subjects are told that all words are real words. It is possible that they would then make
greater use of contextual and other top-down knowledge, and that lexical neighbourhood
denisities would have a greater impact on results.
Fine acoustic detail has generally been neglected in the rules for speech synthesis
systems because it is relatively subtle and basic intelligibility can be achieved without it. It
was argued here that improving the naturalness of synthetic speech by incorporating sys-
tematic coarticulatory variation would also improve intelligibility, provided the perceptual
tests were designed to avoid ceiling effects. Indeed a fairly low signal to noise ratio (5dB)
was used in the experiment. Although the naturalness of the edited synthetic stimuli was
not assessed experimentally, subjective auditory assessment by both the experimenter and
unbiased speakers of British English suggested that the edited forms of words in this experi-
ment were more natural-sounding than the rule forms. The experimental data demonstrate
that fine acoustic detail can contribute not just to the naturalness of synthetic speech, but
also to its intelligibility, at least in noisy listening conditions.
3.10.1 Speech style
The process of incorporating coarticulatory variation in the synthetic stimuli was
not straightforward. Section 3.3 describes how formant frequencies from a single SSBE
speaker were used to guide changes made to Infovox-generated synthetic speech. Although
all the changes in formant frequency values were in the same direction as in the natural
CHAPTER 3. INTELLIGIBILITY OF SYNTHETIC SPEECH 59
speech, most were not of the same magnitude. It was found that formant frequency lowering
in vowels in the context of /r/ had to be done on a far smaller scale in the synthetic speech
than would be predicted from the measurements in natural speech. One consequence of over-
doing the the coarticulatory formant frequency lowering was an inappropriate vowel quality.
Another, related impression, was of a clash of speech styles, where the over-coarticulated
vowel sounds too casual in the context of its carrier sentence, as for bereavement. Similar
problems with over-coarticulation were encountered with other words, but all these were
fixed during the hand-editing process by reducing the extent to which formant frequencies
were lowered.
It was concluded that the absence of small-scale coarticulatory variation in the
majority of the synthesized carrier sentence means that rather less coarticulation sounds
appropriate in the edited portion than is the case in natural speech. If this is true, it
has great significance for the incorporation of coarticulatory detail in synthetic speech. It
seems that for a synthesised word to be maximally intelligible, it must be made to sound
as natural as possible, but must also cohere acoustically with the surrounding speech. If
coarticulatory detail is introduced over longer stretches of the synthetic speech signal, some
of these clashing speech style problems may be avoided. What this experiment shows is
the importance of consistency and of retaining perceptual coherence over long stretches of
the speech signal. If spectral properties of whole sentences are modified in line with the
kind of coarticulatory variation found in natural speech, it is possible that even greater
improvements in intelligibility would be found than have been demonstrated here.
3.10.2 Implications for synthesis applications
This experiment shows that listeners are sensitive to contextually induced vari-
ation in the acoustic signal spread over several segments. A base-line for the perceptual
importance of this kind of acoustic detail is established by the results for Set A, the non-
sense word set. Here there are no lexical or syntactic cues to assist the perception process
and listeners are forced to attend closely to the acoustic signal. Spiegel, Altom, and Mac-
chi (1990) make the useful point that many of the applications for text-to-speech systems
involve large databases of surnames, placenames and so forth, which are often more similar
to nonsense words than to real words. Thus Set A does not merely serve as a diagnostic
tool, but is directly relevant to many text-to-speech applications.
CHAPTER 3. INTELLIGIBILITY OF SYNTHETIC SPEECH 60
Benoıt, Van Erp, Grice, Hazan, and Jekosch (1989), amongst others, comment that
meaningful sentences provide contextual clues whose effects on intelligibility cannot read-
ily be quantified. They use this as an argument for focusing exclusively on semantically
anomalous sentences in the perceptual analysis of synthetic speech. Whilst acknowledging
the motivation for this approach, I feel it is vital to make some attempt at quantifying any
differences in the importance of acoustic cues that may exist between anomalous and mean-
ingful sentences. Clearly the most powerful demonstration of the importance of acoustic
detail is to show perceptual effects in real words in meaningful sentences.
So, whilst Set A provides the most sensitive test of the perceptual salience of
coarticulatory detail, the relevance of such detail to the perception of real words in sen-
tential context is emphasised by the results for Sets B and C. Significant improvements in
intelligibility are found for many of the monosyllabic and polysyllabic real words occur-
ring in meaningful sentences and this is of direct relevance to many real-world synthesis
applications.
The kinds of improvements in intelligibility documented here (7–28%), provide
a strong case for the incorporation of fine acoustic detail in the rules for speech synthe-
sis systems. The perceptual salience of this kind of detail has been demonstrated in a
noisy environment, and the speech-style noise used in the experiment is very much like
the background noise in locations where synthetic speech is typically listened to, for in-
stance in open-plan offices, railway stations, airports, on public telephones and so forth. So
the cafe-style noise used provides a realistic, application-specific test of the contribution of
context-induced acoustic detail to the intelligibility of synthetic speech.
An important question is whether the kind of acoustic detail described here can
contribute to intelligibility in anything other than noisy conditions. It could be said that
these listening conditions impose rather unusual constraints on the perceptual process and
it has been suggested that attention to small-scale acoustic detail is only necessary when the
perceptual system is pushed to the limit. Results from speech-in-noise experiments might
be considered irrelevant to more everyday conditions of spoken language comprehension.
But the experiments surveyed in Section 1.3.1 of the Introduction suggest that the
lack of acoustic coherence in synthetic speech has an impact on speech perception even in
optimal listening conditions. A range of tests comparing synthetic speech to natural speech
show that synthetic speech detrimentally affects recall, speed of comprehension, a variety of
higher-level cognitive processes and secondary task completion. This chapter described an

CHAPTER 3. INTELLIGIBILITY OF SYNTHETIC SPEECH 61
experiment in which background noise is used to avoid the kinds of ceiling effects often found
in other perceptual testing conditions. It would be worthwhile to use some of the other tests
discussed in the Introduction to strengthen claims of the importance of fine acoustic detail
to the robustness of the speech signal and its relevance to real-world applications, but to
do so goes beyond the scope of this thesis.
Having established that the incorporation of small-scale coarticulatory detail in
synthetic speech can bring improvements in naturalness and intelligibility, the next stage
was to explore other kinds of contextual variation which have been neglected in the coarticu-
lation, perception and synthesis literatures. Chapters 4–6 explore a variety of coarticulatory
effects in greater detail and provide indicators of where further perceptual testing might
profitably begin.
62
Chapter 4
The temporal course of rhotic
resonance effects
4.1 Introduction
Prosodic phonologists argue strongly that resonance effects can spread over longer
stretches of the speech signal than single syllables. Kelly (1989) suggests that in his own
West Midlands accent of English, in comparison with Why was Henry la...te?, the phrase
How did K ...en relate? has a distinct ‘frontness’ over the section underlined and more weakly
in the section with the dotted underlining. However, no data are presented to substantiate
such claims.
The evidence in Chapter 2 for r-colouring spreading to a non-adjacent schwa in
/r V C @/ sequences was mixed. Four of the five speakers had r-induced formant frequency
lowering for either F2 or F3 in schwas in this sequence. But the analysis of all 5 speakers
averaged together did not show significant effects of /r/ on either F2 or F3 in the schwa.
This result was viewed with some scepticism, since the experiment was primarily designed
to investigate C-to-V effects within a single syllable, and not the spread of such effects to
non-adjacent segments. So, for instance, the phonetic context following the schwa in the
/r V C @/ sequences was not always well-controlled. Resonance effects in non-adjacent vow-
els were found in Tunley (1995), and in the experiment in Chapter 2 here, F2 averaged across
all speakers was lower in schwas in /rIC@/ sequences. This and the inter-speaker variability
described in Chapter 2 suggested that long-domain effects deserved further investigation.
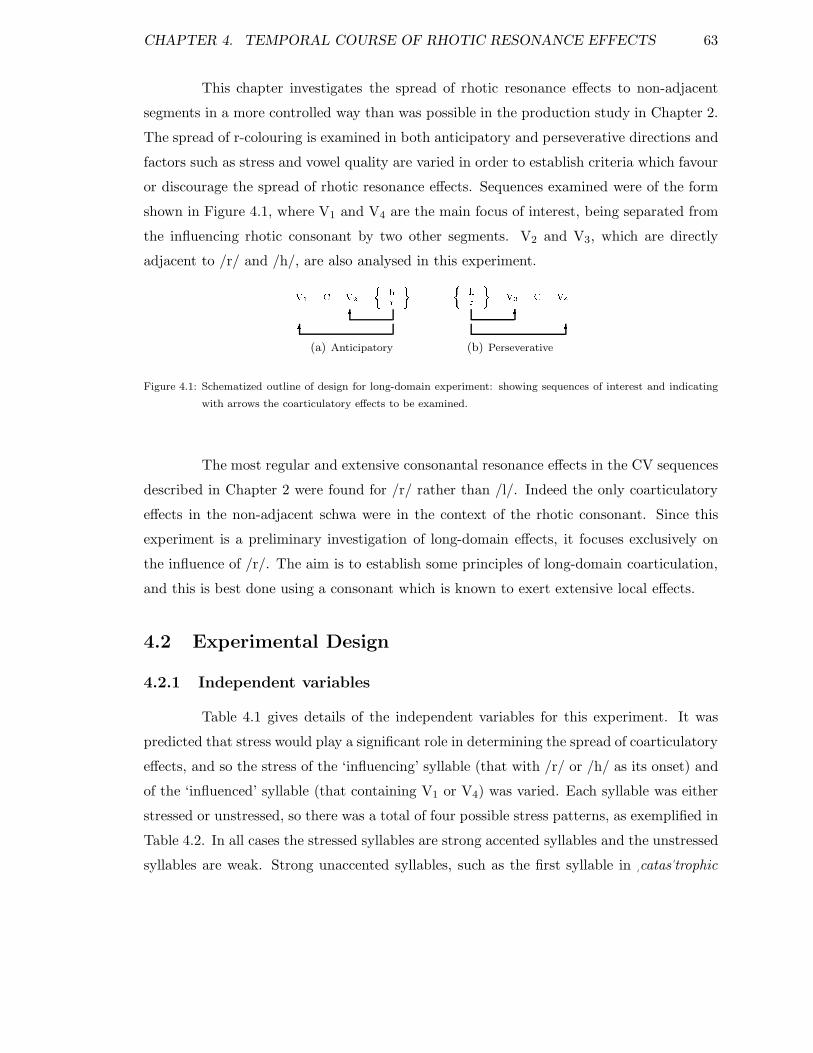
CHAPTER 4. TEMPORAL COURSE OF RHOTIC RESONANCE EFFECTS 63
This chapter investigates the spread of rhotic resonance effects to non-adjacent
segments in a more controlled way than was possible in the production study in Chapter 2.
The spread of r-colouring is examined in both anticipatory and perseverative directions and
factors such as stress and vowel quality are varied in order to establish criteria which favour
or discourage the spread of rhotic resonance effects. Sequences examined were of the form
shown in Figure 4.1, where V1 and V4 are the main focus of interest, being separated from
the influencing rhotic consonant by two other segments. V2 and V3, which are directly
adjacent to /r/ and /h/, are also analysed in this experiment.V1 C V2 n hr o6 6(a) Anticipatory
n hr o V3 C V466(b) Perseverative
Figure 4.1: Schematized outline of design for long-domain experiment: showing sequences of interest and indicating
with arrows the coarticulatory effects to be examined.
The most regular and extensive consonantal resonance effects in the CV sequences
described in Chapter 2 were found for /r/ rather than /l/. Indeed the only coarticulatory
effects in the non-adjacent schwa were in the context of the rhotic consonant. Since this
experiment is a preliminary investigation of long-domain effects, it focuses exclusively on
the influence of /r/. The aim is to establish some principles of long-domain coarticulation,
and this is best done using a consonant which is known to exert extensive local effects.
4.2 Experimental Design
4.2.1 Independent variables
Table 4.1 gives details of the independent variables for this experiment. It was
predicted that stress would play a significant role in determining the spread of coarticulatory
effects, and so the stress of the ‘influencing’ syllable (that with /r/ or /h/ as its onset) and
of the ‘influenced’ syllable (that containing V1 or V4) was varied. Each syllable was either
stressed or unstressed, so there was a total of four possible stress patterns, as exemplified in
Table 4.2. In all cases the stressed syllables are strong accented syllables and the unstressed
syllables are weak. Strong unaccented syllables, such as the first syllable in �catas"trophic

CHAPTER 4. TEMPORAL COURSE OF RHOTIC RESONANCE EFFECTS 64
are not investigated here.
Independent Factor levels
i) ‘Influencing’ consonant /r/ or /h/
ii) Stress of the ‘influencing’ syllable stressed or unstressed
iii) Stress of the ‘influenced’ syllable stressed or unstressed
iv) Nucleus of the ‘influenced’ syllable /i I E æ/ when stressed
/i I @/ when unstressed
v) Direction of spread anticipatory or perseverative
Table 4.1: Independent variables. The ‘influenced’ syllable is that containing V1 or V4 in Figure 4.1, depending on
direction of coarticulatory spread. The ‘influencing’ syllable is that with /r/ or /h/ as its onset.
Stress
target-σ r-σ Subsection of sentence
s s "Eva "raced . . .
w s . . . "Sammy for "racing . . .
s w "Eva re"marked . . .
w w . . . "Sammy for a "crossword . . .
Table 4.2: Possible stress patterns for sequences investigating anticipatory r-colouring in /i/. The sequence of interest
(/i C @ r/) is underlined in the orthography. The target-σ (V1 in Figure 4.1) is that with /i/ as its nucleus
and the r-σ is that with /r/ as its onset. s = strong, w = weak. The intervening syllable is always weak
here. For full details of the sentences from which these examples come, see Table 4.3, page 67.
Chapter 2 described how vowels are not equally susceptible to the influence of
r-colouring in CV sequences. It is predicted that this will also be true for vowels further
removed from the r-context. The same four vowels /i I E æ/ which were investigated in
CV sequences in Chapter 2 are included here as V1 and V4 of the sequence in Figure 4.1.
Where this syllable is unstressed it is always weak and so the vowel set is reduced to /i I @/,
as neither /E/ nor /æ/ occur in weak syllables in English.
The final factor investigated is the direction of spread of r-colouring. Chapter 2
focused exclusively on perseverative effects, here anticipatory coarticulation is also exam-
ined.
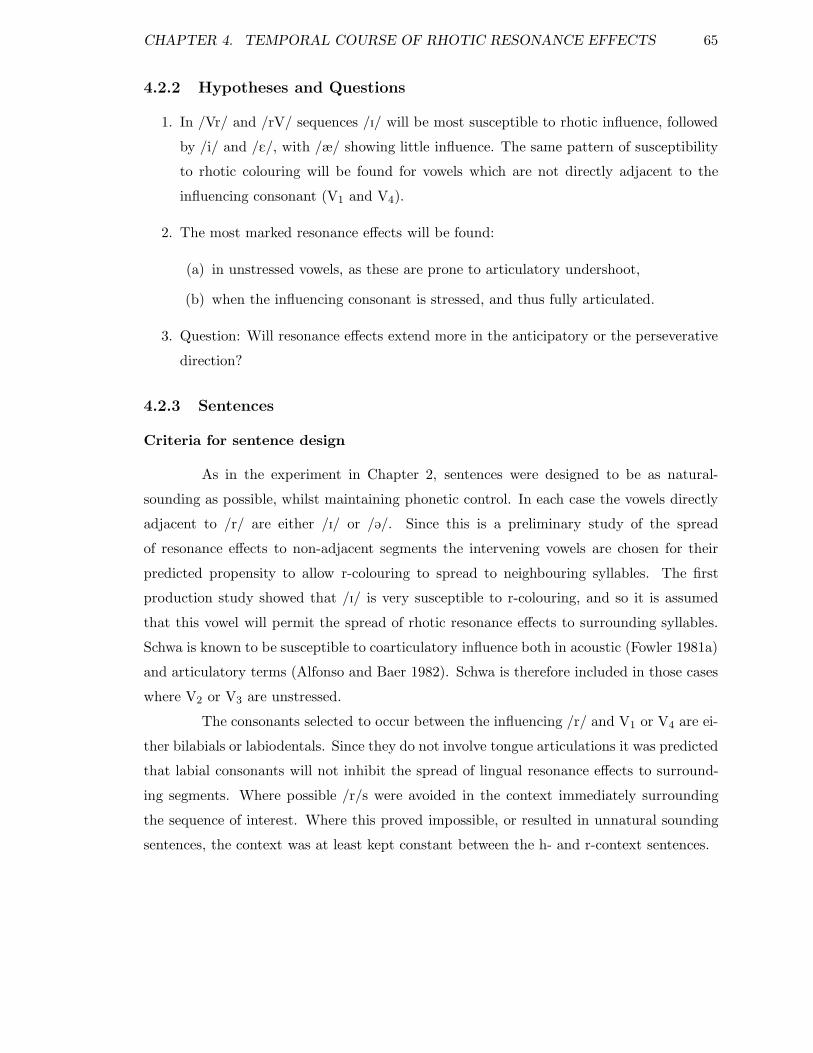
CHAPTER 4. TEMPORAL COURSE OF RHOTIC RESONANCE EFFECTS 65
4.2.2 Hypotheses and Questions
1. In /Vr/ and /rV/ sequences /I/ will be most susceptible to rhotic influence, followed
by /i/ and /E/, with /æ/ showing little influence. The same pattern of susceptibility
to rhotic colouring will be found for vowels which are not directly adjacent to the
influencing consonant (V1 and V4).
2. The most marked resonance effects will be found:
(a) in unstressed vowels, as these are prone to articulatory undershoot,
(b) when the influencing consonant is stressed, and thus fully articulated.
3. Question: Will resonance effects extend more in the anticipatory or the perseverative
direction?
4.2.3 Sentences
Criteria for sentence design
As in the experiment in Chapter 2, sentences were designed to be as natural-
sounding as possible, whilst maintaining phonetic control. In each case the vowels directly
adjacent to /r/ are either /I/ or /@/. Since this is a preliminary study of the spread
of resonance effects to non-adjacent segments the intervening vowels are chosen for their
predicted propensity to allow r-colouring to spread to neighbouring syllables. The first
production study showed that /I/ is very susceptible to r-colouring, and so it is assumed
that this vowel will permit the spread of rhotic resonance effects to surrounding syllables.
Schwa is known to be susceptible to coarticulatory influence both in acoustic (Fowler 1981a)
and articulatory terms (Alfonso and Baer 1982). Schwa is therefore included in those cases
where V2 or V3 are unstressed.
The consonants selected to occur between the influencing /r/ and V1 or V4 are ei-
ther bilabials or labiodentals. Since they do not involve tongue articulations it was predicted
that labial consonants will not inhibit the spread of lingual resonance effects to surround-
ing segments. Where possible /r/s were avoided in the context immediately surrounding
the sequence of interest. Where this proved impossible, or resulted in unnatural sounding
sentences, the context was at least kept constant between the h- and r-context sentences.
CHAPTER 4. TEMPORAL COURSE OF RHOTIC RESONANCE EFFECTS 66
The phonological weight of syllables (heavy vs. light) was not explicitly controlled
in this experiment, as this would have complicated sentence design beyond what was deemed
practical. However, it was recognized that, like stress, syllable weight has an impact on
rhythm and relative syllable durations and as such is likely to have an impact on suscepti-
bility to coarticulatory influence. Due to the focus on short monophthongal vowels and a
need to control segmental context, very simple syllable structures are generally used here.
Using Laver’s (1994: p156) definition, 89% of all syllables of interest (n=112) are light, that
is they have a short vowel and optionally a singleton consonant coda. Of the remaining 11%
heavy syllables (those containing long vowels or with more than one consonant in the coda),
8 tokens are accounted for by stressed /i:/ syllable nuclei, representing 7% of the total. So
overwhelmingly this experiment is an investigation of coarticulatory effects in stressed and
unstressed light syllables.
It is well known that word boundaries affect some acoustic phonetic parameters,
especially the temporal properties of syllables. Klatt (1973) finds vowels before voiceless
consonants to be 35% shorter than before voiced consonants in monosyllabic English words,
whereas in bisyllabic words the vowels are only 22% shorter. Lehiste (1972) finds that
stressed syllables decrease in duration when unstressed syllables are added to a word. This
work is extended by White and Turk (1998), who claim that the domain of syllable compres-
sion begins with a stressed syllable and ends at a word boundary. However, a preliminary
study here suggested that word boundaries did not affect the spread of rhoticity from one
segment to another and this guided the decision not to actively control for word boundaries.
In fact most sentences in this experiment are relatively well controlled for word-
boundary effects. Within the sentences for a particular direction of coarticulatory spread
and for each vowel set the word boundaries occur in comparable positions. This control of
word boundaries is weakest for the sentences investigating perseverative spread where you
have examples like ravine /r@vi:n/ vs. her vino /h@ # vi:n@U/. In the second case there is
a word boundary between the /h/ and the vowel of interest /i:/, whereas in the first case
the /r/ and the vowel of interest are within a single word. Additionally, in a few cases the
/r/ is present by virtue of its status as a linking /r/, as in for a map. Pilot work suggested
that there was no difference in the realisation of linking and non-linking /r/s.
CHAPTER 4. TEMPORAL COURSE OF RHOTIC RESONANCE EFFECTS 67
Anticipatory spread of coarticulatory effects
Table 4.3 describes the sentences used to investigate anticipatory coarticulation.
The first column of the table gives an overview of the phoneme sequence of interest and
marks the stressed syllables. In each case V1 is the main vowel of interest and the second
column describes the vowels examined in this syllable. The third column lists the sentences
in which the sequences of interest are incorporated.
Phoneme sequence V1 Sentence
"V1 C V2
{
"r
"h
}
/i:/
/I/
/E/
/æ/
"Eva
"Pippa
"Emma
"Abba
{
"raced up the hill.
"hate(s) upper class people.
}
V1 C V2
{
"r
"h
} /i/
/I/
/@/
Ask Sammy for
Give Joseph a
Ask Emma for
{
"racing report(s).
"hasty decision(s).
}
"V1 C V2
{
r
h
}
/i:/
/I/
/E/
/æ/
"Eva
"Pippa
"Emma
"Abba
{
remarked on his rudeness.
hypocritically agreed.
}
V1 C V2
{
r
h
} /i/
/I/
/@/
Ask
Sammy
Joseph
Emma
{
for a crossword clue.
for her crossword technique.
}
Table 4.3: Sentences: Anticipatory spread of /r/ colouring. The sequence of interest is underlined in the orthography.
(See also Figure 4.1(a), page 63.)
Perseverative spread of coarticulatory effects
Table 4.4 describes the sentences used to investigate perseverative coarticulation.
The table is constructed in a similar manner to Table 4.3. In each case the main vowel of
interest is V4.
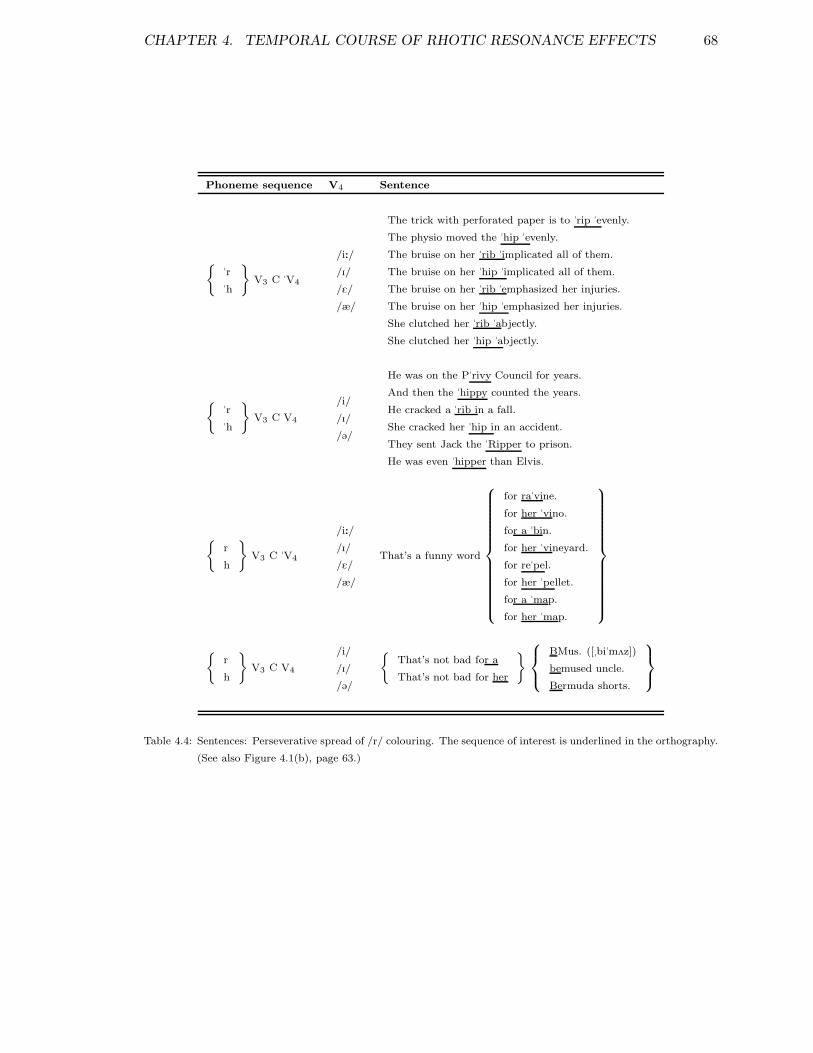
CHAPTER 4. TEMPORAL COURSE OF RHOTIC RESONANCE EFFECTS 68
Phoneme sequence V4 Sentence
{
"r
"h
}
V3 C "V4
/i:/
/I/
/E/
/æ/
The trick with perforated paper is to "rip "evenly.
The physio moved the "hip "evenly.
The bruise on her "rib "implicated all of them.
The bruise on her "hip "implicated all of them.
The bruise on her "rib "emphasized her injuries.
The bruise on her "hip "emphasized her injuries.
She clutched her "rib "abjectly.
She clutched her "hip "abjectly.
{
"r
"h
}
V3 C V4
/i/
/I/
/@/
He was on the P"rivy Council for years.
And then the "hippy counted the years.
He cracked a "rib in a fall.
She cracked her "hip in an accident.
They sent Jack the "Ripper to prison.
He was even "hipper than Elvis.
{
r
h
}
V3 C "V4
/i:/
/I/
/E/
/æ/
That’s a funny word
for ra"vine.
for her "vino.
for a "bin.
for her "vineyard.
for re"pel.
for her "pellet.
for a "map.
for her "map.
{
r
h
}
V3 C V4
/i/
/I/
/@/
{
That’s not bad for a
That’s not bad for her
}
BMus. ([�bi"m2z])
bemused uncle.
Bermuda shorts.
Table 4.4: Sentences: Perseverative spread of /r/ colouring. The sequence of interest is underlined in the orthography.
(See also Figure 4.1(b), page 63.)
CHAPTER 4. TEMPORAL COURSE OF RHOTIC RESONANCE EFFECTS 69
4.3 Recording
The 56 sentences in Tables 4.3 and 4.4 were put together with the sentences used
in the experiments described in Chapters 5 and 6 (see Tables 5.1, 6.1, 6.2 and 6.3) making
a total of 164 sentences. The sentences for each of the three production studies were
sufficiently dissimilar to function as filler sentences for each other. All the sentences were
randomized in 5 blocks to produce 5 repetitions of each sequence of interest. Three native
speakers of Standard Southern British English, 2 female, 1 male, aged between 20–30 years
read the sentences. The same instruction regarding reading-style was given as in the pre-
synthesis recording described in Appendix A, namely that subjects should read in a clear
and careful style, whilst maintaining naturalness.
Each speaker was given a practice session using a subset of the sentences, before
starting the recording proper. This was in order to familiarise them with the task and to
elicit an appropriate speaking style. Since there was a large number of sentences to be
read, the recording was done in two sessions on consecutive days: in the first session 3
repetitions were recorded and in the second session the final 2 repetitions were recorded.
The recording was made onto DAT tape in a sound treated room using a Sennheiser MKH
40 P48 microphone. The speech was digitised at 16kHz using Silicon Graphics Indigo
A.D. converters.
4.4 Measurements and statistical analysis
The frequencies of F2, F3 and F4 were measured at the midpoint of all vowels
shown in Figure 4.1. In the experiment in Chapter 2 only F2 and F3 were measured, but
F4 is included here in case the low F4 typical of /r/ influenced F4 in surrounding vowels.
The midpoints of the vowels were determined by hand after locating vowel onset and offset,
as described in Chapter 2, Section 2.5. As in that experiment, formant frequencies were
measured using the xwaves automatic formant tracking facility, 20-pole Burg lpc spectra
with a 30ms rectangular window. Measurements were corrected by hand where obvious
errors had been made by the formant tracker.
A separate statistical analysis was done for the formant frequency data from adja-
cent vowels and for the data from non-adjacent vowels. A repeated measures ANOVA was
used in each case.
CHAPTER 4. TEMPORAL COURSE OF RHOTIC RESONANCE EFFECTS 70
The adjacent vowel analysis used a 2× 2× 2× 7 design with the following factors:
Consonant: /r/, /h/; Direction of influence: anticipatory, perseverative; Stress of influ-
encing syllable: stressed, unstressed and Quality and stress of V1 or V4: stressed /i I E
æ/, unstressed /i I @/. Vowel quality and stress are pooled in this final factor in order to
make possible a single ANOVA for these adjacent vowels. The unequal numbers of stressed
and unstressed vowels would have required separate ANOVAs if stress was included as a
separate factor.
The unequal numbers of stressed and unstressed vowels meant that two ANOVAs
were required for each formant frequency for the non-adjacent vowels, one for each stress
condition. The non-adjacent vowel analysis is a 2× 2× 2× 4 design for the stressed vowels,
and a 2× 2× 2× 3 design for the unstressed vowels, with the following factors: Consonant:
/r/, /h/; Direction of influence: anticipatory, perseverative; Stress of influencing syllable:
stressed, unstressed and Quality of V1 or V4: /i I E æ/ for the stressed vowels, /i I @/ for
the unstressed vowels.
4.5 Results and Discussion
4.5.1 r-colouring in adjacent vowels
This section describes the formant frequency variation in vowels which are directly
adjacent to the /r/ or /h/ (V2 and V3 in Figure 4.1). I present the most general patterns
first and then analyse each result in more detail where there are differences from this general
pattern.
Figure 4.2 shows the frequencies of F2, F3 and F4 in vowels immediately before
and after the /r/ or /h/. The formant frequencies are averaged across the different vowels
and repetitions. In both V2 and V3 all three formants are much lower in the context of
/r/ than /h/ (F(1,2)=285.06, p < 0.004, F(1,2)=85.06, p < 0.01, F(1,2)=47.41, p < 0.02
for F2, F3 and F4 respectively). The results for F2 and F3 in /rV/ sequences confirm the
findings reported in Chapter 2 and this replication suggests that the patterns observed in
that experiment are robust. What is new here is the finding that F4 frequency is also lower
in the context of /r/.
The absolute formant frequencies vary between the pre- and post-consonantal po-
sitions, due to the occurrence of /I/s after the consonant, whereas all the pre-consonantal

CHAPTER 4. TEMPORAL COURSE OF RHOTIC RESONANCE EFFECTS 71
Consonant context
Fre
quen
cy (
Hz)
/r/ /h/1000
1500
2000
2500
3000
3500
4000
4500
/r/ /h/
F4F3F2
Pre-consonantal (V2) Post-consonantal (V3)
Figure 4.2: F2, F3 and F4 frequencies in the vowels directly ajacent to /r/ or /h/, split into pre- and post-consonantal
positions, averaged across vowels and repetitions. The vowels of interest are V2 and V3 of Figure 4.1.
vowels are schwa. This imbalance was inevitable given that one independent factor was
the stress of the syllable containing the influencing consonant and this necessarily affects
the quality of the following tautosyllabic vowel. However, the degree of r-induced formant
frequency lowering is virtually identical in the anticipatory and perseverative directions.
Indeed, there is no significant consonant×direction interaction for any of the formants
(F(1,2)=14.05, p < 0.06, F(1,2)=3.38, p < 0.2, F(1,2)=5.35, p < 0.15). The difference
in F2 frequency approaches significance, and indeed r-induced formant frequency lower-
ing for F2 is slightly more marked in the anticipatory direction than in the perseverative
direction (−250Hz and −200Hz respectively). Perceptual tests would be required to re-
solve whether this difference in degree of F2 lowering is something that would need to be
accurately modelled when incorporating such contextual effects in synthetic speech.
The lack of any clear consonant×direction interaction confirms the impression
from Figure 4.2 that coarticulatory effects do not spread more readily in one direction than
the other. This is reinforced by the results for the non-adjacent vowels and is discussed in
greater detail in Section 4.5.4.
The adjacent vowels differ in vowel quality and stress between the anticipatory and
perseverative directions, and so one would expect differences in the degree to which these
vowels are susceptible to coarticulatory influence. All adjacent vowels in the anticipatory
direction are unstressed schwas, whereas half of those in the perseverative direction are
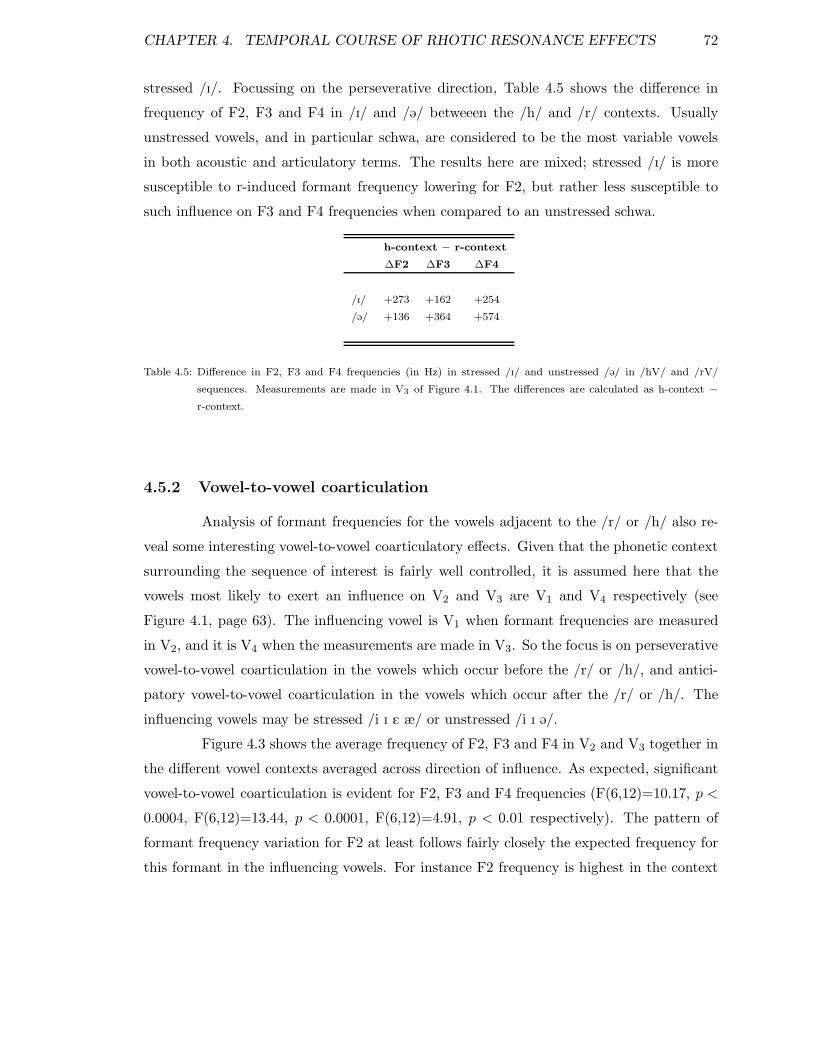
CHAPTER 4. TEMPORAL COURSE OF RHOTIC RESONANCE EFFECTS 72
stressed /I/. Focussing on the perseverative direction, Table 4.5 shows the difference in
frequency of F2, F3 and F4 in /I/ and /@/ betweeen the /h/ and /r/ contexts. Usually
unstressed vowels, and in particular schwa, are considered to be the most variable vowels
in both acoustic and articulatory terms. The results here are mixed; stressed /I/ is more
susceptible to r-induced formant frequency lowering for F2, but rather less susceptible to
such influence on F3 and F4 frequencies when compared to an unstressed schwa.
h-context − r-context
∆F2 ∆F3 ∆F4
/I/ +273 +162 +254
/@/ +136 +364 +574
Table 4.5: Difference in F2, F3 and F4 frequencies (in Hz) in stressed /I/ and unstressed /@/ in /hV/ and /rV/
sequences. Measurements are made in V3 of Figure 4.1. The differences are calculated as h-context −
r-context.
4.5.2 Vowel-to-vowel coarticulation
Analysis of formant frequencies for the vowels adjacent to the /r/ or /h/ also re-
veal some interesting vowel-to-vowel coarticulatory effects. Given that the phonetic context
surrounding the sequence of interest is fairly well controlled, it is assumed here that the
vowels most likely to exert an influence on V2 and V3 are V1 and V4 respectively (see
Figure 4.1, page 63). The influencing vowel is V1 when formant frequencies are measured
in V2, and it is V4 when the measurements are made in V3. So the focus is on perseverative
vowel-to-vowel coarticulation in the vowels which occur before the /r/ or /h/, and antici-
patory vowel-to-vowel coarticulation in the vowels which occur after the /r/ or /h/. The
influencing vowels may be stressed /i I E æ/ or unstressed /i I @/.
Figure 4.3 shows the average frequency of F2, F3 and F4 in V2 and V3 together in
the different vowel contexts averaged across direction of influence. As expected, significant
vowel-to-vowel coarticulation is evident for F2, F3 and F4 frequencies (F(6,12)=10.17, p <
0.0004, F(6,12)=13.44, p < 0.0001, F(6,12)=4.91, p < 0.01 respectively). The pattern of
formant frequency variation for F2 at least follows fairly closely the expected frequency for
this formant in the influencing vowels. For instance F2 frequency is highest in the context
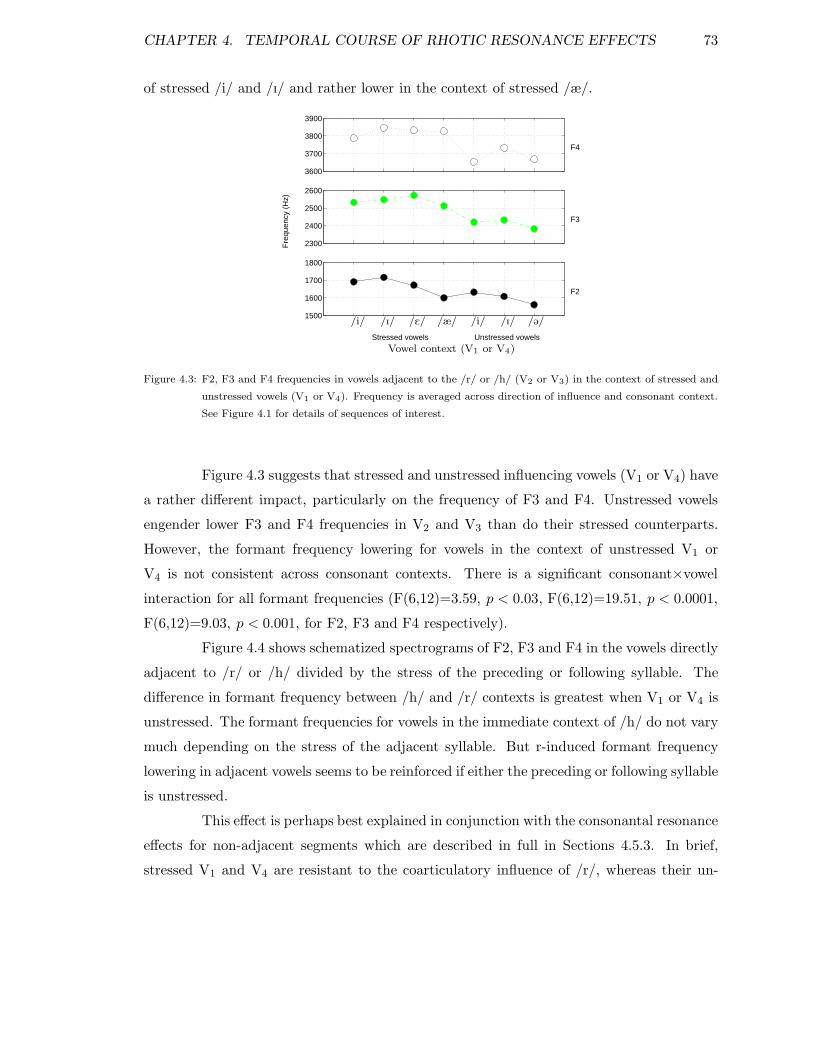
CHAPTER 4. TEMPORAL COURSE OF RHOTIC RESONANCE EFFECTS 73
of stressed /i/ and /I/ and rather lower in the context of stressed /æ/.
Stressed vowels Unstressed vowels
Fre
quen
cy (
Hz)
F2
F3
F4
1500
1600
1700
1800
2300
2400
2500
2600
3600
3700
3800
3900
/i//i/ /I//I/ /E/ /æ/ /@/
Vowel context (V1 or V4)
Figure 4.3: F2, F3 and F4 frequencies in vowels adjacent to the /r/ or /h/ (V2 or V3) in the context of stressed and
unstressed vowels (V1 or V4). Frequency is averaged across direction of influence and consonant context.
See Figure 4.1 for details of sequences of interest.
Figure 4.3 suggests that stressed and unstressed influencing vowels (V1 or V4) have
a rather different impact, particularly on the frequency of F3 and F4. Unstressed vowels
engender lower F3 and F4 frequencies in V2 and V3 than do their stressed counterparts.
However, the formant frequency lowering for vowels in the context of unstressed V1 or
V4 is not consistent across consonant contexts. There is a significant consonant×vowel
interaction for all formant frequencies (F(6,12)=3.59, p < 0.03, F(6,12)=19.51, p < 0.0001,
F(6,12)=9.03, p < 0.001, for F2, F3 and F4 respectively).
Figure 4.4 shows schematized spectrograms of F2, F3 and F4 in the vowels directly
adjacent to /r/ or /h/ divided by the stress of the preceding or following syllable. The
difference in formant frequency between /h/ and /r/ contexts is greatest when V1 or V4 is
unstressed. The formant frequencies for vowels in the immediate context of /h/ do not vary
much depending on the stress of the adjacent syllable. But r-induced formant frequency
lowering in adjacent vowels seems to be reinforced if either the preceding or following syllable
is unstressed.
This effect is perhaps best explained in conjunction with the consonantal resonance
effects for non-adjacent segments which are described in full in Sections 4.5.3. In brief,
stressed V1 and V4 are resistant to the coarticulatory influence of /r/, whereas their un-

CHAPTER 4. TEMPORAL COURSE OF RHOTIC RESONANCE EFFECTS 74
Fre
quen
cy in
Hz
Stressed contexts Unstressed contexts
1000
1500
2000
2500
3000
3500
4000
4500
F2
F3
F4
h−contextsr−contexts
Time −→
Figure 4.4: Schematized spectrograms of F2, F3 and F4 frequencies in vowels adjacent to /r/ or /h/ (V2 or V3) in
the context of stressed and unstressed preceding or following vowels (V1 or V4).
stressed counterparts undergo formant frequency lowering. This r-colouring of non-adjacent
unstressed vowels seems to reinforce r-induced formant frequency lowering in the vowels di-
rectly adjacent to the influencing consonant. This finding is discussed in more detail in
the conclusion to this chapter (Section 4.6), after the description of the results for the
non-adjacent vowels.
4.5.3 r-colouring in non-adjacent stressed vowels
Table 4.6 gives the frequencies of F2, F3 and F4 in stressed V1 and V4 in the non-
adjacent contexts of /r/ and /h/. There is virtually no difference in the frequency of F2
or F3 in these stressed vowels between the two consonant contexts (F(1,2)=2.98, p < 0.23
and F(1,2)=0.12, p < 0.76, for F2 and F3 respectively). The frequency of F4 is 71 Hz lower
in r-contexts than in the h-contexts, but this is not statistically significant (F(1,2)=0.7,
p < 0.5). There was large variation in the frequency of F4, probably due to difficulties in
accurately measuring this formant frequency.
The lack of any effects which even approach significance in the stressed non-
adjacent vowels suggests that such vowels are completely resistant to coarticulatory in-
fluence. Some evidence of r-colouring was found for the unstressed non-adjacent vowels,
and section 4.5.4 focuses exlusively on the results for these vowels, describing other factors
which condition the spread of r-colouring over this time domain.
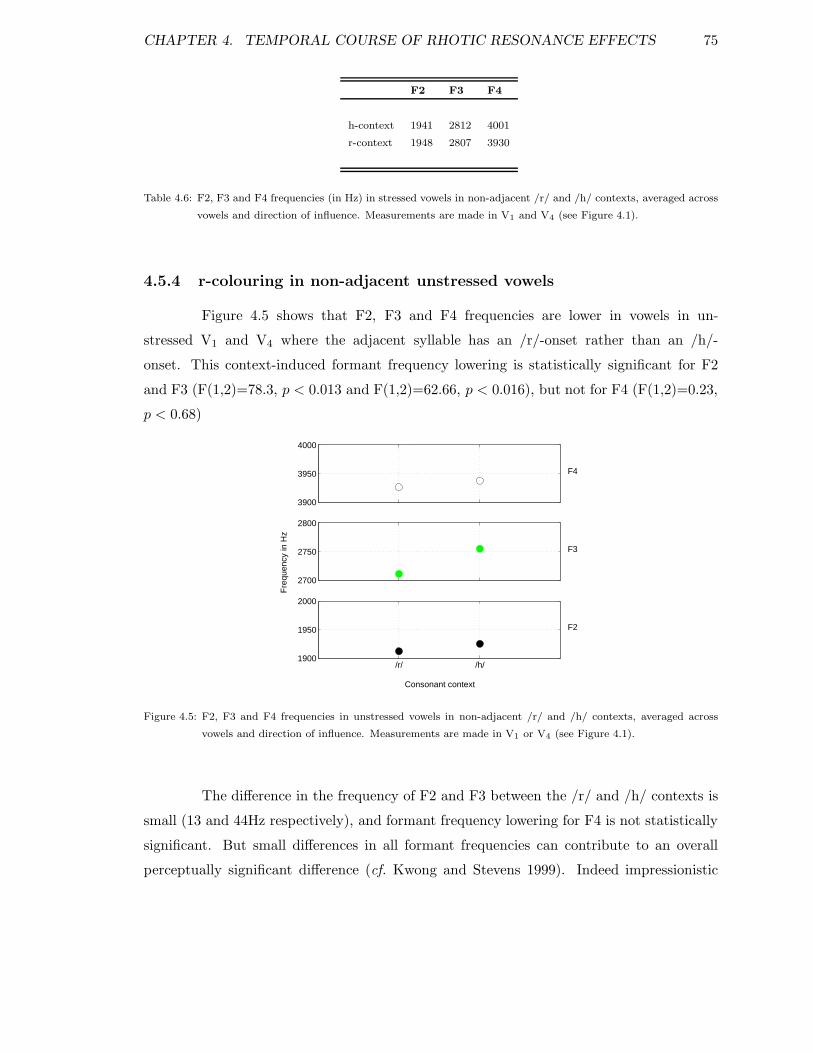
CHAPTER 4. TEMPORAL COURSE OF RHOTIC RESONANCE EFFECTS 75
F2 F3 F4
h-context 1941 2812 4001
r-context 1948 2807 3930
Table 4.6: F2, F3 and F4 frequencies (in Hz) in stressed vowels in non-adjacent /r/ and /h/ contexts, averaged across
vowels and direction of influence. Measurements are made in V1 and V4 (see Figure 4.1).
4.5.4 r-colouring in non-adjacent unstressed vowels
Figure 4.5 shows that F2, F3 and F4 frequencies are lower in vowels in un-
stressed V1 and V4 where the adjacent syllable has an /r/-onset rather than an /h/-
onset. This context-induced formant frequency lowering is statistically significant for F2
and F3 (F(1,2)=78.3, p < 0.013 and F(1,2)=62.66, p < 0.016), but not for F4 (F(1,2)=0.23,
p < 0.68)
Fre
quen
cy in
Hz
Consonant context
F2
F3
F4
/r/ /h/1900
1950
2000
2700
2750
2800
3900
3950
4000
Figure 4.5: F2, F3 and F4 frequencies in unstressed vowels in non-adjacent /r/ and /h/ contexts, averaged across
vowels and direction of influence. Measurements are made in V1 or V4 (see Figure 4.1).
The difference in the frequency of F2 and F3 between the /r/ and /h/ contexts is
small (13 and 44Hz respectively), and formant frequency lowering for F4 is not statistically
significant. But small differences in all formant frequencies can contribute to an overall
perceptually significant difference (cf. Kwong and Stevens 1999). Indeed impressionistic

CHAPTER 4. TEMPORAL COURSE OF RHOTIC RESONANCE EFFECTS 76
observations suggest that r-colouring is perceptible in at least some of the non-adjacent
vowels.
Stevens (1998) suggests that low F4 or F5 is due to tongue-tip retroflexion. So the
fact that the significant formant frequency lowering here is for F2 and F3 suggests that these
consonantal resonance effects may be tongue-body or lip-rounding effects. This conclusion is
supported by data from West (1999), who explores acoustic and articulatory coarticulation
over several segments before and after /r/ and /l/. She compares the sequences /@1 d @2 r/
and /@1 d @2 l/, and finds significantly lower F3 frequency in /@1/ before /r/ and also a
higher upper lip and mid tongue position as measured using electromagnetic articulography.
West does not include /h/ contexts, so her data are not directly comparable with the
data presented here. However, the main finding here is confirmed, namely that r-colouring
spreading over several segments primarily affects F3 frequency and involves some kind
of lip-rounding and tongue-body effects. Clearly there is scope for further simultaneous
articulatory-acoustic studies in this area.
Relative susceptibility of non-adjacent vowels to r-colouring
The experiment in Chapter 2 established a hierarchy of susceptibility to rhotic
resonance effects for vowels in /rV/ sequences, which has /I/ > /i/ ≈ /E/ > /æ/. A similar
comparison of relative susceptibility to coarticulatory influence is undertaken in the current
experiment, looking at vowels separated from the influencing consonant by two segments,
and adding three unstressed vowels to the analysis. As stated in section 4.5.3, none of the
stressed vowels showed any evidence of coarticulatory influence, regardless of their vowel
quality. So the susceptibility hierarchy for stressed vowels in /rV/ sequences is annulled in
non-adjacent contexts.
For the three unstressed vowels, it was expected that schwa would show greatest
effects, since it is known to be highly variable (c.f. Fowler 1981a, Alfonso and Baer 1982).
Unstressed /I/ would also be expected to be susceptible to coarticulatory influence, given
that it was so variable when stressed, and when unstressed it is known to function rather
like /@/ (cf. alternations of /I/ and /@/ in pronunciations of words like analysis: /@næl@sIs/
vs. /@nælIsIs/, Roach and Harman 1997). Compared to /@/ and /I/, unstressed /i/ is
expected to show rather smaller effects.
Figure 4.6 shows F2, F3 and F4 frequencies in unstressed /i I @/ in non-adjacent
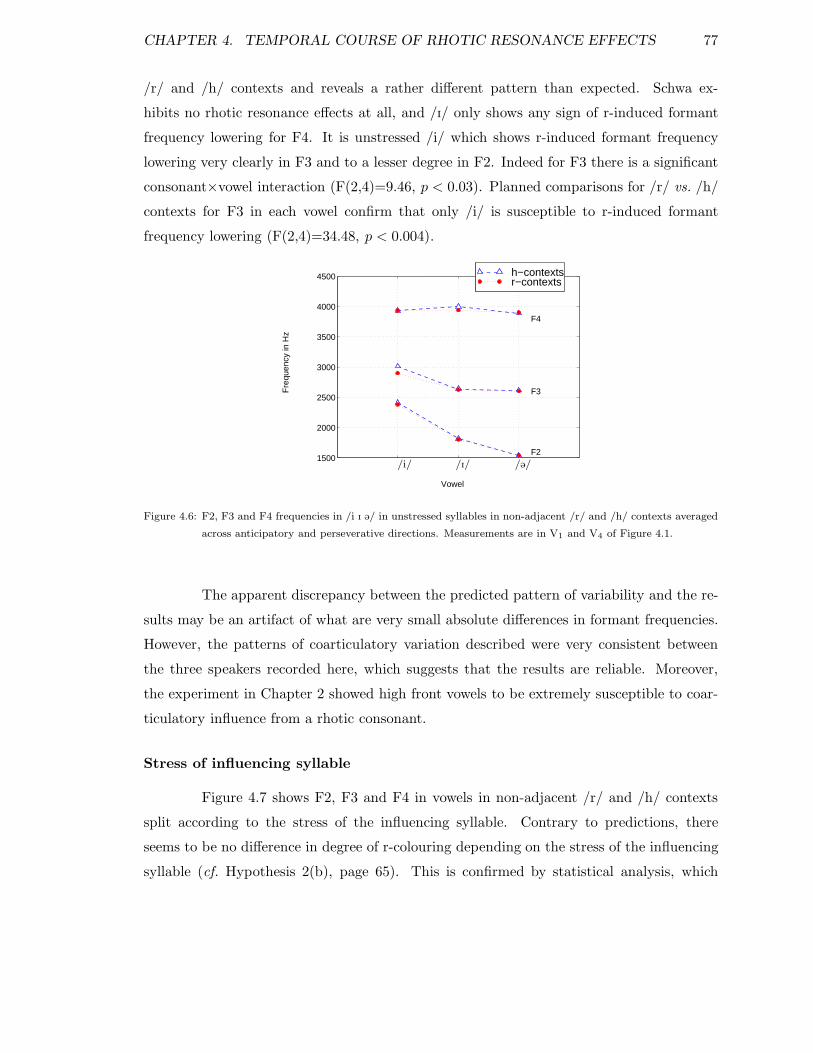
CHAPTER 4. TEMPORAL COURSE OF RHOTIC RESONANCE EFFECTS 77
/r/ and /h/ contexts and reveals a rather different pattern than expected. Schwa ex-
hibits no rhotic resonance effects at all, and /I/ only shows any sign of r-induced formant
frequency lowering for F4. It is unstressed /i/ which shows r-induced formant frequency
lowering very clearly in F3 and to a lesser degree in F2. Indeed for F3 there is a significant
consonant×vowel interaction (F(2,4)=9.46, p < 0.03). Planned comparisons for /r/ vs. /h/
contexts for F3 in each vowel confirm that only /i/ is susceptible to r-induced formant
frequency lowering (F(2,4)=34.48, p < 0.004).
Vowel
Fre
quen
cy in
Hz
1500
2000
2500
3000
3500
4000
4500
F2
F3
F4
h−contextsr−contexts
/i/ /I/ /@/
Figure 4.6: F2, F3 and F4 frequencies in /i I @/ in unstressed syllables in non-adjacent /r/ and /h/ contexts averaged
across anticipatory and perseverative directions. Measurements are in V1 and V4 of Figure 4.1.
The apparent discrepancy between the predicted pattern of variability and the re-
sults may be an artifact of what are very small absolute differences in formant frequencies.
However, the patterns of coarticulatory variation described were very consistent between
the three speakers recorded here, which suggests that the results are reliable. Moreover,
the experiment in Chapter 2 showed high front vowels to be extremely susceptible to coar-
ticulatory influence from a rhotic consonant.
Stress of influencing syllable
Figure 4.7 shows F2, F3 and F4 in vowels in non-adjacent /r/ and /h/ contexts
split according to the stress of the influencing syllable. Contrary to predictions, there
seems to be no difference in degree of r-colouring depending on the stress of the influencing
syllable (cf. Hypothesis 2(b), page 65). This is confirmed by statistical analysis, which
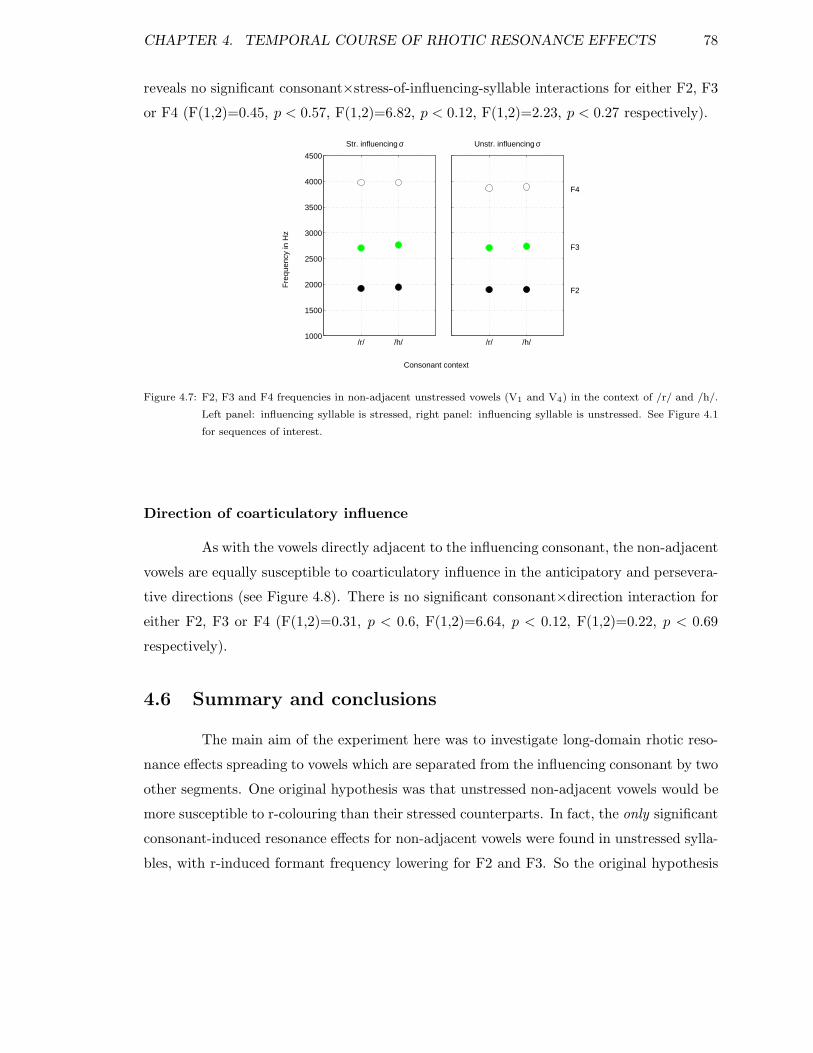
CHAPTER 4. TEMPORAL COURSE OF RHOTIC RESONANCE EFFECTS 78
reveals no significant consonant×stress-of-influencing-syllable interactions for either F2, F3
or F4 (F(1,2)=0.45, p < 0.57, F(1,2)=6.82, p < 0.12, F(1,2)=2.23, p < 0.27 respectively).
Consonant context
Fre
quen
cy in
Hz
Str. influencing σ Unstr. influencing σ
F2
F3
F4
/r/ /h/1000
1500
2000
2500
3000
3500
4000
4500
/r/ /h/
Figure 4.7: F2, F3 and F4 frequencies in non-adjacent unstressed vowels (V1 and V4) in the context of /r/ and /h/.
Left panel: influencing syllable is stressed, right panel: influencing syllable is unstressed. See Figure 4.1
for sequences of interest.
Direction of coarticulatory influence
As with the vowels directly adjacent to the influencing consonant, the non-adjacent
vowels are equally susceptible to coarticulatory influence in the anticipatory and persevera-
tive directions (see Figure 4.8). There is no significant consonant×direction interaction for
either F2, F3 or F4 (F(1,2)=0.31, p < 0.6, F(1,2)=6.64, p < 0.12, F(1,2)=0.22, p < 0.69
respectively).
4.6 Summary and conclusions
The main aim of the experiment here was to investigate long-domain rhotic reso-
nance effects spreading to vowels which are separated from the influencing consonant by two
other segments. One original hypothesis was that unstressed non-adjacent vowels would be
more susceptible to r-colouring than their stressed counterparts. In fact, the only significant
consonant-induced resonance effects for non-adjacent vowels were found in unstressed sylla-
bles, with r-induced formant frequency lowering for F2 and F3. So the original hypothesis
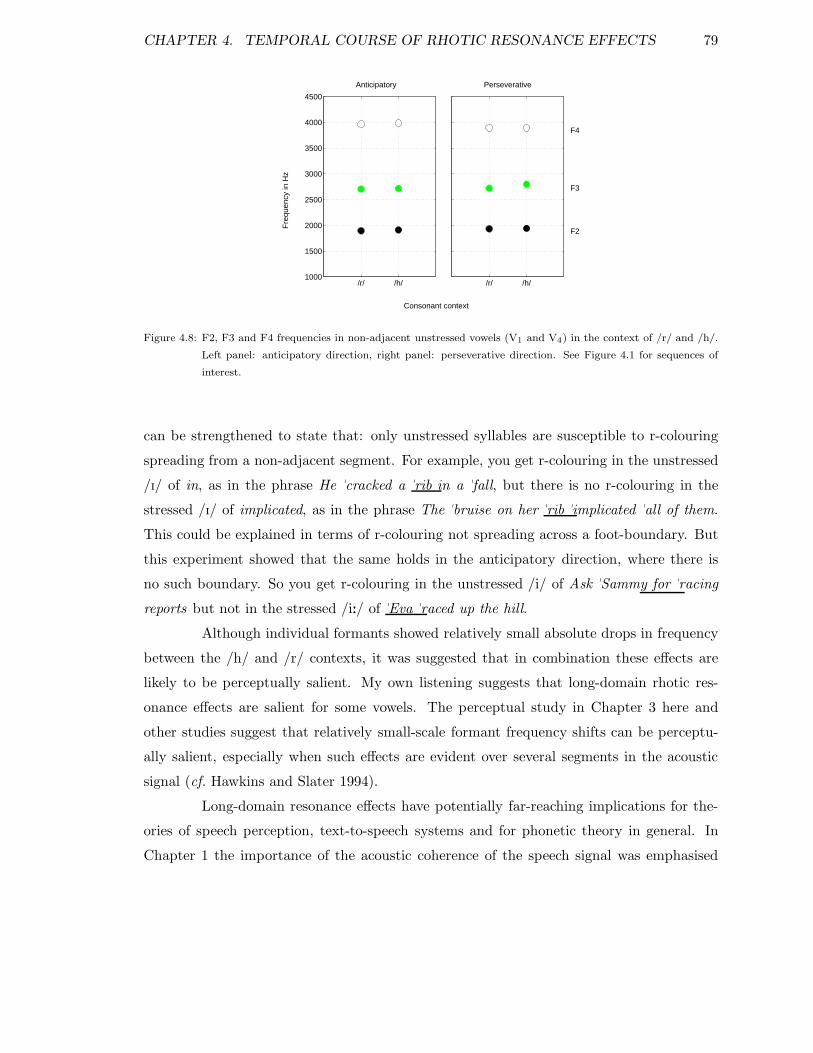
CHAPTER 4. TEMPORAL COURSE OF RHOTIC RESONANCE EFFECTS 79
Consonant context
Fre
quen
cy in
Hz
Anticipatory Perseverative
F2
F3
F4
/r/ /h/1000
1500
2000
2500
3000
3500
4000
4500
/r/ /h/
Figure 4.8: F2, F3 and F4 frequencies in non-adjacent unstressed vowels (V1 and V4) in the context of /r/ and /h/.
Left panel: anticipatory direction, right panel: perseverative direction. See Figure 4.1 for sequences of
interest.
can be strengthened to state that: only unstressed syllables are susceptible to r-colouring
spreading from a non-adjacent segment. For example, you get r-colouring in the unstressed
/I/ of in, as in the phrase He "cracked a "rib in a "fall, but there is no r-colouring in the
stressed /I/ of implicated, as in the phrase The "bruise on her "rib "implicated "all of them.
This could be explained in terms of r-colouring not spreading across a foot-boundary. But
this experiment showed that the same holds in the anticipatory direction, where there is
no such boundary. So you get r-colouring in the unstressed /i/ of Ask "Sammy for "racing
reports but not in the stressed /i:/ of "Eva "raced up the hill.
Although individual formants showed relatively small absolute drops in frequency
between the /h/ and /r/ contexts, it was suggested that in combination these effects are
likely to be perceptually salient. My own listening suggests that long-domain rhotic res-
onance effects are salient for some vowels. The perceptual study in Chapter 3 here and
other studies suggest that relatively small-scale formant frequency shifts can be perceptu-
ally salient, especially when such effects are evident over several segments in the acoustic
signal (cf. Hawkins and Slater 1994).
Long-domain resonance effects have potentially far-reaching implications for the-
ories of speech perception, text-to-speech systems and for phonetic theory in general. In
Chapter 1 the importance of the acoustic coherence of the speech signal was emphasised
CHAPTER 4. TEMPORAL COURSE OF RHOTIC RESONANCE EFFECTS 80
and experiments were described which demonstrate the importance of surrounding context
to the perception of individual phonetic segments. Whilst V1 and V4 are only subtly differ-
ent between /h/ and /r/ contexts, when perceived in conjunction with the more dramatic
contextual differences in vowels directly adjacent to the influencing consonant, such small
acoustic differences may well contribute to the perceptual coherence of the signal. This kind
of acoustic detail is likely to contribute to the naturalness and intelligibility of synthetic
speech, since these effects seem to arise as a result of vocal tract dynamics, or at least occur
systematically in this particular accent of English.
This experiment looked at both anticipatory and perseverative spread of coartic-
ulatory effects, but few differences were found in the propensity of r-colouring to spread in
either direction. For the vowels directly adjacent to the influencing consonant there was
a suggestion that r-induced formant frequency lowering for F2 was more marked in the
anticipatory than the perseverative direction (∆250Hz vs. ∆200Hz), but perceptual tests
would be required to establish whether this difference is salient. Sharf and Ode (1981)
survey experimental work on the directionality of coarticulatory effects and find a diverse
array of results. For every study that shows greater perseverative spread of coarticulatory
influence, it seems there is another study showing greater influence in the anticipatory di-
rection. Sharf and Ode conclude that the propensity to spread in one direction or the other
is specific to particular coarticulatory effects. Although the experiment here did not reveal
greater r-induced formant frequency lowering in either the anticipatory or perseverative di-
rections, it is possible that it also did not reveal the full temporal extent of rhotic influence.
Further experiments on longer strings of unstressed segments may find differences between
the anticipatory and perseverative directions in the temporal extent of r-colouring in vowels.
This experiment highlighted some differences in the relative susceptibility of vowels
to rhotic resonance effects spreading over intervening segments. A direct comparison with
the susceptibility hierarchy of Chapter 2 is not possible, as stressed vowels were found to
be totally resistant to coarticulatory influence over the longer time domain. Amongst the
unstressed vowels r-colouring was evident to some degree in /i/ and /I/, but not in schwa.
This finding was in accordance with repeated findings from Tunley (1995) and for the CV
sequences in Chapter 2, which show that high front vowels are particularly susceptible to
the influence of rhotic consonants in SSBE.
The focus here has been almost exclusively on light syllables and in effect a binary
stress distinction was adopted, comparing stressed accented with unstressed unaccented syl-
CHAPTER 4. TEMPORAL COURSE OF RHOTIC RESONANCE EFFECTS 81
lables, ignoring stressed unaccented syllables. Having established some basic principles for
the spread of coarticulatory effects in stressed accented and unstressed unaccented syllables,
future work can explore the influence of prosodic structure on coarticulatory behaviour in
more detail. One important issue is to disentangle the influence of metrical and phonological
weight (stress vs. light/heavy) on the spread of resonance effects.
Results for the vowels directly adjacent to the influencing consonant confirmed the
extensive formant frequency lowering for F2 and F3 in vowels in CV sequences described
in Chapter 2. Significant formant frequency lowering was also found in F4 and it would
be interesting to see if the inclusion of coarticulatory variation in this formant in synthetic
speech might improve on the perceptual findings of Chapter 3. If acoustic coherence is
indeed a crucial contributor to the naturalness and intelligibility of synthetic speech, then
modelling context-induced variations in all formant frequencies should be important. In the
hand-edited stimuli used in the perception experiment, the lack of modifications to F4 may
have resulted in an inappropriate overall effect given the changes made to the frequencies
of F2 and F3. This may partially explain why creating natural-sounding stimuli was so
difficult, even when closely following patterns of formant frequency variation found for F2
and F3 in real speech. The fact that F4 was not modified may also explain why far smaller
changes to the frequencies of F2 and F3 were tolerated in the synthetic speech than were
found in natural speech (see Chapter 3, page 59). In the Infovox system F4 cannot be
individually modified, but is controlled by altering a parameter which affects F4 and higher
formants. It would be interesting to establish whether variation in F4 frequency is indeed
perceptually salient, as this would suggest a need for F4 to be controlled separately from
the higher formant frequencies.
Perhaps the most interesting finding in this experiment was that r-induced formant
frequency lowering in adjacent vowels was greater when either the preceding or following
syllable was unstressed. Since unstressed vowels are susceptible to coarticulatory influence
even when not directly adjacent to the influencing /r/, it was suggested that unstressed V1
or V4 may enhance r-induced formant frequency lowering in V2 and V3 (see Figure 4.4).
These results support a more holistic approach to the speech signal than the tradi-
tional linear segmental analysis. Not only can coarticulatory effects spread to non-adjacent
syllables, but when these effects do spread, they reinforce the coarticulatory influence on
segments closer to the source of the effect. Vowels next to /r/ undergo formant-frequency
lowering, and this r-induced formant frequency lowering is greatest when either the preced-
CHAPTER 4. TEMPORAL COURSE OF RHOTIC RESONANCE EFFECTS 82
ing or following syllable is unstressed and thus is itself susceptible to coarticulatory influence.
Modelling such effects in the rules for speech synthesis is not simple, as resonance effects
cannot simply be incorporated in individual vowels by taking into account the adjacent or
even the non-adjacent consonantal context. Instead the properties of other surrounding
syllables must also be taken into account in determining the degree of consonantal influence
on a particular vowel. Certainly such effects are not readily captured by concatenative
techniques such as diphone synthesis. Indeed the fact that it is so hard to define a temporal
domain for this kind of phonetic detail means that there are problems for concatenative
synthesis, which might be more easily overcome with a traditional formant-based approach
(cf. Local 1997, endnote (ii)). Concatenative techniques are inherently limited by their
choice of units (hence the importance of appropriate unit selection, cf. Edgington 1998),
whereas formant-synthesis can theoretically accommodate coarticulation effects over any
domain, provided the rules are sufficiently detailed.
In conclusion, it seems that there are complex interactions between vocalic and
consonantal resonance effects over fairly long stretches of the speech signal, and these are
at least partly shaped by the stress of the syllables concerned. The foot does not appear to
be optimal as a domain of coarticulatory influence, since foot-initial /r/ influences sounds
in the previous foot as much as it influences following sounds within its own foot. Nor does
the stress of the /r/ in any way affect the degree to which it influences surrounding vowels.
What does seem to be a crucial factor in determining the spread of consonantal resonance
effects is the stress of the influenced syllables. This experiment shows that consonantal
resonance effects may spread to non-adjacent vowels, provided these occur in unstressed
syllables. Future experiments should string together longer series of unstressed syllables to
see just how far such effects may extend.
Finally, although the context-induced effects found in non-adjacent segments here
were relatively small, the speech-style elicited was clear and careful. This was deemed to
be the most suitable model for maximally intelligible synthetic speech. However, it is fair
to assume that both short and long-domain coarticulatory effects would be greater in more
casual or rapid speech and these effects may be crucial to the successful modelling of different
speech styles by text-to-speech systems. A common demand from visually impaired users of
reading systems is that they should read faster, enabling the user to ‘scan’ text in a similar
way to sighted people. Speeding up synthetic speech is possible in most commercial systems,
but the techniques for doing this are crude (cf. Imaizumi and Kiritani 1992), often with no
CHAPTER 4. TEMPORAL COURSE OF RHOTIC RESONANCE EFFECTS 83
alteration of target values for segments to reflect the articulatory undershoot that occurs
in rapid natural speech. The resulting speech is disproportionately hard to understand
compared with fast natural speech (c.f. Ralston et al. 1991). Accurate modelling of fast-
and casual-speech effects such as undershoot may greatly improve both the naturalness and
intelligibility of text-to-speech systems which produce a variety of speaking styles. And, as
Granstrom (1992) points out, the next generation of text-to-speech systems will be required
to do precisely that.

84
Chapter 5
Realization of vowels after /r/ and
/l/ in consonant clusters
5.1 Introduction
Chapters 2 and 4 examined the spread of lingual resonance effects to adjacent
and non-adjacent vowels, controlling stress and vowel quality to determine which factors
favour the spread of coarticulatory influence. The segmental sequences examined were
relatively simple, consisting generally of a series of CVC sequences. These simple segmental
structures are typical of the majority of work done on coarticulation. Given that about
40% of monosyllabic words in English begin with a cluster and about 60% end with a
cluster (Spiegel, Altom, and Macchi 1990), neglecting consonant clusters in coarticulatory
studies restricts the applications of such work in areas such as speech synthesis and speech
recognition.
This chapter explores the acoustic characteristics of vowels after syllable onset
clusters which inlude /r/ and /l/. Since Chapter 2 documents coarticulatory behaviour in
tautosyllabic CV sequences, it made sense to begin the exploration of more complex cluster
effects within equivalent single syllables where the basic rules of coarticulatory behaviour
are already understood. The focus here, therefore, is limited to syllable onset clusters and
tautosyllabic nuclei.
CHAPTER 5. COARTICULATION AFTER CONSONANT CLUSTERS 85
5.2 Research Questions
Empirical work on consonant clusters has tended to focus on durational changes
to segments in the cluster itself (cf. Klatt 1979, Haggard 1973) or on assimilation of voicing
characteristics (van den Berg and Slis 1987). Other studies explore the temporal overlap of
gestures, for instance during stop-stop sequences (Hardcastle and Roach 1979, Hardcastle
1985), but none of these studies mention the consequent effects on following vowels. Given
the relative lack of empirical work into the coarticulatory effects of clusters on vowels, this
experiment is very much an exploratory study. The main aim is to provide acoustic data
for vowels after a variety of clusters.
The clusters investigated are those containing consonants which it was thought
may alter the articulatory realization of liquids and thus may affect the acoustic charac-
teristics of the following vowels. Labials are not included, as they do not involve tongue
gestures, and so were thought less likely to have an impact on the realization of lingual
consonants such as /r/ and /l/. So the consonants chosen are alveolars and velars, which
impose their own requirements on tongue configuration and thus may influence the con-
figuration for /r/ and /l/. The liquids, alveolars and velars are incorporated in as wide a
variety of clusters as is possible given the phonotactics of English. Full details of the clusters
examined and the sentences in which they were incorporated are given in Section 5.3.
This experiment also documents vowel durations after the various syllable onset
clusters, and again the literature provided few suggestions as to what might be found.
Fowler (1981b) suggests that vowels may be shorter after consonant clusters than after
singleton consonants, but also says that this shortening may be weaker in the perseverative
direction, than it is for vowels occuring before clusters. Van Santen (1992a) says that he
found no published work on the effect of preceding consonant clusters on subsequent vowel
durations, which highlights the need for the kind of study described here. He presents a
limited amount of vowel duration data, the main finding being that vowels are shorter after
stop+liquid sequences than after the stop or liquid alone and he emphasises that his work
needs replication.

CHAPTER 5. COARTICULATION AFTER CONSONANT CLUSTERS 86
5.3 Materials
Table 5.1 lists the sentences for this experiment. In all cases the syllable of interest
is stressed and occurs near the start of the sentence, with nuclear stress being on a word
later in the sentence. This is primarily for ease of sentence design and to enable direct
comparison with the results from Chapter 2 where the CV sequences were also early in the
sentence and carried non-nuclear stress.
Voicing of the consonant directly preceding the /r/ or /l/ is not well controlled,
since place of articulation of the consonant is of greater interest here, as it is more likely to
affect the tongue configuration for the following liquid. It was felt that differences between
the supralaryngeal articulation of the voiced and voiceless consonants would be negligible
compared with the kinds of differences which are of interest here, so voicing is varied when
it allowed more natural-sounding sentences.
5.4 Recording
Sentences for this experiment were recorded along with those for the experiments
in Chapters 4 and 6. Full details of the recording, subjects and references to the other
sentences are given in Chapter 4, Section 4.3.
5.5 Measurements and statistical analysis
F2, F3 and F4 frequencies were measured at the midpoint of each vowel of interest.
Midpoints were determined by hand as described in Chapter 2, Section 2.5.
Vowel durations were also measured, with vowel onset defined as described in
Chapter 2, Section 2.5. In most cases the vowel of interest is followed by the nasal /m/ and
here vowel offset was defined as coinciding with the sharp spectral discontinuity associated
with the lower amplitude during the oral closure for the nasal. In the remainder of cases
the vowel was followed by a /p/ and here vowel offset was defined as coinciding with the
silence for the stop closure.
A repeated measures ANOVA was performed for each formant frequency in the
vowels and on the durational data. In each case a 7 × 4 design was used, with factors:
Onset: /r kr skr tr str l kl/ and Vowel: /i I E æ/.
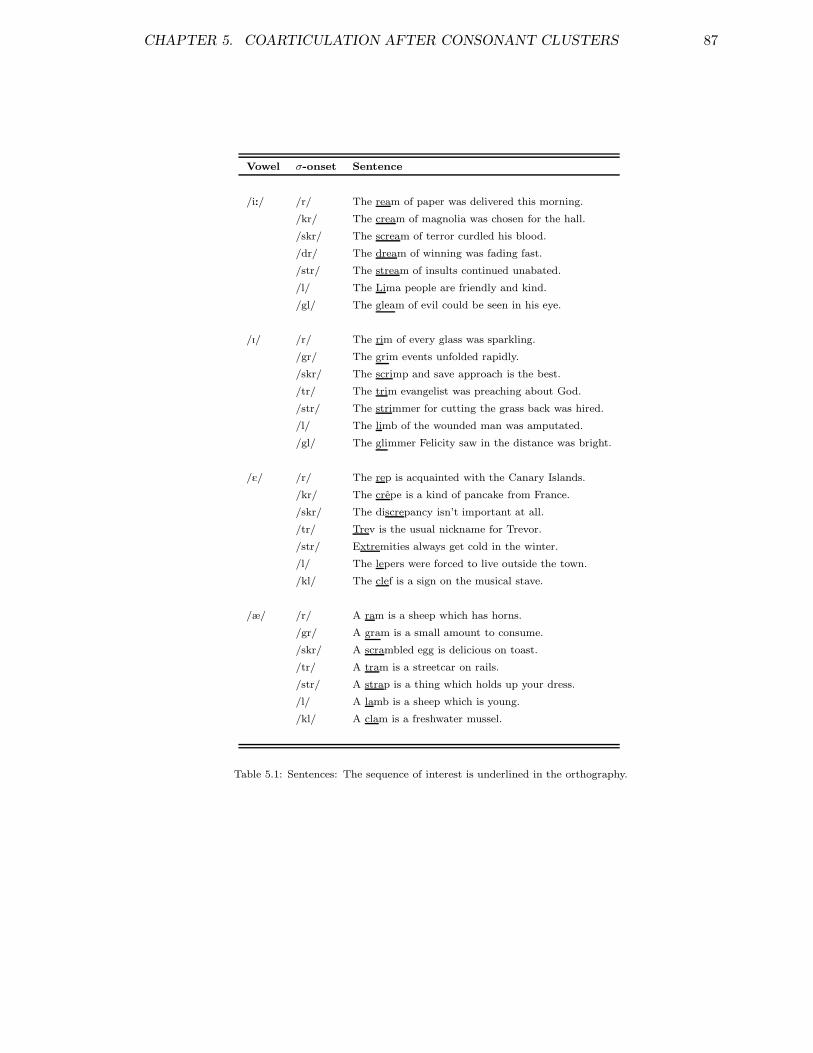
CHAPTER 5. COARTICULATION AFTER CONSONANT CLUSTERS 87
Vowel σ-onset Sentence
/i:/ /r/ The ream of paper was delivered this morning.
/kr/ The cream of magnolia was chosen for the hall.
/skr/ The scream of terror curdled his blood.
/dr/ The dream of winning was fading fast.
/str/ The stream of insults continued unabated.
/l/ The Lima people are friendly and kind.
/gl/ The gleam of evil could be seen in his eye.
/I/ /r/ The rim of every glass was sparkling.
/gr/ The grim events unfolded rapidly.
/skr/ The scrimp and save approach is the best.
/tr/ The trim evangelist was preaching about God.
/str/ The strimmer for cutting the grass back was hired.
/l/ The limb of the wounded man was amputated.
/gl/ The glimmer Felicity saw in the distance was bright.
/E/ /r/ The rep is acquainted with the Canary Islands.
/kr/ The crepe is a kind of pancake from France.
/skr/ The discrepancy isn’t important at all.
/tr/ Trev is the usual nickname for Trevor.
/str/ Extremities always get cold in the winter.
/l/ The lepers were forced to live outside the town.
/kl/ The clef is a sign on the musical stave.
/æ/ /r/ A ram is a sheep which has horns.
/gr/ A gram is a small amount to consume.
/skr/ A scrambled egg is delicious on toast.
/tr/ A tram is a streetcar on rails.
/str/ A strap is a thing which holds up your dress.
/l/ A lamb is a sheep which is young.
/kl/ A clam is a freshwater mussel.
Table 5.1: Sentences: The sequence of interest is underlined in the orthography.
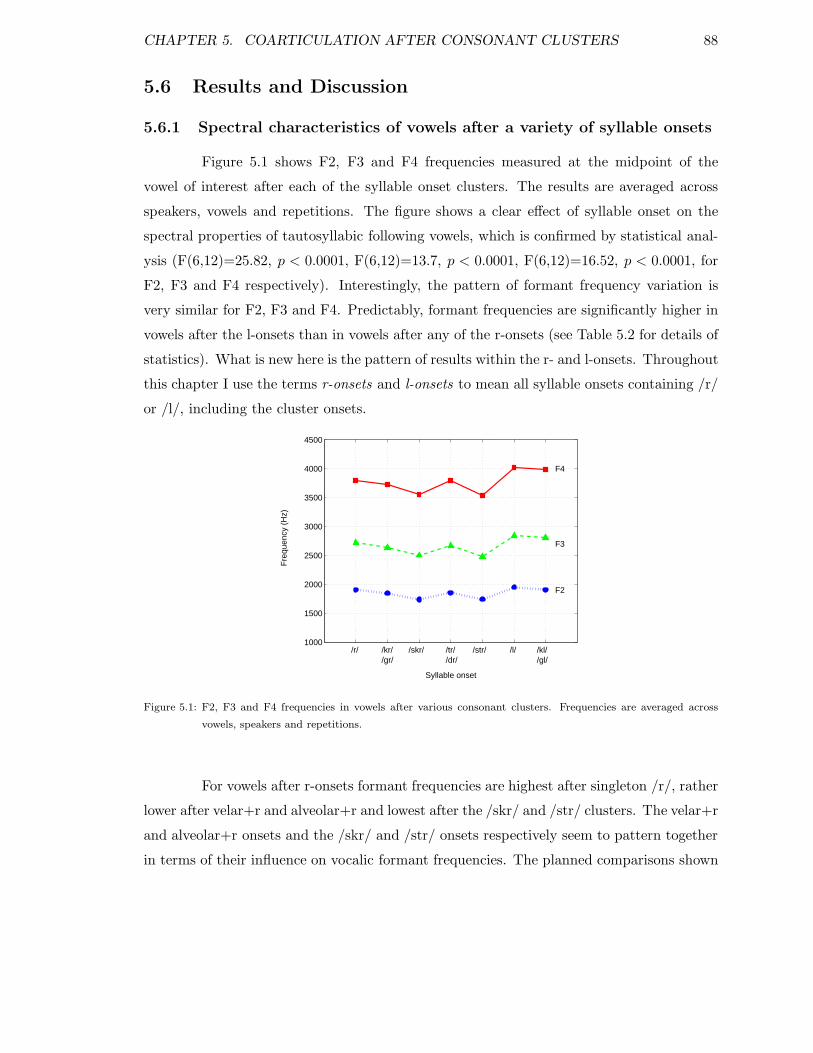
CHAPTER 5. COARTICULATION AFTER CONSONANT CLUSTERS 88
5.6 Results and Discussion
5.6.1 Spectral characteristics of vowels after a variety of syllable onsets
Figure 5.1 shows F2, F3 and F4 frequencies measured at the midpoint of the
vowel of interest after each of the syllable onset clusters. The results are averaged across
speakers, vowels and repetitions. The figure shows a clear effect of syllable onset on the
spectral properties of tautosyllabic following vowels, which is confirmed by statistical anal-
ysis (F(6,12)=25.82, p < 0.0001, F(6,12)=13.7, p < 0.0001, F(6,12)=16.52, p < 0.0001, for
F2, F3 and F4 respectively). Interestingly, the pattern of formant frequency variation is
very similar for F2, F3 and F4. Predictably, formant frequencies are significantly higher in
vowels after the l-onsets than in vowels after any of the r-onsets (see Table 5.2 for details of
statistics). What is new here is the pattern of results within the r- and l-onsets. Throughout
this chapter I use the terms r-onsets and l-onsets to mean all syllable onsets containing /r/
or /l/, including the cluster onsets.
Syllable onset
Fre
quen
cy (
Hz)
/r/ /kr//gr/
/skr/ /tr//dr/
/str/ /l/ /kl//gl/
1000
1500
2000
2500
3000
3500
4000
4500
F4
F3
F2
Figure 5.1: F2, F3 and F4 frequencies in vowels after various consonant clusters. Frequencies are averaged across
vowels, speakers and repetitions.
For vowels after r-onsets formant frequencies are highest after singleton /r/, rather
lower after velar+r and alveolar+r and lowest after the /skr/ and /str/ clusters. The velar+r
and alveolar+r onsets and the /skr/ and /str/ onsets respectively seem to pattern together
in terms of their influence on vocalic formant frequencies. The planned comparisons shown
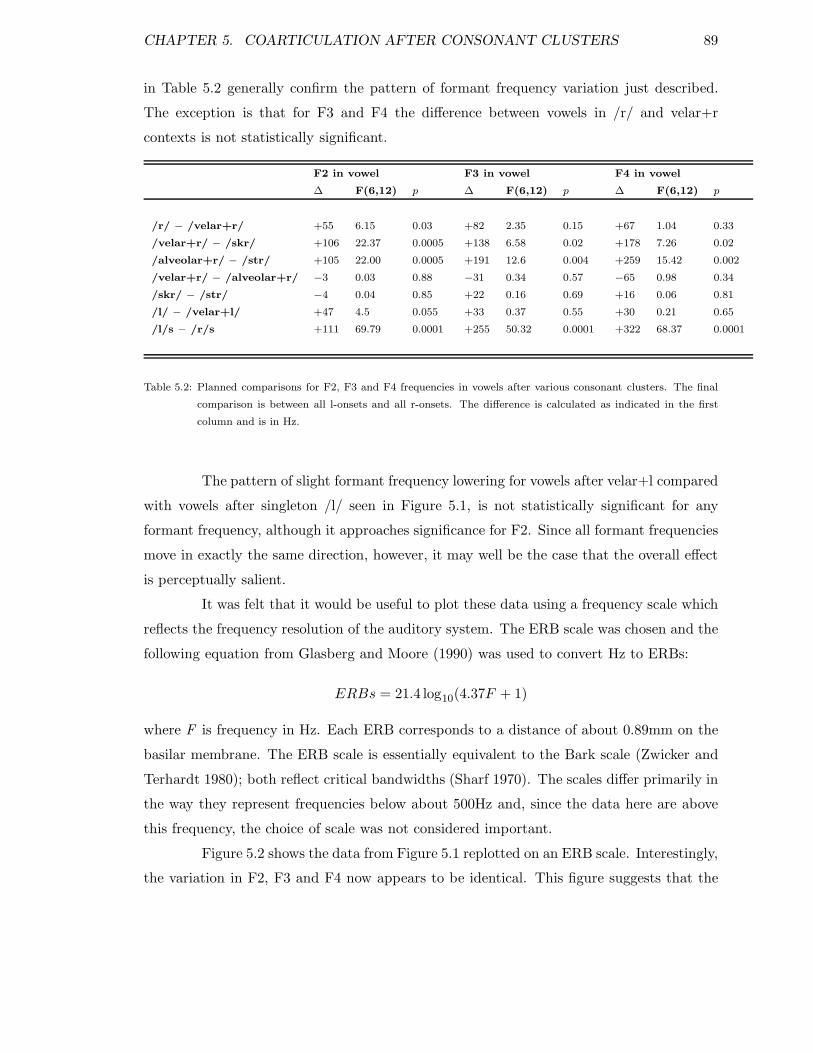
CHAPTER 5. COARTICULATION AFTER CONSONANT CLUSTERS 89
in Table 5.2 generally confirm the pattern of formant frequency variation just described.
The exception is that for F3 and F4 the difference between vowels in /r/ and velar+r
contexts is not statistically significant.
F2 in vowel F3 in vowel F4 in vowel
∆ F(6,12) p ∆ F(6,12) p ∆ F(6,12) p
/r/ − /velar+r/ +55 6.15 0.03 +82 2.35 0.15 +67 1.04 0.33
/velar+r/ − /skr/ +106 22.37 0.0005 +138 6.58 0.02 +178 7.26 0.02
/alveolar+r/ − /str/ +105 22.00 0.0005 +191 12.6 0.004 +259 15.42 0.002
/velar+r/ − /alveolar+r/ −3 0.03 0.88 −31 0.34 0.57 −65 0.98 0.34
/skr/ − /str/ −4 0.04 0.85 +22 0.16 0.69 +16 0.06 0.81
/l/ − /velar+l/ +47 4.5 0.055 +33 0.37 0.55 +30 0.21 0.65
/l/s − /r/s +111 69.79 0.0001 +255 50.32 0.0001 +322 68.37 0.0001
Table 5.2: Planned comparisons for F2, F3 and F4 frequencies in vowels after various consonant clusters. The final
comparison is between all l-onsets and all r-onsets. The difference is calculated as indicated in the first
column and is in Hz.
The pattern of slight formant frequency lowering for vowels after velar+l compared
with vowels after singleton /l/ seen in Figure 5.1, is not statistically significant for any
formant frequency, although it approaches significance for F2. Since all formant frequencies
move in exactly the same direction, however, it may well be the case that the overall effect
is perceptually salient.
It was felt that it would be useful to plot these data using a frequency scale which
reflects the frequency resolution of the auditory system. The ERB scale was chosen and the
following equation from Glasberg and Moore (1990) was used to convert Hz to ERBs:
ERBs = 21.4 log10(4.37F + 1)
where F is frequency in Hz. Each ERB corresponds to a distance of about 0.89mm on the
basilar membrane. The ERB scale is essentially equivalent to the Bark scale (Zwicker and
Terhardt 1980); both reflect critical bandwidths (Sharf 1970). The scales differ primarily in
the way they represent frequencies below about 500Hz and, since the data here are above
this frequency, the choice of scale was not considered important.
Figure 5.2 shows the data from Figure 5.1 replotted on an ERB scale. Interestingly,
the variation in F2, F3 and F4 now appears to be identical. This figure suggests that the
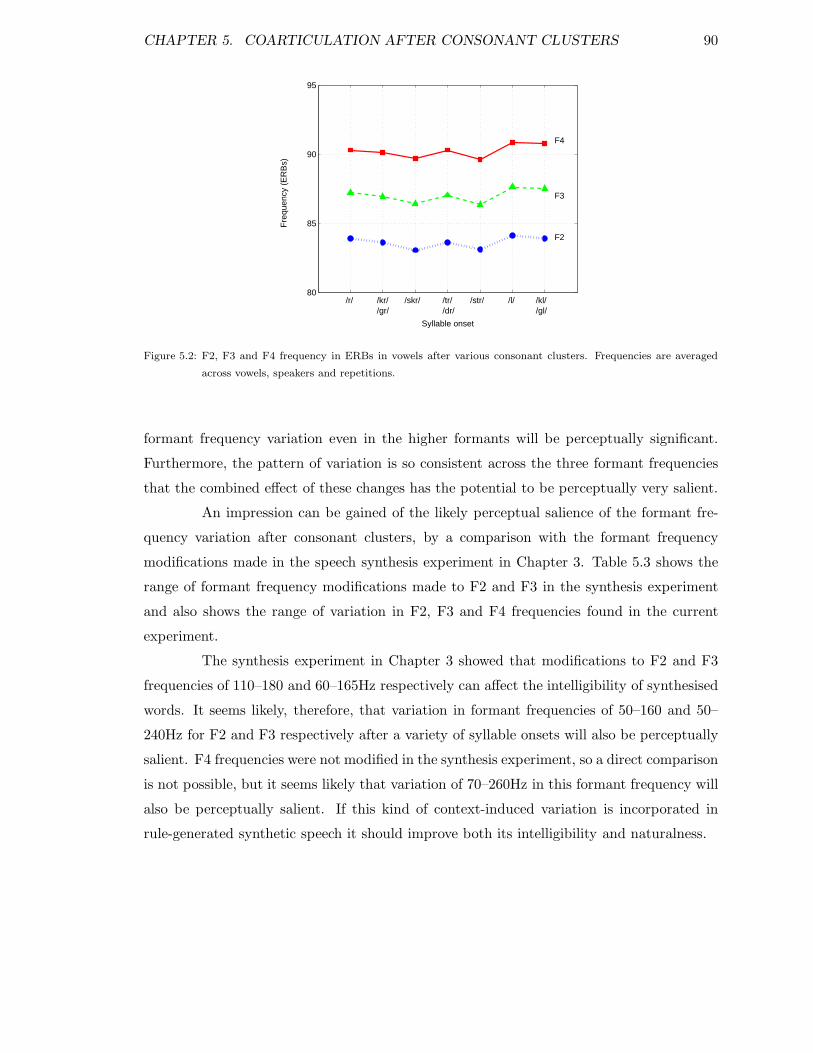
CHAPTER 5. COARTICULATION AFTER CONSONANT CLUSTERS 90
Syllable onset
Fre
quen
cy (
ER
Bs)
/r/ /kr//gr/
/skr/ /tr//dr/
/str/ /l/ /kl//gl/
80
85
90
95
F2
F3
F4
Figure 5.2: F2, F3 and F4 frequency in ERBs in vowels after various consonant clusters. Frequencies are averaged
across vowels, speakers and repetitions.
formant frequency variation even in the higher formants will be perceptually significant.
Furthermore, the pattern of variation is so consistent across the three formant frequencies
that the combined effect of these changes has the potential to be perceptually very salient.
An impression can be gained of the likely perceptual salience of the formant fre-
quency variation after consonant clusters, by a comparison with the formant frequency
modifications made in the speech synthesis experiment in Chapter 3. Table 5.3 shows the
range of formant frequency modifications made to F2 and F3 in the synthesis experiment
and also shows the range of variation in F2, F3 and F4 frequencies found in the current
experiment.
The synthesis experiment in Chapter 3 showed that modifications to F2 and F3
frequencies of 110–180 and 60–165Hz respectively can affect the intelligibility of synthesised
words. It seems likely, therefore, that variation in formant frequencies of 50–160 and 50–
240Hz for F2 and F3 respectively after a variety of syllable onsets will also be perceptually
salient. F4 frequencies were not modified in the synthesis experiment, so a direct comparison
is not possible, but it seems likely that variation of 70–260Hz in this formant frequency will
also be perceptually salient. If this kind of context-induced variation is incorporated in
rule-generated synthetic speech it should improve both its intelligibility and naturalness.
CHAPTER 5. COARTICULATION AFTER CONSONANT CLUSTERS 91
∆Hz ∆ERBs
Synth. Nat. Synth. Nat.
F2 110–180 50–160 57.4–62.0 50.1–60.9
F3 60–165 50–240 51.8–61.2 50.1–64.7
F4 – 70–260 – 53.2–65.4
Table 5.3: Change in formant frequencies in synthesis experiment (Chapter 3) and in natural speech (cluster exper-
iment). For the synthesis experiment the figures represent the range of modifications made to F2 and F3
frequencies in the edited forms of the speech stimuli. No modifications were made to F4 frequency in that
experiment. For the natural speech the figures represent the range of formant frequency variation found
for F2, F3 and F4 after various consonant clusters.
5.6.2 Durational properties of vowels after a variety of syllable onsets
Perhaps the most notable feature of the pattern of formant frequency variation
in Figures 5.1 and 5.2 is that the more segments there are in the syllable onset, the lower
the formant frequencies at the midpoint of the following vowel. Within the r-onsets we
find approximately the pattern /r/ > /Cr/ > /CCr/. Similarly, vowels after singleton /l/
have higher formant frequencies than after /kl/ or /gl/. It was thought that perhaps, as
more elements were added to the syllable onset, the vowel might become shorter, in order
to maintain an approximately equal overall syllable duration (cf. Klatt 1973, van Santen
1992a).
Figure 5.3 shows average vowel duration after each of the syllable onsets. The
pattern of variation in vowel durations is remarkably similar to that found for the formant
frequency data in Figures 5.1 and 5.2. Vowels are longest after singleton /r/ or /l/ and
are progressively shorter, the more consonants that are included in the syllable onset. A
statistical analysis was done using an identical repeated measures ANOVA design to that
used for the formant frequency data. This showed a significant effect of syllable onset on the
duration of the following vowel (F(6,12)=75.58, p < 0.0001). Planned comparisons between
different syllable onsets’ influence on vowel durations are given in Table 5.4. In contrast
to the formant frequency data, velar+r and alveolar+r onsets do not pattern together in
terms of their impact on vowel duration; vowels are shorter after /tr/ and /dr/ than after
/kr/ or /gr/.
Of course factors other than number of constituents in the syllable onset may also
CHAPTER 5. COARTICULATION AFTER CONSONANT CLUSTERS 92
Syllable onset
Vow
el d
urat
ion
(ms)
/r/ /kr//gr/
/skr/ /tr//dr/
/str/ /l/ /kl//gl/
0
20
40
60
80
100
120
Figure 5.3: Vowel duration after various syllable onsets, are averaged across vowels, speakers and repetitions.
vowel durations
∆ms. F(6,12) p
/r/ − /velar+r/ +12 5.69 0.002
/velar+r/ − /skr/ +28 84.75 0.0001
/alveolar+r/ − /str/ +17 29.58 0.0002
/velar+r/ − /alveolar+r/ +10 10.89 0.006
/skr/ − /str/ −1 0.22 0.65
/l/ − /kl/ +9 9.71 0.009
Table 5.4: Planned comparisons for durations of vowels after various consonant clusters. The difference (in ms.) is
calculated as indicated in the first column.
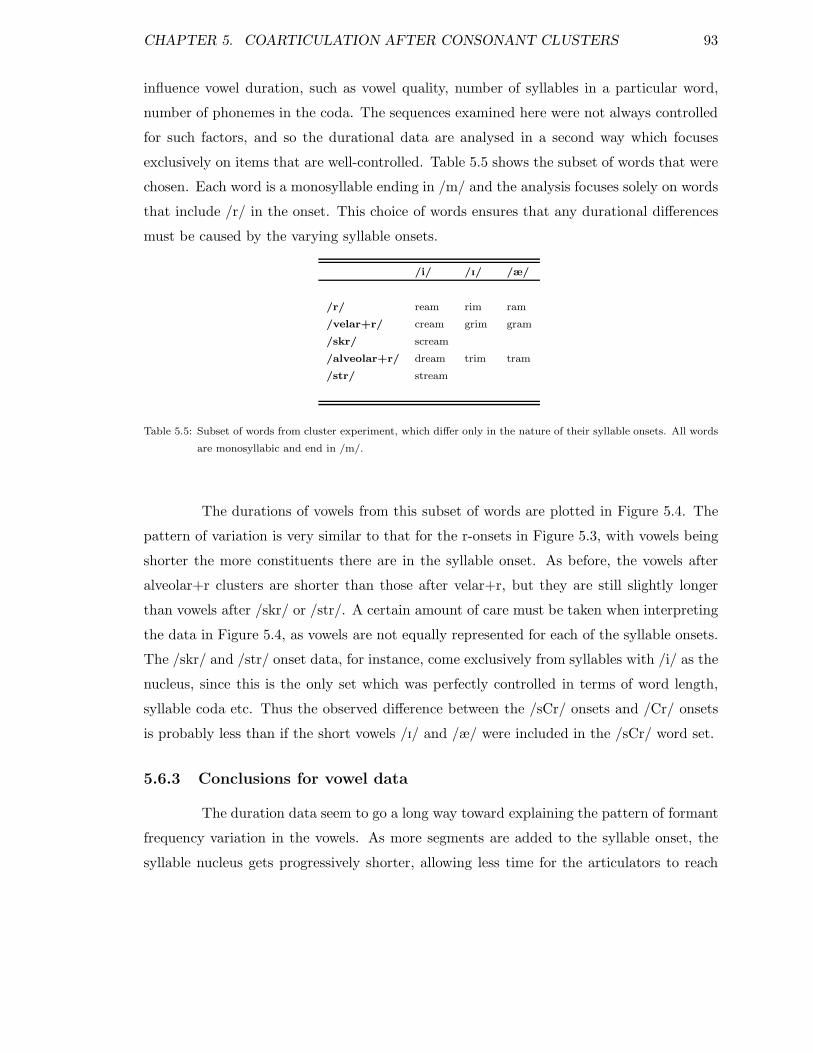
CHAPTER 5. COARTICULATION AFTER CONSONANT CLUSTERS 93
influence vowel duration, such as vowel quality, number of syllables in a particular word,
number of phonemes in the coda. The sequences examined here were not always controlled
for such factors, and so the durational data are analysed in a second way which focuses
exclusively on items that are well-controlled. Table 5.5 shows the subset of words that were
chosen. Each word is a monosyllable ending in /m/ and the analysis focuses solely on words
that include /r/ in the onset. This choice of words ensures that any durational differences
must be caused by the varying syllable onsets.
/i/ /I/ /æ/
/r/ ream rim ram
/velar+r/ cream grim gram
/skr/ scream
/alveolar+r/ dream trim tram
/str/ stream
Table 5.5: Subset of words from cluster experiment, which differ only in the nature of their syllable onsets. All words
are monosyllabic and end in /m/.
The durations of vowels from this subset of words are plotted in Figure 5.4. The
pattern of variation is very similar to that for the r-onsets in Figure 5.3, with vowels being
shorter the more constituents there are in the syllable onset. As before, the vowels after
alveolar+r clusters are shorter than those after velar+r, but they are still slightly longer
than vowels after /skr/ or /str/. A certain amount of care must be taken when interpreting
the data in Figure 5.4, as vowels are not equally represented for each of the syllable onsets.
The /skr/ and /str/ onset data, for instance, come exclusively from syllables with /i/ as the
nucleus, since this is the only set which was perfectly controlled in terms of word length,
syllable coda etc. Thus the observed difference between the /sCr/ onsets and /Cr/ onsets
is probably less than if the short vowels /I/ and /æ/ were included in the /sCr/ word set.
5.6.3 Conclusions for vowel data
The duration data seem to go a long way toward explaining the pattern of formant
frequency variation in the vowels. As more segments are added to the syllable onset, the
syllable nucleus gets progressively shorter, allowing less time for the articulators to reach
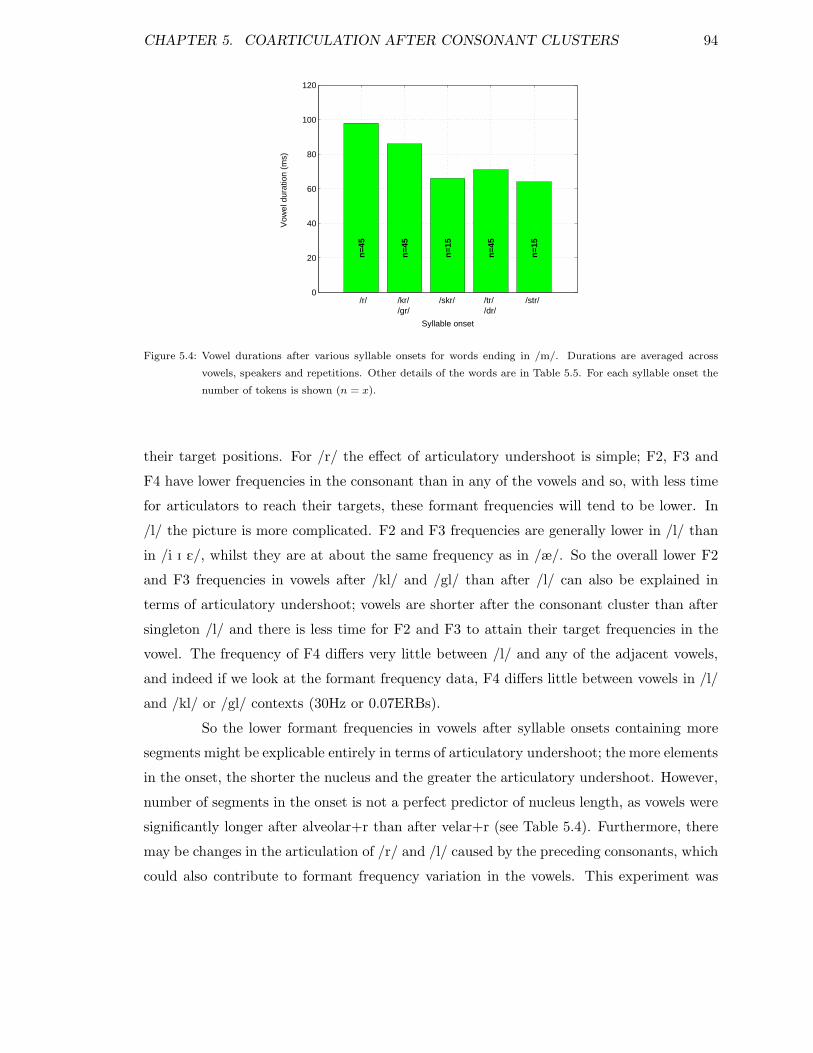
CHAPTER 5. COARTICULATION AFTER CONSONANT CLUSTERS 94
Syllable onset
Vow
el d
urat
ion
(ms)
/r/ /kr//gr/
/skr/ /tr//dr/
/str/0
20
40
60
80
100
120
n=4
5
n=4
5
n=1
5
n=4
5
n=1
5
Figure 5.4: Vowel durations after various syllable onsets for words ending in /m/. Durations are averaged across
vowels, speakers and repetitions. Other details of the words are in Table 5.5. For each syllable onset the
number of tokens is shown (n = x).
their target positions. For /r/ the effect of articulatory undershoot is simple; F2, F3 and
F4 have lower frequencies in the consonant than in any of the vowels and so, with less time
for articulators to reach their targets, these formant frequencies will tend to be lower. In
/l/ the picture is more complicated. F2 and F3 frequencies are generally lower in /l/ than
in /i I E/, whilst they are at about the same frequency as in /æ/. So the overall lower F2
and F3 frequencies in vowels after /kl/ and /gl/ than after /l/ can also be explained in
terms of articulatory undershoot; vowels are shorter after the consonant cluster than after
singleton /l/ and there is less time for F2 and F3 to attain their target frequencies in the
vowel. The frequency of F4 differs very little between /l/ and any of the adjacent vowels,
and indeed if we look at the formant frequency data, F4 differs little between vowels in /l/
and /kl/ or /gl/ contexts (30Hz or 0.07ERBs).
So the lower formant frequencies in vowels after syllable onsets containing more
segments might be explicable entirely in terms of articulatory undershoot; the more elements
in the onset, the shorter the nucleus and the greater the articulatory undershoot. However,
number of segments in the onset is not a perfect predictor of nucleus length, as vowels were
significantly longer after alveolar+r than after velar+r (see Table 5.4). Furthermore, there
may be changes in the articulation of /r/ and /l/ caused by the preceding consonants, which
could also contribute to formant frequency variation in the vowels. This experiment was
CHAPTER 5. COARTICULATION AFTER CONSONANT CLUSTERS 95
primarily designed to explore spectral and durational variation in vowels after a variety of
syllable onsets, the following section describes a supplementary experiment, which examines
the articulatory characteristics of the consonants in the clusters.
5.7 Realization of consonants in clusters
The work reported in this section is on a much smaller scale than that in the main
part of the experiment. The aim is to get an indication of variation in the realization of
the consonants in the clusters examined here, and perhaps to provide a starting point for
further articulatory and acoustic studies. The main question was whether articulation of the
consonant clusters might differ in ways that could explain the pattern of spectral variation
described for the vowels in Section 5.6.1. I look in turn at the realization of /r/ alone and
in clusters, at velars and alveolars in /Cr/ and /sCr/ clusters, and at the realization of
/l/ alone and in velar+l clusters. Given the small scale of this part of the experiment, the
materials and procedure for the investigation of each consonant are discussed individually
in the following sections.
5.7.1 Realization of /r/ in consonant clusters
Ideally this experiment would have included an acoustic analysis of /r/ in the
various clusters. However, the very different realizations of /r/ when it is the sole onset
constituent, and when it is part of a cluster mean that in practice it is very hard to define
a place to measure formant frequencies in the consonant which is consistent between each
of the different onset structures. This is clearly demonstrated by the three spectrograms in
Figure 5.5. It is relatively straightforward to measure formant frequencies at the midpoint
of the /r/ where it occurs in a simple /@ r i:/ sequence, as in 5.5(a); the midpoint of
the consonant is located at approximately 12ms, where the frequency of F2 is at its lowest.
Finding an equivalent location in which to measure formant frequencies is extremely difficult
where the /r/ occurs as part of a consonant cluster as in 5.5(b) and (c). This is most evident
where /r/ occurs after a voiceless obstruent as in 5.5(b), and there is a period of aspiration
at the start of the rhotic consonant. Although measurement of the formant frequencies is
possible in the aspiration phase, the bandwidths will be broader and so accuracy is reduced,
especially with the absence of harmonic structure. These problems were great enough that
it was felt that variability due to measurement error might be as great or greater than
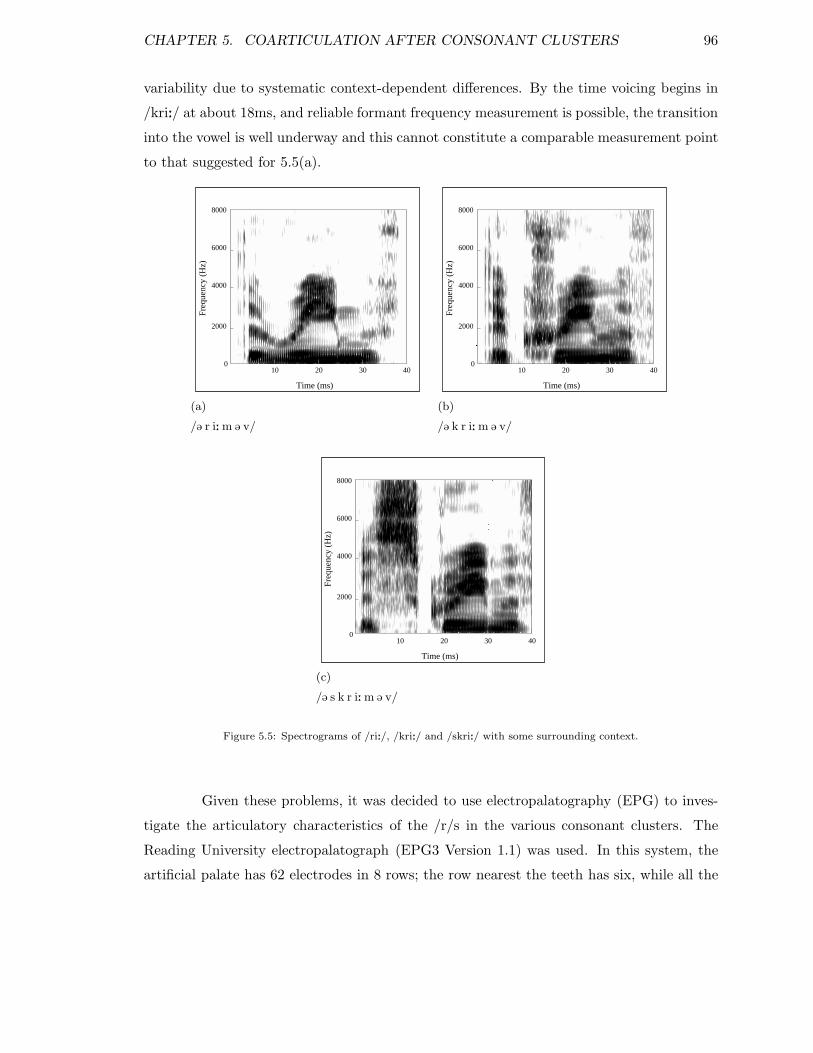
CHAPTER 5. COARTICULATION AFTER CONSONANT CLUSTERS 96
variability due to systematic context-dependent differences. By the time voicing begins in
/kri:/ at about 18ms, and reliable formant frequency measurement is possible, the transition
into the vowel is well underway and this cannot constitute a comparable measurement point
to that suggested for 5.5(a).
(a)
/@ r i: m @ v/
4000
6000
2000
Freq
uenc
y (H
z)
Time (ms)
0
8000
2010 4030
(b)
/@ k r i: m @ v/
4000
6000
2000
Freq
uenc
y (H
z)
Time (ms)
0
8000
2010 4030
(c)
/@ s k r i: m @ v/
4000
6000
2000
Freq
uenc
y (H
z)
Time (ms)
0
8000
2010 4030
Figure 5.5: Spectrograms of /ri:/, /kri:/ and /skri:/ with some surrounding context.
Given these problems, it was decided to use electropalatography (EPG) to inves-
tigate the articulatory characteristics of the /r/s in the various consonant clusters. The
Reading University electropalatograph (EPG3 Version 1.1) was used. In this system, the
artificial palate has 62 electrodes in 8 rows; the row nearest the teeth has six, while all the
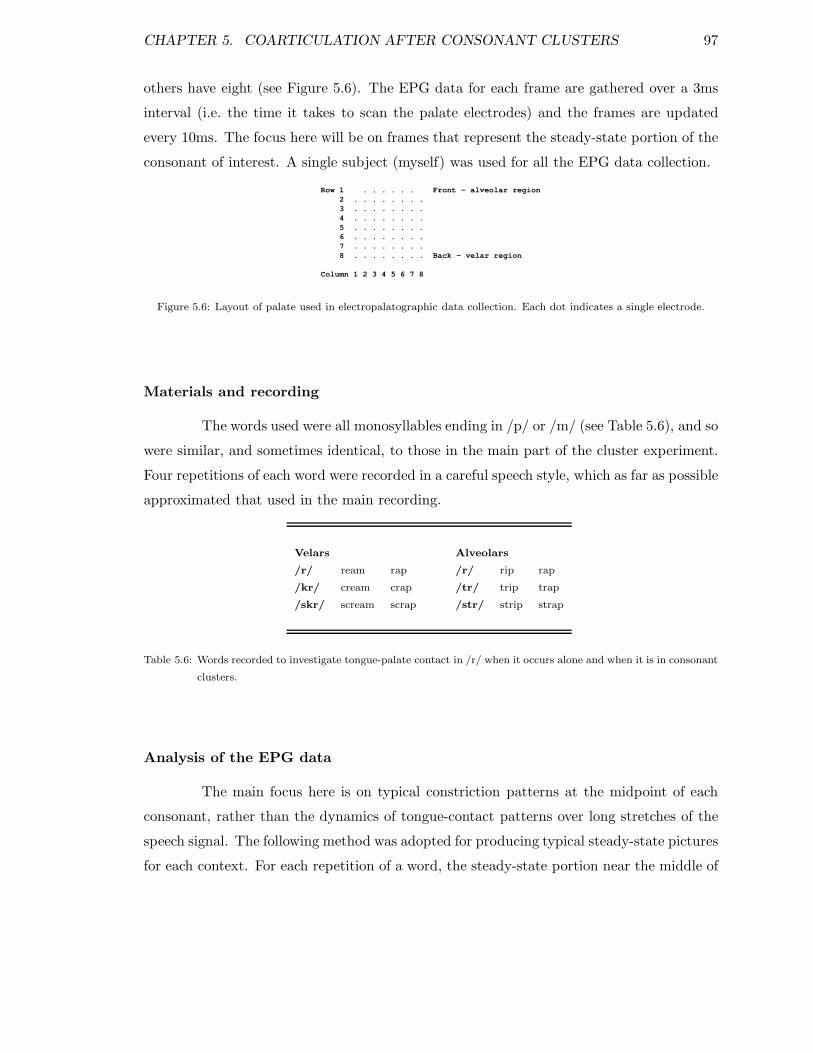
CHAPTER 5. COARTICULATION AFTER CONSONANT CLUSTERS 97
others have eight (see Figure 5.6). The EPG data for each frame are gathered over a 3ms
interval (i.e. the time it takes to scan the palate electrodes) and the frames are updated
every 10ms. The focus here will be on frames that represent the steady-state portion of the
consonant of interest. A single subject (myself) was used for all the EPG data collection.
Row 1 . . . . . . Front - alveolar region 2 . . . . . . . . 3 . . . . . . . . 4 . . . . . . . . 5 . . . . . . . . 6 . . . . . . . . 7 . . . . . . . . 8 . . . . . . . . Back - velar region Column 1 2 3 4 5 6 7 8
Figure 5.6: Layout of palate used in electropalatographic data collection. Each dot indicates a single electrode.
Materials and recording
The words used were all monosyllables ending in /p/ or /m/ (see Table 5.6), and so
were similar, and sometimes identical, to those in the main part of the cluster experiment.
Four repetitions of each word were recorded in a careful speech style, which as far as possible
approximated that used in the main recording.
Velars Alveolars
/r/ ream rap /r/ rip rap
/kr/ cream crap /tr/ trip trap
/skr/ scream scrap /str/ strip strap
Table 5.6: Words recorded to investigate tongue-palate contact in /r/ when it occurs alone and when it is in consonant
clusters.
Analysis of the EPG data
The main focus here is on typical constriction patterns at the midpoint of each
consonant, rather than the dynamics of tongue-contact patterns over long stretches of the
speech signal. The following method was adopted for producing typical steady-state pictures
for each context. For each repetition of a word, the steady-state portion near the middle of

CHAPTER 5. COARTICULATION AFTER CONSONANT CLUSTERS 98
the consonant of interest was identified. These steady-states consist of at least 4 identical
tongue-palate contact frames (ca. 40ms), and more typically they were 6-9 frames long.
Since there were four repetitions of each word, this resulted in four steady-state pictures
for each consonant in the various cluster contexts. An average picture of tongue-palate
contact was established, by defining as ‘on’ any electrode that was on in at least two of the
four pictures. In most cases there was agreement in three or more of the repetitions as to
whether an electrode was on or not. The resulting frames represent the typical steady-state
constriction patterns.
Results of EPG analysis of /r/
Figure 5.7 shows typical steady-state tongue-palate contact patterns for /r/ alone
and in /kr/ and /skr/, in /i:/ vowel contexts above, and /æ/ below. Predictably, the /r/s
before /i:/ have greater tongue-palate contact, particularly in the palatal region. The clear
constriction in the palatal region (rows 3–4) for /ri:/ and /skri:/ is less marked in /kri:/. So,
whilst the velar encourages less palatal contact in /r/, the preceding /s/ tends to pull the
rhotic consonant forward again. In the /æ/ set the only evidence of a palatal constriction is
for /r/ alone (row 4). In both vowel contexts the /r/s after velars have more contact in the
velar region and, interestingly, this is most marked after /sk/. These data thus suggest that
raising the front or front-dorsal part of the tongue for /s/ results in more contact during
/r/ in both the palatal and velar regions.
(a)
/ri:/
. . . . . .. . . . . . . .o o o . . . o .o o . . . . o o o . . . . . . oo . . . . . . oo . . . . . . oo . . . . . . o
(b)
/kri:/
. . . . . .. . . . . . . .o o . . . . . .o o . . . . . o o . . . . . . oo . . . . . . oo . . . . . . oo o . . . . . o
(c)
/skri:/
. . . . . .o . . . . . . .o o . . . . o .o o . . . . o oo . . . . . . oo . . . . . . oo o . . . . . oo o o . . . o o
(d)
/ræ/
. . . . . .. . . . . . . .. . . . . . . .o o . . . . . oo . . . . . . oo . . . . . . oo . . . . . . .o . . . . . . o
(e)
/kræ/
. . . . . .. . . . . . . .. . . . . . . .o . . . . . . .o . . . . . . oo . . . . . . oo . . . . . . oo o . . . . . o
(f)
/skræ/
. . . . . .. . . . . . . .o . . . . . . .o . . . . . . .o . . . . . . oo . . . . . . oo . . . . . . oo o . . . . o o
Figure 5.7: Typical steady-state tongue-palate contact patterns for /r/ in different syllable onsets and two vowel
contexts. Each panel is a composite of 4 repetitions of the token.
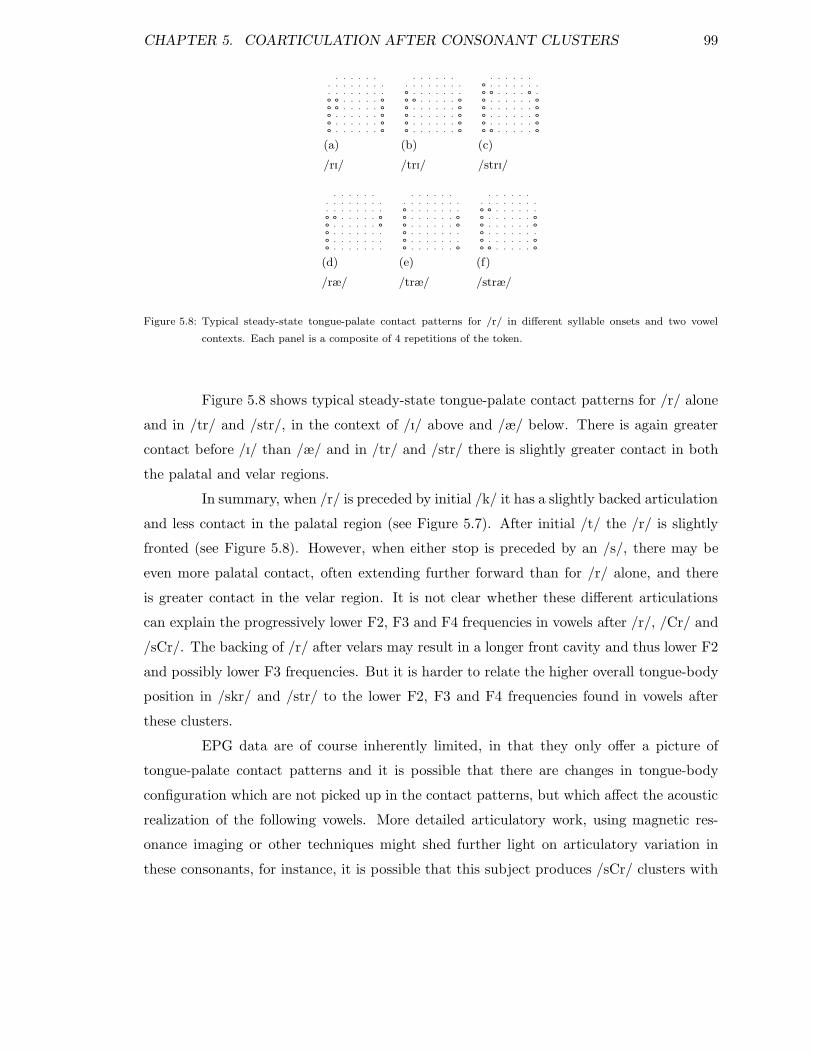
CHAPTER 5. COARTICULATION AFTER CONSONANT CLUSTERS 99
(a)
/rI/
. . . . . .. . . . . . . .. . . . . . . .o o . . . . . oo o . . . . . oo . . . . . . oo . . . . . . oo . . . . . . o
(b)
/trI/
. . . . . .. . . . . . . .o . . . . . . .o o . . . . . oo . . . . . . oo . . . . . . oo . . . . . . oo . . . . . . o
(c)
/strI/
. . . . . .o . . . . . . .o o . . . . o .o . . . . . . oo . . . . . . oo . . . . . . oo . . . . . . oo o . . . . . o
(d)
/ræ/
. . . . . .. . . . . . . .. . . . . . . .o o . . . . . oo . . . . . . oo . . . . . . .o . . . . . . .o . . . . . . .
(e)
/træ/
. . . . . .. . . . . . . .o . . . . . . .o . . . . . . oo . . . . . . oo . . . . . . .o . . . . . . .o . . . . . . o
(f)
/stræ/
. . . . . .. . . . . . . .o o . . . . . .o . . . . . . oo . . . . . . oo . . . . . . .o . . . . . . oo o . . . . . o
Figure 5.8: Typical steady-state tongue-palate contact patterns for /r/ in different syllable onsets and two vowel
contexts. Each panel is a composite of 4 repetitions of the token.
Figure 5.8 shows typical steady-state tongue-palate contact patterns for /r/ alone
and in /tr/ and /str/, in the context of /I/ above and /æ/ below. There is again greater
contact before /I/ than /æ/ and in /tr/ and /str/ there is slightly greater contact in both
the palatal and velar regions.
In summary, when /r/ is preceded by initial /k/ it has a slightly backed articulation
and less contact in the palatal region (see Figure 5.7). After initial /t/ the /r/ is slightly
fronted (see Figure 5.8). However, when either stop is preceded by an /s/, there may be
even more palatal contact, often extending further forward than for /r/ alone, and there
is greater contact in the velar region. It is not clear whether these different articulations
can explain the progressively lower F2, F3 and F4 frequencies in vowels after /r/, /Cr/ and
/sCr/. The backing of /r/ after velars may result in a longer front cavity and thus lower F2
and possibly lower F3 frequencies. But it is harder to relate the higher overall tongue-body
position in /skr/ and /str/ to the lower F2, F3 and F4 frequencies found in vowels after
these clusters.
EPG data are of course inherently limited, in that they only offer a picture of
tongue-palate contact patterns and it is possible that there are changes in tongue-body
configuration which are not picked up in the contact patterns, but which affect the acoustic
realization of the following vowels. More detailed articulatory work, using magnetic res-
onance imaging or other techniques might shed further light on articulatory variation in
these consonants, for instance, it is possible that this subject produces /sCr/ clusters with
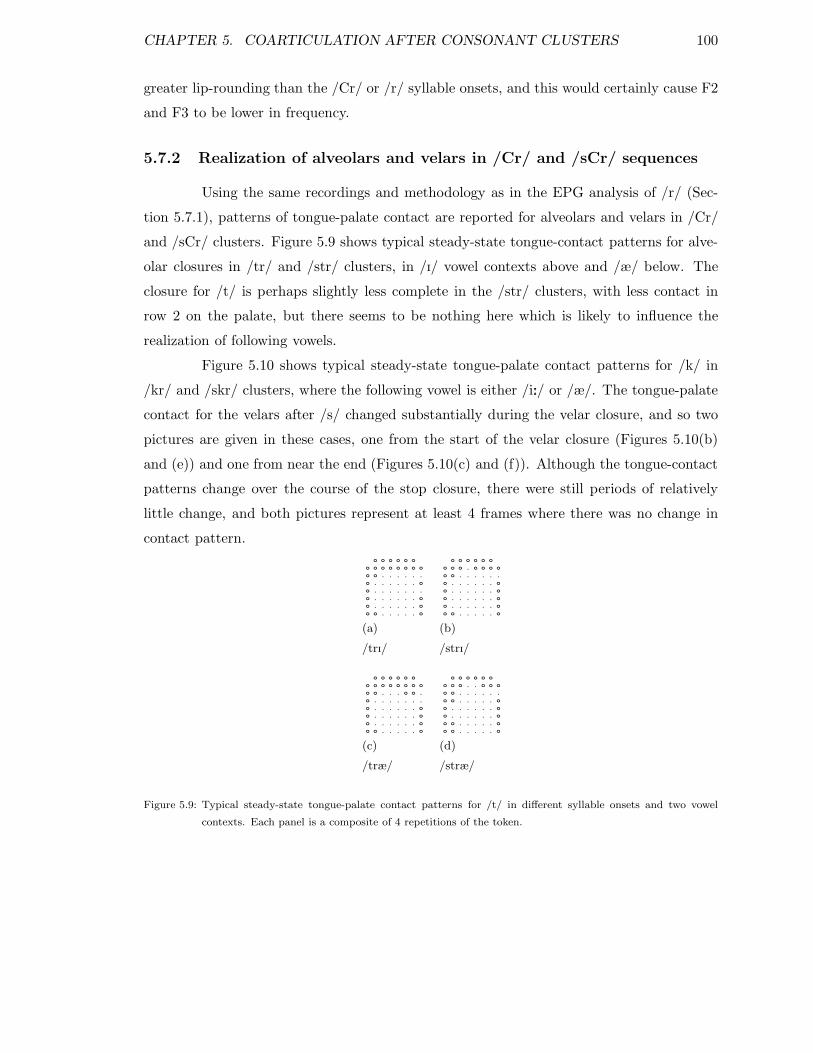
CHAPTER 5. COARTICULATION AFTER CONSONANT CLUSTERS 100
greater lip-rounding than the /Cr/ or /r/ syllable onsets, and this would certainly cause F2
and F3 to be lower in frequency.
5.7.2 Realization of alveolars and velars in /Cr/ and /sCr/ sequences
Using the same recordings and methodology as in the EPG analysis of /r/ (Sec-
tion 5.7.1), patterns of tongue-palate contact are reported for alveolars and velars in /Cr/
and /sCr/ clusters. Figure 5.9 shows typical steady-state tongue-contact patterns for alve-
olar closures in /tr/ and /str/ clusters, in /I/ vowel contexts above and /æ/ below. The
closure for /t/ is perhaps slightly less complete in the /str/ clusters, with less contact in
row 2 on the palate, but there seems to be nothing here which is likely to influence the
realization of following vowels.
Figure 5.10 shows typical steady-state tongue-palate contact patterns for /k/ in
/kr/ and /skr/ clusters, where the following vowel is either /i:/ or /æ/. The tongue-palate
contact for the velars after /s/ changed substantially during the velar closure, and so two
pictures are given in these cases, one from the start of the velar closure (Figures 5.10(b)
and (e)) and one from near the end (Figures 5.10(c) and (f)). Although the tongue-contact
patterns change over the course of the stop closure, there were still periods of relatively
little change, and both pictures represent at least 4 frames where there was no change in
contact pattern.
(a)
/trI/
o o o o o o o o o o o o o oo o . . . . . .o . . . . . . o o . . . . . . .o . . . . . . oo . . . . . . oo o . . . . . o
(b)
/strI/
o o o o o o o o o . o o o oo o . . . . . .o . . . . . . oo . . . . . . oo . . . . . . oo . . . . . . oo o . . . . . o
(c)
/træ/
o o o o o o o o o o o o o oo o . . . o o .o . . . . . . .o . . . . . . oo . . . . . . oo . . . . . . oo o . . . . . o
(d)
/stræ/
o o o o o o o o o . . o o oo o . . . . . .o o . . . . . oo . . . . . . oo . . . . . . oo o . . . . . oo o . . . . . o
Figure 5.9: Typical steady-state tongue-palate contact patterns for /t/ in different syllable onsets and two vowel
contexts. Each panel is a composite of 4 repetitions of the token.
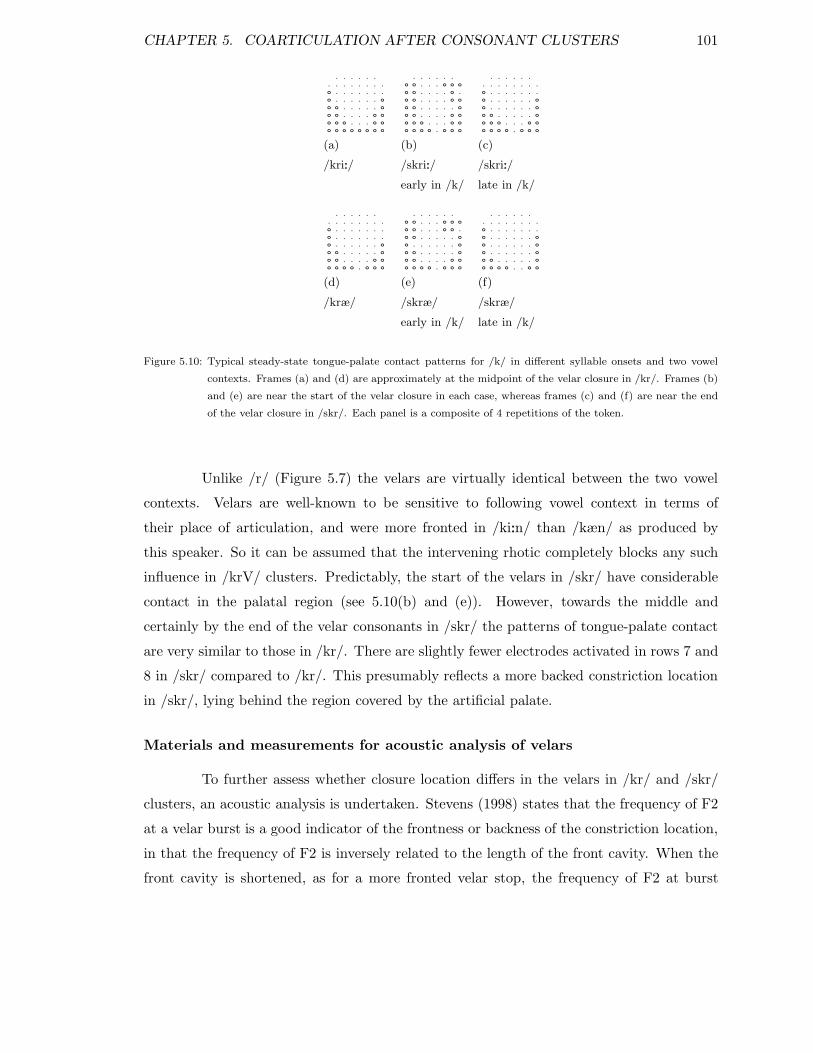
CHAPTER 5. COARTICULATION AFTER CONSONANT CLUSTERS 101
(a)
/kri:/
. . . . . .. . . . . . . .o . . . . . . .o . . . . . . o o o . . . . . oo o . . . . o oo o o . . . o oo o o o o o o o
(b)
/skri:/
early in /k/
. . . . . .o o . . . o o oo o . . . . o .o o . . . . o o o o . . . . . oo o . . . . o oo o o . . . o oo o o o . o o o
(c)
/skri:/
late in /k/
. . . . . .. . . . . . . .o . . . . . . .o . . . . . . o o . . . . . . oo o . . . . . oo o o . . . o oo o o o . o o o
(d)
/kræ/
. . . . . .. . . . . . . .o . . . . . . .o . . . . . . . o . . . . . . oo o . . . . . oo o . . . . o oo o o o . o o o
(e)
/skræ/
early in /k/
. . . . . .o o . . . o o oo o . . . o o .o o . . . . . o o . . . . . . oo o . . . . . oo o . . . . o oo o o o . o o o
(f)
/skræ/
late in /k/
. . . . . .. . . . . . . .o . . . . . . .o . . . . . . o o . . . . . . oo . . . . . . oo o . . . . . oo o o o . . o o
Figure 5.10: Typical steady-state tongue-palate contact patterns for /k/ in different syllable onsets and two vowel
contexts. Frames (a) and (d) are approximately at the midpoint of the velar closure in /kr/. Frames (b)
and (e) are near the start of the velar closure in each case, whereas frames (c) and (f) are near the end
of the velar closure in /skr/. Each panel is a composite of 4 repetitions of the token.
Unlike /r/ (Figure 5.7) the velars are virtually identical between the two vowel
contexts. Velars are well-known to be sensitive to following vowel context in terms of
their place of articulation, and were more fronted in /ki:n/ than /kæn/ as produced by
this speaker. So it can be assumed that the intervening rhotic completely blocks any such
influence in /krV/ clusters. Predictably, the start of the velars in /skr/ have considerable
contact in the palatal region (see 5.10(b) and (e)). However, towards the middle and
certainly by the end of the velar consonants in /skr/ the patterns of tongue-palate contact
are very similar to those in /kr/. There are slightly fewer electrodes activated in rows 7 and
8 in /skr/ compared to /kr/. This presumably reflects a more backed constriction location
in /skr/, lying behind the region covered by the artificial palate.
Materials and measurements for acoustic analysis of velars
To further assess whether closure location differs in the velars in /kr/ and /skr/
clusters, an acoustic analysis is undertaken. Stevens (1998) states that the frequency of F2
at a velar burst is a good indicator of the frontness or backness of the constriction location,
in that the frequency of F2 is inversely related to the length of the front cavity. When the
front cavity is shortened, as for a more fronted velar stop, the frequency of F2 at burst
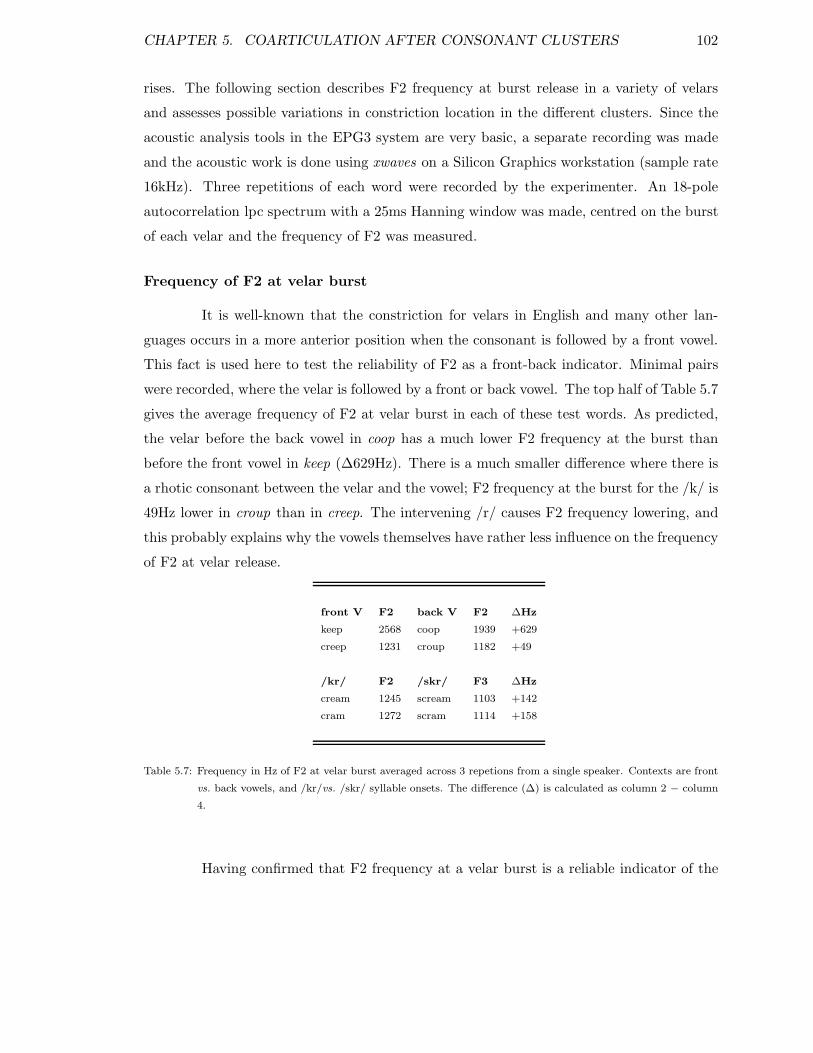
CHAPTER 5. COARTICULATION AFTER CONSONANT CLUSTERS 102
rises. The following section describes F2 frequency at burst release in a variety of velars
and assesses possible variations in constriction location in the different clusters. Since the
acoustic analysis tools in the EPG3 system are very basic, a separate recording was made
and the acoustic work is done using xwaves on a Silicon Graphics workstation (sample rate
16kHz). Three repetitions of each word were recorded by the experimenter. An 18-pole
autocorrelation lpc spectrum with a 25ms Hanning window was made, centred on the burst
of each velar and the frequency of F2 was measured.
Frequency of F2 at velar burst
It is well-known that the constriction for velars in English and many other lan-
guages occurs in a more anterior position when the consonant is followed by a front vowel.
This fact is used here to test the reliability of F2 as a front-back indicator. Minimal pairs
were recorded, where the velar is followed by a front or back vowel. The top half of Table 5.7
gives the average frequency of F2 at velar burst in each of these test words. As predicted,
the velar before the back vowel in coop has a much lower F2 frequency at the burst than
before the front vowel in keep (∆629Hz). There is a much smaller difference where there is
a rhotic consonant between the velar and the vowel; F2 frequency at the burst for the /k/ is
49Hz lower in croup than in creep. The intervening /r/ causes F2 frequency lowering, and
this probably explains why the vowels themselves have rather less influence on the frequency
of F2 at velar release.
front V F2 back V F2 ∆Hz
keep 2568 coop 1939 +629
creep 1231 croup 1182 +49
/kr/ F2 /skr/ F3 ∆Hz
cream 1245 scream 1103 +142
cram 1272 scram 1114 +158
Table 5.7: Frequency in Hz of F2 at velar burst averaged across 3 repetions from a single speaker. Contexts are front
vs. back vowels, and /kr/vs. /skr/ syllable onsets. The difference (∆) is calculated as column 2 − column
4.
Having confirmed that F2 frequency at a velar burst is a reliable indicator of the
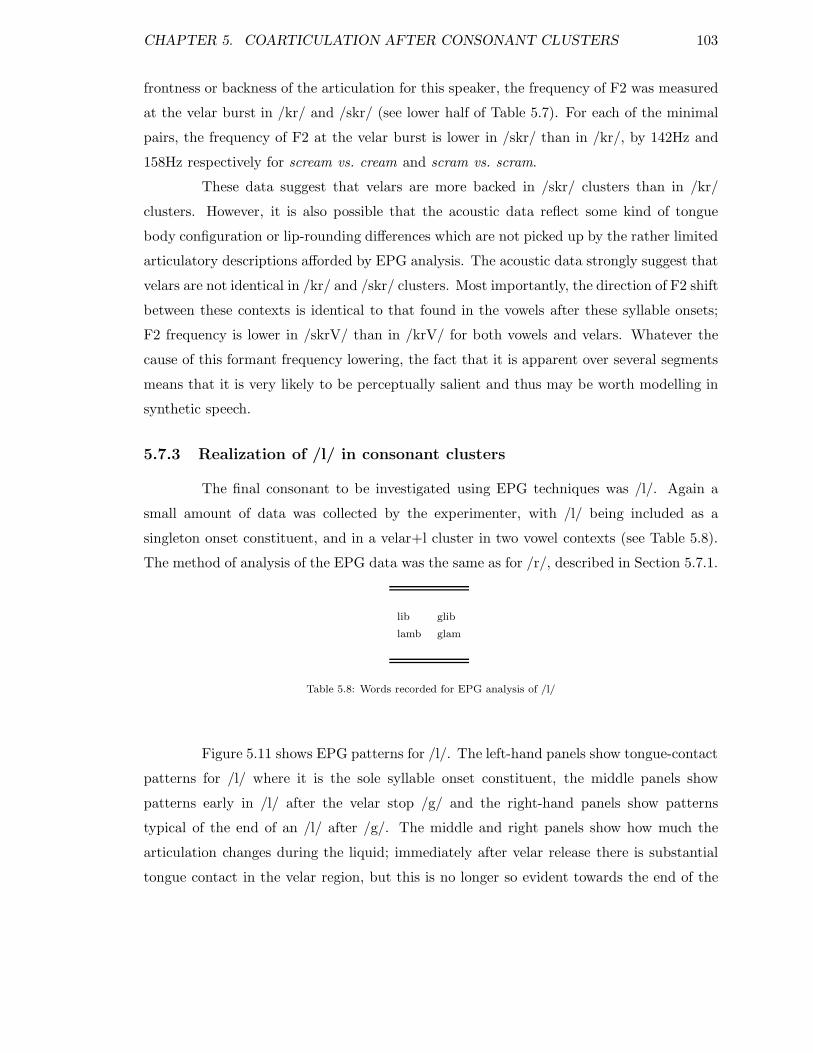
CHAPTER 5. COARTICULATION AFTER CONSONANT CLUSTERS 103
frontness or backness of the articulation for this speaker, the frequency of F2 was measured
at the velar burst in /kr/ and /skr/ (see lower half of Table 5.7). For each of the minimal
pairs, the frequency of F2 at the velar burst is lower in /skr/ than in /kr/, by 142Hz and
158Hz respectively for scream vs. cream and scram vs. scram.
These data suggest that velars are more backed in /skr/ clusters than in /kr/
clusters. However, it is also possible that the acoustic data reflect some kind of tongue
body configuration or lip-rounding differences which are not picked up by the rather limited
articulatory descriptions afforded by EPG analysis. The acoustic data strongly suggest that
velars are not identical in /kr/ and /skr/ clusters. Most importantly, the direction of F2 shift
between these contexts is identical to that found in the vowels after these syllable onsets;
F2 frequency is lower in /skrV/ than in /krV/ for both vowels and velars. Whatever the
cause of this formant frequency lowering, the fact that it is apparent over several segments
means that it is very likely to be perceptually salient and thus may be worth modelling in
synthetic speech.
5.7.3 Realization of /l/ in consonant clusters
The final consonant to be investigated using EPG techniques was /l/. Again a
small amount of data was collected by the experimenter, with /l/ being included as a
singleton onset constituent, and in a velar+l cluster in two vowel contexts (see Table 5.8).
The method of analysis of the EPG data was the same as for /r/, described in Section 5.7.1.
lib glib
lamb glam
Table 5.8: Words recorded for EPG analysis of /l/
Figure 5.11 shows EPG patterns for /l/. The left-hand panels show tongue-contact
patterns for /l/ where it is the sole syllable onset constituent, the middle panels show
patterns early in /l/ after the velar stop /g/ and the right-hand panels show patterns
typical of the end of an /l/ after /g/. The middle and right panels show how much the
articulation changes during the liquid; immediately after velar release there is substantial
tongue contact in the velar region, but this is no longer so evident towards the end of the
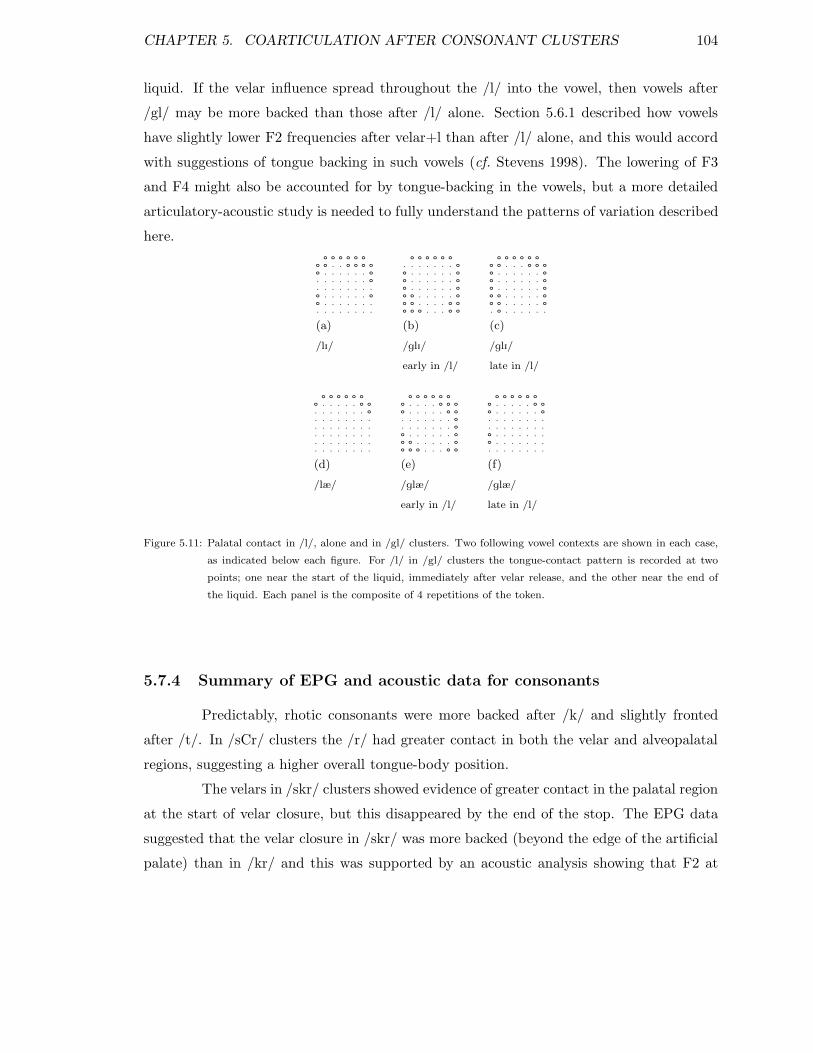
CHAPTER 5. COARTICULATION AFTER CONSONANT CLUSTERS 104
liquid. If the velar influence spread throughout the /l/ into the vowel, then vowels after
/gl/ may be more backed than those after /l/ alone. Section 5.6.1 described how vowels
have slightly lower F2 frequencies after velar+l than after /l/ alone, and this would accord
with suggestions of tongue backing in such vowels (cf. Stevens 1998). The lowering of F3
and F4 might also be accounted for by tongue-backing in the vowels, but a more detailed
articulatory-acoustic study is needed to fully understand the patterns of variation described
here.
(a)
/lI/
o o o o o oo o . . o o o oo . . . . . . o. . . . . . . o. . . . . . . .o . . . . . . oo . . . . . . .. . . . . . . .
(b)
/glI/
early in /l/
o o o o o o. . . . . . . oo . . . . . . oo . . . . . . oo . . . . . . oo o . . . . . oo o . . . . o oo o o . . . o o
(c)
/glI/
late in /l/
o o o o o oo o . . . o o oo . . . . . . oo . . . . . . oo . . . . . . oo o . . . . . oo o . . . . . o. o . . . . . .
(d)
/læ/
o o o o o oo . . . . . o o. . . . . . . o. . . . . . . .. . . . . . . .. . . . . . . .. . . . . . . .. . . . . . . .
(e)
/glæ/
early in /l/
o o o o o oo . . . . o o oo . . . . . o o. . . . . . . o. . . . . . . oo . . . . . . oo o . . . . . oo o o . . . o o
(f)
/glæ/
late in /l/
o o o o o oo . . . . . o oo . . . . . . o. . . . . . . .. . . . . . . .o . . . . . . .o . . . . . . .. . . . . . . .
Figure 5.11: Palatal contact in /l/, alone and in /gl/ clusters. Two following vowel contexts are shown in each case,
as indicated below each figure. For /l/ in /gl/ clusters the tongue-contact pattern is recorded at two
points; one near the start of the liquid, immediately after velar release, and the other near the end of
the liquid. Each panel is the composite of 4 repetitions of the token.
5.7.4 Summary of EPG and acoustic data for consonants
Predictably, rhotic consonants were more backed after /k/ and slightly fronted
after /t/. In /sCr/ clusters the /r/ had greater contact in both the velar and alveopalatal
regions, suggesting a higher overall tongue-body position.
The velars in /skr/ clusters showed evidence of greater contact in the palatal region
at the start of velar closure, but this disappeared by the end of the stop. The EPG data
suggested that the velar closure in /skr/ was more backed (beyond the edge of the artificial
palate) than in /kr/ and this was supported by an acoustic analysis showing that F2 at

CHAPTER 5. COARTICULATION AFTER CONSONANT CLUSTERS 105
velar burst is lower in /skr/ than in /kr/. The frequency of F2 at velar burst is known to be
inversely related to the length of the front cavity at stop release, and so lower F2 suggests
a more backed articulation. It was also acknowledged, however, that F2 lowering could be
caused by lip-rounding, or changes in tongue-body configuration not reflected in the EPG
data and further articulatory and acoustic work is needed to explore this. Whatever the
cause of the F2 lowering, it could well contribute to the lower F2 frequency in vowels after
/skr/ compared with vowels after /kr/.
Finally, /l/ showed greater velar contact after /g/, and this was evident throughout
the liquid and so thought likely to have an influence on following vowels. If the vowels after
/gl/ are more backed than after /l/ they are likely to have lower F2 frequency. This
is precisely the pattern found in Section 5.6.1, although a durational explanation is also
possible for the pattern of spectral variation found after l-onsets.
5.8 Summary and conclusions
This chapter described spectral and temporal variation in vowels after a variety
of syllable onsets which included singleton /r/ and /l/ and consonant clusters involving
liquids. A consistent relationship between the temporal and spectral characteristics of the
vowels was found. In general, the more constituents there were in the syllable onset, the
shorter the following vowel, and the more it seemed prone to articulatory undershoot, as
reflected in lower F2, F3 and F4 frequencies for vowels after r-onsets and lower F2 for vowels
after l-onsets.
The degree and direction of formant frequency variation in F2, F3 and F4 was
very similar between the different syllable onsets, and this pattern was neatest when plot-
ted on an ERB scale, which more accurately reflects the signal’s properties after auditory
processing. The absolute differences between formant frequencies in the different cluster
contexts were large (between 50–260Hz) and the perceptual work in Chapter 3 strongly
suggests that formant frequency variation on this scale and for these formant frequencies
will be perceptually salient.
A great deal of work is currently being done to try and improve the rhythmic
quality of synthetic speech (cf. Edgington 1998, Werner and Keller 1994, van Santen 1992b).
One area which has not been particularly well-researched is the effect of consonant clusters
on following vowel durations (van Santen 1992a), and this chapter provides some preliminary
CHAPTER 5. COARTICULATION AFTER CONSONANT CLUSTERS 106
data in this area. The data confirm the well-known relationship between segment durations
and their spectral properties (cf. Lindblom 1963). The results suggest that the benefits
of getting the timing right in synthetic speech go beyond accurate temporal modelling. If
segment durations are right, and if there is appropriate modelling of articulatory undershoot,
then spectral variation which is related to segment duration may also naturally be captured,
given an appropriate synthesis architecture.
This chapter also includes supplementary data exploring articulatory variation in
the consonants in the various syllable onsets. Some of these data provide partial explana-
tions for the patterns of formant frequency variation found in vowels. For instance, EPG
data suggested that the velar closure in /skr/ was more backed than in /kr/ and this was
also reflected in lower F2 at velar burst in /skr/. This might explain the lower F2 in vowels
following this cluster compared with vowels after /kr/ or /r/ onsets. However, the consonan-
tal data provided at best incomplete explanations for the spectral variation in the vowels,
and it was concluded that the most important factor in determining formant frequencies in
the vowels was their duration.
This chapter explored links between context-induced durational variation in vowels
and their spectral characteristics. The rhythmic patterns described were at the level of the
individual syllable, where it seems that the addition of segments to a syllable onset can
result in a shortening of the tautosyllabic nucleus. The next chapter explores higher-level
influences on vowel durations, investigating the role of metrical structure in determining
the length and spectral characteristics of different vowels.
107
Chapter 6
Further metrical influences on
liquid coarticulation
6.1 Introduction
The production experiments described so far focus primarily on segmental fac-
tors that influence coarticulatory behaviour, with some exploration of the impact of stress
on susceptibility to coarticulatory influence. This chapter examines interactions between
suprasegmental structure and coarticulation.
The separation of the suprasegmental and segmental tiers has long been recognized
to be overly simplistic, and interactions between the two are well-documented. Lehiste
(1970) highlights systematic segmental influences on suprasegmental features; for instance,
high vowels tend to be shorter, have lower intensity and higher F∅ than low vowels. Con-
versely, suprasegmental features commonly affect the realization of phonetic segments; for
instance, unstressed syllables in English tend to have more centralized vowels than their
stressed counterparts (cf. discussion in de Jong, Beckman, and Edwards 1993).
Although researchers in phonetics do not generally consider the division between
segmental and suprasegmental structure to be a reflection of reality, in practice they are of-
ten treated separately in both theoretical work and applications such as the rule-systems for
most speech synthesizers. Formant synthesizers interpolate between target frequencies for
successive acoustic segments, whilst synthesis based on concatenative techniques depends
on a choice of segment (diphone, demisyllable etc.) and basic manipulation of segment
CHAPTER 6. METRICAL INFLUENCES ON LIQUID COARTICULATION 108
timing, F∅ and so forth. Indeed unit selection is a major concern in concatenative synthe-
sis research, as demonstrated by the large number of papers devoted to this issue at the
recent ESCA/COCOSDA synthesis workshop in Australia (Edgington 1998). By explor-
ing interactions between metrical structure and segmentally-governed contextual variability
this chapter highlights some problems for synthesis systems which cannot easily integrate
segmental and suprasegmental information.
A great deal of work has been done relating stress to the timing and acoustic
realization of segments. Some work has also been done on the effect of prosodic structure
on the temporal realization of segments. English is described as having a stress-based
rhythm. That is, the intervals between stressed syllables tend to sound approximately equal
(cf. Abercrombie 1964, Huggins 1975, Laver 1994). Although this auditory impression is
fairly robust, it is often difficult to find evidence of such regular timing in the acoustic
signal (Lehiste 1977, Beckman 1992). However, work by Ogden and Local (1992, 1996)
suggests there is at least a tendency for syllables to become more compressed, as the foot
in which they are contained becomes longer, although their work shows it to be a complex
phenomenon, contingent on additional factors such as syllable weight.
In one part of the present experiment stressed and unstressed CV sequences are
incorporated in feet of different lengths and their durational and spectral properties are
examined. Of the syllables examined in this part of the experiment, 71% were light, and all
the heavy syllables are accounted for by the /i:/ nucleus tokens. Since syllable weight and
vowel quality are relatively well-controlled, it is assumed that it is the number of syllables
in the foot which will be the prime determinant of syllable durations. Further experiments
should vary the phonological weight of syllables whilst controlling vowel-quality to explore
the impact of this factor on temporal and spectral characteristics of the syllable, and possible
interactions with metrical structure when foot-length is also varied. But this was beyond the
scope of the present experiment, which sought to establish some basic principles governing
the relationship between temporal and spectral variation in speech.
The second part of this experiment examines the influence of a syllable’s position
in the foot on its coarticulatory behaviour. Since stressed syllables coarticulate less than
unstressed syllables, it seems clear that the first (stressed) syllable in the foot will be less
susceptible to coarticulatory influence than the following unstressed syllables. But there is
also some evidence to suggest that the unstressed syllables in a foot should not be considered
identical and this is explored further in this chapter. Rodgers (1998) finds that vowels in
CHAPTER 6. METRICAL INFLUENCES ON LIQUID COARTICULATION 109
3rd syllable position in a 4-syllable foot devoice less than the vowels in 2nd or 4th position.
Given that devoicing is a connected speech process closely related to stress, this finding
suggests that the 3 unstressed syllables in a 4-syllable foot are not identical, but that
the middle one carries a stronger beat. This accords with work by Allen and Hawkins
(1978) suggesting that the natural metric form of children’s words is trochaic. Similarly
van Santen (1992a) suggests that speakers may tend to put what he calls a “non-zero”
level of stress on every 2nd or 3rd syllable. Experimental data is presented by Nooteboom
(1991) which shows that within-word sequences of unstressed syllables in Dutch follow a
pattern of rhythmic alternation: short, long, short etc. The second part of the experiment
in this chapter investigates whether this apparent pattern of unequal stress beats results in
different spectral characteristics for the three ‘unstressed’ syllables in a four syllable foot.
6.2 Research Questions
In each foot examined I am interested in the duration and spectral characteristics
of a single CV sequence. Given the rather unpredictable behaviour of vowels after /l/ in the
first production study (Chapter 2) and the perceptual experiment (Chapter 3), no explicit
predictions are made about the behaviour of /lV/ sequences in the different structures.
/h/ is not included, partly because it was impossible to find real-word contexts which were
comparable to those for /l/ and /r/ in the contexts required. It was also felt that previous
experiments had established clear differences between vowels in /r/ and /l/ contexts and
vowels in /h/ contexts and that these did not need further exploration. What is of interest
here is to explore differences between /rV/ or /lV/ sequences when they are incorporated
in different metrical structures.
6.2.1 Hypotheses relating to foot-length
Assuming that there is at least a tendency towards isochrony of stressed syllables
in English, it is predicted that:
1. The more syllables there are in a foot, the greater the compression of each syllable
will be.
2. Unstressed syllables will compress more than stressed ones (cf. Laver 1994).
CHAPTER 6. METRICAL INFLUENCES ON LIQUID COARTICULATION 110
If the hypotheses about syllable compression are substantiated, it is predicted that this will
have the following consequences for the spectral characteristics of the syllables involved:
3. The more syllables there are in a foot the greater their susceptibility to coarticulatory
influence. It is assumed that shorter syllable durations will mean that articulators are
less likely to attain their targets and thus, for instance, r-induced formant frequency
lowering will be greater. This is supported by Laver’s (1994) descriptions of syllable
reorganisation and vowel reduction in compressed vowels.
4. The effects of foot-length on formant frequencies will be greatest for unstressed sylla-
bles, as these compress most.
6.2.2 Hypotheses relating to syllable’s position in the foot
1. Since stressed syllables are less susceptible to coarticulatory influence than unstressed
syllables, the first syllable in the foot will be least susceptible to coarticulatory in-
fluence. Vowels in /rV/ syllables will have highest formant frequencies when in foot-
initial position.
2. If it is true that the 3rd syllable in a 4-syllable foot is ‘stronger’ than the 2nd and 4th
syllables, then this syllable should be less susceptible to coarticulatory influence than
the other unstressed syllables. For instance, vowels in /rV/ syllables which occur 3rd
in the foot will be less prone to r-induced formant frequency lowering than when they
are 2nd or 4th in the foot.
6.3 Materials
6.3.1 Exploring foot-length and syllable compression
In order to explore the impact of foot-length on syllable durations and spectral
variation, foot-length is varied whilst the position of the syllable of interest in the foot is
kept constant. Feet are 2, 3, 4 or 5 syllables long and the syllable of interest is either stressed
or unstressed. Stressed syllables are foot-initial, and the unstressed syllables here are always
second in the foot. As in previous experiments, all stressed syllables are strong accented
syllables and the unstressed syllables are weak. Given this binary stress distinction, some
vowels occur only in stressed or unstressed syllables (see Figure 6.1).
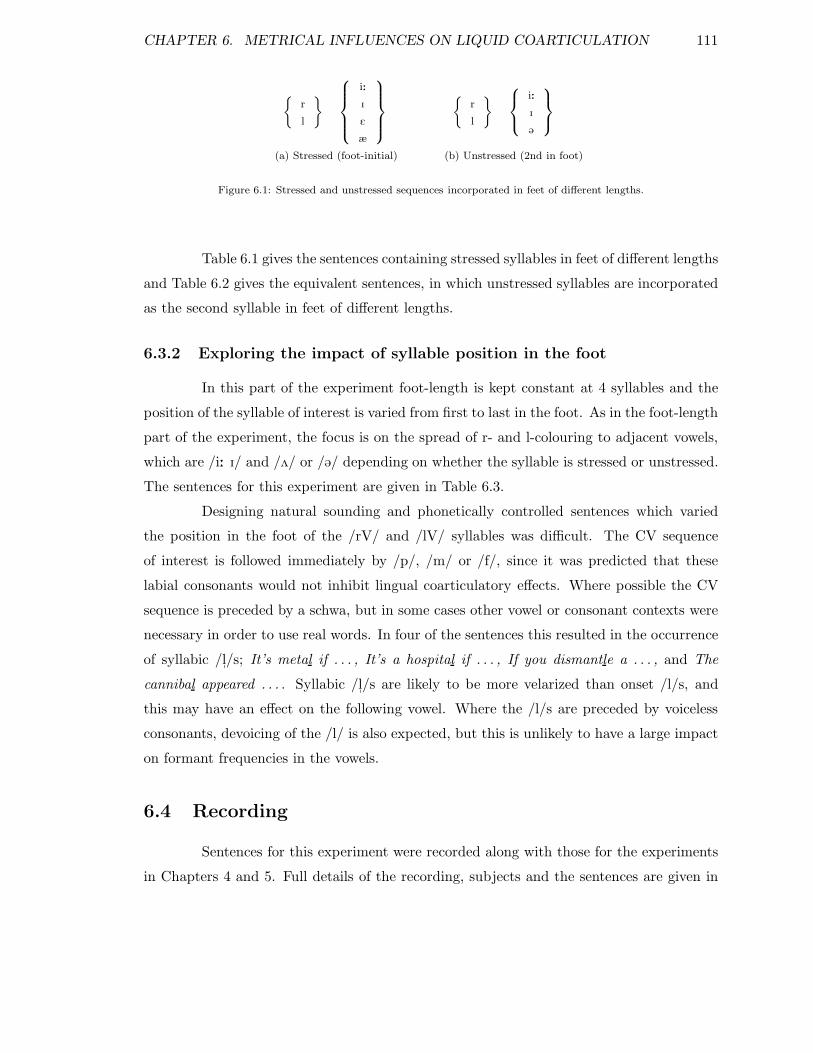
CHAPTER 6. METRICAL INFLUENCES ON LIQUID COARTICULATION 111
{
r
l
}
i:
I
E
æ
{
r
l
}
i:
I
@
(a) Stressed (foot-initial) (b) Unstressed (2nd in foot)
Figure 6.1: Stressed and unstressed sequences incorporated in feet of different lengths.
Table 6.1 gives the sentences containing stressed syllables in feet of different lengths
and Table 6.2 gives the equivalent sentences, in which unstressed syllables are incorporated
as the second syllable in feet of different lengths.
6.3.2 Exploring the impact of syllable position in the foot
In this part of the experiment foot-length is kept constant at 4 syllables and the
position of the syllable of interest is varied from first to last in the foot. As in the foot-length
part of the experiment, the focus is on the spread of r- and l-colouring to adjacent vowels,
which are /i: I/ and /2/ or /@/ depending on whether the syllable is stressed or unstressed.
The sentences for this experiment are given in Table 6.3.
Designing natural sounding and phonetically controlled sentences which varied
the position in the foot of the /rV/ and /lV/ syllables was difficult. The CV sequence
of interest is followed immediately by /p/, /m/ or /f/, since it was predicted that these
labial consonants would not inhibit lingual coarticulatory effects. Where possible the CV
sequence is preceded by a schwa, but in some cases other vowel or consonant contexts were
necessary in order to use real words. In four of the sentences this resulted in the occurrence
of syllabic /l"/s; It’s metal if . . . , It’s a hospital if . . . , If you dismantle a . . . , and The
cannibal appeared . . . . Syllabic /l"/s are likely to be more velarized than onset /l/s, and
this may have an effect on the following vowel. Where the /l/s are preceded by voiceless
consonants, devoicing of the /l/ is also expected, but this is unlikely to have a large impact
on formant frequencies in the vowels.
6.4 Recording
Sentences for this experiment were recorded along with those for the experiments
in Chapters 4 and 5. Full details of the recording, subjects and the sentences are given in
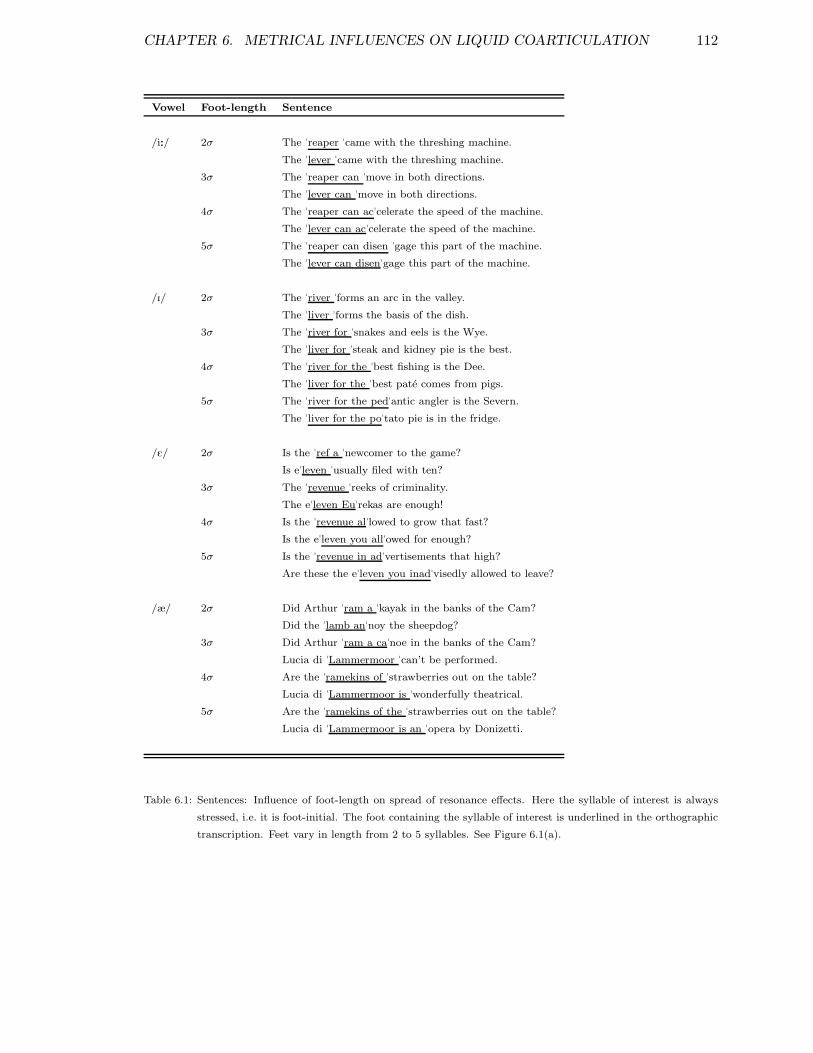
CHAPTER 6. METRICAL INFLUENCES ON LIQUID COARTICULATION 112
Vowel Foot-length Sentence
/i:/ 2σ The "reaper "came with the threshing machine.
The "lever "came with the threshing machine.
3σ The "reaper can "move in both directions.
The "lever can "move in both directions.
4σ The "reaper can ac"celerate the speed of the machine.
The "lever can ac"celerate the speed of the machine.
5σ The "reaper can disen "gage this part of the machine.
The "lever can disen"gage this part of the machine.
/I/ 2σ The "river "forms an arc in the valley.
The "liver "forms the basis of the dish.
3σ The "river for "snakes and eels is the Wye.
The "liver for "steak and kidney pie is the best.
4σ The "river for the "best fishing is the Dee.
The "liver for the "best pate comes from pigs.
5σ The "river for the ped"antic angler is the Severn.
The "liver for the po"tato pie is in the fridge.
/E/ 2σ Is the "ref a "newcomer to the game?
Is e"leven "usually filed with ten?
3σ The "revenue "reeks of criminality.
The e"leven Eu"rekas are enough!
4σ Is the "revenue al"lowed to grow that fast?
Is the e"leven you all"owed for enough?
5σ Is the "revenue in ad"vertisements that high?
Are these the e"leven you inad"visedly allowed to leave?
/æ/ 2σ Did Arthur "ram a "kayak in the banks of the Cam?
Did the "lamb an"noy the sheepdog?
3σ Did Arthur "ram a ca"noe in the banks of the Cam?
Lucia di "Lammermoor "can’t be performed.
4σ Are the "ramekins of "strawberries out on the table?
Lucia di "Lammermoor is "wonderfully theatrical.
5σ Are the "ramekins of the "strawberries out on the table?
Lucia di "Lammermoor is an "opera by Donizetti.
Table 6.1: Sentences: Influence of foot-length on spread of resonance effects. Here the syllable of interest is always
stressed, i.e. it is foot-initial. The foot containing the syllable of interest is underlined in the orthographic
transcription. Feet vary in length from 2 to 5 syllables. See Figure 6.1(a).
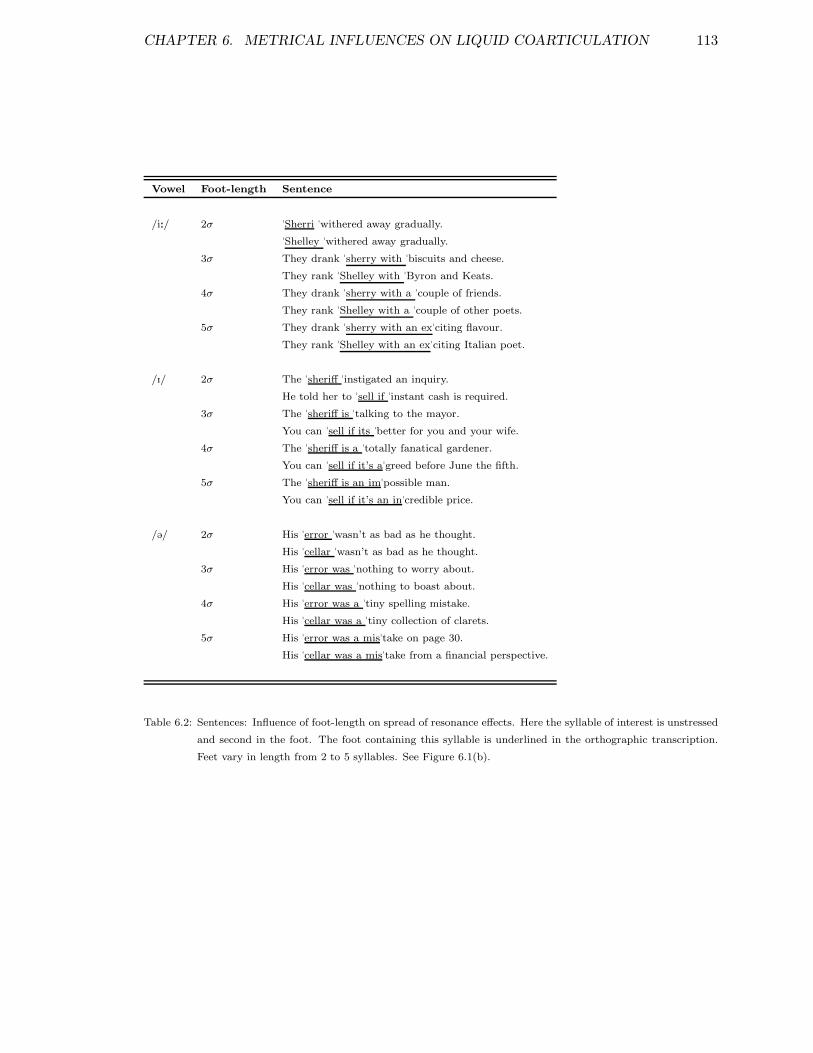
CHAPTER 6. METRICAL INFLUENCES ON LIQUID COARTICULATION 113
Vowel Foot-length Sentence
/i:/ 2σ "Sherri "withered away gradually.
"Shelley "withered away gradually.
3σ They drank "sherry with "biscuits and cheese.
They rank "Shelley with "Byron and Keats.
4σ They drank "sherry with a "couple of friends.
They rank "Shelley with a "couple of other poets.
5σ They drank "sherry with an ex"citing flavour.
They rank "Shelley with an ex"citing Italian poet.
/I/ 2σ The "sheriff "instigated an inquiry.
He told her to "sell if "instant cash is required.
3σ The "sheriff is "talking to the mayor.
You can "sell if its "better for you and your wife.
4σ The "sheriff is a "totally fanatical gardener.
You can "sell if it’s a"greed before June the fifth.
5σ The "sheriff is an im"possible man.
You can "sell if it’s an in"credible price.
/@/ 2σ His "error "wasn’t as bad as he thought.
His "cellar "wasn’t as bad as he thought.
3σ His "error was "nothing to worry about.
His "cellar was "nothing to boast about.
4σ His "error was a "tiny spelling mistake.
His "cellar was a "tiny collection of clarets.
5σ His "error was a mis"take on page 30.
His "cellar was a mis"take from a financial perspective.
Table 6.2: Sentences: Influence of foot-length on spread of resonance effects. Here the syllable of interest is unstressed
and second in the foot. The foot containing this syllable is underlined in the orthographic transcription.
Feet vary in length from 2 to 5 syllables. See Figure 6.1(b).
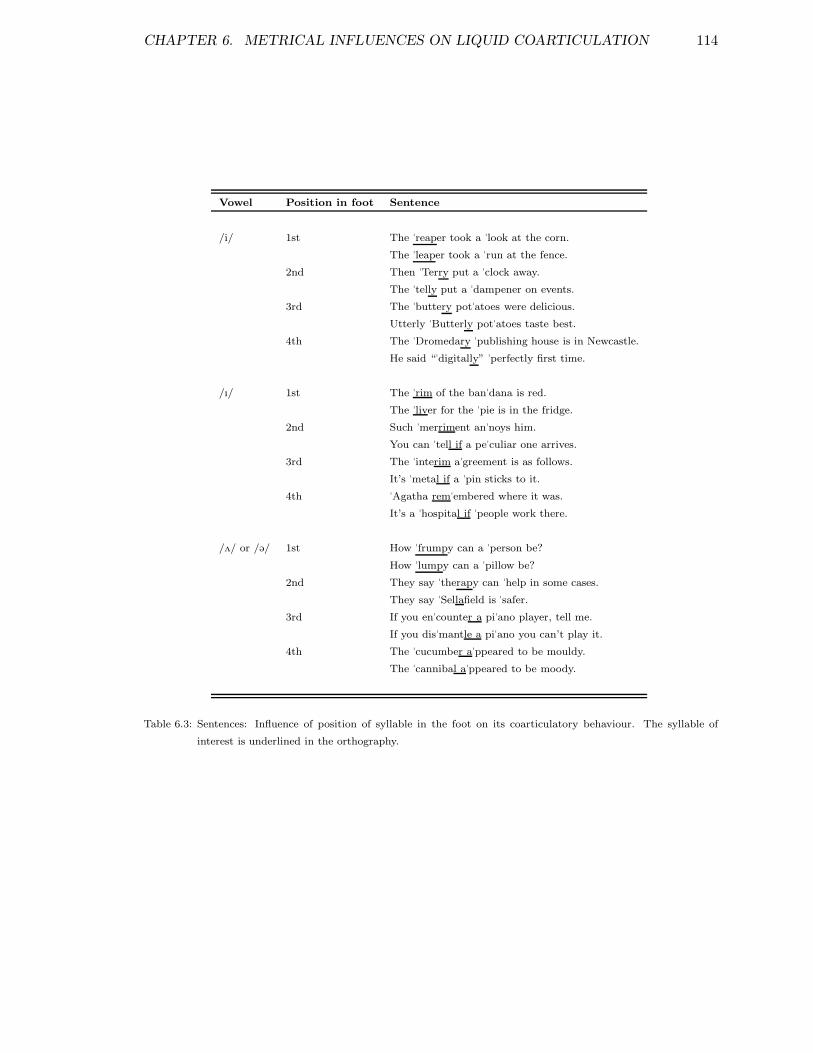
CHAPTER 6. METRICAL INFLUENCES ON LIQUID COARTICULATION 114
Vowel Position in foot Sentence
/i/ 1st The "reaper took a "look at the corn.
The "leaper took a "run at the fence.
2nd Then "Terry put a "clock away.
The "telly put a "dampener on events.
3rd The "buttery pot"atoes were delicious.
Utterly "Butterly pot"atoes taste best.
4th The "Dromedary "publishing house is in Newcastle.
He said “"digitally” "perfectly first time.
/I/ 1st The "rim of the ban"dana is red.
The "liver for the "pie is in the fridge.
2nd Such "merriment an"noys him.
You can "tell if a pe"culiar one arrives.
3rd The "interim a"greement is as follows.
It’s "metal if a "pin sticks to it.
4th "Agatha rem"embered where it was.
It’s a "hospital if "people work there.
/2/ or /@/ 1st How "frumpy can a "person be?
How "lumpy can a "pillow be?
2nd They say "therapy can "help in some cases.
They say "Sellafield is "safer.
3rd If you en"counter a pi"ano player, tell me.
If you dis"mantle a pi"ano you can’t play it.
4th The "cucumber a"ppeared to be mouldy.
The "cannibal a"ppeared to be moody.
Table 6.3: Sentences: Influence of position of syllable in the foot on its coarticulatory behaviour. The syllable of
interest is underlined in the orthography.
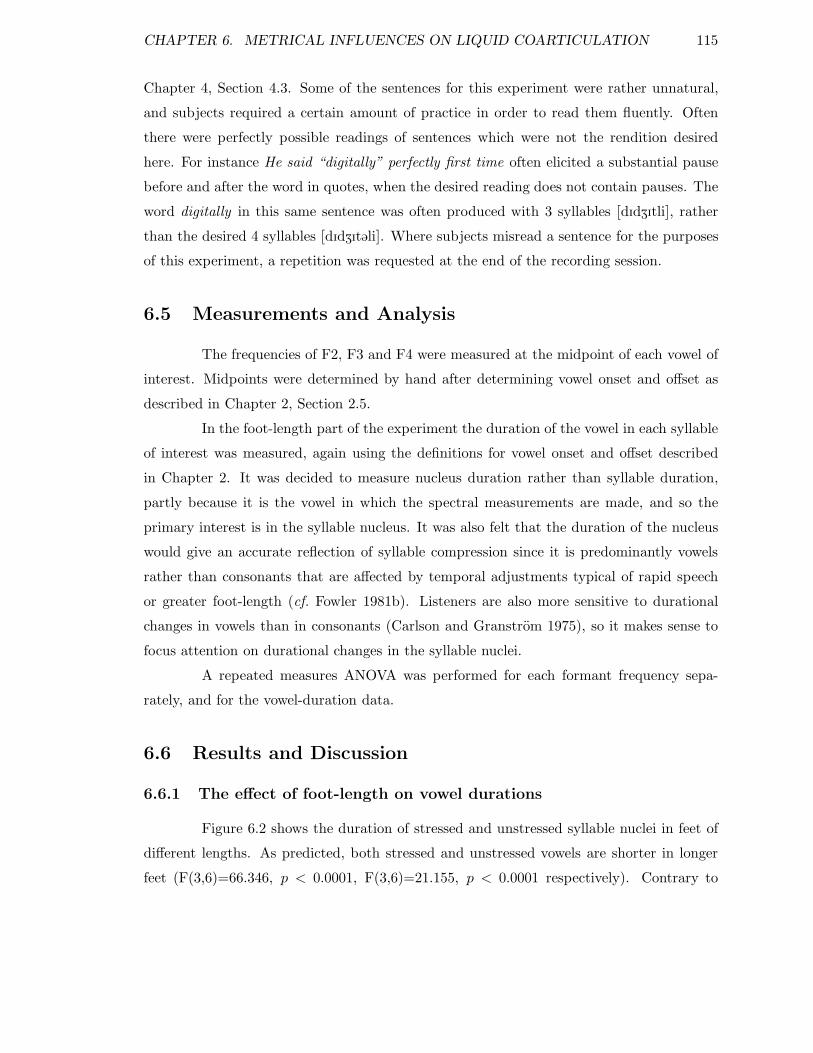
CHAPTER 6. METRICAL INFLUENCES ON LIQUID COARTICULATION 115
Chapter 4, Section 4.3. Some of the sentences for this experiment were rather unnatural,
and subjects required a certain amount of practice in order to read them fluently. Often
there were perfectly possible readings of sentences which were not the rendition desired
here. For instance He said “digitally” perfectly first time often elicited a substantial pause
before and after the word in quotes, when the desired reading does not contain pauses. The
word digitally in this same sentence was often produced with 3 syllables [dIdZItli], rather
than the desired 4 syllables [dIdZIt@li]. Where subjects misread a sentence for the purposes
of this experiment, a repetition was requested at the end of the recording session.
6.5 Measurements and Analysis
The frequencies of F2, F3 and F4 were measured at the midpoint of each vowel of
interest. Midpoints were determined by hand after determining vowel onset and offset as
described in Chapter 2, Section 2.5.
In the foot-length part of the experiment the duration of the vowel in each syllable
of interest was measured, again using the definitions for vowel onset and offset described
in Chapter 2. It was decided to measure nucleus duration rather than syllable duration,
partly because it is the vowel in which the spectral measurements are made, and so the
primary interest is in the syllable nucleus. It was also felt that the duration of the nucleus
would give an accurate reflection of syllable compression since it is predominantly vowels
rather than consonants that are affected by temporal adjustments typical of rapid speech
or greater foot-length (cf. Fowler 1981b). Listeners are also more sensitive to durational
changes in vowels than in consonants (Carlson and Granstrom 1975), so it makes sense to
focus attention on durational changes in the syllable nuclei.
A repeated measures ANOVA was performed for each formant frequency sepa-
rately, and for the vowel-duration data.
6.6 Results and Discussion
6.6.1 The effect of foot-length on vowel durations
Figure 6.2 shows the duration of stressed and unstressed syllable nuclei in feet of
different lengths. As predicted, both stressed and unstressed vowels are shorter in longer
feet (F(3,6)=66.346, p < 0.0001, F(3,6)=21.155, p < 0.0001 respectively). Contrary to
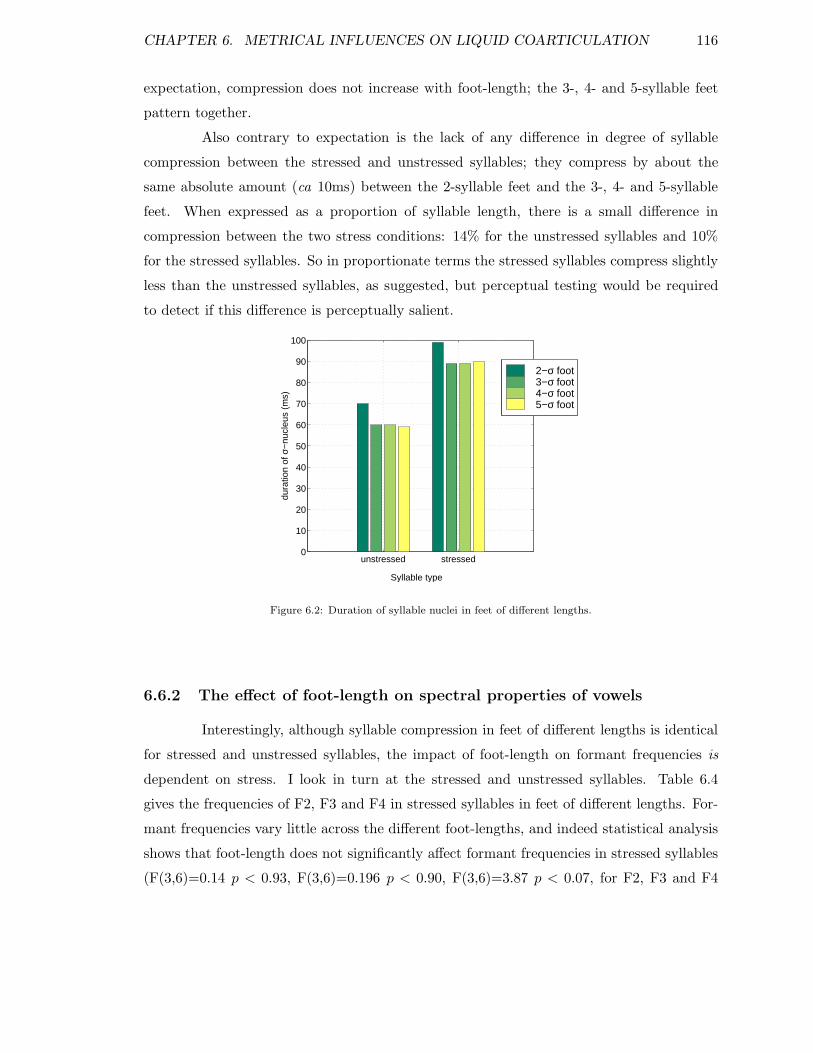
CHAPTER 6. METRICAL INFLUENCES ON LIQUID COARTICULATION 116
expectation, compression does not increase with foot-length; the 3-, 4- and 5-syllable feet
pattern together.
Also contrary to expectation is the lack of any difference in degree of syllable
compression between the stressed and unstressed syllables; they compress by about the
same absolute amount (ca 10ms) between the 2-syllable feet and the 3-, 4- and 5-syllable
feet. When expressed as a proportion of syllable length, there is a small difference in
compression between the two stress conditions: 14% for the unstressed syllables and 10%
for the stressed syllables. So in proportionate terms the stressed syllables compress slightly
less than the unstressed syllables, as suggested, but perceptual testing would be required
to detect if this difference is perceptually salient.
Syllable type
unstressed stressed0
10
20
30
40
50
60
70
80
90
100
dura
tion
of σ
−nu
cleu
s (m
s)
2−σ foot3−σ foot4−σ foot5−σ foot
Figure 6.2: Duration of syllable nuclei in feet of different lengths.
6.6.2 The effect of foot-length on spectral properties of vowels
Interestingly, although syllable compression in feet of different lengths is identical
for stressed and unstressed syllables, the impact of foot-length on formant frequencies is
dependent on stress. I look in turn at the stressed and unstressed syllables. Table 6.4
gives the frequencies of F2, F3 and F4 in stressed syllables in feet of different lengths. For-
mant frequencies vary little across the different foot-lengths, and indeed statistical analysis
shows that foot-length does not significantly affect formant frequencies in stressed syllables
(F(3,6)=0.14 p < 0.93, F(3,6)=0.196 p < 0.90, F(3,6)=3.87 p < 0.07, for F2, F3 and F4
CHAPTER 6. METRICAL INFLUENCES ON LIQUID COARTICULATION 117
respectively). The difference in F4 frequency approaches significance and Table 6.4 shows
that there is some change in this formant frequency over the different foot-lengths. How-
ever, the change in formant frequency does not seem to correlate in any way with increasing
foot-length. It was sometimes difficult to locate F4 in the spectra and so the variation here
probably arises due to inaccuracies in the measurement of this formant frequency. Such
small fluctuations in the frequency of F4 are also likely to be imperceptible.
Foot-length
2-σ 3-σ 4-σ 5-σ
F2 1895 1894 1894 1887
F3 2806 2795 2793 2796
F4 3836 3859 3893 3874
Table 6.4: F2, F3 and F4 frequencies in stressed vowels in feet of different lengths.
Turning to the unstressed syllables, we do find an impact of foot-length on the
spectral characteristics of some syllable-nuclei. The /rV/ and /lV/ syllables are examined
separately, as rather different patterns of formant frequency variation are apparent in each.
Figure 6.3 shows F2, F3 and F4 frequencies measured mid-vowel in /rV/ and /lV/
sequences in feet of different lengths. In the /rV/ syllables both F3 and F4 frequencies are
lower in the 3-, 4- and 5-syllable feet than in the 2-syllable feet (F(3,6)=8.478, p < 0.05
and F(3,6)=36.537, p < 0.001). As with the temporal data, the impact of foot-length on
spectral characteristics is not incremental: the 3-, 4- and 5-syllable feet generally pattern
together. It may seem in Figure 6.3 that F3 and F4 frequencies in vowels in /rV/ sequences
in the 4-syllable feet are rather higher than in the 3- and 5-syllable feet. However, planned
comparisons for the 4-syllable feet vs. 3- and 5-syllable feet show any such difference to
be statistically insignificant (F(3,6)=2.12, p < 0.2, F(3,6)=1, p < 0.36, for F3 and F4
respectively).
In the /lV/ syllables F3 shows the most obvious impact of foot-length on for-
mant frequency: it is lower in the 3-, 4- and 5-syllable feet than in the 2-syllable feet
(F(3,6)=15.656, p < 0.01). At first sight there appears to be relatively little variation in
F2 frequency, but it is on average 41 Hz higher in the 2-syllable feet than in the 3-, 4- or
5-syllable feet (F(3,6)=16.48, p < 0.01). F4 also varies somewhat in frequency with foot-
CHAPTER 6. METRICAL INFLUENCES ON LIQUID COARTICULATION 118
Foot length
Fre
quen
cy (
Hz)
/rV/ /lV/
F2
F3
F4
1500
1750
2000
2400
2650
2900
3500
3750
4000
2-σ2-σ 3-σ3-σ 4-σ4-σ 5-σ5-σ
Figure 6.3: F2, F3 and F4 frequencies in unstressed vowels in /rV/ and /lV/ sequences in feet of different lengths.
length, being higher in the 4-syllable foot than in any of the others (F(3,6)=8.68, p < 0.03).
It is unclear why this should be the case, but again difficulties in accurately measuring F4
may mean that this is simply an anomaly rather than a systematic effect.
Summary of spectral findings
Where foot-length has a significant impact on formant frequency, the tendency is
for the formant to be lower in feet of 3 or more syllables. This is in accordance with an
explanation based on the time it takes for articulators to achieve their targets. Articula-
tory undershoot was used to explain some of the patterns of formant frequency variation
found in vowels after different consonant clusters in Chapter 5, and a similar explanation
can be invoked here. Again, in order to predict the acoustic consequences of articulatory
undershoot we have to compare formant frequencies in the consonants and in the vowels of
interest.
Both F3 and F4 frequencies are lower in /r/ than in vowels, so where syllable nuclei
are shorter and there is less time for articulators to reach their targets, both these formants
tend to be lower than in longer syllables. This experiment shows that vowel durations are
shorter in longer feet, and these shorter vowels show greater r-induced formant frequency
lowering in F3 and F4. F2 is also lower in /r/ than in the vowels here and it is not clear
why this formant frequency does not show any sign of undershoot.
F2 and F3 frequencies in /l/ are also slightly lower than in /i: I @/, and both are
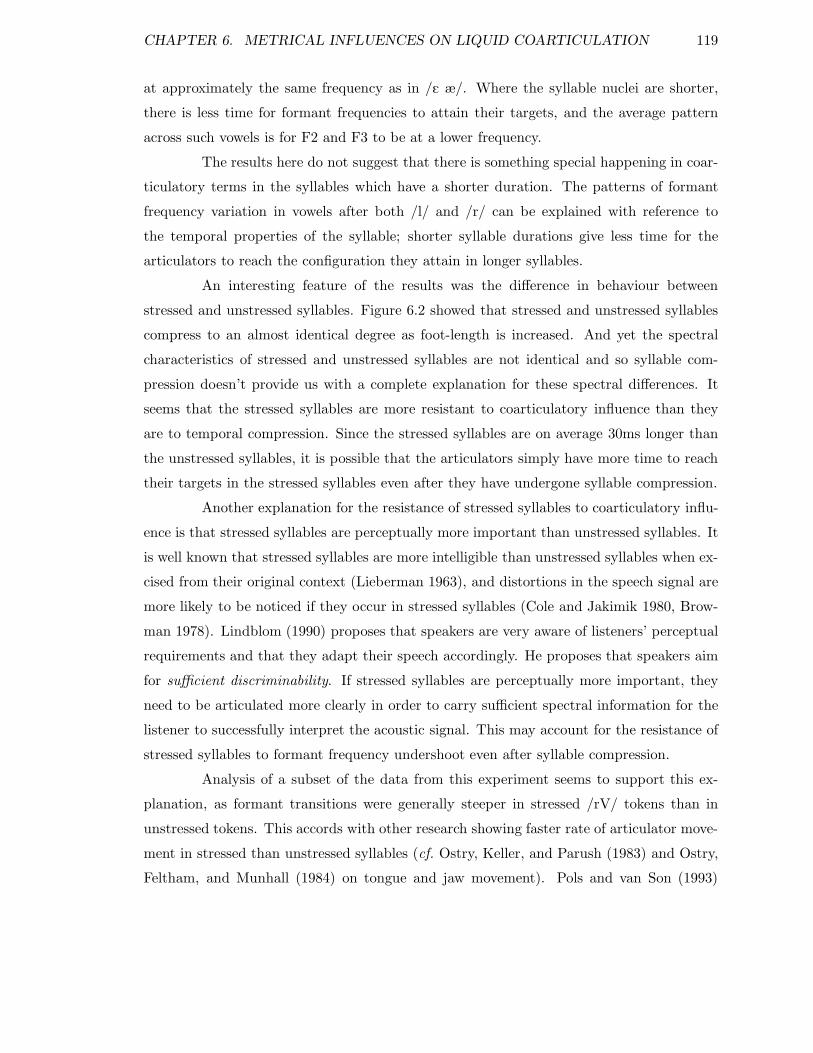
CHAPTER 6. METRICAL INFLUENCES ON LIQUID COARTICULATION 119
at approximately the same frequency as in /E æ/. Where the syllable nuclei are shorter,
there is less time for formant frequencies to attain their targets, and the average pattern
across such vowels is for F2 and F3 to be at a lower frequency.
The results here do not suggest that there is something special happening in coar-
ticulatory terms in the syllables which have a shorter duration. The patterns of formant
frequency variation in vowels after both /l/ and /r/ can be explained with reference to
the temporal properties of the syllable; shorter syllable durations give less time for the
articulators to reach the configuration they attain in longer syllables.
An interesting feature of the results was the difference in behaviour between
stressed and unstressed syllables. Figure 6.2 showed that stressed and unstressed syllables
compress to an almost identical degree as foot-length is increased. And yet the spectral
characteristics of stressed and unstressed syllables are not identical and so syllable com-
pression doesn’t provide us with a complete explanation for these spectral differences. It
seems that the stressed syllables are more resistant to coarticulatory influence than they
are to temporal compression. Since the stressed syllables are on average 30ms longer than
the unstressed syllables, it is possible that the articulators simply have more time to reach
their targets in the stressed syllables even after they have undergone syllable compression.
Another explanation for the resistance of stressed syllables to coarticulatory influ-
ence is that stressed syllables are perceptually more important than unstressed syllables. It
is well known that stressed syllables are more intelligible than unstressed syllables when ex-
cised from their original context (Lieberman 1963), and distortions in the speech signal are
more likely to be noticed if they occur in stressed syllables (Cole and Jakimik 1980, Brow-
man 1978). Lindblom (1990) proposes that speakers are very aware of listeners’ perceptual
requirements and that they adapt their speech accordingly. He proposes that speakers aim
for sufficient discriminability. If stressed syllables are perceptually more important, they
need to be articulated more clearly in order to carry sufficient spectral information for the
listener to successfully interpret the acoustic signal. This may account for the resistance of
stressed syllables to formant frequency undershoot even after syllable compression.
Analysis of a subset of the data from this experiment seems to support this ex-
planation, as formant transitions were generally steeper in stressed /rV/ tokens than in
unstressed tokens. This accords with other research showing faster rate of articulator move-
ment in stressed than unstressed syllables (cf. Ostry, Keller, and Parush (1983) and Ostry,
Feltham, and Munhall (1984) on tongue and jaw movement). Pols and van Son (1993)
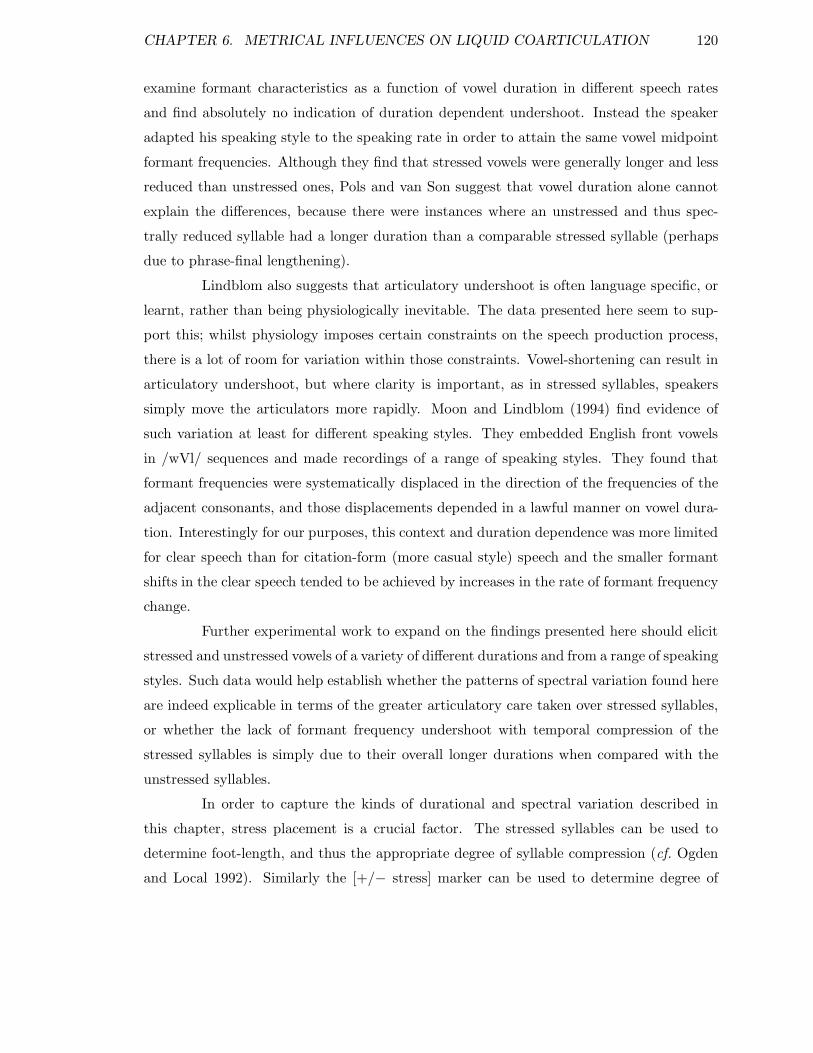
CHAPTER 6. METRICAL INFLUENCES ON LIQUID COARTICULATION 120
examine formant characteristics as a function of vowel duration in different speech rates
and find absolutely no indication of duration dependent undershoot. Instead the speaker
adapted his speaking style to the speaking rate in order to attain the same vowel midpoint
formant frequencies. Although they find that stressed vowels were generally longer and less
reduced than unstressed ones, Pols and van Son suggest that vowel duration alone cannot
explain the differences, because there were instances where an unstressed and thus spec-
trally reduced syllable had a longer duration than a comparable stressed syllable (perhaps
due to phrase-final lengthening).
Lindblom also suggests that articulatory undershoot is often language specific, or
learnt, rather than being physiologically inevitable. The data presented here seem to sup-
port this; whilst physiology imposes certain constraints on the speech production process,
there is a lot of room for variation within those constraints. Vowel-shortening can result in
articulatory undershoot, but where clarity is important, as in stressed syllables, speakers
simply move the articulators more rapidly. Moon and Lindblom (1994) find evidence of
such variation at least for different speaking styles. They embedded English front vowels
in /wVl/ sequences and made recordings of a range of speaking styles. They found that
formant frequencies were systematically displaced in the direction of the frequencies of the
adjacent consonants, and those displacements depended in a lawful manner on vowel dura-
tion. Interestingly for our purposes, this context and duration dependence was more limited
for clear speech than for citation-form (more casual style) speech and the smaller formant
shifts in the clear speech tended to be achieved by increases in the rate of formant frequency
change.
Further experimental work to expand on the findings presented here should elicit
stressed and unstressed vowels of a variety of different durations and from a range of speaking
styles. Such data would help establish whether the patterns of spectral variation found here
are indeed explicable in terms of the greater articulatory care taken over stressed syllables,
or whether the lack of formant frequency undershoot with temporal compression of the
stressed syllables is simply due to their overall longer durations when compared with the
unstressed syllables.
In order to capture the kinds of durational and spectral variation described in
this chapter, stress placement is a crucial factor. The stressed syllables can be used to
determine foot-length, and thus the appropriate degree of syllable compression (cf. Ogden
and Local 1992). Similarly the [+/− stress] marker can be used to determine degree of
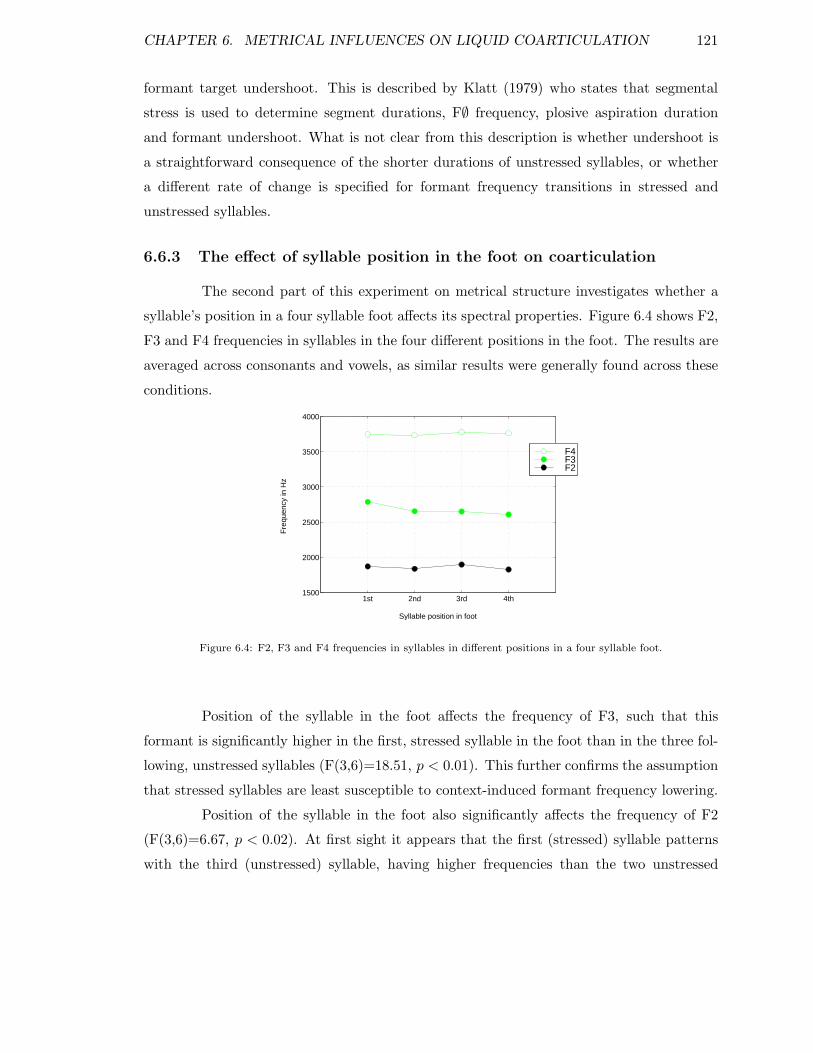
CHAPTER 6. METRICAL INFLUENCES ON LIQUID COARTICULATION 121
formant target undershoot. This is described by Klatt (1979) who states that segmental
stress is used to determine segment durations, F∅ frequency, plosive aspiration duration
and formant undershoot. What is not clear from this description is whether undershoot is
a straightforward consequence of the shorter durations of unstressed syllables, or whether
a different rate of change is specified for formant frequency transitions in stressed and
unstressed syllables.
6.6.3 The effect of syllable position in the foot on coarticulation
The second part of this experiment on metrical structure investigates whether a
syllable’s position in a four syllable foot affects its spectral properties. Figure 6.4 shows F2,
F3 and F4 frequencies in syllables in the four different positions in the foot. The results are
averaged across consonants and vowels, as similar results were generally found across these
conditions.
Syllable position in foot
Fre
quen
cy in
Hz
1st 2nd 3rd 4th1500
2000
2500
3000
3500
4000
F4F3F2
Figure 6.4: F2, F3 and F4 frequencies in syllables in different positions in a four syllable foot.
Position of the syllable in the foot affects the frequency of F3, such that this
formant is significantly higher in the first, stressed syllable in the foot than in the three fol-
lowing, unstressed syllables (F(3,6)=18.51, p < 0.01). This further confirms the assumption
that stressed syllables are least susceptible to context-induced formant frequency lowering.
Position of the syllable in the foot also significantly affects the frequency of F2
(F(3,6)=6.67, p < 0.02). At first sight it appears that the first (stressed) syllable patterns
with the third (unstressed) syllable, having higher frequencies than the two unstressed
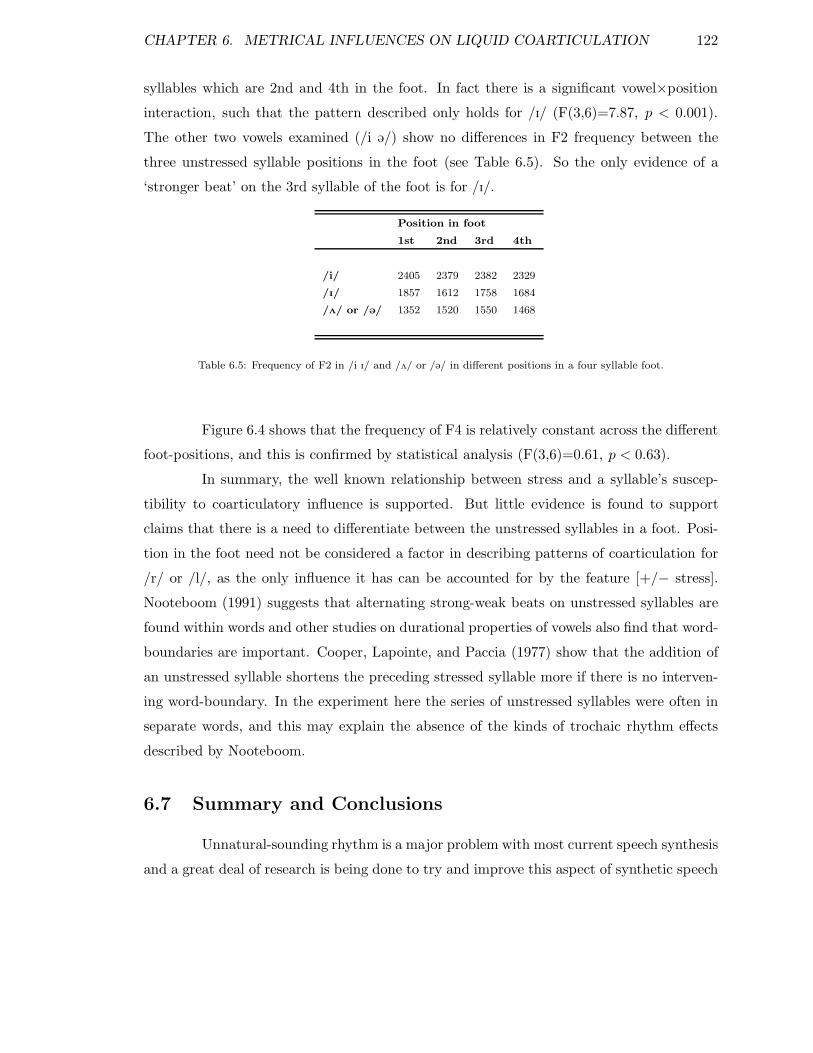
CHAPTER 6. METRICAL INFLUENCES ON LIQUID COARTICULATION 122
syllables which are 2nd and 4th in the foot. In fact there is a significant vowel×position
interaction, such that the pattern described only holds for /I/ (F(3,6)=7.87, p < 0.001).
The other two vowels examined (/i @/) show no differences in F2 frequency between the
three unstressed syllable positions in the foot (see Table 6.5). So the only evidence of a
‘stronger beat’ on the 3rd syllable of the foot is for /I/.
Position in foot
1st 2nd 3rd 4th
/i/ 2405 2379 2382 2329
/I/ 1857 1612 1758 1684
/2/ or /@/ 1352 1520 1550 1468
Table 6.5: Frequency of F2 in /i I/ and /2/ or /@/ in different positions in a four syllable foot.
Figure 6.4 shows that the frequency of F4 is relatively constant across the different
foot-positions, and this is confirmed by statistical analysis (F(3,6)=0.61, p < 0.63).
In summary, the well known relationship between stress and a syllable’s suscep-
tibility to coarticulatory influence is supported. But little evidence is found to support
claims that there is a need to differentiate between the unstressed syllables in a foot. Posi-
tion in the foot need not be considered a factor in describing patterns of coarticulation for
/r/ or /l/, as the only influence it has can be accounted for by the feature [+/− stress].
Nooteboom (1991) suggests that alternating strong-weak beats on unstressed syllables are
found within words and other studies on durational properties of vowels also find that word-
boundaries are important. Cooper, Lapointe, and Paccia (1977) show that the addition of
an unstressed syllable shortens the preceding stressed syllable more if there is no interven-
ing word-boundary. In the experiment here the series of unstressed syllables were often in
separate words, and this may explain the absence of the kinds of trochaic rhythm effects
described by Nooteboom.
6.7 Summary and Conclusions
Unnatural-sounding rhythm is a major problem with most current speech synthesis
and a great deal of research is being done to try and improve this aspect of synthetic speech

CHAPTER 6. METRICAL INFLUENCES ON LIQUID COARTICULATION 123
(cf. Jokisch, Hirschfeld, Eichner, and Hoffman 1998 and Febrer, Padrell, and Bonafonte
1998). However, the focus of such work is usually exclusively on temporal properties of the
speech signal, so this chapter sought to link work on the durational properties of speech with
spectral variation. The experiment reported here explored interactions between metrical
structure and the temporal and spectral properties of individual syllables and emphasised
the importance of linking our understanding of suprasegmental and segmental phenomena.
No evidence was found to suggest that the unstressed syllables in a foot behaved differently
in terms of their coarticulatory behaviour. It is possible that effects might be found for
sequences of unstressed syllables within words, but further experimental work is needed to
explore this. The experiment did reveal effects of foot-length on both temporal and spectral
properties and these are summarised below.
As predicted, longer feet had shorter syllables. However, syllable compression was
not incremental; 3-, 4- and 5-syllable feet patterned together, having syllables that were
shorter than those in 2-syllable feet. Although this is contrary to the initial prediction, the
finding is in accordance with Yang (1998) who finds that syllable compression with added
syllables in street names is not linear, but is strongest as one progresses to words up to
3 syllables in length and then flattens out for words with more than 3 syllables (cf. also
Port 1981). Yang suggests that this supports Klatt’s (1973) idea of the incompressibility of
phonemes beyond a certain minimum duration. While there may be an upper limit on sylla-
ble compression where the determining factor is foot-length and the tendency to isochrony,
the same notion of incompressibility may well not hold where syllable durations are short-
ened in rapid or casual speech. Acoustic studies using a variety of speech styles might
profitably examine syllable durations to see if similar nonlinear principles of compression
hold as in the foot-length experiment described here.
Also contrary to expectation was the fact that the degree of syllable compression
was almost identical in stressed and unstressed conditions. Given this result, perhaps the
most interesting finding in this experiment was that stressed and unstressed syllables did not
behave identically in terms of their spectral properties in feet of different lengths. Stressed
syllables showed no significant effect of foot-length on any of the formant frequencies exam-
ined. Some unstressed syllables, on the other hand, had lower formant frequencies in longer
feet. This was true of F3 and F4 in /rV/ syllables, and F2 and F3 in /lV/ syllables.
The lowering of some formant frequencies in longer feet seems to be a natural
consequence of syllable compression, which occurs as foot-length increases and which results
CHAPTER 6. METRICAL INFLUENCES ON LIQUID COARTICULATION 124
in articulatory undershoot. Two explanations were proposed for the fact that syllable
compression did not produce formant frequency undershoot in stressed syllables. First,
since stressed syllables are longer than unstressed syllables, it is possible that there is simply
more time for articulators to reach their targets. A second possibility is that, since stressed
syllables are perceptually more important, speakers make more of an effort to articulate
clearly and thus attain formant frequency targets in such syllables. The latter explanation
was felt to be more likely.
This chapter highlights some interesting interactions between the temporal and
spectral properties of syllables. An important question for speech synthesis research is to
what extent spectral variation can be produced in synthetic speech by accurate modelling
of durational effects. The work on modelling rhythm in the Yorktalk synthesis system has
shown that getting temporal detail right can significantly improve the intelligibility and
naturalness of the synthetic speech produced (Ogden and Local 1992 and 1996). The data
presented in this chapter suggests that if the timing is right, the spectral characteristics of
the synthetic speech will also be improved.
125
Chapter 7
Concluding Remarks
This thesis began by describing how synthetic speech is disproportionately fragile
in background noise and performs less well than natural speech in tests of memory and
comprehension. It was suggested that some of the failings of synthetic speech are closely
related to its unnatural sound quality and that by improving the naturalness of synthetic
speech we will also improve its intelligibility, both at the segmental level and in tests of higher
level comprehension. One aspect of speech which seems to be important to naturalness is
the systematic context-induced segmental variability, which arises as a natural consequence
of vocal tract dynamics, or which is at least expected to some extent by speakers of a
particular language or dialect.
This thesis explored some relatively subtle aspects of coarticulatory variation in
English, which are not modelled in most current text-to-speech synthesis systems. An initial
production study established some patterns of acoustic variation in vowels in /C1 V C2 @/
sequences, where C1 is either /r/ or /l/. A perceptual experiment showed that synthetic
speech which contains such context-induced spectral variation is more intelligible in back-
ground noise than synthetic speech which lacks these effects. Having established the per-
ceptual salience of this kind of small-scale coarticulatory detail in synthetic speech, the
remainder of the thesis consisted of production studies which were designed to refine our
understanding of patterns of coarticulatory variation. These studies looked in greater detail
at long-domain lingual resonance effects, at the behaviour of vowels after consonant clus-
ters and at the interaction between metrical structure and coarticulation. In this chapter I
discuss some of the main themes of the experimental work and bring together some of the
findings which were discussed in separate chapters.
CHAPTER 7. CONCLUDING REMARKS 126
7.1 Susceptibility to coarticulatory influence
Prosodic phonologists use /r/ and /l/ as examples of consonants which exert an
influence over long stretches of the speech signal, with effects spreading throughout a syllable
and beyond, and /i/ is often cited as a sound which is particularly susceptible to such
context-induced variation (Kelly 1989). However, relatively little experimental work had
been done to corroborate these claims. The variability of /i/ in particular seemed surprising,
given that many other researchers suggest that /i/ is an extremely stable vowel in both
articulatory and acoustic terms (cf. Recasens 1987). Taking this apparent contradiction
as a starting point for an investigation into patterns of coarticulatory variation in English,
Chapter 2 described acoustic variation in four front vowels /i I E æ/ after /r/ and /l/, using
/h/ as a neutral standard of comparison.
/l/ exerted very little influence over following vowels, although F2 frequencies
were slightly lower in /I/ and /E/ after /l/ than after /h/. Very clear patterns of r-induced
formant frequency lowering were found for F2 and F3 in vowels after /r/ compared with
those after /h/. The vowels were not equally susceptible to rhotic influence; greatest r-
colouring was found in /I/, rather less in /i/ and /E/ and least in /æ/. Not surprisingly,
since /I/ is the vowel most influenced by r-colouring, it is also a vowel which permits the
spread of rhotic influence to non-adjacent segments. The experiment found evidence of F2
frequency lowering in the schwa in /r I C @/ sequences but not in any other preceding vowel
contexts.
The results from this first experiment on coarticulatory variation show how difficult
it is to predict susceptibility to coarticulatory influence. Most empirical work to date had
suggested that /i/ is relatively impervious to context-induced variation, but this experiment
supports the prosodic phonologists’ claims, finding /i/ to be just as prone to r-colouring
as /E/. The putative correlation between tongue-height and resistance to coarticulatory
influence does not apply to the sounds investigated here, as /I/ varies most between /h/
and /r/ contexts, whilst /æ/ varies relatively little. This experiment emphasises how much
more work there is to be done, even to understand coarticulation in simple CV sequences.
This pattern of susceptibility to rhotic influence in high front vowels was also supported
by the work on long-domain resonance effects in Chapter 4. For vowels that are separated
from the influencing rhotic by several segments, unstressed /i/ and /I/ showed signs of
r-colouring whereas schwa was resistant to rhotic influence over this time domain.
CHAPTER 7. CONCLUDING REMARKS 127
Bladon and Al-Bamerni (1976) showed that clear /l/ is less resistant to context-
induced variation than its dark counterpart, and they use an index of coarticulation resis-
tance to describe these differences in the susceptibility or resistance of sounds to contextual
influence. They note that coarticulation resistance specifications may not be language uni-
versal, and this may partially account for the discrepancies described in Chapter 2 between
findings of coarticulation resistance in /i/ in Catalan, Italian, Japanese etc.(cf. Recasens
1985, Farnetani 1990 and Magen 1984) and other research demonstrating the susceptibil-
ity to coarticulatory influence of /i/ in Standard Southern and West Midlands accents of
British English (see Chapter 2 and Kelly 1989). Bladon and Al-Bamerni also note that
coarticulation resistance is highly idiolectal, as shown by Su, Li, and Fu (1974) in their
work on speaker-specific nasal coarticulation in vowels. However, the susceptibility of /i/ to
r-colouring described in Chapter 2 was not speaker-specific, but a systematic effect and the
perceptual study in Chapter 3 demonstrated that this kind of context-induced variability
can contribute to lexical access. So, in order to account for the discrepancy between empir-
ical work showing coarticulatory resistance in /i/ and the experiment here demonstrating
/i/’s susceptibility to r-colouring, it was suggested that a single coarticulation resistance
index for individual sounds is insufficient. Instead susceptibility or resistance to coarticula-
tory influence may be highly context specific; high front vowels may well be very stable in
many phonetic contexts, but /r/ seems to exert a strong influence over these sounds.
In terms of incorporating patterns of coarticulatory variation in text-to-speech
synthesis systems, a single r-colouring algorithm for all vowels would fail to capture these
differences in the coarticulatory resistance of sounds to contextual influence. In the syn-
thesis experiment described in Chapter 3 the coarticulatory variation was incorporated in
synthetic speech by a process of hand-editing based on formant frequency measurements
made in natural speech. Having established that this kind of context-induced variation
can contribute to the intelligibility of synthetic speech, the next stage would be to write
rules which would produce appropriate formant frequency variation in each of the vowels
examined here.
7.2 Long-domain rhotic resonance effects
Chapter 4 explored the spread of rhotic resonance effects over longer stretches of
the speech signal, examining /V C V r/ and /r V C V/ sequences. Not surprisingly, stressed
CHAPTER 7. CONCLUDING REMARKS 128
vowels which were not directly adjacent to the influencing /r/ proved to be completely
resistant to coarticulatory influence from the /r/. But unstressed vowels had lower F2 and
F3 frequencies in the non-adjacent context of /r/. Perhaps most interesting was the finding
that this r-colouring in non-adjacent vowels seemed to encourage greater rhotic influence on
adjacent vowels. For instance, if V1 is unstressed in the sequence /V1 C V2 r/, V2 has lower
F2 and F3 frequencies than where V1 is stressed. Similar effects are found in /r V3 C V4/
sequences. Again, where V4 is unstressed and therefore susceptible to rhotic influence, this
encourages greater r-colouring in both stressed and unstressed instances of V3. It seems
that r-colouring in the non-adjacent vowels reinforces r-colouring in vowels directly adjacent
to the rhotic consonant.
This result suggests complex interactions between segments over long stretches of
the speech signal and highlights the difficulty of modelling this kind of coarticulatory detail
in the rules for text-to-speech systems. This finding also demonstrates the limitations of
concatenative synthesis, as it is extremely hard to define a temporal domain for the extent
of coarticulatory influence. In order to capture the kinds of effect just described one would
either need very long units, or the ability to manipulate parameters in shorter units depend-
ing on the properties of surrounding syllables. Not surprisingly, speech synthesis systems
do not generally capture context-induced variation spreading over such long stretches of the
speech signal, and these kinds of coarticulatory effects are rather poorly understood.
As stated, the influence of /r/ on non-adjacent vowels was primarily evident in F3
frequency lowering, although F2 frequency was also slightly lower in non-adjacent r-contexts.
F4 frequency did not vary significantly between non-adjacent /r/ and /h/ contexts. Stevens
(1998) states that low F4 or F5 is related to tongue-tip retroflexion and so it seems that
tongue-tip retroflexion does not spread across intervening segments, whereas retroflexion is
a factor in the influence of /r/ on vowels in both /Vr/ and /rV/ sequences. The acoustic
variation described for F2 and F3 in non-adjacent vowels, therefore, appears to be primarily
due to tongue-body or lip-rounding effects. Support for this is found in West (1999) who
compares /@1 d @2 r/ and /@1 d @2 l/ sequences and finds lower F3 frequency and evidence
of lip-rounding and a higher mid-tongue position in /@1/ in the non-adjacent context of
/r/. This suggests that rhotic effects spreading over several segments involve tongue-body
raising and lip-rounding. These effects are rather different to local rhotic coarticulation in
CV sequences, which involves some degree of tongue-tip retroflexion, as indicated by F4
frequency lowering.
CHAPTER 7. CONCLUDING REMARKS 129
These findings accord with Ohman’s (1966) x-ray data for Swedish and English
VCVs, which show that tongue-body shape for the second vowel is anticipated very early
in the first vowel, while the gesture for a /d/ or /g/ can be regarded as a short-term
perturbation superimposed on the more long-term tongue-body configuration for the vowels
(cf. also Perkell and Cohen 1997). Ohman suggested that vowel gestures are independent
to some extent from consonantal gestures and in later work he was able to capture the
quasi independent apical and dorsal tongue systems in a numerical model of coarticulation,
although he also pointed out that it had limitations (Ohman 1967).
Ohman claims that vowel-to-vowel tongue-body coarticulation is blocked in VCVs
in Russian, which contrasts velarized and palatalized consonants and thus imposes tongue-
body configuration requirements on the intervening consonant. However, provided the
articulatory requirements of the intervening segments do not prohibit it, tongue-body effects
will generally spread over longer stretches of the speech signal than tongue-tip effects and
this is explicable in terms of the slower capacity for movement of the tongue-body compared
with the tongue-tip. It is generally accepted that the variety of English /r/ studied in this
thesis involves either tongue-tip retroflexion, or tongue bunching, or both, and so can be
viewed as combining vocalic and consonantal articulatory features. The data presented here
suggest that English /r/ can have a significant effect both locally, and over longer domains,
in which the influenced segments are separated from the rhotic consonant by several other
phonemes. As computer models of tongue dynamics become more sophisticated (cf. Kakita,
Fujimura, and Honda 1985, Wilhelms-Tricarico and Perkell 1994) it would be worthwhile
exploring the differences between these quasi-independent tongue systems: such models
may assist predictions about domains of coarticulatory influence, but to date they don’t
seem to have addressed this type of issue.
The extent of the formant frequency variation described for non-adjacent vowels in
Chapter 4 is relatively small, but in combination with the larger effects in adjacent vowels,
such acoustic detail is likely to be perceptually salient. It was also pointed out, that one
reason for the relatively small scale of the long-domain effects described here is that the
speech-style elicited for the experiment was careful and relatively slow. It seems fair to
assume that long-domain coarticulatory variation would be far more marked in casual or
rapid speech, and it seems likely to be crucial if such speech styles are to be successfully
modelled by text-to-speech systems. Granstrom (1992) points out that users of speech
synthesisers are now demanding both more natural speech and a variety of speech styles. In
CHAPTER 7. CONCLUDING REMARKS 130
particular, fast synthetic speech which is highly intelligible is a key requirement of visually
impaired users of reading machines.
7.3 Temporal variation and coarticulatory effects
The experiments in Chapters 5 and 6 described segmental and metrical influences
on vowel duration and explored the consequent effects on spectral characteristics.
7.3.1 Segmental influences on timing
Chapter 5 explored the durational and spectral properties of vowels after a series of
consonant clusters. Very little work has been done on the coarticulatory influence of different
clusters on the spectral characteristics of vowels, and van Santen (1992a) highlighted the
lack of work on vowel durations after consonant clusters, although rather more has been
done on anticipatory effects. So this chapter provided new information regarding both
formant frequency and temporal variation in vowels after clusters. Most interesting was the
apparently neat relationship between the two.
The cluster experiment showed that vowels get progressively shorter, the more
elements there are in the syllable onset. So vowels are longest after singleton /r/, shorter
after velar+r and alveolar+r and shortest of all after /str/ and /skr/. Similarly, vowels
are longer after /l/ than after velar+l. As vowel durations decreased, formant frequencies
generally became lower. This was explained in terms of articulatory undershoot. F2, F3
and F4 frequencies are lower in /r/ than in the vowels examined here, and so where the
articulators have less time to reach their targets this results in formant frequency lowering
in the vowels. A similar effect was found for F2 after /l/, which has a lower F2 frequency
than most of the vowels examined.
7.3.2 Metrical influences on timing
Compared with the paucity of studies on durational properties of vowels after
consonant clusters, a great deal of work has been done investigating the influence of metrical
structure on segment durations. The background to descriptions of English as a stress-timed
language is discussed in detail in Chapter 6. There is at least a tendency in English for
syllables to compress as more unstressed syllables are added to a foot, although other factors
CHAPTER 7. CONCLUDING REMARKS 131
such as syllable weight are also important.
The experiment in Chapter 6 extends work on temporal variation to explore the
spectral characteristics of segments in feet of different lengths. The experiment confirmed
that syllable nuclei are shorter in longer feet. This compression is not incremental: the 3-,
4- and 5-syllable feet patterned together in having shorter syllable nuclei than the 2-syllable
feet. Stressed and unstressed syllables compressed by approximately the same amount in
absolute terms (ca. 10ms), with stressed syllables compressing slightly less in proportional
terms.
Although the behaviour of stressed and unstressed syllables was very similar in
terms of their temporal compression in longer feet, their spectral characteristics were dif-
ferent. The stressed syllables showed no variation in formant frequencies in the feet of
different lengths, even though they were susceptible to syllable compression. On the other
hand, the unstressed syllables had lower F3 and F4 frequencies in vowels after /r/ in the 3-,
4- and 5-syllable feet than in the 2-syllable feet, and a similar pattern is found for F2 and
F3 in the /lV/ sequences. As with the pattern of spectral variation in vowels after different
consonant clusters, the formant frequency variation found in unstressed syllables seems to
be closely related to the temporal variation found for the same syllables. Shorter unstressed
vowels allow less time for the articulators to attain their targets. In the consonant contexts
examined here this articulatory undershoot tends to result in formant frequency lower-
ing. However, in the stressed syllables, temporal compression did not lead to articulatory
undershoot probably because speakers make an effort to make these syllables maximally
intelligible (cf. Lieberman 1963) and so move the articulators more rapidly to attain targets
(cf. Ostry, Keller, and Parush 1983, Ostry, Feltham, and Munhall 1984). This explana-
tion is in accordance with claims that speakers actively control degree of coarticulation and
articulatory undershoot (cf. Lindblom 1990, Moon and Lindblom 1994, Pols and van Son
1993).
7.3.3 Summary: Temporal variation and coarticulatory effects
The experiments on clusters and metrical structure confirm that temporal and
spectral properties are closely related. The formant frequency variation found in these ex-
periments seems to follow naturally from the variation in segment duration; as segments
become shorter, so articulatory undershoot increases. However, stress of the syllable con-
CHAPTER 7. CONCLUDING REMARKS 132
cerned is also a factor, as speakers seem to resist articulatory undershoot in stressed sylla-
bles, even where they permit temporal compression. Most importantly, these experiments
suggest that better modelling of rhythm in synthetic speech can also bring improvements
in the spectral characteristics of the speech signal, as long as unit selection is appropriate
(in concatenative synthesis) and as long as the rules relate undershoot to timing differences
and stress.
7.4 Perceptual salience of coarticulatory detail
As stated, the motivation behind the acoustic measurements presented in this
thesis is to improve both the naturalness and the intelligibility of rule-generated synthetic
speech. The experiment in Chapter 3 tests the perceptual salience of the coarticulatory
variation described in Chapter 2, by comparing synthetic speech which lacks the fine spec-
tral detail with synthetic speech which has been hand-edited to incorporate such effects.
Although problems were encountered with the edited forms of l-context tokens, improve-
ments in intelligibility of 7–28% were found for the edited forms of r-context words when
played in background noise.
Chapter 2 showed that both F2 and F3 in the vowel in /rI/ are lowered to the extent
that their values are lower than those for the more open vowel /E/ in the same consonant
context. One might imagine that this would lead to perceptual confusion. However, this
kind of coarticulatory variation which results in an overlapping of the acoustic characteristics
of phonologically distinctive sounds is common in the speech signal and listeners seem to
have few problems coping with it. The perceptual study here shows that listeners can
utilise such effects to aid lexical access. The key here of course is context. Listeners appear
to know that /I/ in the context of a preceding /r/ may have F2 and F3 frequency lower
than those for /E/ in the same context. Furthermore, if such information is missing, as
in much synthetic speech, the resulting acoustic signal strikes the listener immediately as
being unnatural and is likely to be less robust in difficult listening conditions.
7.4.1 Lexical influences on the salience of coarticulatory detail
Previous work had already suggested that fine coarticulatory detail could improve
the intelligibility of synthetic speech (cf. Hawkins and Slater 1994). Chapter 3 extends such
work by focusing on rhotic and lateral resonance effects, but perhaps most importantly it
CHAPTER 7. CONCLUDING REMARKS 133
explored the influence of lexical and contextual cues on the perceptual salience of coartic-
ulatory detail. Much of the perceptual testing on synthetic speech has used very carefully
controlled experiments focussing on nonsense words in semantically anomalous sentences
(see Chapter 1, Section 1.3). The experiment here investigated whether fine coarticulatory
detail contributed equally to the intelligibility of nonsense words and real words and also
compared the effect of incorporating coarticulatory detail in monosyllabic and polysyllabic
real words. Since polysyllabic words typically have low lexical neighbourhood densities
(few similar sounding words) it was thought that the extra coarticulatory information in
the edited forms might be less helpful than for the monosyllabic real words which have a
greater number of words with which they can potentially be confused.
As predicted, the incorporation of coarticulatory detail resulted in the greatest
improvements in intelligibility in the nonsense word set, where listeners are completely de-
pendent on the acoustic signal for information. However, the polysyllabic real word set,
where small or no changes in intelligibility had been expected after the incorporation of
coarticulatory detail, showed huge variation in intelligibility. Some words had very big im-
provements after editing, for instance the word revenue improved in intelligibility by 21%.
But bereavement, another word in the set, fell in intelligibility by 66% due to inappropriate
editing of the acoustic parameters over the /@ri:vm@/ sequence. So, contrary to expecta-
tions, very small changes in just a small portion of the word seem to have a large impact on
the intelligibility of the remainder of the word, affecting the intelligibility of segments which
were untouched in the editing process. This can result in large improvements in intelligi-
bility where appropriate changes are made, but equally, perceptual coherence is easily lost
if the spectral detail is wrong. This is an important finding, as it highlights the importance
of getting spectral detail right, and of maintaining perceptual coherence. It also demon-
strates that relatively small adjustments to one portion of the acoustic signal can affect the
intelligibility of longer stretches of speech.
7.4.2 Perceptual coherence and perceptual testing
The discussion in the previous section highlights some of the difficulties of percep-
tual testing: changes to one section of the speech signal can have a positive or detrimental
effect on the intelligibility of segments whose acoustic properties have not been changed.
Similarly, changing one acoustic parameter without making appropriate changes to other

CHAPTER 7. CONCLUDING REMARKS 134
parameters may result in a loss of perceptual coherence and a fall in intelligibility. This is
demonstrated in work by Docherty (1992) on differences in the timing of voicing in British
English obstruents. Docherty conducts an experiment where the rules for a text-to-speech
synthesiser are improved to include his findings regarding timing of voicing in obstruents,
however, he fails to find much convincing evidence that this temporal detail improves the
intelligibility of the synthetic speech. Docherty suggests that this is not because such tem-
poral detail is unimportant, but that altering the timing of voicing, whilst leaving other
parameters untouched is rather crude — ideally one would model co-variation of voicing
intensity and other parameters such as burst intensity and level of frication.
It also seems reasonable to suppose that subtle differences between stimuli are
likely to be swamped if the general quality of the synthetic speech is poor. Docherty himself
suggests this, as do more recent experiments. Whereas Ogden, Local, and Carter (1999) get
improvements in intelligibility of around 4% by improving the timing of words in rather poor
quality concatenated synthetic speech, Heid and Hawkins (1999) get improvements of 11%
by introducing far smaller changes to just one or two segment boundaries in high quality
synthetic speech. It has not been established whether these contrasting improvements in
intelligibility in fact reflect the greater importance of segment boundary effects, or whether
it is simply that the improvements brought by better timing were swamped by the poorer
overall quality of the synthetic speech in which they were incorporated, but the latter
explanation seems much the more likely.
The perceptual experiment here avoids some of the pitfalls of perceptual testing,
firstly by careful modifications to the F∅ contour, timing and some of the spectral properties
of the basic synthetic rule-forms, so that the quality of each synthesised sentence is high to
start with. This seems to be crucial if the kind of subtle acoustic detail described here is
to contribute to intelligibility. In Docherty’s experiment a closed response design was used,
which focused on isolated words in good listening conditions, so many of the intelligibility
scores showed ceiling effects. The experiment here used whole sentences, an open-response
format and played the speech in background noise. This made the task sufficiently difficult
that listeners made mistakes and so differences between the rule-generated synthetic speech
and the edited forms could be highlighted.
Furthermore, the context-induced coarticulatory detail of interest was introduced
over a relatively long stretch of the speech signal (/@ C V C @/ sequences), thus maintain-
ing perceptual coherence at least over the edited portion of the signal. Problems were

CHAPTER 7. CONCLUDING REMARKS 135
encountered with the edited portion sounding over-coarticulated, or even as though it had
a different voice quality compared to the rest of the sentence. However, by reducing the de-
gree to which formant frequencies were altered, guided by auditory assessment on the part
of the experimenter and other speakers of SSBE, such problems were generally overcome.
Interestingly, it was found that far smaller changes to formant frequencies were
appropriate in the synthetic speech than suggested by the measurements in natural speech.
It may have been that the natural speech was too casual to work well as a model for the
Infovox-generated speech. Alternatively, it may be that the lack of this type of fine acoustic
detail in the majority of the carrier sentence meant that the sudden introduction of such
detail over a small section of the sentence strikes the listener as odd. This would again
indicate the importance of perceptual coherence in the broadest sense, with listeners being
sensitive to acoustic properties pertaining to whole utterances. At any rate, it was very easy
to lose perceptual coherence by overdoing formant frequency adjustments in the sequence
of interest.
Considerable care was also taken to make appropriate changes to all formant fre-
quencies in the vowels which were thought to be affected by the changing consonant contexts.
Previous work (Tunley 1995) had suggested F1 varied little between /r/ and /l/ contexts,
and so this formant frequency was unchanged. But both F2 and F3 were modified in ac-
cordance with the findings in natural speech. Later experiments (see Chapters 4–6) showed
that F4 is also involved in r-colouring in vowels. Modifying this formant frequency as well,
may have produced even bigger improvements in intelligibility. However, the Infovox system
at that stage of development did not permit modification of F4 separately from formant
frequencies F5 and above. It would be interesting to establish if variations in the frequency
of F4 do indeed contribute to the perceptual coherence and intelligibility of speech.
All of this highlights the care which must be taken in perceptual testing, particu-
larly when the focus is on small-scale acoustic detail. The results suggest that if the quality
of the synthetic speech is relatively good, and if listening conditions are difficult, then rel-
atively subtle changes in the spectral properties of a few sounds can result in significant
improvements in the intelligibility of an even longer portion of the speech signal.
Docherty’s (1992) perceptual experiment included a discrimination task, in which
listeners were asked if they could tell the difference between the stimuli. He failed to find any
reliable evidence that listeners were sensitive to the changes made to the speech synthesis
rules. A discrimination task was not undertaken here, because it was felt that untrained
CHAPTER 7. CONCLUDING REMARKS 136
listeners would be unlikely to be able to tell the difference between the rule and edited forms
of the synthetic speech. The kind of coarticulatory detail described in this thesis is relatively
subtle, and often barely noticeable even to the trained ear. And yet the interesting thing
is that this small-scale acoustic detail does have an effect on the intelligibility of synthetic
speech.
7.4.3 Importance of sensitive and application-oriented perceptual testing
Chapter 1 highlighted some of the shortcomings of traditional perceptual tests.
Ceiling effects were avoided in the perceptual work here by playing the synthetic speech in
background noise, and this also had the advantage of mimicking many real-world situations
in which synthetic speech is used, such as noisy open-plan offices, airports etc. One of
the problems with many of the testing methods used on synthetic speech is that they do
not directly assess the speech in the kinds of contexts in which it is most commonly used.
For instance, O’Malley and Caisse (1987) estimate that about 90% of computer speech
applications involve using the telephone, yet the proportion of telephone intelligibility tests
on synthetic speech is relatively small. Systems that are tailored to perform best with
telephone bandwidth and 8kHz sampling rates cannot be properly tested in quiet rooms
over headphones. Ideally the decrement in the intelligibility of synthetic speech between
good and telephone listening conditions should match that for natural speech. And this
itself is a good general test of the quality of the synthetic speech.
Ultimately end-users are not interested in laboratory testing and the perceptual
experiment presented here was designed to be as realistic and as natural a task as possible,
whilst still providing the experimenter with useful information about the synthetic speech.
Future work might use a range of perceptual tests to assess whether the kind of small-scale
coarticulatory detail under discussion here can assist higher-level comprehension processes
and reduce memory load. Given that fine context-induced acoustic variation can assist
lexical access in difficult listening conditions, it seems likely that this is precisely the kind
of detail which could contribute to perceptual coherence in good listening conditions and
would therefore reduce the cognitive effort required to process synthetic speech.
CHAPTER 7. CONCLUDING REMARKS 137
7.5 Afterword: Combined influences on r-colouring
More extensive and consistent coarticulatory effects were found in vowels after
/r/ than /l/, so this final section focuses exclusively on r-colouring and summarises the
contexts which encourage the spread of rhotic influence. The experiment in Chapter 2
established a hierarchy of susceptibility to rhotic influence for a series of front vowels, such
that /I/ > /i/ ≈ /E/ > /æ/. The long-domain experiment in Chapter 4 showed that
high front vowels /i/ and /I/ were prone to r-colouring even when not directly adjacent
to the influencing consonant, provided they were unstressed. Furthermore where there is
r-colouring in these non-adjacent vowels it reinforces the influence of the rhotic consonant
on vowels directly adjacent to the /r/. In the cluster experiment in Chapter 5, an additional
hierarchy of susceptibility to coarticulatory influence was established: the more segments
there are in the syllable onset, then the shorter the following tautosyllabic vowel and the
greater the r-induced formant frequency lowering, such that /sCr/ > /Cr/ > /r/. Finally,
the experiment in Chapter 6 showed that vowel durations are shorter, and r-induced formant
frequency lowering is greater, in unstressed syllables in feet of 3 or more syllables.
Combining these factors, Figure 7.1 contrasts two phrases which should differ in
their propensity to allow r-colouring to spread. In The "bad "rap "artist (non-rhotic accent,
i.e. /D@ "bæd "ræp "AtIst/), the r-syllable is stressed, has a singleton r-onset followed by an
open vowel and it occurs in a one-syllable foot preceded and followed by stressed syllables.
Together these factors mean that the extent of r-colouring is limited to a single syllable, and
formant frequency lowering in the open vowel /æ/ will be less than in a high front vowel.
By contrast, in the phrase The "tapestry bi"kini (/D@ "tæp@stri bI"kini/), the r-syllable is
unstressed, has a 3-phoneme cluster onset /str/ followed by the high front vowel /i/ and it
is in a 4-syllable foot. The surrounding unstressed syllables will also be prone to r-colouring,
so the temporal domain of r-colouring is greater than in The bad rap artist, and the degree
of formant frequency lowering in /ri/ is greater than in /ræ/.
These sentences themselves raise some interesting questions about factors influ-
encing the spread of r-colouring. Some preliminary work suggests that rhotic influence can
spread through a stressed syllable to a non-adjacent unstressed vowel (Sarah Hawkins, per-
sonal communication). This would mean that the unstressed /@/ in The of The bad rap
artist, might be prone to r-induced formant frequency lowering, even though the vowel in
bad is resistant to these effects. Finally, the experiments in this thesis did not explore the
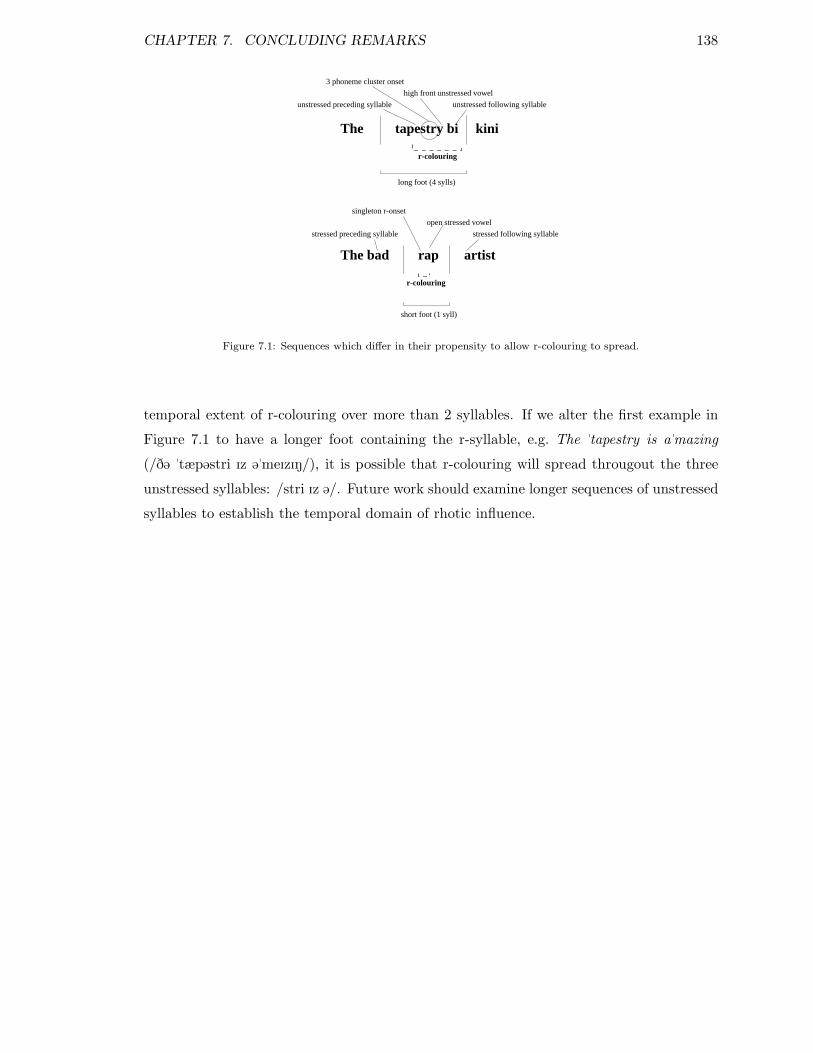
CHAPTER 7. CONCLUDING REMARKS 138
3 phoneme cluster onset
unstressed preceding syllable
high front unstressed vowel
unstressed following syllable
long foot (4 sylls)
tapestry biThe kini
r-colouring
singleton r-onset
stressed preceding syllable
r-colouring
stressed following syllable
open stressed vowel
The bad rap artist
short foot (1 syll)
Figure 7.1: Sequences which differ in their propensity to allow r-colouring to spread.
temporal extent of r-colouring over more than 2 syllables. If we alter the first example in
Figure 7.1 to have a longer foot containing the r-syllable, e.g. The "tapestry is a"mazing
(/D@ "tæp@stri Iz @"meIzIN/), it is possible that r-colouring will spread througout the three
unstressed syllables: /stri Iz @/. Future work should examine longer sequences of unstressed
syllables to establish the temporal domain of rhotic influence.

139
Appendix A
Pre-synthesis production study
A.1 Background to recording
Chapter 3 describes how problems were encountered when the acoustic data from
the production study in Chapter 2 were used as the model for improving synthetic speech.
It was thought that the speech style elicited in that experiment was too casual, and so a
second recording was undertaken, where the speaker was asked to produce a more clear and
careful speech style. The data from that second recording are given in this appendix.
Fillers
There was a funny banging again. John remembered the giraffe was there.
She thought about pineapples constantly. In the end he was out again.
Quickly take it. Eat it.
Next to Jim. Phone Iceland now.
He’s trouble. Magical mist hung over the hills.
The silver chalice had been stolen. Incredible things happened there once.
Take the leather-bound book with you. Imagine something even scarier.
Mr. Hopper took a taxi there. Graham Beckett is a relative of his.
Norman Edwards plays full-back for Leeds. Trevor White mowed the lawn.
Rachel Maddock gave the lecture.
Table A.1: Filler sentences used in the pre-synthesis production study.
The 36 sentences in Table 3.1 (Chapter 3, page 40) were randomized along with 19
fillers (Table A.1) in 10 blocks to obtain 10 repetitions of each target syllable. A single male
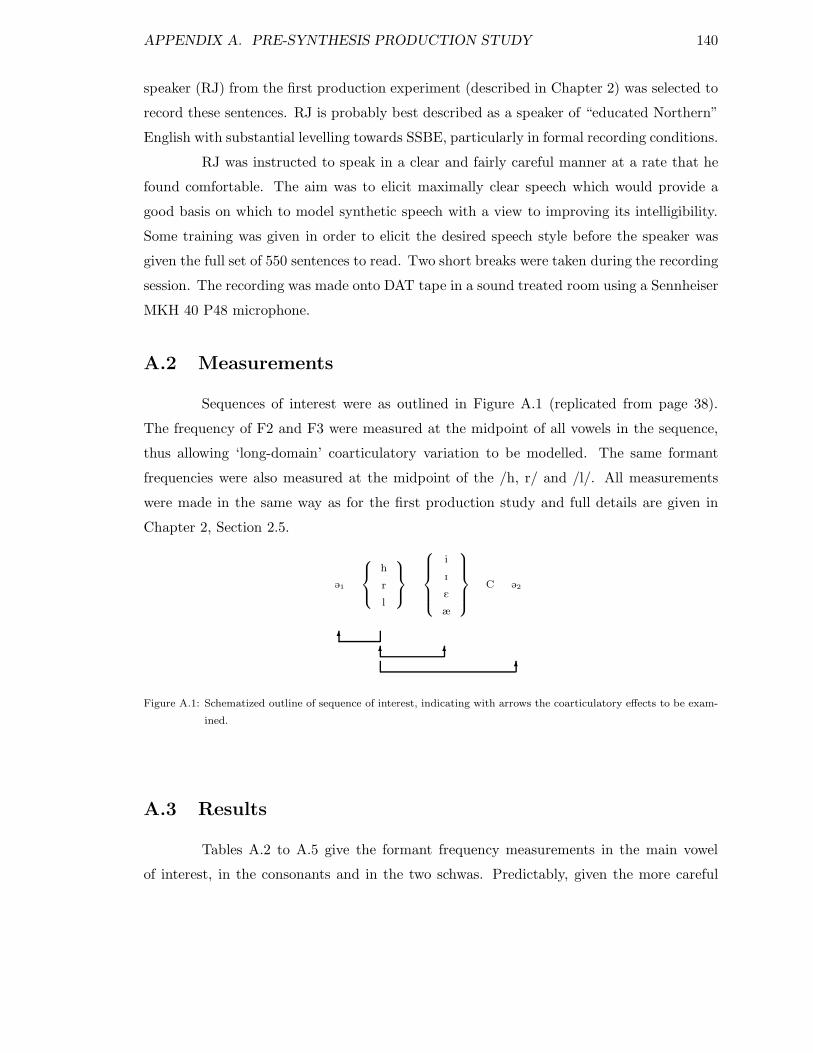
APPENDIX A. PRE-SYNTHESIS PRODUCTION STUDY 140
speaker (RJ) from the first production experiment (described in Chapter 2) was selected to
record these sentences. RJ is probably best described as a speaker of “educated Northern”
English with substantial levelling towards SSBE, particularly in formal recording conditions.
RJ was instructed to speak in a clear and fairly careful manner at a rate that he
found comfortable. The aim was to elicit maximally clear speech which would provide a
good basis on which to model synthetic speech with a view to improving its intelligibility.
Some training was given in order to elicit the desired speech style before the speaker was
given the full set of 550 sentences to read. Two short breaks were taken during the recording
session. The recording was made onto DAT tape in a sound treated room using a Sennheiser
MKH 40 P48 microphone.
A.2 Measurements
Sequences of interest were as outlined in Figure A.1 (replicated from page 38).
The frequency of F2 and F3 were measured at the midpoint of all vowels in the sequence,
thus allowing ‘long-domain’ coarticulatory variation to be modelled. The same formant
frequencies were also measured at the midpoint of the /h, r/ and /l/. All measurements
were made in the same way as for the first production study and full details are given in
Chapter 2, Section 2.5.
@1
h
r
l
i
I
E
æ
C @2
66 6
6
Figure A.1: Schematized outline of sequence of interest, indicating with arrows the coarticulatory effects to be exam-
ined.
A.3 Results
Tables A.2 to A.5 give the formant frequency measurements in the main vowel
of interest, in the consonants and in the two schwas. Predictably, given the more careful
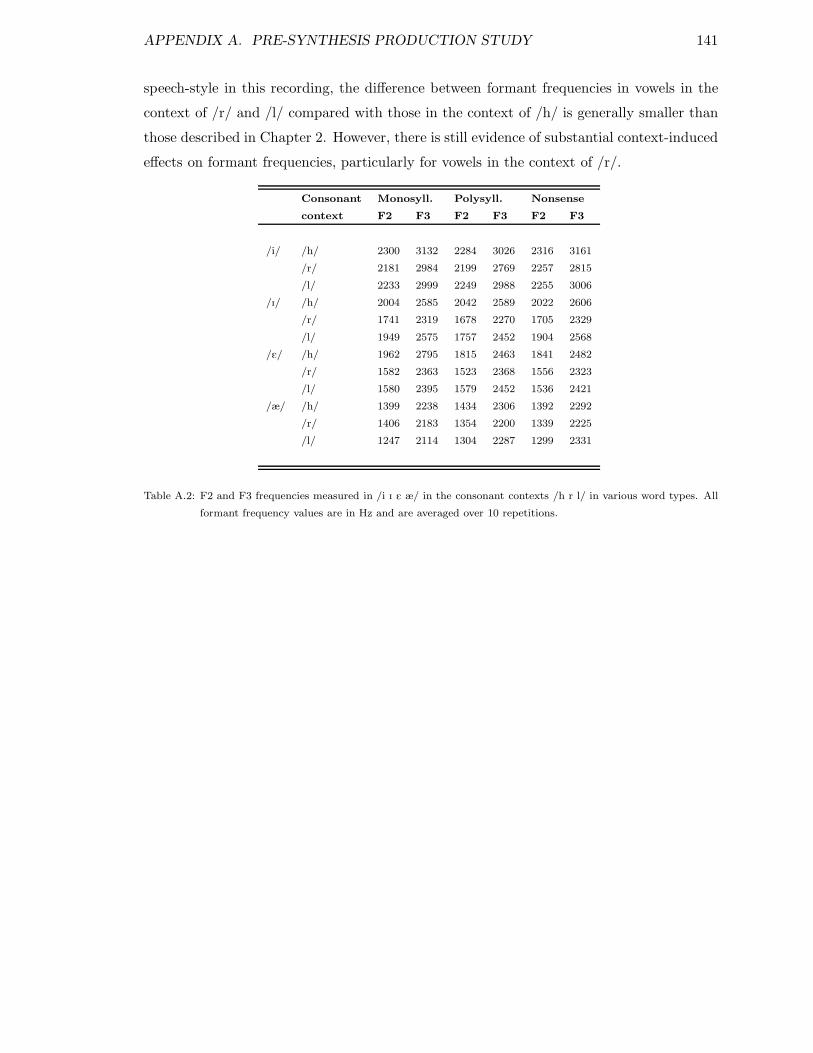
APPENDIX A. PRE-SYNTHESIS PRODUCTION STUDY 141
speech-style in this recording, the difference between formant frequencies in vowels in the
context of /r/ and /l/ compared with those in the context of /h/ is generally smaller than
those described in Chapter 2. However, there is still evidence of substantial context-induced
effects on formant frequencies, particularly for vowels in the context of /r/.
Consonant Monosyll. Polysyll. Nonsense
context F2 F3 F2 F3 F2 F3
/i/ /h/ 2300 3132 2284 3026 2316 3161
/r/ 2181 2984 2199 2769 2257 2815
/l/ 2233 2999 2249 2988 2255 3006
/I/ /h/ 2004 2585 2042 2589 2022 2606
/r/ 1741 2319 1678 2270 1705 2329
/l/ 1949 2575 1757 2452 1904 2568
/E/ /h/ 1962 2795 1815 2463 1841 2482
/r/ 1582 2363 1523 2368 1556 2323
/l/ 1580 2395 1579 2452 1536 2421
/æ/ /h/ 1399 2238 1434 2306 1392 2292
/r/ 1406 2183 1354 2200 1339 2225
/l/ 1247 2114 1304 2287 1299 2331
Table A.2: F2 and F3 frequencies measured in /i I E æ/ in the consonant contexts /h r l/ in various word types. All
formant frequency values are in Hz and are averaged over 10 repetitions.
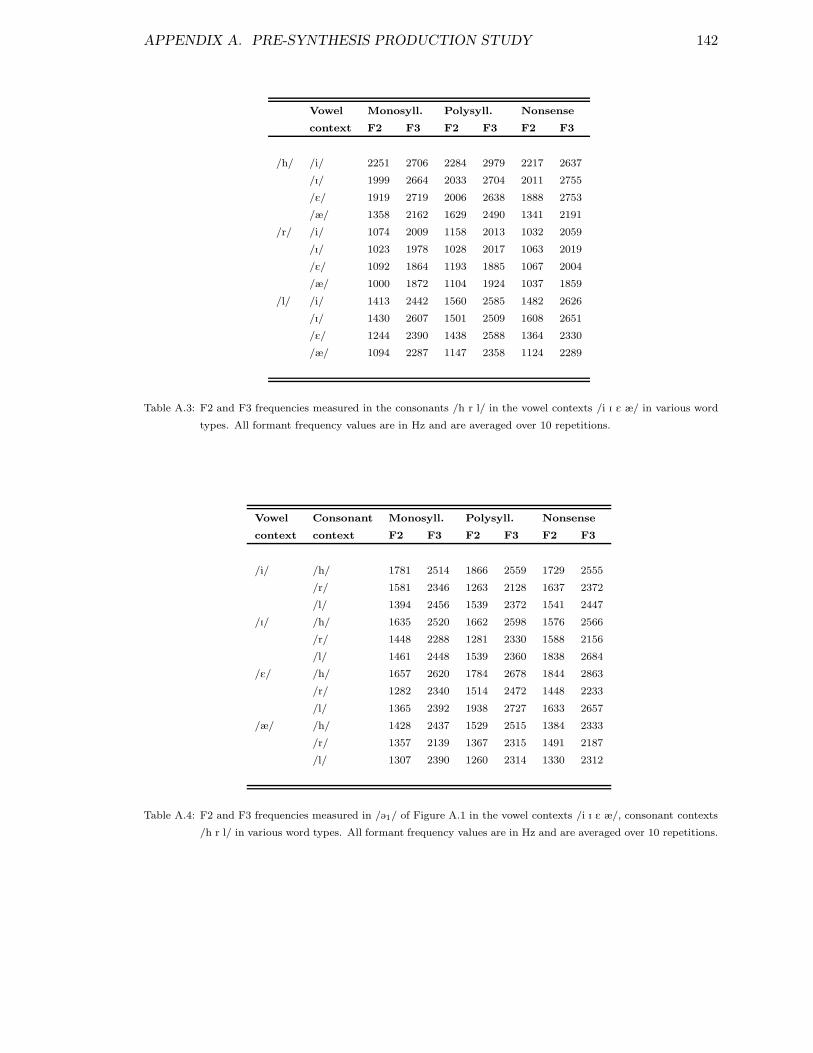
APPENDIX A. PRE-SYNTHESIS PRODUCTION STUDY 142
Vowel Monosyll. Polysyll. Nonsense
context F2 F3 F2 F3 F2 F3
/h/ /i/ 2251 2706 2284 2979 2217 2637
/I/ 1999 2664 2033 2704 2011 2755
/E/ 1919 2719 2006 2638 1888 2753
/æ/ 1358 2162 1629 2490 1341 2191
/r/ /i/ 1074 2009 1158 2013 1032 2059
/I/ 1023 1978 1028 2017 1063 2019
/E/ 1092 1864 1193 1885 1067 2004
/æ/ 1000 1872 1104 1924 1037 1859
/l/ /i/ 1413 2442 1560 2585 1482 2626
/I/ 1430 2607 1501 2509 1608 2651
/E/ 1244 2390 1438 2588 1364 2330
/æ/ 1094 2287 1147 2358 1124 2289
Table A.3: F2 and F3 frequencies measured in the consonants /h r l/ in the vowel contexts /i I E æ/ in various word
types. All formant frequency values are in Hz and are averaged over 10 repetitions.
Vowel Consonant Monosyll. Polysyll. Nonsense
context context F2 F3 F2 F3 F2 F3
/i/ /h/ 1781 2514 1866 2559 1729 2555
/r/ 1581 2346 1263 2128 1637 2372
/l/ 1394 2456 1539 2372 1541 2447
/I/ /h/ 1635 2520 1662 2598 1576 2566
/r/ 1448 2288 1281 2330 1588 2156
/l/ 1461 2448 1539 2360 1838 2684
/E/ /h/ 1657 2620 1784 2678 1844 2863
/r/ 1282 2340 1514 2472 1448 2233
/l/ 1365 2392 1938 2727 1633 2657
/æ/ /h/ 1428 2437 1529 2515 1384 2333
/r/ 1357 2139 1367 2315 1491 2187
/l/ 1307 2390 1260 2314 1330 2312
Table A.4: F2 and F3 frequencies measured in /@1/ of Figure A.1 in the vowel contexts /i I E æ/, consonant contexts
/h r l/ in various word types. All formant frequency values are in Hz and are averaged over 10 repetitions.
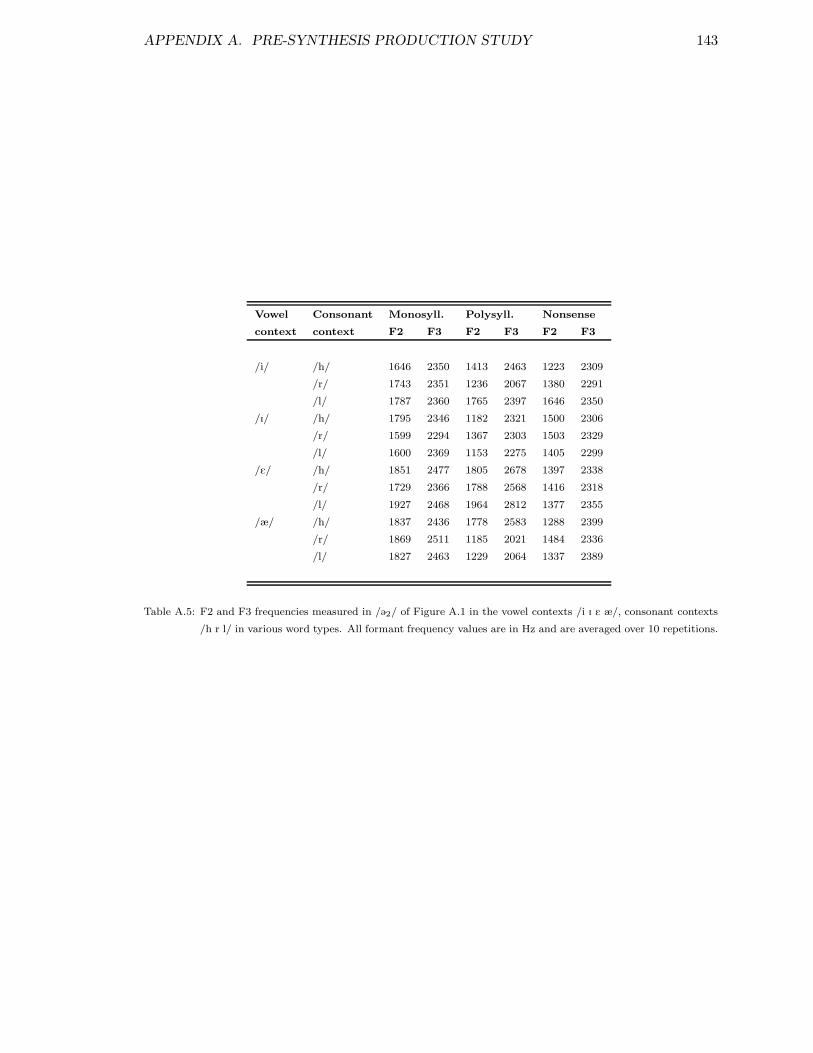
APPENDIX A. PRE-SYNTHESIS PRODUCTION STUDY 143
Vowel Consonant Monosyll. Polysyll. Nonsense
context context F2 F3 F2 F3 F2 F3
/i/ /h/ 1646 2350 1413 2463 1223 2309
/r/ 1743 2351 1236 2067 1380 2291
/l/ 1787 2360 1765 2397 1646 2350
/I/ /h/ 1795 2346 1182 2321 1500 2306
/r/ 1599 2294 1367 2303 1503 2329
/l/ 1600 2369 1153 2275 1405 2299
/E/ /h/ 1851 2477 1805 2678 1397 2338
/r/ 1729 2366 1788 2568 1416 2318
/l/ 1927 2468 1964 2812 1377 2355
/æ/ /h/ 1837 2436 1778 2583 1288 2399
/r/ 1869 2511 1185 2021 1484 2336
/l/ 1827 2463 1229 2064 1337 2389
Table A.5: F2 and F3 frequencies measured in /@2/ of Figure A.1 in the vowel contexts /i I E æ/, consonant contexts
/h r l/ in various word types. All formant frequency values are in Hz and are averaged over 10 repetitions.
144
Appendix B
Synthesis experiment: Acoustic
data for isolated vowels
B.1 Background
As well as the recording for the synthesis experiment which is described in Ap-
pendix A, RJ recorded a set of words and vowels in isolation. The spectral properties of
these vowels were compared to equivalent vowels synthesised on the Infovox system, in order
to assess how RJ could be used as a model for modifications to the synthetic speech. The
formant frequencies in these isolated words and vowels are presented here.
The following vowels were recorded in isolation: /i: E æ A O u @/ and a similar
range of vowels were recorded in real words beginning with a voiced or voiceless bilabial stop
and ending in a voiceless velar stop: beak, pick, peck, back, bark, pork, book. The vowels in
isolation and those in the words are not identical, as the aim of this recording was simply
to cover a range of vowels which could be compared with vowels produced by the Infovox
system.
Recording details are the same as for the main part of the pre-synthesis production
study (see Appendix A). Each vowel or word was read twice by the speaker, and the results
are averaged across these repetitions.
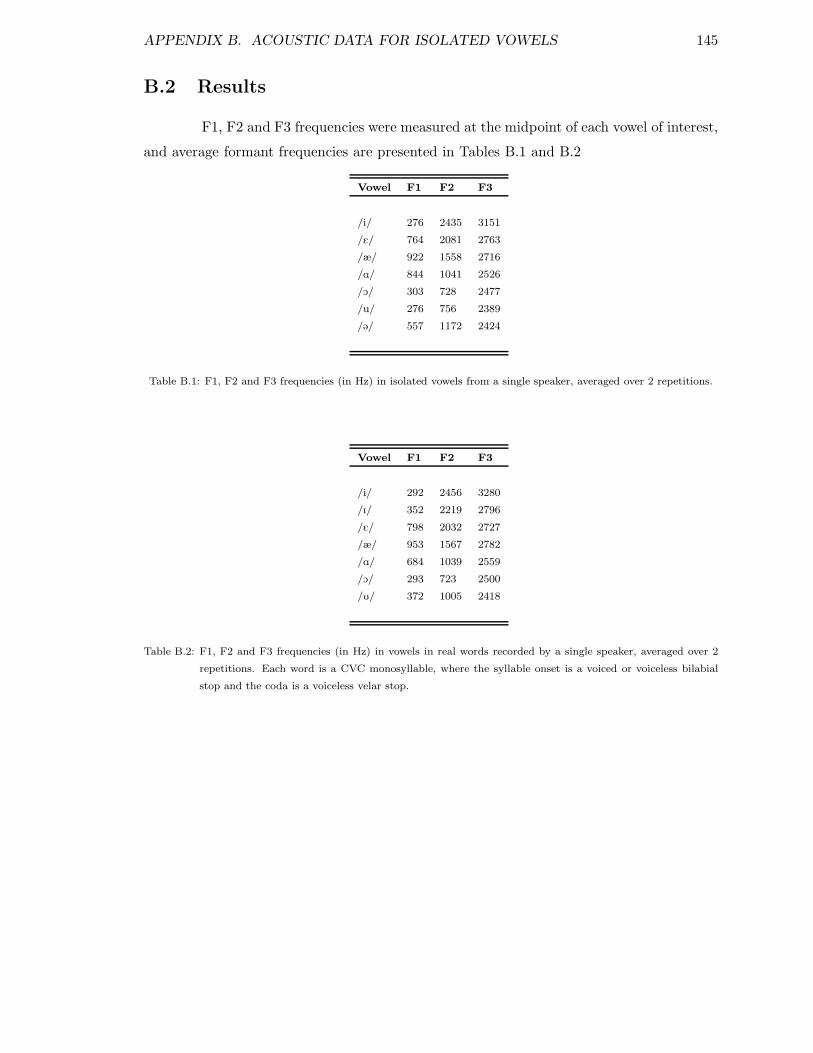
APPENDIX B. ACOUSTIC DATA FOR ISOLATED VOWELS 145
B.2 Results
F1, F2 and F3 frequencies were measured at the midpoint of each vowel of interest,
and average formant frequencies are presented in Tables B.1 and B.2
Vowel F1 F2 F3
/i/ 276 2435 3151
/E/ 764 2081 2763
/æ/ 922 1558 2716
/A/ 844 1041 2526
/O/ 303 728 2477
/u/ 276 756 2389
/@/ 557 1172 2424
Table B.1: F1, F2 and F3 frequencies (in Hz) in isolated vowels from a single speaker, averaged over 2 repetitions.
Vowel F1 F2 F3
/i/ 292 2456 3280
/I/ 352 2219 2796
/E/ 798 2032 2727
/æ/ 953 1567 2782
/A/ 684 1039 2559
/O/ 293 723 2500
/U/ 372 1005 2418
Table B.2: F1, F2 and F3 frequencies (in Hz) in vowels in real words recorded by a single speaker, averaged over 2
repetitions. Each word is a CVC monosyllable, where the syllable onset is a voiced or voiceless bilabial
stop and the coda is a voiceless velar stop.

146
Bibliography
Abercrombie, D. (1964). Syllable quantity and enclitics in English. In D. Abercrombie,
D. B. Fry, P. A. D. MacCarthy, N. C. Scott, and J. L. M. Trim (Eds.), In honour of
Daniel Jones, pp. 216–222. Longmans.
Alfonso, P. J. and T. Baer (1982). Dynamics of vowel articulation. Language and
Speech 25 (2), 151–172.
Allen, G. D. and S. Hawkins (1978). The development of phonological rhythm. In A. Bell
and J. B. Hooper (Eds.), Syllables and Segments, pp. 173–185. North-Holland Pub-
lishing Company.
Allen, J., S. M. Hunnicutt, and D. H. Klatt (1987). From text to speech: The MITalk
system. Cambridge: Cambridge University Press.
Beckman, M. (1992). Evidence for speech rhythms across languages. In Y. Tohkura,
E. Vatikiotis-Bateson, and Y. Sagisake (Eds.), Speech Perception, Production and
Linguistic Structure, pp. 457–463. IOS Press.
Benguerel, A.-P. and H. Cowan (1974). Coarticulation of upper lip protrusion in French.
Phonetica 30, 41–55.
Benoıt, C., A. Van Erp, M. Grice, V. Hazan, and U. Jekosch (1989). Multilingual synthe-
siser assessment using semantically unpredictable sentences. Eurospeech 1989 , 633–
636.
Bladon, R. A. W. and A. Al-Bamerni (1976). Coarticulation resistance in English /l/.
Journal of Phonetics 4, 137–150.
Boogaart, T. and K. Silverman (1992). Evaluating the overall comprehensibility of speech
synthesizers. Proceedings of the 2nd International Conference on Spoken Language
Processing, ICSLP , 1207–1210.
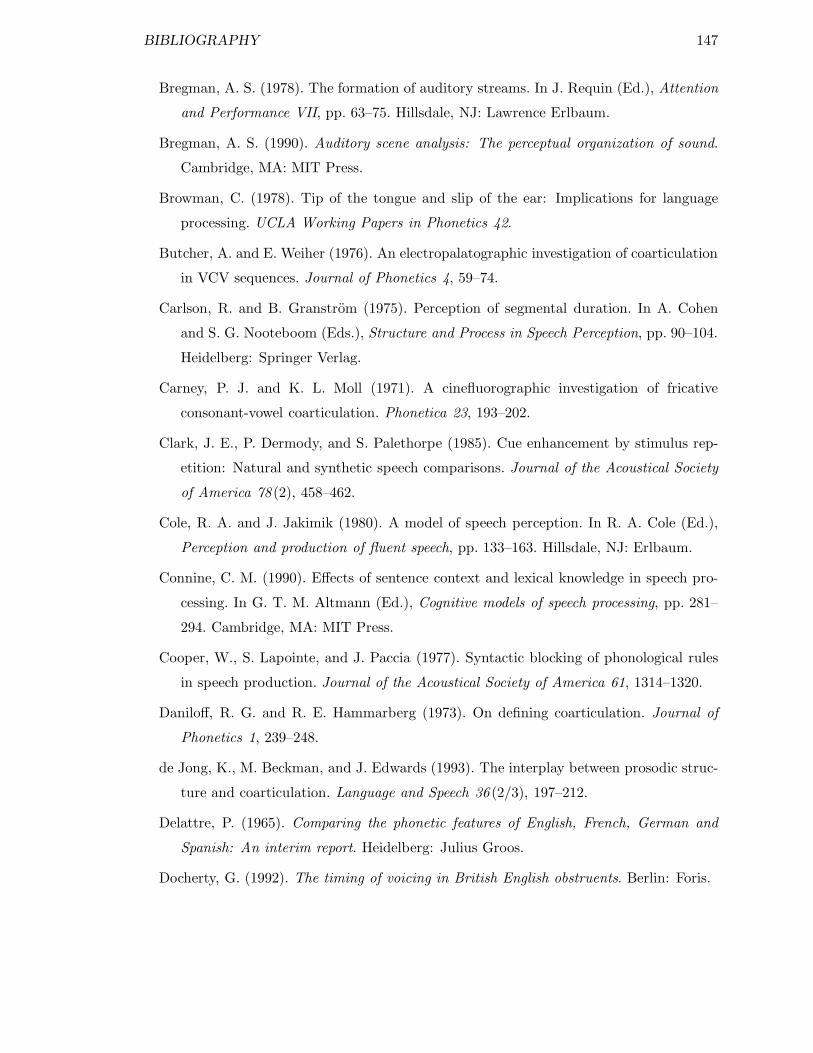
BIBLIOGRAPHY 147
Bregman, A. S. (1978). The formation of auditory streams. In J. Requin (Ed.), Attention
and Performance VII, pp. 63–75. Hillsdale, NJ: Lawrence Erlbaum.
Bregman, A. S. (1990). Auditory scene analysis: The perceptual organization of sound.
Cambridge, MA: MIT Press.
Browman, C. (1978). Tip of the tongue and slip of the ear: Implications for language
processing. UCLA Working Papers in Phonetics 42.
Butcher, A. and E. Weiher (1976). An electropalatographic investigation of coarticulation
in VCV sequences. Journal of Phonetics 4, 59–74.
Carlson, R. and B. Granstrom (1975). Perception of segmental duration. In A. Cohen
and S. G. Nooteboom (Eds.), Structure and Process in Speech Perception, pp. 90–104.
Heidelberg: Springer Verlag.
Carney, P. J. and K. L. Moll (1971). A cinefluorographic investigation of fricative
consonant-vowel coarticulation. Phonetica 23, 193–202.
Clark, J. E., P. Dermody, and S. Palethorpe (1985). Cue enhancement by stimulus rep-
etition: Natural and synthetic speech comparisons. Journal of the Acoustical Society
of America 78 (2), 458–462.
Cole, R. A. and J. Jakimik (1980). A model of speech perception. In R. A. Cole (Ed.),
Perception and production of fluent speech, pp. 133–163. Hillsdale, NJ: Erlbaum.
Connine, C. M. (1990). Effects of sentence context and lexical knowledge in speech pro-
cessing. In G. T. M. Altmann (Ed.), Cognitive models of speech processing, pp. 281–
294. Cambridge, MA: MIT Press.
Cooper, W., S. Lapointe, and J. Paccia (1977). Syntactic blocking of phonological rules
in speech production. Journal of the Acoustical Society of America 61, 1314–1320.
Daniloff, R. G. and R. E. Hammarberg (1973). On defining coarticulation. Journal of
Phonetics 1, 239–248.
de Jong, K., M. Beckman, and J. Edwards (1993). The interplay between prosodic struc-
ture and coarticulation. Language and Speech 36 (2/3), 197–212.
Delattre, P. (1965). Comparing the phonetic features of English, French, German and
Spanish: An interim report. Heidelberg: Julius Groos.
Docherty, G. (1992). The timing of voicing in British English obstruents. Berlin: Foris.
BIBLIOGRAPHY 148
Docherty, G. and L. Shockey (1988). Speech synthesis. In M. Jack and J. Laver (Eds.),
Aspects of Speech Technology, Chapter 3, pp. 144–183. Edinburgh: Edinburgh Uni-
versity press.
Duffy, S. A. and D. B. Pisoni (1992). Comprehension of synthetic speech produced by
rule: A review and theoretical implications. Language and Speech 35 (4), 351–389.
Edgington, M. (Ed.) (1998). Proceedings of the 3rd ESCA/COCOSDA International
Workshop on Speech Synthesis, Jenolan Caves, Australia.
Elman, J. L. and J. McClelland (1986). Exploiting lawful variability in the speech wave.
In J. S. Perkell and D. H. Klatt (Eds.), Invariance and Variability in Speech Processes,
pp. 360–385. Hillsdale, NJ: Lawrence Erlbaum.
Fairbanks, B., N. Guttman, and M. S. Miron (1957). The effects of time compression upon
the comprehension of connected speech. Journal of Speech and Hearing Disorders 22,
10–19.
Fairbanks, G. (1958). Test of phonemic differentiation: The rhyme test. Journal of the
Acoustical Society of America 30, 596–600.
Fant, G. (1973). Speech sounds and features. Cambridge, Mass: MIT Press.
Fant, G. (1989). Quantal theory and features. Journal of Phonetics 17, 79–86.
Farnetani, E. (1990). V-C-V lingual coarticulation and its spatiotemporal domain. In
W. J. Hardcastle and A. Marchal (Eds.), Speech Production and Speech Modelling,
pp. 93–130. Kluwer Academic Publishers.
Febrer, A., J. Padrell, and A. Bonafonte (1998). Modeling phone duration: Application
to Catalan TTS. In Proceedings of the 3rd ESCA/COCOSDA International Workshop
on Speech Synthesis, Jenolan Caves, Australia, pp. 43–46.
Fowler, C. (1981a). Production and perception of coarticulation among stressed and
unstressed vowels. Journal of Speech and Hearing Research 24, 127–139.
Fowler, C. (1981b). A relationship between coarticulation and compensatory shortening.
Phonetica 38, 35–50.
Gay, T. (1974). A cinefluorographic study of vowel production. Journal of Phonetics 2,
255–266.
BIBLIOGRAPHY 149
Gay, T. (1977). Articulatory movements in VCV sequences. Journal of the Acoustical
Society of America 62 (1), 183–193.
Gimson, A. C. (1970). An Introduction to the Pronunciation of English (2 ed.). London:
Edward Arnold.
Glasberg, B. R. and B. C. J. Moore (1990). Derivation of auditory filter shapes from
notched-noise data. Hearing Research 47, 103–118.
Goldinger, S. D. (1997). Words and voices: Perception and production in an episodic lex-
icon. In K. Johnson and J. Mullennix (Eds.), Talker Variability in Speech Processing,
Chapter 3, pp. 33–66. Academic Press.
Granstrom, B. (1992). The use of speech synthesis in exploring different speaking styles.
Speech Communication 11, 347–355.
Green, K. P. and A. Gerdeman (1995). Cross-modal discrepancies in coarticulation and
the integration of speech information: The McGurk effect with mismatched vow-
els. Journal of Experimental Psychology: Human Perception and Performance 21 (6),
1409–1426.
Haggard, M. (1973). Abbreviation of consonants in English pre- and post-vocalic clusters.
Journal of Phonetics 1, 9–24.
Hammarberg, R. (1976). The metaphysics of coarticulation. Journal of Phonetics 4, 353–
363.
Hammarberg, R. (1982). On redefining coarticulation. Journal of Phonetics 10, 123–137.
Hardcastle, W. J. (1985). Some phonetic and syntactic constraints on lingual coarticula-
tion during /kl/ sequences. Speech Communication 4, 247–263.
Hardcastle, W. J. and P. J. Roach (1979). An instrumental investigation of coarticulation
in stop consonant sequences. In P. Hollien and H. Hollien (Eds.), Current Issues in
the Phonetic Sciences, pp. 531–540. Amsterdam: John Benjamin.
Harley, T. A. (1995). The psychology of language: from data to theory. Erlbaum (UK)
Taylor and Francis.
Hawkins, S. (1995). Arguments for a nonsegmental view of speech perception. Interna-
tional Congress of Phonetic Sciences.

BIBLIOGRAPHY 150
Hawkins, S. and A. Slater (1994). Spread of CV and V-to-V coarticulation in British En-
glish: Implications for the intelligibility of synthetic speech. Proceedings ICSLP 94 (1),
57–60.
Hazan, V. and B. Shi (1993). Individual variability in the perception of synthetic speech.
Proceedings of the Eurospeech ’93 3, 1849–1852. Berlin.
Heid, S. and S. Hawkins (1999). Synthesizing systematic variation at boundaries between
vowels and obstruents. In International Congress of Phonetic Sciences. Also at:
http://kiri.ling.cam.ac.uk/procsy/icphs99-hh.ps.
House, A. S., C. E. Williams, M. H. L. Hecker, and K. D. Kryter (1965). Articulation
testing methods: Consonantal differentiations with a closed-response set. Journal of
the Acoustical Society of America 37 (1), 158–166.
Huffman, M. K. (1986). Patterns of coarticulation in English. UCLA Working Papers in
Phonetics 63, 26–47.
Huggins, A. W. F. (1975). On isochrony and syntax. In G. Fant and M. A. A. Tatham
(Eds.), Auditory analysis and synthesis of speech, pp. 455–464. London: Academic
Press.
Imaizumi, S. and S. Kiritani (1992). A generation model of formant trajectories at variable
speaking rates. In G. Bailly, C. Benoıt, and T. R. Sawallis (Eds.), Talking machines:
Theories, models and designs, pp. 61–75. Amsterdam: North Holland.
Jokisch, O., D. Hirschfeld, M. Eichner, and R. Hoffman (1998). Creating an individual
speech rhythm: A data driven approach. In Proceedings of the 3rd ESCA/COCOSDA
International Workshop on Speech Synthesis, Jenolan Caves, Australia, pp. 115–119.
Jones, D. (1972). An outline of English phonetics. Cambridge: Heffers.
Kakita, Y., O. Fujimura, and K. Honda (1985). Computation of mapping from muscular
contraction patterns to formant patterns in vowel space. In V. Fromkin (Ed.), Phonetic
Linguistics: Essays in honor of P. Ladefoged, pp. 133–144. New York: Academic
Press.
Keating, P. A. (1990). The window model of coarticulation: Articulatory evidence. In
J. Kingston and M. E. Beckman (Eds.), Between the Grammar and the Physics of
Speech: Papers in Laboratory Phonology I, pp. 451–470. Cambridge: Cambridge Uni-
versity Press.
BIBLIOGRAPHY 151
Kelly, J. (1989). On the phonological relevance of some non-phonological elements. In
T. Szende (Ed.), Proceedings of the Speech Research International Conference, Bu-
dapest, pp. 56–59.
Kelly, J. and J. Local (1989). Doing Phonology: Observing, recording, interpreting.
Manchester: Manchester University Press.
Kent, R. D. and F. D. Minifie (1977). Coarticulation in recent speech production models.
Journal of Phonetics 5, 115–33.
Klatt, D. H. (1973). Interaction between two factors that influence vowel duration. Jour-
nal of the Acoustical Society of America 54, 1102–1104.
Klatt, D. H. (1979). Synthesis by rule of segmental durations in English sentences. In
B. Lindblom and S. Ohman (Eds.), Frontiers of Speech Communication Research, pp.
287–299. London: Academic Press.
Klatt, D. H. (1986). The problem of variability in speech recognition and in models of
speech perception. In J. S. Perkell and D. H. Klatt (Eds.), Invariance and Variability
in Speech Processes, Chapter 14, pp. 300–324. Hillsdale, NJ: Lawrence Erlbaum.
Klatt, D. H. (1987). Review of text-to-speech conversion for English. Journal of the
Acoustical Society of America 82, 737–793.
Kuhnert, B. and F. Nolan (1997). Coarticulation: Theoretical and empirical perspectives.
In W. J. Hardcastle and N. Hewlett (Eds.), The origin of coarticulation. Cambridge:
Cambridge University Press. Forthcoming, also at:
http://www.phonetik.uni-muenchen.de/FIPKM/Index.html#vol35.
Kwong, K. and K. Stevens (1999). On the voiced-voiceless distinction for writer/rider.
Speech Communication Group Working Papers - Research Laboratory of Electronics,
MIT XI, 1–20.
Laver, J. (1994). Principles of phonetics. Cambridge: Cambridge University Press.
Lehiste, I. (1964). Acoustical characteristics of selected English consonants. International
Journal of American Linguistics 30 (3).
Lehiste, I. (1970). Suprasegmentals. Cambridge, MA: MIT Press.
Lehiste, I. (1972). The timing of utterances and linguistic boundaries. Journal of the
Acoustical Society of America 51, 2018–2024.
BIBLIOGRAPHY 152
Lehiste, I. (1977). Isochrony reconsidered. Journal of Phonetics 5, 253–263.
Lieberman, P. (1963). Some effects of semantic and grammatical context on the produc-
tion and perception of speech. Language and Speech 6, 172–187.
Lindblom, B. (1963). Spectrographic study of vowel reduction. Journal of the Acoustical
Society of America 35, 1773–81.
Lindblom, B. (1990). Explaining phonetic variation: A sketch of the H&H theory. In
W. Hardcastle and A. Marchal (Eds.), Speech Production and Speech modelling, pp.
403–439. Dordrecht: Kluwer.
Lisker, L. (1986). “Voicing” in English: A catalogue of acoustic features signalling /b/
versus /p/ in trochees. Language and Speech 29 (1), 3–11.
Local, J. (1997). What some more prosody and better signal quality can do for speech
synthesis. In Speech Technology in the Public Telephone Network: Where are we to-
day?, Rhodes, Greece, pp. 77–84. COST Telecom Actions. Satellite to Eurospeech
Conference 1997.
Lofqvist, A. (1985). Review of MacNeilage: The production of speech. Phonetica 42,
154–157.
Lubker, J. and T. Gay (1982). Anticipatory labial coarticulation: Experimental, biological
and linguistic variables. Journal of the Acoustical Society of America 71 (2), 437–448.
Luce, P. A. (1981). Comprehension of fluent synthetic speech produced by rule. Research
on Speech Perception Progress Report (7), 229–242. Bloomington, IN: Indiana Uni-
versity.
Luce, P. A., T. Feustel, and D. Pisoni (1983). Capacity demands in short-term memory
for synthetic and natural word lists. Human Factors 25, 17–32.
Luce, P. A., D. B. Pisoni, and S. D. Goldinger (1990). Similarity neighbourhoods of
spoken words. In G. T. M. Altmann (Ed.), Cognitive models of speech processing:
Psycholinguistic and computational perspectives. Cambridge, MA: MIT Press.
MacNeilage, P. F. and J. L. DeClerk (1969). On the motor control of coarticulation in
CVC monosyllables. Journal of the Acoustical Society of America 45, 1217–33.
Magen, H. S. (1984). Vowel-to-vowel coarticulation in English and Japanese. Journal of
the Acoustical Society of America, Supplement 75, S41.
BIBLIOGRAPHY 153
Manous, L., M. Dedina, H. Nusbaum, and D. Pisoni (1985). Speeded sentence verification
of natural and synthetic speech. Research on Speech Perception Progress Report 11.
Bloomington, IN: Indiana University.
Manuel, S. Y. (1990). The role of contrast in limiting vowel-to-vowel coarticulation in
different languages. Journal of the Acoustical Society of America 88 (3), 1286–1289.
Manuel, S. Y. and R. A. Krakow (1984). Universal and language particular aspects of
vowel-to-vowel coarticulation. Technical Report SR-77/78, Haskins Lab. Stat. Rep/
Speech Res.
Massaro, D. W. (1987). Categorical partition: A fuzzy-logical model of categorization be-
haviour. In S. Harnad (Ed.), Categorical Perception, pp. 254–283. Cambridge: Cam-
bridge University Press.
Massaro, D. W. and G. C. Oden (1980). Evaluation and integration of acoustic features
in speech perception. Journal of the Acoustical Society of America 67 (3), 996–1013.
McGurk, H. and J. MacDonald (1976). Hearing lips and seeing voices. Nature 264, 746–
748.
Miller, J. L. (1994). On the internal structure of phonetic categories: A progress report.
Cognition 50, 271–285.
Moll, K. and R. Daniloff (1971). Investigation of the timing of velar movement during
speech. Journal of the Acoustical Society of America 50, 678–684.
Moon, S.-J. and B. Lindblom (1994). Interaction between duration, context, and speaking
style in English stressed vowels. Journal of the Acoustical Society of America 96 (1),
40–55.
Nolan, F. (1983). The phonetic bases of speaker recognition. Cambridge: Cambridge Uni-
versity Press.
Nolan, F. (1985). Idiosyncracy in coarticulation strategies. Cambridge Papers in Phonet-
ics and Experimental Linguistics 4.
Nooteboom, S. G. (1991). Some observations on the temporal organisation and rhythm
of speech. In Proceedings of the XIIth International Congress of Phonetic Sciences,
Aix-en-Provence, France, pp. 228–237. University of Provence.
BIBLIOGRAPHY 154
Nye, P. W. and J. H. Gaitenby (1973). Consonant intelligibility in synthetic speech and
in a natural speech control (modified rhyme test results). Haskins Laboratories Sta-
tus Report on Speech Research SR–33, 77–91. Abstract reproduced in Language and
Language Behaviour Abstracts.
Oden, G. C. and D. W. Massaro (1978). Integration of featural information in speech
perception. Psychological Review 88, 172–191.
Ogden, R. and J. Local (1992). Yorktalk annual report, 1992.
Ogden, R. and J. Local (1996). Yorktalk annual report, March 1991. York Research
Papers in Linguistics 1.
Ogden, R., J. Local, and P. Carter (1999). Temporal interpretation in ProSynth, a
prosodic speech synthesis system. In International Congress of Phonetic Sciences.
Ohman, S. (1966). Coarticulation in VCV utterances: Spectrographic measurements.
Journal of the Acoustical Society of America 39, 151–168.
Ohman, S. (1967). Numerical model of coarticulation. Journal of the Acoustical Society
of America 41, 310–320.
O’Malley, M. H. and M. Caisse (1987). How to evaluate text-to-speech systems. Speech
Technology March/April.
Ostry, D. J., R. F. Feltham, and K. G. Munhall (1984). Characteristics of speech motor
development in children. Developmental Psychology 20, 859–871.
Ostry, D. J., E. Keller, and A. Parush (1983). Similarities in the control of the speech
articulators and the limbs: Kinematics of tongue-dorsum movement in speech. Jour-
nal of Experimental Psychology 9, 622–636. Journal previously appeared as Human
Perception and Performance.
Perkell, J. S. and M. H. Cohen (1997). Token-to-token variation of tongue-body vowel
targets: the effect of context. In S. Kiritani, H. Hirose, and H. Fujisaki (Eds.), Speech
Production and Language: In honor of Osamu Fujimura. Berlin: Mouton de Gruyter.
Pisoni, D. (1997a). Perception of synthetic speech. In J. P. H. van Santen, R. W. Sproat,
J. P. Olive, and J. Hirschberg (Eds.), Progress in Speech Synthesis, Chapter 43, pp.
541–560. Springer.
BIBLIOGRAPHY 155
Pisoni, D. (1997b). Some thoughts on “normalization” in speech perception. In K. John-
son and J. Mullennix (Eds.), Talker Variability in Speech Processing, Chapter 2, pp.
9–32. Academic Press.
Pisoni, D., B. Greene, and H. Nusbaum (1985a). Perception of synthetic speech generated
by rule. Proceedings of the IEEE 73, 1665–1676.
Pisoni, D., B. Greene, and H. Nusbaum (1985b). Some human factors issues in the
perception of synthetic speech. Proceedings Speech Tech ’85 , 57–61. New York.
Pols, L. (1989). Quality evaluation of text-to-speech synthesis systems. In A. Fourcin
(Ed.), Speech input and output assessment: Multilingual methods and standards.
Chichester: Ellis Horwood.
Pols, L. and R. van Son (1993). Acoustics and perception of dynamic vowel segments.
Speech Communication 13, 135–147.
Port, R. F. (1981). Linguistic timing factors in combination. Journal of the Acoustical
Society of America 69, 262–274.
Pratt, R. L. (1986). On the intelligibility of synthetic speech. Proceedings of the Institute
of Acoustics 8 (7), 183–192.
Ralston, J., D. Pisoni, S. Lively, B. Greene, and J. Mullennix (1991). Comprehension
of synthetic speech produced by rule: Word monitoring and sentence-by-sentence
listening times. Human Factors 33, 471–491.
Ralston, J. V., S. E. Lively, D. B. Pisoni, and S. Rivera (1990). Measuring the workload
of comprehending spoken discourse: A first report. Research on Speech Perception
Progress Report 16, 155–167. Bloomington, IN: Indiana University.
Recasens, D. (1985). Coarticulatory patterns and degrees of coarticulatory resistance in
Catalan CV sequences. Language and Speech 28 (2), 97–114.
Recasens, D. (1987). An acoustic analysis of V-to-C and V-to-V coarticulatory effects in
Catalan and Spanish VCV sequences. Journal of Phonetics 15, 299–312.
Recasens, D. (1989). Long-range coarticulation effects for tongue dorsum contact in
VCVCV sequences. Speech Communication 8, 293–307.
Roach, P. and J. Harman (Eds.) (1997). English Pronouncing Dictionary (15 ed.). Cam-
bridge: Cambridge University Press.
BIBLIOGRAPHY 156
Rodgers, J. (1998). Vowel Devoicing in English. Ph. D. thesis, University of Cambridge.
Rosner, B. S. and J. B. Pickering (1994). Vowel perception and production. Number 23
in Oxford Psychology Series. Oxford: Oxford University Press.
Samuel, A. G. (1990). Using perceptual-restoration effects to explore the architecture of
perception. In G. T. M. Altmann (Ed.), Cognitive models of speech processing, pp.
295–314. Cambridge, MA: MIT Press.
Shadle, C. H. (1985). The Acoustics of Fricative Consonants. Ph. D. thesis, MIT.
Sharf, B. (1970). Critical bands. In J. V. Tobias (Ed.), Foundations of Modern Auditory
Theory, Volume I, Chapter 5, pp. 159–202. New York: Academic Press.
Sharf, D. J. and R. N. Ode (1981). Physiologic, acoustic and perceptual aspects of coar-
ticulation: Implications for the remediation of articulatory disorders. In N. J. Lass
(Ed.), Speech and Language: Advances in basic research and practice, Volume 5, pp.
153–247. New York: Academic Press.
Sonntag, G. P., T. Portele, and F. Haas (1998). Comparing the comprehensibility
of different synthetic voices in a dual task experiment. In Proceedings of the 3rd
ESCA/COCOSDA International Workshop on Speech Synthesis, Jenolan Caves, Aus-
tralia, pp. 5–10.
Spiegel, M. F., M. J. Altom, and M. J. Macchi (1990). Comprehensive assessment of the
telephone intelligibility of synthesized and natural speech. Speech Commmunication 9,
279–291.
Stevens, K. N. (1989). On the quantal nature of speech. Journal of Phonetics 17, 3–45.
Stevens, K. N. (1998). Acoustic Phonetics. Cambridge, MA: MIT Press.
Stevens, K. N. and S. E. Blumstein (1978). Invariant cues for place of articulation in stop
consonants. Journal of the Acoustical Society of America 64, 1358–1368.
Su, L.-S., K.-P. Li, and K. S. Fu (1974). Identification of speakers by use of nasal coar-
ticulation. Journal of the Acoustical Society of America 56 (6), 1876–1882.
Summerfield, Q. and J. F. Culling (1994). Auditory computations that separate speech
from competing sounds. In E. Keller (Ed.), Fundamentals of speech synthesis and
speech recognition, pp. 297–312. Chichester: John Wiley and Sons.
BIBLIOGRAPHY 157
Tunley, A. (1995). Coarticulatory variability in /i:/ and /E:/. Master’s thesis, Department
of Linguistics, University of Cambridge.
van Bezooijen, R. and V. van Heuven (1997). Assessment of synthesis systems. In D. Gib-
bon, R. Moore, and R. Winski (Eds.), Handbook of standards and resources for spoken
language systems, Chapter 12, pp. 481–563. Berlin: Mouton de Gruyter.
van den Berg, R. J. H. and I. H. Slis (1987). Phonetic context effects in the perception
of voicing in C1C2 sequences. Journal of Phonetics 15, 39–46.
van Santen, J. (1992a). Contextual effects on vowel-duration. Speech Communication 11,
513–546.
van Santen, J. (1992b). Deriving text-to-speech durations from natural speech. In
G. Bailly, C. Benoıt, and T. R. Sawallis (Eds.), Talking machines: Theories, models
and designs, pp. 275–285. Amsterdam: North Holland.
Warren, P. and W. Marslen-Wilson (1987). Continuous uptake of acoustic cues in spoken
word recognition. Perception and Psychophysics 41 (3), 262–275.
Werner, S. and E. Keller (1994). Prosodic aspects of speech. In E. Keller (Ed.), Fun-
damentals of speech synthesis and speech recognition: Basic concepts, state-of-the-art
and future challenges, Chapter 2, pp. 23–40. Wiley and Sons.
West, P. (1999). The extent of coarticulation of English liquids: An acoustic and articu-
latory study. In International Congress of Phonetic Sciences.
White, L. and A. Turk (1998). Prosodic constituency and syllable duration. Poster pre-
sented at the Sixth Conference on Laboratory Phonology.
Wilhelms-Tricarico, R. and J. S. Perkell (1994). Biomechanical and physiologically based
speech modelling. In Proceedings of the 2nd ESCA/IEEE Workshop on speech syn-
thesis, New York, pp. 17–20.
Yang, L.-C. (1998). Contextual effects on syllable duration. In Proceedings of the 3rd
ESCA/COCOSDA International Workshop on Speech Synthesis, Jenolan Caves, Aus-
tralia, pp. 37–42.
Zwicker, E. and E. Terhardt (1980). Analytical expressions for critical band rate and
critical bandwidth as a function of frequency. Journal of the Acoustical Society of
America 68, 1523–1525.