Eurogeographics´Geospatial Contribution to the Digital Agenda for Europe

Brussels – 24th September 2009
Coal’s Contribution to Security of Energy Supply in Europe
Dr. Thorsten Diercks, Secretary General

24th September 2009 - Figure 2
EURACOAL MembersDEBRIV - Deutscher Braunkohlen-Industrie-Verein e.V. (GER)
GVSt - Gesamtverband Steinkohle e.V. (GER)
COALPRO - Confederation of UK Coal Producers (UK)
ZPWGK - Polish Hard Coal Employer´sAssociation (POL)
PPWB – Employer‘s Confederation of thePolish Lignite Industry (POL)
PPC - Public Power Corporation (GR)
ZSDNP – The Employer‘s Association of Mining and Oil Producers (CZR)
CARBUNION - Federation of Spanish Coal Producers (ESP)
MATRA - Matra Kraftwerk AG (HUN)
Mini Maritsa Iztok EAD (BUL)
PATROMIN - Federation of the RomanianMining Industry (ROM)
Hornonitrianske Bane Prievidza a.s. (SVK)
VDKI - Verein der Kohlenimporteure e.V. (GER)
CoalImp - Association of UK Coal Importers (UK)
Swedish Coal Institute (SWE)
Premogovnik Velenje d.d. (SLO)
All-Ukrainian Coal Employers Association (UKR)
TKI - Turkish Coal Enterprises (TUR)
EPS - Electric Power Industry of Serbia (SER)
RMU Banovici Coal Company (BiH)
ISSeP - Institut Scientifique de Service Public (BEL)
University of Nottingham (UK)
Rock Mechanics Technology Ltd. (UK)
Coaltrans Conferences Ltd. (UK)
BRGM – Bureau de Recherches Géologiques et Minières(FRA)
CERTH/ISFTA – Centre for Research and Technology Hellas/Institute for Solid Fuels Technol. & Applic. (GR)
KOMAG Institute of Mining Technology(POL)

24th September 2009 - Figure 3
Coal’s contribution to security of energy supply in Europe
Agenda
European coal potential
Energy risk management – advantages of coal
Coal’s challenge: climate protection policies
Looking beyond 2020

24th September 2009 - Figure 4
Projected EU energy import dependence
Oil Gas Coal Total
Source: European Commission, EU Trends to 2030, update 2007
The use of coal reduces import dependence.
0%
10%
20%
30%
40%
50%
60%
70%
80%
90%
100%
82%86%
93% 95%
56%
64%
76%
84%
40%48%
59%63%
52%56%
64%67%
2005 2010 2020 2030 2005 2010 2020 2030 2005 2010 2020 2030 2005 2010 2020 2030

24th September 2009 - Figure 5
The gas crisis – power generation 5th to 11th January 2009 - example Germany
Net load on a cold day
Wind23 GW
Nuclear - 20 GW
Natural Gas - 22 GW
Hard Coal - 28 GW
Lignite - 20 GW
Solar2 GW
High 70 – 80 GW
Capacity
Coal generation helped in the crisis, renewables did not.
Capacity
Low - 50 GW

24th September 2009 - Figure 6

24th September 2009 - Figure 7
Hard coal - European potential (Mt)
81,04549,00632,039Ukraine
1,206793413Turkey
494,081476,03218,049TOTAL EU
8,2317,468770Other EU
187,132186,700432United Kingdom
4,2313,363868Spain
2,3872,37314Romania
179,459167,00012,459Poland
5,3515,075276Hungary
83,06582,947118Germany
24,21921,1063,112Czech Republic
PotentialResourcesReservesCountry
Source: BGR

24th September 2009 - Figure 8
Lignite - European potential (Mt)
8,9907,1761,814Turkey
11,2733,7507,523Serbia
4,1821,8142,369Bosnia-Herzegovina
152,77499,29953,475TOTAL EU
1,8611,502359Other EU
656341315Slovenia
60952583Slovakia
8,3557,947408Romania
44,87041,0003,870Poland
6,4303,5542,876Greece
5,3372,7042,633Hungary
77,57836,76040,818Germany
956772185Czech Republic
6,1224,1941,928Bulgaria
PotentialResourcesReservesCountry
Source: BGR

24th September 2009 - Figure 9
Power generation structure in selected EU 27 Member States
Gross power generationTWh Share of coal in %
Source: EUROSTAT – Energy / Yearly Statistics 2006
As at 9/2008
3.357.958 29161.743 9284.361 5960.789 53636.600 4245.843 4162.698 40398.327 38303.007 2235.859 20314.122 1485.535 8574.473 4France
Belgium
Italy
Hungary
Spain
UK
Romania
Bulgaria
Germany
Greece
Czech Republic
Poland
EU 27
coal nuclear gas oil others (hydro/biomass)

24th September 2009 - Figure 10
What we want to achieve - the EU energypolicy triangle
24th September 2009 - Figure 11
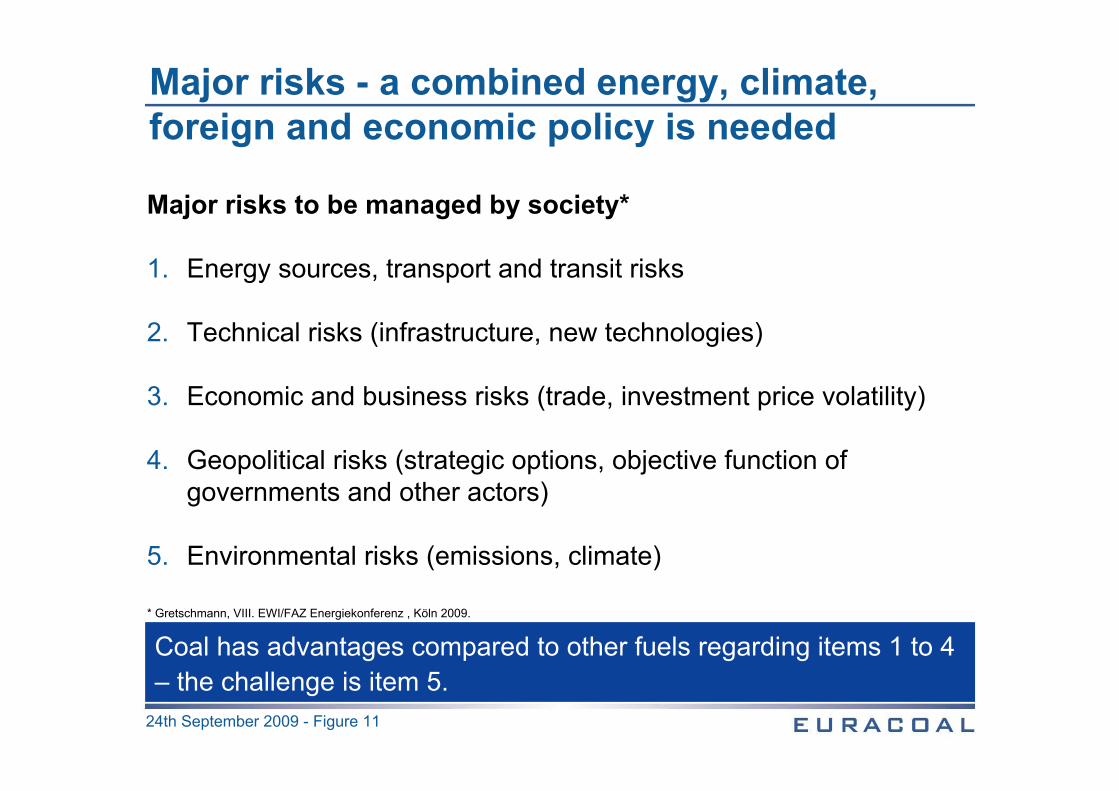
Major risks - a combined energy, climate, foreign and economic policy is needed
Major risks to be managed by society*
1. Energy sources, transport and transit risks
2. Technical risks (infrastructure, new technologies)
3. Economic and business risks (trade, investment price volatility)
4. Geopolitical risks (strategic options, objective function of governments and other actors)
5. Environmental risks (emissions, climate)
Coal has advantages compared to other fuels regarding items 1 to 4 – the challenge is item 5.
* Gretschmann, VIII. EWI/FAZ Energiekonferenz , Köln 2009.

24th September 2009 - Figure 12
Important coal policy issues (I)
Coal extraction: Access to Resources
Member States should emphasize that assuring access to resources is a common task of the EU, Member States and industry in order to secure energy supply
– No hasty closing down of mines on the basis of short-term considerations
– The legal system must ensure that access to resources (opencast and underground) remains possible also in practice – this refers mainly to regional planning as well as environmental approval procedures

24th September 2009 - Figure 13
The challenge for coal is the environment –EU decisions concerning climate protection
EU objectives till 2020:
20 % renewables, 20 % energy savings; 20 % less GHG
Possible objectives till 2050:
Limit global rise in temperature ≤ 2°C;objective ≤ 450 ppm CO2 in atmosphere
Worldwide reduction of anthropogenic GHG emissions to 50 % of 1990 level
Fair burden sharing, i. e. industrialised countries reduce over-proportionally, i. e. 80 – 95 % with 1990 as base year. Fairness at ≈ 2 t GHG emissions per capita per year

24th September 2009 - Figure 14
Electricity generation: significant capacity needs to be replaced in the short to medium term
0
25.000
50.000
75.000
100.000
125.000
150.000
175.000
200.000
2006-2015 2016-2025 2026-2035 2036-2045
Oil
Gas
Lignite
Hard coal
Nuclear energy
MW
Source: Prognos, here: EU-25
Lifetime Assumptions:OIL: 30 yearsGAS: 30 yearsLIGNITE: 40 yearsCOAL: 40 yearsNUCLEAR:40 years

24th September 2009 - Figure 15
Important coal policy issues (II) - Modernisation and increased efficiencies
31 - 36 %
40 - 45 %
η
feasible today
possible tomorrow
Δη~+30%
until 1970 until 1990 until 2010 until 2020
Δη~+30%
25 - 31 %
up to 300 up to 600 up to 1,100 (unit size in MW)
The right base: continuous power plant modernisation/renewal
conceivable dayafter tomorrow
after 2020
CCSpower plant
20
25
30
35
40
45
5045 - >50 %
pit electricity

24th September 2009 - Figure 16
Continuous modernisation remains important Germany – STEAG AG / EVN AG
New 750 MW hard coal-fired power plant
Efficiency: > 45%
2010
DUISBURG - WALSUM 10
Continuous modernisation and efficiency increase are a precondition
for CCS.
24th September 2009 - Figure 17
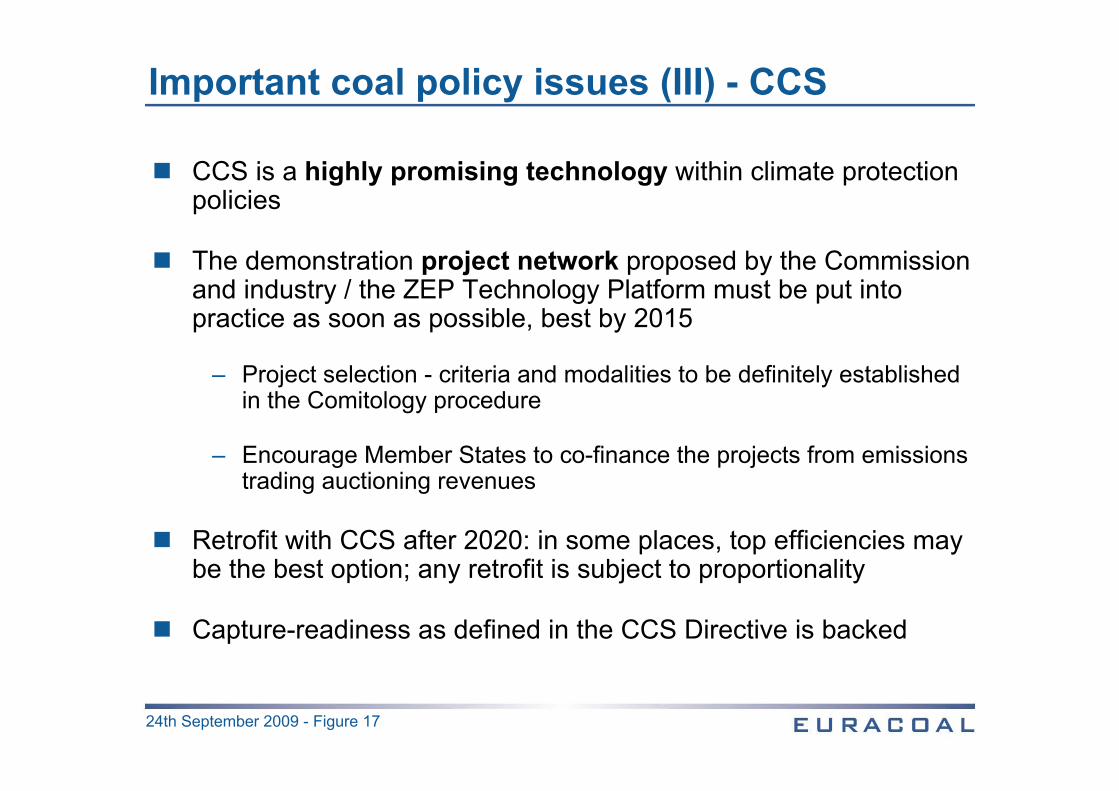
Important coal policy issues (III) - CCS
CCS is a highly promising technology within climate protection policies
The demonstration project network proposed by the Commission and industry / the ZEP Technology Platform must be put into practice as soon as possible, best by 2015
– Project selection - criteria and modalities to be definitely established in the Comitology procedure
– Encourage Member States to co-finance the projects from emissions trading auctioning revenues
Retrofit with CCS after 2020: in some places, top efficiencies may be the best option; any retrofit is subject to proportionality
Capture-readiness as defined in the CCS Directive is backed

24th September 2009 - Figure 18
A number of CCS demonstration projects -Example UK
Kingsnorth, e.on, 300 MW new post-combustion, 2014
Ferrybridge, Scottish and Southern Energy, 500 MW retrofit, 2015+
Tilbury, RWE nPower, 1600 MW new post-combustion, 2016
Hatfield, Powerfuel Power, 900 MW new pre-combustion, 2012-14
Teesside, Centrica etc., 800 MW new pre-combustion, 2013
Killingholme, e.on, 350 MW new pre-combustion, 2016+
KINGSNORTH POST-COMBUSTION

24th September 2009 - Figure 19
Climate protection in the EUTwo phases – two speeds
0
1
2
3
4
5
6
1990 2020 2050
- 20 %
- 80/95 %
GHG emissions in the EU[Mrd. t]
≈ - 40 Mio. t/a
≈ - 120 Mio. t/a
2 t per capita GHG emissions
Conclusion: For the EU, this means that GHG emissions of 5,8 billion t/a in 1990 must be limited to ca. 4,6 billion t in 2020 and ca. 1 billion t/a in 2050.

24th September 2009 - Figure 20
The minus 80-95% CO2 - case
All fossil fuels to be used in industrial installations with CCS only; CCS becomes a general obligation for industry in Europe
Operators of installations must pay for capture, transport and storage, independent of the fossil fuel type used
The CCS infrastructure (transport and storage) is needed at around 2020 and becomes an issue of secure energy later
– It creates planning security
– It secures industrial activity in Europe and may become a production factor for Europe
– Its construction is therefore of general interest; a single user cannot afford it; a common effort is needed

24th September 2009 - Figure 21
Conclusions
Security of energy supply remains important
Hard coal and lignite represent 80 % of the EU-27 domestic fossil fuel resources
In the decades to come,
– access to coal resources,
– continuous modernisation of coal-fired power plants and
– carbon capture and storage (after 2020) for all fossil fuels, including the respective infrastructure,
will be essential for a secure, competitive and sustainable energy supply.
Coal will remain a part of the solution to Europe‘s energy supply.

Thank you for your attention!
Brussels - 24th September 2009
Photos courtesy of:
- E.ON
- STEAG