Phase transformation and microstructural evolution after ...

9th International Command and Control Research and Technology Symposium
Coalition Transformation: An Evolution of People, Processes and Technology to Enhance Interoperability
Topic: C4ISR/C2 Architecture, C2 Experimentation
Title: Through the Looking Glass: Intelligence, Surveillance and Reconnaissance
Experimentation at the Canadian Forces Experimentation Centre
Authors: Paul Comeau
Canadian Forces Experimentation Centre Ottawa, Ontario, Canada [email protected]
Dr Greg Van Bavel
Canadian Forces Experimentation Centre Ottawa, Ontario, Canada [email protected]
Point of Contact:
Paul Comeau Canadian Forces Experimentation Centre National Defence Headquarters 101 Colonel By Drive K1A 0K2 Office: (613) 990-7483 Fax: (613) 991-5819 [email protected]

1
Through the Looking Glass: Intelligence, Surveillance and Reconnaissance Experimentation at the Canadian Forces
Experimentation Centre
Paul Comeau and Greg Van Bavel
Canadian Forces Experimentation Centre National Defence Headquarters
101 Colonel By Drive Ottawa, Canada K1A 0K2 [email protected]
Abstract
As part of its campaign to evaluate new Intelligence, Surveillance, and Reconnaissance (ISR) concepts and capabilities, the Canadian Forces Experimentation Centre conducted the Pacific Littoral ISR Experiment (PLIX) on Canada’s west coast from July 8 to 13, 2003. The objective of PLIX was to assess the utility of a multi-sensor, medium altitude, long endurance Uninhabited Aerial Vehicle (UAV) working within an Integrated ISR Architecture to enhance the Recognised Maritime Picture (RMP) within a specific littoral area of operations. Data from UAV sensor payloads, consisting of maritime patrol radar and EO/IR camera, was transmitted through a line-of-sight data link to a UAV ground control station at Tofino airport on Vancouver Island. An experimental Integrated ISR Architecture (IISRA) connected UAV operations in Tofino to the Maritime Operations Surveillance Centre at Canadian Forces Base Esquimalt, where the experimental RMP was constructed using input from the ordinary RMP and the information derived from the UAV sensors.
This paper characterises the littoral picture provided by the UAV over time, discuss the UAV radar's detection and tracking performance, provides an assessment of the IISRA effect on network latency and accuracy, and examines the target-track persistence in the experimental RMP and its effect on C2 and decision making. The IISRA response function and system entropy are characterized together with lessons learned in the areas of Human Factors, Research and Development needs, Infrastructure and Organization; Concepts & Doctrine; Information Management; and Equipment.
2
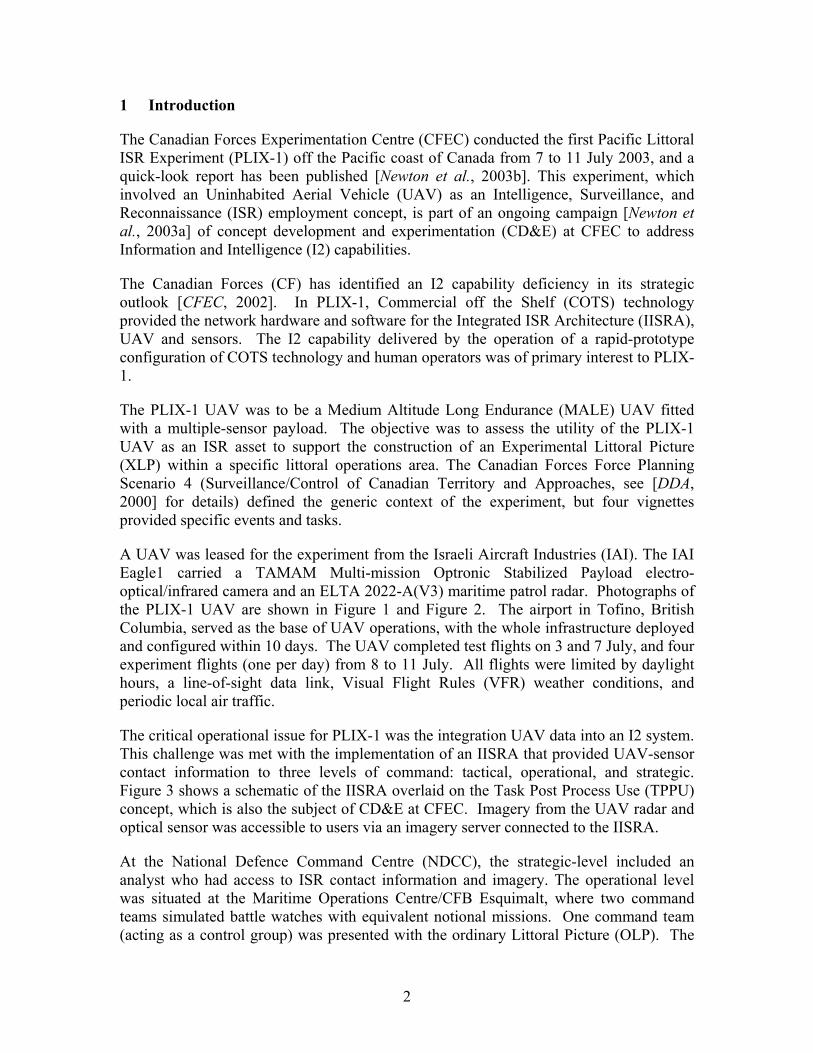
1 Introduction
The Canadian Forces Experimentation Centre (CFEC) conducted the first Pacific Littoral ISR Experiment (PLIX-1) off the Pacific coast of Canada from 7 to 11 July 2003, and a quick-look report has been published [Newton et al., 2003b]. This experiment, which involved an Uninhabited Aerial Vehicle (UAV) as an Intelligence, Surveillance, and Reconnaissance (ISR) employment concept, is part of an ongoing campaign [Newton et al., 2003a] of concept development and experimentation (CD&E) at CFEC to address Information and Intelligence (I2) capabilities.
The Canadian Forces (CF) has identified an I2 capability deficiency in its strategic outlook [CFEC, 2002]. In PLIX-1, Commercial off the Shelf (COTS) technology provided the network hardware and software for the Integrated ISR Architecture (IISRA), UAV and sensors. The I2 capability delivered by the operation of a rapid-prototype configuration of COTS technology and human operators was of primary interest to PLIX-1.
The PLIX-1 UAV was to be a Medium Altitude Long Endurance (MALE) UAV fitted with a multiple-sensor payload. The objective was to assess the utility of the PLIX-1 UAV as an ISR asset to support the construction of an Experimental Littoral Picture (XLP) within a specific littoral operations area. The Canadian Forces Force Planning Scenario 4 (Surveillance/Control of Canadian Territory and Approaches, see [DDA, 2000] for details) defined the generic context of the experiment, but four vignettes provided specific events and tasks.
A UAV was leased for the experiment from the Israeli Aircraft Industries (IAI). The IAI Eagle1 carried a TAMAM Multi-mission Optronic Stabilized Payload electro-optical/infrared camera and an ELTA 2022-A(V3) maritime patrol radar. Photographs of the PLIX-1 UAV are shown in Figure 1 and Figure 2. The airport in Tofino, British Columbia, served as the base of UAV operations, with the whole infrastructure deployed and configured within 10 days. The UAV completed test flights on 3 and 7 July, and four experiment flights (one per day) from 8 to 11 July. All flights were limited by daylight hours, a line-of-sight data link, Visual Flight Rules (VFR) weather conditions, and periodic local air traffic.
The critical operational issue for PLIX-1 was the integration UAV data into an I2 system. This challenge was met with the implementation of an IISRA that provided UAV-sensor contact information to three levels of command: tactical, operational, and strategic. Figure 3 shows a schematic of the IISRA overlaid on the Task Post Process Use (TPPU) concept, which is also the subject of CD&E at CFEC. Imagery from the UAV radar and optical sensor was accessible to users via an imagery server connected to the IISRA.
At the National Defence Command Centre (NDCC), the strategic-level included an analyst who had access to ISR contact information and imagery. The operational level was situated at the Maritime Operations Centre/CFB Esquimalt, where two command teams simulated battle watches with equivalent notional missions. One command team (acting as a control group) was presented with the ordinary Littoral Picture (OLP). The

3
OLP was an area-specific subset of the Recognised Maritime Picture (RMP), which was constructed with existing ISR assets. The other command team developed the XLP within the PLIX-1 Operations Area (OPAREA), which is shown in Figure 4. The XLP was the aggregate of selected information from the OLP and the PLIX-1 UAV sensors. The tactical level, which was located at Tofino, consisted of the UAV mission Tactical Command (TCOM) and level-1 analysis, which provided the Tofino Littoral Picture (TLP) consisting of the full set of PLIX-1 UAV sensor data
(Note: Section 8, on page 24, provides a table of abbreviations and glossary for easy reference)
Figure 1: The IAI Eagle 1 (PLIX-1 UAV) at the Tofino Airport
Figure 2: The IAI Eagle 1 (PLIX-1 UAV) on the Tofino Runway

4
Figure 3: The PLIX-1 IISRA Schematic and the TPPU Intelligence Cycle
50° N
51° N
48° N
49° N
124° W 128° W 126° W
50
Tofino Airport
Esquimalt
030
CYR 106
100 km
PLIX-1 OPAREA
Horizon limit of GCS to AVX-1 linkSubsection of CYR 106NOTAM Extension
Figure 4: The PLIX-1 Operations Area
5
By definition, a hypothesis is a proposition to test, as opposed to a promise to keep. The experiment was undertaken because the precise nature of the I2 capability that the PLIX-1 UAV and IISRA could deliver was unknown. The experiment hypothesis was as follows:
If PLIX-1 UAV patrols a designated operations area of littoral waters, then all surface contacts are detected, continuously tracked, and positively identified in the experimental RMP of the operations area before the end of the patrol.
Clearly, if one contact was not identified, then the hypothesis was false. Therefore, the PLIX-1 hypothesis was falsifiable. It was framed in consultation with the military sponsor and other stakeholders.
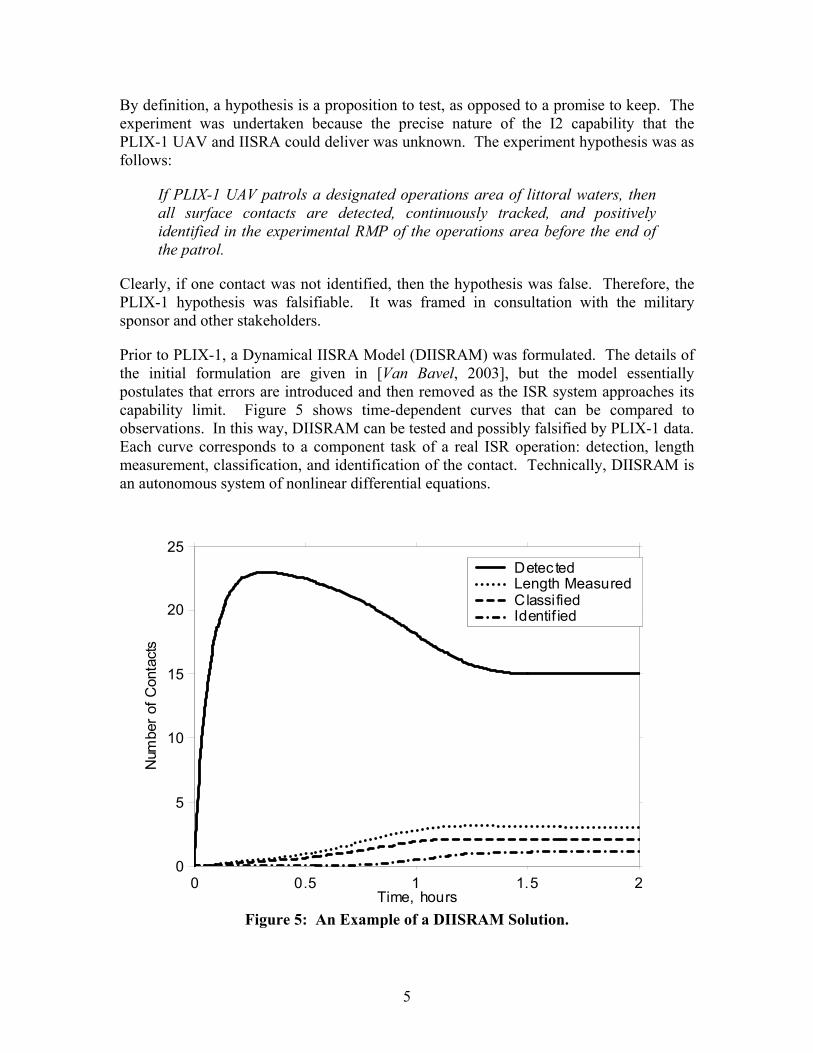
Prior to PLIX-1, a Dynamical IISRA Model (DIISRAM) was formulated. The details of the initial formulation are given in [Van Bavel, 2003], but the model essentially postulates that errors are introduced and then removed as the ISR system approaches its capability limit. Figure 5 shows time-dependent curves that can be compared to observations. In this way, DIISRAM can be tested and possibly falsified by PLIX-1 data. Each curve corresponds to a component task of a real ISR operation: detection, length measurement, classification, and identification of the contact. Technically, DIISRAM is an autonomous system of nonlinear differential equations.
Figure 5: An Example of a DIISRAM Solution.
0 0.5 1 1.5 20
5
10
15
20
25
Time, hours
Num
ber o
f Con
tact
s
Detec tedLength MeasuredClassifiedIdentif ied
6
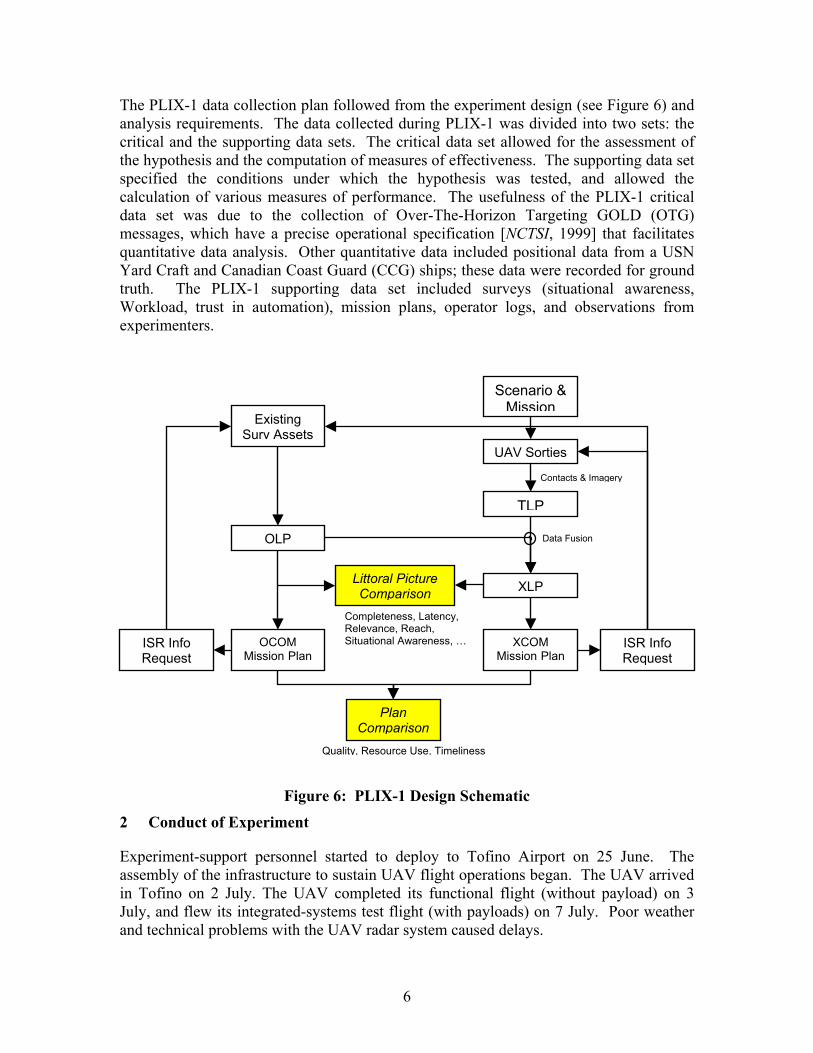
The PLIX-1 data collection plan followed from the experiment design (see Figure 6) and analysis requirements. The data collected during PLIX-1 was divided into two sets: the critical and the supporting data sets. The critical data set allowed for the assessment of the hypothesis and the computation of measures of effectiveness. The supporting data set specified the conditions under which the hypothesis was tested, and allowed the calculation of various measures of performance. The usefulness of the PLIX-1 critical data set was due to the collection of Over-The-Horizon Targeting GOLD (OTG) messages, which have a precise operational specification [NCTSI, 1999] that facilitates quantitative data analysis. Other quantitative data included positional data from a USN Yard Craft and Canadian Coast Guard (CCG) ships; these data were recorded for ground truth. The PLIX-1 supporting data set included surveys (situational awareness, Workload, trust in automation), mission plans, operator logs, and observations from experimenters.
Figure 6: PLIX-1 Design Schematic
2 Conduct of Experiment
Experiment-support personnel started to deploy to Tofino Airport on 25 June. The assembly of the infrastructure to sustain UAV flight operations began. The UAV arrived in Tofino on 2 July. The UAV completed its functional flight (without payload) on 3 July, and flew its integrated-systems test flight (with payloads) on 7 July. Poor weather and technical problems with the UAV radar system caused delays.
XLP
TLP
OLP
XCOM Mission Plan
OCOM Mission Plan
Plan Comparison
UAV Sorties
ISR Info Request
Scenario & Mission
Existing Surv Assets
Littoral Picture Comparison
X
Contacts & Imagery
Quality, Resource Use, Timeliness
Completeness, Latency, Relevance, Reach, Situational Awareness, …ISR Info
Request
Data Fusion
7
Initial assembly of the experimental IISRA was postponed until 2 July, thereby reducing the set-up and testing schedule. Security considerations affected the network configuration, because the UAV payload data and information were to be separated from the real-world RMP. As a result, the interaction of the operators with the IISRA continually developed as their understanding of the IISRA grew. However, before the end of the experiment, all IISRA elements were functional.
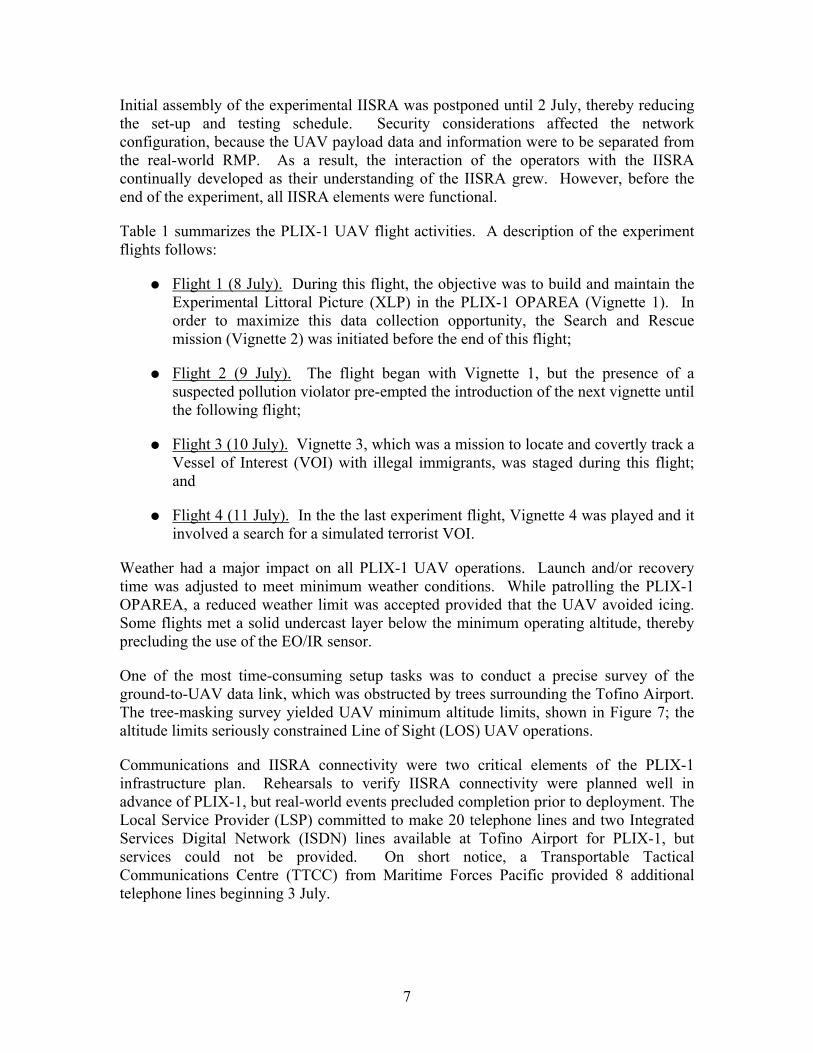
Table 1 summarizes the PLIX-1 UAV flight activities. A description of the experiment flights follows:
Flight 1 (8 July). During this flight, the objective was to build and maintain the Experimental Littoral Picture (XLP) in the PLIX-1 OPAREA (Vignette 1). In order to maximize this data collection opportunity, the Search and Rescue mission (Vignette 2) was initiated before the end of this flight;
Flight 2 (9 July). The flight began with Vignette 1, but the presence of a suspected pollution violator pre-empted the introduction of the next vignette until the following flight;
Flight 3 (10 July). Vignette 3, which was a mission to locate and covertly track a Vessel of Interest (VOI) with illegal immigrants, was staged during this flight; and
Flight 4 (11 July). In the the last experiment flight, Vignette 4 was played and it involved a search for a simulated terrorist VOI.
Weather had a major impact on all PLIX-1 UAV operations. Launch and/or recovery time was adjusted to meet minimum weather conditions. While patrolling the PLIX-1 OPAREA, a reduced weather limit was accepted provided that the UAV avoided icing. Some flights met a solid undercast layer below the minimum operating altitude, thereby precluding the use of the EO/IR sensor.
One of the most time-consuming setup tasks was to conduct a precise survey of the ground-to-UAV data link, which was obstructed by trees surrounding the Tofino Airport. The tree-masking survey yielded UAV minimum altitude limits, shown in Figure 7; the altitude limits seriously constrained Line of Sight (LOS) UAV operations.
Communications and IISRA connectivity were two critical elements of the PLIX-1 infrastructure plan. Rehearsals to verify IISRA connectivity were planned well in advance of PLIX-1, but real-world events precluded completion prior to deployment. The Local Service Provider (LSP) committed to make 20 telephone lines and two Integrated Services Digital Network (ISDN) lines available at Tofino Airport for PLIX-1, but services could not be provided. On short notice, a Transportable Tactical Communications Centre (TTCC) from Maritime Forces Pacific provided 8 additional telephone lines beginning 3 July.

8
Table 1: Summary of PLIX-1 UAV Activity (from [Newton et al., 2003b])
July Type Take Off Landing Flying Time (hours) Remarks
3 Functional Test 1630 L 1702 L 0.53 Without
Payloads 4 Systems Test Cancelled – Radar unserviceable
6 Systems Test Cancelled – Weather
7 Systems Test 1310 L 1520 L 2.17 With Payloads
Total Test-Flight Time 2.70
8 Experiment Flight 1 1201 L 1613 L 4.20
9 Experiment Flight 2 1252 L 1858 L 6.10
Suspect Pollution Violator
10 Experiment Flight 3 1058 L 1658 L 6.00
11 Experiment Flight 4 1200 L 1508 L 3.13
13 Experiment Flight 5 Cancelled – Weather
Total Experiment Flight Time 19.43
PLIX-1 represented the first time that a UAV was integrated into Canadian domestic airspace. Airspace integration procedures were established well in advance of the deployment. For airspace and flight safety, the Flight Approval Authority dictated that the CF provide radar coverage of the uncontrolled Tofino airfield, one flight-safety officer, and one aerospace controller. All PLIX-1 airspace reservations and associated Notice to Airmen (NOTAM) were communicated to local airports prior to the start of UAV flights. Radio procedures for an uncontrolled aerodrome were used during PLIX-1 UAV flights. Air-traffic de-confliction delayed either the launch or the recovery of the UAV several times. The restricted (Class F) airspace over the PLIX-1 OPAREA was activated and deactivated as required through Vancouver air traffic control centre. The PLIX-1 UAV was tracked, on radar and optically, as far as 22 km, which allowed for the maintenance of a safe separation from all observed air traffic. Radio Frequency (RF) spectrum approval for PLIX-1 was difficult, because the UAV contractor needed to modify their system to satisfy Canadian RF regulations.

9
Figure 7: Line of Sight Operations Restrictions on the PLIX-1 UAV Altitude, in Feet Above Ground Level (from [Newton et al., 2003b]). Extensive data collection took place during PLIX-1. All significant events, decisions and actions were captured through event logs, together with Global Command and Control System – Maritime (GCCS-M) Over the Horizon – Targeting GOLD (OTG) message traffic, independent contact logs, reference vessel positions, operating picture screen shots for both OCOM and XCOM, UAV-sensor imagery, team mission plans, and various underlying conditions (weather, network serviceability).
10
3 Analysis
The variety of data collected at PLIX-1 has supported a multifaceted analysis, which is still ongoing. This section presents specific results obtained from processing automatically collected OTG messages, and more general results obtained from many data sources. It is not possible to present all results in this paper; therefore, the following presentation is a limited sample of results from 9 July.
3.1 Littoral Picture Comparison
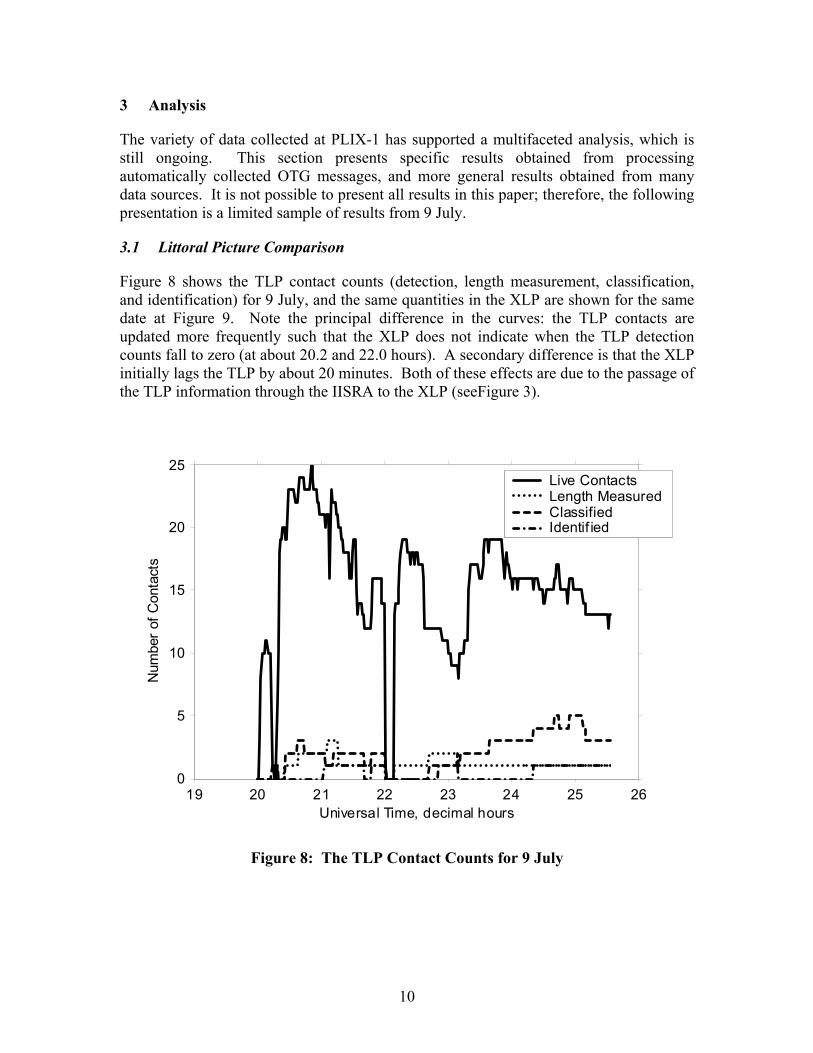
Figure 8 shows the TLP contact counts (detection, length measurement, classification, and identification) for 9 July, and the same quantities in the XLP are shown for the same date at Figure 9. Note the principal difference in the curves: the TLP contacts are updated more frequently such that the XLP does not indicate when the TLP detection counts fall to zero (at about 20.2 and 22.0 hours). A secondary difference is that the XLP initially lags the TLP by about 20 minutes. Both of these effects are due to the passage of the TLP information through the IISRA to the XLP (seeFigure 3).
Figure 8: The TLP Contact Counts for 9 July
19 20 21 22 23 24 25 260
5
10
15
20
25
Universal Time, decimal hours
Num
ber o
f Con
tact
s
Live ContactsLength MeasuredClassifiedIdentif ied

11
Figure 9: The XLP Contact Counts for 9 July
3.2 Mission Plan Comparison
Table 2 summarises the Ordinary Command (OCOM) and the Experimental Command (XCOM) mission planning efforts. Mission plans were captured as a paper exercise and so were not executed. Abbreviations found only in Table 2 are defined as follows:
CC115: a multipurpose aircraft; CH-124: the maritime (Sea King) helicopter; CP 140: a maritime patrol aircraft; ELINT: Electronic Intelligence; FFH: Frigate with helicopter; JTF2: Joint Task Force 2 (i.e. a special operations unit); MCDV: Maritime Coastal Defence Vessel; SAR: Search and Rescue; SSE: Signals Surveillance Element; and RFI: Request for Information.
19 20 21 22 23 24 25 260
5
10
15
20
25
Universal Time, decimal hours
Num
ber o
f Con
tact
sLive ContactsLength MeasuredClassifiedIdentified

12
Table 2: A Summary of the OCOM and XCOM Mission Plans
Date / Mission OCOM
Assets Tasked Stdby+Transit/Task
General Observations
XCOM Outcome
8 JUL 03 SAR Overdue Vessel
CC115 2+3.5 hrs Hourly ELINT RFI thru SSE
UAV track not recorded in GCCS
UAV locates vessel after 4 hrs CH-124 to assist 2+3hrs
9 JUL 03 Immigrant Smuggler / Polluter
CC115 0.5+2hrs CP140 U/S
UAV track recorded C115 cued by poss ELINT after 1 hr
VOI id at 2.5hrs Pollution violator located after 3.8hrs
10 JUL 03 Terrorist Vessel
CP140 1 +8 hrs CCG 3+ hrs
Frequent Track re-indexing GCCS drops tracks
VOI not detected in 6 hrs CP140 on 1hr stdby
11 JUL 03 Terrorist Vessel (Continued)
CP140 1 + 10 hrs 2 MCDV 16+ hrs FFH 12+ hrs JTF2
OCOM/XCOM risk assessments vary Ships continue search despite weather
VOI may have been tracked for 35 minutes. Mission cancelled due to weather at 3 hrs.
Significant resources were planned for deployment by OCOM given the information available to them as compared to XCOM. Unfortunately CP140 aircraft would have been unavailable to deploy during parts of the experiment. In the case of the terrorist vessel, XCOM had high confidence of locating and tracking the VOI, while OCOM assigned significant assets to carry out ISR tasks and to prosecute. Detection and continuous tracking of the VOI was not achieved in the last 2 missions. We discuss some of the reasons here.
3.3 Tracking Performance
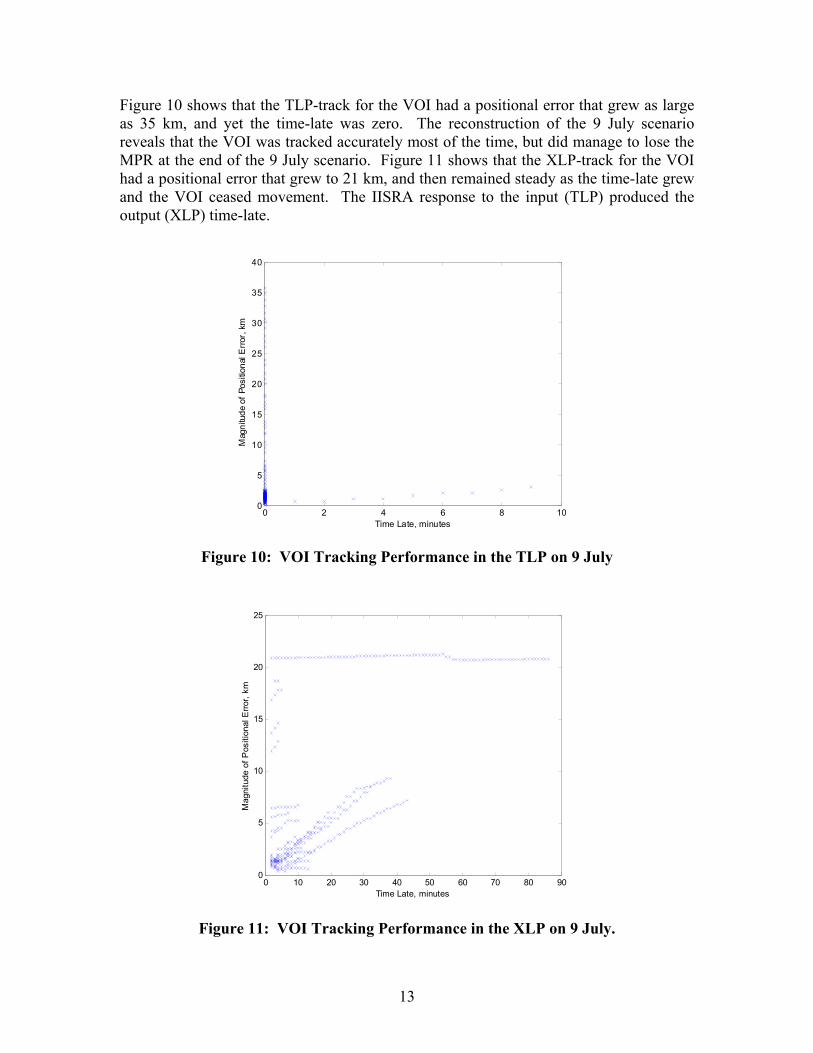
The tracking performance of the VOI is computed using the OTG position reports for the Maritime Patrol Radar (MPR) onboard the PLIX-1 UAV and the self-recorded position data from the VOI (U. S. Navy Yard Craft AGATE PASSAGE). Figure 10 shows the scatter plot of the magnitude of the positional error versus time-late in the TLP on 9 July; Figure 11 shows a similar plot for the XLP. For each contact, time-late is defined as the current time relative to the time of the latest position report.
Time late can account for a positional error, because a contact continues to move while its last position report grows stale. In the TLP (Figure 10), there is only one case where an increase in time-late accounts for an increase of positional error, whereas in the XLP (Figure 11) there are many cases. When time-late is small and the positional error is greater than 2 km (the system resolution), then the contact is not tracked accurately.
13
Figure 10 shows that the TLP-track for the VOI had a positional error that grew as large as 35 km, and yet the time-late was zero. The reconstruction of the 9 July scenario reveals that the VOI was tracked accurately most of the time, but did manage to lose the MPR at the end of the 9 July scenario. Figure 11 shows that the XLP-track for the VOI had a positional error that grew to 21 km, and then remained steady as the time-late grew and the VOI ceased movement. The IISRA response to the input (TLP) produced the output (XLP) time-late.
0 2 4 6 8 100
5
10
15
20
25
30
35
40
Time Late, minutes
Mag
nitu
de o
f Pos
ition
al E
rror,
km
Figure 10: VOI Tracking Performance in the TLP on 9 July
0 10 20 30 40 50 60 70 80 900
5
10
15
20
25
Time Late, minutes
Mag
nitu
de o
f Pos
ition
al E
rror,
km
Figure 11: VOI Tracking Performance in the XLP on 9 July.

14
3.4 Time Late
As was mentioned above, the time-late is defined (for each contact) as the current time relative to the time of the latest report. Figure 12 shows the cumulative time-late distribution for 9 July for all contacts (including the VOI); the nonparametric Kolmogorov-Smirnov test indicates that the difference in the two distributions is highly significant. Therefore, the PLIX-1 IISRA had a significant effect on the contacts’ time-late.
Figure 12: Time Late Cumulative Distributions for 9 July
Time-late cumulative probability levels are shown in Figure 13, where it is evident that a few contacts with the greatest time-late (the 95% level) were not updated regularly in the TLP and the XLP, whereas the median (the 50% level) and the least time-late (the 5% level) contacts were better updated in the XLP and best updated in the TLP.
The entropy of the time-late distribution for all contacts can be calculated from the observed probability (occupancy fraction) of contacts in each time-late state (i.e. use the Shannon entropy formula). Figure 14 shows the entropy versus time on July 9; note that the sudden decrease in the TLP entropy (at about 23:10 UT) corresponds to when the mission turned its attention away from the suspected pollution violator and returned to maintaining the entire littoral picture. With effort, it appears that entropy can be reduced in an information system.
0 50 100 150 200 250 3000
10
20
30
40
50
60
70
80
90
100
Time Late, Minutes
Cul
ulat
ive
Prob
abili
ty, %
TLPXLP

15
20 21 22 23 24 25 26 270
100
200
300
95%
Lev
el T
ime-
Late
, Min
utes
20 21 22 23 24 25 26 270
50
100
50%
Lev
el T
ime-
Late
, Min
utes
20 21 22 23 24 25 26 270
20
40
60
5% L
eve
l Tim
e-L
ate,
Min
ute
s
Time, Decimal Hours UT
TLPXLP
TLPXLP
TLPXLP
Figure 13: Cumulative Time Late Probability Levels for 9 July
20 21 22 23 24 25 26 27
0
0.5
1
1.5
2
2.5
Time, Decimal Hours UT
Ent
ropy
of T
ime-
Late
Dis
tribu
tion
TLPXLP
Figure 14: Entropy of the Time-Late Distribution on 9 July.
16
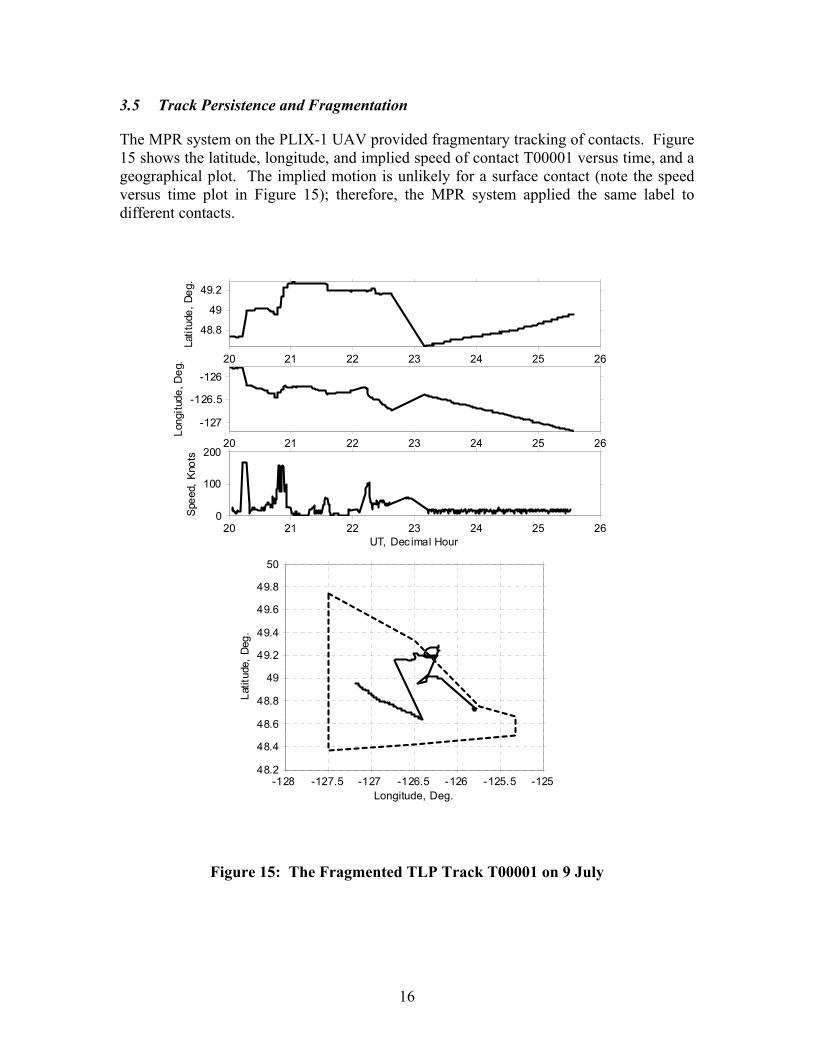
3.5 Track Persistence and Fragmentation
The MPR system on the PLIX-1 UAV provided fragmentary tracking of contacts. Figure 15 shows the latitude, longitude, and implied speed of contact T00001 versus time, and a geographical plot. The implied motion is unlikely for a surface contact (note the speed versus time plot in Figure 15); therefore, the MPR system applied the same label to different contacts.
20 21 22 23 24 25 26
48.8
49
49.2
Latit
ude,
Deg
.
20 21 22 23 24 25 26
-127
-126.5
-126
Long
itude
, Deg
.
20 21 22 23 24 25 260
100
200
Spee
d, K
nots
UT, Dec imal Hour
-128 -127.5 -127 -126.5 -126 -125.5 -12548.2
48.4
48.6
48.8
49
49.2
49.4
49.6
49.8
50
Latit
ude,
Deg
.
Longitude, Deg.
Figure 15: The Fragmented TLP Track T00001 on 9 July
17
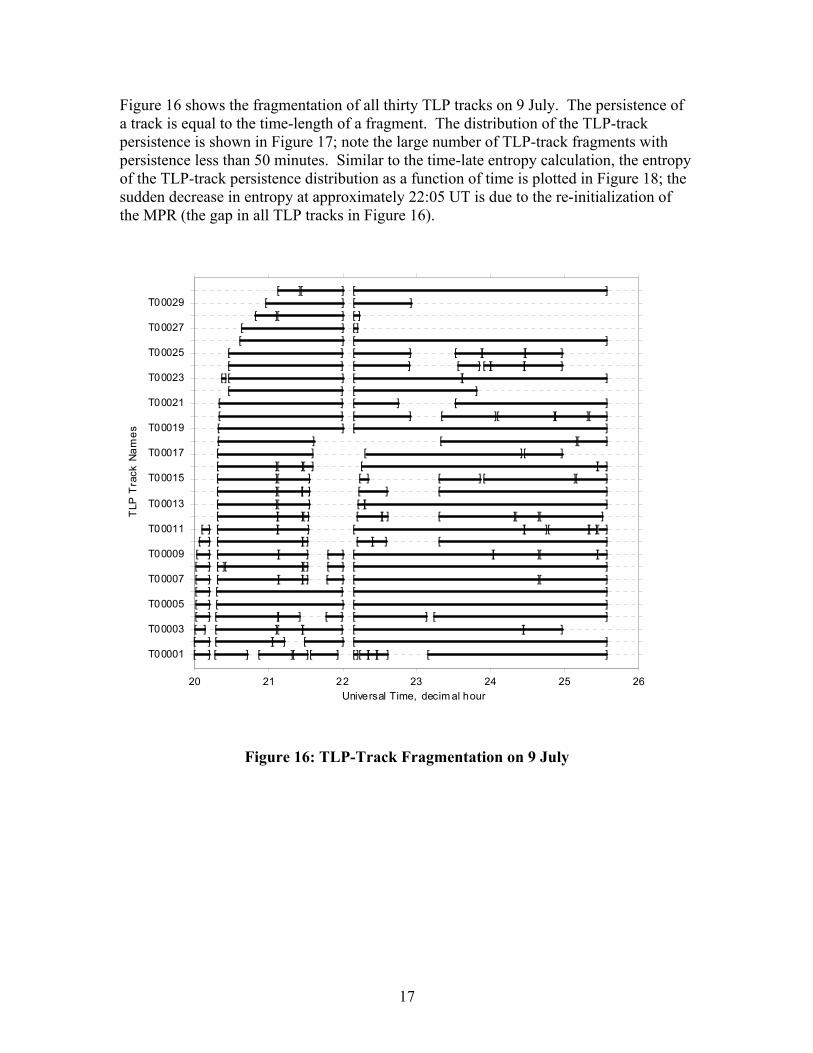
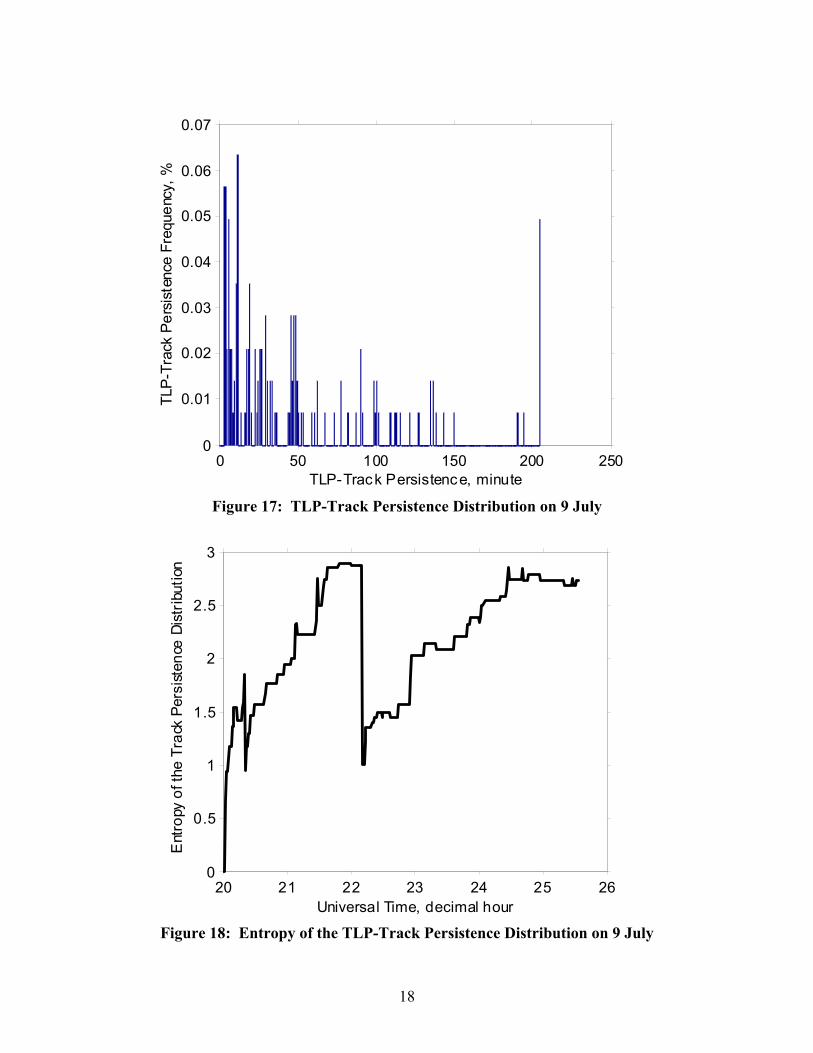
Figure 16 shows the fragmentation of all thirty TLP tracks on 9 July. The persistence of a track is equal to the time-length of a fragment. The distribution of the TLP-track persistence is shown in Figure 17; note the large number of TLP-track fragments with persistence less than 50 minutes. Similar to the time-late entropy calculation, the entropy of the TLP-track persistence distribution as a function of time is plotted in Figure 18; the sudden decrease in entropy at approximately 22:05 UT is due to the re-initialization of the MPR (the gap in all TLP tracks in Figure 16).
20 21 22 23 24 25 26
T00001
T00003
T00005
T00007
T00009
T00011
T00013
T00015
T00017
T00019
T00021
T00023
T00025
T00027
T00029
[ ] [ ] [ ][ ][ ] [][ ][ ][ ] [ ][ ] [ ][ ] [ ] [ ][ ] [ ][ ][ ] [ ][ ][ ] [ ][ ] [ ] [ ] [ ][ ] [ ] [ ][ ] [ ] [ ][ ] [ ][ ][ ] [ ] [ ][ ][ ] [ ][ ][] [ ] [ ][ ] [ ][ ] [ ] [ ][ ][ ][ ][ ] [ ][ ] [ ][ ] [ ][ ] [ ][ ] [ ][ ][ ][ ][ ]
[ ][ ][ ] [ ][ ] [ ][ ][ ][ ][ ] [ ][ ][ ][ ][ ] [ ] [ ][ ][ ] [ ] [ ] [ ][ ][ ][ ][ ] [ ][ ][ ] [ ][ ][ ] [ ][ ][ ] [ ][ ] [ ] [ ][ ][ ][ ][ ] [ ] [ ]
[ ] [ ][][ ] [ ][ ]
[ ] [ ] [ ] [ ][ ][ ][ ] [ ] [ ][ ][ ]
[ ] [ ][ ] []
[ ][ ] [ ][ ] [ ]
[ ][ ] [ ]
TLP
Tra
ck N
ames
Universal Time, decim al hour
Figure 16: TLP-Track Fragmentation on 9 July
18
0 50 100 150 200 2500
0.01
0.02
0.03
0.04
0.05
0.06
0.07
TLP-Track Persistence, minute
TLP-
Trac
k Pe
rsis
tenc
e Fr
eque
ncy,
%
Figure 17: TLP-Track Persistence Distribution on 9 July
20 21 22 23 24 25 260
0.5
1
1.5
2
2.5
3
Universal Time, decimal hour
Ent
ropy
of t
he T
rack
Per
sist
ence
Dis
trib
utio
n
Figure 18: Entropy of the TLP-Track Persistence Distribution on 9 July

19
3.6 The PLIX-1 Data and the Dynamical Model
An analysis of the uncertainty (or errors) in the TLP contact counts must be completed before a goodness-of-fit test can be applied to any attempt to fit the Dynamical IISRA Model (DIISRAM) to PLIX-1 data. DIISRAM predicted that after an increase from their initial conditions, the contact counts achieve a steady-state. It is assumed that fluctuations in the number of MPR detections are binomially distributed about the steady-state value. Table 3 shows the results of the uncertainty analysis.
Table 3: Contact Count Binomial Distribution Parameters and Uncertainty Estimates
Binomial Distribution Parameters Day of
July
Sample Size (Steady-State
Histogram) Probability of
Detection Number of Targets in
PLIX-1 OPAREA Standard Deviation
8 16 86% 17 1.4 9 21 90% 17 1.2
10 31 75% 18 1.8 11 11 97% 25 0.9
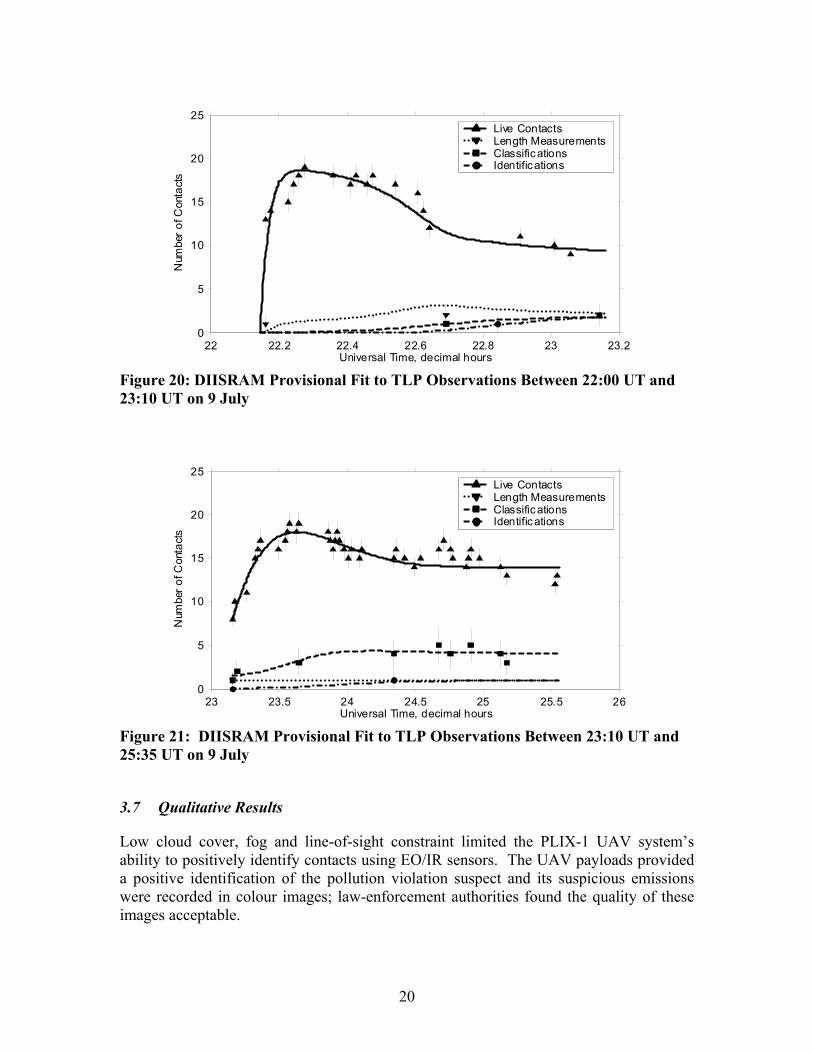
Figure 19, Figure 20, and Figure 21 show examples of provisional fits of DIISRAM to TLP observations for three time intervals on 9 July. The observed data are plotted as symbols (see included legend) with error bars, and the DIISRAM solutions are plotted as curves (the line styles are the same as Figure 5). Note that DIISRAM accounts for the initial “overshoot” in the number of live contacts due to the introduction of spurious contacts, and then the subsequent fall in the contact count as errors are corrected during efforts to length-measure, classify and identify the contacts.
20.2 20.4 20.6 20.8 21 21.2 21.4 21.6 21.8 22 22.20
5
10
15
20
25
30
Universal Time, decimal hours
Num
ber o
f Con
tact
s
Live ContactsLength MeasurementsClassificationsIdentifications
Figure 19: DIISRAM Provisional Fit to TLP Observations Between 20:00 UT and 22:00 UT on 9 July
20
22 22.2 22.4 22.6 22.8 23 23.20
5
10
15
20
25
Universal Time, decimal hours
Num
ber o
f Con
tact
s
Live ContactsLength MeasurementsClassificationsIdentifications
Figure 20: DIISRAM Provisional Fit to TLP Observations Between 22:00 UT and 23:10 UT on 9 July
23 23.5 24 24.5 25 25.5 260
5
10
15
20
25
Universal Time, decimal hours
Num
ber o
f Con
tact
s
Live ContactsLength MeasurementsClassificationsIdentifications
Figure 21: DIISRAM Provisional Fit to TLP Observations Between 23:10 UT and 25:35 UT on 9 July
3.7 Qualitative Results
Low cloud cover, fog and line-of-sight constraint limited the PLIX-1 UAV system’s ability to positively identify contacts using EO/IR sensors. The UAV payloads provided a positive identification of the pollution violation suspect and its suspicious emissions were recorded in colour images; law-enforcement authorities found the quality of these images acceptable.

21
The OLP was not the focus of the OCOM mission planning process; however, the OLP did provide adequate cueing to enable broad direction for planning search or reconnaissance missions. On 8 and 9 July, the XLP helped XCOM locate the VOI sooner than OCOM. The VOI evaded detection on 10 July. The simulated terrorist vessel was not identified on 11 July.
The IISRA evolved over the course of the experiment. Several technical and procedural issues were resolved as the system was operating, such that its effectiveness continually improved. The requirement to keep XLP tracks separate from RMP (real-world) tracks limited XLP track management (e.g. fusion with RMP tracks). Experiment track labels were maintained so that they could be filtered from the OCOM control group. The Tofino components of the IISRA included personnel to manually re-input TLP-track information before posting it to the XLP. The network security limited the experiment to one-way communication between Tofino and Esquimalt, precluding shared information and situational awareness between TCOM and XCOM. Operators and planners working with the XLP had a limited ability to understand new information within the IISRA, because information regarding updates, such as vessel classification (by type, or length), and identification were not put in the standard OTG fields. Cross-referencing and indexing of imagery with TLP-track number was not consistent.
The analysis of the surveys [Lichacz, 2004] was difficult, because PLIX-1 was a live field experiment rather than a fully controllable trial. The workload survey found that the perceived workload was lower for XCOM (21% NASA TLX) than for OCOM (38% NASA TLX). This may have been due, paradoxically from the lower level of information available. Trust in automation was higher for XCOM (7/10) than for OCOM (5/10) as measured on a subjective scale. Unfortunately, the Situational Awareness (SA) data was unusable, because questions were answered incorrectly. The ability to isolate subject variability was also a problem with the execution. Despite tracking issues and latency, confidence in the littoral picture was subjectively assessed to be greater for the XLP than for the OLP.
4 Conclusions
The PLIX-1 Hypothesis was falsified since not all contacts were classified and identified. The PLIX-1 UAV radar provided contact reports and input track data for the IISRA, but it had mixed success detecting and tracking the VOI. The IISRA significantly degraded the time-late (latency) of the UAV radar contacts. The TLP-target identities were ambiguous in the OTG data, which resulted from significant TLP-track fragmentation and varying TLP-track persistence. The IISRA response obscured these problems, such that the XLP appeared deceptively stable.
The fluctuation in the TLP-contact counts fit a binomial distribution, which yielded detection probabilities, number of targets in the PLIX-1 OPAREA, and uncertainties of the TLP-contact counts. The Dynamical IISRA Model accounted for the general time-evolution of contact characterization.

22
PLIX-1 highlighted the limitation of LOS UAV systems and emphasises the requirement for a Beyond Line of Sight (BLOS) capability. Radio frequency spectrum clearance, for either LOS or BLOS UAV systems, remains an issue that needs to be addressed well in advance of any future experiment.
Effective experiment control was hampered by both a lack of communication and a misunderstanding of experiment objectives. Training was not sufficient to reduce confounding of learning curve effects from concepts. There was insufficient lead-time for IISRA design, integration, and testing. The data collection strategy also suffered because the opportunities for electronic data capture did not become apparent until the first complete implementation of the IISRA. PLIX-1 was small enough to allow contingency plans to be improvised; however, this may not have been possible in a larger experiment. The amount of the data was underestimated; hence, the post-experiment analysis has required an effort greater than anticipated.
An IISRA requires high quality and timely inputs from each sensor source. This experiment showed that sensor integration and track management must be achieved at source since multi-sensor data fusion remains one of the greatest challenges in ISR. Sensors and systems were limited by training, LOS operating constraints, information latency and loss, and weather conditions which together affected mission effectiveness. The later is especially relevant in Canadian surveillance operations. In addition, the lack of real time information sharing between the UAV crew and the Maritime Operations Centre affected optimal employment of the UAVs capabilities.
5 Recommendations
A series of recommendations were derived following this experiment. In terms of conduct of experiments:
• Experiment objectives must be well communicated.
• Require sufficient lead-time for training, “systems” design, integration, testing, and rehearsal.
• Strengthen any data collection strategy by maximizing electronic data capture.
• Develop contingency plans through a Master Events List (MEL), and plan to complete the bulk of analysis post-experiment.
Recommendations related to future operations were also derived. Air sense and operational experience, spatial awareness, and the cognitive skills associated with thinking in three-dimensions are requirements for the operation of a MALE UAV. MALE and HALE UAV platforms should be equipped with payloads that can operate and collect information in all weather conditions, and especially those conditions encountered in the Canadian coastal surveillance role. The CF must ensure that all UAV acquisitions have multiplexed sensors to support simultaneous acquisition and posting of all sensor data. Develop CF UAV CONOPS and Tactics Techniques and Procedures

23
(TTP) based upon lessons learned so far. Develop doctrine for BLOS UAV operations and experimentation.
The more experienced GCCS operators should be encouraged to share their expertise with the rest of the community through the establishment of a GCCS community of practice. It is recommended to develop a consolidated maritime contact database and the doctrine for the TPPU process within an IISRA. A RF spectrum approval process (for the wireless components of a IISRA) must be devised to satisfy operational requirements.
All information managed through the IISRA should have a reported margin of error, such as positional and course accuracy, imagery resolution. Since operators had difficulty maintaining awareness of information updates, the IISRA should have an alert system that prompts operators when mission-critical information is posted. The next IISRA experiment conducted by CFEC will ensure that the architecture includes secure two-way communications and wide bandwidth networks.
6 Summation
The first Pacific Littoral ISR Experiment was a successful event that generated much interest, many lessons learned and some practical recommendations. Detailed scientific analysis of the data has already revealed many relevant quantitative and qualitative features of real-world ISR operations, which could not have been generated in a synthetic environment. Lessons learned from this and earlier experiments are being combined and applied to the planning for the next experiment: the Atlantic Littoral ISR Experiment, to be held 10 to 31 August 2004. ALIX will use an expanded ISR architecture riding on operational networks, beyond line of sight MALE UAV, an improved network concept of operations which will engage other government departments, and an enhanced data analysis and collection strategy. PLIX-1 yielded insights that shall enhance the CF information and intelligence capability.
7 References
[CFEC, 2002] Canadian Forces Experimentation Centre (CFEC), Canadian Forces Joint Concept Development and Experimentation Plan (CF JCD&E Plan): Plan Pegasus, Department of National Defence (DND), May 2002.
[DDA, 2000] Director Defence Analysis, Descriptions–Departmental Force Planning Scenarios (FPS), DND, January 2000.
[Lichacz, 2004] Lichacz, F. M. J., Examining the effects of UAV enhanced maritime surveillance on situation awareness, workload, and trust in automation, Defence Research and Development Canada (DRDC) Technical Memo, submitted for review, June 2004.
[NCTSI, 1999] Navy Center for Tactical Systems Interoperability (NCTSI), Operational Specification for Over-the-Horizon Targeting GOLD, Revision C, U. S. Department of Defense, September 1999.

24
[Newton et al., 2003a] Newton, S. J., R. K. Bowes, G. H. Van Bavel, and P. Pace, Experiment Report IICDE – 001/2003 (Interim): Uninhabited Aerial Vehicle Concept Development and Experimentation, CFEC, August 2003.
[Newton et al., 2003b] Newton, S. J., M. M. Regush, P. Comeau, G. H. Van Bavel, and R. K. Bowes, Experiment Report–001/2003 (Quick Look) Pacific Littoral ISR Experiment–Part 1, CFEC, August 2003.
[Van Bavel, 2003] Van Bavel, G. H., Pacific Littoral ISR Experiment 1 Design, DND Operational Research Division (ORD), DOR(Joint) Research Note RN 2003/06, September 2003.
8 Abbreviations and Glossary
ALIX Atlantic Littoral ISR Experiment
BLOS Beyond Line of Sight
C2 Command and Control
CD&E Concept Development and Experimentation
CF Canadian Forces
CFEC Canadian Forces Experimentation Centre
COTS Commercial off the Shelf
DIISRAM Dynamical IISRA Model
EO/IR Electro-Optical / Infrared
Esquimalt The site of the operational-level command teams (XCOM and OCOM) and littoral pictures (XLP and OLP)
FPS Force Planning Scenario
GCS Ground Control Station for a UAV
I2 Information and Intelligence
identification The highest level of identification in CF maritime ISR doctrine (i.e. the name of the vessel)
IISRA Integrated ISR Architecture
ISR Intelligence, Surveillance, and Reconnaissance
LOS Line of Sight
MALE Medium Altitude Long Endurance, a class of UAV
MARPAC Maritime Forces Pacific

25
MPR Maritime Patrol Radar
NDCC National Defence Command Centre
NOTAM Notice to Airmen
OCOM Ordinary Command team, who use the OLP to plan their assigned mission.
OLP Ordinary Littoral Picture; a subset of the RMP focused on the PLIX-1 OPAREA
OPAREA Operations Area
OTG Over-The-Horizon Targeting GOLD; this abbreviation is defined in the Operational Specification [NCTSI, 1999], but OTH-GOLD is also in used instead.
OCOM Plan The Ordinary Command’s Mission Plan, which is generated by OCOM based upon the OLP
PLIX Pacific Littoral ISR Experiment (campaign)
PLIX-1 OPAREA The PLIX-1 UAV littoral operations area, near Vancouver Island
PLIX-1 UAV The UAV leased for PLIX-1, which was a MALE UAV equipped with multiple-sensors: synthetic aperture radar, and electro-optical/infrared camera
PLIX-N Pacific Littoral ISR Experiment N, where N = 1, and 2
RF Radio Frequency
RMP Recognized Maritime Picture; this operating picture is global in scope and maintained through international collaboration
SAR 1. Search and Rescue 2. Synthetic Aperture Radar
TCOM Tactical Command, based in Tofino at the UAV tactical-level base of operations
TLP Tofino Littoral Picture, which is constructed at the tactical level using data from the PLIX-1 UAV payloads only
Tofino The site of the tactical-level command and control; the Tofino Airport was the PLIX-1 UAV base of operations.
TPPU Task Post Process Use is an intelligence cycle or procedure under concept development for network-centric operations.

26
UAV Uninhabited Aerial Vehicle (also Unmanned Aerial Vehicle)
UT Universal Time
VFR Visual Flight Rules
Vignette 1 Wide Area Surveillance
Vignette 2 Search and Rescue of overdue ship / vessel-in-distress
Vignette 3 Locate and covertly track Vessel of Interest with illegal immigrants
Vignette 4 Locate, track, and provide targeting for Vessel of Interest with weapons of mass destruction
VOI Vessel of Interest represents either a vessel-in-distress or a threat to Canadian sovereignty and/or interests, played by the U. S. Navy Yard Craft AGATE PASSAGE
XCOM The Experimental Command team, who use the XLP to plan their assigned mission
XCOM Plan The Experimental Command’s Mission Plan, which is generated by XCOM based upon the XLP
XLP Experimental Littoral Picture, constructed in Esquimalt (the operational-level) by XCOM analysts