Coagulopathy and Goal Directed Hemostatic … Trauma... · Coagulopathy and Goal Directed...
57
Coagulopathy and Goal Directed Hemostatic Resuscitation in Pediatric Trauma Adam M. Vogel, MD Assistant Professor, Division of Pediatric Surgery Washington University in St. Louis School of Medicine December 3, 2013
Transcript of Coagulopathy and Goal Directed Hemostatic … Trauma... · Coagulopathy and Goal Directed...
Coagulopathy and Goal Directed Hemostatic Resuscitation in Pediatric
Trauma
Adam M. Vogel, MD Assistant Professor, Division of Pediatric Surgery
Washington University in St. Louis School of Medicine December 3, 2013
Disclosure
I have no relevant financial or nonfinancial relationships to disclose
Outline
• Acute coagulopathy of trauma • TEG
– Mechanics – Interpretation
• TEG in adults trauma • TEG in pediatric trauma • SLCH
Acute Coagulopathy of Trauma
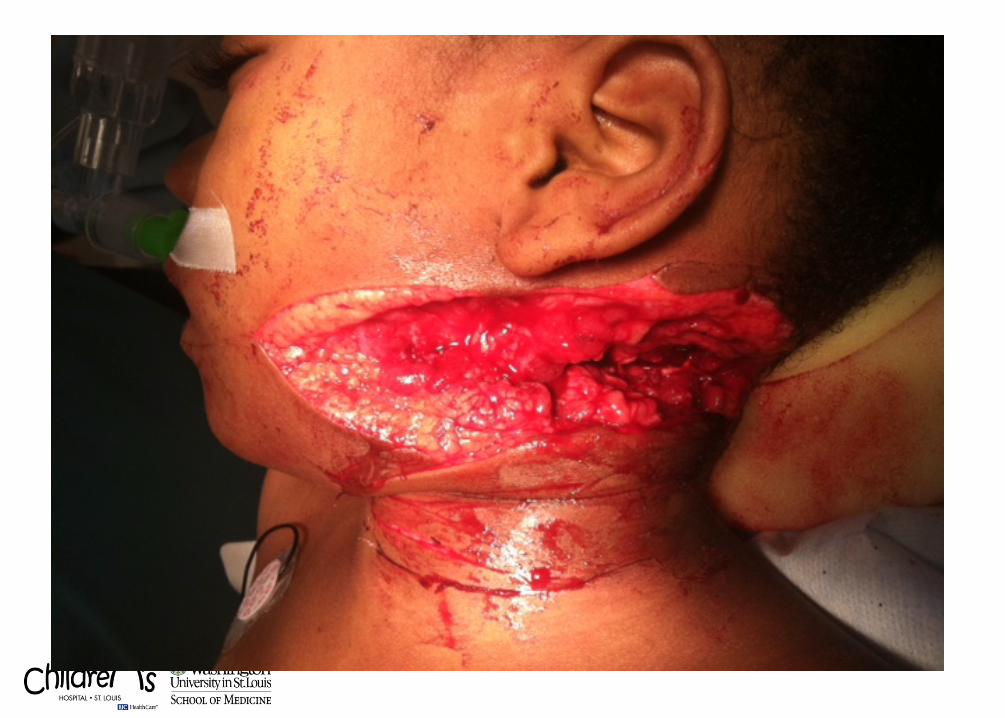
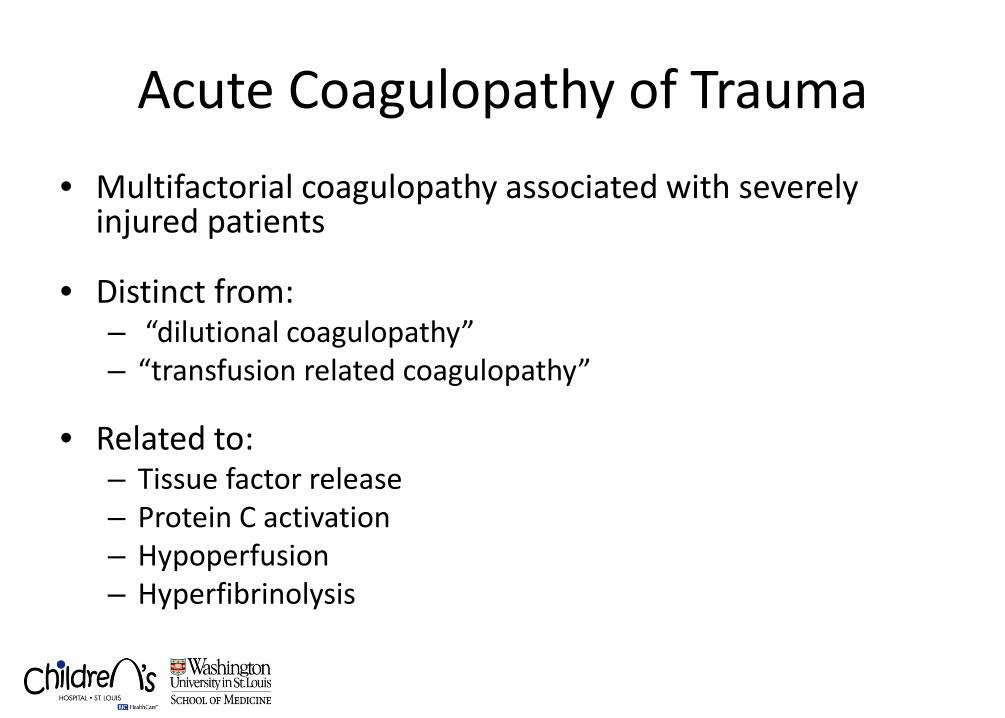
Acute Coagulopathy of Trauma • Multifactorial coagulopathy associated with severely
injured patients
• Distinct from: – “dilutional coagulopathy” – “transfusion related coagulopathy”
• Related to: – Tissue factor release – Protein C activation – Hypoperfusion – Hyperfibrinolysis
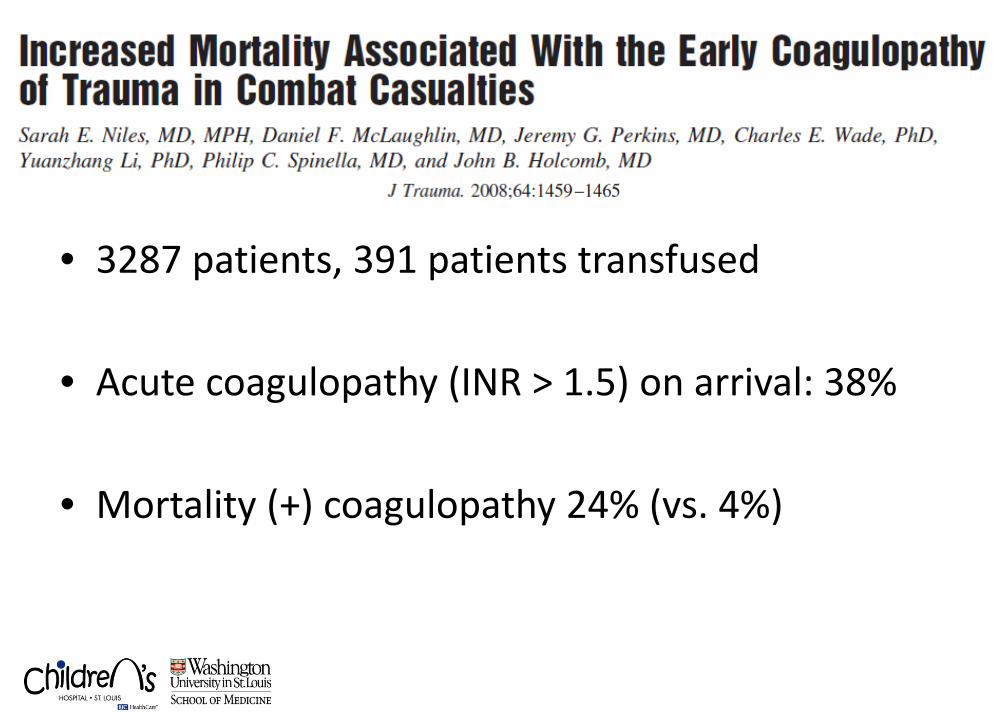
• 3287 patients, 391 patients transfused • Acute coagulopathy (INR > 1.5) on arrival: 38% • Mortality (+) coagulopathy 24% (vs. 4%)
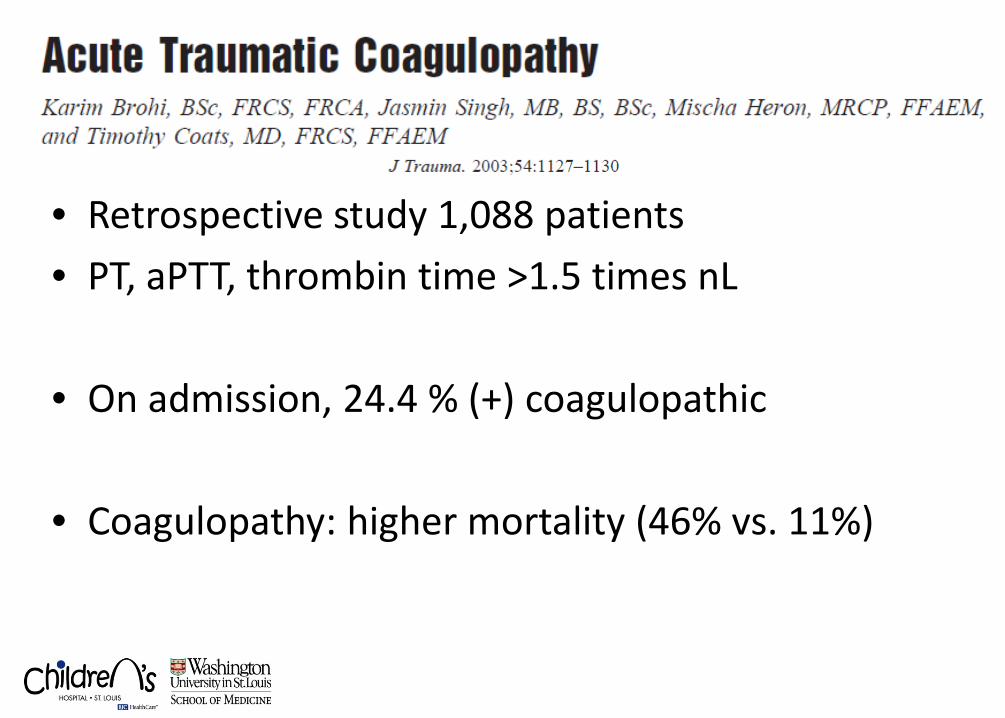
• Retrospective study 1,088 patients • PT, aPTT, thrombin time >1.5 times nL
• On admission, 24.4 % (+) coagulopathic
• Coagulopathy: higher mortality (46% vs. 11%)
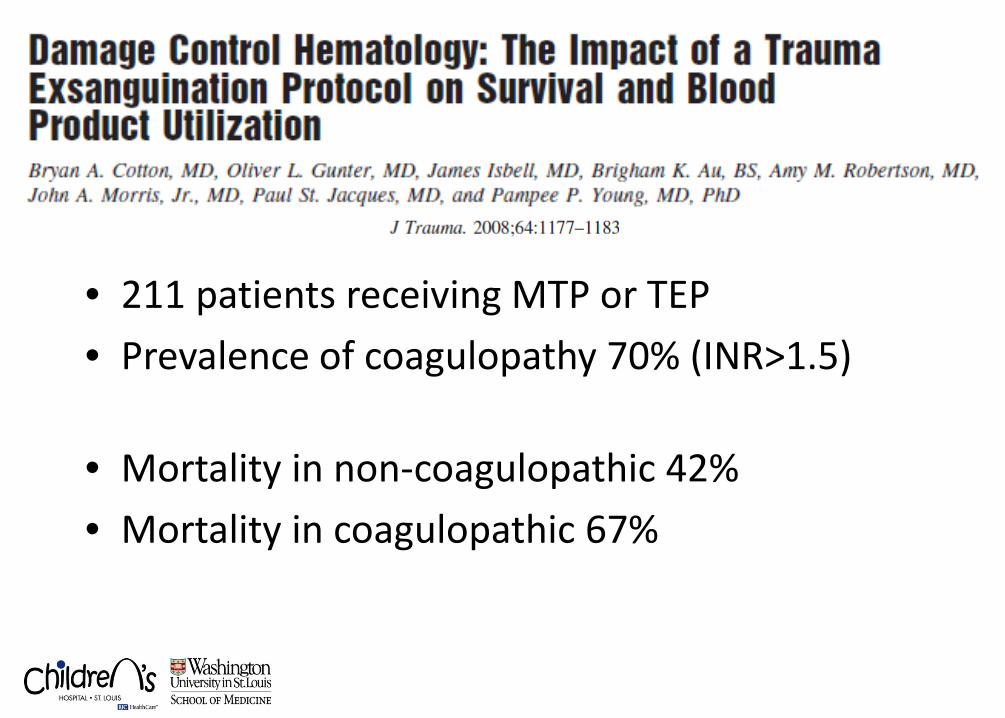
• 211 patients receiving MTP or TEP • Prevalence of coagulopathy 70% (INR>1.5)
• Mortality in non-coagulopathic 42% • Mortality in coagulopathic 67%
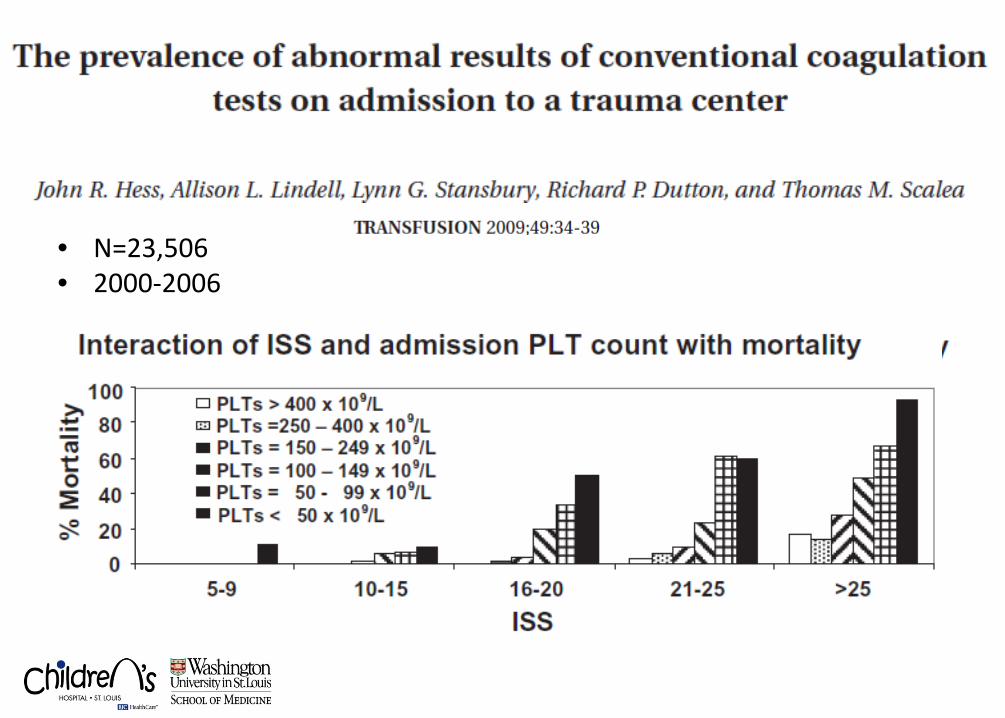
• N=23,506 • 2000-2006

In Children . . .
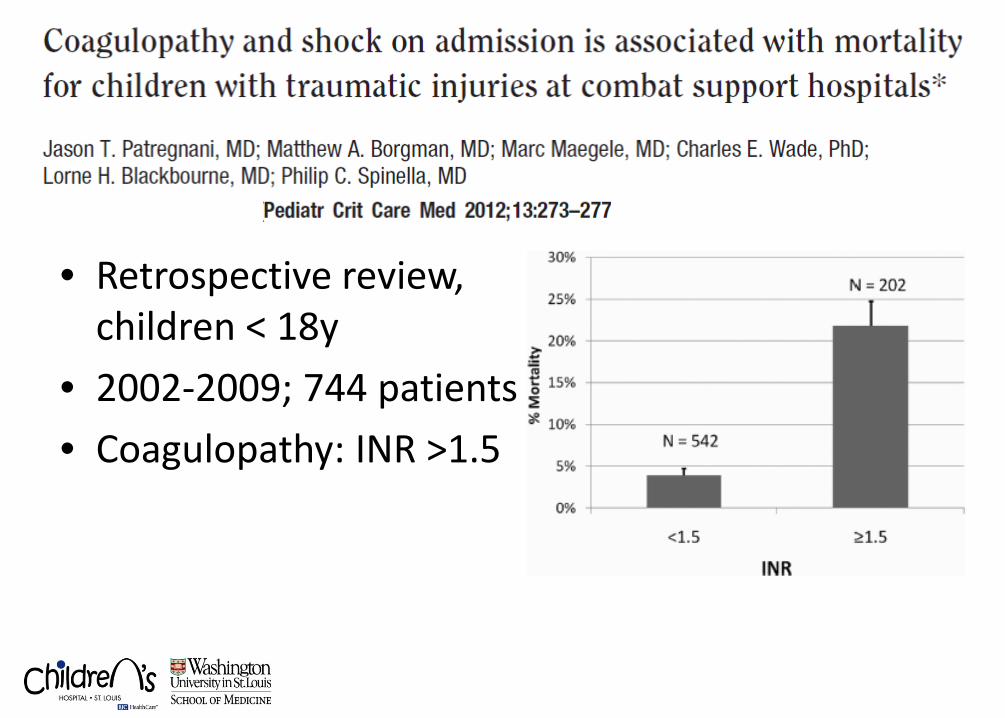
• Retrospective review, children < 18y
• 2002-2009; 744 patients • Coagulopathy: INR >1.5
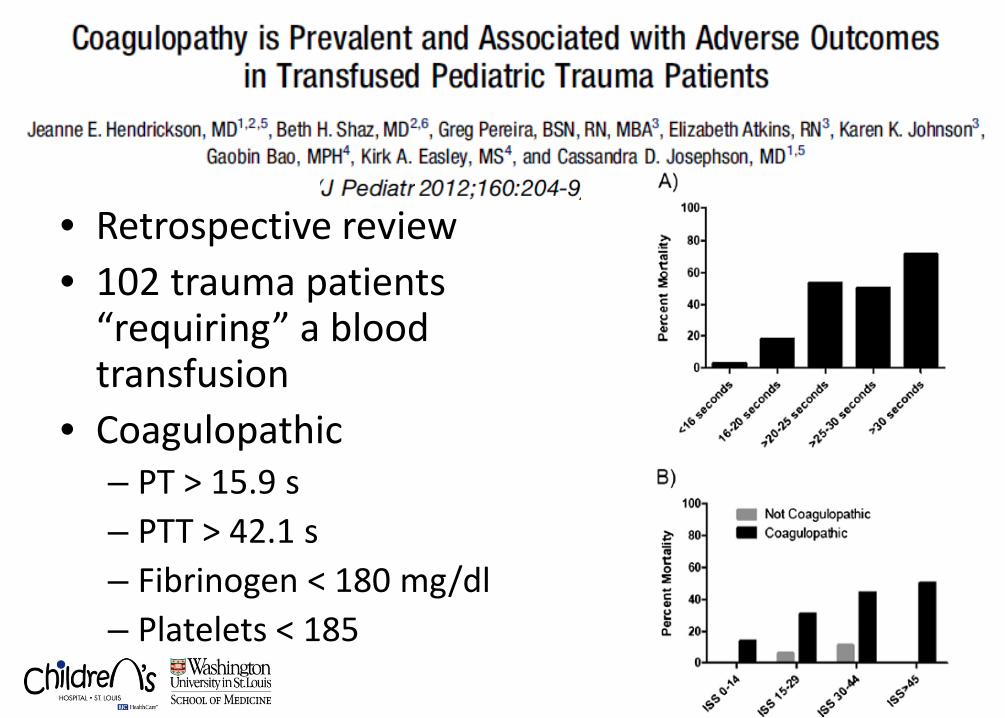
• Retrospective review • 102 trauma patients
“requiring” a blood transfusion
• Coagulopathic – PT > 15.9 s – PTT > 42.1 s – Fibrinogen < 180 mg/dl – Platelets < 185
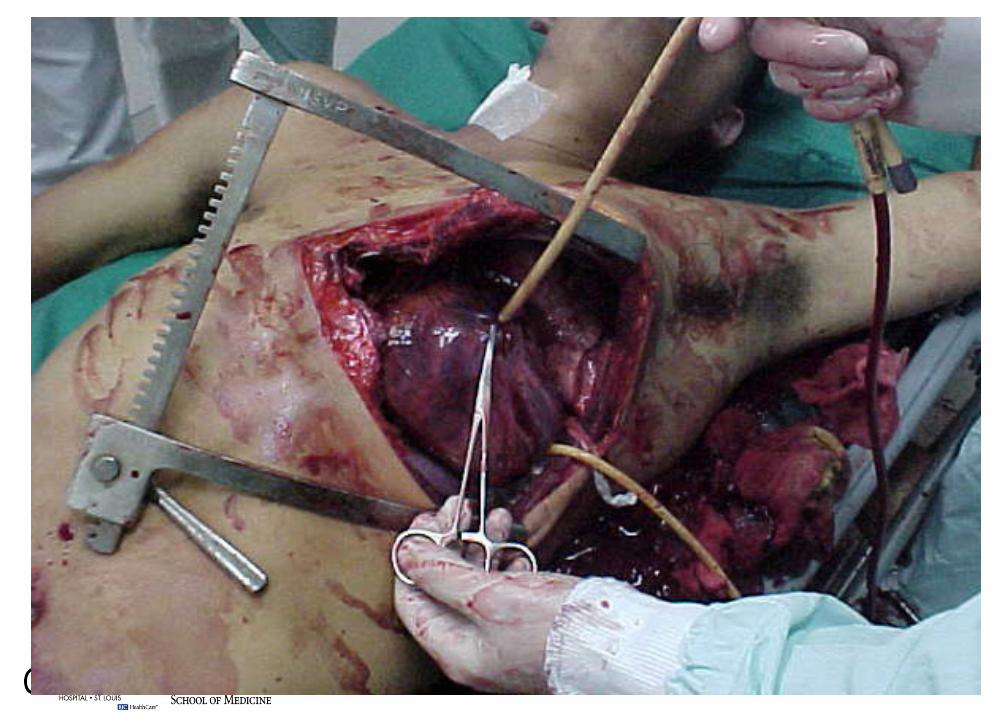
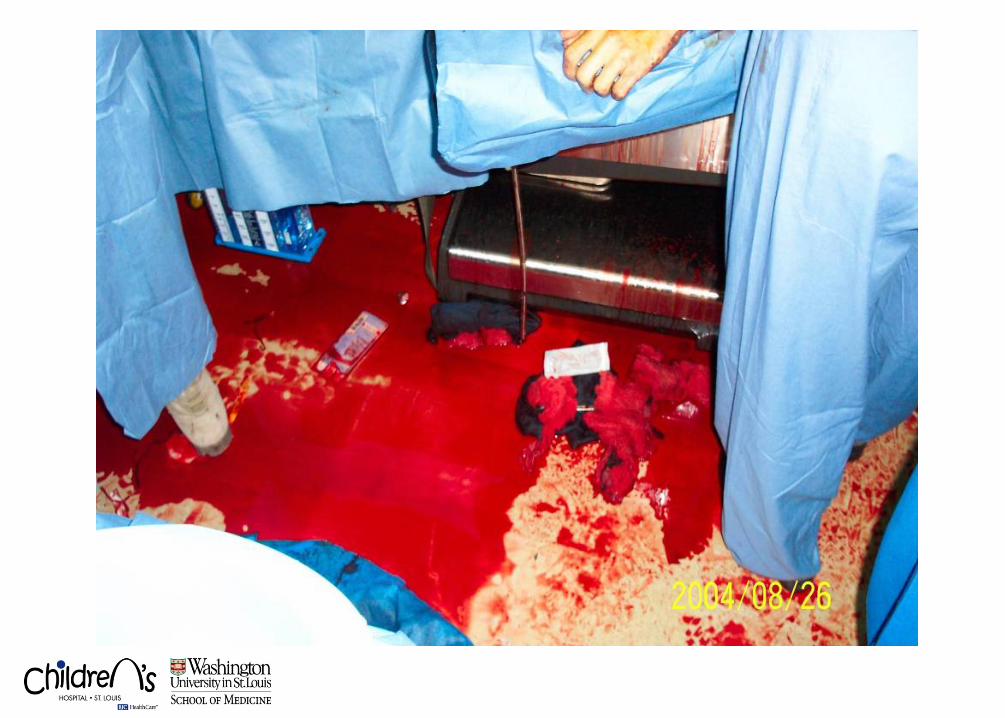
We therefore conclude . . .
Acute coagulopathy of trauma is real and is BAD
“Goal Directed” Resuscitation • Restore “normal” physiology • Reversal of the “shock” state
• End Organ Perfusion
– Mental status, capillary refill, urine output • Vital signs
– HR, BP, MAP, RR, SaO2 • Laboratory data
– ABG base deficit, lactate • Real-time imaging
– FAST-ECHO, IVC filling
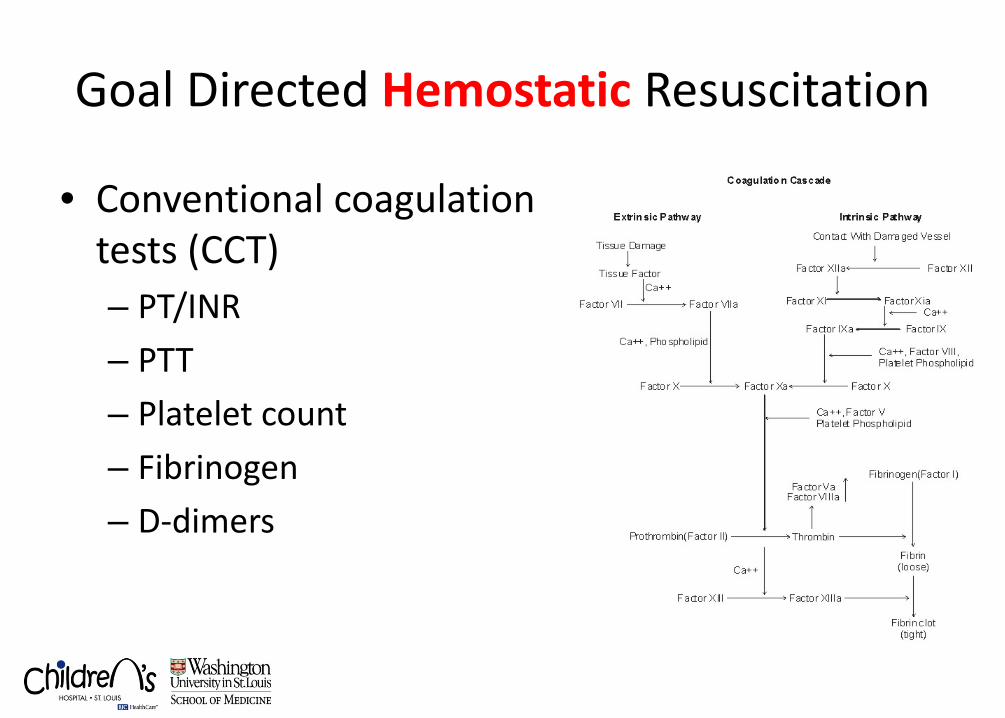
Goal Directed Hemostatic Resuscitation
• Conventional coagulation tests (CCT) – PT/INR – PTT – Platelet count – Fibrinogen – D-dimers
Thrombelastography • TEG
– Assesses global function of clotting proteins, platelets, and the fibrinolytic system
– Viscioelastic mechanical properties of blood – Useful point-of-care assay
• Different devices: TEG™ vs. ROTEM™
– Different names for the parameters
• Multiple flavors of “activating” agents: – Celite – Kaolin – Tissue factor – “Rapid”: Kaolin + tissue factor
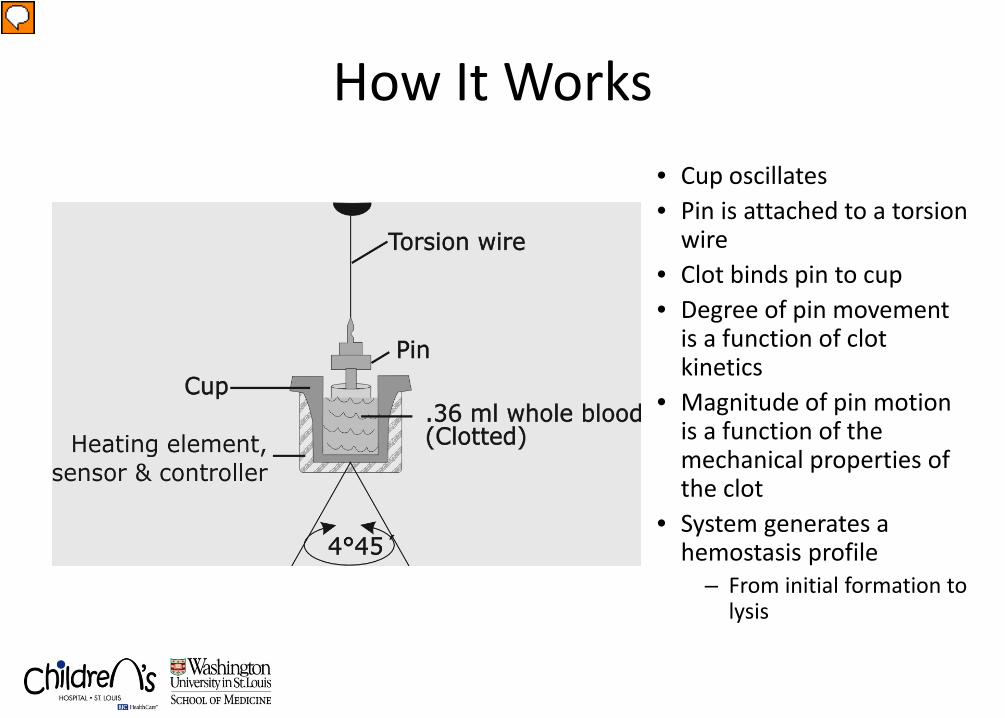
How It Works • Cup oscillates • Pin is attached to a torsion
wire • Clot binds pin to cup • Degree of pin movement
is a function of clot kinetics
• Magnitude of pin motion is a function of the mechanical properties of the clot
• System generates a hemostasis profile
– From initial formation to lysis
Presenter
Presentation Notes
The TEG analyzer has a sample cup that constantly oscillates at a set speed through an arc of 4°45‘; each oscillation lasts ten seconds. A whole blood sample of 360 l is placed into the cup, and a stationary pin attached to a torsion wire is immersed in the blood. When fibrin first forms, it begins to bind the cup and pin, causing the pin to oscillate in phase with the cup. The degree of pin movement is a function of the kinetics of clot development. The torque of the rotating cup is transmitted to the immersed pin only after fibrin or fibrin-platelet bonding has linked the cup and pin together. The strength of these fibrin-platelet bonds affects the magnitude of the pin motion. The magnitude of the output is directly related to the strength of the forming clot. As the clot retracts or lyses, the bonds between the cup and pin are broken, and the transfer of cup motion is diminished. The movement of the pin is converted by a mechanical-electrical transducer into an electrical signal, which can be monitored by a computer. The movement of the pin generates a hemostasis profile, which is a measure of the time it takes for the first fibrin strand to form, the kinetics of clot formation, the strength of the clot (in shear elasticity units of dyn/cm2), and the dissolution of clot.
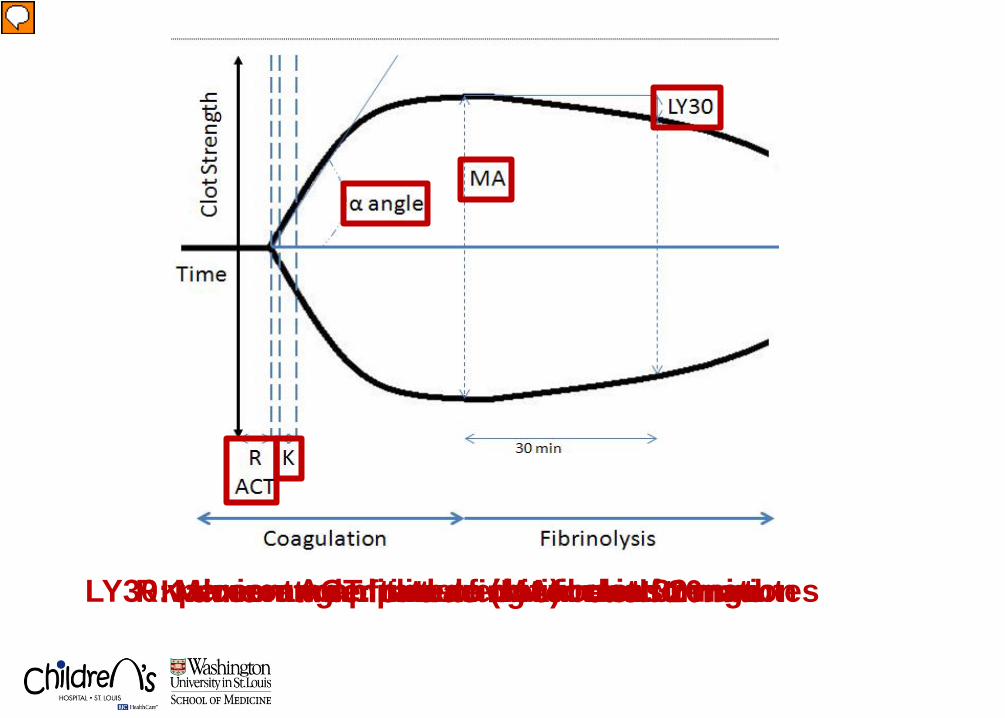
R value or ACT: time to initial clot formation K time – time for tracing to reach 20mm α angle: rate of clot formation Maximum amplitude (MA): clot strength LY30: percent amplitude reduction in 30 minutes
Presenter
Presentation Notes
This is an example of a TEG tracing showing both coagulation and fibrinolysis . . . The R value or ACT in rTEG is the time to initiate clot formation, and is thought to reflect clotting factors. Normal range, 0-118 seconds The K time is the time for the tracing to reach 20mm. Normal range, 1-2 minutes. The alpha angle represents the rate of clot formation. Normal range, 66-82 degrees. Both k and alpha are thought to reflect fibrinogen The MA or maximum amplitude represents maximal clot strength and is thought to reflect platelet function. Normal range, 54-72 millimeters. Finally, the LY30 is the percent degradation of the tracing formthe MA over 30 min and reflects fibrinolysis. Normal range, 0.0-7.5%.
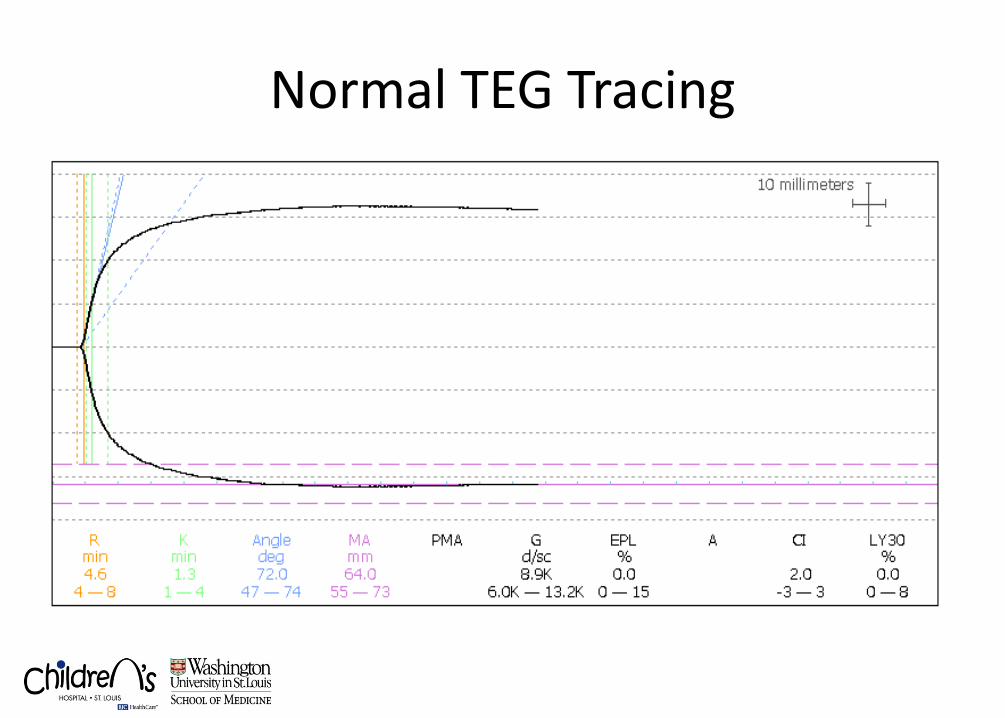
Normal TEG Tracing
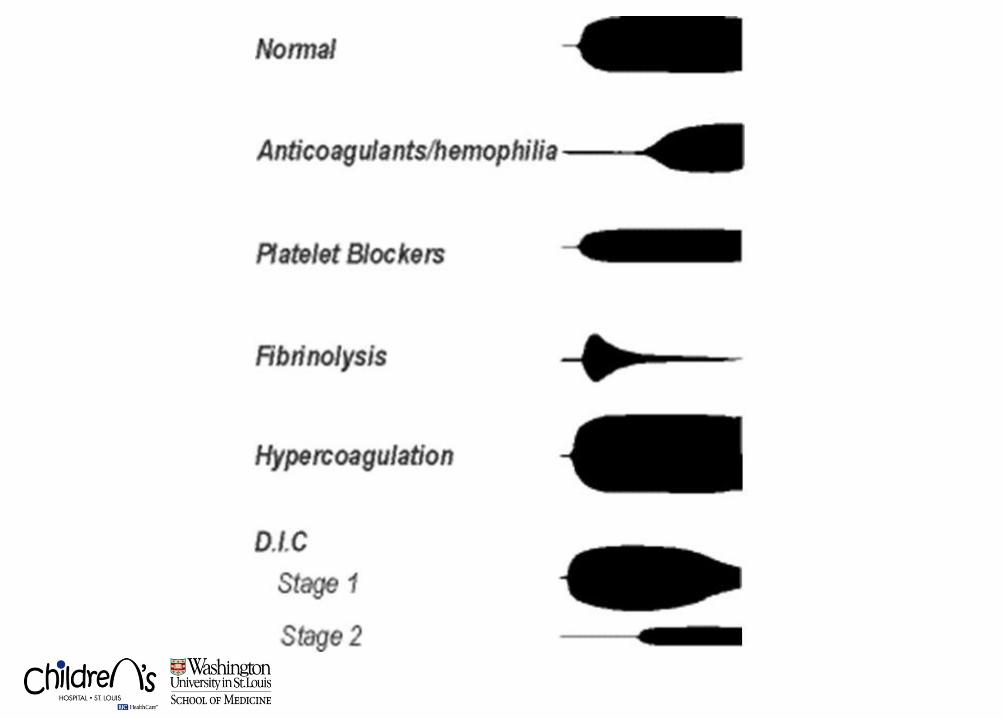
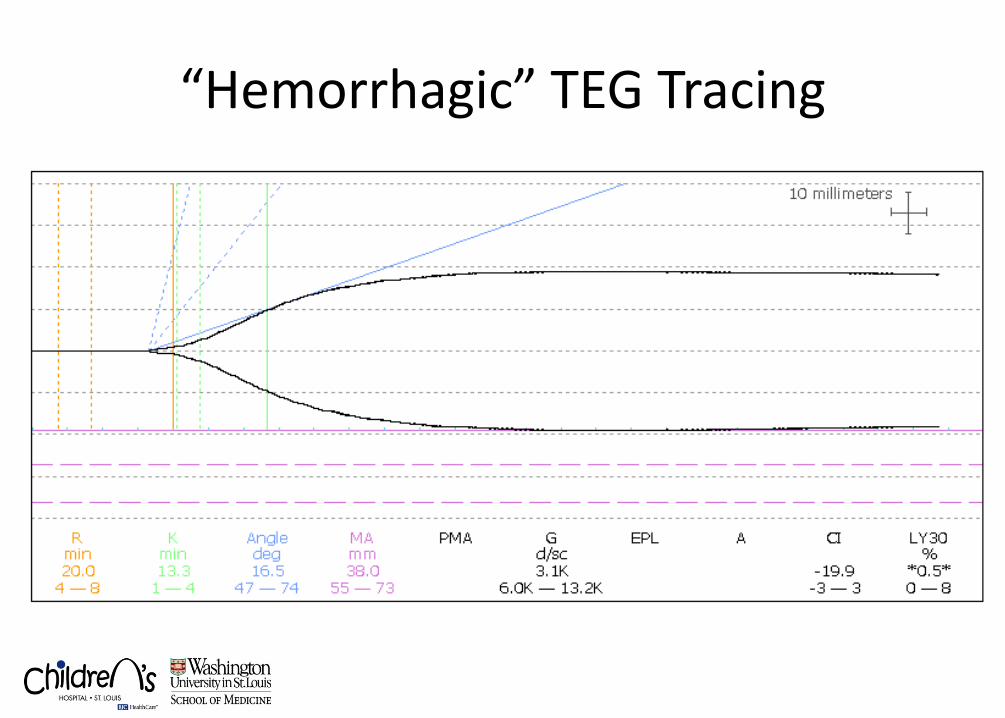
“Hemorrhagic” TEG Tracing
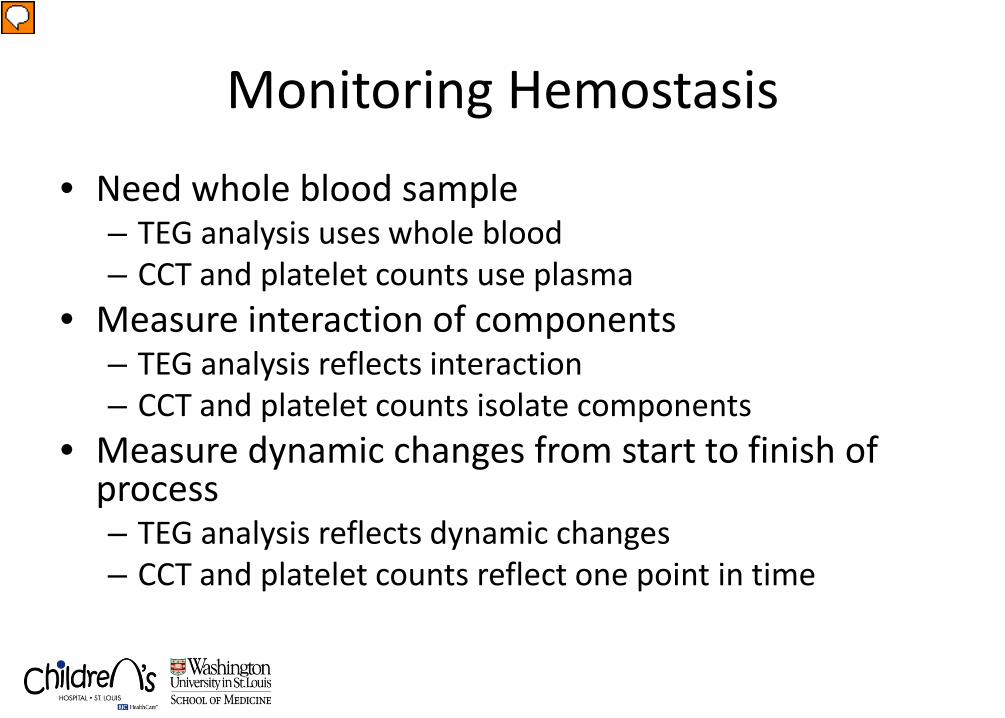
Monitoring Hemostasis
• Need whole blood sample – TEG analysis uses whole blood – CCT and platelet counts use plasma
• Measure interaction of components – TEG analysis reflects interaction – CCT and platelet counts isolate components
• Measure dynamic changes from start to finish of process – TEG analysis reflects dynamic changes – CCT and platelet counts reflect one point in time
Presenter
Presentation Notes
Monitoring hemostasis using the cell-based model requires a whole blood test, as in TEG® analysis. Whole blood is needed to measure the interactions among platelets, coagulation factors, and other cellular or plasmatic factors. Many laboratory tests including PT, aPTT, TT, D-DIMER, and platelet counts — use plasma, and as a result miss the impact of the cellular elements. TEG analysis reflects the cell based model and extends beyond it by measuring the net effect of all the blood-borne components of hemostasis. These include — coagulation factors, fibrinogen, platelets, fibrinolytic factors, inflammatory cells, blood cells, mediators and most pharmacological agents. The hemostatic process is dynamic, and the components interact differently as the process moves from activation to clot formation to clot lysis. Monitoring should reflect the dynamic changes of all components from start to finish, as in TEG® analysis. Most tests like PT, aPTT, TT, and platelet count focus on just one component at a specific, isolated point in the process.
TEG in Adult Trauma
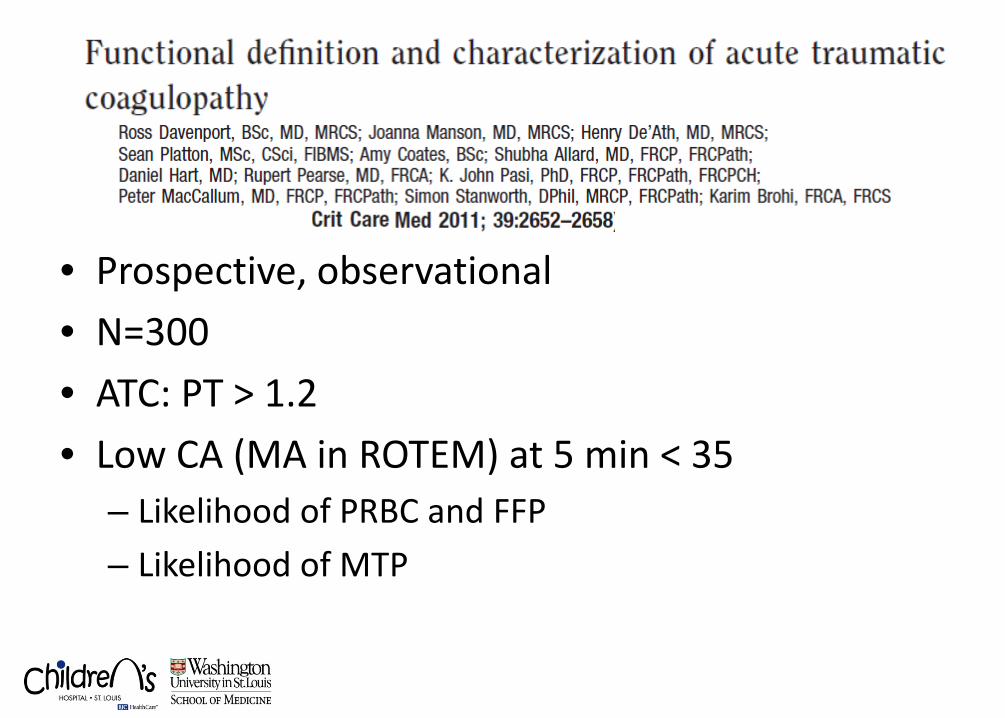
• Prospective, observational • N=300 • ATC: PT > 1.2 • Low CA (MA in ROTEM) at 5 min < 35
– Likelihood of PRBC and FFP – Likelihood of MTP
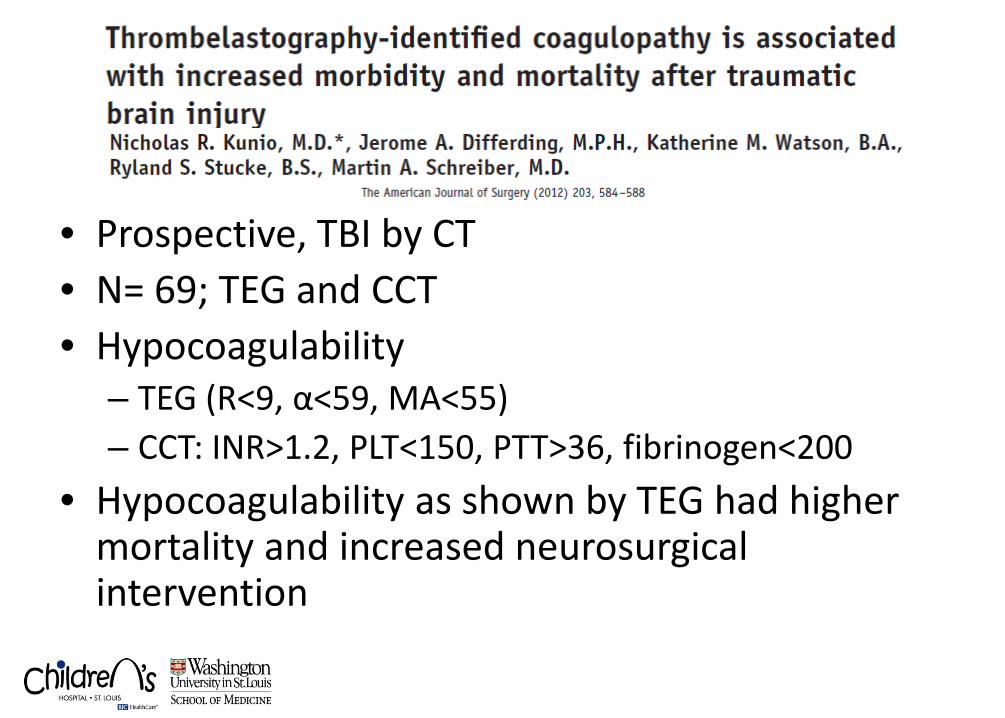
• Prospective, TBI by CT • N= 69; TEG and CCT • Hypocoagulability
– TEG (R<9, α<59, MA<55) – CCT: INR>1.2, PLT<150, PTT>36, fibrinogen<200
• Hypocoagulability as shown by TEG had higher mortality and increased neurosurgical intervention
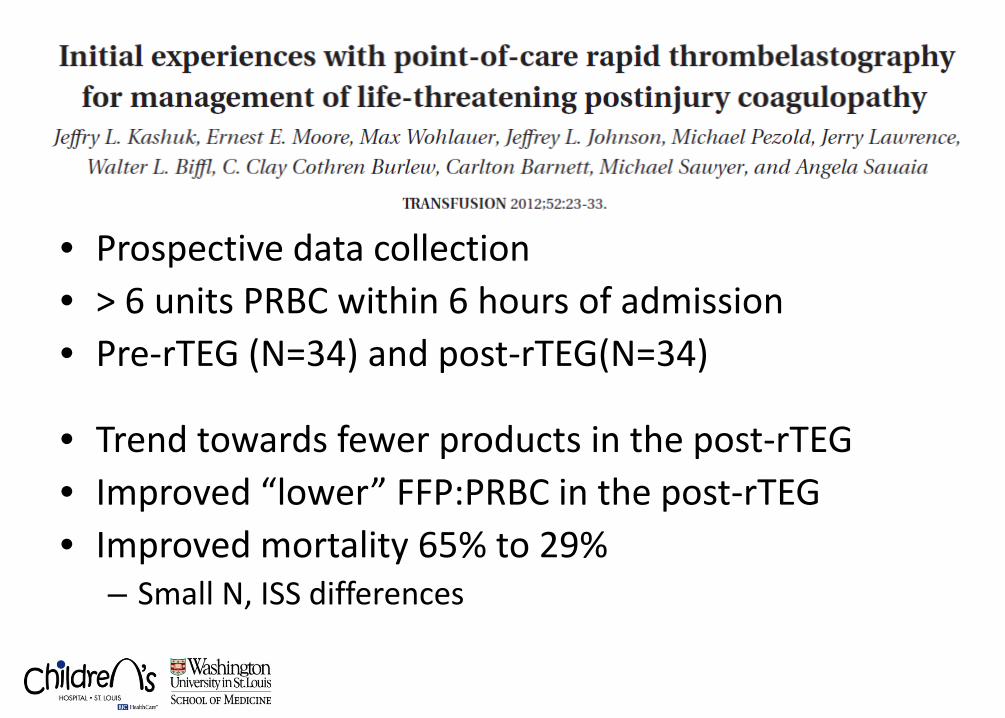
• Prospective data collection • > 6 units PRBC within 6 hours of admission • Pre-rTEG (N=34) and post-rTEG(N=34)
• Trend towards fewer products in the post-rTEG • Improved “lower” FFP:PRBC in the post-rTEG • Improved mortality 65% to 29%
– Small N, ISS differences
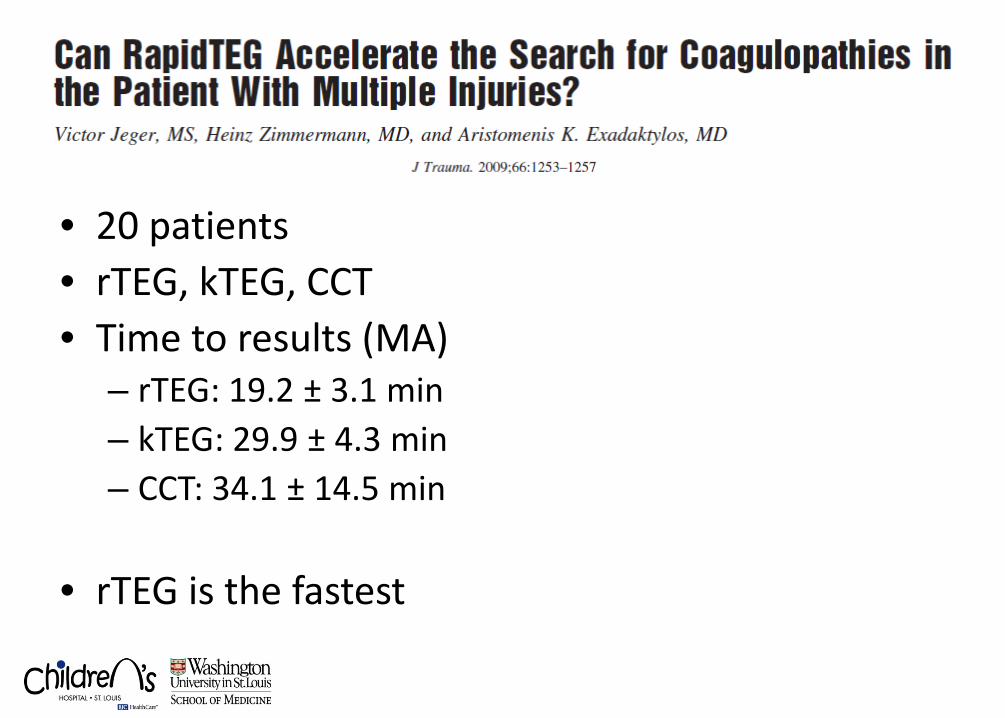
• 20 patients • rTEG, kTEG, CCT • Time to results (MA)
– rTEG: 19.2 ± 3.1 min – kTEG: 29.9 ± 4.3 min – CCT: 34.1 ± 14.5 min
• rTEG is the fastest
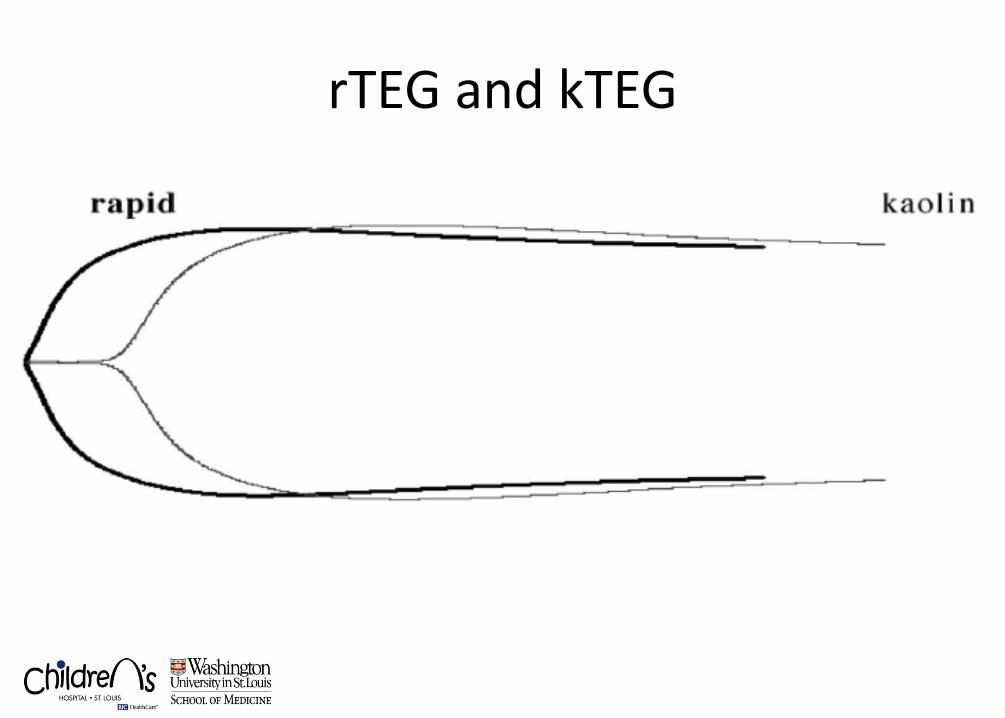
rTEG and kTEG
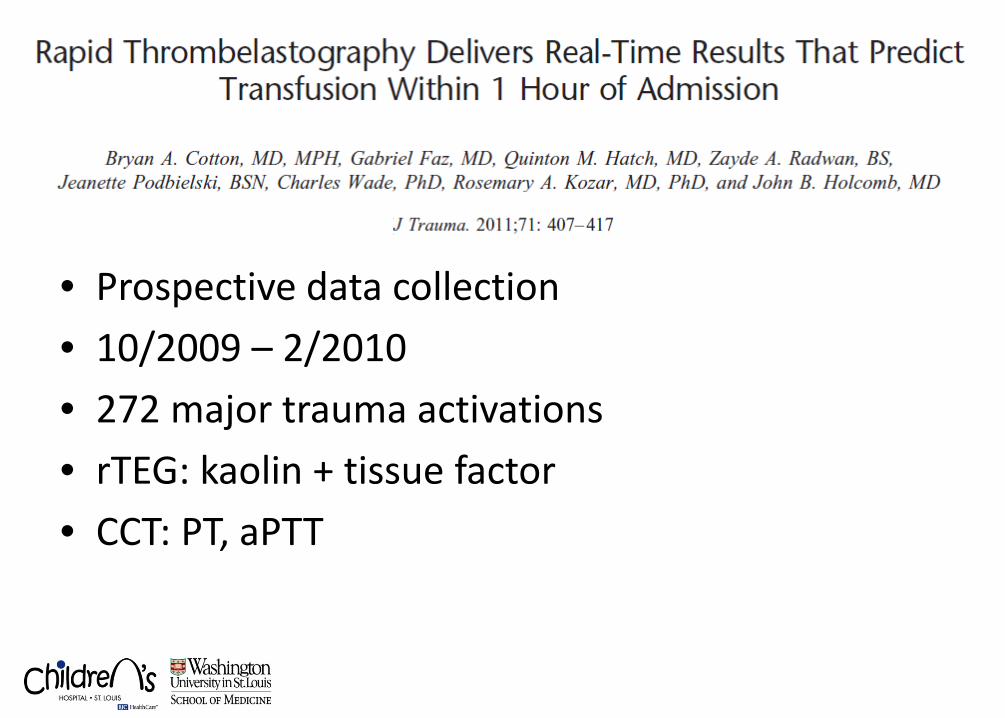
• Prospective data collection • 10/2009 – 2/2010 • 272 major trauma activations • rTEG: kaolin + tissue factor • CCT: PT, aPTT
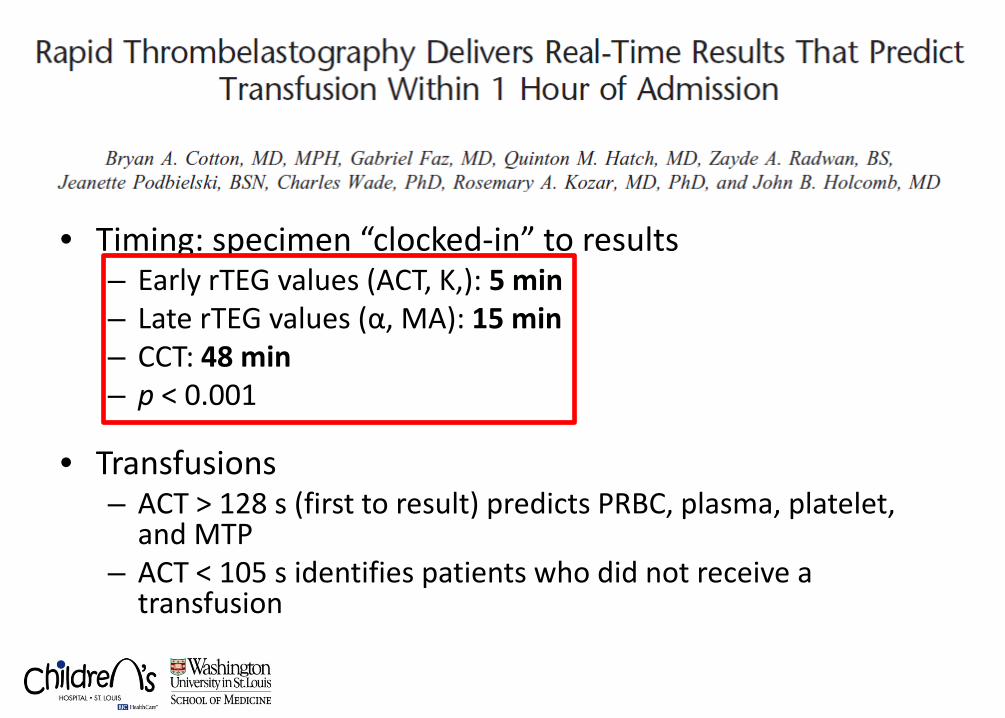
• Timing: specimen “clocked-in” to results – Early rTEG values (ACT, K,): 5 min – Late rTEG values (α, MA): 15 min – CCT: 48 min – p < 0.001
• Transfusions – ACT > 128 s (first to result) predicts PRBC, plasma, platelet,
and MTP – ACT < 105 s identifies patients who did not receive a
transfusion
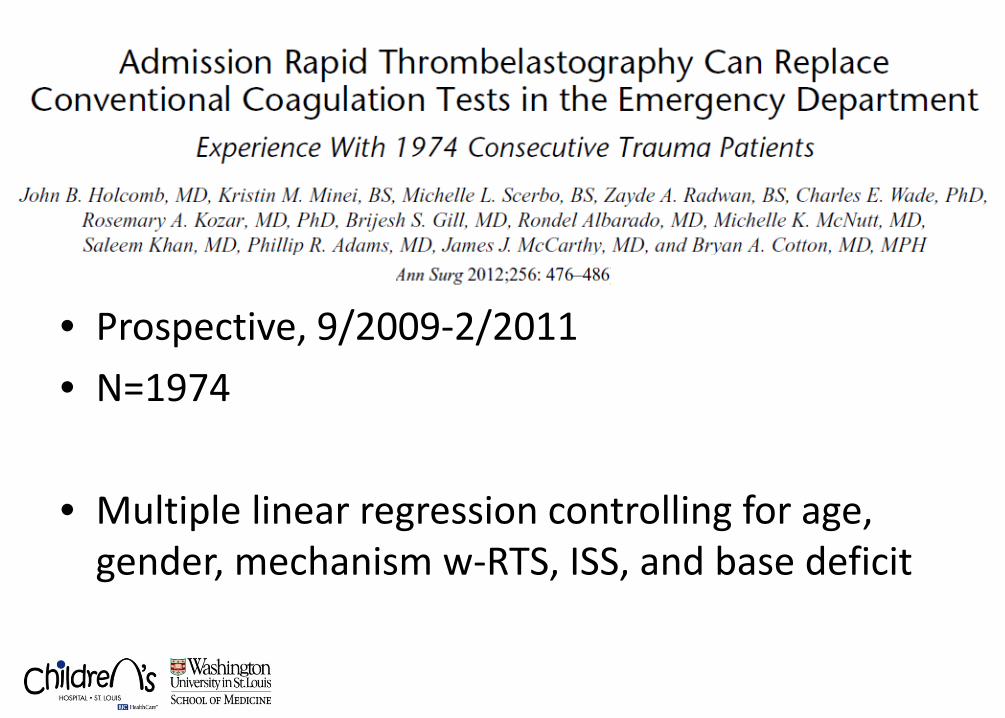
• Prospective, 9/2009-2/2011 • N=1974
• Multiple linear regression controlling for age,
gender, mechanism w-RTS, ISS, and base deficit
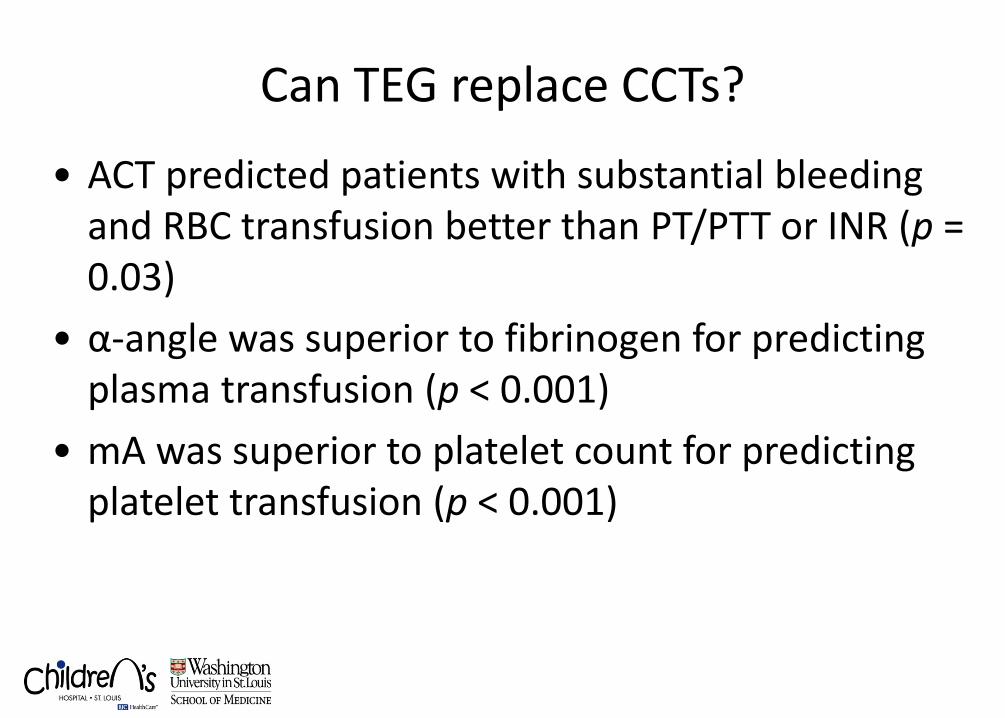
• ACT predicted patients with substantial bleeding and RBC transfusion better than PT/PTT or INR (p = 0.03)
• α-angle was superior to fibrinogen for predicting plasma transfusion (p < 0.001)
• mA was superior to platelet count for predicting platelet transfusion (p < 0.001)
Can TEG replace CCTs?
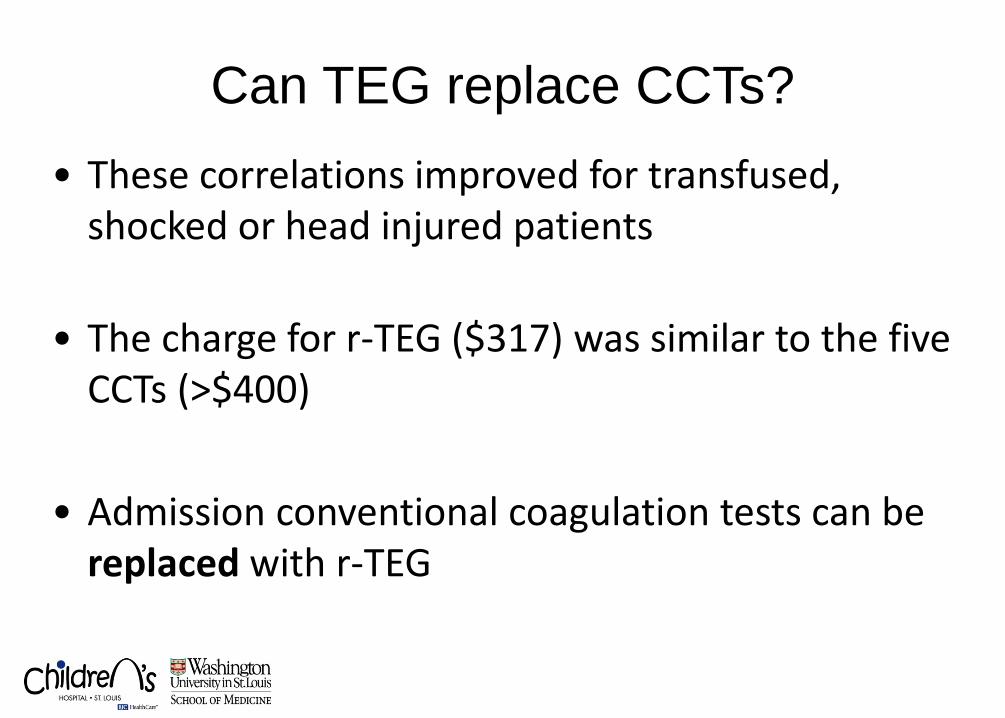
• These correlations improved for transfused, shocked or head injured patients
• The charge for r-TEG ($317) was similar to the five CCTs (>$400)
• Admission conventional coagulation tests can be
replaced with r-TEG
Can TEG replace CCTs?
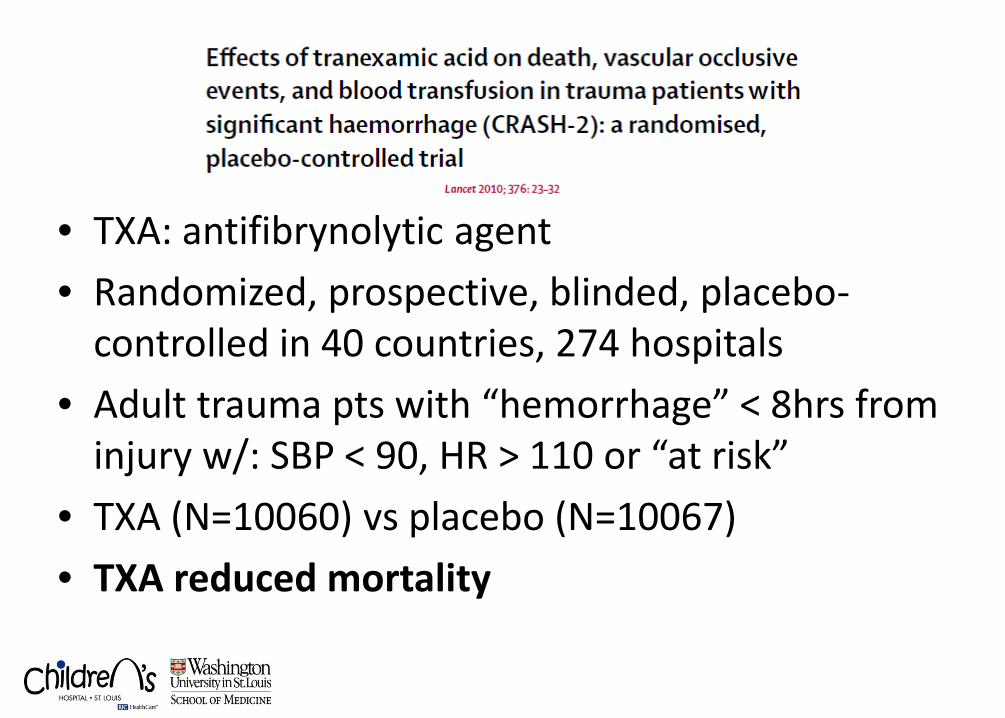
• TXA: antifibrynolytic agent • Randomized, prospective, blinded, placebo-
controlled in 40 countries, 274 hospitals • Adult trauma pts with “hemorrhage” < 8hrs from
injury w/: SBP < 90, HR > 110 or “at risk” • TXA (N=10060) vs placebo (N=10067) • TXA reduced mortality
TEG in Pediatric Trauma
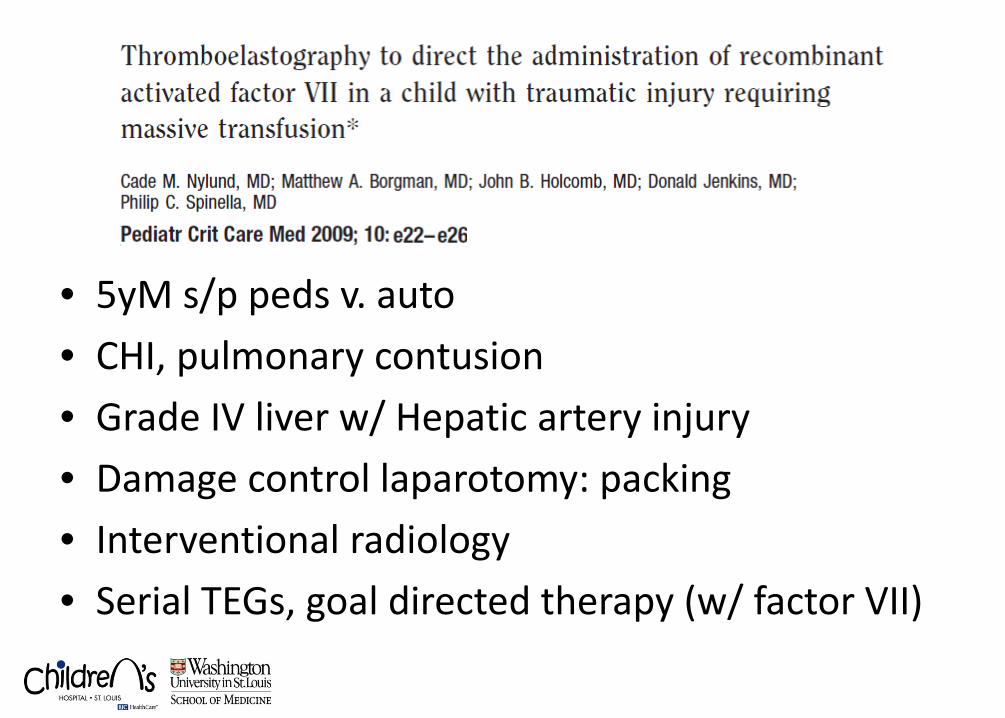
• 5yM s/p peds v. auto • CHI, pulmonary contusion • Grade IV liver w/ Hepatic artery injury • Damage control laparotomy: packing • Interventional radiology • Serial TEGs, goal directed therapy (w/ factor VII)
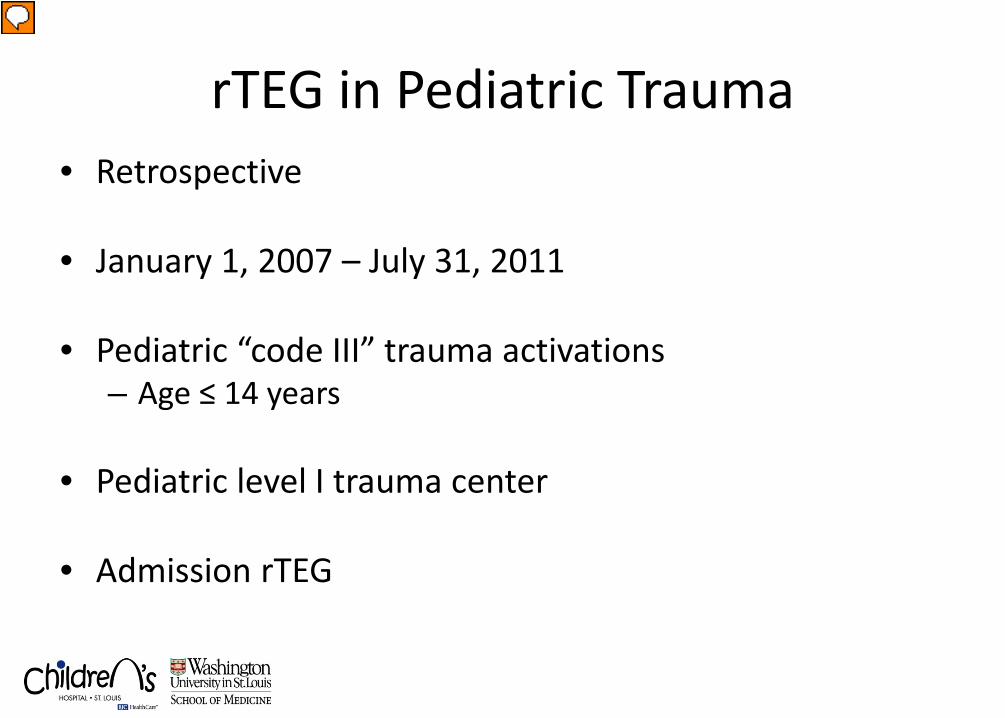
rTEG in Pediatric Trauma • Retrospective
• January 1, 2007 – July 31, 2011
• Pediatric “code III” trauma activations
– Age ≤ 14 years • Pediatric level I trauma center • Admission rTEG
Presenter
Presentation Notes
This was a retrospective review over a two year period of the highest level trauma activations at an ACS verified level 1 pediatric trauma center of patients that received an admission rTEG
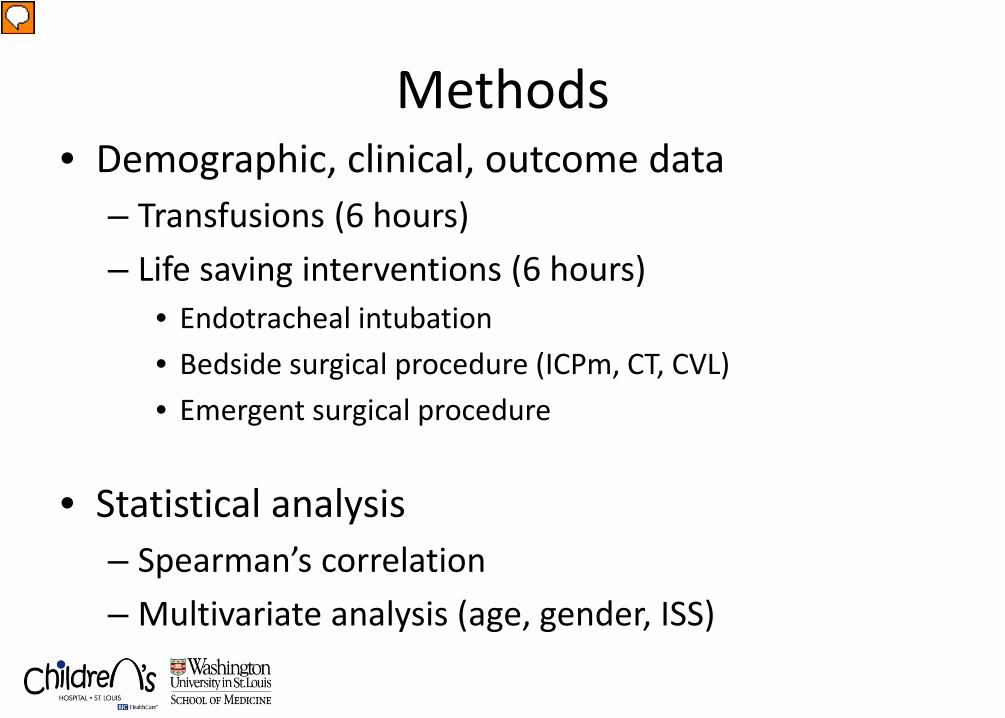
Methods • Demographic, clinical, outcome data
– Transfusions (6 hours) – Life saving interventions (6 hours)
• Endotracheal intubation • Bedside surgical procedure (ICPm, CT, CVL) • Emergent surgical procedure
• Statistical analysis – Spearman’s correlation – Multivariate analysis (age, gender, ISS)
Presenter
Presentation Notes
Demographic, clinical, and outcome data were extracted from the patients electronic medical record and trauma registry and data relating to transfusion requirement and life saving interventions were obtained. Spearman’s correlation was used to relate rTEG parameters to conventional coagulation tests . Multivariate analysis controlling apriori for age, gender, and ISS was performed top evaluate rTEG parameters with transfusion requirements and life saving interventions.
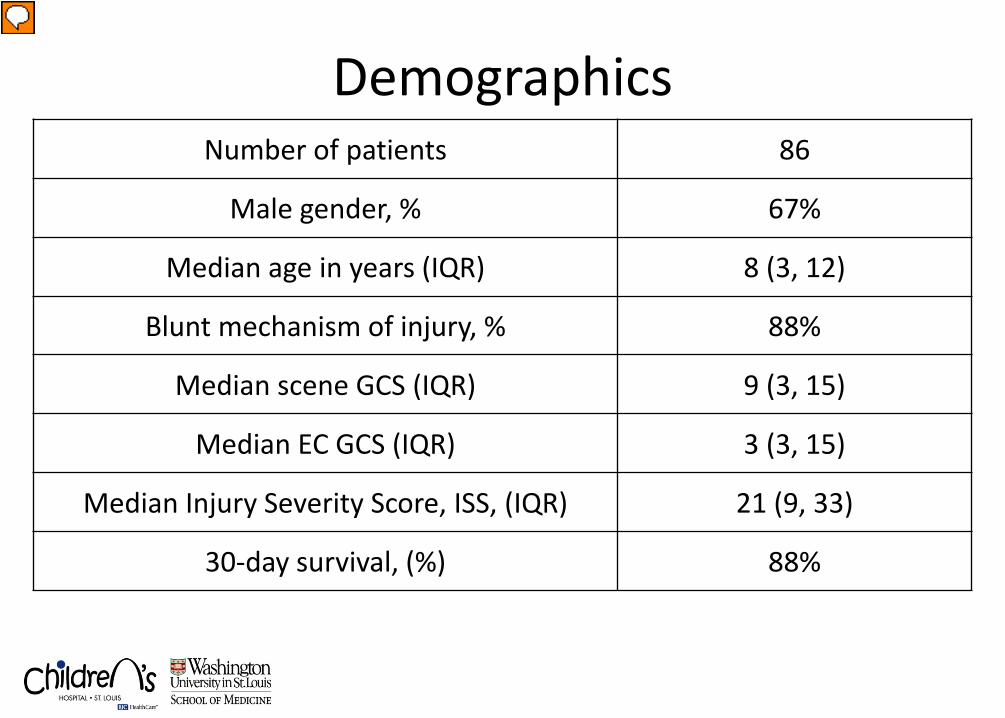
Demographics Number of patients 86
Male gender, % 67%
Median age in years (IQR) 8 (3, 12)
Blunt mechanism of injury, % 88%
Median scene GCS (IQR) 9 (3, 15)
Median EC GCS (IQR) 3 (3, 15)
Median Injury Severity Score, ISS, (IQR) 21 (9, 33)
30-day survival, (%) 88%
Presenter
Presentation Notes
Patient demographics are as follows: For background, over the 2 year period, there were 2955 pediatric trauma activations, 326 were classified as code 3, and 86 of these patents received an rTEG on admission. The majority were male and the predominant mechanism was blunt. The median ISS was 21. There was an 88% survival. TBI Head AIS >3 was 55%
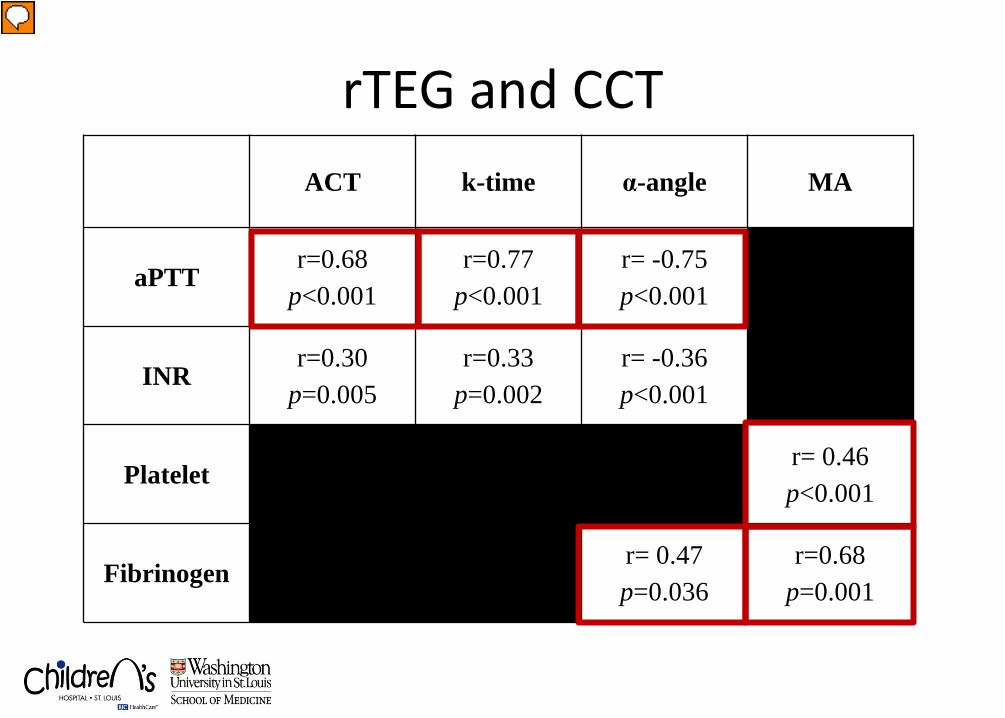
rTEG and CCT ACT k-time α-angle MA
aPTT r=0.68
p<0.001 r=0.77
p<0.001 r= -0.75 p<0.001
INR r=0.30
p=0.005 r=0.33
p=0.002 r= -0.36 p<0.001
Platelet r= 0.46 p<0.001
Fibrinogen r= 0.47 p=0.036
r=0.68 p=0.001
Presenter
Presentation Notes
Overall, rTEG parameters correlated nicely to conventional coagulation tests. An r value 0.3-0.7 represents good correlation with r > 0.7 representing excellent correlation. In this dataset, ACT, k, and alpha correlate very well with aPTT Alpha showed good correlation with fibrinogen, and MA had good correlation with platelets and fibrinogen.
Early Transfusion
• Controlling for age, gender, ISS
• ACT, R, K, α, and MA – “Predict” PRBC and FFP transfusion
Life Saving Interventions
• Only MA predicted life saving interventions – OR 0.84; 95% CI 0.72-0.98; p=0.032
Limitations
• Single center
• Retrospective
• Sample size
Presenter
Presentation Notes
This study has several limitations most notably its retrospective nature, its single center and small sample size.
Conclusions
• rTEG correlates with conventional coagulation tests
• rTEG predicts transfusion requirements
• rTEG predicts life saving interventions
• “GOAL DIRECTED” HEMOSTATIC RESUSCITATION
Presenter
Presentation Notes
Despite these limitations, we conclude the rapid thromboelastography may be very useful in pediatric trauma. rTEG values do correlate with conventional coagulation tests It also predicts the need for transfusion and other life saving interventions. Rapid thromboelastography may be a valuable tool in pediatric trauma and may serve as a guide for goal directed hemostatic resuscitation.

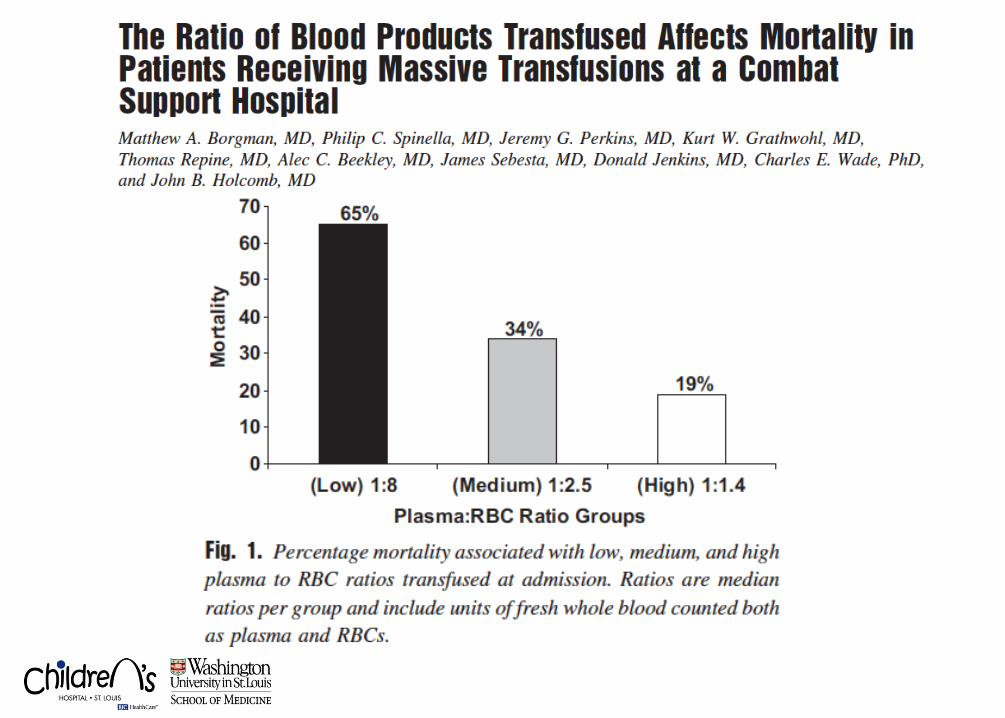
A word (or two) on Massive Transfusion

Here at Children’s . . .
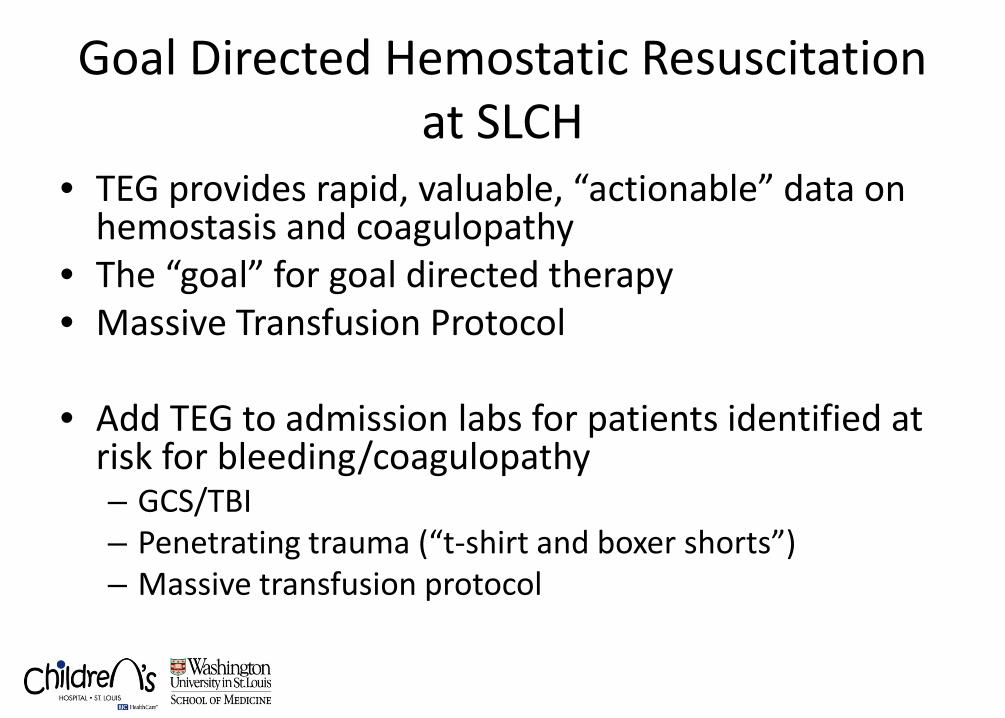
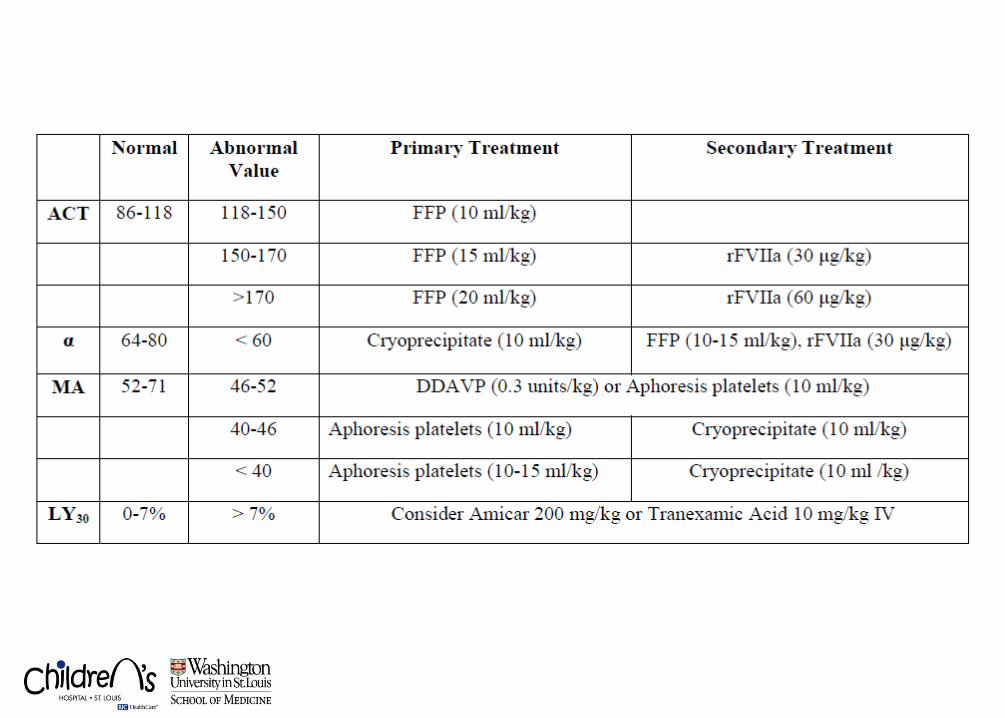
Goal Directed Hemostatic Resuscitation at SLCH
• TEG provides rapid, valuable, “actionable” data on hemostasis and coagulopathy
• The “goal” for goal directed therapy • Massive Transfusion Protocol
• Add TEG to admission labs for patients identified at
risk for bleeding/coagulopathy – GCS/TBI – Penetrating trauma (“t-shirt and boxer shorts”) – Massive transfusion protocol

Thank you