CO Modeling in a Deep Saline Aquifer: A Predictive...
20
rXXXX American Chemical Society A dx.doi.org/10.1021/es103187b | Environ. Sci. Technol. XXXX, XXX, 000–000 ARTICLE pubs.acs.org/est CO 2 Modeling in a Deep Saline Aquifer: A Predictive Uncertainty Analysis Using Design of Experiment Baozhong Liu and Ye Zhang* Department of Geology and Geophysics, University of Wyoming, Laramie, Wyoming 82071, United States b S Supporting Information ABSTRACT: When field data are limited, stratigraphic models are used instead of detailed, fully heterogeneous models (FHM) to represent deep saline aquifers in numerical simulations of CO 2 storage. This study evaluates parameter sensitivity and prediction uncertainty of three stratigraphic models of decreasing complexity (i.e., facies, layered, formation) against that of a FHM. For select simulation outcomes (i.e., CO 2 mass profiles, gas plume shape, brine leakage), parameter sensitivity and associated prediction uncertainty are compared among the models, with the FHM serving as a reference. The analysis is conducted using the computationally efficient design of experiment (DoE) and response surface (RS) methodology. Results suggest that when a competent caprock exists (permeability <1 10 4 mD), the facies and layered models are capable of capturing the most important sensitivity parameters of the FHM, that is, residual gas saturation, heterogeneity variance, and salinity. Using the important parameters identified by DoE, RS modeling then suggests that the same two models also capture the ranges of predictions in mobile gas, trapped gas, and brine leakage. The formation model is less accurate in capturing the sensitivity and prediction ranges of the FHM, although it is accurate in predicting brine leakage into the overlying formation. 1. INTRODUCTION Carbon dioxide (CO 2 ) capture and storage (CCS) into deep saline aquifers is considered a promising option to mitigate global climate change. 1 To assess a storage formation, reservoir simula- tion is commonly performed using a site geologic model. Due to technical or economical reasons, data needed to build a detailed site model are often lacking. As a compromise, stratigraphic models are built in which facies or depositional zones, or even the entire aquifer, are assumed homogeneous. Since natural aquifers exhibit intrinsic permeability (k) heterogeneity at multiple scales, stratigraphic models are conceptual simplifications created based on the level of data support. It is important to understand not only the adequacy of such models in representing natural systems, but also if an optimal complexity of the stratigraphic model exists that can lead to a cost-effective strategy in data collection and reservoir modeling. However, a key difficulty exists here: in addition to uncertainty in aquifer permeability, uncertainty in multiple geologic and engineering variables exists. Determination of an optimal stratigraphic model must be evaluated within a full parameter space, which is computationally challen- ging if CO 2 storage is modeled at the field (or larger) scales using traditional simulation techniques. 2 In this study, a design of experiment (DoE) and response surface (RS) methodology is used to conduct a parameter sensitivity study and prediction uncertainty analysis. The methodology is computationally efficient, suitable for the uncertainty analysis of data-poor settings. 3,4 To eliminate uncertainty in k pattern and focus only on parameter uncertainty, a 3D synthetic aquifer is created to represent a groundtruth model with a fully known permeability pattern. This fully heterogeneous model (FHM) is used to gauge the performance of three stratigraphic models of decreasing complexities: a facies model with eight units, a layered model with three units, and a formation model with one unit Received: September 18, 2010 Accepted: March 16, 2011 Revised: March 10, 2011
Transcript of CO Modeling in a Deep Saline Aquifer: A Predictive...

rXXXX American Chemical Society A dx.doi.org/10.1021/es103187b | Environ. Sci. Technol. XXXX, XXX, 000–000
ARTICLE
pubs.acs.org/est
CO2 Modeling in a Deep Saline Aquifer: A Predictive UncertaintyAnalysis Using Design of ExperimentBaozhong Liu and Ye Zhang*
Department of Geology and Geophysics, University of Wyoming, Laramie, Wyoming 82071, United States
bS Supporting Information
ABSTRACT:
When field data are limited, stratigraphic models are used instead of detailed, fully heterogeneous models (FHM) to represent deepsaline aquifers in numerical simulations of CO2 storage. This study evaluates parameter sensitivity and prediction uncertainty ofthree stratigraphic models of decreasing complexity (i.e., facies, layered, formation) against that of a FHM. For select simulationoutcomes (i.e., CO2 mass profiles, gas plume shape, brine leakage), parameter sensitivity and associated prediction uncertainty arecompared among the models, with the FHM serving as a reference. The analysis is conducted using the computationally efficientdesign of experiment (DoE) and response surface (RS) methodology. Results suggest that when a competent caprock exists(permeability <1� 10�4 mD), the facies and layered models are capable of capturing the most important sensitivity parameters ofthe FHM, that is, residual gas saturation, heterogeneity variance, and salinity. Using the important parameters identified by DoE, RSmodeling then suggests that the same twomodels also capture the ranges of predictions inmobile gas, trapped gas, and brine leakage.The formation model is less accurate in capturing the sensitivity and prediction ranges of the FHM, although it is accurate inpredicting brine leakage into the overlying formation.
1. INTRODUCTION
Carbon dioxide (CO2) capture and storage (CCS) into deepsaline aquifers is considered a promising option tomitigate globalclimate change.1 To assess a storage formation, reservoir simula-tion is commonly performed using a site geologic model. Due totechnical or economical reasons, data needed to build a detailedsite model are often lacking. As a compromise, stratigraphicmodels are built in which facies or depositional zones, or even theentire aquifer, are assumed homogeneous. Since natural aquifersexhibit intrinsic permeability (k) heterogeneity at multiple scales,stratigraphic models are conceptual simplifications created basedon the level of data support. It is important to understand notonly the adequacy of such models in representing naturalsystems, but also if an optimal complexity of the stratigraphicmodel exists that can lead to a cost-effective strategy in datacollection and reservoir modeling. However, a key difficultyexists here: in addition to uncertainty in aquifer permeability,uncertainty in multiple geologic and engineering variables exists.Determination of an optimal stratigraphic model must be evaluated
within a full parameter space, which is computationally challen-ging if CO2 storage is modeled at the field (or larger) scales usingtraditional simulation techniques.2
In this study, a design of experiment (DoE) and responsesurface (RS)methodology is used to conduct a parameter sensitivitystudy and prediction uncertainty analysis. The methodology iscomputationally efficient, suitable for the uncertainty analysis ofdata-poor settings.3,4 To eliminate uncertainty in k pattern andfocus only on parameter uncertainty, a 3D synthetic aquifer iscreated to represent a groundtruth model with a fully knownpermeability pattern. This fully heterogeneous model (FHM) isused to gauge the performance of three stratigraphic models ofdecreasing complexities: a facies model with eight units, a layeredmodel with three units, and a formation model with one unit
Received: September 18, 2010Accepted: March 16, 2011Revised: March 10, 2011

B dx.doi.org/10.1021/es103187b |Environ. Sci. Technol. XXXX, XXX, 000–000
Environmental Science & Technology ARTICLE
(Figure 1). Since aquifers can exhibit different degrees of perme-ability heterogeneity and preferential CO2 channeling can occurin highly heterogeneous systems,5 the FHM is scaled to increas-ing natural log permeability (lnk) variances. Variance of lnk is akey uncertainty parameter analyzed. At each variance level, thestratigraphic models are upscaled from the FHM (detail is de-scribed elsewhere6).
For our set of models (i.e., stratigraphic models are conceptualequivalents of the FHM), multiple uncertain input parameters aredefined, their selection based on typical uncertainty variables andtheir ranges encountered at CCS sites. For a suite of predictionoutcomes, a stratigraphicmodel is considered optimal if it can captureboth parameter sensitivity and prediction uncertainty of the FHM.Specifically, within the full parameter space, the stratigraphic modelsare examined in three aspects: (1) accuracy in predicting CO2 massprofiles, plume shape, and brine leakage; (2) ability to capture themost important parameters impacting theoutcomesof theFHM; (3)ability to capture the prediction envelopes of the FHM.
Worldwide saline aquifers suitable for CCS can be found at avariety of depths. To explore the effect of depth on model sen-sitivity and prediction uncertainty, the models are placed at 1, 2, and3 km, respectively. The upper limit of 1 km is slightly deeper thanthe typical depth threshold where CO2 is considered supercritical(∼800 m). Since geothermal gradient is one of the parametersvaried, this depth ensures that CO2 remains supercritical in themodel. The lower limit is selected based on a cost threshold:7 below 3km, storage efficiency generally decreases and cost per tonof injectionincreases. The uncertainty analysis is repeated at each depth.
In the following sections, the uncertainty analysis is introduced,followed by results, discussions, and conclusions. Supporting Informa-tion (SI) is attached, including details of CO2 simulation, parametersvaried in the sensitivity analysis (SA), and gas prediction outcomes.
2. MATERIALS AND METHODS
2.1. Model Creation. Using images of sediment created in alaboratory flume, a FHM is created (Figure 1A). The model is
2525m long, 2525mwide, and 102.5 m thick, as a host formationof∼1 km2 by 100 m is required to store CO2 from a single powerplant.8 Using facies analysis, a stratigraphic model is createdcontaining eight facies units (Figure 1B). Since the flume depositemulates a fluvial system with multiple depositional episodes, a3-Unit layered model is created (Figure 1C). Each layer consistsof several units of the facies model (e.g., layer 1 corresponds tofacies units 1�4, etc). A formation model is also created(Figure 1D). The 8-, 3-, and 1-Unit models are hosted within asedimentary hierarchy, representing conceptual models devel-oped at decreasing complexity (i.e., heterogeneity resolution)from the FHM. To ensure that models are comparable, equiva-lent permeability is computed for each unit of stratigraphic modelsusing an upscaling technique.6 Under the same fluid drivingforces, all models predict similar flow rates.6 Since CO2 storageand leakage are both of interest, a 40 m thick (10 vertical cells)caprock is placed above the aquifer. The caprock is assumed to behomogeneous. The combined aquifer and caprock is referred toas a storage model. All models employ the same grid, with 520 251block cells.2.2. CO2 Simulation. CO2 is injected using a single vertical
well at the model center, perforated in the aquifer only. In the SA,the total injected CO2 is fixed (538 063 t), whereas the injectionrate is varied as an uncertain input variable (0.45�0.90 kg/s).Thus, injection duration varies from 20�40 years, correspondingto the changing injection rate. A 500-year postinjection monitor-ing period is simulated. All models are given a laterally openboundary. An external aquifer is placed above the caprock to providea receptacle to receive CO2 and brine that has leaked through thecaprock (details of the simulations can be found in the SI).To simplify the simulation and sensitivity analysis, this study
employs several assumptions. First, fluid rock reactions are notconsidered, which can be assumed negligible for an aquifer withquartz-dominated mineralogy.1 Nonisothermal effects are ignored,as are drying-out, salting-out, and coupled flow and geomecha-nical feedbacks. Viscous fingering due to CO2 dissolution inbrine, which typically requires a cm-scale grid size, is notmodeled. Capillary pressure (Pc) is assumed negligible, thus asingle fluid pressure is computed. In field-scale modeling, Pc canbe neglected when there exist strong viscous or gravity forces.2
However, we acknowledge the potentially important role capil-lary entry pressure plays in deterring CO2 breakthrough into thecaprock. This effect will be considered in future work.2.3. Sensitivity Analysis and Response Surface Modeling.
Sensitivity analysis (SA) for each model is conducted using DoE.9
Unlike the conventional analysis whereby parameters are variedone at a time while keeping all others fixed, DoE varies subsets ofthe parameters simultaneously according to a design table. Resultsare compiled and examined with multivariate analysis of variance(MANOVA) to identify parameters that have statistically sig-nificant effects on a prediction outcome. Though a variety ofdesigns are available (same design can be used for multiple out-comes), a two-level Plackett-Burman (PB) design is used whichis the most effective when parameters varied in the SA (or factors)are orthogonal, that is, uncorrelated. Compared to other designs(e.g., fractional factorial), the PB design is parsimonious inselecting a parameter subset for simulations, providing largesavings in program execution time when the problem size is largeand the physics to be solved complex. However, the PB designcan only identify main effects as well as any confound interac-tions with themain effects. It is themost useful as a screening toolthat can quickly identify significant uncertainty factors. In reservoir
Figure 1. Aquifer models of this study: (A) fully heterogeneous model(permeability is shown in mD when the system lnk variance is 7.0);(B) facies model with 8 units (unit ID is shown); (C) layeredmodel with3 units; (D) formation model with 1 unit. All models employ a uniformgrid, with 101 � 101 � 41 block cells. To all models, a homogeneouscaprock is added (not shown).

C dx.doi.org/10.1021/es103187b |Environ. Sci. Technol. XXXX, XXX, 000–000
Environmental Science & Technology ARTICLE
simulation, PB is used in scoping studies to guide early datacollection.10
The RS method consists of fitting a polynomial function toeach outcome of the DoE analysis.11 The function is based on thefactors previously identified as important to the outcome. Priorto RS modeling, three values for each factor are necessary in theDoE analysis, that is,�/0/þ values. Such values can correspondto key probabilities of a factor, but it is not a requirement. The RSmodel is considered a predictive model of the relationshipbetween input factors and simulation outcomes (responses).Using RS, a range of predictions can be made by varying thesefactors within their respective ranges. The factor values can becontinuous, as opposed to (discrete) end-point and midpointvalues specified in the design. Since prediction using RS is fast, itis used in reservoir analysis as a proxy model to analyze pre-diction uncertainty.3 For example, if a minimum or maximumresponse exists within the factor region, this can be identifiedfrom the RS model using optimization techniques. Monte Carloanalysis can also be run on the RS (by randomly drawing factors),leading to a probability density function of the outcome. Suchanalyses are orders of magnitude faster than one using reservoirsimulations. In this study, the DoE and RS analysis is perform-ed with JMP 8.0, a package developed by Statistical AnalysisSoftware, Inc.2.3.1. Input Parameters. A SA is conducted for all models
using DoE. For each model, seven input parameters are varied:(1) vertical gradient of background aquifer flow (AquG), (2)geothermal gradient (TG), (3) level of aquifer heterogeneity(i.e., variance of lnk, VAR), (4) maximum residual gas saturation(SGR), (5) salinity of formation water (SAL), (6) injection rate(q), and (7) caprock permeability (krock). The parameters andtheir ranges are summarized for the FHM in Table 1. For thestratigraphic models, the same parameters are varied, thoughVAR now represents the variance of the FHM (aquifer zoneonly), from which units of the stratigraphic models are homoge-nized. Justification for choosing the parameters and their ranges isprovided in the SI.2.3.2. Model Outcomes. Five outcomes are evaluated for CO2
modeling: (1) mobile gas-phase CO2 (mobile gas), (2) trappedgas-phase CO2 (trapped gas), (3) dissolved aqueous-phase CO2
(dissolved gas), (4) brine displaced from the storage model intothe overlying aquifer, and (5) gas-phase leakage into the sameaquifer. Since CO2modeling contains two periods (injection andmonitoring) and during each period, viscous force, gravity, andheterogeneity can exert different influence on flow, sensitivity ofmodel outcomes to parameters is expected to change with time.Each outcome is exported at six different times: at the end ofinjection and at 100, 200, 300, 400, and 500 years postinjection.2.3.3. DoE and RSModeling. For the seven factors varied in the
SA, a PB design table is shown (Table 2). A center run is addedwhere all factors assuming their median (“0”) values. This run is
optional for identifying important factors, but is necessary foridentifying parameter nonlinearity and providing center-valuedresponses for RS modeling. After simulating all runs in Table 2,model outcomes at the select output times are compiled. Foreach outcome (at each time), parameter importance is deter-mined by its main effect on the outcome at a specified statisticalconfidence level. Using MANOVA, a list of the most importantto the least important parameters can be identified. The FHMfollows this design exactly. For the stratigraphic models, VAR isnot a direct input factor. Instead, the level of VAR determines aset of equivalent permeabilities that has been computed byhomogenizing the FHM.6 For all models, at all depths (1, 2,and 3 km), 4 � 13 � 3 = 156 simulations are conducted.Prediction uncertainty of all models is evaluated following
these steps: (1) RS models are first developed for the FHM formultiple outcomes, and at multiple times. These models are verifiedagainst the simulation results; (2) for the same outcomes, RSmodels are developed and verified for the stratigraphic models.(3) using RSs, at each output time, minimum and maximumresponses of an outcome are generated. A time-dependent pre-diction envelope is created. (4) for the same outcome, predictionenvelopes are compared among the models. (5) above analysis isrepeated at different depths, following a DoE analysis conductedusing CO2 simulation results at that depth.
3. RESULTS AND DISCUSSION
Results of this study follow five themes: (1) DoE results of theFHM are analyzed first, providing insights into parametersensitivity for a model with fully resolved permeability. (2)DoE results of all models are compared to evaluate parametersensitivity in response to changing conceptual models (Table 3).For select simulation runs, gas profiles, plume shape, and CO2/brine leakage are compared. (3) RS results of all models arecompared to identify an appropriate stratigraphic model that cancapture the prediction envelopes of the FHM. (4) All resultsabove pertain to a system depth of 2 km—the center value ofdepth. The analysis is repeated at 1 and 3 km depths to evaluateits effect on parameter sensitivity and prediction uncertainty. (5)Time scale of simulation is reduced to emulate pilot-scalescenarios. For most runs, gas-phase leakage through the caprock
Table 1. Input Parameters and Their Ranges Varied in the SAfor the FHM.�1, 0,þ1, Indicate Low, Mid, And High ValuesAssigned to Each Parameter, Respectively. All Parameters AreIndependent of One Another
AquG (m/m) TG (oC/m) VAR SGR SAL ppm q kg/s krock mD
�1 �0.03 0.025 0.1 0.06 10 000 0.45 10�8
0 0.00 0.040 1.0 0.30 135 000 0.68 10�6
1 0.03 0.050 7.0 0.42 260 000 0.90 10�4
Table 2. PB Design with Seven Factors. An Optional CentralRun (Run 7) Is Added. Corresponding Parameter Values for�1/0/1 Are Shown in Table 1
run
AquG
(m/m)
TG
(oC/m) VAR SGR
SAL
(ppm)
q
(kg/s)
krock
(mD)
1 �1 �1 �1 1 �1 �1 1
2 �1 �1 1 �1 �1 1 �1
3 �1 �1 1 �1 1 1 1
4 �1 1 �1 �1 1 �1 1
5 �1 1 �1 1 1 1 �1
6 �1 1 1 1 �1 �1 �1
7 0 0 0 0 0 0 0
8 1 �1 �1 �1 1 �1 �1
9 1 �1 �1 1 �1 1 1
10 1 �1 1 1 1 �1 �1
11 1 1 �1 �1 �1 1 �1
12 1 1 1 �1 �1 �1 1
13 1 1 1 1 1 1 1

D dx.doi.org/10.1021/es103187b |Environ. Sci. Technol. XXXX, XXX, 000–000
Environmental Science & Technology ARTICLE
is negligible, thus statistical tests on parameter importance to thisoutcome cannot be conducted.3.1. Parameter Sensitivity of the FHM. For outcomes of the
FHM, statistically important factors are identified at the 90%confidence level (Table 3). In predicting trapped gas, SGR, VAR,and SAL are the 3 most important factors over the entire simulationtime. Their main effects are positive, indicating that increasing thevalue of each will lead to more residual gas trapping.During monitoring, higher SGR leads to more trapping, as
expected, since gravity override is significant, resulting in upwardplume migration. At the trailing plume, gas saturation (Sg) de-creases (water imbibes), leading to residual trapping. During in-jection, however, SGR is also identified as important, suggestingthat Sg is locally decreasing. This is confirmed by inspecting Sgover time. This could be due to a combination of gravity flow,dissolution, and injector pressure response to boundary condi-tion. For example, when VAR = 7.0, gas plume sought out a high-k pathway in the aquifer and rose toward the caprock. At the endof injection, a small pool appeared beneath the caprock, andalong the pathway, Sg can decrease locally when gravity out-competes viscous drive. The injector pressure is also inspected:after reaching an initially higher value, pressure pulse reaches theboundary, injector pressure is adjusted slightly downward, whichmay cause Sg to decrease. Though the magnitude of this trapping issmall, the amount trapped is controlled by SGR.Increasing VAR results in more trapped gas: higher VAR leads
to more lateral plume spreading, more brine contacts the gas,thus more trapping during imbibition. VAR shifts from being thesecond most important factor during the first 200 years, to beingthe third most important at longer time scales. VAR is importantduring injection and early monitoring, when gas flow andtrapping is most active and thus more sensitive to heterogeneity.In later times,moremobile gas hasmigrated to the top of the aquifer,sampling less heterogeneity as the plume rises. Simultaneously,
much of the gas in the lower aquifer becomes immobilized, thusheterogeneity of the exerts little impact on trapping there.In predicting trapped gas, increasing SAL inhibits dissolution,
leading to more gas available for migration, thus increased amountof residual gas trapping. However, due to less dissolution, theoverall trapping (dissolved plus residual) may decrease.In predicting dissolved gas, SAL is the most important factor
exerting a negative effect over all times, as expected. VAR is thenext most important, though its effect is positive. Larger VARcontributes to more lateral plume spreading, more brine is con-tacted by gas, and thus more dissolution.In predicting mobile gas, VAR is the only important factor
during injection; after injection, SGR is more important, fol-lowed by VAR. Both factors exert negative effects: when VAR ishigh, gas plume is dispersed, thus contacting more brine, result-ing in enhanced residual trapping and dissolution. This leads toless mobile gas. When SGR is high, more gas is trapped, and thusless mobile gas. SGR is not important during injection, probablybecause imbibition is mildly active then, while VAR affects bothtrapping and dissolution. To quickly immobilize the plume in theaquifer, high variance and high residual gas saturation appear ideal.In predicting gas-phase leakage, DoE analysis cannot be con-
ducted since gas leakage through caprock is zero in most runs.Within the parameter space, the high krock (10�4 mD) is com-petent in deterring gasmigration. The largest CO2 leakage occursin Run 4. The amount of the gas leaked is extremely small, but it isof interest to examine the causes. Run 4 has the most favorablecombination of all parameters that contribute to leakage: an up-ward aquiferflow, highTG(more buoyant gas), lowVAR(less lateralspreading, more upward migration), small SGR (less trapping,more mobile gas for migration), high SAL (less dissolution lead-ing to more gas thus more mobile gas), low q (reduced viscousdriving force, less lateral spreading), and high krock.In predicting brine leakage, krock is the most important factor
at all times, while AquG is additionally important duringmonitoring.
Table 3. Results of SA at 2 km Depth. Parameters Important to an Outcome Are Listed from the Most Important to the LeastImportant at a 90% Confidence Level. “Brine Leakage” Is Brine That Has Leaked through the Caprock into the Overlying Aquifer
outcomes models end of injection monitoring period (years after injection ends)
100 200 300 400 500
trapped gas FHM SGR/VAR/SAL SGR/VAR/SAL SGR/VAR/SAL SGR/SAL/VAR SGR/SAL/VAR SGR/SAL/VAR8-UNIT SGR SGR/VAR/SAL SGR/VAR/SAL SGR/VAR/SAL SGR/VAR/SAL SGR/VAR/SAL3-UNIT SGR/VAR SGR/VAR/SAL SGR/VAR/SAL SGR/VAR/SAL SGR/VAR/SAL SGR/VAR/SAL1-UNIT SAL/SGR/q/TG SGR/SAL SGR/SAL SGR/SAL SGR/SAL SGR/SAL
dissolved gas FHM SAL/VAR/TG SAL/VAR/SGR SAL/VAR/SGR SAL/VAR/SGR SAL/VAR/SGR SAL/VAR/SGR8-UNIT SAL/TG/VAR/q SAL/VAR SAL/VAR SAL/VAR/TG/
SGRSAL/VAR/SGR/TG SAL/VAR/SGR/
TG3-UNIT SAL/TG/VAR/q SAL/VAR/TG SAL/VAR/TG/
SGRSAL/VAR/TG/
SGRSAL/VAR/TG/SGR SAL/VAR/TG/
SGR1-UNIT SAL SAL/TG/SGR SAL/TG/SGR SAL/SGR/TG SAL/SGR/TG/VAR SAL/SGR/TG
mobile gas FHM VAR SGR/VAR SGR/VAR SGR/VAR SGR/VAR SGR/VAR8-UNIT VAR/SAL SGR/VAR/TG/
AquG/SAL/qSGR/VAR/TG/
SAL/AquGSGR/VAR/SAL SGR/VAR SGR/VAR/SAL
3-UNIT SAL/VAR/SGR SGR/VAR/TG/AquG/SAL
SGR/VAR/TG/AquG
SGR/VAR/TG SGR/VAR SGR/VAR
1-UNIT SAL/SGR/q SGR/VAR SGR/VAR SGR/VAR SGR/VAR SGR
brine leakage FHM krock krock/AquG krock/AquG krock/AquG krock/AquG krock/AquG8-UNIT krock krock/AquG krock/AquG krock/AquG krock/AquG krock/AquG3-UNIT krock krock/AquG krock/AquG krock/AquG krock/AquG krock/AquG1-UNIT krock krock/AquG krock/AquG krock/AquG krock/AquG krock/AquG

E dx.doi.org/10.1021/es103187b |Environ. Sci. Technol. XXXX, XXX, 000–000
Environmental Science & Technology ARTICLE
Brine leakage is driven by pressure buildup in the aquifer, re-flected by a higher rate during injection but lower rate duringmonitoring. After injection ceases, pressure at the injector dis-sipates. The strength and direction of the background flow becomeimportant. Thus, if short-term leakage is of concern, caprock per-meability must be evaluated: a competent caprock for containinggas here is not competent in deterring brine migration. If long-term leakage is of interest, aquifer flow should be evaluated, thoughthis formof leakage could be natural. SinceCO2 dissolves into brine,factors that contribute to brine leakage will also contribute to theleakage of dissolved CO2 into the overlying formations.3.2. Parameter Sensitivity of All Models. SA results of all
models are compared (Table 3), with several observations: (1) inpredicting brine leakage, sensitivity of the stratigraphic models isidentical to that of the FHM. Due to k homogenization, thesemodels predict similar fluid pressure as that of the FHM. Withinthe parameter space evaluated, formation model can be adequatein assessing brine leakage of a heterogeneous system. (2) whenpredicting trapped gas, SA results of the facies and layeredmodels are close to those of the FHM. (3) when predicting dis-solved gas, all stratigraphic models are sensitive to the same, mostimportant, factor of the FHM (i.e., SAL), though they fail toconsistently capture the secondary or tertiary factors. (4) whenpredicting mobile gas, SGR and VAR are the twomost frequentlyoccurring factors for all models.Since VAR is consistently identified as an important parameter
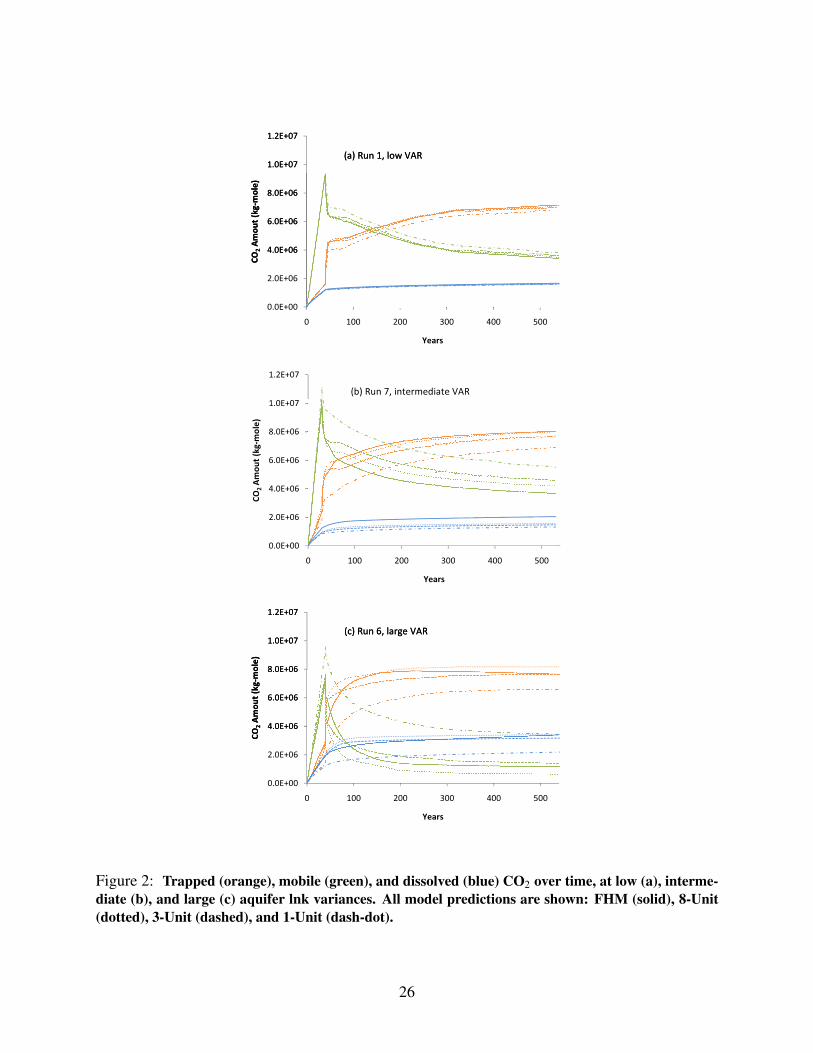
impacting gas predictions, three runs with low (Run 1), inter-mediate (Run 7), and high (Run 6) VAR are compared amongthe models, in terms of gas profile and plume shape predictions(see SI). Results suggest that, in gas predictions, both hetero-geneity variance and heterogeneity resolution are important incontrolling the accuracy of the stratigraphic models: whenvariance is fixed, higher resolution leads to greater accuracy;when resolution is fixed, higher variance leads to greater inaccu-racy. However, brine leakage predicted by these models is almostidentical, proving that accuracy in brine prediction is not affectedby either heterogeneity variance or its resolution.3.3. Response Surface Modeling. Within the parameter
space, a prediction envelope can be created for each outcome using
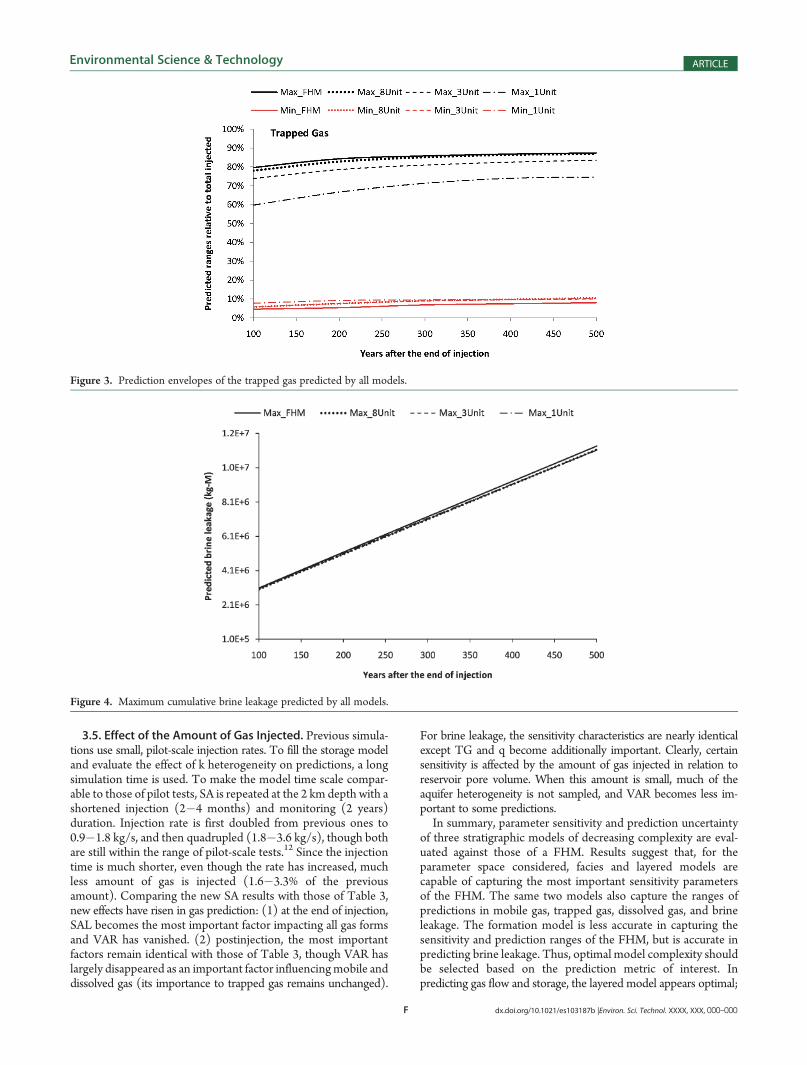
RSs. For each model, time-dependent prediction envelopes arecreated for the monitoring phase. The outcomes are: mobile gas(Figure 2), trapped gas (Figure 3), and brine leakage (Figure 4).The amount of dissolved gas depends on the other gas forms; itsresults are not presented. The envelopes are created by running aRS model to identify the minimum and maximum values of anoutcome. However, when brine leakage is close to zero, extra-polation of RS predicts meaningless (negative) values. Only max-imum leakage is determined. Results suggest that in predictingboth mobile and trapped gas (thus dissolved gas), the facies andlayered models are adequate for capturing the prediction envel-opes of the FHM. The formation model suffers large errors inpredicting minimummobile gas andmaximum trapped gas. Notethat in comparing the prediction envelopes, factor combinationthat gives rise to a maximum mobile gas will likely correspond toa minimum trapped and dissolved gas, vice versa. In predictingmaximum brine leakage, all models give nearly identical results,as expected.Above results suggest that if an appropriate stratigraphic model is
used, prediction envelopes generated using RSs of this model canpotentially capture the prediction envelopes of the FHM gener-ated with full-field simulations. This statement is approximatelytrue, since prediction envelopes of the FHM were not generatedusing numerous reservoir simulations, but were instead gener-ated by the RSs of the FHM. These RSs involve interpolation inthe parameter space at unsampled parameter values. If the RSmodel is very accurate, minimum or maximum on the RS are ex-pected to be similar to the true minimum ormaximum. However,the PB design, though efficient (fewer runs), is of lower resolu-tion. In the DoE and RSmethodology, higher resolution schemesexist which use more simulations to gain greater accuracy in RSmodeling. These designs will be evaluated in future work.3.4. Effect of Depth. The above SA and RS results were
examined at 2 km depth. The analysis is repeated at 1 and 3 kmdepths (see SI). Both parameter sensitivity and predictionuncertainty of the FHM and the ability of the stratigraphicmodels to capture them are similar to those identified at 2 km,suggesting that the above observations can be extended toother depths.
Figure 2. Prediction envelopes of the mobile gas predicted by all models. The amount of mobile gas is expressed in terms of percentage of the totalinjected gas.
F dx.doi.org/10.1021/es103187b |Environ. Sci. Technol. XXXX, XXX, 000–000
Environmental Science & Technology ARTICLE
3.5. Effect of the Amount of Gas Injected. Previous simula-tions use small, pilot-scale injection rates. To fill the storage modeland evaluate the effect of k heterogeneity on predictions, a longsimulation time is used. To make the model time scale compar-able to those of pilot tests, SA is repeated at the 2 km depth with ashortened injection (2�4 months) and monitoring (2 years)duration. Injection rate is first doubled from previous ones to0.9�1.8 kg/s, and then quadrupled (1.8�3.6 kg/s), though bothare still within the range of pilot-scale tests.12 Since the injectiontime is much shorter, even though the rate has increased, muchless amount of gas is injected (1.6�3.3% of the previousamount). Comparing the new SA results with those of Table 3,new effects have risen in gas prediction: (1) at the end of injection,SAL becomes the most important factor impacting all gas formsand VAR has vanished. (2) postinjection, the most importantfactors remain identical with those of Table 3, though VAR haslargely disappeared as an important factor influencingmobile anddissolved gas (its importance to trapped gas remains unchanged).
For brine leakage, the sensitivity characteristics are nearly identicalexcept TG and q become additionally important. Clearly, certainsensitivity is affected by the amount of gas injected in relation toreservoir pore volume. When this amount is small, much of theaquifer heterogeneity is not sampled, and VAR becomes less im-portant to some predictions.In summary, parameter sensitivity and prediction uncertainty
of three stratigraphic models of decreasing complexity are eval-uated against those of a FHM. Results suggest that, for theparameter space considered, facies and layered models arecapable of capturing the most important sensitivity parametersof the FHM. The same two models also capture the ranges ofpredictions in mobile gas, trapped gas, dissolved gas, and brineleakage. The formation model is less accurate in capturing thesensitivity and prediction ranges of the FHM, but is accurate inpredicting brine leakage. Thus, optimal model complexity shouldbe selected based on the prediction metric of interest. Inpredicting gas flow and storage, the layered model appears optimal;
Figure 4. Maximum cumulative brine leakage predicted by all models.
Figure 3. Prediction envelopes of the trapped gas predicted by all models.

G dx.doi.org/10.1021/es103187b |Environ. Sci. Technol. XXXX, XXX, 000–000
Environmental Science & Technology ARTICLE
in predicting brine leakage (related to fluid pressure), the for-mation model appears optimal. Furthermore, for the models andparameters considered, permeability variance, gas relative per-meability hysteresis, and salinity consistently impact one or moreprediction outcomes, suggesting that they should be routinelyevaluated in site assessments. In particular, when heterogeneity isof low variance, simple stratigraphic models can accurately predictplume shape and CO2 mass fractions; when variance increases,models with higher heterogeneity resolution are needed. How-ever, the importance of variance can diminish when the amountof gas injected is small. These observations are expected tobe applicable to the full range of depths encountered in CCSoperations.Our results, however, are specific to the ranges of the para-
meters varied. For example, if an end-member valuemuch greaterthan 10�4 mD is assigned to krock, its importance to predictinggas-phase leakage will likely change. At a typical storage site,information usually exists concerning caprock and its perme-ability. krock range here reflects a degree of prior knowledge.Since the DoE and RS methodology is applicable to fieldmodeling, parameters and their ranges should be tailored tosite-specific condition incorporating prior knowledge beforeuncertainty analysis is performed. Furthermore, results of thisstudy are obtained using a screening design which sacrifices re-solution for efficiency. Future work will investigate high resolu-tion designs which can enhance the accuracy of RS modeling.Finally, a fixed aquifer geometry is evaluated with no dippingbeds. Though variance of heterogeneity is varied for the FHM, itspattern is fixed. Future work will evaluate aquifers with differentdip, geometry, and internal heterogeneity (e.g., weak versusstrong connectivity in permeability). Capillary pressure effectswill be modeled, as well as other potentially important variablesand processes (e.g., vertical versus horizontal wells, lateral aquiferflow). Future work will also assess injection rates commensuratewith those used in commercial-scale operations.
’ASSOCIATED CONTENT
bS Supporting Information. Additional information includ-ing three figures and three tables. This material is available free ofcharge via the Internet at http://pubs.acs.org.
’AUTHOR INFORMATION
Corresponding Author*E-mail: [email protected].
’ACKNOWLEDGMENT
Acknowledgment is made to the donors of the AmericanChemical Society Petroleum Research Fund (ACS PRF GrantNo. 48773-DNI 8) for partial support of this research. Supportfrom the National Science Foundation (EAR-0838250) is ac-knowledged, as well as the School of Energy Resources at theUniversity of Wyoming through its Matching Grant FundProgram. We thank Schlumberger Information Solutions forsoftware donation and technical support.
’REFERENCES
(1) IPCC. Carbon Dioxide Capture and Storage, Chp 5, Under-ground Geological Storage. http://www.ipcc.ch/pdf/special-reports/srccs/ (accessed July 24, 2007).
(2) Gerritsen, M.; Durlofsky, L. J. Modeling fluid flow in oil reser-voirs. Annu. Rev. Fluid Mech. 2005, 211�238, doi: 10.1146/annurev.fluid.37.061903.175748.
(3) Friedmann, F.; Chawathe, A.; Larue, D. Assessing uncertainty inchannelized reservoirs using experimental designs. SPE, 2003, PaperNumber 85117.
(4) Narahara, G.; Spokes, J.; Brennan, D.; Maxwell, G.; Bast, M.WellCount Optimization Incorporating a Wide Range of Uncertainties for theDeepwater Agbami Field, 16988. ; SPE: Houston, TX, May 3—6, 2004.
(5) Bryant, S.; Lakeshminarasimhan, S.; Pope, G. A. Buoyancy-dominated multiphase flow and its effect on geological sequestrationof CO2. SPE J. 2008, 447–454.
(6) Zhang, Y.; Liu, B.; Gable, C. W. Homogenization of hydraulicconductivity for hierarchical sedimentary deposits at multiple scales.Transp. Porous Media 2011, DOI: 10.1007/s11242-010-9711-8.
(7) Eccles, J. K.; N., R. G.; Pratson, L.; Jackson, R. B. Phyisical andeconomic potential of geologic CO2 storage in saline aquifers. Envrion.Sci. Technol. 2009, 43, 1962–1969.
(8) Doughty, C.; Pruess, K. Modeling supercritical carbon dioxideinjection in heterogeneous porous media. Vadose Zone J. 2004,3, 837–847.
(9) Montgomery, D. C. Design and Analysis of Experiments, 7th ed.;John Wiley & Sons, Inc: New York, 2008.
(10) Milliken, W.; Levy, M.; Strebelle, S.; Zhang, Y. The effect ofgeologic parameters and uncertainties on subsurface flow: Deepwaterdepositional systems. SPE, 2007, Paper Number 109950.
(11) Myers, R.; Montgomery, D. Response Surface Methodology—Process and Product Optimization Using Designed Experiments; JohnWiley& Sons: New York, 1995.
(12) Michael, K.; Golab, A.; Shulakova, V.; Ennis-King, J.; Allinson,G.; Sharma, S.; Aikeen, T. Geological storage of CO2 in saline aquifers—A review of the experience from existing storage operations. Int.J. Greenhouse Gas Control 2010, 4, 659–667.

Supporting Information Available
4 SUPPLEMENTAL
4.1 Numerical Simulation of CO2 Injection
CO2 injection is simulated with GASWAT (2009), a multiphase compositional simulator applica-
ble to modeling CO2 flow in deep saline aquifers (13). Two phases are considered: a CO2-rich
supercritical phase (or “gas” phase) and a H2O-rich liquid phase. CO2 density is computed based
on a cubic equation of state tuned to experimental measurements, while liquid density is corrected
for total dissolved solids (salinity). Between the two phases, two components (CO2, H2O) are
modeled; each component can exist in both phases. The simulator first solves the pressure and
molar density of each component. The mole fractions of the components in the phases are then
computed through a flash process, where mutual solubilities of CO2 and H2O are calculated to
match experimental data. A modified Peng-Robinson Equation of State is used to calculate gas
solubility in the aqueous phase when water salinity is high.
A constant reservoir temperature is specified, based on model depth, geothermal gradient, and
a fixed surface temperature. GASWAT does not solve the heat balance equation, thus the reservoir
temperature is not perturbed by CO2 flow (temperature is used to compute the in-situ fluid prop-
erties). The storage model is saturated with brine prior to CO2 injection. Water is assumed to be
the wetting phase, CO2 the non-wetting phase. Rock compressibility is assigned using a typical
value for sandstones. Relative permeability functions are based on experimental measurements
(see 5.2 for details). To model flow reversal in a grid cell before the maximum gas saturation is
reached, the Carlson method is used for scanning curve interpolation between the bounding relative
permeability curves (14).
The storage model is assumed to be part of a larger regional flow system, thus open boundary
(constant-head) is assigned to the model sides, which allows both gas and brine to migrate laterally
out of the aquifer. This boundary condition also prevents pressure buildup in the model. The
19

injector bottomhole pressure (BHP) is checked against a fracture pressure, which is evaluated at
the model depth as 1.6 × hydrostatic pressure (the piezometric head of the aquifer is assumed to
be at the land surface). In all simulations of the SA, by setting the fracture pressure as the BHP
constraint for the injector, the fracture pressure is never exceeded.
4.2 Input Variables
The SA for each storage model varies a select set of input parameters, while keeping others con-
stant. The constant parameters are those that either do not vary (e.g., gravitational constant), or
their variations are typically small at a storage site (e.g., porosity, rock/fluid compressibility). The
parameters that are varied in the SA are those that can exhibit large uncertainties at a storage site.
All model parameters are listed in Table 1, including their values used by simulations or ranges
varied in the SA. For the parameters varied in the SA, detailed justifications are provided below.
Table 1: Model parameters and their values. Parameters varied in the SA are labeled as “variable”.
Parameter Symbol Value Unit Noteporosity (caprock) φ 0.01 fixedporosity (aquifer) φ 0.15 fixedirreducible water saturation Swi 0.42 fixedgas endpoint relative permeability kend
rg 0.26 fixedwater endpoint relative permeability kend
rw 1.0 fixeddrainage connate water saturation Sd
w 0.06 fixedcritical gas saturation Scr
g 0.06 fixedtemperature (land surface) T 15 oC fixedhydrostatic pressure gradient ∇P 0.10 bar/m fixedrock compressibility β 1.4×10⁻⁵ 1/bar fixeddepth of the top of the grid D 1000–3000 m variableresidual gas saturation Sr
g or SGR 0.06–0.42 variablesalinity SAL 10,000–260,000 ppm variableinjection rate q 0.45–0.90 kg/s variableregional (vertical) hydraulic gradient AquG -0.03–0.03 m/m variablecaprock permeability krock 10−8–10−4 mD variablegeothermal gradient TG 0.025-0.050 oC/m variableaquifer lnk variance VAR 0.1–7.0 mD2 variable
(1) Gradient of the background aquifer flow (AquG). In sedimentary basins, background flow
can exist when the storage aquifer is part of a larger groundwater system. A vertical background
20
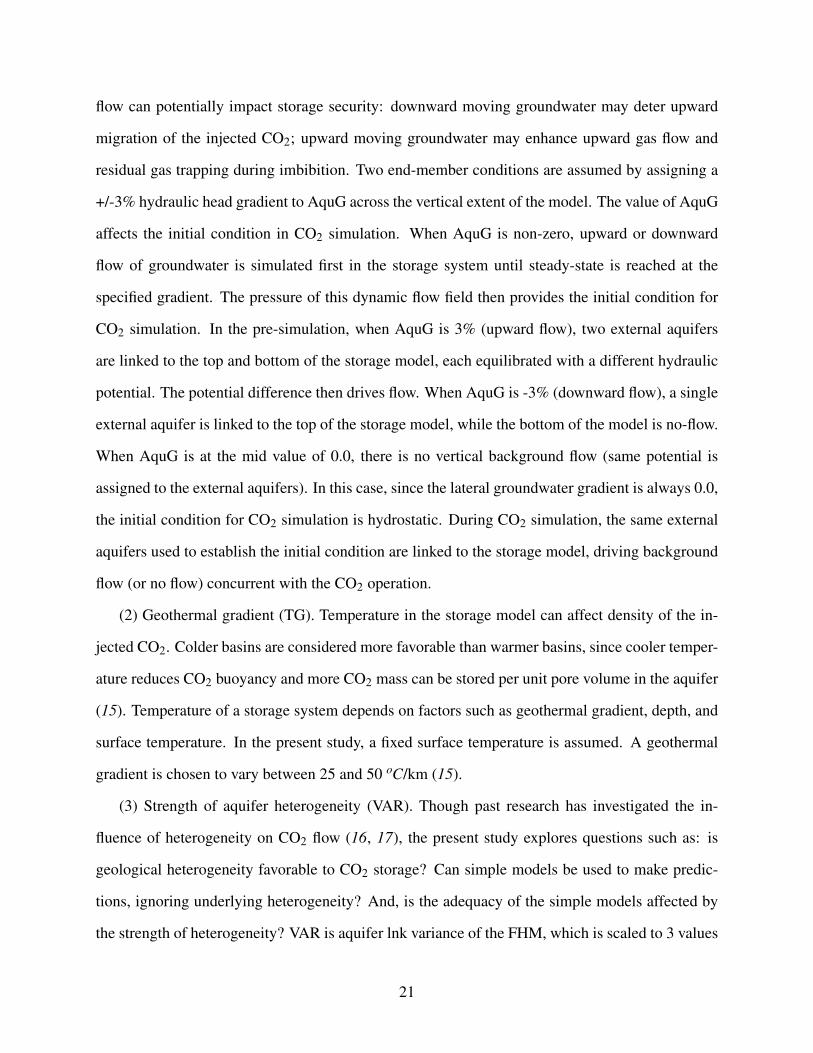
flow can potentially impact storage security: downward moving groundwater may deter upward
migration of the injected CO2; upward moving groundwater may enhance upward gas flow and
residual gas trapping during imbibition. Two end-member conditions are assumed by assigning a
+/-3% hydraulic head gradient to AquG across the vertical extent of the model. The value of AquG
affects the initial condition in CO2 simulation. When AquG is non-zero, upward or downward
flow of groundwater is simulated first in the storage system until steady-state is reached at the
specified gradient. The pressure of this dynamic flow field then provides the initial condition for
CO2 simulation. In the pre-simulation, when AquG is 3% (upward flow), two external aquifers
are linked to the top and bottom of the storage model, each equilibrated with a different hydraulic
potential. The potential difference then drives flow. When AquG is -3% (downward flow), a single
external aquifer is linked to the top of the storage model, while the bottom of the model is no-flow.
When AquG is at the mid value of 0.0, there is no vertical background flow (same potential is
assigned to the external aquifers). In this case, since the lateral groundwater gradient is always 0.0,
the initial condition for CO2 simulation is hydrostatic. During CO2 simulation, the same external
aquifers used to establish the initial condition are linked to the storage model, driving background
flow (or no flow) concurrent with the CO2 operation.
(2) Geothermal gradient (TG). Temperature in the storage model can affect density of the in-
jected CO2. Colder basins are considered more favorable than warmer basins, since cooler temper-
ature reduces CO2 buoyancy and more CO2 mass can be stored per unit pore volume in the aquifer
(15). Temperature of a storage system depends on factors such as geothermal gradient, depth, and
surface temperature. In the present study, a fixed surface temperature is assumed. A geothermal
gradient is chosen to vary between 25 and 50 oC/km (15).
(3) Strength of aquifer heterogeneity (VAR). Though past research has investigated the in-
fluence of heterogeneity on CO2 flow (16, 17), the present study explores questions such as: is
geological heterogeneity favorable to CO2 storage? Can simple models be used to make predic-
tions, ignoring underlying heterogeneity? And, is the adequacy of the simple models affected by
the strength of heterogeneity? VAR is aquifer lnk variance of the FHM, which is scaled to 3 values
21

in the SA: 0.1, 1.0, and 7.0, representing a weakly to strongly heterogeneous system (18). During
this scaling, the mean lnk of the aquifer remains fixed, thus only the spread of the heterogeneity is
affected. As a result, three sets of permeability data are created for the FHM, based on which three
sets of equivalent permeabilities are computed for the units of the stratigraphic models.
(4) Gas phase relative permeability hysteresis (SGR). The importance of residual gas trapping
due to non-wetting phase relative permeability hysteresis is widely recognized, though uncertainty
exists in the magnitude of this hysteresis for the CO2/brine system. In this study, a uniform set of
relative permeability functions is assigned to the aquifer, though residual gas saturation is varied
between 0.06 to 0.42, representing zero to large gas phase relative permeability hysteresis (Fig-
ure 1). These functions are constructed using experimental data for the Viking Sandstone (19). For
the caprock, a separate set of non-hysteretic relative permeability functions is used based on those
measured for the low-permeability Calmar Formation in the Alberta Basin (20).
(5) Salinity (SAL). Salinity affects CO2 dissolution in brine (21) as well as brine density. Salin-
ity is varied from 10,000 to 260,000 ppm. 10,000 ppm is the lower limit at which a deep aquifer
qualifies for CO2 storage; 260,000 ppm is the upper limit of applicability for the solubility module
of GASWAT.
(6) Injection rate (q). Injection rate can affect the lateral extent of the injected CO2. Increasing
rate increases the viscous driving force which enhances lateral spreading, thus more trapping and
dissolution. Higher rate can also create higher local pressure gradient near the injector, which leads
to higher maximum gas saturation before flow reversal. Following the scanning curve that is closer
to the bounding imbibition curve, the higher gas saturation will lead to more residual trapping
during imbibition. The injection rate is varied between 0.45 and 0.9 kg/s, the later being the largest
rate at which convergence issues will not occur in all the simulation runs, while satisfying the
BHP constraint. Note that when higher rates were initially attempted, some DoE runs could not
converge after a long simulation time (e.g., 3 weeks). The injection rate used here reflects a pilot-
scale scenario, which is not fully realistic considering that commercial-scale injection rate can be
higher. Future work will consider larger rates after the simulator issues and constraints are first
22

0.3
0.4
0.5
0.6
0.7
0.8
0.9
1
kr
(fra
ction
)
krw, drn
krg, drn
krg, imb_mid
krg, imb_max
(a) Saline aquifer
Sgcr=0.06
0
0.1
0.2
0.3
0.4
0.5
0.6
0.7
0.8
0.9
1
0 0.2 0.4 0.6 0.8 1
kr
(fra
ction
)
Brine saturation (fraction)
krw, drn
krg, drn
krg, imb_mid
krg, imb_max
(a) Saline aquifer
0.3
0.4
0.5
0.6
0.7
0.8
0.9
1
kr
(fra
ction
)
krw, drn
krg, drn
(b) Caprock
0
0.1
0.2
0.3
0.4
0.5
0.6
0.7
0.8
0.9
1
0 0.2 0.4 0.6 0.8 1
kr
(fra
ction
)
Brine saturation (fraction)
krw, drn
krg, drn
(b) Caprock
Figure 1: Relative permeability functions for the aquifer (a) and the caprock (b). In the SA, theresidual gas saturation (SGR) in the aquifer is varied, i.e., the 3 bounding imbibition curves in (a),one coinciding with the drainage curve when SGR is 0.06 (Table 1). In this case, SGR = Scr
g (criticalgas saturation) and gas phase relative permeability is non-hysteretic.
23

overcome.
(7) Caprock permeability (krock). Caprock permeability can influence not only gas and brine
migration but also the evolution of reservoir fluid pressure, particularly if the formation is com-
partmentalized (not considered here) (22). A set of preliminary simulations was conducted first to
identify a maximum krock of 1x10⁻⁴ mD without leading to significant gas-phase leakage. In these
simulations, all other parameters assumed their center values, thus the maximum krock found is not
necessarily applicable to all parameter combinations. krock is assumed to vary between 1x10⁻⁴
and 1x10⁻⁸ mD, based on values observed for shale and clay-rich rocks.
4.3 Results at 1 km & 3 km Depths
The SA is repeated for all models, with the system depth adjusted to 1 and 3 km, respectively.
Important parameters to the same set of prediction outcomes are compiled (Table 2, Table 3).
Compared to the results at 2 km (Table 3), the most significant difference occurs at 3 km, during
early monitoring: TG becomes important to predicting brine leakage (positive effect), dissolved
gas (positive effect), and mobile gas (negative effect). This suggests that within the parameter
space, the importance of geothermal gradient to predictions is affected by changing depth, though
such effects are mostly secondary.
Table 2: Results of SA at 1 km depth.
Outcomes Models End of Injection Monitoring Period (Years After Injection Ends)100 200 300 400 500
Trapped Gas
FHM SGR SGR/VAR/SAL SGR/VAR/SAL SGR/SAL/VAR SGR/SAL/VAR SGR/SAL/VAR8UNIT VAR/SGR SGR/VAR/SAL/AquG SGR/VAR/SAL SGR/VAR/SAL SGR/VAR/SAL SGR/VAR/SAL3UNIT SAL/TG/VAR/q SAL/VAR/TG SAL/VAR/TG/SGR SAL/VAR/TG/SGR SAL/VAR/TG/SGR SAL/VAR/TG/SGR1UNIT SGR/SAL/q SGR SGR SGR/SAL SGR/SAL SGR/SAL/VAR
Dissolved Gas
FHM SAL/VAR/TG SAL/VAR SAL/VAR/SGR SAL/VAR/SGR SAL/VAR/SGR SAL/VAR/SGR8UNIT SAL/TG/VAR/q SAL/VAR/TG SAL/VAR/TG/SGR SAL/VAR/TG/SGR SAL/VAR/TG/SGR SAL/VAR/SGR/TG3UNIT SAL/TG/VAR/q SAL/VAR/SGR/TG SAL/VAR/SGR/TG SAL/VAR/SGR/TG SAL/VAR/SGR/TG SAL/SGR/VAR1UNIT SAL/TG SAL/SGR/TG/VAR SAL/SGR/TG/VAR SAL/SGR/TG/VAR SAL SAL/SGR/TG
Mobile Gas
FHM VAR SGR/VAR SGR/VAR SGR/VAR SGR/VAR/SAL SGR/VAR/SAL8UNIT VAR/SAL/TG/SGR SGR/VAR/AquG/SAL/TG SGR/VAR/SAL SGR/VAR/SAL SGR/VAR/SAL SGR/VAR/SAL3UNIT VAR/SAL SGR/VAR/AquG/SAL/TG SGR/VAR/SAL/AquG/TG SGR/VAR/SAL SGR/VAR/SAL SGR/VAR/SAL1UNIT SAL/q/SGR/AquG SGR/VAR SGR SGR SGR SGR/VAR
Brine Leakage
FHM krock krock/AquG/TG krock/AquG krock/AquG krock/AquG krock/AquG8-UNIT krock krock/AquG/TG krock/AquG krock/AquG krock/AquG krock/AquG3-UNIT krock krock/AquG/TG krock/AquG krock/AquG krock/AquG krock/AquG1-UNIT krock krock/AquG/TG krock/AquG krock/AquG krock/AquG krock/AquG
24

Table 3: Results of SA at 3 km depth.
Outcomes Models End of Injection Monitoring Period (Years After Injection Ends)100 200 300 400 500
Trapped Gas
FHM SGR/VAR SGR/SAL/VAR SGR/SAL/VAR SGR/SAL/VAR SGR/SAL/VAR SGR/SAL/VAR8UNIT SGR SGR/SAL/VAR SGR/VAR/SAL SGR/VAR/SAL SGR/SAL/VAR SGR/SAL/VAR3UNIT SGR SGR/SAL SGR/SAL/VAR SGR/SAL/VAR SGR/SAL/VAR SGR/SAL/VAR1UNIT SGR/SAL SGR/SAL SGR/SAL SGR/SAL SGR/SAL SGR/SAL
Dissolved Gas
FHM SAL/TG/VAR SAL/VAR/TG/SGR SAL/VAR/SGR/TG SAL/VAR/SGR/TG SAL/VAR/SGR/TG SAL/VAR/SGR/TG/krock8UNIT SAL/TG/VAR/q SAL/TG/VAR SAL/VAR/TG SAL/VAR/TG SAL/VAR/TG SALVAR/TG/SGR3UNIT SAL/TG/VAR/q SAL/TG/VAR SAL/TG/VAR SAL/TG/VAR SAL/VAR/TG/SGR SAL/VAR/TG/SGR1UNIT SAL/TG SAL/TG/SGR SAL/TG/SGR SAL/TG/SGR/VAR SAL/TG/SGR/VAR SAL/TG/SGR/VAR
Mobile Gas
FHM VAR SGR/VAR/TG/krock SGR/VAR/TG SGR/VAR SGR/VAR SGR/VAR8UNIT SAL/VAR/TG SGR/VAR/TG/AquG SGR/VAR/TG SGR/VAR/TG SGR/VAR/TG/SAL SGR/VAR/SAL3UNIT SAL SGR/VAR/TG/AquG SGR/VAR/TG SGR/VAR/TG SGR/VAR SGR/VAR1UNIT SAL/SGR/q SGR/TG SGR/TG/q/VAR SGR/TG SGR SGR
Brine Leakage
FHM krock krock krock/AquG/TG krock/AquG/TG krock/AquG/TG krock/AquG8-UNIT krock krock/AquG/TG krock/AquG/TG krock/AquG/TG krock/AquG krock/AquG3-UNIT krock krock/AquG/TG krock/AquG/TG krock/AquG krock/AquG krock/AquG1-UNIT krock krock/AquG/TG krock/AquG/TG krock/AquG krock/AquG krock/AquG
4.4 Gas Profile and Plume Shape Predictions
Since VAR is consistently identified as an important parameter impacting gas predictions, three
runs with low (Run 1), intermediate (Run 7), and high (Run 6) VAR are presented. The model
depth is 2 km. In each run, performance of the stratigraphic models is compared with that of the
FHM.
Gas profiles are compared first (Figure 2): (1) in all runs, the 8-Unit model is the most accurate,
followed by the 3-Unit and 1-Unit models. (2) when variance is low, prediction errors of the
stratigraphic models are smaller, vice versa.
Gas plumes simulated by the same models are visualized next (Figure 3). Here, only the
plumes simulated by the low-variance Run 1 and high-variance Run 6 are shown. For the Run 1
simulations, all models predict very similar plume shapes, at both time scales (end of injection,
end of monitoring). This suggests that when the system variance is low, an optimal stratigraphic
model for predicting the plume shape is the 1-unit model.
When variance is higher, the FHM predicts a plume that is more laterally spread out. During
injection, a sub plume develops in this model through a high permeability pathway, as discussed
in the article. At the end of injection, a small amount of gas has reached and pooled beneath the
caprock. During the monitoring phase, this gas cap expands slowly, while the overall plume shape
does not change significantly. In contrast to Run 1, plume shapes predicted by the stratigraphic
25
4.0E+06
6.0E+06
8.0E+06
1.0E+07
1.2E+07
CO
2A
mo
ut
(k
g-m
ole
)
(a) Run 1, low VAR
0.0E+00
2.0E+06
4.0E+06
6.0E+06
8.0E+06
1.0E+07
1.2E+07
0 100 200 300 400 500
CO
2A
mo
ut
(k
g-m
ole
)
Years
(a) Run 1, low VAR
4.0E+06
6.0E+06
8.0E+06
1.0E+07
1.2E+07
CO
2A
mo
ut
(k
g-m
ole
)
(b) Run 7, intermediate VAR
0.0E+00
2.0E+06
4.0E+06
6.0E+06
8.0E+06
1.0E+07
1.2E+07
0 100 200 300 400 500
CO
2A
mo
ut
(k
g-m
ole
)
Years
(b) Run 7, intermediate VAR
4.0E+06
6.0E+06
8.0E+06
1.0E+07
1.2E+07
CO
2A
mo
ut
(k
g-m
ole
)
(c) Run 6, large VAR
0.0E+00
2.0E+06
4.0E+06
6.0E+06
8.0E+06
1.0E+07
1.2E+07
0 100 200 300 400 500
CO
2A
mo
ut
(k
g-m
ole
)
Years
(c) Run 6, large VAR
Figure 2: Trapped (orange), mobile (green), and dissolved (blue) CO2 over time, at low (a), interme-diate (b), and large (c) aquifer lnk variances. All model predictions are shown: FHM (solid), 8-Unit(dotted), 3-Unit (dashed), and 1-Unit (dash-dot).
26

Sg
0.00 0.25 0.50 0.75 1.00
End of Injection (Run 1) End of Monitoring (Run 1) End of Injection (Run 6) End of Monitoring (Run 6)
FHM
8-Unit
3-Unit
1-Unit
y
z
x
Figure 3: Gas plume visualization at the end of injection and monitoring. Sg includes both mobileand trapped gas. Depth = 2km. Run 1 is of low variance; Run 6 is of high variance. First row: FHM;Second row: 8-unit model; Third row: 3-unit model; Fourth row: 1-unit model. Box indicates modelboundary including the caprock unit.
27

models deviate significantly from those of the FHM, in particular, the sub plume is not predicted
by these models. The 1-unit model is the worst predictor which gives the classic plume shapes of a
homogeneous formation. Comparing the 8-unit and 3-unit models, however, their predictions only
differ slightly, consistent with their mass profile results (Figure 2). When the system variance is
higher, an optimal stratigraphic model for predicting the plume shape is the 3-unit model.
This material is available free of charge via the Internet at http://pubs.acs.org/.
28

References
(1) IPCC, Carbon Dioxide Capture and Storage, Chp 5, Underground Geological Storage.
http://www.ipcc.ch/pdf/special-reports/srccs/.
(2) Gerritsen, M.; Durlofsky, L. J. Modeling Fluid Flow in Oil Reservoirs. Annual Review of
Fluid Mechanics 2005, 211–238, doi: 10.1146/annurev.fluid.37.061903.175748.
(3) Friedmann, F.; Chawathe, A.; Larue, D. Assessing Uncertainty in Channelized Reservoirs
using Experimental Designs. SPE, 2003, Paper Number 85117.
(4) Narahara, G.; Spokes, J.; Brennan, D.; Maxwell, G.; Bast, M. Well count optimization in-
corporating a wide range of uncertainties for the deepwater Agbami Field. 2004; SPE 16988,
Houston, Texas, U.S.A., May 3—6, 2004.
(5) Bryant, S.; Lakeshminarasimhan, S.; Pope, G. A. Buoyancy-Dominated Multiphase Flow and
its Effect on Geological Sequestration of CO2. SPE Journal, 2008, 447–454.
(6) Zhang, Y.; Liu, B.; Gable, C. W. Homogenization of Hydraulic Conductivity for Hierarchical
Sedimentary Deposits at Multiple Scales. Transport in Porous Media, 2011, Accepted for
Publication.
(7) Jordan K. Eccles, R. G. N., Lincoln Pratson; Jackson, R. B. Phyisical and Economic Potential
of Geologic CO2 Storage in Saline Aquifers. Envrionmental Science and Technology, 2009,
43, 1962–1969.
(8) Doughty, C.; Pruess, K. Modeling Supercritical Carbon Dioxide Injection in Heterogeneous
Porous Media. Vadose Zone Journal, 2004, 3, 837–847.
(9) Montgomery, D. C. Design and Analysis of Experiments, 7th ed.; John Wiley & Sons, Inc,
2008.
29

(10) Milliken, W.; Levy, M.; Strebelle, S.; Zhang, Y. The Effect of Geologic Parameters and Un-
certainties on Subsurface Flow: Deepwater Depositional Systems. SPE, 2007, Paper Number
109950.
(11) Myers, R.; Montgomery, D. Response Surface Methodology — Process and Product Opti-
mization Using Designed Experiments; John Wiley & Sons: New York, 1995.
(12) Michael, K.; Golab, A.; Shulakova, V.; Ennis-King, J.; Allinson, G.; Sharma, S.; Aikeen, T.
Geological storage of CO2 in saline aquifers - a review of the experience from existing storage
operations. International Journal of Greenhouse Gas Control 2010, 4, 659–667.
(13) Schlumberger, ECLIPSE Technical Manual: the GASWAT Option. 2009.
(14) Carlson, F. Simulation of relative pearmeability hysteresis to the non-wetting phase. SPE,
1981, 1962–1969, Paper Number 10157.
(15) Bachu, S. Screening and Ranking of Sedimentary Basins for Sequestration of CO2 in Geo-
logical Media in Response to Climate Change. Environmental Geology, 2003, 44, 277–289.
(16) Ashraf, M.; Lie, K.-A.; Nilsen, H. M.; Nordbotten, J. M.; Skorstad, A. Impact of Geological
Heterogeneity on Early-Stage CO2 Plume Migration. 2010; XVIII International Conference
on Water Resources, June 2010, Barcelona.
(17) Oloruntobi, O. S.; LaForce, T. Effect of Aquifer Heterogeneity on CO2 Sequestration. SPE,
2009, Paper Number 121776.
(18) Gelhar, L. W. Stochastic Subsurface Hydrology; Prentice Hall College Div, 1993.
(19) Bennion, D. B.; Bachu, S. Drainage and Imbibition Relative Permeability Relationships
for Supercritical CO2/Brine and H2S/Brine Systems in Intergranular Sandstone, Carbonate,
Shale, and Anhydrite Rocks. SPE, 2008, Paper Number 99326.
30

(20) Bennion, D. B.; Bachu, S. Permeability and Relative Permeability Measurements at Reservoir
Conditions for CO2-Water Systems in Ultra Low Permeability Confining Caprocks. SPE,
2007, Paper Number 106995.
(21) Chang, Y.; Coats, B. K.; Nolen, J. S. A Compositional Model for CO2 Floods Including CO2
Solubility into Water. SPE Reservoir Evaluation and Engineering 1998, 1, 155–160.
(22) Birkholzer, J.; Zhou, Q.; Tsang, C.-F. Large-scale impact of CO2 storage in deep saline
aquifers: A sensitivity study on pressure response in stratified systems. International Journal
of Greenhouse Gas Control 2009, 3, 181–194.
31