CNN Ukraine Crisis Poll - Savanta ComRes€¦ · CNN – Ukraine Crisis Poll METHODOLOGY NOTE...
77
CNN – Ukraine Crisis Poll METHODOLOGY NOTE ComRes interviewed 1,000 Ukraine adults aged 18+ by telephone between 7 th and 11 th May 2014. Interviews were conducted by native speakers of Ukrainian and Russian. Quotas were set on age, gender, region and settlement size in line with official statistics. Data were weighted demographically to be representative of all Ukraine adults aged 18+. All press releases or other publications must be checked with ComRes before use. ComRes requires 48 hours to check a press release unless otherwise agreed. To commission a voting intention poll or a public opinion survey please contact Katharine Peacock: [email protected] To register for Pollwatch, a monthly newsletter update on the polls, please email: [email protected]
Transcript of CNN Ukraine Crisis Poll - Savanta ComRes€¦ · CNN – Ukraine Crisis Poll METHODOLOGY NOTE...

CNN – Ukraine Crisis Poll METHODOLOGY NOTE ComRes interviewed 1,000 Ukraine adults aged 18+ by telephone between 7th and 11th May 2014. Interviews were conducted by native speakers of Ukrainian and Russian. Quotas were set on age, gender, region and settlement size in line with official statistics. Data were weighted demographically to be representative of all Ukraine adults aged 18+. All press releases or other publications must be checked with ComRes before use. ComRes requires 48 hours to check a press release unless otherwise agreed. To commission a voting intention poll or a public opinion survey please contact Katharine Peacock: [email protected]
To register for Pollwatch, a monthly newsletter update on the polls, please email: [email protected]

Table 1 GenderBase:All res pondents
CNN Ukraine Cris is Surv ey Telephone Fieldw ork : 7th - 11th May 2014
Page 1
Absolutes/col percents
Prepared by ComRes
Total Gender Age Region
Male Female 18-35 36-55 56+ North West Central South (without Crimea)
East Ukraine (without Crimea)
Crimea
A B C D E F G H I J K L
Total 1,000 450 550 332 348 320 177 196 221 131 213 938 62
Wtd Total 1,000 456 544 331 350 320 177 201 220 144 212 954 46
Male 456 456 - 169 167 119 91 97 102 67 80 437 19
46% 100% - 51% 48% 37% 52% 48% 46% 47% 38% 46% 40%
Female 544 - 544 161 183 201 86 104 118 77 132 517 27
54% - 100% 49% 52% 63% 48% 52% 54% 53% 62% 54% 60%

Table 1 Cont'dGenderBase:All res pondents
CNN Ukraine Cris is Surv ey Telephone Fieldw ork : 7th - 11th May 2014
Page 2
Absolutes/col percents
Prepared by ComRes
Total Language Sense of loyalty (Eur vs Russia) Sense of loyalty (Russia vs Ukra ine)
Ukrainian Russian Both equally
Other Europe Russia Neither Don't know
Russia Ukraine Neither Don't know
M N O P Q R S T U V W X
Total 1,000 459 406 114 21 555 201 215 29 135 797 51 17
Wtd Total 1,000 465 398 114 23 563 191 217 29 123 806 53 17
Male 456 208 182 50 15 271 74 97 14 55 372 21 8
46% 45% 46% 44% 64% 48% 39% 44% 47% 44% 46% 39% 45%
Female 544 257 216 63 8 292 117 121 15 69 434 32 9
54% 55% 54% 56% 36% 52% 61% 56% 53% 56% 54% 61% 55%

Table 2 AgeBase:All res pondents
CNN Ukraine Cris is Surv ey Telephone Fieldw ork : 7th - 11th May 2014
Page 3
Absolutes/col percents
Prepared by ComRes
Total Gender Age Region
Male Female 18-35 36-55 56+ North West Central South (without Crimea)
East Ukraine (without Crimea)
Crimea
A B C D E F G H I J K L
Total 1,000 450 550 332 348 320 177 196 221 131 213 938 62
Wtd Total 1,000 456 544 331 350 320 177 201 220 144 212 954 46
Less than 18 years - - - - - - - - - - - - -
- - - - - - - - - - - - -
18-35 years 331 169 161 331 - - 65 58 67 49 79 319 12
33% 37% 30% 100% - - 37% 29% 30% 34% 37% 33% 26%
36-55 years 350 167 183 - 350 - 81 74 75 51 53 334 16
35% 37% 34% - 100% - 46% 37% 34% 35% 25% 35% 34%
Over 56 years 320 119 201 - - 320 30 69 78 44 80 301 19
32% 26% 37% - - 100% 17% 34% 35% 31% 38% 32% 40%

Table 2 Cont'dAgeBase:All res pondents
CNN Ukraine Crisis Survey Telephone Fieldw ork : 7th - 11th May 2014
Page 4
Absolutes/col percents
Prepared by ComRes
Total Language Sense of loyalty (Eur vs Russia) Sense of loyalty (Russia vs Ukra ine)
Ukrainian Russian Both equally
Other Europe Russia Neither Don't know
Russia Ukraine Neither Don't know
M N O P Q R S T U V W X
Total 1,000 459 406 114 21 555 201 215 29 135 797 51 17
Wtd Total 1,000 465 398 114 23 563 191 217 29 123 806 53 17
Less than 18 years - - - - - - - - - - - - -
- - - - - - - - - - - - -
18-35 years 331 136 144 44 6 168 68 89 5 51 257 19 3
33% 29% 36% 39% 26% 30% 36% 41% 18% 41% 32% 36% 20%
36-55 years 350 173 126 39 12 209 57 69 14 39 290 16 5
35% 37% 32% 34% 50% 37% 30% 32% 48% 31% 36% 30% 27%
Over 56 years 320 156 127 31 5 186 66 59 10 34 258 18 9
32% 34% 32% 27% 24% 33% 34% 27% 34% 28% 32% 34% 53%

Table 3 Adminis trative uni tBase:All res pondents
CNN Ukraine Cris is Surv ey Telephone Fieldw ork : 7th - 11th May 2014
Page 5
Absolutes/col percents
Prepared by ComRes
Total Gender Age Region
Male Female 18-35 36-55 56+ North West Central South (without Crimea)
East Ukraine (without Crimea)
Crimea
A B C D E F G H I J K L
Total 1,000 450 550 332 348 320 177 196 221 131 213 938 62
Wtd Total 1,000 456 544 331 350 320 177 201 220 144 212 954 46
Vinnyts'ka 43 16 27 19 15 9 - - 43 - - 43 -
4% 4% 5% 6% 4% 3% - - 20% - - 5% -
Volyns'ka 21 7 14 5 10 5 - 21 - - - 21 -
2% 1% 3% 2% 3% 2% - 10% - - - 2% -
Dnipropetrovs'ka 74 35 39 20 23 31 - - 74 - - 74 -
7% 8% 7% 6% 7% 10% - - 34% - - 8% -
Donets'ka 97 38 59 44 24 29 - - - - 97 97 -
10% 8% 11% 13% 7% 9% - - - - 46% 10% -
Zhitomirs'ka 27 15 12 10 12 5 27 - - - - 27 -
3% 3% 2% 3% 4% 2% 15% - - - - 3% -
Zakarpats'ka 25 12 13 7 11 8 - 25 - - - 25 -
2% 3% 2% 2% 3% 2% - 12% - - - 3% -
Zaporiz'ska 38 17 21 15 14 10 - - - 38 - 38 -
4% 4% 4% 4% 4% 3% - - - 26% - 4% -
Ivano-Frankivs'ka 30 15 15 10 9 11 - 30 - - - 30 -
3% 3% 3% 3% 3% 3% - 15% - - - 3% -
Kyiv oblast and city of Kyiv 100 50 50 39 46 16 100 - - - - 100 -
10% 11% 9% 12% 13% 5% 56% - - - - 10% -
Kirovograds'ka 19 7 12 6 2 11 - - 19 - - 19 -
2% 2% 2% 2% 1% 3% - - 9% - - 2% -
Crimea 46 19 27 12 16 19 - - - - - - 46
5% 4% 5% 4% 4% 6% - - - - - - 100%
Lugans'ka 52 21 31 16 9 27 - - - - 52 52 -
5% 5% 6% 5% 2% 8% - - - - 25% 5% -
Lvivska 58 32 26 11 25 22 - 58 - - - 58 -
6% 7% 5% 3% 7% 7% - 29% - - - 6% -
Mykolayivs'ka 28 13 15 7 9 12 - - - 28 - 28 -
3% 3% 3% 2% 3% 4% - - - 19% - 3% -

Table 3 Cont'dAdminis trative uni tBase:All res pondents
CNN Ukraine Cris is Surv ey Telephone Fieldw ork : 7th - 11th May 2014
Page 6
Absolutes/col percents
Prepared by ComRes
Total Gender Age Region
Male Female 18-35 36-55 56+ North West Central South (without Crimea)
East Ukraine (without Crimea)
Crimea
A B C D E F G H I J K L
Total 1,000 450 550 332 348 320 177 196 221 131 213 938 62
Wtd Total 1,000 456 544 331 350 320 177 201 220 144 212 954 46
Odes'ka 55 28 27 18 21 16 - - - 55 - 55 -
5% 6% 5% 6% 6% 5% - - - 38% - 6% -
Poltavs'ka 28 14 14 6 13 9 - - 28 - - 28 -
3% 3% 3% 2% 4% 3% - - 13% - - 3% -
Rivnens'ka 25 12 12 11 7 7 - 25 - - - 25 -
2% 3% 2% 3% 2% 2% - 12% - - - 3% -
Sums'ka 26 14 12 11 10 5 26 - - - - 26 -
3% 3% 2% 3% 3% 2% 15% - - - - 3% -
Ternopilska 23 10 13 6 8 8 - 23 - - - 23 -
2% 2% 2% 2% 2% 3% - 11% - - - 2% -
Kharkivs'ka 63 21 42 19 20 24 - - - - 63 63 -
6% 5% 8% 6% 6% 7% - - - - 30% 7% -
Khersons'ka 23 9 14 10 7 7 - - - 23 - 23 -
2% 2% 3% 3% 2% 2% - - - 16% - 2% -
Khmelnyts'ka 27 14 13 11 12 4 - - 27 - - 27 -
3% 3% 2% 3% 3% 1% - - 12% - - 3% -
Cherkas'ka 29 16 13 5 9 14 - - 29 - - 29 -
3% 3% 2% 2% 3% 5% - - 13% - - 3% -
Chernihivs'ka 24 12 12 6 13 5 24 - - - - 24 -
2% 3% 2% 2% 4% 2% 14% - - - - 3% -
Chernivets'ka 19 8 11 7 5 7 - 19 - - - 19 -
2% 2% 2% 2% 1% 2% - 9% - - - 2% -
Refused - - - - - - - - - - - - -
- - - - - - - - - - - - -

Table 3 Cont'dAdminis trative uni tBase:All res pondents
CNN Ukraine Cris is Surv ey Telephone Fieldw ork : 7th - 11th May 2014
Page 7
Absolutes/col percents
Prepared by ComRes
Total Language Sense of loyalty (Eur vs Russia) Sense of loyalty (Russia vs Ukra ine)
Ukrainian Russian Both equally
Other Europe Russia Neither Don't know
Russia Ukraine Neither Don't know
M N O P Q R S T U V W X
Total 1,000 459 406 114 21 555 201 215 29 135 797 51 17
Wtd Total 1,000 465 398 114 23 563 191 217 29 123 806 53 17
Vinnyts'ka 43 35 5 3 - 28 1 13 1 - 40 2 1
4% 7% 1% 3% - 5% 1% 6% 4% - 5% 4% 7%
Volyns'ka 21 20 1 1 - 16 - 2 2 - 20 - 1
2% 4% 0% 1% - 3% - 1% 8% - 3% - 3%
Dnipropetrovs'ka 74 19 37 17 1 38 11 23 2 6 61 5 1
7% 4% 9% 15% 5% 7% 6% 11% 7% 5% 8% 10% 6%
Donets'ka 97 4 85 7 - 17 51 27 3 37 47 11 2
10% 1% 21% 6% - 3% 27% 12% 9% 30% 6% 20% 10%
Zhitomirs'ka 27 25 1 1 - 23 - 4 - - 26 1 -
3% 5% 0% 1% - 4% - 2% - - 3% 2% -
Zakarpats'ka 25 17 3 - 5 16 3 4 3 - 22 - 3
2% 4% 1% - 23% 3% 1% 2% 9% - 3% - 15%
Zaporiz'ska 38 5 27 5 - 18 7 11 2 2 33 2 1
4% 1% 7% 5% - 3% 4% 5% 7% 2% 4% 4% 6%
Ivano-Frankivs'ka 30 27 2 - 1 26 2 2 - - 29 - 1
3% 6% 1% - 4% 5% 1% 1% - - 4% - 6%
Kyiv oblast and city of Kyiv 100 51 35 13 1 81 - 19 - - 97 2 1
10% 11% 9% 11% 4% 14% - 9% - - 12% 3% 5%
Kirovograds'ka 19 13 1 5 - 14 2 3 - - 18 1 -
2% 3% 0% 5% - 3% 1% 1% - - 2% 1% -
Crimea 46 1 42 1 2 7 36 3 - 35 10 1 -
5% 0% 10% 1% 10% 1% 19% 1% - 28% 1% 3% -
Lugans'ka 52 3 44 3 1 4 31 15 1 23 25 3 1
5% 1% 11% 3% 5% 1% 16% 7% 4% 18% 3% 6% 6%
Lvivska 58 53 2 - 2 54 - 4 - - 58 - -
6% 11% 1% - 11% 10% - 2% - - 7% - -
Mykolayivs'ka 28 12 9 7 - 17 4 4 2 2 24 1 1
3% 3% 2% 6% - 3% 2% 2% 8% 2% 3% 2% 7%
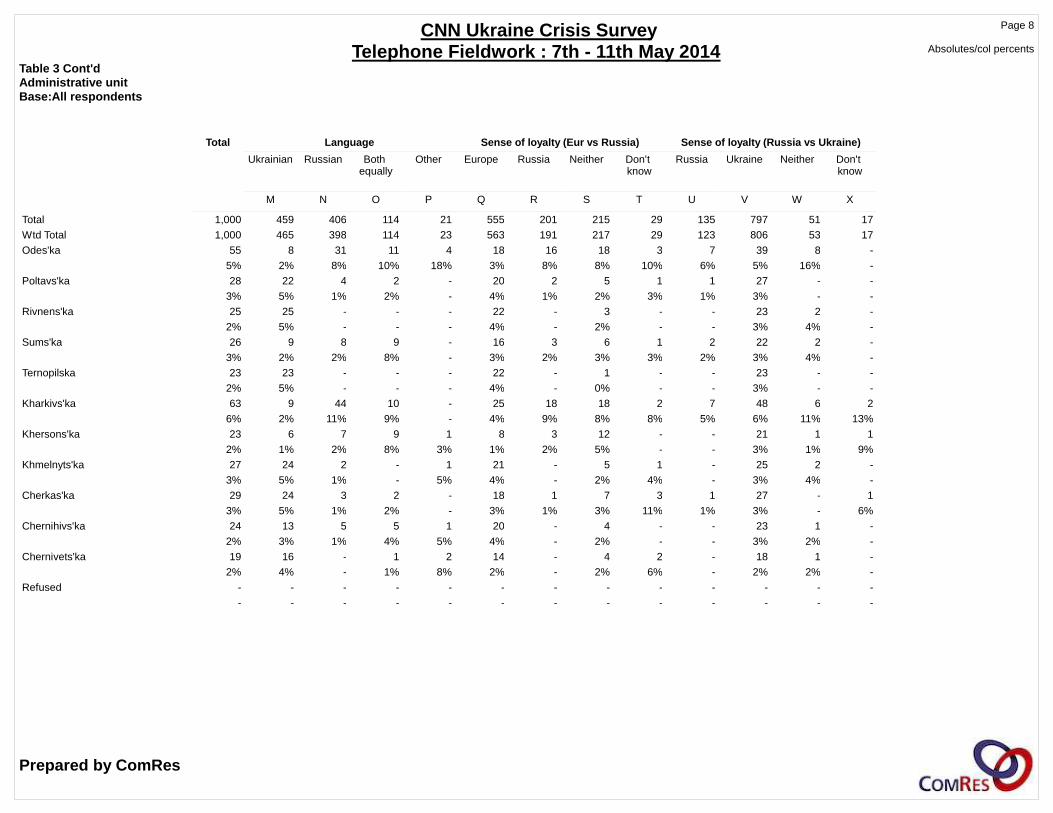
Table 3 Cont'dAdminis trative uni tBase:All res pondents
CNN Ukraine Cris is Surv ey Telephone Fieldw ork : 7th - 11th May 2014
Page 8
Absolutes/col percents
Prepared by ComRes
Total Language Sense of loyalty (Eur vs Russia) Sense of loyalty (Russia vs Ukra ine)
Ukrainian Russian Both equally
Other Europe Russia Neither Don't know
Russia Ukraine Neither Don't know
M N O P Q R S T U V W X
Total 1,000 459 406 114 21 555 201 215 29 135 797 51 17
Wtd Total 1,000 465 398 114 23 563 191 217 29 123 806 53 17
Odes'ka 55 8 31 11 4 18 16 18 3 7 39 8 -
5% 2% 8% 10% 18% 3% 8% 8% 10% 6% 5% 16% -
Poltavs'ka 28 22 4 2 - 20 2 5 1 1 27 - -
3% 5% 1% 2% - 4% 1% 2% 3% 1% 3% - -
Rivnens'ka 25 25 - - - 22 - 3 - - 23 2 -
2% 5% - - - 4% - 2% - - 3% 4% -
Sums'ka 26 9 8 9 - 16 3 6 1 2 22 2 -
3% 2% 2% 8% - 3% 2% 3% 3% 2% 3% 4% -
Ternopilska 23 23 - - - 22 - 1 - - 23 - -
2% 5% - - - 4% - 0% - - 3% - -
Kharkivs'ka 63 9 44 10 - 25 18 18 2 7 48 6 2
6% 2% 11% 9% - 4% 9% 8% 8% 5% 6% 11% 13%
Khersons'ka 23 6 7 9 1 8 3 12 - - 21 1 1
2% 1% 2% 8% 3% 1% 2% 5% - - 3% 1% 9%
Khmelnyts'ka 27 24 2 - 1 21 - 5 1 - 25 2 -
3% 5% 1% - 5% 4% - 2% 4% - 3% 4% -
Cherkas'ka 29 24 3 2 - 18 1 7 3 1 27 - 1
3% 5% 1% 2% - 3% 1% 3% 11% 1% 3% - 6%
Chernihivs'ka 24 13 5 5 1 20 - 4 - - 23 1 -
2% 3% 1% 4% 5% 4% - 2% - - 3% 2% -
Chernivets'ka 19 16 - 1 2 14 - 4 2 - 18 1 -
2% 4% - 1% 8% 2% - 2% 6% - 2% 2% -
Refused - - - - - - - - - - - - -
- - - - - - - - - - - - -

Table 4 Q1_1 - For eac h of the follow ing pl ease tell me w ho you fe el a stronger s ense of loy alty tow ards:Base:All res pondents
CNN Ukraine Cris is Surv ey Telephone Fieldw ork : 7th - 11th May 2014
Page 9
Absolutes/col percents
Prepared by ComRes
Total Gender Age Region
Male Female 18-35 36-55 56+ North West Central South (without Crimea)
East Ukraine (without Crimea)
Crimea
A B C D E F G H I J K L
Total 1,000 450 550 332 348 320 177 196 221 131 213 938 62
Wtd Total 1,000 456 544 331 350 320 177 201 220 144 212 954 46
Europe 563 271 292 168 209 186 140 169 139 61 46 556 7
56% 59% 54% 51% 60% 58% 79% 84% 63% 43% 22% 58% 15%
Russia 191 74 117 68 57 66 3 5 17 30 100 155 36
19% 16% 21% 21% 16% 21% 2% 2% 8% 21% 47% 16% 79%
Neither 217 97 121 89 69 59 33 20 56 45 60 214 3
22% 21% 22% 27% 20% 18% 18% 10% 26% 31% 28% 22% 6%
Don't know 29 14 15 5 14 10 1 7 8 7 6 29 -
3% 3% 3% 2% 4% 3% 1% 3% 4% 5% 3% 3% -

Table 4 Cont'dQ1_1 - For eac h of the follow ing pl ease tell me w ho you fe el a stronger s ense of loy alty tow ards:Base:All res pondents
CNN Ukraine Cris is Surv ey Telephone Fieldw ork : 7th - 11th May 2014
Page 10
Absolutes/col percents
Prepared by ComRes
Total Language Sense of loyalty (Eur vs Russia) Sense of loyalty (Russia vs Ukra ine)
Ukrainian Russian Both equally
Other Europe Russia Neither Don't know
Russia Ukraine Neither Don't know
M N O P Q R S T U V W X
Total 1,000 459 406 114 21 555 201 215 29 135 797 51 17
Wtd Total 1,000 465 398 114 23 563 191 217 29 123 806 53 17
Europe 563 357 133 63 10 563 - - - 2 551 8 2
56% 77% 33% 55% 43% 100% - - - 1% 68% 14% 13%
Russia 191 12 159 15 5 - 191 - - 119 58 8 7
19% 3% 40% 13% 20% - 100% - - 96% 7% 15% 41%
Neither 217 83 93 34 7 - - 217 - 2 177 37 2
22% 18% 23% 30% 31% - - 100% - 1% 22% 68% 10%
Don't know 29 13 13 2 1 - - - 29 1 21 1 6
3% 3% 3% 2% 6% - - - 100% 1% 3% 3% 36%

Table 5 Q1_2 - For eac h of the follow ing pl ease tell me w ho you fe el a stronger s ense of loy alty tow ards:Base:All res pondents
CNN Ukraine Cris is Surv ey Telephone Fieldw ork : 7th - 11th May 2014
Page 11
Absolutes/col percents
Prepared by ComRes
Total Gender Age Region
Male Female 18-35 36-55 56+ North West Central South (without Crimea)
East Ukraine (without Crimea)
Crimea
A B C D E F G H I J K L
Total 1,000 450 550 332 348 320 177 196 221 131 213 938 62
Wtd Total 1,000 456 544 331 350 320 177 201 220 144 212 954 46
Russia 123 55 69 51 39 34 2 - 8 11 67 88 35
12% 12% 13% 15% 11% 11% 1% - 4% 8% 32% 9% 76%
Ukraine 806 372 434 257 290 258 168 194 198 117 120 796 10
81% 82% 80% 78% 83% 81% 95% 96% 90% 81% 57% 83% 21%
Neither 53 21 32 19 16 18 6 3 11 12 20 52 1
5% 5% 6% 6% 5% 6% 4% 2% 5% 9% 9% 5% 3%
Don't know 17 8 9 3 5 9 1 4 3 4 5 17 -
2% 2% 2% 1% 1% 3% 1% 2% 1% 3% 2% 2% -

Table 5 Cont'dQ1_2 - For eac h of the follow ing pl ease tell me w ho you fe el a stronger s ense of loy alty tow ards:Base:All res pondents
CNN Ukraine Cris is Surv ey Telephone Fieldw ork : 7th - 11th May 2014
Page 12
Absolutes/col percents
Prepared by ComRes
Total Language Sense of loyalty (Eur vs Russia) Sense of loyalty (Russia vs Ukra ine)
Ukrainian Russian Both equally
Other Europe Russia Neither Don't know
Russia Ukraine Neither Don't know
M N O P Q R S T U V W X
Total 1,000 459 406 114 21 555 201 215 29 135 797 51 17
Wtd Total 1,000 465 398 114 23 563 191 217 29 123 806 53 17
Russia 123 3 111 8 2 2 119 2 1 123 - - -
12% 1% 28% 7% 8% 0% 62% 1% 4% 100% - - -
Ukraine 806 450 239 97 21 551 58 177 21 - 806 - -
81% 97% 60% 86% 89% 98% 30% 82% 70% - 100% - -
Neither 53 12 32 8 1 8 8 37 1 - - 53 -
5% 3% 8% 7% 3% 1% 4% 17% 5% - - 100% -
Don't know 17 1 17 - - 2 7 2 6 - - - 17
2% 0% 4% - - 0% 4% 1% 21% - - - 100%
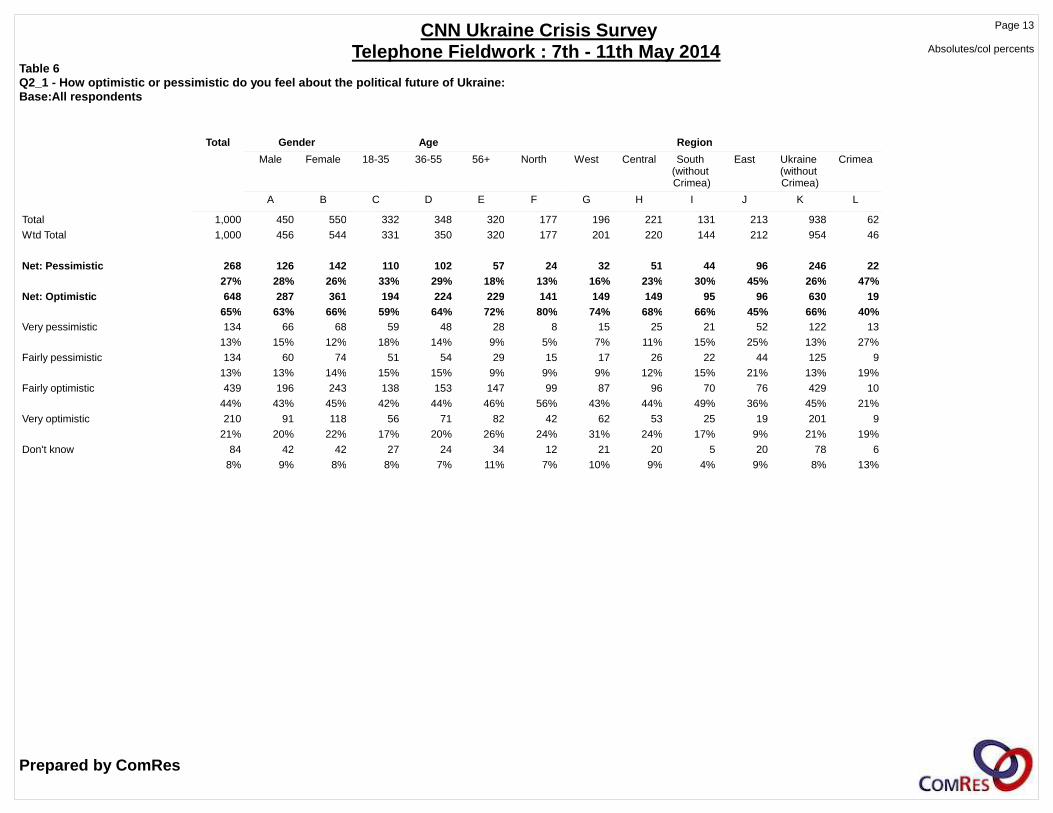
Table 6 Q2_1 - How optimisti c or pes simi stic do you feel about the politic al future of Ukraine:Base:All res pondents
CNN Ukraine Cris is Surv ey Telephone Fieldw ork : 7th - 11th May 2014
Page 13
Absolutes/col percents
Prepared by ComRes
Total Gender Age Region
Male Female 18-35 36-55 56+ North West Central South (without Crimea)
East Ukraine (without Crimea)
Crimea
A B C D E F G H I J K L
Total 1,000 450 550 332 348 320 177 196 221 131 213 938 62
Wtd Total 1,000 456 544 331 350 320 177 201 220 144 212 954 46
Net: Pess imistic 268 126 142 110 102 57 24 32 51 44 96 246 2227% 28% 26% 33% 29% 18% 13% 16% 23% 30% 45% 26% 47%
Net: Optimisti c 648 287 361 194 224 229 141 149 149 95 96 630 1965% 63% 66% 59% 64% 72% 80% 74% 68% 66% 45% 66% 40%
Very pessimistic 134 66 68 59 48 28 8 15 25 21 52 122 13
13% 15% 12% 18% 14% 9% 5% 7% 11% 15% 25% 13% 27%
Fairly pessimistic 134 60 74 51 54 29 15 17 26 22 44 125 9
13% 13% 14% 15% 15% 9% 9% 9% 12% 15% 21% 13% 19%
Fairly optimistic 439 196 243 138 153 147 99 87 96 70 76 429 10
44% 43% 45% 42% 44% 46% 56% 43% 44% 49% 36% 45% 21%
Very optimistic 210 91 118 56 71 82 42 62 53 25 19 201 9
21% 20% 22% 17% 20% 26% 24% 31% 24% 17% 9% 21% 19%
Don't know 84 42 42 27 24 34 12 21 20 5 20 78 6
8% 9% 8% 8% 7% 11% 7% 10% 9% 4% 9% 8% 13%

Table 6 Cont'dQ2_1 - How optimisti c or pes simi stic do you feel about the politic al future of Ukraine:Base:All res pondents
CNN Ukraine Cris is Surv ey Telephone Fieldw ork : 7th - 11th May 2014
Page 14
Absolutes/col percents
Prepared by ComRes
Total Language Sense of loyalty (Eur vs Russia) Sense of loyalty (Russia vs Ukra ine)
Ukrainian Russian Both equally
Other Europe Russia Neither Don't know
Russia Ukraine Neither Don't know
M N O P Q R S T U V W X
Total 1,000 459 406 114 21 555 201 215 29 135 797 51 17
Wtd Total 1,000 465 398 114 23 563 191 217 29 123 806 53 17
Net: Pess imistic 268 72 156 33 7 87 106 71 4 79 156 31 227% 15% 39% 29% 31% 15% 55% 33% 14% 64% 19% 57% 14%
Net: Optimisti c 648 349 209 75 16 438 65 127 19 31 586 20 1165% 75% 52% 66% 69% 78% 34% 58% 65% 25% 73% 38% 63%
Very pessimistic 134 30 82 18 4 35 66 31 2 54 64 15 1
13% 6% 21% 16% 18% 6% 35% 14% 7% 44% 8% 27% 8%
Fairly pessimistic 134 42 74 15 3 52 39 41 2 24 92 16 1
13% 9% 18% 13% 13% 9% 21% 19% 7% 20% 11% 30% 7%
Fairly optimistic 439 223 152 53 10 298 44 87 9 22 397 14 5
44% 48% 38% 47% 44% 53% 23% 40% 32% 18% 49% 26% 30%
Very optimistic 210 126 56 22 6 140 21 39 10 9 189 6 6
21% 27% 14% 19% 25% 25% 11% 18% 33% 7% 23% 12% 33%
Don't know 84 45 34 5 - 38 21 19 6 14 64 2 4
8% 10% 9% 5% - 7% 11% 9% 21% 11% 8% 5% 23%

Table 7 Q2_2 - How optimisti c or pes simi stic do you feel about the econo mic future of Ukraine:Base:All res pondents
CNN Ukraine Cris is Surv ey Telephone Fieldw ork : 7th - 11th May 2014
Page 15
Absolutes/col percents
Prepared by ComRes
Total Gender Age Region
Male Female 18-35 36-55 56+ North West Central South (without Crimea)
East Ukraine (without Crimea)
Crimea
A B C D E F G H I J K L
Total 1,000 450 550 332 348 320 177 196 221 131 213 938 62
Wtd Total 1,000 456 544 331 350 320 177 201 220 144 212 954 46
Net: Pess imistic 283 136 147 114 102 67 35 23 52 48 103 260 2228% 30% 27% 34% 29% 21% 20% 11% 24% 33% 48% 27% 48%
Net: Optimisti c 665 292 373 206 233 225 134 164 156 88 102 645 2067% 64% 69% 62% 67% 70% 76% 82% 71% 61% 48% 68% 44%
Very pessimistic 126 65 61 55 42 29 15 9 16 19 55 114 12
13% 14% 11% 17% 12% 9% 9% 5% 7% 13% 26% 12% 26%
Fairly pessimistic 157 71 86 59 60 38 20 13 36 29 48 147 10
16% 16% 16% 18% 17% 12% 11% 7% 17% 20% 23% 15% 23%
Fairly optimistic 470 209 260 156 164 150 93 111 110 61 83 457 13
47% 46% 48% 47% 47% 47% 52% 55% 50% 42% 39% 48% 27%
Very optimistic 195 83 113 51 69 76 41 54 46 27 20 188 7
20% 18% 21% 15% 20% 24% 23% 27% 21% 19% 9% 20% 16%
Don't know 52 28 25 11 14 28 8 14 12 8 7 49 4
5% 6% 5% 3% 4% 9% 4% 7% 5% 6% 3% 5% 8%

Table 7 Cont'dQ2_2 - How optimisti c or pes simi stic do you feel about the econo mic future of Ukraine:Base:All res pondents
CNN Ukraine Cris is Surv ey Telephone Fieldw ork : 7th - 11th May 2014
Page 16
Absolutes/col percents
Prepared by ComRes
Total Language Sense of loyalty (Eur vs Russia) Sense of loyalty (Russia vs Ukra ine)
Ukrainian Russian Both equally
Other Europe Russia Neither Don't know
Russia Ukraine Neither Don't know
M N O P Q R S T U V W X
Total 1,000 459 406 114 21 555 201 215 29 135 797 51 17
Wtd Total 1,000 465 398 114 23 563 191 217 29 123 806 53 17
Net: Pess imistic 283 77 168 31 7 87 115 77 4 91 160 30 228% 17% 42% 27% 31% 15% 60% 35% 14% 74% 20% 55% 11%
Net: Optimisti c 665 362 211 76 16 447 68 126 24 27 606 18 1467% 78% 53% 67% 69% 80% 36% 58% 81% 22% 75% 34% 84%
Very pessimistic 126 19 89 15 4 29 66 30 1 58 51 15 2
13% 4% 22% 13% 16% 5% 34% 14% 4% 47% 6% 28% 11%
Fairly pessimistic 157 59 79 16 4 58 49 47 3 33 109 14 -
16% 13% 20% 14% 16% 10% 26% 22% 10% 27% 14% 27% -
Fairly optimistic 470 243 161 58 9 319 46 92 12 21 428 13 7
47% 52% 40% 51% 38% 57% 24% 43% 42% 17% 53% 24% 43%
Very optimistic 195 119 51 19 7 128 23 33 11 5 178 5 7
20% 26% 13% 16% 30% 23% 12% 15% 39% 4% 22% 10% 41%
Don't know 52 26 19 7 - 28 8 15 1 6 40 6 1
5% 6% 5% 6% - 5% 4% 7% 5% 5% 5% 10% 5%

Table 8 Q2_3 - How optimisti c or pes simi stic do you feel about the futur e for y ou and your fami ly:Base:All res pondents
CNN Ukraine Cris is Surv ey Telephone Fieldw ork : 7th - 11th May 2014
Page 17
Absolutes/col percents
Prepared by ComRes
Total Gender Age Region
Male Female 18-35 36-55 56+ North West Central South (without Crimea)
East Ukraine (without Crimea)
Crimea
A B C D E F G H I J K L
Total 1,000 450 550 332 348 320 177 196 221 131 213 938 62
Wtd Total 1,000 456 544 331 350 320 177 201 220 144 212 954 46
Net: Pess imistic 127 57 70 38 49 40 14 10 22 29 51 126 113% 13% 13% 12% 14% 12% 8% 5% 10% 20% 24% 13% 3%
Net: Optimisti c 825 374 451 284 284 256 154 180 191 111 147 783 4282% 82% 83% 86% 81% 80% 87% 90% 87% 77% 69% 82% 90%
Very pessimistic 50 23 27 16 21 13 6 6 7 11 19 49 1
5% 5% 5% 5% 6% 4% 4% 3% 3% 8% 9% 5% 2%
Fairly pessimistic 78 35 43 22 28 27 8 4 16 17 31 77 1
8% 8% 8% 7% 8% 8% 5% 2% 7% 12% 15% 8% 2%
Fairly optimistic 518 234 284 156 194 167 102 111 112 75 99 499 19
52% 51% 52% 47% 55% 52% 58% 55% 51% 52% 47% 52% 40%
Very optimistic 307 140 167 127 91 89 52 70 79 36 48 284 23
31% 31% 31% 39% 26% 28% 29% 35% 36% 25% 22% 30% 50%
Don't know 48 25 23 8 16 24 8 11 7 4 15 45 3
5% 5% 4% 2% 4% 7% 5% 5% 3% 3% 7% 5% 6%

Table 8 Cont'dQ2_3 - How optimisti c or pes simi stic do you feel about the futur e for y ou and your fami ly:Base:All res pondents
CNN Ukraine Cris is Surv ey Telephone Fieldw ork : 7th - 11th May 2014
Page 18
Absolutes/col percents
Prepared by ComRes
Total Language Sense of loyalty (Eur vs Russia) Sense of loyalty (Russia vs Ukra ine)
Ukrainian Russian Both equally
Other Europe Russia Neither Don't know
Russia Ukraine Neither Don't know
M N O P Q R S T U V W X
Total 1,000 459 406 114 21 555 201 215 29 135 797 51 17
Wtd Total 1,000 465 398 114 23 563 191 217 29 123 806 53 17
Net: Pess imistic 127 34 75 18 - 39 48 37 4 28 73 20 613% 7% 19% 16% - 7% 25% 17% 13% 23% 9% 37% 36%
Net: Optimisti c 825 409 303 90 23 501 132 170 23 88 695 32 1082% 88% 76% 79% 100% 89% 69% 78% 77% 71% 86% 60% 58%
Very pessimistic 50 9 30 10 - 14 20 12 4 14 26 7 3
5% 2% 8% 9% - 2% 10% 6% 13% 12% 3% 12% 19%
Fairly pessimistic 78 25 45 7 - 25 28 25 - 14 48 13 3
8% 5% 11% 6% - 4% 14% 11% - 11% 6% 24% 17%
Fairly optimistic 518 251 192 62 13 333 80 94 12 53 442 17 5
52% 54% 48% 55% 56% 59% 42% 43% 40% 43% 55% 33% 30%
Very optimistic 307 158 111 28 10 168 52 76 11 35 253 15 5
31% 34% 28% 24% 44% 30% 27% 35% 37% 28% 31% 27% 28%
Don't know 48 22 20 6 - 23 12 11 3 7 38 2 1
5% 5% 5% 5% - 4% 6% 5% 10% 6% 5% 3% 5%

Table 9 Q3_1 - Which o f the foll ow ing outco mes to the c urrent situatio n in Ukraine do y ou think would be bes t for you and your family :Base:All res pondents
CNN Ukraine Cris is Surv ey Telephone Fieldw ork : 7th - 11th May 2014
Page 19
Absolutes/col percents
Prepared by ComRes
Total Gender Age Region
Male Female 18-35 36-55 56+ North West Central South (without Crimea)
East Ukraine (without Crimea)
Crimea
A B C D E F G H I J K L
Total 1,000 450 550 332 348 320 177 196 221 131 213 938 62
Wtd Total 1,000 456 544 331 350 320 177 201 220 144 212 954 46
Ukraine joining the European Union
471 240 230 135 176 160 123 153 122 41 26 465 6
47% 53% 42% 41% 50% 50% 70% 76% 55% 28% 12% 49% 13%
Ukraine forming an allegiance with Russia
161 66 94 62 42 57 1 2 15 24 86 129 32
16% 15% 17% 19% 12% 18% 1% 1% 7% 17% 41% 13% 69%
Ukraine not aligning with either Russia or the European Unio
369 149 220 134 132 103 53 45 83 79 101 360 8
37% 33% 40% 40% 38% 32% 30% 23% 38% 55% 47% 38% 18%

Table 9 Cont'dQ3_1 - Which o f the foll ow ing outco mes to the c urrent situatio n in Ukraine do y ou think would be bes t for you and your family :Base:All res pondents
CNN Ukraine Cris is Surv ey Telephone Fieldw ork : 7th - 11th May 2014
Page 20
Absolutes/col percents
Prepared by ComRes
Total Language Sense of loyalty (Eur vs Russia) Sense of loyalty (Russia vs Ukra ine)
Ukrainian Russian Both equally
Other Europe Russia Neither Don't know
Russia Ukraine Neither Don't know
M N O P Q R S T U V W X
Total 1,000 459 406 114 21 555 201 215 29 135 797 51 17
Wtd Total 1,000 465 398 114 23 563 191 217 29 123 806 53 17
Ukraine joining the European Union
471 309 105 49 8 423 2 39 7 - 460 7 4
47% 66% 26% 43% 33% 75% 1% 18% 24% - 57% 13% 24%
Ukraine forming an allegiance with Russia
161 10 135 15 1 5 125 29 1 93 51 12 6
16% 2% 34% 13% 3% 1% 65% 13% 4% 75% 6% 22% 32%
Ukraine not aligning with either Russia or the European Unio
369 146 158 49 15 135 64 149 21 30 296 35 7
37% 31% 40% 43% 63% 24% 33% 69% 72% 25% 37% 65% 43%

Table 10 Q3_2 - Which o f the foll ow ing outco mes to the c urrent situatio n in Ukraine do y ou think would be bes t for Ukraine as a whole:Base:All res pondents
CNN Ukraine Cris is Surv ey Telephone Fieldw ork : 7th - 11th May 2014
Page 21
Absolutes/col percents
Prepared by ComRes
Total Gender Age Region
Male Female 18-35 36-55 56+ North West Central South (without Crimea)
East Ukraine (without Crimea)
Crimea
A B C D E F G H I J K L
Total 1,000 450 550 332 348 320 177 196 221 131 213 938 62
Wtd Total 1,000 456 544 331 350 320 177 201 220 144 212 954 46
Ukraine joining the European Union
459 227 232 129 168 162 118 147 115 43 30 454 5
46% 50% 43% 39% 48% 51% 66% 73% 52% 30% 14% 48% 11%
Ukraine forming an allegiance with Russia
151 62 90 60 39 53 1 2 16 26 78 124 27
15% 14% 16% 18% 11% 16% 1% 1% 7% 18% 37% 13% 60%
Ukraine not aligning with either Russia or the European Unio
389 166 223 142 142 105 58 51 88 74 103 376 13
39% 37% 41% 43% 41% 33% 33% 26% 40% 52% 49% 39% 29%

Table 10 Cont'dQ3_2 - Which o f the foll ow ing outco mes to the c urrent situatio n in Ukraine do y ou think would be bes t for Ukraine as a whole:Base:All res pondents
CNN Ukraine Cris is Surv ey Telephone Fieldw ork : 7th - 11th May 2014
Page 22
Absolutes/col percents
Prepared by ComRes
Total Language Sense of loyalty (Eur vs Russia) Sense of loyalty (Russia vs Ukra ine)
Ukrainian Russian Both equally
Other Europe Russia Neither Don't know
Russia Ukraine Neither Don't know
M N O P Q R S T U V W X
Total 1,000 459 406 114 21 555 201 215 29 135 797 51 17
Wtd Total 1,000 465 398 114 23 563 191 217 29 123 806 53 17
Ukraine joining the European Union
459 304 102 46 8 412 3 38 6 2 446 10 2
46% 65% 26% 41% 33% 73% 2% 17% 20% 2% 55% 18% 13%
Ukraine forming an allegiance with Russia
151 9 125 16 1 6 120 25 1 84 52 10 5
15% 2% 31% 14% 6% 1% 63% 11% 4% 68% 6% 18% 31%
Ukraine not aligning with either Russia or the European Unio
389 152 172 52 14 144 68 155 22 37 308 34 10
39% 33% 43% 45% 61% 26% 36% 71% 76% 30% 38% 64% 56%

Table 11 Q4 Some countries , suc h as the USA and m embers of the Europe an Union, have enforced econo mic s ancti ons ag ainst Russia. To what extent do you approve ordisapprove of these sanctions?Base:All res pondents
CNN Ukraine Crisi s Surv ey
Telephone Fieldw ork : 7th - 11th May 2014
Page 23
Absolutes/col percents
Prepared by ComRes
Total Gender Age Region
Male Female 18-35 36-55 56+ North West Central South (without Crimea)
East Ukraine (without Crimea)
Crimea
A B C D E F G H I J K L
Total 1,000 450 550 332 348 320 177 196 221 131 213 938 62
Wtd Total 1,000 456 544 331 350 320 177 201 220 144 212 954 46
Net: Approve 672 321 352 213 249 210 156 182 173 90 63 664 867% 70% 65% 64% 71% 66% 88% 91% 78% 62% 30% 70% 18%
Net: Disap prove 289 123 166 107 83 100 15 17 36 49 135 251 3829% 27% 31% 32% 24% 31% 9% 8% 16% 34% 64% 26% 82%
Strongly approve 537 272 265 166 190 181 128 158 140 66 38 530 7
54% 60% 49% 50% 54% 56% 72% 79% 63% 46% 18% 56% 15%
Tend to approve 135 48 87 47 59 29 28 24 33 24 25 134 1
14% 11% 16% 14% 17% 9% 16% 12% 15% 16% 12% 14% 3%
Tend to disapprove 83 33 49 45 21 17 2 8 13 14 38 75 7
8% 7% 9% 13% 6% 5% 1% 4% 6% 10% 18% 8% 16%
Strongly disapprove 206 89 117 62 62 83 13 8 23 35 97 176 30
21% 20% 21% 19% 18% 26% 7% 4% 10% 24% 46% 18% 66%
Don't know 39 12 26 11 17 10 6 2 12 6 14 39 -
4% 3% 5% 3% 5% 3% 3% 1% 5% 4% 6% 4% -

Table 11 Cont'dQ4 Some countries , suc h as the USA and m embers of the Europe an Union, have enforced econo mic s ancti ons ag ainst Russia. To what extent do you approve or disapprove of these sanctions?Base:All res pondents
CNN Ukraine Crisi s Surv ey
Telephone Fieldw ork : 7th - 11th May 2014
Page 24
Absolutes/col percents
Prepared by ComRes
Total Language Sense of loyalty (Eur vs Russia) Sense of loyalty (Russia vs Ukra ine)
Ukrainian Russian Both equally
Other Europe Russia Neither Don't know
Russia Ukraine Neither Don't know
M N O P Q R S T U V W X
Total 1,000 459 406 114 21 555 201 215 29 135 797 51 17
Wtd Total 1,000 465 398 114 23 563 191 217 29 123 806 53 17
Net: Approve 672 399 178 79 16 516 19 121 16 11 634 21 567% 86% 45% 69% 69% 92% 10% 56% 54% 9% 79% 40% 32%
Net: Disap prove 289 50 204 29 6 37 167 74 11 110 143 27 1029% 11% 51% 26% 25% 7% 87% 34% 39% 89% 18% 50% 56%
Strongly approve 537 335 129 60 13 441 9 78 8 5 515 13 4
54% 72% 32% 53% 56% 78% 5% 36% 27% 4% 64% 25% 25%
Tend to approve 135 64 49 19 3 75 10 42 8 7 119 8 1
14% 14% 12% 17% 13% 13% 5% 20% 27% 6% 15% 16% 6%
Tend to disapprove 83 19 52 9 3 14 31 32 7 14 58 8 2
8% 4% 13% 8% 11% 2% 16% 15% 23% 12% 7% 16% 12%
Strongly disapprove 206 31 152 21 3 23 136 42 5 95 85 18 8
21% 7% 38% 18% 14% 4% 71% 19% 16% 77% 11% 34% 45%
Don't know 39 16 16 5 1 9 5 23 2 2 29 5 2
4% 3% 4% 5% 6% 2% 3% 10% 7% 2% 4% 10% 12%

Table 12 Q5 Do you think that each of the following w ould be good or bad for Ukraine : Economi c sanctions against Russ ia:Base:All res pondents
CNN Ukraine Crisi s Surv ey Telephone Fieldw ork : 7th - 11th May 2014
Page 25
Absolutes/col percents
Prepared by ComRes
Total Gender Age Region
Male Female 18-35 36-55 56+ North West Central South (without Crimea)
East Ukraine (without Crimea)
Crimea
A B C D E F G H I J K L
Total 1,000 450 550 332 348 320 177 196 221 131 213 938 62
Wtd Total 1,000 456 544 331 350 320 177 201 220 144 212 954 46
Good 344 170 174 96 134 114 79 97 82 48 32 338 6
34% 37% 32% 29% 38% 36% 44% 48% 37% 33% 15% 35% 13%
Bad 290 122 169 100 91 99 30 32 58 49 102 271 19
29% 27% 31% 30% 26% 31% 17% 16% 26% 34% 48% 28% 42%
Neither 297 137 160 114 102 81 54 59 65 42 57 278 19
30% 30% 29% 34% 29% 25% 31% 29% 29% 29% 27% 29% 42%
Don't know 69 26 42 20 23 25 14 12 15 5 20 67 1
7% 6% 8% 6% 7% 8% 8% 6% 7% 3% 10% 7% 3%
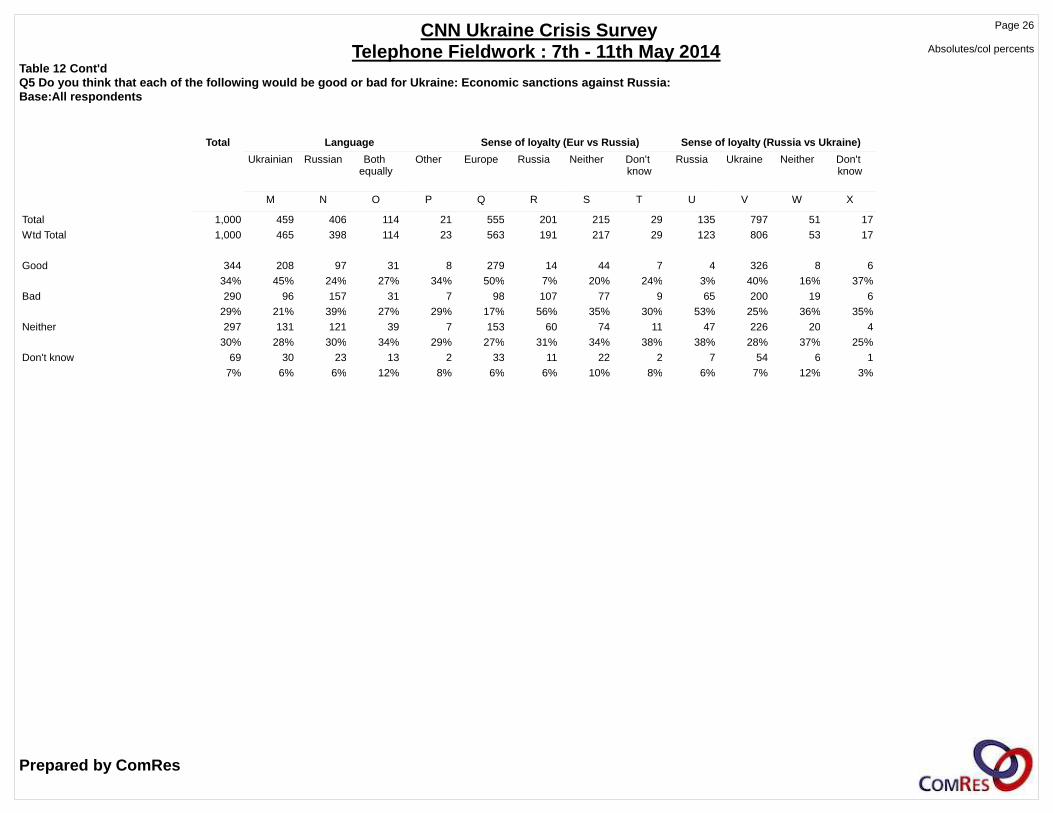
Table 12 Cont'dQ5 Do you think that each of the following w ould be good or bad for Ukraine: Economi c sanctions against Russ ia:Base:All res pondents
CNN Ukraine Crisi s Surv ey Telephone Fieldw ork : 7th - 11th May 2014
Page 26
Absolutes/col percents
Prepared by ComRes
Total Language Sense of loyalty (Eur vs Russia) Sense of loyalty (Russia vs Ukra ine)
Ukrainian Russian Both equally
Other Europe Russia Neither Don't know
Russia Ukraine Neither Don't know
M N O P Q R S T U V W X
Total 1,000 459 406 114 21 555 201 215 29 135 797 51 17
Wtd Total 1,000 465 398 114 23 563 191 217 29 123 806 53 17
Good 344 208 97 31 8 279 14 44 7 4 326 8 6
34% 45% 24% 27% 34% 50% 7% 20% 24% 3% 40% 16% 37%
Bad 290 96 157 31 7 98 107 77 9 65 200 19 6
29% 21% 39% 27% 29% 17% 56% 35% 30% 53% 25% 36% 35%
Neither 297 131 121 39 7 153 60 74 11 47 226 20 4
30% 28% 30% 34% 29% 27% 31% 34% 38% 38% 28% 37% 25%
Don't know 69 30 23 13 2 33 11 22 2 7 54 6 1
7% 6% 6% 12% 8% 6% 6% 10% 8% 6% 7% 12% 3%
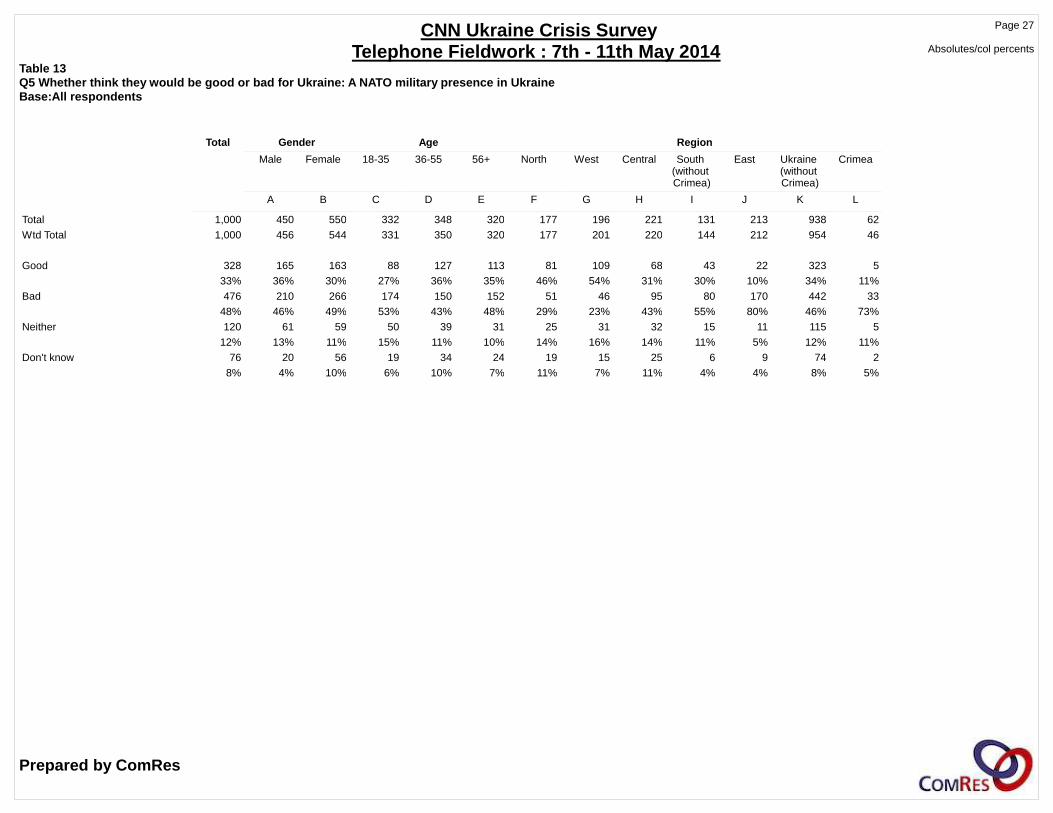
Table 13 Q5 Whethe r think the y woul d be go od or bad for Ukrai ne: A NATO mili tary pres ence in UkraineBase:All res pondents
CNN Ukraine Cris is Surv ey Telephone Fieldw ork : 7th - 11th May 2014
Page 27
Absolutes/col percents
Prepared by ComRes
Total Gender Age Region
Male Female 18-35 36-55 56+ North West Central South (without Crimea)
East Ukraine (without Crimea)
Crimea
A B C D E F G H I J K L
Total 1,000 450 550 332 348 320 177 196 221 131 213 938 62
Wtd Total 1,000 456 544 331 350 320 177 201 220 144 212 954 46
Good 328 165 163 88 127 113 81 109 68 43 22 323 5
33% 36% 30% 27% 36% 35% 46% 54% 31% 30% 10% 34% 11%
Bad 476 210 266 174 150 152 51 46 95 80 170 442 33
48% 46% 49% 53% 43% 48% 29% 23% 43% 55% 80% 46% 73%
Neither 120 61 59 50 39 31 25 31 32 15 11 115 5
12% 13% 11% 15% 11% 10% 14% 16% 14% 11% 5% 12% 11%
Don't know 76 20 56 19 34 24 19 15 25 6 9 74 2
8% 4% 10% 6% 10% 7% 11% 7% 11% 4% 4% 8% 5%

Table 13 Cont'dQ5 Whethe r think the y woul d be go od or bad for Ukrai ne: A NATO mili tary pres ence in UkraineBase:All res pondents
CNN Ukraine Cris is Surv ey Telephone Fieldw ork : 7th - 11th May 2014
Page 28
Absolutes/col percents
Prepared by ComRes
Total Language Sense of loyalty (Eur vs Russia) Sense of loyalty (Russia vs Ukra ine)
Ukrainian Russian Both equally
Other Europe Russia Neither Don't know
Russia Ukraine Neither Don't know
M N O P Q R S T U V W X
Total 1,000 459 406 114 21 555 201 215 29 135 797 51 17
Wtd Total 1,000 465 398 114 23 563 191 217 29 123 806 53 17
Good 328 208 78 36 6 291 6 26 5 3 316 6 3
33% 45% 20% 32% 26% 52% 3% 12% 18% 3% 39% 11% 19%
Bad 476 141 268 56 11 143 174 143 16 112 313 39 12
48% 30% 67% 49% 46% 25% 91% 66% 54% 91% 39% 72% 71%
Neither 120 67 37 11 4 75 8 37 1 6 106 7 1
12% 14% 9% 10% 18% 13% 4% 17% 4% 5% 13% 12% 7%
Don't know 76 49 15 10 2 53 3 12 7 2 71 3 1
8% 11% 4% 9% 10% 9% 2% 6% 25% 2% 9% 5% 3%

Table 14 Q5 Do you think that each of the following w ould be good or bad for Ukraine: A Russ ian mi litary presenc e in UkraineBase:All res pondents
CNN Ukraine Crisi s Surv ey Telephone Fieldw ork : 7th - 11th May 2014
Page 29
Absolutes/col percents
Prepared by ComRes
Total Gender Age Region
Male Female 18-35 36-55 56+ North West Central South (without Crimea)
East Ukraine (without Crimea)
Crimea
A B C D E F G H I J K L
Total 1,000 450 550 332 348 320 177 196 221 131 213 938 62
Wtd Total 1,000 456 544 331 350 320 177 201 220 144 212 954 46
Good 74 25 49 35 20 19 1 2 6 10 39 58 16
7% 6% 9% 10% 6% 6% 1% 1% 3% 7% 18% 6% 34%
Bad 820 386 434 257 305 258 171 193 198 115 129 806 14
82% 85% 80% 78% 87% 81% 96% 96% 90% 80% 61% 84% 31%
Neither 80 36 44 25 22 33 5 5 10 14 35 69 11
8% 8% 8% 7% 6% 10% 3% 3% 4% 9% 17% 7% 24%
Don't know 26 9 17 14 3 9 - 1 6 6 9 21 5
3% 2% 3% 4% 1% 3% - 0% 3% 4% 4% 2% 11%

Table 14 Cont'dQ5 Whethe r think the y woul d be go od or bad for Ukrai ne: A Russ ian m ilitary prese nce i n UkraineBase:All res pondents
CNN Ukraine Cris is Surv ey Telephone Fieldw ork : 7th - 11th May 2014
Page 30
Absolutes/col percents
Prepared by ComRes
Total Language Sense of loyalty (Eur vs Russia) Sense of loyalty (Russia vs Ukra ine)
Ukrainian Russian Both equally
Other Europe Russia Neither Don't know
Russia Ukraine Neither Don't know
M N O P Q R S T U V W X
Total 1,000 459 406 114 21 555 201 215 29 135 797 51 17
Wtd Total 1,000 465 398 114 23 563 191 217 29 123 806 53 17
Good 74 6 60 6 1 5 61 5 2 52 17 4 1
7% 1% 15% 6% 3% 1% 32% 2% 7% 42% 2% 8% 7%
Bad 820 442 267 90 21 537 67 192 24 32 738 40 11
82% 95% 67% 79% 89% 95% 35% 88% 83% 26% 91% 74% 65%
Neither 80 14 52 12 2 19 47 13 1 28 42 7 3
8% 3% 13% 10% 8% 3% 25% 6% 3% 23% 5% 14% 15%
Don't know 26 3 18 6 - 1 16 7 2 11 10 2 2
3% 1% 5% 5% - 0% 8% 3% 7% 9% 1% 4% 13%

Table 15 Q5 Whethe r think the y woul d be go od or bad for Ukrai ne: A Unite d Nations or internationa l coa lition p resenc e in Ukrai neBase:All res pondents
CNN Ukraine Cris is Surv ey Telephone Fieldw ork : 7th - 11th May 2014
Page 31
Absolutes/col percents
Prepared by ComRes
Total Gender Age Region
Male Female 18-35 36-55 56+ North West Central South (without Crimea)
East Ukraine (without Crimea)
Crimea
A B C D E F G H I J K L
Total 1,000 450 550 332 348 320 177 196 221 131 213 938 62
Wtd Total 1,000 456 544 331 350 320 177 201 220 144 212 954 46
Good 409 207 202 106 159 144 96 106 99 51 48 400 9
41% 45% 37% 32% 45% 45% 54% 53% 45% 35% 22% 42% 19%
Bad 326 140 186 126 101 99 31 31 58 57 121 298 27
33% 31% 34% 38% 29% 31% 17% 16% 26% 40% 57% 31% 60%
Neither 165 83 82 64 61 39 37 40 33 22 27 159 5
16% 18% 15% 19% 18% 12% 21% 20% 15% 15% 13% 17% 11%
Don't know 101 26 75 35 29 37 13 23 30 14 16 97 4
10% 6% 14% 11% 8% 12% 7% 12% 13% 10% 8% 10% 10%

Table 15 Cont'dQ5 Whethe r think the y woul d be go od or bad for Ukrai ne: A Unite d Nations or internationa l coa lition p resenc e in Ukrai neBase:All res pondents
CNN Ukraine Cris is Surv ey Telephone Fieldw ork : 7th - 11th May 2014
Page 32
Absolutes/col percents
Prepared by ComRes
Total Language Sense of loyalty (Eur vs Russia) Sense of loyalty (Russia vs Ukra ine)
Ukrainian Russian Both equally
Other Europe Russia Neither Don't know
Russia Ukraine Neither Don't know
M N O P Q R S T U V W X
Total 1,000 459 406 114 21 555 201 215 29 135 797 51 17
Wtd Total 1,000 465 398 114 23 563 191 217 29 123 806 53 17
Good 409 238 117 43 10 334 16 48 11 14 379 12 3
41% 51% 29% 38% 45% 59% 8% 22% 37% 11% 47% 23% 19%
Bad 326 84 202 35 6 82 129 105 9 84 202 30 10
33% 18% 51% 30% 24% 15% 68% 48% 31% 68% 25% 56% 57%
Neither 165 91 51 20 3 92 28 39 6 18 138 6 2
16% 20% 13% 17% 15% 16% 15% 18% 20% 15% 17% 10% 14%
Don't know 101 53 29 16 4 54 18 25 4 7 87 5 2
10% 11% 7% 14% 16% 10% 10% 12% 12% 6% 11% 10% 10%

Table 16 Q5 Whethe r think the y woul d be go od or bad for Ukrai ne: Ukraine joining the Europea n UnionBase:All res pondents
CNN Ukraine Cris is Surv ey Telephone Fieldw ork : 7th - 11th May 2014
Page 33
Absolutes/col percents
Prepared by ComRes
Total Gender Age Region
Male Female 18-35 36-55 56+ North West Central South (without Crimea)
East Ukraine (without Crimea)
Crimea
A B C D E F G H I J K L
Total 1,000 450 550 332 348 320 177 196 221 131 213 938 62
Wtd Total 1,000 456 544 331 350 320 177 201 220 144 212 954 46
Good 538 261 277 158 203 177 126 163 142 60 40 531 7
54% 57% 51% 48% 58% 55% 71% 81% 64% 41% 19% 56% 15%
Bad 306 123 184 128 86 92 11 17 47 64 139 277 30
31% 27% 34% 39% 25% 29% 6% 8% 21% 44% 66% 29% 65%
Neither 110 58 52 36 39 36 27 16 23 16 22 104 6
11% 13% 10% 11% 11% 11% 15% 8% 10% 11% 11% 11% 13%
Don't know 46 14 32 9 22 15 13 5 9 5 10 42 4
5% 3% 6% 3% 6% 5% 7% 3% 4% 3% 5% 4% 8%

Table 16 Cont'dQ5 Do you think that each of the following w ould be good or bad for Ukraine: U kraine j oining the European UnionBase:All res pondents
CNN Ukraine Crisi s Surv ey Telephone Fieldw ork : 7th - 11th May 2014
Page 34
Absolutes/col percents
Prepared by ComRes
Total Language Sense of loyalty (Eur vs Russia) Sense of loyalty (Russia vs Ukra ine)
Ukrainian Russian Both equally
Other Europe Russia Neither Don't know
Russia Ukraine Neither Don't know
M N O P Q R S T U V W X
Total 1,000 459 406 114 21 555 201 215 29 135 797 51 17
Wtd Total 1,000 465 398 114 23 563 191 217 29 123 806 53 17
Good 538 344 130 54 10 460 9 56 13 6 514 13 5
54% 74% 33% 47% 43% 82% 5% 26% 44% 5% 64% 25% 30%
Bad 306 47 209 40 10 38 154 107 7 101 167 30 9
31% 10% 53% 35% 45% 7% 80% 49% 26% 82% 21% 56% 50%
Neither 110 53 41 13 3 50 18 38 4 10 91 7 2
11% 11% 10% 12% 12% 9% 9% 17% 15% 8% 11% 13% 12%
Don't know 46 21 18 7 - 15 11 16 5 6 35 3 2
5% 4% 5% 6% - 3% 6% 7% 16% 5% 4% 6% 9%

Table 17 Q5 Whethe r think the y woul d be go od or bad for Ukrai ne: Ukraine hav ing a formal allegianc e with Russ iaBase:All res pondents
CNN Ukraine Cris is Surv ey Telephone Fieldw ork : 7th - 11th May 2014
Page 35
Absolutes/col percents
Prepared by ComRes
Total Gender Age Region
Male Female 18-35 36-55 56+ North West Central South (without Crimea)
East Ukraine (without Crimea)
Crimea
A B C D E F G H I J K L
Total 1,000 450 550 332 348 320 177 196 221 131 213 938 62
Wtd Total 1,000 456 544 331 350 320 177 201 220 144 212 954 46
Good 307 130 177 101 96 110 23 28 49 55 120 275 32
31% 28% 32% 30% 27% 34% 13% 14% 22% 38% 56% 29% 69%
Bad 387 186 202 135 137 116 90 116 100 48 29 383 4
39% 41% 37% 41% 39% 36% 51% 58% 45% 33% 14% 40% 10%
Neither 205 108 97 71 80 54 44 36 49 28 41 198 7
20% 24% 18% 21% 23% 17% 25% 18% 22% 20% 19% 21% 15%
Don't know 102 33 69 24 37 40 20 20 22 13 23 99 3
10% 7% 13% 7% 11% 13% 12% 10% 10% 9% 11% 10% 6%

Table 17 Cont'dQ5 Do you think that each of the following w ould be good or bad for Ukraine: U kraine h aving a formal alleg iance with Russi aBase:All res pondents
CNN Ukraine Crisi s Surv ey Telephone Fieldw ork : 7th - 11th May 2014
Page 36
Absolutes/col percents
Prepared by ComRes
Total Language Sense of loyalty (Eur vs Russia) Sense of loyalty (Russia vs Ukra ine)
Ukrainian Russian Both equally
Other Europe Russia Neither Don't know
Russia Ukraine Neither Don't know
M N O P Q R S T U V W X
Total 1,000 459 406 114 21 555 201 215 29 135 797 51 17
Wtd Total 1,000 465 398 114 23 563 191 217 29 123 806 53 17
Good 307 70 206 26 5 88 147 59 12 97 178 21 10
31% 15% 52% 23% 20% 16% 77% 27% 40% 79% 22% 40% 58%
Bad 387 253 84 39 12 293 11 79 4 3 365 15 4
39% 54% 21% 34% 54% 52% 6% 36% 14% 3% 45% 29% 21%
Neither 205 99 73 29 4 130 22 47 6 16 177 11 -
20% 21% 18% 26% 16% 23% 11% 22% 20% 13% 22% 21% -
Don't know 102 44 36 20 2 52 11 31 8 7 86 5 4
10% 9% 9% 17% 10% 9% 6% 14% 26% 6% 11% 10% 22%

Table 18 Q6 For each of the following, ple ase say whethe r their respons e to the current s ituation i n Ukraine has m ade things b etter , worse , or had n o effec t at al l - European UnionBase:All res pondents
CNN Ukraine Crisi s Surv ey Telephone Fieldw ork : 7th - 11th May 2014
Page 37
Absolutes/col percents
Prepared by ComRes
Total Gender Age Region
Male Female 18-35 36-55 56+ North West Central South (without Crimea)
East Ukraine (without Crimea)
Crimea
A B C D E F G H I J K L
Total 1,000 450 550 332 348 320 177 196 221 131 213 938 62
Wtd Total 1,000 456 544 331 350 320 177 201 220 144 212 954 46
Better 433 207 226 114 166 153 87 138 113 52 34 424 9
43% 45% 41% 34% 47% 48% 49% 69% 51% 36% 16% 44% 19%
No effect at all 270 135 135 106 101 64 67 45 67 35 47 260 10
27% 30% 25% 32% 29% 20% 38% 22% 31% 24% 22% 27% 21%
Worse 246 98 148 101 66 79 12 12 29 51 118 222 24
25% 22% 27% 31% 19% 25% 7% 6% 13% 35% 55% 23% 53%
Don't know 51 15 36 10 17 24 11 6 11 7 14 48 3
5% 3% 7% 3% 5% 8% 6% 3% 5% 5% 7% 5% 6%

Table 18 Cont'dQ6 For each of the following, ple ase say whethe r their respons e to the current s ituation i n Ukraine has m ade things b etter , worse , or had n o effec t at al l - European UnionBase:All res pondents
CNN Ukraine Crisi s Surv ey Telephone Fieldw ork : 7th - 11th May 2014
Page 38
Absolutes/col percents
Prepared by ComRes
Total Language Sense of loyalty (Eur vs Russia) Sense of loyalty (Russia vs Ukra ine)
Ukrainian Russian Both equally
Other Europe Russia Neither Don't know
Russia Ukraine Neither Don't know
M N O P Q R S T U V W X
Total 1,000 459 406 114 21 555 201 215 29 135 797 51 17
Wtd Total 1,000 465 398 114 23 563 191 217 29 123 806 53 17
Better 433 272 111 40 10 360 9 50 14 5 411 9 7
43% 58% 28% 35% 41% 64% 5% 23% 46% 4% 51% 18% 38%
No effect at all 270 137 96 31 7 160 32 70 8 19 231 16 5
27% 29% 24% 27% 28% 28% 17% 32% 29% 15% 29% 29% 26%
Worse 246 39 170 32 5 26 139 75 5 94 124 23 5
25% 8% 43% 28% 20% 5% 73% 35% 18% 76% 15% 43% 27%
Don't know 51 17 21 10 2 17 10 22 2 5 40 5 2
5% 4% 5% 9% 10% 3% 5% 10% 7% 4% 5% 10% 9%

Table 19 Q6 For each of the following, ple ase say whethe r their respons e to the current s ituation i n Ukraine has m ade things b etter , worse , or had n o effec t at al l - USABase:All res pondents
CNN Ukraine Crisi s Surv ey Telephone Fieldw ork : 7th - 11th May 2014
Page 39
Absolutes/col percents
Prepared by ComRes
Total Gender Age Region
Male Female 18-35 36-55 56+ North West Central South (without Crimea)
East Ukraine (without Crimea)
Crimea
A B C D E F G H I J K L
Total 1,000 450 550 332 348 320 177 196 221 131 213 938 62
Wtd Total 1,000 456 544 331 350 320 177 201 220 144 212 954 46
Better 367 186 181 100 126 141 86 124 78 45 29 361 6
37% 41% 33% 30% 36% 44% 49% 62% 35% 31% 13% 38% 13%
No effect at all 267 120 147 105 100 61 60 49 77 37 36 260 7
27% 26% 27% 32% 29% 19% 34% 24% 35% 26% 17% 27% 15%
Worse 308 133 175 113 99 96 21 14 45 57 140 277 31
31% 29% 32% 34% 28% 30% 12% 7% 20% 40% 66% 29% 68%
Don't know 59 17 42 12 25 22 9 14 20 5 8 57 2
6% 4% 8% 4% 7% 7% 5% 7% 9% 3% 4% 6% 5%

Table 19 Cont'dQ6 For each of the following, ple ase say whethe r their respons e to the current s ituation i n Ukraine has m ade things b etter , worse , or had n o effec t at al l - USABase:All res pondents
CNN Ukraine Crisi s Surv ey Telephone Fieldw ork : 7th - 11th May 2014
Page 40
Absolutes/col percents
Prepared by ComRes
Total Language Sense of loyalty (Eur vs Russia) Sense of loyalty (Russia vs Ukra ine)
Ukrainian Russian Both equally
Other Europe Russia Neither Don't know
Russia Ukraine Neither Don't know
M N O P Q R S T U V W X
Total 1,000 459 406 114 21 555 201 215 29 135 797 51 17
Wtd Total 1,000 465 398 114 23 563 191 217 29 123 806 53 17
Better 367 231 95 33 7 320 7 32 8 3 356 4 3
37% 50% 24% 29% 29% 57% 3% 15% 27% 2% 44% 7% 19%
No effect at all 267 147 83 31 5 163 15 80 9 6 242 16 4
27% 32% 21% 27% 22% 29% 8% 37% 32% 5% 30% 29% 23%
Worse 308 56 204 39 9 48 164 89 8 112 162 26 8
31% 12% 51% 34% 39% 9% 86% 41% 26% 91% 20% 49% 49%
Don't know 59 30 15 11 2 32 6 17 5 3 47 8 2
6% 7% 4% 9% 10% 6% 3% 8% 16% 3% 6% 14% 9%

Table 20 Q6 For each of the following, ple ase say whethe r their respons e to the current s ituation i n Ukraine has m ade things b etter , worse , or had n o effec t at al l - UNBase:All res pondents
CNN Ukraine Crisi s Surv ey Telephone Fieldw ork : 7th - 11th May 2014
Page 41
Absolutes/col percents
Prepared by ComRes
Total Gender Age Region
Male Female 18-35 36-55 56+ North West Central South (without Crimea)
East Ukraine (without Crimea)
Crimea
A B C D E F G H I J K L
Total 1,000 450 550 332 348 320 177 196 221 131 213 938 62
Wtd Total 1,000 456 544 331 350 320 177 201 220 144 212 954 46
Better 350 187 163 90 135 126 75 106 82 49 33 345 5
35% 41% 30% 27% 39% 39% 43% 53% 37% 34% 16% 36% 11%
No effect at all 353 181 172 128 135 90 75 66 89 50 58 338 16
35% 40% 32% 39% 38% 28% 42% 33% 41% 35% 27% 35% 34%
Worse 216 67 148 89 54 72 12 9 32 37 104 194 22
22% 15% 27% 27% 15% 23% 7% 5% 14% 26% 49% 20% 47%
Don't know 81 20 61 23 27 32 14 20 18 9 17 77 4
8% 4% 11% 7% 8% 10% 8% 10% 8% 6% 8% 8% 8%

Table 20 Cont'dQ6 For each of the following, ple ase say whethe r their respons e to the current s ituation i n Ukraine has m ade things b etter , worse , or had n o effec t at al l - UNBase:All res pondents
CNN Ukraine Crisi s Surv ey Telephone Fieldw ork : 7th - 11th May 2014
Page 42
Absolutes/col percents
Prepared by ComRes
Total Language Sense of loyalty (Eur vs Russia) Sense of loyalty (Russia vs Ukra ine)
Ukrainian Russian Both equally
Other Europe Russia Neither Don't know
Russia Ukraine Neither Don't know
M N O P Q R S T U V W X
Total 1,000 459 406 114 21 555 201 215 29 135 797 51 17
Wtd Total 1,000 465 398 114 23 563 191 217 29 123 806 53 17
Better 350 207 100 34 9 289 7 43 10 5 332 7 6
35% 45% 25% 30% 37% 51% 4% 20% 36% 4% 41% 13% 33%
No effect at all 353 177 119 47 10 205 49 89 11 31 295 24 4
35% 38% 30% 42% 44% 36% 25% 41% 37% 25% 37% 45% 23%
Worse 216 40 148 26 2 29 120 65 2 80 112 19 4
22% 9% 37% 22% 9% 5% 63% 30% 8% 65% 14% 36% 23%
Don't know 81 41 31 6 2 39 15 21 6 7 67 3 4
8% 9% 8% 6% 10% 7% 8% 9% 19% 6% 8% 6% 22%

Table 21 Q6 For each of the following, ple ase say whethe r their respons e to the current s ituation i n Ukraine has m ade things b etter , worse , or had n o effec t at al l - RussiaBase:All res pondents
CNN Ukraine Crisi s Surv ey Telephone Fieldw ork : 7th - 11th May 2014
Page 43
Absolutes/col percents
Prepared by ComRes
Total Gender Age Region
Male Female 18-35 36-55 56+ North West Central South (without Crimea)
East Ukraine (without Crimea)
Crimea
A B C D E F G H I J K L
Total 1,000 450 550 332 348 320 177 196 221 131 213 938 62
Wtd Total 1,000 456 544 331 350 320 177 201 220 144 212 954 46
Better 76 27 50 32 17 27 1 7 3 7 45 62 14
8% 6% 9% 10% 5% 8% 1% 3% 1% 5% 21% 7% 31%
No effect at all 101 39 62 36 31 34 4 3 14 13 50 83 18
10% 9% 11% 11% 9% 11% 2% 1% 6% 9% 24% 9% 39%
Worse 796 382 414 254 299 243 171 191 200 121 104 786 10
80% 84% 76% 77% 86% 76% 97% 95% 91% 84% 49% 82% 23%
Don't know 26 7 19 8 2 16 1 1 4 3 13 22 4
3% 2% 4% 2% 1% 5% 1% 0% 2% 2% 6% 2% 8%

Table 21 Cont'dQ6 For each of the following, ple ase say whethe r their respons e to the current s ituation i n Ukraine has m ade things b etter , worse , or had n o effec t at al l - RussiaBase:All res pondents
CNN Ukraine Crisi s Surv ey Telephone Fieldw ork : 7th - 11th May 2014
Page 44
Absolutes/col percents
Prepared by ComRes
Total Language Sense of loyalty (Eur vs Russia) Sense of loyalty (Russia vs Ukra ine)
Ukrainian Russian Both equally
Other Europe Russia Neither Don't know
Russia Ukraine Neither Don't know
M N O P Q R S T U V W X
Total 1,000 459 406 114 21 555 201 215 29 135 797 51 17
Wtd Total 1,000 465 398 114 23 563 191 217 29 123 806 53 17
Better 76 6 65 4 2 5 64 7 1 51 21 4 1
8% 1% 16% 3% 9% 1% 33% 3% 3% 41% 3% 7% 6%
No effect at all 101 16 72 11 2 16 65 19 2 47 43 9 3
10% 3% 18% 10% 8% 3% 34% 9% 6% 38% 5% 16% 17%
Worse 796 438 244 95 19 537 50 182 27 18 729 38 12
80% 94% 61% 83% 83% 96% 26% 84% 91% 15% 90% 70% 67%
Don't know 26 5 17 4 - 5 12 9 - 8 13 3 2
3% 1% 4% 4% - 1% 6% 4% - 6% 2% 6% 10%

Table 22 Q6 For each of the following, ple ase say whethe r their respons e to the current s ituation i n Ukraine has m ade things b etter , worse , or had n o effec t at al l - Pro-U krainian leaders in UkraineBase:All res pondents
CNN Ukraine Crisi s Surv ey
Telephone Fieldw ork : 7th - 11th May 2014
Page 45
Absolutes/col percents
Prepared by ComRes
Total Gender Age Region
Male Female 18-35 36-55 56+ North West Central South (without Crimea)
East Ukraine (without Crimea)
Crimea
A B C D E F G H I J K L
Total 1,000 450 550 332 348 320 177 196 221 131 213 938 62
Wtd Total 1,000 456 544 331 350 320 177 201 220 144 212 954 46
Better 319 155 164 90 117 112 73 91 85 38 27 314 5
32% 34% 30% 27% 33% 35% 41% 46% 38% 27% 13% 33% 11%
No effect at all 222 109 113 90 85 47 52 50 52 34 29 217 6
22% 24% 21% 27% 24% 15% 29% 25% 24% 23% 14% 23% 13%
Worse 377 165 212 125 117 134 42 41 64 59 142 347 30
38% 36% 39% 38% 34% 42% 24% 20% 29% 41% 67% 36% 65%
Don't know 82 26 56 25 31 26 11 19 20 13 15 77 5
8% 6% 10% 8% 9% 8% 6% 9% 9% 9% 7% 8% 11%

Table 22 Cont'dQ6 For each of the following, ple ase say whethe r their respons e to the current s ituation i n Ukraine has m ade things b etter , worse , or had n o effec t at al l - Pro-U krainian leaders in UkraineBase:All res pondents
CNN Ukraine Crisi s Surv ey
Telephone Fieldw ork : 7th - 11th May 2014
Page 46
Absolutes/col percents
Prepared by ComRes
Total Language Sense of loyalty (Eur vs Russia) Sense of loyalty (Russia vs Ukra ine)
Ukrainian Russian Both equally
Other Europe Russia Neither Don't know
Russia Ukraine Neither Don't know
M N O P Q R S T U V W X
Total 1,000 459 406 114 21 555 201 215 29 135 797 51 17
Wtd Total 1,000 465 398 114 23 563 191 217 29 123 806 53 17
Better 319 190 86 34 9 260 12 38 9 4 308 5 2
32% 41% 22% 30% 37% 46% 6% 18% 30% 3% 38% 9% 13%
No effect at all 222 128 70 23 2 148 17 51 7 10 197 13 2
22% 28% 18% 20% 8% 26% 9% 23% 23% 8% 24% 25% 10%
Worse 377 108 212 46 10 115 152 102 8 105 235 30 7
38% 23% 53% 41% 44% 20% 79% 47% 26% 85% 29% 57% 38%
Don't know 82 39 30 10 3 39 11 26 6 4 66 5 7
8% 8% 8% 9% 11% 7% 6% 12% 21% 3% 8% 10% 38%

Table 23 Q6 For each of the following, ple ase say whethe r their respons e to the current s ituation i n Ukraine has m ade things b etter , worse , or had n o effec t at al l - Pro-R ussian leaders in UkraineBase:All res pondents
CNN Ukraine Crisi s Surv ey
Telephone Fieldw ork : 7th - 11th May 2014
Page 47
Absolutes/col percents
Prepared by ComRes
Total Gender Age Region
Male Female 18-35 36-55 56+ North West Central South (without Crimea)
East Ukraine (without Crimea)
Crimea
A B C D E F G H I J K L
Total 1,000 450 550 332 348 320 177 196 221 131 213 938 62
Wtd Total 1,000 456 544 331 350 320 177 201 220 144 212 954 46
Better 65 20 45 27 19 19 3 3 5 9 35 56 10
7% 4% 8% 8% 6% 6% 2% 2% 2% 6% 17% 6% 21%
No effect at all 85 39 45 43 16 26 5 9 14 9 34 72 13
8% 9% 8% 13% 5% 8% 3% 5% 7% 6% 16% 8% 27%
Worse 812 385 427 244 308 260 168 183 191 123 127 792 20
81% 85% 78% 74% 88% 81% 95% 91% 87% 85% 60% 83% 44%
Don't know 38 11 27 17 6 15 1 6 9 3 16 34 4
4% 2% 5% 5% 2% 5% 1% 3% 4% 2% 8% 4% 8%

Table 23 Cont'dQ6 For each of the following, ple ase say whethe r their respons e to the current s ituation i n Ukraine has m ade things b etter , worse , or had n o effec t at al l - Pro-R ussian leaders in UkraineBase:All res pondents
CNN Ukraine Crisi s Surv ey
Telephone Fieldw ork : 7th - 11th May 2014
Page 48
Absolutes/col percents
Prepared by ComRes
Total Language Sense of loyalty (Eur vs Russia) Sense of loyalty (Russia vs Ukra ine)
Ukrainian Russian Both equally
Other Europe Russia Neither Don't know
Russia Ukraine Neither Don't know
M N O P Q R S T U V W X
Total 1,000 459 406 114 21 555 201 215 29 135 797 51 17
Wtd Total 1,000 465 398 114 23 563 191 217 29 123 806 53 17
Better 65 6 54 5 - 4 56 5 - 43 19 3 1
7% 1% 14% 5% - 1% 29% 2% - 34% 2% 6% 5%
No effect at all 85 22 57 4 2 18 50 16 - 35 42 5 2
8% 5% 14% 3% 9% 3% 26% 8% - 29% 5% 9% 11%
Worse 812 428 265 98 21 533 66 186 27 34 725 43 10
81% 92% 66% 87% 91% 95% 35% 86% 91% 27% 90% 81% 59%
Don't know 38 9 23 6 - 7 19 10 3 12 20 2 4
4% 2% 6% 6% - 1% 10% 5% 9% 10% 2% 4% 26%

Table 24 Q7 Whic h of the fo llow ing pol itical figures outside of Ukraine do you think best un derstands the needs of Ukraine?Base:All res pondents
CNN Ukraine Cris is Surv ey Telephone Fieldw ork : 7th - 11th May 2014
Page 49
Absolutes/col percents
Prepared by ComRes
Total Gender Age Region
Male Female 18-35 36-55 56+ North West Central South (without Crimea)
East Ukraine (without Crimea)
Crimea
A B C D E F G H I J K L
Total 1,000 450 550 332 348 320 177 196 221 131 213 938 62
Wtd Total 1,000 456 544 331 350 320 177 201 220 144 212 954 46
US President Barack Obama 135 67 68 49 44 42 31 42 36 14 11 134 1
14% 15% 12% 15% 13% 13% 17% 21% 16% 10% 5% 14% 2%
Russian President Vladimir Putin 150 60 90 55 40 55 4 2 13 20 82 121 29
15% 13% 17% 16% 11% 17% 2% 1% 6% 14% 39% 13% 63%
German Chancellor Angela Merkel 284 137 147 81 102 101 68 76 75 31 31 280 4
28% 30% 27% 25% 29% 32% 39% 38% 34% 21% 15% 29% 8%
UN General Secretary Ban Ki-Moon
50 22 28 9 26 14 8 11 15 8 7 48 1
5% 5% 5% 3% 8% 4% 5% 5% 7% 5% 3% 5% 3%
British Prime Minister David Cameron
54 27 27 18 16 20 10 13 13 12 7 54 -
5% 6% 5% 5% 5% 6% 5% 6% 6% 8% 3% 6% -
Other 10 2 7 4 4 2 3 2 2 - 2 9 1
1% 0% 1% 1% 1% 0% 2% 1% 1% - 1% 1% 2%
None 214 96 119 81 78 55 35 34 40 51 46 207 7
21% 21% 22% 25% 22% 17% 20% 17% 18% 35% 22% 22% 16%
Don't know 76 29 47 26 31 19 13 13 25 6 17 74 2
8% 6% 9% 8% 9% 6% 7% 7% 11% 4% 8% 8% 5%
Belarussian President Alexander Lukashenko
10 5 5 5 2 3 1 - 1 1 6 9 1
1% 1% 1% 2% 0% 1% 1% - 0% 1% 3% 1% 2%
Leaders of Poland 17 12 6 2 7 9 4 9 1 1 3 17 -
2% 3% 1% 1% 2% 3% 2% 4% 0% 1% 1% 2% -

Table 24 Cont'dQ7 Whic h of the fo llow ing pol itical figures outside of Ukraine do you think best un derstands the needs of Ukraine?Base:All res pondents
CNN Ukraine Cris is Surv ey Telephone Fieldw ork : 7th - 11th May 2014
Page 50
Absolutes/col percents
Prepared by ComRes
Total Language Sense of loyalty (Eur vs Russia) Sense of loyalty (Russia vs Ukra ine)
Ukrainian Russian Both equally
Other Europe Russia Neither Don't know
Russia Ukraine Neither Don't know
M N O P Q R S T U V W X
Total 1,000 459 406 114 21 555 201 215 29 135 797 51 17
Wtd Total 1,000 465 398 114 23 563 191 217 29 123 806 53 17
US President Barack Obama 135 89 34 10 1 111 3 18 2 - 130 5 -
14% 19% 9% 9% 6% 20% 2% 8% 8% - 16% 10% -
Russian President Vladimir Putin 150 9 128 11 1 10 124 14 2 98 40 8 4
15% 2% 32% 10% 6% 2% 65% 6% 8% 80% 5% 14% 25%
German Chancellor Angela Merkel 284 179 67 31 7 222 7 47 8 3 276 3 2
28% 38% 17% 27% 30% 39% 3% 22% 28% 2% 34% 5% 13%
UN General Secretary Ban Ki-Moon
50 19 19 9 3 37 4 6 2 1 42 3 4
5% 4% 5% 8% 12% 7% 2% 3% 8% 1% 5% 6% 20%
British Prime Minister David Cameron
54 33 14 5 2 40 1 14 - - 50 4 -
5% 7% 4% 4% 9% 7% 0% 6% - - 6% 8% -
Other 10 4 5 - 1 8 1 1 - 1 9 - -
1% 1% 1% - 5% 1% 0% 0% - 1% 1% - -
None 214 84 95 31 4 82 41 86 6 17 173 20 4
21% 18% 24% 27% 18% 15% 21% 40% 21% 14% 22% 37% 25%
Don't know 76 38 25 11 2 39 8 23 7 2 65 5 3
8% 8% 6% 10% 10% 7% 4% 10% 23% 2% 8% 10% 17%
Belarussian President Alexander Lukashenko
10 - 8 1 1 - 4 6 - 2 3 5 -
1% - 2% 1% 5% - 2% 3% - 1% 0% 10% -
Leaders of Poland 17 10 3 4 - 14 - 2 1 - 17 - -
2% 2% 1% 4% - 3% - 1% 4% - 2% - -
Table 25 Q8 Do you as socia te thes e words m ore w ith Barack Obama or more w ith Vla dimir Putin - A strong l eaderBase:All res pondents
CNN Ukraine Crisi s Surv ey Telephone Fieldw ork : 7th - 11th May 2014
Page 51
Absolutes/col percents
Prepared by ComRes
Total Gender Age Region
Male Female 18-35 36-55 56+ North West Central South (without Crimea)
East Ukraine (without Crimea)
Crimea
A B C D E F G H I J K L
Total 1,000 450 550 332 348 320 177 196 221 131 213 938 62
Wtd Total 1,000 456 544 331 350 320 177 201 220 144 212 954 46
Obama 270 124 146 66 92 112 52 90 77 30 17 266 4
27% 27% 27% 20% 26% 35% 29% 45% 35% 21% 8% 28% 10%
Putin 439 203 235 173 152 114 56 45 74 69 157 400 39
44% 45% 43% 52% 43% 36% 32% 22% 34% 48% 74% 42% 84%
Neither 233 106 127 79 83 71 59 53 53 36 30 231 2
23% 23% 23% 24% 24% 22% 33% 26% 24% 25% 14% 24% 5%
Don't know 58 22 36 13 23 23 10 13 16 9 8 57 1
6% 5% 7% 4% 7% 7% 6% 7% 7% 6% 4% 6% 2%

Table 25 Cont'dQ8 Do you as socia te thes e words m ore w ith Barack Obama or more w ith Vla dimir Putin - A strong l eaderBase:All res pondents
CNN Ukraine Crisi s Surv ey Telephone Fieldw ork : 7th - 11th May 2014
Page 52
Absolutes/col percents
Prepared by ComRes
Total Language Sense of loyalty (Eur vs Russia) Sense of loyalty (Russia vs Ukra ine)
Ukrainian Russian Both equally
Other Europe Russia Neither Don't know
Russia Ukraine Neither Don't know
M N O P Q R S T U V W X
Total 1,000 459 406 114 21 555 201 215 29 135 797 51 17
Wtd Total 1,000 465 398 114 23 563 191 217 29 123 806 53 17
Obama 270 182 54 25 9 233 6 25 6 2 264 3 1
27% 39% 14% 22% 38% 41% 3% 12% 20% 1% 33% 6% 6%
Putin 439 115 262 53 9 150 173 106 11 116 276 37 9
44% 25% 66% 47% 38% 27% 90% 49% 36% 94% 34% 69% 55%
Neither 233 137 62 28 6 143 9 74 8 3 218 11 2
23% 29% 16% 25% 24% 25% 5% 34% 26% 2% 27% 21% 10%
Don't know 58 31 20 7 - 36 4 13 5 3 48 2 5
6% 7% 5% 7% - 6% 2% 6% 18% 2% 6% 4% 29%

Table 26 Q8 Do you as socia te thes e words m ore w ith Barack Obama or more w ith Vla dimir Putin - Trustw orthyBase:All res pondents
CNN Ukraine Crisi s Surv ey Telephone Fieldw ork : 7th - 11th May 2014
Page 53
Absolutes/col percents
Prepared by ComRes
Total Gender Age Region
Male Female 18-35 36-55 56+ North West Central South (without Crimea)
East Ukraine (without Crimea)
Crimea
A B C D E F G H I J K L
Total 1,000 450 550 332 348 320 177 196 221 131 213 938 62
Wtd Total 1,000 456 544 331 350 320 177 201 220 144 212 954 46
Obama 389 187 202 110 141 138 89 129 88 48 30 384 5
39% 41% 37% 33% 40% 43% 51% 64% 40% 33% 14% 40% 11%
Putin 175 69 106 61 48 66 3 4 15 22 97 141 33
17% 15% 19% 19% 14% 20% 2% 2% 7% 15% 46% 15% 73%
Neither 410 195 215 154 150 105 79 68 106 71 78 402 7
41% 43% 39% 47% 43% 33% 45% 34% 48% 49% 37% 42% 16%
Don't know 26 4 22 5 10 11 6 1 11 3 6 26 -
3% 1% 4% 2% 3% 4% 3% 0% 5% 2% 3% 3% -

Table 26 Cont'dQ8 Do you as socia te thes e words m ore w ith Barack Obama or more w ith Vla dimir Putin - Trustw orthyBase:All res pondents
CNN Ukraine Crisi s Surv ey Telephone Fieldw ork : 7th - 11th May 2014
Page 54
Absolutes/col percents
Prepared by ComRes
Total Language Sense of loyalty (Eur vs Russia) Sense of loyalty (Russia vs Ukra ine)
Ukrainian Russian Both equally
Other Europe Russia Neither Don't know
Russia Ukraine Neither Don't know
M N O P Q R S T U V W X
Total 1,000 459 406 114 21 555 201 215 29 135 797 51 17
Wtd Total 1,000 465 398 114 23 563 191 217 29 123 806 53 17
Obama 389 245 94 40 11 335 7 40 7 1 377 8 3
39% 53% 24% 35% 48% 60% 4% 18% 25% 1% 47% 15% 19%
Putin 175 7 148 16 3 5 144 24 2 104 49 14 8
17% 2% 37% 14% 14% 1% 75% 11% 7% 84% 6% 26% 45%
Neither 410 200 147 55 9 210 37 145 16 18 356 30 5
41% 43% 37% 48% 38% 37% 20% 67% 56% 14% 44% 57% 29%
Don't know 26 13 10 3 - 12 3 8 4 1 23 1 1
3% 3% 2% 3% - 2% 2% 3% 12% 1% 3% 2% 7%

Table 27 Q8 Do you as socia te thes e words m ore w ith Barack Obama or more w ith Vla dimir Putin - ReliableBase:All res pondents
CNN Ukraine Crisi s Surv ey Telephone Fieldw ork : 7th - 11th May 2014
Page 55
Absolutes/col percents
Prepared by ComRes
Total Gender Age Region
Male Female 18-35 36-55 56+ North West Central South (without Crimea)
East Ukraine (without Crimea)
Crimea
A B C D E F G H I J K L
Total 1,000 450 550 332 348 320 177 196 221 131 213 938 62
Wtd Total 1,000 456 544 331 350 320 177 201 220 144 212 954 46
Obama 322 159 163 89 106 127 71 108 87 32 21 318 4
32% 35% 30% 27% 30% 40% 40% 54% 39% 22% 10% 33% 8%
Putin 193 81 112 76 49 67 4 4 19 29 104 159 34
19% 18% 21% 23% 14% 21% 2% 2% 9% 20% 49% 17% 74%
Neither 455 207 247 157 183 114 94 85 106 79 82 446 8
45% 46% 45% 48% 52% 36% 53% 42% 48% 55% 39% 47% 18%
Don't know 31 9 22 9 11 11 8 5 8 4 5 31 -
3% 2% 4% 3% 3% 4% 4% 2% 4% 3% 3% 3% -

Table 27 Cont'dQ8 Do you as socia te thes e words m ore w ith Barack Obama or more w ith Vla dimir Putin - ReliableBase:All res pondents
CNN Ukraine Crisi s Surv ey Telephone Fieldw ork : 7th - 11th May 2014
Page 56
Absolutes/col percents
Prepared by ComRes
Total Language Sense of loyalty (Eur vs Russia) Sense of loyalty (Russia vs Ukra ine)
Ukrainian Russian Both equally
Other Europe Russia Neither Don't know
Russia Ukraine Neither Don't know
M N O P Q R S T U V W X
Total 1,000 459 406 114 21 555 201 215 29 135 797 51 17
Wtd Total 1,000 465 398 114 23 563 191 217 29 123 806 53 17
Obama 322 207 71 36 7 285 5 25 7 1 314 5 2
32% 45% 18% 32% 32% 51% 3% 11% 25% 1% 39% 10% 12%
Putin 193 13 160 16 4 13 145 33 2 107 64 15 7
19% 3% 40% 14% 19% 2% 76% 15% 7% 87% 8% 28% 40%
Neither 455 226 158 59 11 243 40 155 16 16 401 32 6
45% 49% 40% 52% 50% 43% 21% 71% 56% 13% 50% 60% 35%
Don't know 31 19 9 3 - 21 1 5 4 - 28 1 2
3% 4% 2% 3% - 4% 1% 2% 12% - 3% 2% 13%

Table 28 Q8 Do you as socia te thes e words m ore w ith Barack Obama or more w ith Vla dimir Putin - FriendlyBase:All res pondents
CNN Ukraine Crisi s Surv ey Telephone Fieldw ork : 7th - 11th May 2014
Page 57
Absolutes/col percents
Prepared by ComRes
Total Gender Age Region
Male Female 18-35 36-55 56+ North West Central South (without Crimea)
East Ukraine (without Crimea)
Crimea
A B C D E F G H I J K L
Total 1,000 450 550 332 348 320 177 196 221 131 213 938 62
Wtd Total 1,000 456 544 331 350 320 177 201 220 144 212 954 46
Obama 472 218 255 142 176 154 110 138 113 61 43 466 6
47% 48% 47% 43% 50% 48% 62% 69% 51% 43% 21% 49% 13%
Putin 144 54 89 46 45 52 3 4 11 21 76 114 30
14% 12% 16% 14% 13% 16% 2% 2% 5% 14% 36% 12% 65%
Neither 336 166 170 132 111 93 55 53 77 60 81 325 10
34% 36% 31% 40% 32% 29% 31% 26% 35% 41% 38% 34% 23%
Don't know 49 18 31 11 17 21 9 6 19 2 11 49 -
5% 4% 6% 3% 5% 6% 5% 3% 9% 2% 5% 5% -

Table 28 Cont'dQ8 Do you as socia te thes e words m ore w ith Barack Obama or more w ith Vla dimir Putin - FriendlyBase:All res pondents
CNN Ukraine Crisi s Surv ey Telephone Fieldw ork : 7th - 11th May 2014
Page 58
Absolutes/col percents
Prepared by ComRes
Total Language Sense of loyalty (Eur vs Russia) Sense of loyalty (Russia vs Ukra ine)
Ukrainian Russian Both equally
Other Europe Russia Neither Don't know
Russia Ukraine Neither Don't know
M N O P Q R S T U V W X
Total 1,000 459 406 114 21 555 201 215 29 135 797 51 17
Wtd Total 1,000 465 398 114 23 563 191 217 29 123 806 53 17
Obama 472 285 122 51 14 380 9 69 14 3 456 11 2
47% 61% 31% 45% 62% 68% 5% 32% 49% 3% 57% 20% 12%
Putin 144 7 119 15 2 6 121 15 1 91 37 10 6
14% 2% 30% 14% 9% 1% 63% 7% 3% 74% 5% 18% 34%
Neither 336 149 138 44 6 154 53 119 10 25 275 30 6
34% 32% 35% 38% 24% 27% 28% 55% 33% 20% 34% 56% 38%
Don't know 49 24 19 4 1 22 8 14 4 4 39 3 3
5% 5% 5% 3% 5% 4% 4% 6% 14% 3% 5% 6% 17%

Table 29 Q8 Do you as socia te thes e words m ore w ith Barack Obama or more w ith Vla dimir Putin - CleverBase:All res pondents
CNN Ukraine Crisi s Surv ey Telephone Fieldw ork : 7th - 11th May 2014
Page 59
Absolutes/col percents
Prepared by ComRes
Total Gender Age Region
Male Female 18-35 36-55 56+ North West Central South (without Crimea)
East Ukraine (without Crimea)
Crimea
A B C D E F G H I J K L
Total 1,000 450 550 332 348 320 177 196 221 131 213 938 62
Wtd Total 1,000 456 544 331 350 320 177 201 220 144 212 954 46
Obama 357 166 191 98 128 131 90 113 89 43 20 355 2
36% 36% 35% 30% 37% 41% 51% 56% 40% 30% 10% 37% 5%
Putin 299 136 164 129 87 83 21 18 37 50 133 259 41
30% 30% 30% 39% 25% 26% 12% 9% 17% 34% 63% 27% 89%
Neither 265 118 146 90 101 74 54 57 69 42 41 263 1
26% 26% 27% 27% 29% 23% 30% 28% 32% 29% 19% 28% 3%
Don't know 79 36 43 13 33 32 13 13 25 9 17 77 1
8% 8% 8% 4% 9% 10% 7% 6% 11% 7% 8% 8% 3%

Table 29 Cont'dQ8 Do you as socia te thes e words m ore w ith Barack Obama or more w ith Vla dimir Putin - CleverBase:All res pondents
CNN Ukraine Crisi s Surv ey Telephone Fieldw ork : 7th - 11th May 2014
Page 60
Absolutes/col percents
Prepared by ComRes
Total Language Sense of loyalty (Eur vs Russia) Sense of loyalty (Russia vs Ukra ine)
Ukrainian Russian Both equally
Other Europe Russia Neither Don't know
Russia Ukraine Neither Don't know
M N O P Q R S T U V W X
Total 1,000 459 406 114 21 555 201 215 29 135 797 51 17
Wtd Total 1,000 465 398 114 23 563 191 217 29 123 806 53 17
Obama 357 238 75 36 7 314 5 32 7 - 350 6 1
36% 51% 19% 32% 32% 56% 2% 15% 22% - 43% 11% 6%
Putin 299 53 211 30 6 64 163 65 7 116 151 24 8
30% 11% 53% 27% 25% 11% 85% 30% 24% 94% 19% 45% 45%
Neither 265 138 80 37 9 141 16 99 9 4 238 19 3
26% 30% 20% 33% 39% 25% 8% 46% 30% 4% 29% 36% 18%
Don't know 79 36 32 10 1 44 8 21 7 3 67 4 5
8% 8% 8% 9% 4% 8% 4% 9% 23% 2% 8% 8% 30%

Table 30 Q8 Do you as socia te thes e words m ore w ith Barack Obama or more w ith Vla dimir Putin - DangerousBase:All res pondents
CNN Ukraine Crisi s Surv ey Telephone Fieldw ork : 7th - 11th May 2014
Page 61
Absolutes/col percents
Prepared by ComRes
Total Gender Age Region
Male Female 18-35 36-55 56+ North West Central South (without Crimea)
East Ukraine (without Crimea)
Crimea
A B C D E F G H I J K L
Total 1,000 450 550 332 348 320 177 196 221 131 213 938 62
Wtd Total 1,000 456 544 331 350 320 177 201 220 144 212 954 46
Obama 155 64 91 55 48 52 9 7 14 26 70 127 28
15% 14% 17% 17% 14% 16% 5% 4% 6% 18% 33% 13% 61%
Putin 672 311 361 213 243 216 144 170 164 92 91 661 11
67% 68% 66% 64% 69% 67% 81% 85% 75% 64% 43% 69% 24%
Neither 129 64 65 45 45 39 17 18 31 21 36 123 6
13% 14% 12% 14% 13% 12% 9% 9% 14% 15% 17% 13% 13%
Don't know 45 17 28 17 14 13 7 5 11 5 16 44 1
4% 4% 5% 5% 4% 4% 4% 2% 5% 4% 8% 5% 2%

Table 30 Cont'dQ8 Do you as socia te thes e words m ore w ith Barack Obama or more w ith Vla dimir Putin - DangerousBase:All res pondents
CNN Ukraine Crisi s Surv ey Telephone Fieldw ork : 7th - 11th May 2014
Page 62
Absolutes/col percents
Prepared by ComRes
Total Language Sense of loyalty (Eur vs Russia) Sense of loyalty (Russia vs Ukra ine)
Ukrainian Russian Both equally
Other Europe Russia Neither Don't know
Russia Ukraine Neither Don't know
M N O P Q R S T U V W X
Total 1,000 459 406 114 21 555 201 215 29 135 797 51 17
Wtd Total 1,000 465 398 114 23 563 191 217 29 123 806 53 17
Obama 155 19 118 14 3 19 113 23 - 78 61 11 5
15% 4% 30% 13% 14% 3% 59% 11% - 63% 8% 20% 29%
Putin 672 375 200 78 19 485 36 132 20 21 616 30 4
67% 81% 50% 69% 81% 86% 19% 61% 67% 17% 76% 56% 25%
Neither 129 48 62 17 1 45 33 44 6 20 96 8 4
13% 10% 16% 15% 5% 8% 17% 20% 20% 16% 12% 16% 23%
Don't know 45 23 18 4 - 13 10 18 4 4 32 4 4
4% 5% 5% 3% - 2% 5% 8% 13% 3% 4% 8% 23%

Table 31 Q9 How favourabl e or unfavour able d o you feel towards each of the follow ing - Russia n Preside nt Vladim ir PutinBase:All res pondents
CNN Ukraine Crisi s Surv ey Telephone Fieldw ork : 7th - 11th May 2014
Page 63
Absolutes/col percents
Prepared by ComRes
Total Gender Age Region
Male Female 18-35 36-55 56+ North West Central South (without Crimea)
East Ukraine (without Crimea)
Crimea
A B C D E F G H I J K L
Total 1,000 450 550 332 348 320 177 196 221 131 213 938 62
Wtd Total 1,000 456 544 331 350 320 177 201 220 144 212 954 46
Net: Favourab le 242 100 142 98 67 77 9 8 25 40 121 203 3924% 22% 26% 30% 19% 24% 5% 4% 11% 28% 57% 21% 84%
Net: Unfavourable 736 350 386 228 273 235 166 191 189 100 83 729 774% 77% 71% 69% 78% 73% 94% 95% 86% 69% 39% 76% 15%
Very favourable 122 47 75 43 36 42 4 3 10 14 63 93 28
12% 10% 14% 13% 10% 13% 2% 2% 5% 9% 30% 10% 61%
Fairly favourable 120 53 67 55 30 35 5 5 15 27 58 110 10
12% 12% 12% 16% 9% 11% 3% 2% 7% 19% 28% 11% 23%
Fairly unfavourable 195 91 103 63 76 56 35 38 48 34 35 190 4
19% 20% 19% 19% 22% 17% 20% 19% 22% 24% 16% 20% 10%
Very unfavourable 541 259 282 165 197 179 131 153 141 66 49 539 2
54% 57% 52% 50% 56% 56% 74% 76% 64% 46% 23% 56% 5%
Don't know 23 6 17 5 10 8 3 2 7 4 8 22 1
2% 1% 3% 1% 3% 3% 2% 1% 3% 2% 4% 2% 2%

Table 31 Cont'dQ9 How favourabl e or unfavour able d o you feel towards each of the follow ing - Russia n Preside nt Vladim ir PutinBase:All res pondents
CNN Ukraine Crisi s Surv ey Telephone Fieldw ork : 7th - 11th May 2014
Page 64
Absolutes/col percents
Prepared by ComRes
Total Language Sense of loyalty (Eur vs Russia) Sense of loyalty (Russia vs Ukra ine)
Ukrainian Russian Both equally
Other Europe Russia Neither Don't know
Russia Ukraine Neither Don't know
M N O P Q R S T U V W X
Total 1,000 459 406 114 21 555 201 215 29 135 797 51 17
Wtd Total 1,000 465 398 114 23 563 191 217 29 123 806 53 17
Net: Favourab le 242 20 189 28 5 19 173 43 6 121 89 23 824% 4% 47% 25% 22% 3% 91% 20% 21% 98% 11% 43% 45%
Net: Unfavourable 736 437 197 84 18 536 16 164 19 2 697 29 774% 94% 49% 74% 78% 95% 8% 76% 66% 2% 87% 55% 39%
Very favourable 122 10 102 7 2 6 102 12 2 77 35 3 7
12% 2% 26% 6% 11% 1% 53% 5% 7% 62% 4% 6% 40%
Fairly favourable 120 10 87 21 3 13 72 31 4 44 55 20 1
12% 2% 22% 18% 11% 2% 37% 14% 14% 36% 7% 37% 6%
Fairly unfavourable 195 102 61 26 6 113 7 66 9 2 177 13 2
19% 22% 15% 23% 25% 20% 4% 30% 30% 2% 22% 24% 14%
Very unfavourable 541 335 135 58 12 423 9 98 11 - 520 16 4
54% 72% 34% 51% 53% 75% 4% 45% 36% - 65% 30% 25%
Don't know 23 8 13 2 - 7 2 10 4 - 19 1 3
2% 2% 3% 2% - 1% 1% 5% 13% - 2% 2% 15%

Table 32 Q9 How favourabl e or unfavour able d o you feel towards each of the follow ing - Russia ns in ge neralBase:All res pondents
CNN Ukraine Crisi s Surv ey Telephone Fieldw ork : 7th - 11th May 2014
Page 65
Absolutes/col percents
Prepared by ComRes
Total Gender Age Region
Male Female 18-35 36-55 56+ North West Central South (without Crimea)
East Ukraine (without Crimea)
Crimea
A B C D E F G H I J K L
Total 1,000 450 550 332 348 320 177 196 221 131 213 938 62
Wtd Total 1,000 456 544 331 350 320 177 201 220 144 212 954 46
Net: Favourab le 577 262 315 176 211 190 75 85 110 82 180 533 4458% 58% 58% 53% 60% 59% 43% 42% 50% 57% 85% 56% 95%
Net: Unfavourable 398 182 215 148 130 119 97 107 105 58 29 395 240% 40% 40% 45% 37% 37% 55% 53% 48% 40% 14% 41% 5%
Very favourable 247 93 154 58 83 106 22 28 45 29 94 218 28
25% 20% 28% 18% 24% 33% 13% 14% 20% 20% 44% 23% 61%
Fairly favourable 330 169 161 118 128 85 53 58 65 53 86 315 16
33% 37% 30% 36% 37% 26% 30% 29% 30% 37% 41% 33% 34%
Fairly unfavourable 169 64 105 63 57 50 40 39 46 28 16 168 1
17% 14% 19% 19% 16% 16% 22% 19% 21% 19% 8% 18% 2%
Very unfavourable 229 118 110 86 74 69 57 69 59 30 13 227 1
23% 26% 20% 26% 21% 22% 32% 34% 27% 21% 6% 24% 3%
Don't know 26 11 14 7 8 11 5 8 5 4 3 26 -
3% 2% 3% 2% 2% 3% 3% 4% 2% 3% 1% 3% -

Table 32 Cont'dQ9 How favourabl e or unfavour able d o you feel towards each of the follow ing - Russia ns in ge neralBase:All res pondents
CNN Ukraine Crisi s Surv ey Telephone Fieldw ork : 7th - 11th May 2014
Page 66
Absolutes/col percents
Prepared by ComRes
Total Language Sense of loyalty (Eur vs Russia) Sense of loyalty (Russia vs Ukra ine)
Ukrainian Russian Both equally
Other Europe Russia Neither Don't know
Russia Ukraine Neither Don't know
M N O P Q R S T U V W X
Total 1,000 459 406 114 21 555 201 215 29 135 797 51 17
Wtd Total 1,000 465 398 114 23 563 191 217 29 123 806 53 17
Net: Favourab le 577 197 302 67 11 237 187 136 17 120 407 37 1258% 42% 76% 59% 47% 42% 98% 62% 59% 97% 51% 70% 71%
Net: Unfavourable 398 252 90 44 11 309 3 75 10 2 380 13 240% 54% 22% 39% 49% 55% 2% 34% 35% 2% 47% 25% 14%
Very favourable 247 78 141 26 1 74 110 56 6 78 142 20 7
25% 17% 35% 23% 6% 13% 58% 26% 20% 63% 18% 37% 41%
Fairly favourable 330 119 160 42 9 163 76 79 12 43 265 18 5
33% 26% 40% 37% 41% 29% 40% 36% 40% 34% 33% 33% 30%
Fairly unfavourable 169 103 38 26 3 129 2 31 6 2 161 6 -
17% 22% 10% 22% 11% 23% 1% 14% 22% 2% 20% 10% -
Very unfavourable 229 149 52 19 9 180 1 44 4 - 219 8 2
23% 32% 13% 17% 38% 32% 1% 20% 13% - 27% 14% 14%
Don't know 26 16 7 2 1 16 1 7 2 1 19 3 3
3% 3% 2% 2% 4% 3% 1% 3% 6% 1% 2% 6% 15%

Table 33 Q9 How favourabl e or unfavour able d o you feel towards each of the follow ing - Preside nt Oleksandr TurchinovBase:All res pondents
CNN Ukraine Crisi s Surv ey Telephone Fieldw ork : 7th - 11th May 2014
Page 67
Absolutes/col percents
Prepared by ComRes
Total Gender Age Region
Male Female 18-35 36-55 56+ North West Central South (without Crimea)
East Ukraine (without Crimea)
Crimea
A B C D E F G H I J K L
Total 1,000 450 550 332 348 320 177 196 221 131 213 938 62
Wtd Total 1,000 456 544 331 350 320 177 201 220 144 212 954 46
Net: Favourab le 456 214 242 123 179 154 112 139 112 51 33 447 946% 47% 44% 37% 51% 48% 63% 69% 51% 35% 16% 47% 19%
Net: Unfavourable 499 226 272 197 152 149 57 53 97 86 171 463 3650% 50% 50% 60% 43% 47% 32% 26% 44% 60% 80% 49% 77%
Very favourable 143 53 90 18 57 68 39 45 40 10 6 140 3
14% 12% 17% 5% 16% 21% 22% 22% 18% 7% 3% 15% 6%
Fairly favourable 313 162 151 105 123 86 73 94 72 41 27 307 6
31% 36% 28% 32% 35% 27% 41% 47% 33% 29% 13% 32% 13%
Fairly unfavourable 225 102 123 99 65 61 40 38 52 42 44 217 8
23% 22% 23% 30% 19% 19% 23% 19% 24% 29% 21% 23% 18%
Very unfavourable 273 124 149 98 87 89 16 14 44 44 126 246 27
27% 27% 27% 30% 25% 28% 9% 7% 20% 31% 60% 26% 60%
Don't know 45 15 31 11 18 16 8 9 12 7 8 44 1
5% 3% 6% 3% 5% 5% 5% 5% 5% 5% 4% 5% 3%

Table 33 Cont'dQ9 How favourabl e or unfavour able d o you feel towards each of the follow ing - Preside nt Oleksandr TurchinovBase:All res pondents
CNN Ukraine Crisi s Surv ey Telephone Fieldw ork : 7th - 11th May 2014
Page 68
Absolutes/col percents
Prepared by ComRes
Total Language Sense of loyalty (Eur vs Russia) Sense of loyalty (Russia vs Ukra ine)
Ukrainian Russian Both equally
Other Europe Russia Neither Don't know
Russia Ukraine Neither Don't know
M N O P Q R S T U V W X
Total 1,000 459 406 114 21 555 201 215 29 135 797 51 17
Wtd Total 1,000 465 398 114 23 563 191 217 29 123 806 53 17
Net: Favourab le 456 298 99 47 12 363 13 67 13 7 431 13 546% 64% 25% 42% 53% 65% 7% 31% 45% 6% 54% 24% 29%
Net: Unfavourable 499 147 283 58 11 178 177 132 11 116 336 36 1150% 32% 71% 51% 47% 32% 93% 61% 39% 94% 42% 68% 62%
Very favourable 143 107 24 10 2 119 4 16 3 2 137 4 1
14% 23% 6% 9% 10% 21% 2% 8% 11% 1% 17% 7% 3%
Fairly favourable 313 190 75 37 10 245 9 50 10 5 295 9 4
31% 41% 19% 33% 43% 43% 5% 23% 34% 4% 37% 17% 25%
Fairly unfavourable 225 98 89 32 6 124 30 63 8 13 193 15 5
23% 21% 22% 28% 27% 22% 16% 29% 28% 11% 24% 28% 27%
Very unfavourable 273 48 193 27 5 54 147 69 3 103 143 21 6
27% 10% 49% 23% 20% 10% 77% 32% 11% 83% 18% 40% 35%
Don't know 45 21 17 8 - 21 1 19 5 1 38 5 2
5% 4% 4% 7% - 4% 0% 9% 16% 1% 5% 9% 10%

Table 34 Q9 How favourabl e or unfavour able d o you feel towards each of the follow ing - Former Presi dent V iktor Yush chenk oBase:All res pondents
CNN Ukraine Crisi s Surv ey Telephone Fieldw ork : 7th - 11th May 2014
Page 69
Absolutes/col percents
Prepared by ComRes
Total Gender Age Region
Male Female 18-35 36-55 56+ North West Central South (without Crimea)
East Ukraine (without Crimea)
Crimea
A B C D E F G H I J K L
Total 1,000 450 550 332 348 320 177 196 221 131 213 938 62
Wtd Total 1,000 456 544 331 350 320 177 201 220 144 212 954 46
Net: Favourab le 201 82 119 74 67 60 42 49 46 25 33 195 620% 18% 22% 22% 19% 19% 24% 24% 21% 18% 16% 20% 13%
Net: Unfavourable 769 359 410 248 272 249 128 146 167 114 176 730 3977% 79% 75% 75% 78% 78% 72% 73% 76% 79% 83% 77% 84%
Very favourable 63 26 37 13 21 28 14 13 14 8 13 62 1
6% 6% 7% 4% 6% 9% 8% 6% 6% 6% 6% 7% 2%
Fairly favourable 138 57 82 61 46 32 28 36 32 17 21 133 5
14% 12% 15% 18% 13% 10% 16% 18% 15% 12% 10% 14% 11%
Fairly unfavourable 355 162 193 134 129 92 70 71 65 58 75 339 16
35% 36% 35% 40% 37% 29% 40% 35% 30% 40% 35% 36% 34%
Very unfavourable 414 196 217 114 143 157 58 75 102 56 101 391 23
41% 43% 40% 35% 41% 49% 32% 37% 46% 39% 48% 41% 50%
Don't know 30 15 16 8 11 11 7 6 7 5 3 29 1
3% 3% 3% 3% 3% 3% 4% 3% 3% 3% 1% 3% 3%

Table 34 Cont'dQ9 How favourabl e or unfavour able d o you feel towards each of the follow ing - Former Presi dent V iktor Yush chenk oBase:All res pondents
CNN Ukraine Crisi s Surv ey Telephone Fieldw ork : 7th - 11th May 2014
Page 70
Absolutes/col percents
Prepared by ComRes
Total Language Sense of loyalty (Eur vs Russia) Sense of loyalty (Russia vs Ukra ine)
Ukrainian Russian Both equally
Other Europe Russia Neither Don't know
Russia Ukraine Neither Don't know
M N O P Q R S T U V W X
Total 1,000 459 406 114 21 555 201 215 29 135 797 51 17
Wtd Total 1,000 465 398 114 23 563 191 217 29 123 806 53 17
Net: Favourab le 201 116 53 24 7 136 19 39 8 7 185 5 420% 25% 13% 21% 32% 24% 10% 18% 28% 6% 23% 9% 23%
Net: Unfavourable 769 334 337 82 16 409 168 172 19 115 594 47 1277% 72% 84% 72% 68% 73% 88% 79% 64% 93% 74% 88% 72%
Very favourable 63 41 15 3 4 43 5 13 2 1 58 3 1
6% 9% 4% 2% 18% 8% 3% 6% 6% 1% 7% 5% 3%
Fairly favourable 138 75 39 21 3 93 14 25 6 6 127 2 3
14% 16% 10% 19% 15% 16% 7% 12% 22% 5% 16% 4% 19%
Fairly unfavourable 355 165 147 33 9 201 62 81 10 46 285 20 4
35% 35% 37% 29% 40% 36% 33% 37% 33% 37% 35% 38% 25%
Very unfavourable 414 169 189 49 6 208 106 91 9 69 309 27 8
41% 36% 48% 43% 28% 37% 55% 42% 31% 56% 38% 50% 47%
Don't know 30 14 8 8 - 18 4 6 2 1 27 1 1
3% 3% 2% 7% - 3% 2% 3% 8% 1% 3% 3% 5%

Table 35 Q9 How favourabl e or unfavour able d o you feel towards each of the follow ing - Leaders in Crime aBase:All res pondents
CNN Ukraine Crisi s Surv ey Telephone Fieldw ork : 7th - 11th May 2014
Page 71
Absolutes/col percents
Prepared by ComRes
Total Gender Age Region
Male Female 18-35 36-55 56+ North West Central South (without Crimea)
East Ukraine (without Crimea)
Crimea
A B C D E F G H I J K L
Total 1,000 450 550 332 348 320 177 196 221 131 213 938 62
Wtd Total 1,000 456 544 331 350 320 177 201 220 144 212 954 46
Net: Favourab le 187 73 114 77 55 55 6 15 22 26 83 152 3519% 16% 21% 23% 16% 17% 3% 8% 10% 18% 39% 16% 76%
Net: Unfavourable 727 348 379 232 268 226 163 173 179 107 94 717 1073% 76% 70% 70% 77% 71% 92% 86% 82% 75% 44% 75% 23%
Very favourable 80 26 54 28 24 28 2 7 10 4 35 59 21
8% 6% 10% 8% 7% 9% 1% 4% 5% 3% 17% 6% 45%
Fairly favourable 107 47 61 49 31 27 3 8 12 22 48 93 14
11% 10% 11% 15% 9% 8% 2% 4% 5% 15% 23% 10% 31%
Fairly unfavourable 143 60 83 60 48 35 20 37 31 27 23 138 4
14% 13% 15% 18% 14% 11% 11% 18% 14% 19% 11% 14% 10%
Very unfavourable 585 288 296 172 221 192 143 136 148 80 71 579 6
58% 63% 54% 52% 63% 60% 81% 68% 67% 56% 34% 61% 13%
Don't know 86 35 51 21 26 38 9 13 18 11 35 85 1
9% 8% 9% 6% 8% 12% 5% 6% 8% 7% 16% 9% 2%
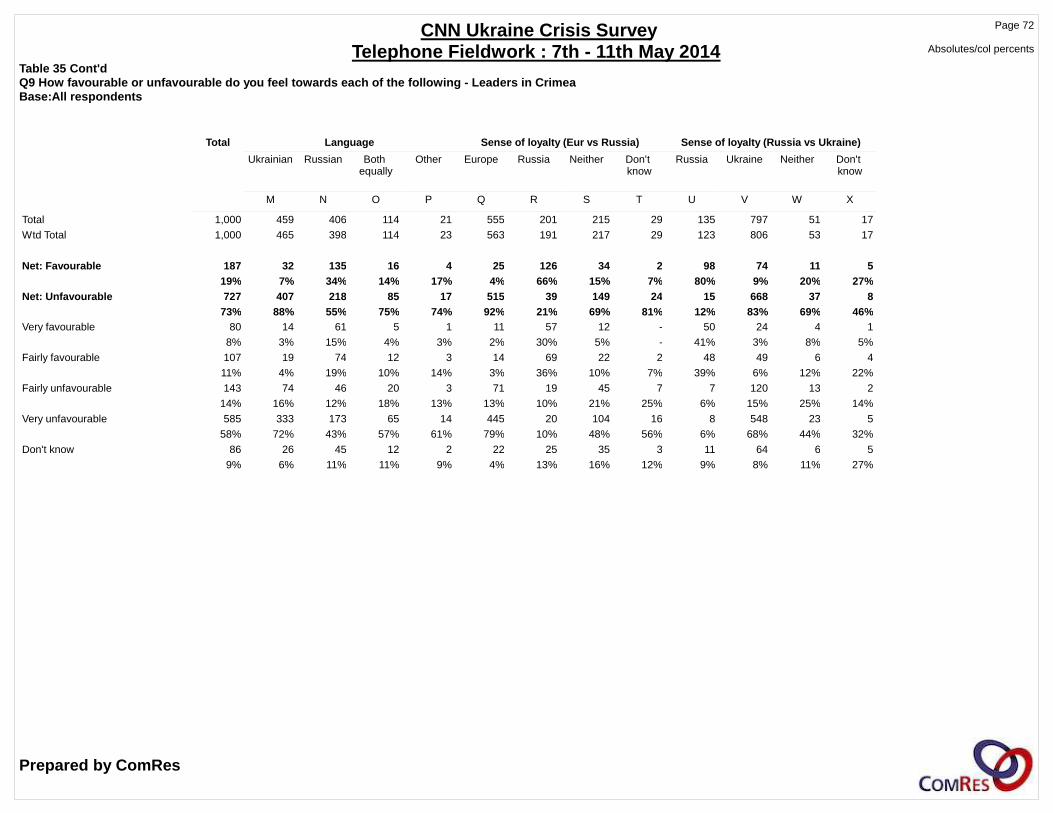
Table 35 Cont'dQ9 How favourabl e or unfavour able d o you feel towards each of the follow ing - Leaders in Crime aBase:All res pondents
CNN Ukraine Crisi s Surv ey Telephone Fieldw ork : 7th - 11th May 2014
Page 72
Absolutes/col percents
Prepared by ComRes
Total Language Sense of loyalty (Eur vs Russia) Sense of loyalty (Russia vs Ukra ine)
Ukrainian Russian Both equally
Other Europe Russia Neither Don't know
Russia Ukraine Neither Don't know
M N O P Q R S T U V W X
Total 1,000 459 406 114 21 555 201 215 29 135 797 51 17
Wtd Total 1,000 465 398 114 23 563 191 217 29 123 806 53 17
Net: Favourab le 187 32 135 16 4 25 126 34 2 98 74 11 519% 7% 34% 14% 17% 4% 66% 15% 7% 80% 9% 20% 27%
Net: Unfavourable 727 407 218 85 17 515 39 149 24 15 668 37 873% 88% 55% 75% 74% 92% 21% 69% 81% 12% 83% 69% 46%
Very favourable 80 14 61 5 1 11 57 12 - 50 24 4 1
8% 3% 15% 4% 3% 2% 30% 5% - 41% 3% 8% 5%
Fairly favourable 107 19 74 12 3 14 69 22 2 48 49 6 4
11% 4% 19% 10% 14% 3% 36% 10% 7% 39% 6% 12% 22%
Fairly unfavourable 143 74 46 20 3 71 19 45 7 7 120 13 2
14% 16% 12% 18% 13% 13% 10% 21% 25% 6% 15% 25% 14%
Very unfavourable 585 333 173 65 14 445 20 104 16 8 548 23 5
58% 72% 43% 57% 61% 79% 10% 48% 56% 6% 68% 44% 32%
Don't know 86 26 45 12 2 22 25 35 3 11 64 6 5
9% 6% 11% 11% 9% 4% 13% 16% 12% 9% 8% 11% 27%

Table 36 Q9 How favourabl e or unfavour able d o you feel towards each of the follow ing - European Unio nBase:All res pondents
CNN Ukraine Crisi s Surv ey Telephone Fieldw ork : 7th - 11th May 2014
Page 73
Absolutes/col percents
Prepared by ComRes
Total Gender Age Region
Male Female 18-35 36-55 56+ North West Central South (without Crimea)
East Ukraine (without Crimea)
Crimea
A B C D E F G H I J K L
Total 1,000 450 550 332 348 320 177 196 221 131 213 938 62
Wtd Total 1,000 456 544 331 350 320 177 201 220 144 212 954 46
Net: Favourab le 665 324 341 199 256 209 155 180 172 74 71 651 1366% 71% 63% 60% 73% 65% 88% 89% 78% 51% 34% 68% 29%
Net: Unfavourable 295 120 175 125 79 91 16 16 39 64 130 265 3029% 26% 32% 38% 23% 28% 9% 8% 18% 44% 61% 28% 65%
Very favourable 292 150 142 77 107 109 67 97 72 28 23 286 6
29% 33% 26% 23% 31% 34% 38% 48% 33% 19% 11% 30% 13%
Fairly favourable 372 174 198 122 150 101 88 83 100 46 48 365 7
37% 38% 36% 37% 43% 32% 50% 41% 45% 32% 23% 38% 16%
Fairly unfavourable 135 58 77 60 38 38 9 9 17 27 56 118 17
14% 13% 14% 18% 11% 12% 5% 5% 8% 19% 26% 12% 37%
Very unfavourable 159 62 98 65 41 53 7 7 22 37 74 147 13
16% 14% 18% 20% 12% 17% 4% 3% 10% 26% 35% 15% 27%
Don't know 41 12 29 7 14 19 6 5 9 6 11 38 3
4% 3% 5% 2% 4% 6% 3% 3% 4% 4% 5% 4% 6%

Table 36 Cont'dQ9 How favourabl e or unfavour able d o you feel towards each of the follow ing - European Unio nBase:All res pondents
CNN Ukraine Crisi s Surv ey Telephone Fieldw ork : 7th - 11th May 2014
Page 74
Absolutes/col percents
Prepared by ComRes
Total Language Sense of loyalty (Eur vs Russia) Sense of loyalty (Russia vs Ukra ine)
Ukrainian Russian Both equally
Other Europe Russia Neither Don't know
Russia Ukraine Neither Don't know
M N O P Q R S T U V W X
Total 1,000 459 406 114 21 555 201 215 29 135 797 51 17
Wtd Total 1,000 465 398 114 23 563 191 217 29 123 806 53 17
Net: Favourab le 665 400 176 77 11 527 26 94 17 16 623 20 666% 86% 44% 68% 49% 94% 14% 43% 58% 13% 77% 37% 33%
Net: Unfavourable 295 51 202 30 11 24 157 108 6 104 152 31 829% 11% 51% 27% 47% 4% 82% 50% 21% 85% 19% 58% 44%
Very favourable 292 185 71 29 6 253 6 25 8 2 281 6 4
29% 40% 18% 26% 26% 45% 3% 11% 26% 1% 35% 12% 21%
Fairly favourable 372 214 105 48 5 274 20 69 9 14 342 14 2
37% 46% 26% 42% 23% 49% 10% 32% 31% 11% 42% 26% 12%
Fairly unfavourable 135 26 89 13 7 11 63 58 3 46 73 15 1
14% 6% 22% 11% 30% 2% 33% 27% 12% 38% 9% 29% 4%
Very unfavourable 159 25 113 17 4 14 93 49 3 58 79 16 7
16% 5% 28% 15% 17% 2% 49% 23% 9% 47% 10% 29% 40%
Don't know 41 14 20 6 1 11 8 15 6 3 31 3 4
4% 3% 5% 5% 4% 2% 4% 7% 22% 2% 4% 5% 23%

Table 37 Q9 How favourabl e or unfavour able d o you feel towards each of the follow ing - United State sBase:All res pondents
CNN Ukraine Crisi s Surv ey Telephone Fieldw ork : 7th - 11th May 2014
Page 75
Absolutes/col percents
Prepared by ComRes
Total Gender Age Region
Male Female 18-35 36-55 56+ North West Central South (without Crimea)
East Ukraine (without Crimea)
Crimea
A B C D E F G H I J K L
Total 1,000 450 550 332 348 320 177 196 221 131 213 938 62
Wtd Total 1,000 456 544 331 350 320 177 201 220 144 212 954 46
Net: Favourab le 630 304 327 201 236 194 147 174 154 80 62 618 1363% 67% 60% 61% 67% 61% 83% 87% 70% 56% 29% 65% 27%
Net: Unfavourable 323 138 185 121 98 104 21 20 56 59 135 291 3232% 30% 34% 37% 28% 32% 12% 10% 26% 41% 64% 31% 69%
Very favourable 232 111 122 61 93 79 61 72 54 26 16 230 2
23% 24% 22% 18% 27% 25% 35% 36% 25% 18% 7% 24% 5%
Fairly favourable 398 193 205 140 143 115 85 102 100 54 47 388 10
40% 42% 38% 42% 41% 36% 48% 51% 45% 37% 22% 41% 23%
Fairly unfavourable 143 55 88 56 41 46 13 13 26 26 52 130 13
14% 12% 16% 17% 12% 14% 7% 6% 12% 18% 25% 14% 27%
Very unfavourable 180 83 97 66 57 58 8 7 31 32 83 161 19
18% 18% 18% 20% 16% 18% 4% 4% 14% 22% 39% 17% 42%
Don't know 47 14 33 9 16 22 9 7 9 5 14 45 1
5% 3% 6% 3% 5% 7% 5% 3% 4% 3% 7% 5% 3%

Table 37 Cont'dQ9 How favourabl e or unfavour able d o you feel towards each of the follow ing - United State sBase:All res pondents
CNN Ukraine Crisi s Surv ey Telephone Fieldw ork : 7th - 11th May 2014
Page 76
Absolutes/col percents
Prepared by ComRes
Total Language Sense of loyalty (Eur vs Russia) Sense of loyalty (Russia vs Ukra ine)
Ukrainian Russian Both equally
Other Europe Russia Neither Don't know
Russia Ukraine Neither Don't know
M N O P Q R S T U V W X
Total 1,000 459 406 114 21 555 201 215 29 135 797 51 17
Wtd Total 1,000 465 398 114 23 563 191 217 29 123 806 53 17
Net: Favourab le 630 374 166 74 16 491 22 102 15 13 593 20 563% 80% 42% 65% 68% 87% 12% 47% 51% 11% 74% 37% 30%
Net: Unfavourable 323 72 211 34 6 53 162 98 10 107 178 29 1032% 15% 53% 30% 28% 9% 85% 45% 35% 87% 22% 55% 55%
Very favourable 232 146 50 28 8 196 5 26 6 3 224 4 2
23% 31% 13% 24% 36% 35% 2% 12% 20% 2% 28% 8% 11%
Fairly favourable 398 228 116 46 7 295 18 76 9 10 369 16 3
40% 49% 29% 41% 32% 52% 9% 35% 31% 8% 46% 29% 19%
Fairly unfavourable 143 38 91 12 3 32 63 44 4 33 94 10 6
14% 8% 23% 10% 11% 6% 33% 20% 14% 27% 12% 18% 34%
Very unfavourable 180 34 120 22 4 21 99 54 6 73 84 20 4
18% 7% 30% 19% 17% 4% 52% 25% 21% 59% 10% 37% 22%
Don't know 47 19 21 6 1 19 6 18 4 4 36 5 3
5% 4% 5% 5% 4% 3% 3% 8% 14% 3% 4% 9% 15%