
CMS CERTIFICATE OF WAIVER AND PROVIDER … · CMS CERTIFICATE OF WAIVER AND PROVIDER PERFORMED...
30
CMS CERTIFICATE OF WAIVER AND PROVIDER PERFORMED MICROSCOPY PROCEDURES PILOT PROJECT Table of Contents I. Executive Summary II. Background III. The Waiver/Provider Performed Microscopy Procedures (PPMP) Project IV. Findings V. Summary VI. Recommendations VII. Recognition VIII. Appendix A: Full List of Data Tables IX. Appendix B: State-By-State Revisits X. Appendix C: Post-Survey Questionnaire Results
-
Upload
truongtruc -
Category
Documents
-
view
246 -
download
0
Transcript of CMS CERTIFICATE OF WAIVER AND PROVIDER … · CMS CERTIFICATE OF WAIVER AND PROVIDER PERFORMED...

CMS CERTIFICATE OF WAIVER AND PROVIDER PERFORMED MICROSCOPY PROCEDURES PILOT PROJECT
Table of Contents
I. Executive Summary
II. Background
III. The Waiver/Provider Performed Microscopy Procedures (PPMP) Project
IV. Findings
V. Summary
VI. Recommendations
VII. Recognition
VIII. Appendix A: Full List of Data Tables
IX. Appendix B: State-By-State Revisits
X. Appendix C: Post-Survey Questionnaire Results

EXECUTIVE SUMMARY
Expanded pilot studies by the Centers for Medicare and Medicaid Services (CMS), formerly the Health Care Financing Administration (HCFA), of laboratories issued a certificate of waiver (COW) and provider performed microscopy procedures (PPMP) laboratories demonstrate that 50% of laboratories performing waived tests do not follow the manufacturer’s instructions or do not have manufacturer’s instructions. The only CLIA requirement for COW laboratories is to follow the manufacturer’s test instructions. These findings mirror those of previous pilots conducted by Colorado, Ohio, New York and most recently, the Office of the Inspector General (OIG). If these percentages are nationally representative, as many as 60,000 laboratories may not be following manufacturer’s instructions and may be performing tests incorrectly to potentially harm patients.
COW and PPMP laboratories constitute 77% of the total 175,000 CLIA-enrolled laboratories and have no direct oversight. In this project, CMS surveyed 436 facilities that represent 2.5% of the COW and PPMP laboratories in eight states. The surveyors observed quality problems that CMS would not have discovered without visiting these laboratories.
Specifically, 20% of the laboratories issued a COW were not performing quality control (QC) as required by the manufacturer and 12% were not performing the additional QC requirements prescribed by CDC as a condition of test waiver. These percentages are artificially low because only certain waived tests require the performance of QC. Particular examples of problems identified by the surveyors include: laboratories were cutting fecal occult blood cards and urine dipsticks in segments to extend their use, which altered the mix of reagent and specimen; thereby, destroying the credibility of these tests. Other laboratories were using a variety of expired components from different test kits, which is prohibited by the manufacturer. One laboratory was using the wrong software for a popular cholesterol instrument. When surveyors explained the potential accuracy problems resulting from these activities, the facilities were eager to change. Most facilities wanted to “do the right thing” but had no resources or training to do so.
PPMP laboratories must meet the same CLIA quality standards as laboratories performing moderate complexity tests. This project found that 25% of the PPMP laboratories do not document personnel competency, and 38% do not evaluate test accuracy at least twice yearly. Also 6% percent of the COW and 6% of the PPMP laboratories had inappropriate certificates; these laboratories were conducting tests they were not authorized to perform. Additional findings are that States with laboratory licensure programs had at least five times fewer problems than States with no program. Doctors and nurses perform most of the tests. Lastly, not following instructions is exacerbated by lack of training of testing personnel and creates an extremely hazardous combination for test accuracy. CMS confirmed that lack of routine oversight in COW and PPMP laboratories continues to be a significant challenge to ensuring quality testing.
We recommend the following: • Institute an educational program for COW and PPMP laboratories. • Validate the effectiveness of this educational program. • Survey a percentage of COW and PPMP laboratories annually.
2

• Develop a self-assessment tool for PPMP laboratories. • Provide educational material as part of the CLIA enrollment process. • Have State Survey Agencies contact COW and PPMP laboratories to verify test menus.
BACKGROUND
Congress passed the Clinical Laboratory Improvement Amendments (CLIA) in 1988 to ensure the accuracy, reliability and timeliness of patient test results regardless of where the test is performed. CLIA requires all laboratories that examine materials derived from the human body for the diagnosis, prevention, or treatment purposes to be certified by the Secretary of Health and Human Services. The CMS, in conjunction with the Centers for Disease Control and Prevention (CDC) and the Food and Drug Administration (FDA), oversees the administration of the CLIA laboratory certification program for the Secretary. This certification is accomplished through assessment of compliance with complexity related standards and COW, provider performed microscopy procedures (PPMP), compliance and accreditation certificates.
By the CLIA law, COW laboratories perform only tests that are determined by the FDA and CDC to be so simple and accurate that erroneous results are negligible. In addition to performing waived tests, PPMP laboratories may perform certain microscopic examinations during the course of a patient visit using specimens that are not easily transportable.
Laboratories that only perform waived testing must enroll, pay applicable certificate fees biennially, and follow manufacturers’ test instructions. Since the inception of the program in 1992, the number and types of waived tests have increased from 8 tests to 40 tests. The number of COW laboratories has grown exponentially from 20% to 55% of the total 175,000 laboratories. COW laboratories are not subject to standards or routine survey. However, CMS has the authority (42 CFR 493.35) to survey these laboratories when there is risk of harm to patients, when a complaint is alleged, to determine if a laboratory is testing beyond the scope of its certificate, and/or to collect information regarding the appropriateness of waived tests.
Provider performed microscopy procedures laboratories are not subject to routine survey but must meet certain quality and administrative requirements and can be surveyed at the discretion of CMS. PPMP laboratories represent 22% of the laboratories in the USA; thus, a total 77% of laboratories have no direct, routine oversight.
Due to the increases in the number of waived tests, the large numbers of laboratories with no oversight, and the serious findings in COW laboratories with complaints, the States of Colorado and Ohio initiated pilot COW and PPMP survey programs. These pilots consisted of focused onsite surveys with prior notification and screening of the laboratories to confirm the States' concerns about quality testing in these laboratories. Both Ohio and Colorado found that more than 50% of the laboratories were not following the manufacturer's testing instructions. As many as 10% of the laboratories were found to be conducting tests they were not authorized to perform.
3

In addition, the OIG published a study in March 2001 (OEI-05-00-00251). Their findings revealed similar problems in both COW and PPMP laboratories. Nearly all State Agency inspectors believed the lack of oversight of COW and PPMP laboratories constitute a vulnerability. This is a vulnerability, because surveyors do not have an opportunity to identify and correct problems, and to educate untrained personnel. Other vulnerabilities included: • Laboratories not following manufacturers instructions, • Failure to identify incorrect results, • Testing beyond a laboratory’s CLIA certificate, • Untrained staff, • Lack of quality controls, • Poor equipment, • Poor storage of reagents, • Poor record keeping and • Misunderstanding of CLIA requirements.
Another OIG respondent called the lack of site visits for COW laboratories, “ a huge black hole in the integrity of the CLIA program. If no one ever checks on them…they can essentially do whatever they want.”
CMS is obligated to follow up on these major findings in order to be an effective steward of quality and responsive to the public good. Therefore, CMS expanded this COW and PPMP pilot.
THE COW/PPMP PROJECT
CMS increased the COW/PPMP project to include 8 additional States: Arizona, Idaho, Iowa, Massachusetts, Mississippi, New Mexico, New York, and Pennsylvania. States were instructed to include a variety of types of laboratories from rural and urban settings in the sample. The States included some with laboratory licensing programs . [State licensing is broadly defined as any State that has additional regulatory requirements for laboratories.] Two and one-half percent of the total number of COW and PPMP laboratories in each selected State were surveyed. In order to capture the broadest experience of waived and PPMP testing, CMS sought a variety of laboratory situations through the CLIA data system. These included laboratories in physician’s offices, skilled nursing facilities, end stage renal disease clinics, health maintenance organizations, community clinics, etc. Using the previous pilot as a guide, CMS developed a survey protocol and tools to use onsite and created evaluation forms for compiling the final data.
CMS notified State Agency directors, accreditation organizations, public health organizations, medical societies, and professional allied health organizations about the expansion of the pilot project prior to implementation. The surveys were pre-announced by formal letter to the director of the laboratory, then followed by a telephone call to confirm a convenient survey time. The outcome oriented, educational surveys were conducted at no charge to the laboratory.
The data indicates most laboratories welcomed the survey experience as beneficial. No surveyors were refused entry. Depending on the findings in the laboratory, onsite surveys resulted in one of three follow-up actions. The surveyors congratulated laboratories that were
4

testing in a quality manner with a “Letter of Compliance”. In those laboratories that needed assistance with manufacturers’ instructions, the surveyors provided direction and educational advice while onsite, then followed-up with a “Letter of Recommendations”. For laboratories that had certification problems, the surveyors explained the remedy and followed-up with a “Statement of Deficiencies”. These certification problems included laboratories that were conducting tests they were not authorized to perform and/or laboratories that allowed testing personnel other than those authorized by regulation to perform microscopic examinations. All laboratories had the opportunity to evaluate their survey experiences on a confidential post-survey questionnaire. (See Appendix C for post-survey questionnaire results.)
In order for CMS to validate the effectiveness of these efforts and to determine if the laboratories implemented the recommendations, revisits to some of the laboratories were necessary. Thus, on July 12, 2001, a letter was sent to the ARAs informing them of the need for the revisits. Subsequently, according to the State Agencies’ (SAs’)/Regional Offices’ (ROs’) discretion, they determined the sample size and the selection of laboratories to visit. (See Appendix C for the post-questionnaire survey results.)
CMS and the surveyors held bimonthly conference calls to offer direction, obtain feedback, and insure consistency and timeliness among the surveyors. The initial surveys were completed between November 2000 and the end of January 2001. Revisits were completed by the end of calendar year 2001. The following section offers a statistical compilation of the survey results.
FINDINGS
Information gathered during this project from 436 laboratory facilities is separated into COW and PPMP categories. As PPMP laboratories may perform waived tests, laboratories performing waived testing but holding a PPMP certificate surveyed as part of this project were included in the COW statistics. Therefore, 436 actual sites were visited, but 270 laboratories, which performed waived tests, and 190 laboratories, which performed PPMP tests, were evaluated. The two sections, COW and PPMP are further divided into certificate issues (information not related to testing quality), survey action (how results of the survey were conveyed to the laboratories) and survey results (tabulation of quality issues). Complete tables of the initial visits are in Appendix A. The State-By-State findings of the revisits are in Appendix B. The post-survey questionnaire results are in Appendix C.
COW LABORATORIES
PersonnelThe surveyors collected information on personnel performing waived testing. In cases where more than one person performed testing in the laboratory, statistics were gathered on all personnel performing testing. Registered nurses, followed by physicians, performed the majority of the testing. The following chart provides the break down of personnel.
5

Testing Personnel by Qualification Number of Labs Registered Nurse 240 Physician (M.D., D.O.) 233 Licensed Practical Nurse (LPN) 189 Medical Assistant (Certified M.A.) 119 High School Graduate 76 Nurse Practitioner/Nurse Midwife 62 Physician’s Assistant 21 Other: Certified Nursing Assistant (CNA), Chiropractor, Emergency Medical Technician (ambulance service), Paramedic, Patient Care Technician in ESRD, Respiratory Therapist
11
Medical Technologist, MT (B.S.degree) 10 Pharmacist/ Dr. of Pharmacology 5 Medical Laboratory Technician, MLT (A.A. degree) 4 Ph.D. 1 Podiatrist 1 Dentist 1
A total of 270 laboratories performing waived testing were surveyed. A broad range of facility types was selected. The facility types surveyed were mostly physician office laboratories (POLs) at 67% followed by skilled nursing facilities at 11% and end-stage renal dialysis facilities at 3%. Sixty-nine percent of the laboratories were located in urban areas with 31% in rural. Eighty-nine percent of facilities tested 6000 or fewer tests per year. Three percent of the facilities performed 18,000 or more tests. The percentage of facility types surveyed generally reflects the proportion of the total enrollment of these types of laboratories in the CLIA program; e.g., POLs represent about 58% of all laboratories in CLIA.
6
Survey Results
The surveys focused on quality outcome issues; i.e., test results or potential risk of harm to patients. Information on quality assurance practices, staff competency and proficiency testing (PT) was targeted. In addition, compliance with following manufacturers’ test instructions, a regulatory requirement for waived tests, was observed. The most commonly noted deficiency was related to the laboratories not following manufacturer's instructions. One hundred seventy-three of 270 laboratories did not have current manufacturer's instructions and/or did not follow the instructions they had. In addition, fifty-three laboratories were not performing quality control (QC) as required by the manufacturers’ instructions. Another 33 laboratories did not perform additional QC requirements for test waiver as prescribed by the CDC. This number is artificially low because only certain waived tests require QC. The surveyors also found problems relating to staff competency evaluation and training. Fifty-one laboratories did not provide training to their staffs on test methods or evaluate the staffs for their ability to perform accurate and reliable testing.
CMS State Agency surveyors found 13 laboratories voluntarily performed proficiency testing that is not a regulatory requirement for waived testing. Forty-three laboratories performed QC beyond the manufacturers' instructions. This represents laboratories actually performing QC that was listed only as recommended (not required) by the manufacturer. Again, laboratories in States with licensure requirements had fewer quality issues and were more likely to participate voluntarily in PT programs than in States that did not. None of the COW laboratories surveyed were operating in a manner that constituted serious and immediate jeopardy.
(See chart on following page.)
7
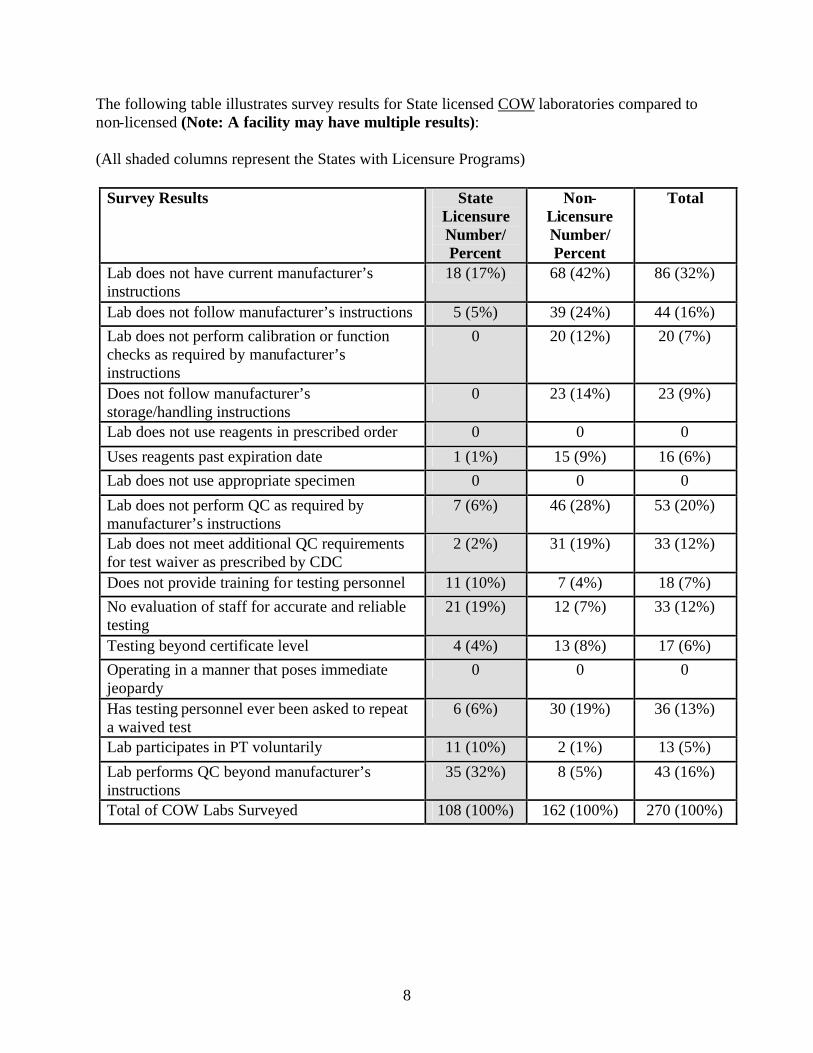
The following table illustrates survey results for State licensed COW laboratories compared to non-licensed (Note: A facility may have multiple results):
(All shaded columns represent the States with Licensure Programs)
Survey Results State Licensure Number/ Percent
Non-Licensure Number/ Percent
Total
Lab does not have current manufacturer’s instructions
18 (17%) 68 (42%) 86 (32%)
Lab does not follow manufacturer’s instructions 5 (5%) 39 (24%) 44 (16%) Lab does not perform calibration or function checks as required by manufacturer’s instructions
0 20 (12%) 20 (7%)
Does not follow manufacturer’s storage/handling instructions
0 23 (14%) 23 (9%)
Lab does not use reagents in prescribed order 0 0 0
Uses reagents past expiration date 1 (1%) 15 (9%) 16 (6%) Lab does not use appropriate specimen 0 0 0
Lab does not perform QC as required by manufacturer’s instructions
7 (6%) 46 (28%) 53 (20%)
Lab does not meet additional QC requirements for test waiver as prescribed by CDC
2 (2%) 31 (19%) 33 (12%)
Does not provide training for testing personnel 11 (10%) 7 (4%) 18 (7%) No evaluation of staff for accurate and reliable testing
21 (19%) 12 (7%) 33 (12%)
Testing beyond certificate level 4 (4%) 13 (8%) 17 (6%) Operating in a manner that poses immediate jeopardy
0 0 0
Has testing personnel ever been asked to repeat a waived test
6 (6%) 30 (19%) 36 (13%)
Lab participates in PT voluntarily 11 (10%) 2 (1%) 13 (5%)
Lab performs QC beyond manufacturer’s instructions
35 (32%) 8 (5%) 43 (16%)
Total of COW Labs Surveyed 108 (100%) 162 (100%) 270 (100%)
8

Follow Up to Survey FindingsThree actions could result from each survey. 1) The “Statement of Deficiencies” was issued to laboratories conducting unauthorized testing or having unqualified personnel. 2) A “Report of Recommendations” letter was issued to laboratories needing educational guidance only. 3) A “Letter of Compliance” was issued to laboratories where no quality issues were found.A total of nine laboratories were issued a "Statement of Deficiencies", three were State licensed and six were non-licensed. A total of 123 laboratories were issued a "Report of Recommendation" letter, 22 were State licensed and 101 were non-licensed. A total of 134 laboratories were issued a letter of compliance, 83 were State licensed and 52 were non-licensed. As expected, laboratories in States with licensure requirements had significantly fewer quality issues than those in States that did not.
The following table illustrates survey action for State licensed COW laboratories compared to non-licensed laboratories:
Survey Action Taken State Licensure Number/ Percent
Non-Licensure Number/ Percent
Total
Refused Entry 0 0 0
Issued Statement of Deficiencies 3 (3%) 6 (4%) 9 (3%) Issued Report of Recommendations Letter
22 (20%) 98 (60%) 120 (44%)
Issued Compliance Letter 83 (77%) 53 (33%) 136 (50%)
Total of COW Labs Surveyed 108 (100%) 162 (100%) 265* *Five PPMP labs doing waived testing required no separate action.
Certificate IssuesSixty-three of the surveyed laboratories had administrative certificate issues that included change of ownership, change of address, or change of director. This information is necessary for effective administration of the CLIA program.
When comparing State COW licensure and non-licensure laboratories, 25 of the licensed facilities were noted to have certificate issues and 38 non-licensed facilities had certificate issues. This represents no percentage difference in licensure compared to non-licensure.
Certificate Issues Identified State Licensure Number/ Percent
Non-Licensure Number/ Percent
Total
Change of Ownership 5 (5%) 7 (4%) 12 (4%) Change of Address (billing or physical)
4 (4%) 5 (3%) 9 (3%)
Change of Director 16 (15%) 26 (16%) 42 (16%) Total Labs with Certificate Issues 25 (23%) 38 (23%) 63
Total of COW Labs Surveyed 108 (100%) 162 (100%) 270
9
PROVIDER PERFORMED MICROSCOPY PROCEDURES LABORATORIES
A total of 190 laboratories performing PPMP testing were surveyed. The facility types surveyed were mostly POLs at 71%, followed by skilled nursing facilities at 13% and community clinics at 5%. Seventy-three percent of the laboratories were located in urban areas with 27% in rural areas. Ninety-one percent of facilities performed 6000 or fewer tests per year. Less than one percent of the facilities performed 18,000 or more tests in a year.
Survey Results
The most commonly noted deficiency was quality assurance; i.e., not evaluating test reliability twice a year, with 72 of the 190 laboratories failing to do so. Quality assurance issues, such as no documentation of personnel competency, no director approved procedure manual, inadequate centrifuge and microscope maintenance were noted in 171 laboratories. No PPMP laboratories surveyed were operating in a manner that constituted serious and immediate jeopardy. Thirty-three laboratories had no procedures for specimen collection, labeling, transportation, and preservation.
The surveyors discovered that 12 laboratories voluntarily participated in proficiency testing (PT) although it is not required by CLIA.
10

The following table illustrates survey findings in state licensed PPMP laboratories compared to non-licensed laboratories (Note: A facility may have multiple results):
(All shaded columns represent the States with Licensure Programs)
Survey Results State Licensure Number/Percent
Non-Licensure Number/Percent
Total
Operating in a manner that poses immediate jeopardy
0 0 0
Does not evaluate test reliability twice yearly
31 (34%) 41 (41%) 72 (38%)
Does not have documentation of personnel competency
30 (33%) 18 (18%) 48 (25%)
Does not have a director approved procedure manual
17 (19%) 36 (36%) 53 (28%)
Does not document periodic maintenance of microscope
10 (11%) 33 (33%) 43 (23%)
Does not document periodic maintenance of centrifuge
9 (10%) 16 (16%) 25 (13%)
Does not have identity of microscopy TP in records
1 (1%) 9 (9%) 10 (5%)
Does not follow approved procedure manual
0 2 (2%) 2 (1%)
PPMP testing not performed during patient’s visit
- - -
-----Has no procedures for specimen collection
6 (7%) 3 (3%) 9 (5%)
-----Has no procedures for specimen labeling
6 (7%) 3 (3%) 9 (5%)
-----Has no procedures for specimen preservation
3 (3%) 3 (3%) 6 (3%)
-----Has no procedures for specimen transportation
0 3 (3%) 3 (2%)
-----Has no procedures for specimen processing
3 (3%) 3 (3%) 6 (3%)
Testing beyond certificate level 8 (9%) 3 (3%) 11 (6%)
Inappropriate providers performing testing
1 (1%) 1 (1%) 2 (1%)
Does lab participate in PT voluntarily 11 (12%) 1 (1%) 12 (6%)
Total Number of PPMP labs surveyed 90 (100%) 100 (100%) 190 (100%)
11

Follow Up to Survey Findings
A total of 13 laboratories were issued a "Statement of Deficiencies", nine were State licensed and four were non-licensed. A total of 121 laboratories were issued a "Report of Recommendation" letter, 39 were State licensed and 82 were non-licensed. At total of 56 laboratories were issued a letter of compliance, 42 were State licensed and 14 were non-licensed.
The following table illustrates survey action taken in State licensed PPMP laboratories compared to non-licensed laboratories:
Survey Action Taken State Licensure Number/Percent
Non-Licensure Number/Percent
Total
Refused Entry 0 0 0
Issued Statement of Deficiencies 9 (10%) 4 (4%) 13 (7%) Issued Report of Recommendations Letter
39 (43%) 82 (82%) 121 (64%)
Issued Compliance Letter 42 (47%) 14 (14%) 56 (29%) Total Number of PPMP labs surveyed
90 (100%) 100 (100%) 190 (100%)
Certificate Issues
Forty-two of the 190 laboratories had certificate issues that included change of ownership, change of address or change of director. When separated into licensure versus non-licensure, 24 licensed and 18 non-licensed laboratories had certificate issues.
Certificate Issues State Licensure Non-Licensure Total
Change of ownership 6 (7%) 5 (5%) 11 (6%) Change of address (billing or physical)
7 (8%) 4 (4%) 11 (6%)
Change of director 11 (12%) 9 (9%) 20 (11%) Total Number of Labs with Certificate Issues
24 (27%) 18 (18%) 42
Total Number of PPMP labs 90 (100%) 100 (100%) 190 (100%)
SUMMARY
COW and PPMP laboratories, which account for 77% of all CLIA laboratories, were found to be lax in reporting certificate issues. Accurate and timely reporting of change of address, director, and tests performed are essential to the administration of the CLIA program. More importantly, CMS determined that the significant scope of quality testing problems in laboratories with no
12

direct oversight needs to be addressed immediately and ongoing. Laboratories in states with laboratory licensure programs performed better overall.
CLIA requires COW laboratories to follow the manufacturers’ test instructions. The surveyors found that almost 50% of the laboratories performing waived testing either did follow or did not have current manufacturer's instructions. In addition, 32% of the laboratories that were required were not performing quality control (QC) as indicated by the manufacturer's instructions or the additional QC requirements as prescribed by CDC for test waiver. For example, one laboratory performed QC but never followed up when the QC was out of range meaning that patient results for that period could be incorrect. Another laboratory was using the wrong software for a popular cholesterol instrument.
PPMP laboratories must follow the same quality standards CLIA has set for laboratories performing moderate complexity tests. This project found that 25% of the PPMP labs had no documentation of personnel competency and 38% do not evaluate test reliability at least twice yearly.
A few of the laboratories had inappropriate certificates, which necessitated a change in certificate type. Six percent of the COW, as well as six percent of the PPMP laboratories had inappropriate certificates. Eight of the PPMP labs were not doing any PPMP testing, and were able to switch to a COW. The remaining laboratories were testing beyond the scope of their certificates and were required to obtain the correct certificate.
On a positive note, we found one PPMP facility that evaluated the physicians and the tests reliability quarterly. That same facility accepted credential review performed by the local university in lieu of evaluating the physicians. Both these measures are beyond the minimum requirements of CLIA. Most facilities visited wanted to “do the right thing” but had no contacts or training to do so.
According to the post survey questionnaires (668B forms), the project was truly an educational experience to the laboratories. Although the post-survey questionnaires are voluntary for laboratories, surveyors encourage laboratories to participate. The following are some of the actual comments (See Appendix C for the post-questionnaire survey results.) provided by laboratory `participants in the project:
“Appreciated educational consultative approach; true quality improvement”,“Valuable in terms of assuring good performance”;“Properly timed, educational, relaxed mood”;“Good idea”;“Conducted in an exchange of information mode rather than punitive”;“Appreciated the chance to participate”;“Strongly support any survey process that improves quality of care to patients”.
The results of this project mirrored the findings of the previous pilots conducted by Colorado, Ohio, New York State and most recently the OIG and the results were well-received by the
13

laboratories. Since this project confirmed CMS’s concerns about quality problems in these laboratories; i. e., identified the dangerous combination of not following instructions and lack of testing personnel training, we are making the following recommendations.
14

RECOMMENDATIONS
Institute an educational program for all COW and PPMP laboratories in partnership with CDC, accreditation organizations, manufacturers, medical organizations and other professional organizations.
Validate the effectiveness of the educational approach. Re-survey the laboratories in this project with identified problems after they participate in an educational program. Also survey a percentage of laboratories that participate in an educational program but that have not had a previous survey.
Survey a percentage of COW and PPMP laboratories annually. Include laboratories that change from a Certificate of Compliance (COC) to a Certificate of Waiver (COW) or a PPMP certificate in the sample.
Develop a self-assessment survey tool for the PPMP laboratories to monitor their quality assurance programs (microscope maintenance, reagents in date, twice yearly test evaluation). A similar tool already exists for COC laboratories.
Provide simple and concise information on applicable CLIA requirements to new COW and PPMP laboratories during the enrollment process. Newly enrolled and previously established COW or PPMP laboratories may volunteer for an on-site educational conference. The purpose of this visit is educational, to introduce the laboratories to good laboratory practices. Include pertinent information on the CMS CLIA web site for easy access.
Have State Survey Agencies randomly contact (by telephone) a sample of COW and PPMP laboratories to verify that they are testing within the scope of their CLIA certificate and follow up with any necessary certificate changes.
15

RECOGNITION OF PARTICIPANTS IN THE COW/PPMP PROJECT
Region I: Charles Reynolds - State of Massachusetts: Doris DeGraves, Claire Abdelahad, Robert F. Bunker, Michael P. Caron, Nancy L. Hines, Sabrina Chapel, Pam Strom
Region II: Carmelita Ragaza - State of New York: Jeanne V. Linden, Colleen Flood, M.A. Chaudhry, Daria Gregg, Marie Kaehler, Mollie Kirkwood, Connie Maitland, Ed Maziarz, Mary O’Hanlon, Eve Rebassoo, Monroe Van Valkenburgh, Julie-Ann Fortran, Joyce Abele, Kathleen Davis, Cynthia Rasul
Region III: Benjamin Snyder - State of Pennsylvania: Joseph Gasiewski, Marianne Porter, James Bruton, Larry Lint, James Mathis, Alice Narcowich, Matthew Parfitt, Debra Tyler, Margaret Urzua, Kevin Wynn, Thomas Zaborsky
Region IV: Martha Kaye Personette - State of Mississippi: Theresa Irwin
Region VI: Sandra Pearson, LaDonna Ross - State of New Mexico: Julie Aragon
Region VII: Regie Haug - State of Iowa: Nancy Grove, James Ross
Region IX: Holly Stern - State of Arizona: Joan Apt, Diane Eckles
Region X: Francisca L. Lehr - State of Idaho: David Eisentrager, Phil Ciancia
Central Office: Judith A. Yost, Carla Ausby, Val Coppola, Herbert Goodrich, Daralyn Hassan, Kate Kremann, Ronalda Leneau, Peggy Martin, Virginia Wanamaker
16

17
Appendix A: Full List of Data Tables
COW Laboratories
Shaded Columns Represent the States with Licensure Programs Number of Labs by Facility Type ID MA PA AZ IA MS NM NY Total
Amb. Surg. Center 0 0 0 3 0 1 1 0 5 (2%) Community Clinic 0 0 0 1 0 1 1 0 3 (1%)
Comp Outpatient Rehab 0 0 0 0 0 0 1 0 1 (<1%) Ancillary Test Site 0 0 1 0 0 0 1 0 2 (1%)
ESRD 0 0 3 3 0 1 1 0 8 (3%) Health Fair 0 0 0 0 0 0 0 0 0
HMO 0 0 0 0 0 0 1 0 1 (<1%) Hospital 0 1 0 0 0 0 1 0 2 (1%)
Independent 0 0 0 3 0 0 1 0 4 (1%) Industrial 0 0 0 1 0 0 1 0 2 (1%)
Insurance 0 2 0 0 0 0 0 0 2 (1%) ICFMR 0 0 0 0 1 0 1 0 2 (1%)
Mobile Unit 0 0 1 0 0 0 0 0 1 (<1%) Pharmacy 0 0 0 0 2 2 1 0 5 (2%)
School/Student Health 0 0 0 0 0 0 1 0 1 (<1%) Skilled Nursing/Nursing 0 12 0 3 13 2 1 0 31 (11%)
POL 3 16 64 15 18 7 1 58 182 (67%) Other Practitioner 0 0 0 0 2 0 1 0 3 (1%)
Tissue Bank 0 0 0 0 0 0 0 0 0 Blood Banks 0 0 0 0 0 0 1 0 1 (<1%)
RHC/FQHC 0 0 0 1 0 3 1 0 5 (2%) Ambulance 0 0 1 1 0 0 0 0 2 (1%)
Other 0 0 4 1 1 0 1 0 7 (3%) Grand Total 3 31 74 32 37 17 18 58 270 (100%)
Location of Laboratories ID MA PA AZ IA MS NM NY Total
Urban 3 31 44 24 18 7 11 47 185 (69%) Rural 0 0 30 8 19 10 7 11 85 (31%)
Grand Total 3 31 74 32 37 17 18 58 270 (100%)

18
COW Laboratories Test Volume (Monthly) ID MA PA AZ IA MS NM
* NY**
Total
Less than 100 2 19 50 15 26 4 7 34 157 (58%)
101 – 200 1 8 7 7 3 3 1 11 41 (15%)201 – 300 0 0 8 4 2 3 2 4 23 (9%)
301 – 400 0 2 1 2 2 2 0 1 10 (4%) 401 – 500 0 0 3 3 1 2 0 0 9 (3%)
501 – 600 0 0 0 0 1 2 1 2 6 (2%) 601 – 700 0 0 0 0 1 0 1 0 2 (1%)
701 – 800 0 0 2 0 0 0 0 0 2 (1%) 801 – 900 0 0 2 0 0 0 0 0 2 (1%)
901 –1000 0 0 0 0 0 0 0 1 1 (<1%) 1001 – 1100 0 0 0 0 0 0 0 0 0
1101 – 1200 0 0 0 1 0 0 0 0 1 (<1%) 1201 – 1300 0 1 0 0 0 0 0 0 1 (<1%)
1301 – 1400 0 0 0 0 0 0 0 0 0 1401 – 1500 0 0 0 0 1 1 0 0 2 (1%)
Over 1500 0 1 1 0 0 0 2 3 7 (3%) Total of Labs Able to Report Volumes 3 31 74 32 37 17 14 56 264 *Four facilities did not know the test volume. **Two facilities were doing only PPMP testing. Certificate Issues Identified ID MA PA AZ IA MS NM NY Total
Change of ownership 0 5 0 5 0 0 0 2 12 (4%) Change of address (billing or physical) 0 1 3 1 1 0 2 1 9 (3%)
Change of director 0 8 8 7 8 2 6 3 42 (16%) Total of Labs with Certificate Issues 0 14 11 13 9 2 8 6 63
Grand total of COW labs surveyed 3 31 74 32 37 17 18 58 270

COW Laboratories
The following table illustrates survey results for State licensed COW laboratories compared to non-licensed (Note: A facility may have multiple results):
(All shaded columns represent the States with Licensure Programs)
Survey Results ID MA PA AZ IA MS NM NY Total
Testing beyond certificate level 1 1 2 3 1 3 2 4 17 (6%) Operating in a manner that poses immediate jeopardy
0 0 0 0 0 0 0 0 0
Lab does not have current manufacturer’s instructions
0 3 15 11 4 5 9 39 86 (32%)
Lab does not follow manufacturer’s instructions
0 3 2 25 0 4 5 5 44 (16%)
Lab does not use appropriate specimen 0 0 0 0 0 0 0 0 0 Lab does not use reagents in prescribed order
0 0 0 0 0 0 0 0 0
Lab does not perform quality control as required by manufacturer’s instructions
0 0 7 25 4 3 5 9 53 (20%)
Lab does not meet additional QC requirements as prescribed by CDC
2 0 0 8 6 1 4 12 33 (12%)
Lab does not perform calibration or function checks as required by manufacturer’s instructions
0 0 0 11 1 3 3 2 20 (7%)
Does not follow manufacturer’s storage/handling instructions
0 0 0 16 0 3 4 0 23 (9%)
Uses reagents past expiration date 0 1 0 3 1 3 4 4 16 (6%) Does not provide training for testing personnel
0 0 11* 5 1 0 0 1 18 (7%)
No evaluation of staff for accurate and reliable testing
0 0 21* 5 0 0 1 6 33 (12%)
Has testing personnel ever been asked to repeat a waived test
0 0 6 19 0 0 0 11 36 (13%)
Lab participates in PT voluntarily 1 2 8 0 0 0 2 0 13 (5%) Lab performs QC beyond manufacturer’s instructions
0 12 23 3 5 0 0 0 43 (16%)
*No documentation of personnel training.(Note: Percentages are based on the total number (270) of laboratories performing waived testing.)
19

COW Laboratories
Survey Action Taken ID MA PA AZ IA* MS NM NY Total
Refused Entry 0 0 0 0 0 0 0 0 0 Issued Statement of Deficiencies 0 1 2 3 1 1 1 0 9 (3%)
Issued Report of Recommendations Letter
2 6 14 23 16 10 9 40 120 (44%)
Issued Compliance Letter 1 24 58 6 15 6 8 18 136 (50%)
Total of Labs Surveyed 3 31 74 32 32 17 18 58 265* *Five PPMP labs doing waived testing required no separate action.
State Licensure and Non-Licensure Compared – COW
States with Licensure: Idaho, Massachusetts, and PennsylvaniaStates with No Licensure: Arizona, Iowa, Mississippi, New Mexico, and New York
Laboratories State Licensure Non-Licensure Total
Surveyed 108 162 270
Survey Action Taken State Licensure Number/ Percent
Non-Licensure Number/ Percent
Total
Refused Entry 0 0 0
Issued Statement of Deficiencies 3 (3%) 6 (4%) 9 (3%) Issued Report of Recommendations Letter
22 (20%) 98 (60%) 120 (44%)
Issued Compliance Letter 83 (77%) 53 (33%) 136 (50%)
Total of COW Labs Surveyed 108 (100%) 157 (100%) 265* *Five PPMP labs doing waived testing required no separate action.
Certificate Issues Identified State Licensure Number/ Percent
Non-Licensure Number/ Percent
Total
Change of ownership 5 (5%) 7 (4%) 12 (4%) Change of address (billing or physical) 4 (4%) 5 (3%) 9 (3%)
Change of director 16 (15%) 26 (16%) 42 (16%) Total Labs with Certificate Issues 25 (23%) 38 (23%) 63
Total of COW Labs Surveyed 108 (100%) 162 (100%) 270
20

State Licensure and Non-Licensure Compared – COW
The following table illustrates survey results for State licensed COW laboratories compared to non-licensed (Note: A facility may have multiple results):
(All shaded columns represent the States with Licensure Programs)
Survey Results State Licensure Number/ Percent
Non-Licensure Number/ Percent
Total
Testing beyond certificate level 4 (4%) 13 (8%) 17 (6%)
Operating in a manner that poses immediate jeopardy
0 0 0
Lab does not have current manufacturer’s instructions
18 (17%) 68 (42%) 86 (32%)
Lab does not follow manufacturer’s instructions 5 (5%) 39 (24%) 44 (16%) Lab does not use appropriate specimen 0 0 0
Lab does not use reagents in prescribed order 0 0 0 Lab does not perform QC as required by manufacturer’s instructions
7 (6%) 46 (28%) 53 (20%)
Lab does not meet additional QC requirements for test waiver as prescribed by CDC
2 (2%) 31 (19%) 33 (12%)
Lab does not perform calibration or function checks as required by manufacturer’s instructions
0 20 (12%) 20 (7%)
Does not follow manufacturer’s storage/handling instructions
0 23 (14%) 23 (9%)
Uses reagents past expiration date 1 (1%) 15 (9%) 16 (6%)
Does not provide training for testing personnel 11 (10%) 7 (4%) 18 (7%) No evaluation of staff for accurate and reliable testing
21 (19%) 12 (7%) 33 (12%)
Has testing personnel ever been asked to repeat a waived test
6 (6%) 30 (19%) 36 (13%)
Lab participates in PT voluntarily 11 (10%) 2 (1%) 13 (5%)
Lab performs QC beyond manufacturer’s instructions
35 (32%) 8 (5%) 43 (16%)
Total of COW Labs Surveyed 108 (100%) 162 (100%) 270 (100%)
21
22
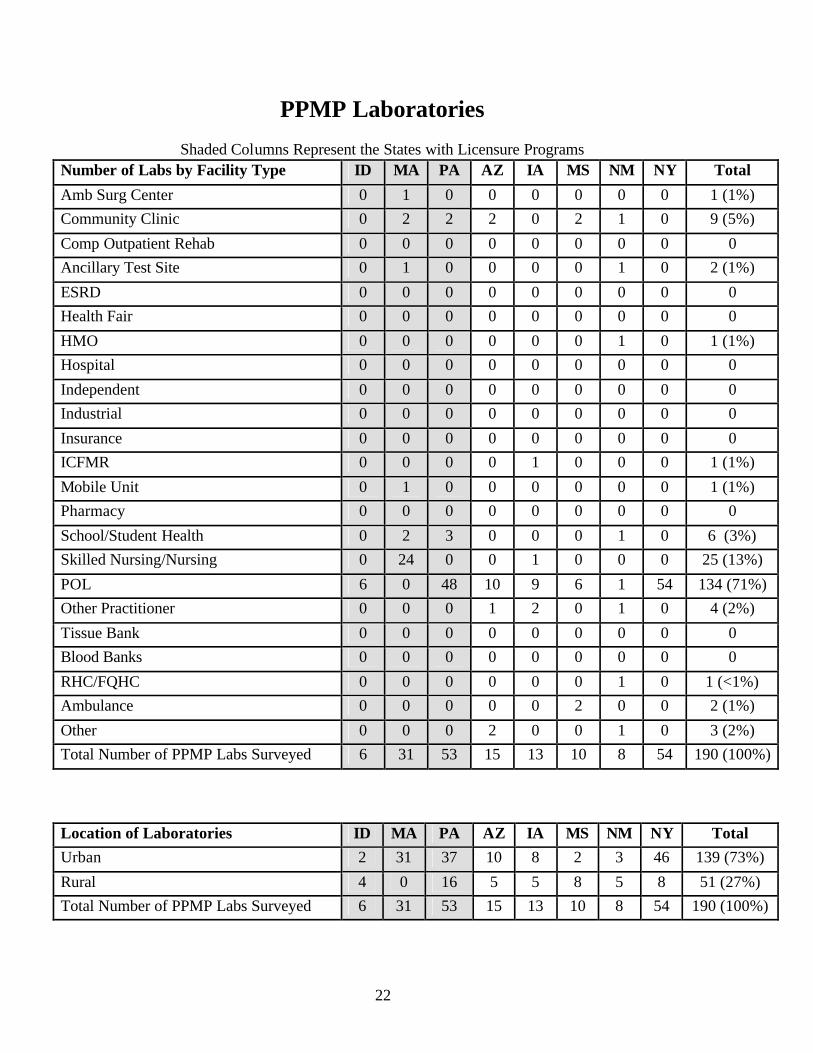
PPMP Laboratories
Shaded Columns Represent the States with Licensure Programs Number of Labs by Facility Type ID MA PA AZ IA MS NM NY Total
Amb Surg Center 0 1 0 0 0 0 0 0 1 (1%) Community Clinic 0 2 2 2 0 2 1 0 9 (5%)
Comp Outpatient Rehab 0 0 0 0 0 0 0 0 0 Ancillary Test Site 0 1 0 0 0 0 1 0 2 (1%)
ESRD 0 0 0 0 0 0 0 0 0 Health Fair 0 0 0 0 0 0 0 0 0
HMO 0 0 0 0 0 0 1 0 1 (1%) Hospital 0 0 0 0 0 0 0 0 0
Independent 0 0 0 0 0 0 0 0 0 Industrial 0 0 0 0 0 0 0 0 0
Insurance 0 0 0 0 0 0 0 0 0 ICFMR 0 0 0 0 1 0 0 0 1 (1%)
Mobile Unit 0 1 0 0 0 0 0 0 1 (1%) Pharmacy 0 0 0 0 0 0 0 0 0
School/Student Health 0 2 3 0 0 0 1 0 6 Skilled Nursing/Nursing 0 24 0 0 1 0 0 0 25 (13%)
POL 6 0 48 10 9 6 1 54 134 (71%) Other Practitioner 0 0 0 1 2 0 1 0 4 (2%)
Tissue Bank 0 0 0 0 0 0 0 0 0 Blood Banks 0 0 0 0 0 0 0 0 0
RHC/FQHC 0 0 0 0 0 0 1 0 1 (<1%) Ambulance 0 0 0 0 0 2 0 0 2 (1%)
Other 0 0 0 2 0 0 1 0 3 (2%) Total Number of PPMP Labs Surveyed 6 31 53 15 13 10 8 54 190 (100%)
Location of Laboratories ID MA PA AZ IA MS NM NY Total Urban 2 31 37 10 8 2 3 46 139 (73%)
Rural 4 0 16 5 5 8 5 8 51 (27%) Total Number of PPMP Labs Surveyed 6 31 53 15 13 10 8 54 190 (100%)
(3%)

23
PPMP Laboratories
Test Volume (Monthly) ID MA*
PA AZ IA MS NM**
NY Total
Less than 100 4 25 35 5 13 5 6 37 130 (68%)
101 – 200 2 1 4 1 0 2 1 8 19 (10%) 201 – 300 0 1 4 2 0 1 0 7 15 (8%)
301 – 400 0 1 0 1 0 0 0 1 3 (2%) 401 – 500 0 0 4 1 0 0 0 0 5 (3%)
501 – 600 0 0 1 0 0 0 0 0 1 (1%) 601 – 700 0 0 0 1 0 0 0 0 1 (1%)
701 – 800 0 0 1 1 0 0 0 1 3 (2%) 801 – 900 0 0 1 0 0 0 0 0 1 (1%)
901 –1000 0 0 0 1 0 1 0 0 2 (1%) 1001 – 1100 0 0 0 2 0 0 0 0 2 (1%)
1101 – 1200 0 0 0 0 0 0 0 0 0 1201 – 1300 0 0 2 0 0 0 0 0 2 (1%)
1301 – 1400 0 0 0 0 0 0 0 0 0 1401 – 1500 0 0 0 0 0 0 0 0 0
Over 1500 0 0 1 0 0 1 0 0 2 (1%) Number of PPMP Labs able to Report Volumes
6 28 53 15 13 10 7 54 186 (100%)
* Three facilities not performing any PPMP tests. ** One facility did not know the annual test volume. Certificate Issues Identified ID MA PA AZ IA MS NM NY Total
Change of ownership 0 5 1 3 0 0 0 2 11 (6%) Change of address (billing or physical) 0 2 5 0 0 0 1 3 11 (6%)
Change of director 1 6 4 3 3 0 3 0 20 (11%) Total of Labs with Certificate Issues 1 13 10 6 3 0 4 5 42
Total Number of PPMP Labs Surveyed 6 31 53 15 13 10 8 54 190

PPMP Laboratories
The following table illustrates survey results for State licensed PPMP laboratories compared to non-licensed (Note: A facility may have multiple results):
(All shaded columns represent the States with Licensure Programs)
Survey Results ID MA PA AZ IA MS NM NY Total
Testing beyond certificate level 1 4 3 0 0 0 1 2 11 (6%) Operating in a manner that poses immediate jeopardy
0 0 0 0 0 0 0 0 0
Inappropriate providers performing testing
0 1 0 0 1 0 0 0 2 (1%)
Does not have identity of microscopy TP in records
0 1 0 0 2 7 0 0 10 (5%)
Does not have documentation of personnel competency
4 13 13 8 10 0 0 0 48 (25%)
PPMP testing not performed during patient’s visit
0 0 0 0 0 0 0 0 0
-----Has no procedures for specimen collection
0 0 6 2 0 0 1 0 9 (5%)
-----Has no procedures for specimen labeling
0 0 6 2 0 0 1 0 9 (5%)
-----Has no procedures for specimen preservation
0 0 3 2 0 0 1 0 6 (3%)
-----Has no procedures for specimen transportation
0 0 0 2 0 0 1 0 3 (2%)
-----Has no procedures for specimen processing
0 0 3 2 0 0 1 0 6 (3%)
Does not have a director approved procedure manual
2 6 9 6 6 7 2 15 53 (28%)
Does not follow approved procedure manual
0 0 0 0 2 0 0 0 2 (1%)
Does not document periodic maintena nce of centrifuge
0 4 5 0 3 2 0 11 25 (13%)
Does not document periodic
Maintenance of microscope
0 5 5 6 1 6 0 20 43 (23%)
Does not evaluate test reliability twice yearly
3 13 15 11 11 7 2 10 72 (38%)
Does lab participate in PT voluntarily 0 8 3 0 1 0 0 0 12 (6%) Total Number of PPMP Labs Surveyed 6 31 53 15 13 10 8 54 190 (100%)
24

PPMP Laboratories
(All shaded columns represent the States with Licensure Programs)
Survey Actions ID MA PA AZ IA MS NM NY Total
Refused Entry 0 0 0 0 0 0 0 0 0 Issued Statement of Deficiencies 1 5 3 0 1 0 1 2 13 (7%)
Issued Report of Recommendations Letter
5 14 20 15 11 9 4 43 121 (64%)
Issued Compliance Letter 0 12 30 0 1 1 3 9 56 (29%)
Total Number of PPMP Labs Surveyed 6 31 53 15 13 10 8 54 190 (100%)
Licensure and Non-Licensure Compared – PPMP
States with Licensure: Idaho, Massachusetts, and PennsylvaniaStates with No Licensure: Arizona, Iowa, Mississippi, New Mexico, and New York
Total Laboratories State Licensure Non-Licensure Total
90 100 190
Certificate Issues State Licensure Non-Licensure Total
Change of ownership 6 (7%) 5 (5%) 11 (6%) Change of address (billing or physical) 7 (8%) 4 (4%) 11 (6%)
Change of director 11 (12%) 9 (9%) 20 (11%) Total Number of Labs with Certificate Issues
24 (27%) 18 (18%) 42
Total Number of PPMP labs 90 (100%) 100 (100%) 190 (100%)
Survey Action Taken State Licensure Number/Percent
Non-Licensure Number/Percent
Total
Refused Entry 0 0 0
Issued Statement of Deficiencies 9 (10%) 4 (4%) 13 (7%) Issued Report of Recommendations Letter
39 (43%) 82 (82%) 121 (64%)
Issued Compliance Letter 42 (47%) 14 (14%) 56 (29%) Total Number of PPMP labs surveyed 90 (100%) 100 (100%) 190 (100%)
25

Licensure and Non-Licensure Compared – PPMP
The following table illustrates survey results for State licensed PPMP laboratories compared to non-licensed (Note: A facility may have multiple results):
(All shaded columns represent the States with Licensure Programs)
Survey Results State Licensure Number/Percent
Non-Licensure Number/Percent
Total
Testing beyond certificate level 8 (9%) 3 (3%) 11 (6%) Operating in a manner that poses immediate jeopardy
0 0 0
Inappropriate providers performing testing
1 (1%) 1 (1%) 2 (1%)
Does not have identity of microscopy TP in records
1 (1%) 9 (9%) 10 (5%)
Does not have documentation of personnel competency
30 (33%) 18 (18%) 48 (25%)
PPMP testing not performed during patient’s visit
0 0 0
-----Has no procedures for specimen collection
6 (7%) 3 (3%) 9 (5%)
-----Has no procedures for specimen labeling
6 (7%) 3 (3%) 9 (5%)
-----Has no procedures for specimen preservation
3 (3%) 3 (3%) 6 (3%)
-----Has no procedures for specimen transportation
0 3 (3%) 3 (2%)
-----Has no procedures for specimen processing
3 (3%) 3 (3%) 6 (3%)
Does not have a director approved procedure manual
17 (19%) 36 (36%) 53 (28%)
Does not follow approved procedure manual
0 2 (2%) 2 (1%)
Does not document periodic maintenance of centrifuge
9 (10%) 16 (16%) 25 (13%)
Does not document periodic maintenance of microscope
10 (11%) 33 (33%) 43 (23%)
Does not evaluate test reliability twice yearly
31 (34%) 41 (41%) 72 (38%)
Does lab participate in PT voluntarily 11 (12%) 1 (1%) 12 (6%) Total Number of PPMP labs surveyed 90 (100%) 100 (100%) 190 (100%)
26

Appendix B
State-By-State Revisits
The State Agencies (SAs) revisited a total of 82 (82/436) laboratory facilities, approximately 19% of the total number of laboratory facilities visited in this project.
FINDINGS
Based upon the data collected for the revisits, there was improvement in the participating laboratories in 7 of the 8 states. The improvement varied from state to state with a total improvement of about 74% (61/82). Some states reported partial improvement, meaning that the laboratory followed some, but not all of the survey recommendations. The approximate 26% (21/82) of laboratories that did not improve may be due to several factors such as, apathy, resistance to change, incognizance of good laboratory practices, lack of time to establish a routine for good laboratory practices, frequent personnel turnover and/or a lack of communication from the laboratory director to the testing personnel, etc. Nonetheless, this reinforces the need for education.
RO I – MASSACHUSETTS (MA) In the original project, MA surveyed 31 facilities that performed waived testing and 31
PPMP labs. Their follow-up consisted of 7 labs. The problems were corrected at 5 of the 7 labs, or 71% corrected the problems. In one facility the problems were partially corrected, and this was NOT counted as one of the five. The remaining lab had MORE problems on the follow-up than on the initial visit.
RO II – NEW YORK (NY) In the original project, NY surveyed 58 facilities that performed waived testing and 54
PPMP labs. Their follow-up consisted of 28 labs, 27 COWS and 1 PPMP. In their follow-up report, 25% of the labs implemented the recommendations, 28% of the labs had partial implementation, and 29% had no implementation of the recommendations.
RO III – PENNSYLVANIA (PA) In the original project, PA surveyed 74 facilities that performed waived testing and 53
PPMP labs. Their follow-up consisted of 8 labs, all PPMP. In their follow-up, 4 of the 8 labs, or 50% implemented the recommendations, and the other 50% had partial implementation of the recommendations. Their report stated that all of the labs improved.
RO IV – MISSISSIPPI (MS) In the original project, MS surveyed 17 facilities that performed waived testing and 10
PPMP labs. Their follow-up consisted of 8 labs, 4 COW and 4 PPMP. There were 7 on-site revisits and 1 follow-up letter. In their follow-up, 7 of the 8 labs, or 88% showed improvement. One lab had not performed the contingency QC.
27

RO VI – NEW MEXICO (NM) In the original project, NM surveyed 18 facilities that performed waived testing and 8
PPMP labs. Their follow-up consisted of 16 labs, 10 COW and 6 PPMP. According to their report, 5 of the 6, or 83% of the PPMP labs improved; the one failed to write a procedure for the microscopy procedures. There was 100% improveme nt with the COW labs; 10 of the 10 implemented the recommendations!
RO VII – IOWA (IA) In the original project, IA surveyed 37 facilities that performed waived testing and 13
PPMP labs. Their follow-up consisted of 6 labs, 3 COW labs and 3 PPMP labs. According to their follow-up report, 2 of the 3, or 67% of the PPMP labs showed no improvement. The other PPMP lab only performed waived testing. One of the COW labs did not perform the contingency QC, but when it was issued a Statement of Deficiencies (CMS Form 2567), it provided an acceptable plan of correction.
RO IX – ARIZONA (AZ) In the original project, AZ surveyed 32 facilities that performed waived testing and 15
PPMP labs. Their follow-up consisted of 5 COW labs, and 4 of the 5 labs, or 80% improved. The lab that did not improve had a turnover in staff.
RO X- -IDAHO (ID) In the original project, ID surveyed 3 facilities that performed waived testing and 6
PPMP labs. Their follow-up consisted of 4 labs, 1 COW and 3 PPMP with 100% correction.
Factors Affecting The Revisits Data
The results of the revisits were evaluated on a state-by-state basis. Because of the small sample size (82), and the variations in data collection and reporting, there were inconsistencies with the information captured from state to state which impacted the overall findings to measure improvement and/or to capture factors that affect improvement. For example, some SAs documented personnel changes where other SAs did not. Some SAs also reported “partial improvement” or having new problems identified during the revisits that were not present during the initial visits, where other SAs did not document this. For subsequent studies, CMS will develop a data collection tool to ensure the consistency and thoroughness of the data compiled and for the final summary reports. Additionally, CMS will define how the SAs will determine whether or not the laboratory improved. Furthermore, there will be better guidelines for the revisits. For an example, in order for the surveyor to compare and tally their findings, the surveyor will use one checklist designed to gather information for both the initial and the follow-up visits.
28
--
Appendix C
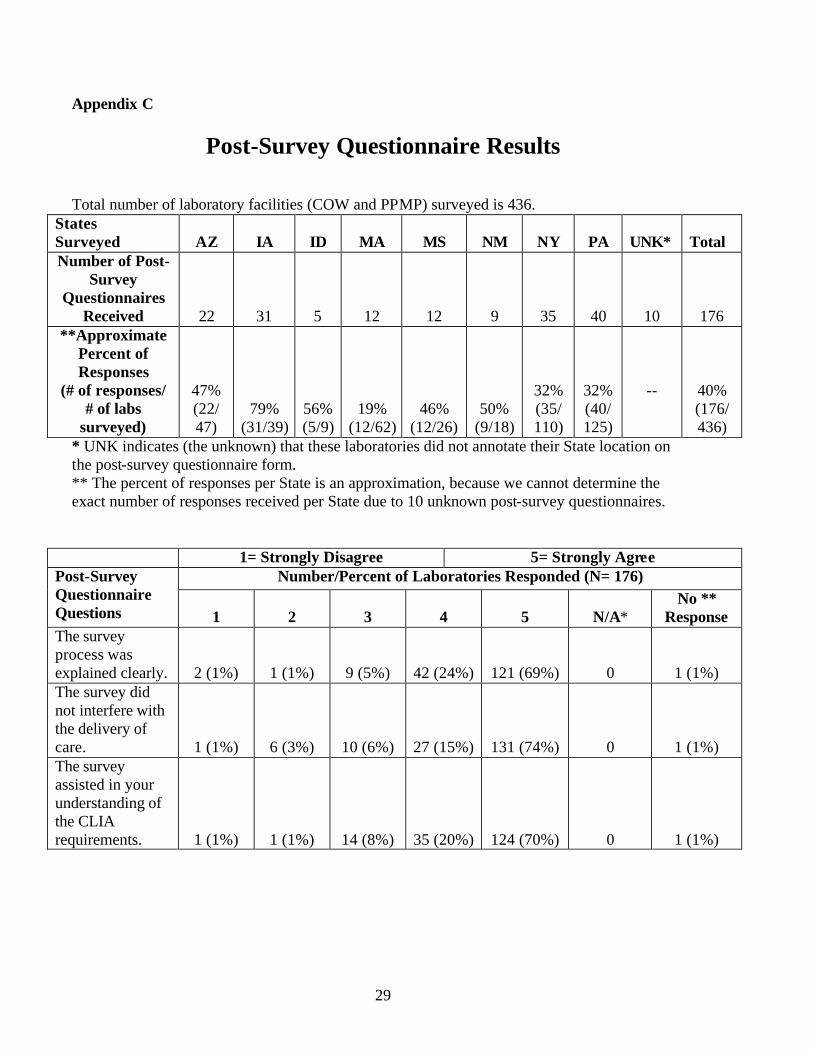
Post-Survey Questionnaire Results
Total number of laboratory facilities (COW and PPMP) surveyed is 436. States Surveyed AZ IA ID MA MS NM NY PA UNK* Total Number of Post-
Survey Questionnaires
Received 22 31 5 12 12 9 35 40 10 176 **Approximate
Percent of Responses
(# of responses/ # of labs
surveyed)
47% (22/ 47)
79% (31/39)
56% (5/9)
19% (12/62)
46% (12/26)
50% (9/18)
32% (35/ 110)
32% (40/ 125)
40% (176/ 436)
* UNK indicates (the unknown) that these laboratories did not annotate their State location on the post-survey questionnaire form. ** The percent of responses per State is an approximation, because we cannot determine the exact number of responses received per State due to 10 unknown post-survey questionnaires.
1= Strongly Disagree 5= Strongly Agree Post-Survey Questionnaire Questions
Number/Percent of Laboratories Responded (N= 176)
1 2 3 4 5 N/A* No **
Response The survey process was explained clearly. 2 (1%) 1 (1%) 9 (5%) 42 (24%) 121 (69%) 0 1 (1%) The survey did not interfere with the delivery of care. 1 (1%) 6 (3%) 10 (6%) 27 (15%) 131 (74%) 0 1 (1%) The survey assisted in your understanding of the CLIA requirements. 1 (1%) 1 (1%) 14 (8%) 35 (20%) 124 (70%) 0 1 (1%)
29

1= Strongly Disagree 5= Strongly Agree Post-Survey Questionnaire Questions
Number/Percent of Laboratories Responded (N= 176)
1 2 3 4 5 N/A* No **
Response Deficiencies, if any, were explained clearly so that you understood what the problem was and why. 0 1 (1%) 6 (3%) 21 (12%) 72 (41%) 75 (43%) 1 (1%) If deficiencies were found, the time frame and process for the plan of correction was explained. 1 (1%) 0 11 (6%) 14 (8%) 51 (29%) 97 (55%) 2 (1%) The survey was completed in a reasonable amount of time. 0 2 (1%) 5 (3%) 25 (14%) 142 (81%) 0 2 (1%) The survey met your laboratory's expectations. 0 1 (1%) 16 (9%) 33 (19%) 122 (69%) 0 4 (2%)
* N/A indicates non-applicable. ** No response indicates that the laboratory did not answer the question.
January 28, 2003
30


