
CMI Limited Annual Report 2007 - … adding to the already well established Brisbane office. ......
88
CMI Limited Annual Report 2007 CMI LIMITED ANNUAL REPORT 2007
Transcript of CMI Limited Annual Report 2007 - … adding to the already well established Brisbane office. ......

CMI Limited Annual Report 2007
CM
I LIM
Ite
d A
nn
uA
L R
epo
Rt
2007

CMI LIMITED ANNUAL REPORT 2007
ContentS2007 Highlights 2
Chairman’s Review 3
Group Business overview 4
2007 operational Review 5
directors & Senior Management 7
CMI Locations 9
Financial Report 11
Shareholder Information 80
Corporate directory 83
the Annual General Meeting of CMI Limited will be held at the Brisbane Riverview Hotel, Clayfield Albion Room, cnr Kingsford-Smith drive and Hunt Street, Hamilton on Monday, 12 november 2007 at 10.00 am. the business of the meeting is outlined in the formal notice and proxy Form that is enclosed with this report.
FINANCIAL CALENDAR
Financial year end 30 June 2007ASX announcement of results and dividend 31 August 2007Annual General Meeting 12 november 2007
ANNUAL GENERAL MEETING

CMI LIMITED ANNUAL REPORT 2007 �
CMI Limited is a diversified company which operates through three major business streams:
• Engineered and 4WD Components – manufacture and distribution of metal-based products for a diverse range of industry sectors including automotive, 4WD accessories, heavy transport, water fittings, white goods, energy, rural and housing.
• Electrical Components – manufacture and distribution of specialty cables, high voltage cables, flexible cables, plugs and couplers for the mining, communication, film, sound and lighting industries.
• Financial Services – consumer and commercial finance through the finance brokerage company, Capitalcorp Finance & Leasing Pty Ltd (“Capitalcorp”), which operates from 40 branches nationally.
The company’s operations, which are based throughout Australia, New Zealand and the United States of America, generated revenue of $265.4 million.
With its head office in Brisbane, CMI employs approximately 1,058 people as at 30 June 2007.
CMI

CMI LIMITED ANNUAL REPORT 20072
2007 Highlights
Financial Overview
• Revenue decreased by 4.8% to $265.4 million.
• Operating profit after tax decreased prior to impairment write down by 16.3% to $13.4 million.
• Significant growth in our Electrical business with sales increasing by 55.1% to $49.3 million and profit before tax increasing by 66% to $15 million.
• Acquisition of the business of XLPE Cables on 11 July 2006 to add high voltage cables to our Electrical division’s product range.
• Acquisition of the business of 4WD Warehouse on 1 June 2007 consisting of retail outlets at Kings Park, Penrith and Orange and 4WD Megastores advertising and purchasing group.
Operational Overview
• The Engineering division has been affected by the trend away from locally manufactured six cylinder cars in favour of smaller imported cars. The market statistics for the seven months to July 2007 indicate that 80% of new car sales are imported cars.
• The production volumes of the Original Equipment manufacturers supplied by CMI decreased during the year which has impacted on volumes at the Engineering Division’s Campbellfield and Kensington plants.
• Engineering Division’s margins were subject to cost pressures increasing raw material prices, the strong Australian dollar and low cost overseas component suppliers.
• The Electrical Division significantly increased revenue and profit through an expanded product range and distribution base. The division has been successful in increasing the sales of the Minto mining products and Aflex Cables range whilst integrating the XLPE high voltage cable range into the distribution network.
• TJM recorded revenue and profit before tax in line with the prior year. The SUV market has remained buoyant with the increase in sales on 4WD utilities compensating for any decrease in sales of other large 4WD’s. On 1 June 2007 TJM purchased the business of 4WD Warehouse Pty Ltd consisting of three retail stores and the 4WD Megastores advertising and purchasing group.
• Capitalcorp’s Business Finance capability was strengthened with particular emphasis on the Sydney and Melbourne markets adding to the already well established Brisbane office.
• Capitalcorp has opened eight new points of representation during the past 12 months.
• CMI Springs New Zealand has continued to trade in line with forecasts despite increased competition within the local market from Chinese suppliers. The business of Curtis Springs acquired in May 2006 was fully integrated into the existing operations during the year increasing the customer base and product range.
Financial Summary 2003 2004 2005 2006 2007 % $’000 $’000 $’000 $’000 $’000 Change
Group Revenue �96,045 275,604 284,040 278,704 265,397 (5)
Earnings before Depreciation, Interest & Tax �9,655 26,976 28,80� 27,750 6,540 (76)Depreciation & Amortisation (5,678) (7,285) (7,37�) (7,730) (7,379) (5)Earnings before Interest & Tax �3,977 �9,69� 2�,430 20,020 (839) (�04)Interest & Finance Charges (3,�97) (3,674) (3,705) (4,060) (4,397) 8Operating Profit (Loss) before Tax �0,780 �6,0�7 �7,725 �5,960 (5,236) (�33) Operating Profit (Loss) after Tax 7,229 �0,585 �2,�59 ��,�97 (3,840) (�34)
Earnings per Share
- Basic (Cents) �8.29 26.4� 22.89 23.45 (2�.6�) (�92)
Dividends
- Ordinary ($’000) 2,704 2,989 4,295 4,335 3,�83 (27)- Preference ($’000) 2,548 3,406 4,5�5 N/a N/a N/a- Class A ($’000) N/a N/a N/a 2,738 3,786 38
Dividends per Share
- Ordinary (Cents) �0.00 �2.00 �2.00 �2.00 9.00 (25)- Preference (Cents) * �2.50 �3.25 �4.00 3.50 N/a N/a- Class A (Cents) * N/a N/a N/a �0.50 �4.00 N/a
Shareholders Funds ($’000) 65,6�9 70,�77 84,296 87,985 79,5�5 (�0)Net Tangible Assets per Ordinary Share (Dollars) 0.90 0.44 �.45 �.57 �.39 (��)Number of Employees �,�46 �,3�� �,272 �,�26 �,058 (6)
* All issued Preference Shares were converted to Class A shares during the 2006 year.

CMI LIMITED ANNUAL REPORT 2007 3
Chairman’s Review
2007 has been a year of significant change for the company. Mr Max Hofmeister, the Chairman and CEO since the company was listed on the ASX in 1993, retired from all positions in the company during the year. Over that long term, he built the company from small beginnings to the company that it is today.
CMI today has three major business units: engineering, electrical and finance.
The engineering businesses have been the core of the company for the whole period of its existence and have been substantive suppliers of components to the car manufacturers and to the after-market. The Australian car manufacturing industry has changed greatly in the last few years and continues to change with the challenge of lower cost imports competing with the local engineering businesses. Those cost challenges have caused a significant reduction in the profitability of the CMI engineering businesses and the Board does not believe that any of those challenges will diminish in the next year.
The electrical businesses have continued to grow and to increase profitability. Much of the electrical sales are into the resources sector and the Board expects those markets to continue to grow over the next year.
The finance business has been impacted by increased competition in its market. The business has significant volumes and has an extensive distribution network of branches. The Board expects that trading conditions will continue to be difficult in this year.
Following the retirement of the former CEO, Mr Ray Catelan was appointed Managing Director. He has substantial experience in operating successful trading businesses and he is working with other management and the Board to finalise and implement the future strategy for the company.
I acknowledge the retirement of former directors Mr Maurie Maughan and long serving Mr John Johnson during the year.
Colin Ryan
Chairman

CMI LIMITED ANNUAL REPORT 20074
Group Business Overview
Engineered Components & 4WD Components Electrical Components USA Operations Financial Services
BUSINESS ACTIVITY
• Manufacture of precision engineered components for end manufacturers
• Manufacture and marketing of accessories for 4WD and light commercial vehicles
• Manufacture and distribution of specialist cabling and electrical products
• Distribution of CMI manufactured heavy transport, brake and 4WD components
• Consumer and commercial brokerage
BUSINESS NAMES
• CMI Operations
• CMI Forge
• CMI Water
• CMI Springs
• Curtis Springs
• Toowoomba Metal Technologies
• Toowoomba Engine Products
• TJM
• 4WD Megastores
• 4WD Warehouse
• CMI Electrical Products
• Hartland Cables
• Minto Industrial Products
• Aflex Cables
• XLPE Cables
• CMI Operations
• TJM USA
• Capitalcorp Financial Services
• Capitalcorp Finance & Leasing
PRODUCTS • Seat belt, suspension and brake components, inlet and exhaust manifolds and axle components
• Passenger airbag components, light truck mirror assemblies, drive train components and high performance disc brakes
• Truck, trailer and bus brake drums, wheel assemblies
• Water reticulation fittings, centrifugal pumps, water tanks
• Cylinder Heads
• Turbine Blades
• Vehicle Frontal Protection Systems (VFPS), canopies, side/rear protection bars, roof racks, water tanks, winches, suspension, rear bars, snorkels and other specialist accessories
• Power and communication cables/assemblies, computer cabling, mining plugs and high voltage couplers
• Brake components and select range of 4WD components
• Truck and trailer brake drums, hubs and wheel assemblies
• Personal loans – car loans, boat loans, unsecured personal loans
• Commercial finance – leases, hire purchases, operating and rental finance, novated leases and business loans.
• Home loans
• Insurance – motor vehicle insurance, personal loan protection insurance, gap cover insurance
INDUSTRY SECTORS
SUPPLIED
• Car & Component Manufacturing, Whitegoods, Energy, Agricultural, Heavy Transport, Water Supply, Building and Construction
• 4WD Accessory, Retailers & Distributors, Car Manufacturing
• Mining, Communications, Sound & Lighting and Power
• 4WD Accessory, Retailers and Distributors,
• Car and Component Manufacturing
• Consumers and Small, Medium Entities (SMEs)
MAJOR CUSTOMERS
• Holden, Ford, General Motors Brazil, Autoliv, Bosch Australia, PBR, Drivetrain Sustems International, Bendix Mintex, Cooper Standard, Dana, Unidrive, Schefenacker, BIC, Fisher and Paykel, Gallagher Group, Arvin Meritor, Transpec BPW, Tyco
• 4WD Specialist Distributors for after-market products
• Original Equipment market – Nissan, Mazda and Ford
• Specialist electrical distributors and OEM’s
• 4WD Specialist Distributors for after-market products
• Direct – PBR (Pacifica Limited subsidiary)
• Indirect – Ford, General Motors
Major Finance Providers
• GE Automotive Financial Services, Esanda, Westpac, ANZ, NAB and St George
OPERATING LOCATIONS
• Ballarat, Horsham, Campbellfield, Kensington, Footscray, Toowoomba, Auckland, Christchurch
• Brisbane and distribution in all capital cities and major provincial areas
• Sydney, Melbourne, Brisbane, Rockhampton, Perth
• Knoxville, Tennessee, Columbia, South Carolina
40 branches throughout Australia

CMI LIMITED ANNUAL REPORT 2007 5
2007 Operational ReviewENGINEERED AND 4WD COMPONENTS
The year under review was adversely affected by decreased sales of Australian manufactured 6 cylinder vehicles and a decline in large 4WD sales. The difficult trading conditions, which included increased raw material costs, large increases to petrol prices, reduced demand in the North American market and an increasingly competitive market, resulted in a 12.7% decline in sales revenue.
CMI Campbellfield
Despite the commencement of the supply of components for the mirror assembly of light trucks in North America and Australia, CMI’s Campbellfield manufacturing facility has endured a difficult year due to the decrease in the number of vehicles produced locally by a major customer, Ford. The ongoing demand for locally built 6 cylinder Ford vehicles over the next twelve months remains unknown.
CMI Kensington
CMI’s Kensington manufacturing plant returned a reduced contribution to the prior year whilst exceeding its budget. The reduction in the performance from the prior year related to a decrease in the demand for machined components for General Motor’s Family Two engines that are exported to Korea, China and Brazil and the impact of Ford’s reduced build rate on the components associated with the work won from the ION plant in New Zealand.
CMI Forge
This business, continued to perform below budgeted and prior year levels due to the reduced demand for locally produced cars, particularly for large 6 cylinder cars and the turbine blade business for GE generating below forecast sales. The business has also been impacted by increasing raw material costs and the strong Australian dollar.
CMI Forge has consolidated the majority of the operations from the two sites to one site during the year. The integration of the two sites is expected to be completed in the first half of 2007/2008.
The business has also incurred significant redundancy costs during the year associated with the reduced sales levels and the integration of the two sites.
As a fully accredited supplier to GE, CMI Forge is well positioned to meet any additional orders from GE to supply turbine blades for land-based wind generators in the USA. This business is now an integral part of its core operations.
Toowoomba Metal Technologies (TMT)
TMT sales volumes were in line with budget for the year. The profitability of the business suffered from the effect of scrap metal price increases and an increase in the Australian dollar against the US dollar.
The supply of heavy transport product to North America slowed during the second half of the year due to the increase in the Australian dollar against the US dollar and a major customer Dana entering into Chapter 11 in North America.
TMT has maintained its supply of after market cylinder heads through a USA based distributor despite the increase in the exchange rate.
Demand for TMT’s heavy transport products continues to remain strong.
CMI Horsham
CMI Horsham performed in line with budget in 2006/2007 despite higher scrap metal prices and a decrease in the Ford build rates. The primary driver behind the business’ performance was the continued supply of automotive components supplied to CMI Kensington and solid general engineering demand.
CMI New Zealand
CMI New Zealand has continued to consistently perform at close to budgeted levels despite ongoing pressure from overseas competition particularly from China.
The 2006/2007 result was an improvement on the prior year due to the impact of a favourable exchange rate movement as well as being the first full year of the incorporation of the business of Curtis Springs acquired on 1 May 2006. The business is expected to continue to face pressure from overseas competition in 2007/2008.
CMI USA
The first half of the year was impacted by reduced vehicle production volumes in North America by General Motors as a result of model run outs and increased fuel prices.
Demand from General Motors for the brake components we supply via our contract with Pacifica’s USA subsidiary PBR, increased during the second half with the introduction of the GMT 900 platform, although sales gained were at decreased margins.
Sales of TJM’s 4WD accessories in the USA were affected by a decrease in large vehicle sales due to increased fuel prices. The coming year will see the introduction of sales of TJM’s air operated differential locker into USA markets with the first two models scheduled for release in the first half of the year. Whilst this product will take some time to establish within the USA market we are confident that sales will grow following the model range’s progressive expansion.
CMI Ballarat
The Ballarat plant supplies brake components for export to the USA, and as such was affected by the decrease in volumes in the first half of the year associated with the runout of the GMT 800 platform and the reduced margins encountered in the second half following the introduction of the GMT 900 platform.
CMI Water
CMI Water was established during the year. The division manufactures polyethylene water tanks at its factory in Bundaberg, Queensland. The division whilst profitable in its first year of operation did not contribute significantly to the results of the company.

CMI LIMITED ANNUAL REPORT 20076
TJM
TJM sales performance was in line with our expectations with sales down 3% and profit up by 6% compared to the prior year. The increase in the profitability is a direct result of a focus on the costs within the business and the fact TJM has continued to increase its sourcing of products from overseas to supplement local production in order to control overall costs.
During the year TJM purchased the businesses of 4WD Megastores and 4WD Warehouse consisting of retail outlets at Kings Park NSW, Penrith NSW and Orange NSW and an advertising and marketing business.
TJM focus will continue on the control of costs and on new product development and the expansion of its existing product range.
We remain confident that TJM will continue to maintain current levels of orders. To ensure the business remains competitive we will continue out-sourcing production of some selected TJM designed and tooled components offshore. This initiative is to enable us to cost-effectively extend the range of TJM accessories which can be offered to the market both in Australia and overseas.
ELECTRICAL COMPONENTS
CMI Electrical
The CMI Electrical business has performed above our expectations, with sales revenue up 55.1% to $49.3 million and profit before tax increasing by 66% to $15 million. The year included the results of NSW based cabling business, XLPE Cables for the first time (purchased in July 2006).
Headed by Jeff Heslington, this division now employs around 83 staff based in offices at Sydney, Melbourne, Brisbane, Rockhampton and Perth. The operational structure has been built around the acquisition and successful integration of several separate businesses including Minto Industrial Products, Hartland Cables, Aflex Cables and XLPE Cables.
The division has continued to focus on consolidating the product range around a core of proven locally manufactured lines supplemented by a an increase in number of imported products. Major product lines now sold throughout Australia, and in selected areas overseas, comprise power and communication cables/assemblies, computer cabling, plugs and high voltage couplers.
The division’s operations are structured around the following five business units:
• Aflex Cables;
• Cable Assemblies;
• Hartland Cables;
• Minto Industrial Products; and
• XLPE Cables.
Each of the five Electrical Components business units focuses on one or two industry sectors and the cumulative reach of the division’s product range now extends across mining, industrial, electrical appliance, niche data, flexible cabling and high voltage cabling.
With the global resources sector continuing to grow during the year ended 30 June 2007 and the Australian coal mining sector remaining buoyant, the division has achieved further sales growth from its mining products. Growth is predicted to
continue from the division’s mining products, flexible and medium to high voltage cabling operations.
FINANCIAL SERVICES
Capitalcorp
The past year has seen a further expansion of the Branch distribution network taking to 40 our points of representation. Our Business Finance capability was strengthened with particular emphasis on the Sydney and Melbourne markets adding to the already well established Brisbane office. Capitalcorp has opened eight new points of representation during the past 12 months.
• Silverwater, Sydney
• Homebush, Sydney
• Caloundra
• Coffs Harbour
• Lismore
• Geelong West
• Sydney and Melbourne Business Finance
Capitalcorp now boasts 40 Points of representation offering the full suite of Consumer, Business Finance and Home loan products.
We have improved our capability of financing vehicles on line with the introduction of Autocapital, a web based used car search and online application facility linked to Capitalcorp accredited dealers.
The result for the Financial Services Division was affected by issues that adversely impacted the core business, which is providing finance for used motor vehicles.
Down Turn in Used Motor Sales
Many consumers are continuing to prefer the purchase of new rather than used motor vehicle due to the strong A$ and particularly the availability of new, cheaper, smaller, fuel efficient imported motor vehicles. This has affected used car sales across the board, but particularly from used motor dealers where a significant portion of the Capitalcorp core consumer finance and insurance business emanates.
Costs Incurred In Restructure
Substantial costs have been incurred with the restructuring of the delivery channels in our two largest markets; Sydney and Melbourne. We have moved our distribution model from predominantly a single independent contractor to mainly corporate controlled branches. This will produce improved profits in the medium term, and also reduce reliance on singular independent operators.
Margin and Interest Rate Pressure
As the used car market contracted during the past two years interest margins have reduced and and competition has increased with introducers and referrers of new business now demanding a larger percentage of available commissions.
The ensuing 12 months will focus on strongly growing our direct Sydney and Melbourne presence. Further, we will build on the now established commercial lending opportunities and the Autocapital online initiative.
2007 Operational Review

CMI LIMITED ANNUAL REPORT 2007 7
Directors and Senior Management
Colin Ryan AM
Chairman
Colin Ryan joined the board on 28 February 2007 as the non-executive chairman and independent director. Colin is currently: Chairman of the Brisbane Airport Corporation Ltd, Chairman of Capital + Merchant Finance Ltd (New Zealand), Chairman of Cymbis Finance Australia Ltd, Director of Softlink International Ltd and Chairman of the Royal Children’s Hospital Foundation.
Colin is the former Queensland managing partner of Arthur Andersen and former Deputy Chairman of the Port of Brisbane. He holds bachelor degrees in Commerce and Law, is a Fellow of the Institute of Chartered Accountants and a Fellow of the Australian Institute of Company Directors.
Raymond Catelan
Managing Director
Ray Catelan joined the board as a director on 18 May 2007 and as managing director on 3 July 2007. Ray has extensive commercial and management experience both in public and private company environments including more than 12 years in the IT industry. Ray founded RP Data in 1991 and was the managing director. RP Data was first listed on the Australian Stock Exchange in May 2000.
Ray is also a non-executive director of Bigair Group Limited.
Danny Herceg
Non-Executive Director
Danny Herceg joined the board on 9 March 2007 as an independent director. Danny is a senior corporate and commercial lawyer with a specialisation in capital raisings, mergers and acquisitions, privatisations, restructurings and venture capital. Danny commenced practise in 1990 after completing degrees in science and law. He was a capital raisings partner of Gilbert + Tobin before establishing Herceg Lawyers in 2002. In addition to Danny’s capital raisings expertise, Danny advises on various commercial and corporate law issues, including prospectus issues, corporate governance and employee share and option plans, as well as joint ventures and non-equity funding.
Danny is also the Chairman and a non-executive director of Bigair Group Limited.
Mark Laidlaw
Chief Financial Officer and Company Secretary
Mark Laidlaw joined CMI in 1997. He is a former audit manager of international accountancy firm, Deloitte Touche Tohmatsu. Mark worked for Deloitte in both Australia and the USA and was responsible for the CMI audit from 1991 to 1997. He is a member of the Institute of Chartered Accountants in Australia. He holds a Bachelor of Commerce (Honours) from the University of Queensland.
Dan Gallagher
Executive General Manager – Engineering
Dan Gallagher is responsible for the management of the company’s Engineered Components manufacturing operations in Australia and New Zealand. He has extensive experience in the automotive manufacturing sector, having held positions with Ford and Autoliv before joining CMI in 1993.
Dan has played a key part in maximising the company’s production efficiencies, and has been responsible for the restructure and implementation of lean manufacturing through many of CMI’s manufacturing facilities.
He is a member of the Australian Industry Group and the Federation of Automotive Products Manufacturers.
Ian Whittle
Managing Director – Financial Services
Ian Whittle was appointed Managing Director of Capitalcorp by CMI in November 2003. Ian has over 29 years experience in the financial services industry, including 8 years as a member of the Bank of Queensland’s Senior Executive Team. Prior to joining Capitalcorp he was the Bank of Queensland’s General Manager, Business Acquisition, with a focus on acquiring new commercial and high net worth individual customers.

CMI LIMITED ANNUAL REPORT 20078
Vince Misztowt
Vice President – USA Division
Vince Misztowt has managed CMI’s USA Division which is based in Knoxville, Tennessee, since its establishment in 1997. Besides managing the distribution of CMI’s products to PBR’s Tennessee and South Carolina brake manufacturing operations, Vince also has responsibility for distributing the company’s 4WD accessories in the USA market.
Jeff Heslington
General Manager – Electrical Components Division
Jeff Heslington joined CMI’s Hartland Cables business in 1999. Since then he has focused on strengthening the Electrical Components Division’s product range, including new design development.
Jeff, who is based in Sydney, was appointed General Manager of the Electrical Components Division in 2002. He has over 20 years experience in the electrical industry having worked for a range of companies including MM Cables where he was heavily involved in exports and government contracts.
Neil Saxon
Division Manager – TJM
Neil joined TJM in 2007. Neil has extensive experience in manufacturing and over seven years in the 4WD industry having previously held a senior position within ARB as their manufacturing manager overseeing their Australian and Thailand plants.
Neil is a mechanical engineer who has a focus on cost control, productivity improvements and product sourcing.
Geoff Fussell
Corporate Finance Manager
Geoff Fussell joined CMI in February 2003. He is a former client director of an international Chartered Accounting Firm – Assurance and Advisory division. He has also worked as a Senior Manager in the Corporate Finance division of Deloitte Touche Tohmatsu in the United Kingdom.
He is a member of the Institute of Chartered Accountants in Australia and holds a Bachelor of Commerce from the University of Queensland.
Allan Thomson
Manager – Tax and Treasury
Allan Thomson joined CMI in 2000. He is a former tax manager of Deloitte Touche Tohmatsu.
Allan is a member of the Institute of Chartered Accountants in Australia and the Taxation Institute of Australia and holds a Bachelor of Commerce and Bachelor of Law from the University of Queensland.
Ian Shelton
Information Systems Manager
Ian Shelton joined CMI in May 2000. Ian’s previous experience includes 10 years in the audit section of Deloitte Touche Tohmatsu, 15 years in senior financial and administration positions in both public and private companies and prior to joining CMI, he was responsible for ERP system implementations with Pronto Software.
Directors and Senior Management

CMI LIMITED ANNUAL REPORT 2007 9
Engineered and 4WD Components
Ballarat903 Latrobe StreetBallarat VIC 3350Telephone: 03 5335 8121Facsimile: 03 5335 5446Email: [email protected]
Melbourne (Campbellfield)76-106 National BoulevardCampbellfield VIC 3061Telephone: 03 9358 8300Facsimile: 03 9358 8350Email: [email protected]
Melbourne (Kensington)133 – 165 Kensington RoadKensington VIC 3031Telephone: 03 9687 6801Facsimile: 03 9689 9627Email: [email protected]
Melbourne (West Footscray)465 Somerville RoadWest Footscray VIC 3012Telephone: 03 8325 5200Facsimile: 03 8325 5299Email: [email protected]
HorshamPalm AvenueHorsham VIC 3400Telephone: 03 5382 0094Facsimile: 03 5382 0938Email: [email protected]
Toowoomba259 Ruthven StreetToowoomba QLD 4350Telephone: 07 4690 2200Facsimile: 07 4638 3559Email: [email protected]
Bundaberg (CMI Water)5 Charlie Triggs CrescentBundaberg QLD 4670Telephone: 07 4151 6822Facsimilie: 07 4151 8827
Brisbane (4WD Components)150 Robinson RoadGeebung QLD 4034Telephone: 07 3865 9999Facsimile: 07 3865 3677Email: [email protected]
Auckland 7A Carmont PlaceMt Wellington, Auckland NZTelephone: + 649 579 4089Facsimile: + 649 579 2595Email: [email protected]
Christchurch 25 Lunns RoadChristchurch NZTelephone: + 643 343 4460Facsimile: + 643 343 4469Email: [email protected]
US Operations
Knoxville, Tennessee2510 Quality LaneKnoxville, Tennessee 37931 USATelephone: +1 865 670 1556Facsimile: +1 865 670 1993Email: [email protected]
Columbia, South Carolina1025 Technology DriveWest Columbia, SC 29170 USATelephone: +1 803 822 0655Facsimile: +1 803 822 0654
Email: [email protected]
Electrical Components
Sydney18 - 20 Railway RoadMeadowbank NSW 2114Telephone: 02 9807 6155Facsimile: 02 9808 2033
XLPE Cables87 Malta StreetFairfield NSW 2165Telephone: 02 9723 2300Facsimile: 02 9723 2322
Melbourne (Aflex Cables)3-5 Dissik StCheltenham Vic 3192Telephone: 03 9532 1233Facsimile: 03 9553 3502
Brisbane150 Robinson RoadGeebung QLD 4034Telephone: 07 3865 4745Facsimile: 07 3865 7494
RockhamptonUnit 2/253 Bolsover StreetRockhampton QLD 4700Telephone: 07 4921 0978Facsimile: 07 4921 0981
Perth5 Runyon RoadMidvale WA 6056Telephone: 08 9250 5933Facsimile: 08 9250 5722
CMI Locations

CMI LIMITED ANNUAL REPORT 2007�0
Financial Services
Brisbane (Head Office)Garden City Office Park, Building 52404 Logan RoadUpper Mt Gravatt Qld 4122Telephone: 07 3112 2222Facsimile: 07 3112 2229Email: [email protected]
Points of Representation
40 throughout Australia as at right.
(details available
www.capitalcorp.com.au)
QLD
Bundaberg
Brisbane
Cairns
Chermside
Gold Coast
Home Loans
Ipswich
Mt Gravatt
Mackay
Rockhampton
Sunshine Coast
Toowoomba
Townsville
Underwood
NSW
Sydney - Business Finance
Albury
Capital Coast
Coffs Harbour
Homebush
Lismore
Newcastle
Orange
Penrith
Wollongong
NT
Darwin
VIC
Ballarat
Bendigo
Geelong West
Geelong South
Melbourne - Commercial
Ringwood
Shepparton
ACTCanberra
SAAdelaideMt GambierPort Lincoln
TASBurnieLauncestonHobart
WAPerth
CMI Locations

CMI LIMITED ANNUAL REPORT 2007 ��
Corporate Governance Statement 12
Directors’ Report 15
Independence Declaration by Auditors 21
Independent Audit Report 22
Directors’ Declaration 24
Income Statement 25
Balance Sheet 26
Statement of Changes in Equity 27
Cash Flow Statement 29
Notes to the Financial Statements 30
Financial Report

CMI LIMITED ANNUAL REPORT 2007�2
The Board of Directors (“Board”) is responsible for the corporate governance practices of the Company. Following the release of the Principles of Good Corporate Governance and Best Practice Recommendations by the ASX Corporate Governance Council, the Board formalised a Corporate Governance Charter in 2004. The summary of the Corporate Governance Charter is available on the Company’s website (www.cmilimited.com.au).
The following statement sets out the main corporate governance practices adopted by the Board and discloses any instances of non-compliance with, and reasons for not adopting, the best practice recommendations of the ASX Corporate Governance Council.
Lay Solid Foundations for Management and Oversight
The Board is responsible for, and has the authority to determine, all matters relating to the running of the Company including the policies, practices, management, operations and objectives of the Company. It is the role of management to manage the Company in accordance with the directions of the Board. The functions reserved to the Board, and those delegated to management, are disclosed in the Corporate Governance Charter.
Structure the Board to Add Value
As at the date of this statement, the Board comprises three directors - one executive and two non-executives. Details of the directors, including their skills, expertise, length of service and independence, are set out in the Directors’ Report.
The Board acknowledges the ASX Corporate Governance Council recommendation that the board should consist of a majority of independent directors and as such the Board consists of a majority of independent non-executive directors.
The Company complies with the ASX Corporate Governance Council recommendation of having different people in the roles of Chairman and Managing Director. The Chairman is also an independent director.
The Board considers that two directors are independent. An independent director is one who is free from any interest and any business or other relationship which could, or could reasonably be perceived to materially interfere with the director’s ability to act with a view to the best interests of the company.
The non-executive directors were appointed during the year as indicated within the Directors’ Report.
With the prior approval of the Board, each director has the right to seek independent legal and other professional advice at the Company’s expense concerning any aspect of the Company’s operations or undertakings in order to fulfil his duties and responsibilities.
The Board established an Audit Committee in 1994 and a Remuneration Committee in 1998. Each has had a formal charter since that time. A summary of the charters is available on the Company’s website.
The Board performs the duties of the Nomination Committee. There is no established formal Nomination Committee. Due to the small number of directors it is unlikely that the company would obtain additional benefits from a formal committee structure.
Promote Ethical and Responsible Decision Making
It is part of the philosophy of the Company that it will at all times comply with the law and behave ethically.
The Company has a Code of Ethics to guide directors, the Managing Director, and other executives as to the practices necessary to maintain confidence in the Company’s integrity, and the responsibility and accountability of individuals for reporting and investigating reports of unethical practices.
The directors and employees must be aware of, and comply with the provisions of, the Corporations Act 2001 in relation to insider trading. The Company has Security Transaction Rules that set out the policy of the Company on dealing in shares and securities by directors and employees. These are formally acknowledged by all directors and relevant employees of the Company.
A summary of The Code of Ethics and the Security Transaction Rules are available on the Company’s website.
Safeguard Integrity in Financial Reporting
The Managing Director and Chief Financial Officer verify in writing to the Board and to the Auditors that the financial reports of the Company present a true and fair view, in all material respects, of the Company’s financial condition and operational results, and are drawn up in accordance with relevant Accounting Standards.
The Audit Committee consists of one executive director and two independent non-executive directors. The Chairman of the Audit Committee is a non-executive director. The Board acknowledges the ASX Corporate Governance Council recommendation that the Audit Committee should consist of at least three members, all of whom are non-executive directors. Consideration has been given as to how and when this can be achieved, however the Board is currently of the view that this would require the appointment of an additional director which would be an unnecessary cost to the Company and the shareholders.
The Committee’s responsibility is to independently verify and safeguard the integrity of the Company’s financial reporting and oversee the independence of the external auditors. Details of the names and qualifications of the members of the Audit Committee, and their attendance at meetings, are disclosed in the Directors’ Report.
A formal charter which outlines the audit committee’s role, responsibilities, composition, structure and membership requirements and a summary of its main provision has been published on the Company’s website.
Corporate Governance Statement

CMI LIMITED ANNUAL REPORT 2007 �3
Make Timely and Balanced Disclosures
The Board complies with the continuous disclosure obligations of the Australian Stock Exchange (“ASX”) and, in so doing, immediately notifies the market by disclosing any information in relation to the business of the Company that a reasonable person would expect to have a material effect on, or lead to a substantial movement in, the price or value of the Company’s shares. The Company Secretary is responsible for communications with the ASX including responsibility for ensuring compliance with the continuous disclosure requirements in the ASX Listing Rules and overseeing information released to the ASX and shareholders.
Respect the Rights of Shareholders
In addition to market disclosure, the Company has a policy to ensure shareholders are able to gain access to information about the Company.
The principal communication with shareholders is through the provision of the Annual Report and Financial Statements, through the interim reports and at the Annual General Meeting. Shareholders are encouraged to participate at general meetings. There is also the Company’s website, which includes major briefings and announcements, the Corporate Governance Charter, other policies and committee charters and terms of reference.
The Board of Directors requests that the Company’s external auditor attends all Annual General Meetings and be available to answer shareholders’ questions about the conduct of the audit and the preparation and content of the auditor’s report thereon.
Recognise and Manage Risk
The Board recognises that the management of risk is an integral part of the management process and adheres to the general principles of Standards Australia Risk Management Standard 4360:1999. The Managing Director and Chief Financial Officer advise the Board in writing that the integrity of financial systems is founded on a sound system of risk management and internal compliance and control, which adheres to the policies adopted by the Board, and that the Company’s risk management and internal compliance and control system is operating efficiently and effectively in all material respects.
Encourage Enhanced Performance
The Managing Director is a key member of the Board and the key employee of the Company. An Operating Report is provided monthly to each of the directors. The report keeps them informed of the Company’s activities and performance.
The Remuneration Committee undertakes a detailed evaluation of the Managing Director’s performance on an annual basis. This evaluation utilises both quantitative and qualitative measures, and is judged against approved plans.
In addition, the Remuneration Committee, in conjunction with the Managing Director, reviews in a similar manner the performance of the senior executives of the Company who report directly to the Managing Director.
The results of these evaluations are tabled to the Board as part of the Remuneration Committee’s report. At this meeting, the Board and Managing Director discuss and agree goals (both quantitative and qualitative) for the coming year.
Remunerate Fairly and Responsibly
In accordance with its charter, the Remuneration Committee supports and advises the Board on appropriate remuneration policies, designed to meet the needs of the Company and enhance corporate and individual performance, as well as to attract and retain competent new talent.
It is responsible for reviewing and recommending salary package arrangements for the Managing Director, senior executives and directors, having regard to the performance of the Company and the individuals. Details of the names and qualifications of the members of the Remuneration Committee, and their attendance at meetings during the financial year, are disclosed in the Directors’ Report.
In recommending remuneration levels for the Managing Director, senior executives and directors, the committee considers several factors. The Company believes that it is imperative that these levels are commensurate with current market trends in relevant businesses, so as to ensure that high calibre employees and directors are attracted to and retained by the Company.
Other than for directors, remuneration packages usually include bonus and option elements, thus providing maximum benefits to both the Company and its shareholders.
In accordance with the Company’s Constitution, the total remuneration payable to non-executive directors is not to exceed $390,000 per annum as approved by the shareholders at a general meeting.
The policy on bonuses for the Managing Director and senior executives takes into account both quantitative and qualitative measures and, while profit performance is a key factor, revenue, market share, production hours, customer satisfaction and achievement of strategic objectives are considered, as well as the individual’s performance. Payment is always at the discretion of the Board, which takes into account the Company’s overall financial and strategic performance.
The Company operates the CMI Employee Incentive Scheme, approved by the shareholders in accordance with the requirements of the ASX. The intention of the Scheme is to assist in the attraction and retention of employees and executives. The Board will determine in its absolute discretion the eligibility and the number of options to be offered, having regard to length of service, contribution, and potential contribution to the Company. Further detail is contained in the Directors’ Report and the Financial Statements.
Details of directors’ and senior executives’ remuneration are disclosed in the Directors’ Report.
Corporate Governance Statement

CMI LIMITED ANNUAL REPORT 2007�4
Recognise the Legitimate Interests of Stakeholders
The Company has developed a Code of Conduct to guide compliance with legal and other obligations of legitimate shareholders. This Code of Conduct is available on the Company’s website.
The directors are responsible for the corporate governance practices of the company. This statement sets out the main corporate governance practices that were in operation throughout the financial year, except where otherwise indicated.
Corporate Governance Statement

CMI LIMITED ANNUAL REPORT 2007 �5
The directors of CMI Limited submit herewith the annual financial report for the financial year ended 30 June 2007. In order to comply with the provisions of the Corporations Act 2001, the directors report as follows:
The name and particulars of the directors of the company during or since the end of the financial year are:
Name Particulars
Colin G. Ryan Chairman and Non-Executive Director – Appointed 28 February 2007
Mr Ryan, AM, BCom, LLB, FCA, FAICD, is a former Queensland managing partner of an international chartered accounting firm. He is currently Chairman of the Brisbane Airport Corporation Ltd, Chairman of the Royal Children’s Hospital Foundation, Chairman of Cymbis Finance Australia Ltd and Director of Softlink International Ltd. Mr Ryan was awarded the Order of Australia in 2004 for his services to the health industry and corporate governance.
During the financial year he attended 2 of the 2 directors’ meetings held since his appointment.
Danny Herceg Non-Executive Director – Appointed 9 March 2007
Mr Herceg is a senior corporate and commercial lawyer with a particular specialisation in capital raisings, mergers and acquisitions, privatisations, restructurings and venture capital.
During the financial year he attended 1 of the 2 directors’ meetings held since his appointment.
Raymond D. Catelan Managing Director – Appointed 3 July 2007; Director - Appointed 18 May 2007
Mr Catelan has had extensive commercial and management experience both in the public and private company environments, particularly in providing property and equipment information services.
During the financial year there were no directors’ meetings held subsequent to his appointment.
Maxwell J. Hofmeister Executive Director – Appointed 20 June 1991
Mr Hofmeister founded the company in 1991, following an extensive involvement with other successful rural products, engineering and manufacturing companies.
During the financial year he attended 11 of the 11 directors’ meetings held and 4 of the 4 audit committee meetings.
Maurice C. Maughan Non Executive Director – Appointed 27 October 2005
Mr Maughan, FCA, has had extensive experience as a former partner in an international chartered accounting firm.
During the financial year he attended 11 of the 11 directors’ meetings held and 4 of the 4 audit committee meetings.
John J.A. Johnson Non Executive Director – Appointed 25 February 1993
Mr Johnson has had extensive marketing and business development experience.
During the financial year he attended 8 of the 9 directors’ meetings held and 4 of the 4 audit committee meetings.
Warren V. Hill Non Executive Director – Appointed 22 September 2003
Mr Hill was appointed Chief Operating Officer of CMI Limited in November 2002 and was responsible for the company’s Australian and New Zealand operations. Mr Hill resigned as Chief Operating Officer on 28 February 2006. The Board granted Mr Hill six months leave of absence effective 1 March 2006.
During the financial year he attended 4 of the 4 directors’ meetings held.
The above named directors held office during and since the end of the financial year except for:
Mr W.V. Hill – resigned 28 November 2006 Mr C.G. Ryan – appointed 28 February 2007 Mr J.J.A. Johnson – resigned 28 February 2007 Mr D. Herceg – appointed 9 March 2007 Mr R.D. Catelan – appointed 18 May 2007 Mr M.J. Hofmeister – resigned 8 June 2007 Mr M.C. Maughan – resigned 2 July 2007
Mr R.D. Catelan and Mr D. Herceg were appointed Directors of BigAir Group Limited in July 2007. The directors do not hold any other listed company directorships.
Details of directors’ shareholdings as at the date of this report:
NameFully Paid Ordinary
SharesPartly Paid Ordinary
SharesFully Paid Class A
SharesExecutive Share
Options
R.D. Catelan as:
RP Prospects Pty Limited as trustee for the M & L Trust 10,274,943 – 964,067 –
Directors’ Report
CMI LIMITED ANNUAL REPORT 2007�6
Company Secretary
Mark D. Laidlaw Joined CMI Limited in 1997 as Chief Financial Officer. He is a former audit manager of international accountancy firm, Deloitte Touche Tohmatsu. He is a member of the Institute of Chartered Accountants in Australia and holds a Bachelor of Commerce (Honours) from the University of Queensland.
Principal Activities
The consolidated entity’s principal activities in the course of the financial year were the manufacture and marketing of precision engineered components, particularly for the automotive industry, the manufacture and marketing of components and parts for 4WD, light commercial and heavy transport vehicles, the manufacture and marketing of specialist cabling and electrical products for a range of industry sectors and the provision of chattel finance to both consumer and commercial borrowers.
Review Of Operations
Consolidated revenue for the year was $265,397 thousand (2006: $278,704 thousand). The consolidated entity’s loss before tax was $5,236 thousand (2006 profit: $15,960 thousand) and the loss after tax was $3,840 thousand (2006 profit: $11,197 thousand). Refer to the Chairman’s Review and the Operational Review for more details.
Changes In State Of Affairs
During the financial year there was no significant change in the state of affairs of the consolidated entity other than that referred to in the financial statements or notes thereto.
Future Developments
Disclosure of information regarding likely developments in the operations of the consolidated entity in future financial years and the expected results of those operations is likely to result in unreasonable prejudice to the consolidated entity. Accordingly, this information has not been included in this report.
Subsequent Events
There has not been any matter or circumstance, other than that referred to above, in the financial statements or notes thereto, that has arisen since the end of the financial year, that has significantly affected, or may significantly affect, the operations of the consolidated entity, the results of those operations, or the state of affairs of the consolidated entity in future financial years.
Environmental Regulations
The consolidated entity’s operations are subject to various environmental regulations governed by State, Federal and Local legislation. The impact on the business is constantly reviewed to ensure it complies with and exhibits best practice within the following areas of environmental regulation: air, water, noise, hazardous chemicals and contaminated land waste.
Appropriate licenses have been obtained where necessary and procedures implemented to ensure that the consolidated entity operates under the conditions imposed by the license or regulation. During the year, no areas of non-compliance were identified.
Dividends
All dividends stated below are whole numbers and are not rounded to the nearest thousand dollars.
In respect of the financial year ended 30 June 2006, as detailed in the directors’ report for that financial year, a final dividend of $912,688 (3.5 cents per share) franked to 100% at 30% corporate income tax rate was paid to the holders of fully paid Class A shares on 4 September 2006.
In respect of the financial year ended 30 June 2006, as detailed in the directors’ report for that financial year, a final dividend of $2,170,510 (6 cents per share) franked to 100% at 30% corporate income tax rate was paid to the holders of fully paid and partly paid ordinary shares on 2 November 2006.
In respect of the financial year ended 30 June 2007, an interim dividend of $912,688 (3.5 cents per share) franked to 100% at 30% corporate income tax rate was paid to the holders of fully paid Class A shares on 4 December 2006.
Directors’ Report

CMI LIMITED ANNUAL REPORT 2007 �7
In respect of the financial year ended 30 June 2007, interim dividends of $980,188 (3.5 cents per share) franked to 100% at 30% corporate income tax rate were paid to the holders of fully paid Class A shares on 2 March 2007 and 4 June 2007.
In respect of the financial year ended 30 June 2007, an interim dividend of $1,012,579 (3 cents per share) franked to 100% at 30% corporate income tax rate was paid to the holders of fully paid ordinary shares on 2 May 2007.
In respect of the financial year ended 30 June 2007, the directors recommend the payment of a final dividend of $980,188 (3.5 cents per share) franked to 100% at 30% corporate income tax rate to the holders of fully paid Class A shares on 3 September 2007.
In respect of the financial year ended 30 June 2007, the directors do not recommend the payment of a final dividend to the holders of fully paid ordinary shares.
Indemnification Of Officers And Auditors
During the financial year, the company paid a premium in respect of a contract insuring the directors of the company (as named above), the company secretary and all executive officers of the company and of any related body corporate against a liability incurred as such a director, secretary or executive officer to the extent permitted by the Corporations Act 2001. The contract of insurance prohibits disclosure of the nature of the liability and the amount of the premium.
The company has not otherwise, during or since the financial year, indemnified or agreed to indemnify an officer or auditor of the company or of any related body corporate against a liability incurred as such an officer or auditor.
Remuneration Report
The remuneration report is set out under the following main headings:
A. Principles used to determine the nature and amount of remuneration
B. Service agreements
C. Details of remuneration
D. Share-based compensation
A. Principles Used to Determine the Nature and Amount of Remuneration
The remuneration committee reviews the remuneration packages of all directors and executives on an annual basis and makes recommendations to the board. Remuneration packages are reviewed and determined with due regard to current market rates and are benchmarked against comparable industry salaries, adjusted by a performance factor to reflect changes in the performance of the company.
The objective of the company’s remuneration reward framework is to ensure reward for performance is competitive and appropriate for the results delivered. The framework aligns reward with achievement of strategic and financial objectives and the creation of wealth for shareholders.
In order to retain and attract executives of sufficient calibre to facilitate the efficient and effective management of the company’s operations, the remuneration committee seeks the advice of external advisers in connection with the structure of remuneration packages.
The overall level of executive reward takes into account the performance of the consolidated entity over a number of years. Over the past five years, the consolidated entity’s profit from ordinary activities after income tax (but prior to the impairment loss) has grown by 87.7%, and total equity has grown by 55.8%. During the same period, directors and executives remuneration (included in part C below) has grown by 130.8%. Refer to the Financial Summary in the 2007 Highlights for more details.
In accordance with the company’s constitution, the total remuneration payable to non-executive directors is not to exceed $390,000 per annum as approved by the shareholders at a general meeting.
One non-executive director received payment upon retirement of three times their annual director fee.
Remuneration packages contain the following key elements:
a) Short-term employee benefits - salary/fees, bonuses and non monetary benefits including the provision of motor vehicles, accommodation and interest not charged on loans provided by the company;
b) Post-employment benefits - including superannuation and prescribed benefits; and
c) Share-based payment – shares issued during the financial year and share options granted under the director and employee share option plans approved by shareholders on 23 August 1999, and
d) Long-term benefits – including long service leave and retirement benefits.
Directors’ Report

CMI LIMITED ANNUAL REPORT 2007�8
Short-term employee benefits – directors and executives listed in part C below are offered a competitive remuneration that comprises the components of base pay and benefits. Base pay for executives is reviewed annually to ensure the executive’s pay is competitive with the market. An executive’s pay is also reviewed on promotion. Specific key management personnel are paid cash bonuses based on performance criteria. The performance criteria used to determine the amount of compensation include revenue, net profit before tax and inventory targets.
Other benefits – executives receive benefits including long service leave and superannuation as required by the laws in the various jurisdictions in which the company operates. In certain circumstances, additional benefits (e.g. travel, car parking and accommodation) may also be provided.
Equity - further details of the employee incentive scheme are disclosed in note 23 to the financial statements.
None of the directors or executives listed in part C below received any profit based or performance based compensation by way of bonus or other compensation.
B. Service Agreements
Directors and executives are employed through contracts for service which contain the following key conditions:
• Reviewed annually on or about 1 September;
• Require a six month notice period; and
• If employment is terminated by the company before the term of the contract expires, the specified director or executive is entitled to a termination payment based on up to two years of the contract, or the remaining contract period, whichever is greater.
C. Details of Remuneration
The directors of the company and the consolidated entity are detailed below as are the five executives who received the highest remuneration for the year ended 30 June 2007:
Directors
C.G. Ryan (appointed 28 February 2007) D. Herceg (appointed 9 March 2007) R.D. Catelan (appointed 18 May 2007) M.J. Hofmeister (resigned 8 June 2007) M.C. Maughan (resigned 2 July 2007) J.J.A. Johnson (resigned 28 February 2007) W.V. Hill (resigned 28 November 2006)
Five highest remunerated executives
P.R. Meurer (Chief Executive – Engineering Division), resigned 16 November 2006 D.J. Gallagher (Manufacturing Manager – Engineering Division) I.C. Whittle (Managing Director – Capitalcorp Finance & Leasing Pty Ltd) M.D. Laidlaw (Chief Financial Officer/Company Secretary) J.L. Heslington (General Manager – Electrical Components Division)
Directors’ Report

CMI LIMITED ANNUAL REPORT 2007 �9
The following tables disclose the remuneration of the directors and five highest remunerated executives of the company and the consolidated entity.
2007
Short-term Employee Benefits Post Employment Benefits Share-based payment
Total $
Salary/Fees
$Bonus
$
Non-monetary
$Other
$Superannuation
$Other
$Shares
$Options
$
C.G. Ryan 53,776 - - - - - - - 53,776
D. Herceg 22,667 - - - 2,040 - - - 24,707
R.D. Catelan - - - - - - - - -
M.J. Hofmeister 1,018,500 - - 241,644 - - - - 1,260,144
J.J.A. Johnson 36,666 - - 8,209 - - - - 44,875
W. V. Hill - - - - - - - - -
M.C. Maughan 89,905 - - - - - - - 89,905
P.R. Meurer 147,791 - - - 33,355 329,047 - - 510,193
D.J. Gallagher 157,586 - 15,000 13,608 103,320 218,866 - - 508,380
I.C. Whittle 300,000 - - 594 - - - - 300,594
M.D. Laidlaw 244,648 - - 19,708 22,019 - - - 286,375
J.L. Heslington 216,333 - 15,000 29,331 19,470 - - - 280,134
Total 2,287,872 - 30,000 313,094 180,204 547,913 - - 3,359,083
2006
Short-term Employee Benefits Post Employment Benefits Share-based payment
Total $
Salary/ Fees
$Bonus
$
Non-monetary
$Other
$Superannuation
$Other
$Shares
$Options
$
M.J. Hofmeister 880,000 - - 89,609 - - 53,584 - 1,023,193
J.J.A. Johnson 55,000 - - 10,654 - - - - 65,654
W. V. Hill 168,314 - - 15,429 - - - - 183,743
M.C. Maughan 34,005 - - - - - - - 34,005
V. Misztowt 345,485 - - 16,394 - - - - 361,879
I.C. Whittle 300,000 - - 609 - - - - 300,609
P.R. Meurer 275,229 - - - 24,771 - - - 300,000
D.J. Gallagher 160,329 - 15,000 13,788 100,296 - - - 289,413
M.D. Laidlaw 207,951 - - 19,070 18,716 - - - 245,737
Total 2,426,313 - 15,000 165,553 143,783 - 53,584 - 2,804,233
(i) Further disclosure is contained in notes 23 and 27 to the financial statements.
D. Share Based Compensation
The Remuneration Committee makes recommendations to the Board regarding the granting of options to directors and executives as part of their remuneration package based on the company’s performance and as an incentive to improve the performance of the company. Options issued to directors require approval by a general meeting of shareholders. Options issued to executives are in accordance with the company’s employee incentive scheme.
Share Options Granted to Key Management Personnel
No options were granted to directors or executives during and since the end of the financial year.
Directors’ Report

CMI LIMITED ANNUAL REPORT 200720
Share Options Exercised During the Year
On 20 December 2006, 1,000,000 fully paid ordinary shares were issued to Mr M.J. Hofmeister pursuant to the exercise of unquoted options.
Share Options Lapsed During the Year
200,000 share options lapsed during the financial year.
The Percentage of Remuneration Consisting of Options During the Year
As no options were issued during the year, the percentage of remuneration consisting of options for directors and for the five highest remunerated executives during the year was zero.
Share Options on Issue to Directors and the Five Highest Remunerated Executives
The following options were on issue at year end:
Individual Issuing EntityNumber of Shares
Under Option Class of Share Exercise PriceExpiry Date of
Options
M.D. Laidlaw CMI Limited 100,000 Ordinary $2.22 28/10/09
J.L. Heslington CMI Limited 10,000 Ordinary $2.22 27/4/09
Employee Incentive Scheme
In accordance with the provisions of the employee incentive scheme, as at the date of this report, employees are entitled to purchase an aggregate of 42,500 ordinary shares of CMI Limited at an issue price of $2.22 per ordinary share during the period of 5 years after 27 April 2004 and 100,000 ordinary shares of CMI Limited at an issue price of $2.22 per ordinary share during the period of 5 years after 29 October 2004.
Further details of the employee incentive scheme are disclosed in note 23 to the financial statements.
Non-audit Services
The directors are satisfied that the provision of non-audit services, during the year, by the auditor (or by another person or firm on the auditor’s behalf) is compatible with the general standard of independence for auditors imposed by the Corporations Act 2001. Details of amounts paid or payable for non-audit services provided during the year by the auditor are outlined in note 25 to the financial statements.
Independence Declaration By Auditors
The auditor’s independence declaration is included on page 21.
Rounding Off Of Amounts
The company is a company of the kind referred to in ASIC Class Order 98/0100, dated 10 July 1998, and in accordance with that Class Order amounts in the directors’ report and the financial report have been rounded off to the nearest thousand dollars, unless otherwise stated.
Signed in accordance with a resolution of the directors made pursuant to section 298(2) of the Corporations Act 2001.
On behalf of the Directors
C.G. RyanChairman
R.D. CatelanDirector
BRISBANE
Dated: 12 September 2007
Directors’ Report

CMI LIMITED ANNUAL REPORT 2007 2�

CMI LIMITED ANNUAL REPORT 200722

CMI LIMITED ANNUAL REPORT 2007 23

CMI LIMITED ANNUAL REPORT 200724
The directors declare that:
a) In the directors’ opinion, there are reasonable grounds to believe that the company will be able to pay its debts as and when they become due and payable;
b) In the directors’ opinion, the attached financial statements and notes thereto are in accordance with the Corporations Act 2001, including compliance with accounting standards and giving a true and fair view of the financial position and performance of the company and the consolidated entity; and
c) The directors have been given the declarations required by section 295A of the Corporations Act 2001.
At the date of this declaration the company is within the class of companies affected by ASIC Class Order 98/1418. The nature of the deed of cross guarantee is such that each company which is party to the deed guarantees to each creditor payment in full of any debt in accordance with the deed of cross guarantee.
In the directors’ opinion, there are reasonable grounds to believe that the company and the companies to which the ASIC Class Order applies, as detailed in Note 28 to the financial statements, will as a group, be able to meet any obligations or liabilities to which they are, or may become, subject by virtue of the deed of cross guarantee.
Signed in accordance with a resolution of the directors made pursuant to section 295(5) of the Corporations Act 2001.
On behalf of the Directors
C.G. Ryan
Chairman
R.D. Catelan
Director
BRISBANE
Dated: 12 September 2007
Directors’ DeclarationFOR THE FINANCIAL YEAR ENDED 30 JUNE 2007

CMI LIMITED ANNUAL REPORT 2007 25
NOTE CONSOLIDATED COMPANY
2007 2006 2007 2006 $’000 $’000 $’000 $’000
Revenue 2 265,397 278,704 10,226 10,549
Other income 2 2,701 2,416 3 3
Changes in inventories (1,476) (4,679) - -
Raw materials expense (116,518) (112,415) - -
Sub-contractors expense (7,537) (14,122) - -
Employee benefits expense (79,906) (84,250) (218) (93)
Repairs, maintenance and consumables expense (9,458) (10,530) - -
ASX and share register expense (215) (219) (215) (219)
Occupancy expense (11,810) (11,410) (86) (318)
Travel and communication expense (4,272) (4,002) - -
Freight and cartage expense (5,546) (5,589) - -
Depreciation and amortisation expense (7,379) (7,730) - -
Finance costs (4,397) (4,060) - -
Impairment of non-current assets (18,601) - - -
Other expenses (6,219) (6,154) - (4)
Profit/(Loss) before income tax 2 (5,236) 15,960 9,710 9,918
Income tax 3 1,396 (4,763) (2,711) (2,831)
Profit/(Loss) from continuing operations (3,840) 11,197 6,999 7,087
Profit/(Loss) attributable to members of the parent entity (3,840) 11,197 6,999 7,087
Earnings per share:
Basic (cents per share) 21 (21.61) 23.45
Diluted (cents per share) 21 (21.61) 23.09
Notes to the financial statements are included on pages 30 to 79.
Income StatementFOR THE FINANCIAL YEAR ENDED 30 JUNE 2007

CMI LIMITED ANNUAL REPORT 200726
NOTE CONSOLIDATED COMPANY
2007 2006 2007 2006 $’000 $’000 $’000 $’000
CURRENT ASSETS
Cash and cash equivalents 4,724 3,461 - -
Trade and other receivables 4 56,868 55,267 21,763 21,037
Inventories 5 43,645 42,337 - -
Current tax assets 3 1,189 - 1,171 -
106,426 101,065 22,934 21,037
Non-current assets classified as held for sale 34 1,032 - - -
TOTAL CURRENT ASSETS 107,458 101,065 22,934 21,037
NON-CURRENT ASSETS
Trade and other receivables 6 - 100 25,000 25,000
Other financial assets 7 - - 29,198 29,151
Property, plant and equipment 8 43,354 61,876 - -
Goodwill 9 10,176 6,309 - -
Other intangible assets 10 22,351 24,215 - -
Deferred tax assets 3 212 209 74 161
TOTAL NON-CURRENT ASSETS 76,093 92,709 54,272 54,312
TOTAL ASSETS 183,551 193,774 77,206 75,349
CURRENT LIABILITIES
Trade and other payables 11 31,798 32,872 - 165
Borrowings 12 52,295 7,610 7,069 6,616
Current tax payables 3 - 406 - 445
Provisions 13 7,289 11,746 - -
TOTAL CURRENT LIABILITIES 91,382 52,634 7,069 7,226
NON-CURRENT LIABILITIES
Borrowings 14 6,008 45,325 - -
Deferred tax liabilities 3 1,231 5,625 - -
Provisions 15 5,415 2,205 - -
TOTAL NON-CURRENT LIABILITIES 12,654 53,155 -
TOTAL LIABILITIES 104,036 105,789 7,069 7,226
NET ASSETS 79,515 87,985 70,137 68,123
EQUITY
Issued capital 18 70,103 67,999 70,103 67,999
Reserves 19 91 (144) - 120
Retained earnings 20 9,321 20,130 34 4
TOTAL EQUITY 79,515 87,985 70,137 68,123
Notes to the financial statements are included on pages 30 to 79.
Balance SheetAS AT 30 JUNE 2007

CMI LIMITED ANNUAL REPORT 2007 27
NOTE CONSOLIDATED
Issued Capital Reserves Retained Earnings Total Equity $’000 $’000 $’000 $’000
At 1 July 2005 68,067 223 16,006 84,296
Adjustment on adoption of AASB 132 and AASB 139 1(u) (20,401) - - (20,401)
Adjustment on conversion of convertible preference shares to Class A shares 1(u) 20,401 - - 20,401
Translation of foreign operations: Exchange differences taken to equity - (420) - (420)
Net Income Recognised Directly in Equity - (420) - (420) Profit for the period - - 11,197 11,197
Total Recognised Income and Expense for the Period - (420) 11,197 10,777
Transactions with equity holders in their capacity as equity holders:
Contributions of equity - - - -
Share buy-back (68) - - (68)
Employee equity-settled benefits - 53 - 53 Dividends provided for or paid - - (7,073) (7,073)
At 1 July 2006 67,999 (144) 20,130 87,985
Translation of foreign operations: Exchange differences taken to equity - 355 - 355
Net Income Recognised Directly in Equity - 355 - 355 Profit/(Loss) for the period - - (3,840) (3,840)
Total Recognised Income and Expense for the Period - 355 (3,840) (3,485)
Transactions with equity holders in their capacity as equity holders:
Contributions of equity – ordinary shares 4,350 - - 4,350
Contributions of equity – Class A shares 2,063 - - 2,063
Ordinary share buy-back (3,954) - - (3,954)
Equity adjustment on share buy-back (424) - - (424)
Ordinary share buy-back costs (98) - - (98)
Employee equity-settled benefits - 47 - 47
Employee equity-settled benefits reserve transferred to issued capital 167 (167) - -
Dividends provided for or paid - - (6,969) (6,969)
At 30 June 2007 70,103 91 9,321 79,515
Notes to the financial statements are included on pages 30 to 79.
Statement of Changes in EquityFOR THE FINANCIAL YEAR ENDED 30 JUNE 2007

CMI LIMITED ANNUAL REPORT 200728
NOTE COMPANY
Issued Capital Reserves Retained Earnings Total Equity $’000 $’000 $’000 $’000
At 1 July 2005 68,067 67 (10) 68,124
Adjustment on adoption of AASB 132 and AASB 139 1(u) (20,401) - - (20,401)
Adjustment on conversion of convertible preference shares to Class A shares 1(u) 20,401 - - 20,401
Profit for the period - - 7,087 7,087
Total Recognised Income and Expense for the Period - - 7,087 7,087
Transactions with equity holders in their capacity as equity holders:
Contributions of equity - - - -
Share buy-back (68) - - (68)
Employee equity-settled benefits - 53 - 53
Dividends provided for or paid - - (7,073) (7,073)
At 1 July 2006 67,999 120 4 68,123
Profit for the period - - 6,999 6,999
Total Recognised Income and Expense for the Period - - 6,999 6,999
Transactions with equity holders in their capacity as equity holders:
Contributions of equity – ordinary shares 4,350 - - 4,350
Contributions of equity – Class A shares 2,063 - - 2,063
Ordinary share buy-back (3,954) - - (3,954)
Equity adjustment on share buy-back (424) - - (424)
Ordinary share buy-back costs (98) - - (98)
Employee equity-settled benefits - 47 - 47
Employee equity-settled benefits reserve transferred to issued capital 167 (167) - -
Dividends provided for or paid - - (6,969) (6,969)
At 30 June 2007 70,103 - 34 70,137
Notes to the financial statements are included on pages 30 to 79.
Statement of Changes in EquityFOR THE FINANCIAL YEAR ENDED 30 JUNE 2007

CMI LIMITED ANNUAL REPORT 2007 29
NOTE CONSOLIDATED COMPANY
2007 2006 2007 2006 $’000 $’000 $’000 $’000 Inflow Inflow Inflow Inflow (Outflow) (Outflow) (Outflow) (Outflow)
Cash flows from operating activities:
Receipts from customers 292,496 316,688 - -
Payments to suppliers and employees (269,509) (282,148) - -
Interest paid (3,862) (3,284) - -
Dividends received - - 523 481
Income tax paid (4,374) (6,996) (4,342) (6,814)
Net cash provided by/(used in) operating activities 30(b) 14,751 24,260 (3,819) (6,333)
Cash flows from investing activities:
Interest received 254 278 - -
Payment for intangible assets - (188) - -
Payment for deferred expenditure (1,313) (1,337) - -
Amounts received from/(advanced) to related parties 4,450 - 13,239 14,384
Payment for plant and equipment (2,702) (3,190) - -
Payment for purchase of businesses 30(c) (8,808) (1,297) - -
Proceeds from sale of plant and equipment 2,001 92 3 3
Net cash (used in)/provided by investing activities (6,118) (5,642) 13,242 14,387
Cash flows from financing activities:
Proceeds from issue of equity securities - - - -
Share issue expenses (140) - (140) -
Payment for share buy-back (2,314) (68) (2,314) (68)
Dividends paid (6,969) (7,986) (6,969) (7,986)
Proceeds from borrowings 8,000 - - -
Repayment of borrowings (6,010) (10,452) - -
Net cash provided by/(used in) financing activities (7,433) (18,506) (9,423) (8,054)
Net increase/(decrease) in cash and cash equivalents held 1,200 112 - -
Cash and cash equivalents at the beginning of the financial year 3,433 3,336 - -
Effect of exchange rate changes on the balance of cash held in foreign currencies 29 (15) - -
Cash and cash equivalents at the end of the financial year 30(a) 4,662 3,433 - -
Notes to and forming part of the financial statements are included on pages 30 to 79.
Cash Flow StatementFOR THE FINANCIAL YEAR ENDED 30 JUNE 2007

CMI LIMITED ANNUAL REPORT 200730
1. SUMMARY OF ACCOUNTING POLICIES
Statement of Compliance
The financial report is a general purpose financial report which has been prepared in accordance with the Corporations Act 2001, Accounting Standards and Interpretations, and complies with other requirements of the law. The financial report includes the separate financial statements of the company and the consolidated financial statements of the Group. Accounting Standards include Australian equivalents to International Financial Reporting Standards (‘A-IFRS’). Compliance with the A-IFRS ensures that the financial statements and notes of the company and the Group comply with International Financial Reporting Standards (‘IFRS’). The parent entity financial statements and notes also comply with IFRS except for the disclosure requirements in IAS 32 Financial Instruments: Disclosure and Presentation as the Australian equivalent Accounting Standard, AASB 132 Financial Instruments: Disclosure and Presentation does not require such disclosures to be presented by the parent entity where its separate financial statements are presented together with the consolidated financial statements of the consolidated entity.
The financial statements were authorised for issue by the directors on 12 September 2007.
Basis of Preparation
The financial report has been prepared on the basis of historical cost. Cost is based on the fair values of the consideration given in exchange for assets. All amounts are presented in Australian dollars, unless otherwise noted.
The company is a company of the kind referred to in ASIC Class Order 98/0100, dated 10 July 1998, and in accordance with that Class Order amounts in the directors’ report and the financial report have been rounded off to the nearest thousand dollars, unless otherwise stated.
In the application of CMI Limited (“Group”) accounting policies, management is required to make judgments, estimates and assumptions about carrying values of assets and liabilities that are not readily apparent from other sources. The estimates and associated assumptions are based on historical experience and various other factors that are believed to be reasonable under the circumstance, the results of which form the basis of making the judgments. Actual results may differ from these estimates. The estimates and underlying assumptions are reviewed on an ongoing basis. Revisions to accounting estimates are recognized in the period in which the estimate is revised if the revision only affects that period, or in the period of the revision and future periods if the revision affects both current and future periods.
Judgments made by management in the application of the Group’s accounting policies that have significant effects on the financial statements and estimates with a significant risk of material adjustments in the next year are disclosed, where applicable, in the relevant notes to the financial statements.
Accounting policies are selected and applied in a manner which ensures that the resulting financial information satisfies the concepts of relevance and reliability, thereby ensuring that the substance of the underlying transactions or other events is reported.
The following significant accounting policies have been adopted in the preparation and presentation of the financial report.
Significant Accounting Policies
a) Borrowings
Borrowings are recorded initially at fair value, net of transaction costs. Subsequent to initial recognition, borrowings are measured at amortised cost with any difference between the initial recognised amount and the redemption value being recognised in profit and loss over the period of the borrowing using the effective interest rate method.
All bank debt is disclosed as current at 30 June 2007 as the majority of the bank facilities expire on 31 October 2007. The company is currently negotiating with the bank to extend these facilities.
b) Borrowing Costs
Borrowing costs directly attributable to qualifying assets are capitalised and amortised over the life of the asset.
c) Cash and Cash Equivalents
Cash and cash equivalents comprise cash on hand, cash in banks and investments in money market instruments, net of outstanding bank overdrafts. Bank overdrafts are shown within borrowings in current liabilities in the balance sheet.
d) Employee Benefits
Provision is made for benefits accruing to employees in respect of wages and salaries, annual leave, long service leave and sick leave when it is probable that settlement will be required and they are capable of being measured reliably.
Provisions made in respect of employee benefits expected to be settled within 12 months, are measured at their nominal values using the remuneration rate expected to apply at the time of settlement.
Provisions made in respect of employee benefits which are not expected to be settled within 12 months are measured as the present value of the estimated future cash outflows to be made by the consolidated entity in respect of services provided by employees up to the reporting date.
Notes to the Financial StatementsFOR THE FINANCIAL YEAR ENDED 30 JUNE 2007

CMI LIMITED ANNUAL REPORT 2007 3�
1. SUMMARY OF ACCOUNTING POLICIES (continued)
Contributions to defined contribution superannuation plans are expensed when incurred.
e) Financial Assets
Subsequent to initial recognition, investments in subsidiaries are measured at cost.
Other financial assets are classified into the following specified categories: financial assets at fair value through profit or loss, held-to-maturity investments, available-for-sale financial assets, and loans and receivables. The classification depends on the nature and purpose of the financial assets and is determined at the time of the initial recognition.
Loansandreceivables
Trade receivables, loans and other receivables are recorded at amortised cost less impairment.
f) Financial Instruments Issued by the Company
DebtandEquityInstruments
Debt and equity instruments are classified as either liabilities or as equity in accordance with the substance of the contractual arrangement.
CompoundInstruments
The component parts of compound instruments are classified separately as liabilities and equity in accordance with the substance of the contractual arrangement. At the date of issue, the fair value of the liability component is estimated using the prevailing market interest rate for a similar non-convertible debt. The equity component initially brought to account is determined by deducting the amount of the liability component from the amount of the compound instrument as a whole.
TransactionCostsontheIssueofEquityInstruments
Transaction costs arising on the issue of equity instruments are recognised directly in equity as a reduction of the proceeds of the equity instruments to which the costs relate. Transaction costs are the costs that are incurred directly in connection with the issue of those equity instruments and which would not have been incurred had those instruments not been issued.
InterestandDividends
Interest and dividends are classified as expenses or as distributions of profit consistent with the balance sheet classification of the related debt or equity instruments.
g) Foreign Currency
Foreigncurrencytransactions
All foreign currency transactions during the year are brought to account using the exchange rate in effect at the date of the transaction. Foreign currency monetary items at reporting date are translated at the exchange rate existing at that date. Non-monetary assets and liabilities carried at fair value that are denominated in foreign currencies are translated at the rates prevailing at the date when the fair value was determined.
Exchange differences are recognised in net profit or loss in the period in which they arise.
Foreignoperations
On consolidation, the assets and liabilities of the consolidated entity’s overseas operations are translated at exchange rates prevailing at the reporting date. Income and expense items are translated at the average exchange rates for the period unless exchange rates fluctuate significantly. Exchange differences arising, if any, are recognised in the foreign currency translation reserve, and recognised in profit or loss on disposal of the foreign operation.
h) Goods and Services Tax
Revenues, expenses and assets are recognised net of the amount of goods and services tax (GST), except:
i) where the amount of GST incurred is not recoverable from the taxation authority, it is recognised as part of the cost of acquisition of an asset or as part of an item of expense; or
ii) for receivables and payables which are recognised inclusive of GST.
The net amount of GST recoverable from, or payable to, the taxation authority is included as part of receivables or payables.
Cash flows are included in the statement of cash flows on a gross basis. The GST component of cash flows arising from investing and financing activities which is recoverable from, or payable to, the taxation authority is classified as operating cash flows.
Notes to the Financial StatementsFOR THE FINANCIAL YEAR ENDED 30 JUNE 2007

CMI LIMITED ANNUAL REPORT 200732
1. SUMMARY OF ACCOUNTING POLICIES (continued)
i) Goodwill
Goodwill, representing the excess of the cost of acquisition over the fair value of the identifiable assets, liabilities and contingent liabilities acquired, is recognised as an asset and not amortised, but tested for impairment annually and whenever there is an indication that the goodwill may be impaired. Any impairment is recognised immediately in profit and loss and is not subsequently reversed. Refer to note 1(j).
j) Impairment of Assets
At each reporting date, the consolidated entity reviews the carrying amounts of its tangible and intangible assets to determine whether there is any indication that those assets have suffered an impairment loss. If any such indication exists, the recoverable amount of the asset is estimated in order to determine the extent of the impairment loss (if any). Where the asset does not generate cash flows that are independent from other assets, the consolidated entity estimates the recoverable amount of the cash-generating unit to which the asset belongs.
Goodwill, intangible assets with indefinite useful lives and intangible assets not yet available for use are tested for impairment annually and whenever there is an indication that the asset may be impaired. An impairment of goodwill is not subsequently reversed. Recoverable amount is the higher of fair value less costs to sell and value in use. In assessing value in use, the estimated future cash flows are discounted to their present value using a pre-tax discount rate that reflects current market assessments of the time value of money and the risks specific to the asset for which the estimates of future cash flows have not been adjusted.
If the recoverable amount of an asset (or cash-generating unit) is estimated to be less than its carrying amount, the carrying amount of the asset (cash-generating unit) is reduced to its recoverable amount. An impairment loss is recognised in profit or loss immediately, unless the relevant asset is carried at fair value, in which case the impairment loss is treated as a revaluation decrease.
Where an impairment loss subsequently reverses, the carrying amount of the asset (cash-generating unit) is increased to the revised estimate of its recoverable amount, but only to the extent that the increased carrying amount does not exceed the carrying amount that would have been determined had no impairment loss been recognised for the asset (cash-generating unit) in prior years. A reversal of an impairment loss is recognised in profit or loss immediately, unless the relevant asset is carried at fair value, in which case the reversal of the impairment loss is treated as a revaluation increase.
k) Income Tax
CurrentTax
Current tax is calculated by reference to the amount of income taxes payable or recoverable in respect of the taxable profit or tax loss for the period. It is calculated using tax rates and tax laws that have been enacted or substantively enacted by reporting date. Current tax for current and prior periods is recognised as a liability (or asset) to the extent that it is unpaid (or refundable).
DeferredTax
Deferred tax is accounted for using the comprehensive balance sheet liability method in respect of temporary differences arising from differences between the carrying amount of assets and liabilities in the financial statements and the corresponding tax base of those items.
In principle, deferred tax liabilities are recognised for all taxable temporary differences. Deferred tax assets are recognised to the extent that it is probable that sufficient taxable amounts will be available against which deductible temporary differences or unused tax losses and tax offsets can be utilised. However, deferred tax assets and liabilities are not recognised if the temporary differences giving rise to them arise from the initial recognition of assets and liabilities (other than as a result of a business combination) which affects neither taxable income nor accounting profit. Furthermore, a deferred tax liability is not recognised in relation to taxable temporary differences arising from goodwill.
Deferred tax liabilities are recognised for taxable temporary differences arising on investments in subsidiaries, branches, associates and joint ventures except where the consolidated entity is able to control the reversal of the temporary differences and it is probable that the temporary differences will not reverse in the foreseeable future. Deferred tax assets arising from deductible temporary differences associated with these investments and interests are only recognised to the extent that it is probable that there will be sufficient taxable profits against which to utilise the benefits of the temporary differences and they are expected to reverse in the foreseeable future.
Deferred tax assets and liabilities are measured at the tax rates that are expected to apply to the period(s) when the asset and liability give rise to them are realised or settled, based on tax rates (and tax laws) that have been enacted or substantively enacted by reporting date. The measurement of deferred tax liabilities and assets reflects the tax consequences that would follow from the manner in which the consolidated entity expects, at the reporting date, to recover or settle the carrying amount of its assets and liabilities.
Notes to the Financial StatementsFOR THE FINANCIAL YEAR ENDED 30 JUNE 2007

CMI LIMITED ANNUAL REPORT 2007 33
1. SUMMARY OF ACCOUNTING POLICIES (continued)
Deferred tax assets and liabilities are offset when they relate to income taxes levied by the same taxation authority and the consolidated entity intends to settle its current tax assets and liabilities on a net basis.
CurrentandDeferredTaxforthePeriod
Current and deferred tax is recognised as an expense or income in the income statement, except when it relates to items credited or debited directly to equity, in which case the deferred tax is also recognised directly in equity, or where it arises from the initial accounting for a business combination, in which case it is taken into account in the determination of goodwill or excess.
TaxConsolidation
The company and all its wholly-owned Australian resident entities are part of a tax-consolidated group under Australian taxation law. CMI Limited is the head entity in the tax-consolidated group.
Entities within the tax-consolidated group have entered into a tax funding agreement with the head entity. Under the terms of the tax funding agreement, CMI Limited and each of the entities in the tax-consolidated group has agreed to pay a tax equivalent payment to or from the head entity, based on the current tax liability or current tax asset of the entity.
The current and deferred tax assets and liabilities of the parent entity are not reduced by the amounts owing from or to subsidiary entities in accordance with the tax funding agreement as these amounts are recognised as inter-company receivables and payables.
Entities within the tax-consolidated group have adopted the stand alone approach to measuring current and deferred tax amounts.
l) Intangible Assets
Brandnames
Brandnames are recorded at cost and amortised on a straight line basis over a period of 40 years. Other intangible assets are amortised over a period not exceeding 20 years.
ResearchandDevelopmentCosts
Expenditure on research activities is recognised as an expense in the period in which it is incurred. Where no internally-generated intangible asset can be recognised, development expenditure is recognised as an expense in the period as incurred.
An intangible asset arising from development (or from the development phase of an internal project) is recognised if, and only if, all of the following are demonstrated:
• the technical feasibility of completing the intangible asset so that it will be available for use or sale;
• the intention to complete the intangible asset and use or sell it;
• the ability to use or sell the intangible asset;
• how the intangible asset will generate probable future economic benefits;
• the availability of adequate technical, financial and other resources to complete the development and to use or sell the intangible asset; and
• the ability to measure reliably the expenditure attributable to the intangible asset during its development.
Internally-generated intangible assets are stated at cost less accumulated amortised and impairment, and are amortised on a straight-line basis over the period in which the corresponding benefits are expected to arise, commencing with the commercial production of the product.
The unamortised balance of development costs deferred in previous periods is reviewed regularly and at each reporting date, to ensure the criterion for deferral continues to be met. Where such costs are no longer considered recoverable, they are written-off as an expense in net profit or loss.
m) Inventories
Inventories are valued at the lower of cost and net realisable value. Costs, including an appropriate portion of fixed and variable overhead expenses, are assigned to inventory on hand by the method most appropriate to each particular class of inventory, with the majority being valued on a first in first out basis. Net realisable value represents the estimated selling price less all estimated costs of completion and costs to be incurred in marketing, selling and distribution.
Notes to the Financial StatementsFOR THE FINANCIAL YEAR ENDED 30 JUNE 2007

CMI LIMITED ANNUAL REPORT 200734
1. SUMMARY OF ACCOUNTING POLICIES (continued)
n) Leased Assets
Leases are classified as finance leases whenever the terms of the lease transfer substantially all the risks and rewards of ownership to the lessee. All other leases are classified as operating leases.
Assets held under finance leases are initially recognised at their fair value or, if lower, at amounts equal to the present value of the minimum lease payments, each determined at the inception of the lease. The corresponding liability to the lessor is included in the balance sheet as a finance lease obligation.
Lease payments are apportioned between finance charges and reduction of the lease obligation so as to achieve a constant rate of interest on the remaining balance of the liability. Finance charges are charged directly to income, unless they are directly attributable to qualifying assets, in which case they are capitalised in accordance with the consolidated entity’s general policy on borrowing costs. Refer to note 1(b).
Finance leased assets are amortised on a straight line basis over the estimated useful life of the asset.
Operating lease payments are recognised as an expense on a straight-line basis over the lease term, except where another systematic basis is more representative of the time pattern in which economic benefits from the leased asset are consumed.
o) Payables
Trade payables and other accounts payable are recognised when the consolidated entity becomes obliged to make future payments resulting from the purchase of goods and services.
p) Principles of Consolidation
The consolidated financial statements have been prepared by combining the financial statements of all the entities that comprise the consolidated entity, being the company (the parent entity) and its subsidiaries as defined in Accounting Standard AASB 127 Consolidated and Separate Financial Statements. Consistent accounting policies have been employed in the preparation and presentation of the consolidated financial statements.
On acquisition, the assets, liabilities and contingent liabilities of a subsidiary are measured at their fair values at the date of acquisition. Any excess of the cost of acquisition over the fair values of the identifiable net assets acquired is recognised as goodwill. If, after reassessment, the fair values of the identifiable net assets acquired exceeds the cost of acquisition, the deficiency is credited to profit and loss in the period of acquisition.
The consolidated financial statements include the information and results of each subsidiary from the date on which the company obtains control and until such time as the company ceases to control such entity. In preparing the consolidated financial statements, all intercompany balances and transactions, and unrealised profits arising within the consolidated entity are eliminated in full.
q) Property, Plant and Equipment
Land and buildings, plant and equipment, leasehold improvements and equipment under finance lease are stated at cost less accumulated depreciation and impairment. Cost includes expenditure that is directly attributable to the acquisition of the item.
Depreciation is provided on property, plant and equipment, including freehold buildings but excluding land. Depreciation is calculated on a straight line basis so as to write off the net cost of each asset during its expected useful life to its estimated residual value. Leasehold improvements are depreciated over the period of the lease or estimated useful life, whichever is the shorter, using the straight line method. The estimated useful lives, residual values and depreciation method are reviewed at the end of each annual reporting period. The following estimated useful lives are used in the calculation of depreciation:
• Buildings 25 – 50 years
• Plant and equipment 3 – 20 years
• Equipment under finance leases 3 – 20 years
r) Provisions
Provisions are recognised when the consolidated entity has a present obligation, the future sacrifice of economic benefits is probable, and the amount of the provision can be measured reliably.
The amount recognised as a provision is the best estimate of the consideration required to settle the present obligation at reporting date, taking into account the risks and uncertainties surrounding the obligation. Where a provision is measured using the cashflows estimated to settle the present obligation, its carrying amount is the present value of those cashflows.
Notes to the Financial StatementsFOR THE FINANCIAL YEAR ENDED 30 JUNE 2007

CMI LIMITED ANNUAL REPORT 2007 35
1. SUMMARY OF ACCOUNTING POLICIES (continued)
When some or all of the economic benefits required to settle a provision are expected to be recovered from a third party, the receivable is recognised as an asset if it is probable that recovery will be received and the amount of the receivable can be measured reliably.
Dividends
A provision is recognised for dividends when they have been declared, determined or publicly recommended by the directors on or before reporting date.
Rebates
A provision for rebates is recognised when future rebates are expected to be claimed by insurance and finance providers on previously paid commissions due to cancellation of contracts.
s) Revenue Recognition
Saleofgoodsanddisposalofassets
Revenue from the sale of goods is recognised when the consolidated entity has transferred to the buyer the significant risks and rewards of ownership of the goods.
Renderingofservices
Revenue from services provided is recognised upon the delivery of the service to the customer.
t) Tooling
Material items of expenditure, relating to tooling, are capitalised into plant and equipment to the extent that there will be future economic benefits.
The capitalised costs are amortised over the expected period (not exceeding 15 years) in which the corresponding benefits are expected to arise. The amortised balance of costs capitalised is reviewed regularly and at each balance date, to ensure the criterion for capitalisation continues to be met. Where such costs are no longer considered recoverable, they are recognised in net profit or loss.
u) 1 July 2005 – Financial Instruments
In the prior year, the consolidated entity elected not to restate information for the year ended 30 June 2005 for financial instruments within the scope of Accounting Standards AASB 132 Financial Instruments: Disclosure and Presentation and AASB 139 Financial Instruments: Recognition and Measurement, as permitted on the first-time adoption of A-IFRS. The effect of changes in the accounting policies for financial instruments on the balance sheet as at 1 July 2005 is explained below.
The convertible preference shares are assessed to contain both equity and debt characteristics. At 1 July 2005, the date of applying AASB 132 and AASB 139, the total value of the convertible preference shares has been allocated between debt and equity. The value of the convertible preference shares at this date was $31,036 thousand. On 1 July 2005 non-current financial liabilities were increased by $20,401 thousand and issued capital was reduced by $20,401 thousand.
On 27 September 2005, shareholders approved the conversion of the convertible preference shares to ‘Class A Shares’. The effect of this conversion was to enable the liability component to be reclassified as equity.
There was no impact on the income statement as no convertible preference share dividends were declared between 1 July 2005 and 27 September 2005, and there was no gain or loss on the conversion.
v) Adoption of new and revised Accounting Standards
The Australian Accounting Standards Board (‘AASB’) released AASB 2005-9 ‘Amendments to Australian Accounting Standards’ in September 2005. AASB 2005-9 amends AASB 139 ‘Financial Instruments: Recognition and Measurement’ to require certain financial guarantee contracts to be recognised in accordance with AASB 139, and to be subsequently measured at the higher of the best estimate of the expenditure required to settle the obligation and the amount initially recognised less, where appropriate, cumulative amortisation.
The changes introduced by AASB 2005-9 are applied by CMI Limited with effect from the beginning of the comparative reporting period presented in this financial report (i.e. with effect from 1 July 2005). CMI Limited is party to a number of financial guarantee contracts whereby the company has provided financial guarantees to related parties external to the CMI Limited group. The application of these amendments does not result in financial guarantee contracts being recognised at 30 June 2007.
Notes to the Financial StatementsFOR THE FINANCIAL YEAR ENDED 30 JUNE 2007

CMI LIMITED ANNUAL REPORT 200736
1. SUMMARY OF ACCOUNTING POLICIES (continued)
w) Standards and Interpretations in issue not yet adopted
At the date of authorisation of the financial report, a number of Standards and Interpretations were in issue but not yet effective.
Initial application of the following Standards will not affect any of the amounts recognised in the financial report, but will change the disclosures presently made in relation to the consolidated entity’s and the company’s financial report:
Standard
Effective for annual reporting periods beginning
on or after
Expected to be initially applied in the
financial year ending
AASB 7 ‘Financial Instruments: Disclosures’ and consequential amendments to other accounting standards resulting from its issue 1 January 2007 30 June 2008
AASB 101 ‘Presentation of Financial Statements’ – revised standard 1 January 2007 30 June 2008
AASB 2007-7 ‘Amendments to Australian Accounting Standards’ 1 July 2007 30 June 2008
AASB 8 ‘Operating Segments’ 1 January 2009 30 June 2010
Initial application of the following Standards and Interpretations is not expected to have any material impact to the financial report of the consolidated entity and the company:
Standard/Interpretation
Effective for annual reporting periods beginning
on or after
Expected to be initially applied in the
financial year ending
AASB Interpretation 10 ‘Interim Financial Reporting and Impairment’ 1 November 2006 30 June 2008
AASB Interpretation 11 ‘AASB 2 – Group and Treasury Share Transactions’ 1 March 2007 30 June 2008
AASB 2007-1 ‘Amendments to Australian Accounting Standards arising from AASB Interpretation 11’ 1 March 2007 30 June 2008
AASB Interpretation 12 ‘Service Concession Arrangements’ 1 January 2008 30 June 2009
AASB 2007-2 ‘Amendments to Australian Accounting Standards arising from AASB Interpretation 12’ 1 January 2008 30 June 2009
AASB 2007-4 ‘Amendments to Australian Accounting Standards arising from ED 151 and Other Amendments’ 1 July 2007 30 June 2008
AASB Interpretation 13 ‘Customer Loyalty Programmes’ 1 July 2008 30 June 2009
AASB Interpretation 14 ‘AASB 119 – The Limit on a Defined Benefit Asset, Minimum Funding Requirements and their Interaction’ 1 January 2008 30 June 2009
AASB 123 ‘Borrowing Costs’ – revised standard 1 January 2009 30 June 2010
AASB 2007-6 ‘Amendments to Australian Accounting Standards arising from AASB 123’ 1 January 2009 30 June 2010
x) Non-current assets held for sale
Non-current assets classified as held for sale are measured at the lower of carrying amount and fair value less costs to sell. Non-current assets are classified as held for sale if their carrying amount will be recovered principally through a sale transaction rather than through continuing use. This condition is regarded as met only when the asset is available for immediate sale in its present condition subject only to terms that are usual and customary for such a sale and the sale is highly probable. The sale of the asset must be expected to be completed within one year from the date of classification, except in the circumstances where sale is delayed by events or circumstances outside the Group’s control and the Group remains committed to a sale.
Notes to the Financial StatementsFOR THE FINANCIAL YEAR ENDED 30 JUNE 2007

CMI LIMITED ANNUAL REPORT 2007 37
CONSOLIDATED COMPANY
2007 2006 2007 2006 $’000 $’000 $’000 $’000
2. PROFIT FROM OPERATIONS
(a) Revenue from continuing operations
Revenue from operations consisted of the following items:
Revenue from the sales of goods 236,597 246,597 - -
Revenue from the rendering of services 25,846 29,123 - -
Interest - other persons 254 280 - -
Management fee – subsidiaries - - 9,554 10,068
Dividend – subsidiaries - - 672 481
Other Items 2,700 2,704 - -
265,397 278,704 10,226 10,549
(b) Profit before income tax
Profit before income tax has been arrived at
after crediting/(charging) the following gains and losses from continuing operations:
Government grants received for staff training 59 393 - -
Automotive competitiveness and investment scheme 2,566 2,023 - -
Gain/(loss) on disposal of property, plant and equipment 76 (110) 3 3 Net foreign exchange gains/(losses) (88) (130) - -
2,613 2,176 3 3
Gains attributable to continuing operations 2,701 2,416 3 3 Losses attributable to continuing operations (88) (240) - -
2,613 2,176 3 3
Profit before income tax has been arrived at after charging the following expenses:
Cost of sales 188,042 201,866 - -
Impairment of non-current assets:
Property, plant and equipment 15,598 - - -
Goodwill 1,730 - - -
Other intangible assets 1,273 - - -
Finance Costs:
Interest – other entities 3,411 2,898 - -
Finance lease finance charges 986 1,162 - -
Depreciation or amortisation of:
Property, plant & equipment 3,968 4,143 - -
Leased assets 1,507 1,597 - -
Brandnames 567 567 - -
Other intangibles 1,337 1,423 - -
Operating lease rental expenses 8,149 7,607 86 322
Bad debts written off in respect of amounts receivable from other entities 148 509 - -
Notes to the Financial StatementsFOR THE FINANCIAL YEAR ENDED 30 JUNE 2007

CMI LIMITED ANNUAL REPORT 200738
CONSOLIDATED COMPANY
2007 2006 2007 2006 $’000 $’000 $’000 $’000
2. PROFIT FROM OPERATIONS (continued)
Research and development costs immediately expensed 5 150 - -
Employee benefit expense:
Post-employment benefits:
Defined contribution plans 4,911 5,377 - -
Share-based payments:
Equity settled share-based payments - 53 - -
Termination benefits 2,748 1,363 - -
Other employee benefits 72,200 77,457 218 93
79,859 84,250 218 93
3. INCOME TAXES
(a) Income tax recognised in profit or loss
Tax expense/(benefit) comprises:
Current tax expense 3,089 3,993 2,582 2,722
(Over)/Underprovision of income tax in previous year (149) (256) - -
Deferred tax expense relating to the origination and reversal of temporary differences (4,336) 1,026 129 109
Total tax expense/(benefit) attributable to continuing operations (1,396) 4,763 2,711 2,831
The prima facie income tax on pre-tax accounting profit from operations reconciles to the income tax expense in the financial statements as follows:
Profit/(loss) from continuing operations (5,236) 15,960 9,710 9,918
Income tax calculated at 30% (1,571) 4,788 2,913 2,975
Add/(Deduct)
Impairment losses on goodwill not deductible 519 - - -
Foreign tax differential 20 216 - -
Other items 121 81 - -
Exempt foreign dividends - - (202) (144)
Research and development allowance (336) (66) - -
(Over)/Underprovision of income tax in previous year (149) (256) - -
175 (25) (202) (144)
Income tax attributable to continuing operations (1,396) 4,763 2,711 2,831
The tax rate used in the above reconciliation is the corporate tax rate of 30% payable by Australian corporate entities on taxable profits under Australian tax law. There has been no change in the corporate tax rate when compared with the previous reporting period.
Notes to the Financial StatementsFOR THE FINANCIAL YEAR ENDED 30 JUNE 2007

CMI LIMITED ANNUAL REPORT 2007 39
CONSOLIDATED COMPANY
2007 2006 2007 2006 $’000 $’000 $’000 $’000
3. INCOME TAXES (continued)
(b) Current tax assets and liabilities
Current tax assets:
Tax refund receivable 1,189 - 1,171 -
Current tax payables:
Income tax payable attributable to:
Parent entity - (524) - (524)
Entities in the tax-consolidated group - 969 - 969
Other - (39) - -
- 406 - 445
(c) Income tax recognised directly in equity
The following current and deferred amounts were charged directly to equity during the period:
Current tax:
Share issue expenses - - - -
Deferred tax:
Share issue expenses deductible over 5 years 42 - 42 -
42 - 42 -
(d) Deferred tax balances
Deferred tax assets comprise:
Temporary differences 212 209 74 161
Deferred tax liabilities comprise:
Temporary differences 1,231 5,625 - -
Notes to the Financial StatementsFOR THE FINANCIAL YEAR ENDED 30 JUNE 2007

CMI LIMITED ANNUAL REPORT 200740
3. INCOME TAXES (continued)
Taxable and deductible temporary differences arise from the following:
Consolidated
Opening Charged Charged Acquisitions Closing balance to income to equity balance $’000 $’000 $’000 $’000 $’000
2007 Gross deferred tax liabilities:
Other receivables (614) (16) - - (630)
Inventories (629) (27) - - (656)
Property, plant and equipment (6,834) 4,263 - - (2,571)
Intangible assets (2,653) 560 - - (2,093)
Other (31) 29 - - (2)
(10,761) 4,809 - - (5,952)
Gross deferred tax assets:
Provisions 4,852 (431) - 19 4,440
Doubtful debts 254 (93) - - 161
Share issue expenses 109 (77) 42 - 74
Other 130 128 - - 258
5,345 (473) 42 19 4,933
Attributable to continuing operations (5,416) 4,336 42 19 (1,019)
Disclosed in the accounts pursuant to the set-off provisions as:
Deferred tax assets 212 Deferred tax liabilities (1,231)
(1,019)
Consolidated
Opening Charged Charged Acquisitions Closing balance to income to equity balance $’000 $’000 $’000 $’000 $’000
2006 Gross deferred tax liabilities:
Other receivables (660) 46 - - (614)
Inventories (662) 33 - - (629)
Property, plant and equipment (6,136) (698) - - (6,834)
Intangible assets (2,852) 199 - - (2,653)
Other (28) (3) - - (31)
(10,338) (423) - - (10,761)
Gross deferred tax assets:
Provisions 5,312 (491) - 31 4,852
Doubtful debts 202 52 - - 254
Share issue expenses 215 (106) - - 109
Other 188 (58) - - 130
5,917 (603) - 31 5,345
Attributable to continuing operations (4,421) (1,026) - 31 (5,416)
Disclosed in the accounts pursuant to the set-off provisions as:
Deferred tax assets 209 Deferred tax liabilities (5,625)
(5,416)
Notes to the Financial StatementsFOR THE FINANCIAL YEAR ENDED 30 JUNE 2007

CMI LIMITED ANNUAL REPORT 2007 4�
3. INCOME TAXES (continued)
Company
Opening Charged to Charged to Closing balance income equity balance $’000 $’000 $’000 $’000
2007 Gross deferred tax assets:
Property, plant and equipment 2 (2) - -
Accruals 49 (49) - -
Share issue expenses 110 (78) 42 74
Attributable to continuing operations 161 (129) 42 74
Company
Opening Charged to Charged to Closing balance income equity balance $’000 $’000 $’000 $’000
2006 Gross deferred tax assets:
Property, plant and equipment 5 (3) - 2
Accruals 49 - - 49
Share issue expenses 216 (106) - 110
Attributable to continuing operations 270 (109) - 161
Tax consolidation system
Legislation to allow groups, comprising a parent entity and its Australian resident wholly-owned entities, to elect to consolidate and be treated as a single entity for income tax purposes was substantively enacted on 21 October 2002.
The company and its wholly-owned Australian resident entities are eligible to consolidate for tax purposes under this legislation and have elected to be taxed as a single entity from 1 July 2002. The head entity within the tax consolidated group for the purposes of the tax consolidated system is CMI Limited.
Entities within the tax consolidated group have entered into a tax funding agreement with the head entity. Under the terms of this agreement, CMI Limited and each of the entities in the tax consolidated group has agreed to pay a tax equivalent payment to or from the head entity, based on the net accounting profit or loss of the entity and the current rate. Such amounts are reflected in amounts receivable from or payable to other entities in the tax consolidated group.
Entities within the tax-consolidated group have adopted the stand alone approach to measuring current and deferred tax amounts.
Notes to the Financial StatementsFOR THE FINANCIAL YEAR ENDED 30 JUNE 2007
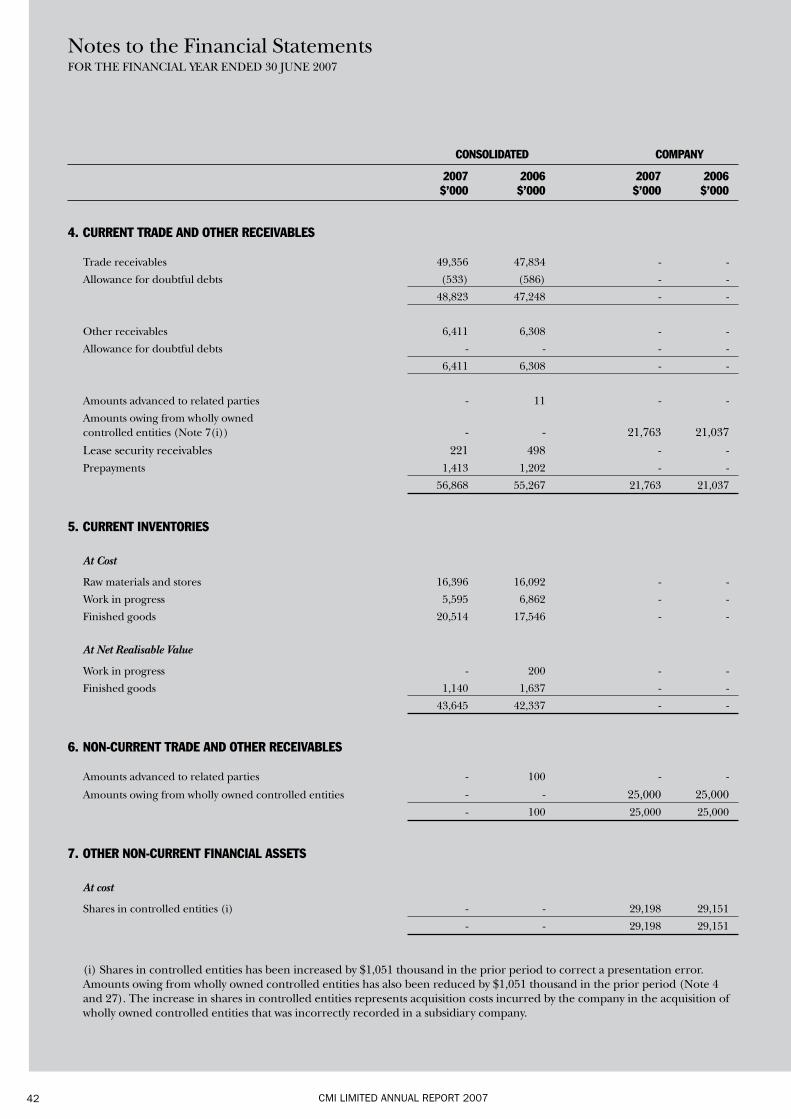
CMI LIMITED ANNUAL REPORT 200742
CONSOLIDATED COMPANY
2007 2006 2007 2006 $’000 $’000 $’000 $’000
4. CURRENT TRADE AND OTHER RECEIVABLES
Trade receivables 49,356 47,834 - -
Allowance for doubtful debts (533) (586) - -
48,823 47,248 - -
Other receivables 6,411 6,308 - -
Allowance for doubtful debts - - - -
6,411 6,308 - -
Amounts advanced to related parties - 11 - -
Amounts owing from wholly owned controlled entities (Note 7(i)) - - 21,763 21,037
Lease security receivables 221 498 - - Prepayments 1,413 1,202 - -
56,868 55,267 21,763 21,037
5. CURRENT INVENTORIES
AtCost
Raw materials and stores 16,396 16,092 - -
Work in progress 5,595 6,862 - -
Finished goods 20,514 17,546 - -
AtNetRealisableValue
Work in progress - 200 - -
Finished goods 1,140 1,637 - -
43,645 42,337 - -
6. NON-CURRENT TRADE AND OTHER RECEIVABLES
Amounts advanced to related parties - 100 - -
Amounts owing from wholly owned controlled entities - - 25,000 25,000 - 100 25,000 25,000
7. OTHER NON-CURRENT FINANCIAL ASSETS
Atcost
Shares in controlled entities (i) - - 29,198 29,151
- - 29,198 29,151
(i) Shares in controlled entities has been increased by $1,051 thousand in the prior period to correct a presentation error. Amounts owing from wholly owned controlled entities has also been reduced by $1,051 thousand in the prior period (Note 4 and 27). The increase in shares in controlled entities represents acquisition costs incurred by the company in the acquisition of wholly owned controlled entities that was incorrectly recorded in a subsidiary company.
Notes to the Financial StatementsFOR THE FINANCIAL YEAR ENDED 30 JUNE 2007

CMI LIMITED ANNUAL REPORT 2007 43
8. PROPERTY, PLANT AND EQUIPMENT
Consolidated
Freehold Plant and Equipment under land and buildings Equipment finance lease TOTAL $’000 $’000 $’000 $’000
Gross Carrying Amount
Balance at 1 July 2005 (at cost) 1,295 65,358 25,334 91,987
Additions - 3,395 3,112 6,507
Acquired balances - 904 - 904
Transfers - 1,907 (1,907) -
Disposals - (1,321) (36) (1,357)
Net foreign currency exchange differences - (427) - (427)
Balance at 1 July 2006 (at cost) 1,295 69,816 26,503 97,614
Additions - 2,702 2,405 5,107
Acquired balances - 153 - 153
Transfers - 6,347 (6,347) -
Disposals - (2,896) - (2,896)
Classified as held for sale - (1,277) - (1,277)
Net foreign currency exchange differences - 497 - 497
Balance at 30 June 2007 (at cost) 1,295 75,342 22,561 99,198
Accumulated Depreciation / Amortisation / Impairment
Balance at 1 July 2005 (257) (27,809) (3,342) (31,408)
Disposals - 1,149 6 1,155
Transfers - (559) 559 -
Depreciation expense (i) (28) (4,115) (1,597) (5,740)
Net foreign currency exchange differences - 255 - 255
Balance at 1 July 2006 (285) (31,079) (4,374) (35,738)
Acquired balances - - - -
Disposals - 973 - 973
Transfers - (1,483) 1,483 -
Depreciation expense (i) (28) (3,940) (1,507) (5,475)
Impairment losses charged to profit (ii) - (15,598) - (15,598)
Classified as held for sale - 245 - 245
Net foreign currency exchange differences - (251) - (251)
Balance at 30 June 2007 (313) (51,133) (4,398) (55,844)
Net Book Value
As at 30 June 2006 1,010 38,737 22,129 61,876
As at 30 June 2007 982 24,209 18,163 43,354
Notes to the Financial StatementsFOR THE FINANCIAL YEAR ENDED 30 JUNE 2007

CMI LIMITED ANNUAL REPORT 200744
8. PROPERTY, PLANT AND EQUIPMENT (continued)
Company
Freehold Plant and Equipment under land and buildings Equipment finance lease TOTAL $’000 $’000 $’000 $’000
Gross Carrying Amount
Balance at 1 July 2005 (at cost) - 149 - 149
Additions - - - -
Disposals - (32) - (32)
Balance at 1 July 2006 (at cost) - 117 - 117
Additions - - - -
Disposals - (117) - (117)
Balance at 30 June 2007 (at cost) - - - -
Accumulated Depreciation / Amortisation / Impairment
Balance at 1 July 2005 - (149) - (149)
Disposals - 32 - 32
Transfers - - - -
Depreciation expense (i) - - - -
Balance at 1 July 2006 - (117) - (117)
Disposals - 117 - 117
Transfers - - - -
Depreciation expense (i) - - - -
Balance at 30 June 2007 - - - -
Net Book Value
As at 30 June 2006 - - - -
As at 30 June 2007 - - - -
(i) Aggregate depreciation allocated during the year is recognised as an expense and disclosed in note 2 to the
financial statements.
(ii) During the financial year, the consolidated entity assessed the recoverable amount of plant and equipment, and determined that plant and equipment associated with the consolidated entity’s engineered components operations was impaired by $15,598 thousand (2006: nil). The recoverable amount of the engineered components operations was assessed by reference to the cash-generating unit’s value in use. A discount factor of 12.08% p.a. (2006: 11.58% p.a.) was applied in the value in use model.
The main factors contributing to the impairment of the cash-generating unit were the loss of sales volume due to the state of the automotive manufacturing industry in Australia and the USA and the on-going costs of rationalisation and restructuring.
Impairment losses of plant and equipment are included in the line item ‘impairment of non-current assets’ in the income statement.
Notes to the Financial StatementsFOR THE FINANCIAL YEAR ENDED 30 JUNE 2007

CMI LIMITED ANNUAL REPORT 2007 45
CONSOLIDATED COMPANY
2007 2006 2007 2006 $’000 $’000 $’000 $’000
9. GOODWILL
Gross Carrying Amount
Balance at beginning of the financial year 6,309 6,121 - -
Additional amounts recognised from business combinations occurring during the period 5,597 - - -
Final settlement of business combinations occurring in prior periods - 188 - -
Balance at end of the financial year 11,906 6,309 - -
Accumulated Impairment Losses
Balance at beginning of the financial year - - - -
Impairment losses for the year (i) (1,730) - - -
Balance at end of the financial year (1,730) - - -
Net Book Value
At the beginning of the financial year 6,309 6,121 - -
At the end of the financial year 10,176 6,309 - -
(i) During the financial year, the consolidated entity assessed the recoverable amount of goodwill, and determined that goodwill associated with the consolidated entity’s engineered components operations was impaired by $1,730 thousand (2006: nil). The recoverable amount of the engineered components operations was assessed by reference to the cash-generating unit’s value in use. A discount factor of 12.08% p.a. (2006: 11.58% p.a.) was applied in the value in use model.
The main factors contributing to the impairment of the cash-generating unit were the loss of sales volume due to the state of the automotive manufacturing industry in Australia and the USA and the on-going costs of rationalisation and restructuring.
Impairment losses of goodwill are included in the line item ‘impairment of non-current assets’ in the income statement.
Allocation of goodwill to cash-generating units
Goodwill has been allocated for impairment testing purposes to three groups of cash-generating units, as follows:
Engineered Components division, Electrical Components division and Services division.
The carrying amount of goodwill allocated to cash-generating units that are significant in aggregate is as follows:
Engineered Components 1,428 2,142 - -
Electrical Components 6,850 2,269 - -
Services 1,898 1,898 - -
10,176 6,309 - -
Notes to the Financial StatementsFOR THE FINANCIAL YEAR ENDED 30 JUNE 2007

CMI LIMITED ANNUAL REPORT 200746
9. GOODWILL (continued)
Engineered Components
The engineered components operating units produce similar products, and their recoverable amounts are based on some of the same key assumptions. The recoverable amount of the cash generating unit is determined based on a value in use calculation which uses cash flow projections based on financial budgets approved by management covering a ten-year period, and a discount rate of 12.08% p.a. (2006: 11.58% p.a.). Management believes that any reasonably possible change in the key assumptions on which recoverable amount is based would not cause the aggregate carrying amount to exceed the aggregate recoverable amount of the cash-generating unit.
Electrical Components
The electrical components operating units produce similar products, and their recoverable amounts are based on some of the same key assumptions. The recoverable amount of the cash generating unit is determined based on a value in use calculation which uses cash flow projections based on financial budgets approved by management covering a ten-year period, and a discount rate of 12.08% p.a. (2006: 11.58% p.a.). Management believes that any reasonably possible change in the key assumptions on which recoverable amount is based would not cause the aggregate carrying amount to exceed the aggregate recoverable amount of the cash-generating unit.
Services
The recoverable amount of the services division is determined based on a value in use calculation which uses cash flow projections based on financial budgets approved by management covering a ten-year period, and a discount rate of 12.08% p.a. (2006: 11.58% p.a.). Management believes that any reasonably possible change in the key assumptions on which recoverable amount is based would not cause the aggregate carrying amount to exceed the aggregate recoverable amount of the cash-generating unit.
The key assumptions used in the value in use calculations for the various significant cash-generating units are as follows:
Key assumption Engineered Components Electrical Components Services
Budgeted market share Average market share in the period immediately before the budget period, which is consistent with past experience.
Budgeted gross marginAverage gross margins achieved in the period immediately before the budget period, increased for expected efficiency improvements. This reflects past experience. Management expects efficiency improvements of 3% per year to be reasonably achievable.
Raw materials price inflation
Forecast consumer price indices during the budget period for the countries from which raw materials are purchased. The values assigned to the key assumption are consistent with external sources of information.
Not applicable
Notes to the Financial StatementsFOR THE FINANCIAL YEAR ENDED 30 JUNE 2007

CMI LIMITED ANNUAL REPORT 2007 47
10. OTHER INTANGIBLE ASSETS
Consolidated
Capitalised Development Brandnames Total $’000 $’000 $’000
Gross carrying amount
Balance at 1 July 2005 7,018 22,692 29,710
Additions through internal developments 1,337 - 1,337
Disposals (24) - (24)
Balance at 1 July 2006 8,331 22,692 31,023
Additions through internal developments 1,313 - 1,313
Disposals - - -
Balance at 30 June 2007 9,644 22,692 32,336
Accumulated amortisation and impairment
Balance at 1 July 2005 (3,090) (1,753) (4,843)
Amortisation expense (i) (1,423) (567) (1,990)
Disposals 25 - 25
Balance at 1 July 2006 (4,488) (2,320) (6,808)
Amortisation expense (i) (1,337) (567) (1,904)
Disposals - - -
Impairment losses charged to profit or loss (ii) (1,273) - (1,273)
Balance at 30 June 2007 (7,098) (2,887) (9,985)
Net Book Value
As at 30 June 2006 3,843 20,372 24,215
As at 30 June 2007 2,546 19,805 22,351
Company
Capitalised Development Brandnames Total $’000 $’000 $’000
Gross carrying amount Balance at 1 July 2005 - - -
Balance at 1 July 2006 - - -
Balance at 30 June 2007 - - -
Accumulated amortisation and impairment Balance at 1 July 2005 - - -
Balance at 1 July 2006 - - -
Balance at 30 June 2007 - - -
Net Book Value As at 30 June 2006 - - -
As at 30 June 2007 - - -
(i) Amortisation expense is included in the line item ‘depreciation and amortisation expense’ in the income statement.
Notes to the Financial StatementsFOR THE FINANCIAL YEAR ENDED 30 JUNE 2007

CMI LIMITED ANNUAL REPORT 200748
10. OTHER INTANGIBLE ASSETS (continued)
(ii) During the financial year, the consolidated entity assessed the recoverable amount of intangible assets, and determined that capitalised development associated with the consolidated entity’s engineered components operations was impaired by $1,273 thousand (2006: nil). The recoverable amount of the engineered components operations was assessed by reference to the cash-generating unit’s value in use. A discount factor of 12.08% p.a. (2006: 11.58% p.a.) was applied in the value in use model.
The main factors contributing to the impairment of the cash-generating unit were the loss of sales volume due to the state of the automotive manufacturing industry in Australia and the USA and the on-going costs of rationalisation and restructuring.
Impairment losses of intangible assets are included in the line item ‘impairment of non-current assets’ in the income statement.
Significant intangible assets
The consolidated entity includes the brandnames, Capitalcorp and TJM. The carrying amount of the Capitalcorp brandname of $15,300 thousand (2006: $15,725 thousand) will be fully amortised in 36 years (2006: 37 years). The carrying amount of the TJM brandname of $4,505 thousand (2006: $4,647 thousand) will be fully amortised in 32 years (2006: 33 years).
CONSOLIDATED COMPANY
2007 2006 2007 2006 $’000 $’000 $’000 $’000
11. CURRENT TRADE AND OTHER PAYABLES
Trade payables 18,643 23,005 - -
Other creditors & accruals 13,155 9,867 - 165
31,798 32,872 - 165
12. CURRENT BORROWINGS
Unsecured
At amortised cost:
Other loans from other entities - - - -
Amounts owing to wholly owned controlled entities - - 7,069 6,616 - - 7,069 6,616
Secured
At amortised cost:
Bank Overdraft (i) 62 28 - -
Bills of Exchange (i) 47,500 1,750 - -
Bank Loans (ii) 51 78 - - Finance Lease Liabilities (iii) (Note 17) 4,682 5,754 - -
52,295 7,610 - -
52,295 7,610 7,069 6,616
i) Secured by a fixed and floating charge over the assets and undertaking of the consolidated entity excluding Metlcast
Manufacturing Pty Ltd.
ii) Secured over specific items of plant and equipment.
iii) Secured over the assets leased; part of a $19 million lease facility (2006: $19 million).
Notes to the Financial StatementsFOR THE FINANCIAL YEAR ENDED 30 JUNE 2007

CMI LIMITED ANNUAL REPORT 2007 49
CONSOLIDATED COMPANY
2007 2006 2007 2006 $’000 $’000 $’000 $’000
13. CURRENT PROVISIONS
Dividends (Note 16) - - - -
Employee benefits 7,032 11,297 - -
Make Good (Note 16) 23 190 - - Rebates (Note 16) 234 259 - -
7,289 11,746 - -
14. NON-CURRENT BORROWINGS
Unsecured
At amortised cost:
Other loans from other entities - - - -
- - - -
Secured
At amortised cost:
Bills of Exchange (i) - 37,750 - -
Bank Loans (ii) - 47 - -
Finance Lease Liabilities (iii) (Note 17) 6,008 7,528 - -
6,008 45,325 - -
6,008 45,325 - -
i) Secured by a fixed and floating charge over the assets and undertaking of the consolidated entity excluding Metlcast Manufacturing Pty Ltd.
ii) Secured over specific items of plant and equipment.
iii) Secured over the assets leased; part of a $19 million lease facility (2006: $19 million).
15. NON-CURRENT PROVISIONS
Employee benefits 5,415 2,205 - -
Notes to the Financial StatementsFOR THE FINANCIAL YEAR ENDED 30 JUNE 2007

CMI LIMITED ANNUAL REPORT 200750
16. PROVISIONS
Consolidated
Dividend Make Good Rebates (i) (ii) (iii) $’000 $’000 $’000
Balance at 30 June 2006 - 190 259
Additional provisions recognised 6,969 - -
Reductions arising from payments/other sacrifices of future economic benefits (6,969) (167) (25)
Balance at 30 June 2007 - 23 234
Current (note 13) - 23 234
Non-current (note 15) - - -
- 23 234
Company
Dividend Make Good Rebates (i) (ii) (iii) $’000 $’000 $’000
Balance at 30 June 2006 - - -
Additional provisions recognised 6,969 - -
Reductions arising from payments/other sacrifices of future economic benefits (6,969) - -
Balance at 30 June 2007 - - -
Current (note 13) - - -
Non-current (note 15) - - -
- - -
i) The provision for dividends represents the aggregate amount of dividends declared, determined or publicly recommended on or before the reporting date, which remain undistributed as at reporting date, regardless of the extent to which they are expected to be paid in cash.
ii) The provision for make good represents future costs expected to be incurred in dismantling and removing plant and equipment and restoring the sites on which the plant and equipment were located.
iii) The provision for rebates represents future rebates expected to be claimed by insurance and finance providers on previously paid commissions due to cancellation or early completion of contracts.
Notes to the Financial StatementsFOR THE FINANCIAL YEAR ENDED 30 JUNE 2007

CMI LIMITED ANNUAL REPORT 2007 5�
17. LEASES
Finance Leases
Leasing arrangements
Finance leases relate to plant and equipment with lease terms of between 3 to 5 years. The company/consolidated entity has options to purchase the plant and equipment for a nominal amount at the conclusion of the lease agreements.
Minimum Future Lease Payments Present Value of Minimum Future Lease Payments
Consolidated Company Consolidated Company
2007 $’000
2006 $’000
2007 $’000
2006 $’000
2007 $’000
2006 $’000
2007 $’000
2006 $’000
No later than 1 year 5,316 6,484 - - 4,682 5,754 - -
Later than 1 year and not later than 5 years 6,620 8,258 - - 6,008 7,528 - -
Later than 5 years - - - - - - - -
Minimum finance lease payments 11,936 14,742 - - 10,690 13,282 - -
Less future finance charges (1,246) (1,460) - - - - - -
Present value of minimum lease payments 10,690 13,282 - - 10,690 13,282 - -
Included in the financial statements as:
Current (Note 12) 4,682 5,754 - - 4,682 5,754 - -
Non-current (Note 14) 6,008 7,528 - - 6,008 7,528 - -
10,690 13,282 - - 10,690 13,282 - -
CONSOLIDATED COMPANY
2007 2006 2007 2006 $’000 $’000 $’000 $’000
Operating Leases
Leasing arrangements
Operating leases relate to property, plant and equipment with lease terms of between 1 to 13 years. All leases are non-cancellable, operate under normal commercial terms and conditions, and are payable on a monthly or quarterly basis. The company/consolidated entity does not have an option to purchase the leased asset at the expiry of the lease period.
Non-cancellable operating leases
Not later than 1 year 6,213 6,764 67 71
Later than 1 year but not later than 5 years 14,383 17,629 39 112
Later than 5 years 3,495 8,080 - -
24,091 32,473 106 183
Notes to the Financial StatementsFOR THE FINANCIAL YEAR ENDED 30 JUNE 2007

CMI LIMITED ANNUAL REPORT 200752
CONSOLIDATED COMPANY
2007 2006 2007 2006 $’000 $’000 $’000 $’000
18. ISSUED CAPITAL
33,752,634 (2006: 35,859,654) fully paid ordinary shares 37,227 36,755 37,227 36,755
Nil (2006: 750,000) partly paid ordinary shares - 7 - 7
28,005,311 fully paid Class A shares (2006: 26,076,742 fully paid Class A shares) 32,876 31,237 32,876 31,237
70,103 67,999 70,103 67,999
Changes to the then Corporations Law abolished the authorised capital and par value concept in relation to share capital from 1 July 1998. Therefore, the company does not have a limited amount of authorised capital and issued shares do not have a par value.
2007 2006
No. No. ’000 $’000 ’000 $’000
FullyPaidOrdinaryShares
Balance at beginning of financial year 35,860 36,755 35,910 36,823
Transfer from partly paid ordinary shares 750 7 - -
Issue of shares under director and employee share option plan 1,000 - - -
Transfer from equity-settled employee benefits reserve (note 19) - 167 - -
Payment of share loan - 4,350 - -
Share buy-back (3,857) (3,954) (50) (68)
Share buy-back costs - (98) - -
Balance at end of financial year 33,753 37,227 35,860 36,755
Fully paid ordinary shares carry one vote per share and carry the right to dividends.
PartlyPaidOrdinaryShares
Balance at beginning of financial year 750 7 750 7
Calls during financial year - - - -
Transfer to fully paid ordinary shares (750) (7) - -
Balance at end of financial year - - 750 7
Partly paid ordinary shares carry one vote per share and carry the right to dividends in the proportion that the amount of the dividend paid is of the amounts paid and payable.
Notes to the Financial StatementsFOR THE FINANCIAL YEAR ENDED 30 JUNE 2007

CMI LIMITED ANNUAL REPORT 2007 53
18. ISSUED CAPITAL (continued)
2007 2006
No. No. ’000 $’000 ’000 $’000
ClassAShares
Balance at beginning of financial year 26,077 31,237 26,077 31,237
Issue of shares 1,928 2,063 - -
Equity adjustment on share buy-back - (424) - -
Balance at end of financial year 28,005 32,876 26,077 31,237
The Class A shares are irredeemable and are entitled to only vote in specific circumstances. These shares carry the right to a preferred ranking over ordinary shares for payment of dividends. The dividends are non-cumulative.
CONSOLIDATED COMPANY
2007 2006 2007 2006 $’000 $’000 $’000 $’000
19. RESERVES
a) Reserves Comprise:
Foreign Currency Translation Reserve 91 (264) - -
Employee Equity-settled Benefits Reserve - 120 - 120
91 (144) - 120
b) Movements in Reserves
ForeignCurrencyTranslationReserve
Balance at beginning of financial year (264) 156 - -
Translation of foreign operations 355 (420) - -
Balance at end of financial year 91 (264) - -
Exchange differences relating to the translation from New Zealand dollars, being the functional currency of the consolidated entity’s foreign controlled entity in New Zealand, into Australian dollars are brought to account by entries made directly to the foreign currency translation reserve.
EmployeeEquity-settledBenefitsReserve
Balance at beginning of financial year 120 67 120 67
Share-based payment 47 53 47 53
Transfer to ordinary share capital (167) - (167) -
Balance at end of financial year - 120 - 120
The employee equity-settled benefits reserve arises on the provision of loans to directors and executives to pay for calls on the partly paid ordinary shares and to pay for the exercise of share options. Amounts are transferred out of the reserve and into issued capital when the loans mature. Further information about share-based payments to employees is included in note 23 to the financial statements.
Notes to the Financial StatementsFOR THE FINANCIAL YEAR ENDED 30 JUNE 2007

CMI LIMITED ANNUAL REPORT 200754
CONSOLIDATED COMPANY
2007 2006 2007 2006 $’000 $’000 $’000 $’000
20. RETAINED EARNINGS
Balance at beginning of financial year 20,130 16,006 4 (10)
Net profit/(loss) attributable to members of the parent entity (3,840) 11,197 6,999 7,087
Dividends provided for or paid (6,969) (7,073) (6,969) (7,073)
Balance at end of financial year 9,321 20,130 34 4
21. EARNINGS PER SHARE
2007 2006
Cents per Share Cents per Share
Basic earnings per share (21.61) 23.45
Diluted earnings per share (21.61) 23.09
Basic Earnings per Share
The earnings and weighted average number of ordinary shares used in the calculation of basic earnings per share are as follows:
CONSOLIDATED
2007 2006 $’000 $’000
Earnings (i) (7,626) 8,459
No. No. ’000 ’000
Weighted average number of ordinary shares (ii) 35,291 36,069
(i) Earnings used in the calculation of basic earnings per share reconciles to net profit/(loss) in the income statement as follows:
CONSOLIDATED
2007 2006 $’000 $’000
Net profit/(loss) (3,840) 11,197
Class A share dividends declared in respect of the period (3,786) (2,738)
Earnings used in the calculation of basic EPS (7,626) 8,459
(ii) Options are considered to be potential ordinary shares and are therefore excluded from the weighted average number of ordinary shares used in the calculation of basic earnings per share. Where dilutive, potential ordinary shares are included in the calculation of diluted earnings per share (refer below).
Notes to the Financial StatementsFOR THE FINANCIAL YEAR ENDED 30 JUNE 2007

CMI LIMITED ANNUAL REPORT 2007 55
21. EARNINGS PER SHARE (continued)
Diluted Earnings per Share
The earnings and weighted average number of ordinary and potential ordinary shares used in the calculation of diluted earnings per share are as follows:
CONSOLIDATED
2007 2006 $’000 $’000
Earnings (i) (7,626) 8,459
No. No. ’000 ’000
Weighted average number of ordinary and potential ordinary shares (ii) 35,291 36,631
(i) Earnings used in the calculation of diluted earnings per share reconciles to net profit/(loss) in the statement of financial performance as follows:
CONSOLIDATED
2007 2006 $’000 $’000
Net profit/(loss) (3,840) 11,197
Class A share dividends provided for or paid (3,786) (2,738)
Earnings used in the calculation of diluted EPS (7,626) 8,459
(ii) Weighted average number of ordinary shares and potential ordinary shares used in the calculation of diluted earnings per share reconciles to the weighted average number of ordinary shares used in the calculation of basic earnings per share as follows:
No. No. ’000 ’000
Weighted average number of ordinary shares used in the calculation of basic EPS 35,291 36,069
Shares deemed to be issued for no consideration in respect of:
Partly paid ordinary shares - 562
Convertible preference shares - -
Weighted average number of ordinary shares and potential ordinary shares used in the calculation of diluted EPS 35,291 36,631
(iii) Class A shares are excluded on the basis that they are not convertible to ordinary shares. Share options are excluded on the basis that they are not dilutive.
Notes to the Financial StatementsFOR THE FINANCIAL YEAR ENDED 30 JUNE 2007

CMI LIMITED ANNUAL REPORT 200756
2007 2007 2006 2006 Cents per Total Cents per Total Share $’000 Share $’000
22. DIVIDENDS
Recognised Amounts
Fully Paid Ordinary Shares:
Interim dividend - franked to 30% tax rate 3.00 1,012 6.00 2,152
Final dividend - franked to 30% tax rate 6.00 2,152 6.00 2,154
Partly Paid Ordinary Shares:
Interim dividend - franked to 30% tax rate - - 2.52414 19
Final dividend - franked to 30% tax rate 2.52414 19 1.28274 10
Class A Shares:
Quarterly interim dividends - franked to 30% tax rate 3.5/qtr 2,873 3.5/qtr 2,738
Final dividend – franked to 30% tax rate 3.5/qtr 913 - -
6,969 7,073
Unrecognised Amounts
Fully Paid Ordinary Shares:
Final dividend - franked to 30% tax rate - - 6.00 2,152
Partly Paid Ordinary Shares:
Final dividend - franked to 30% tax rate - - 2.52414 19
Class A Shares:
Final dividend – franked to 30% tax rate 3.5/qtr 980 3.5/qtr 913
980 3,084
The final dividend in respect of ordinary shares and Class A shares for the year ended 30 June 2007 has not been recognised in this financial report because the final dividend was declared, determined or publicly recommended subsequent to 30 June 2007. On the basis that directors will continue to publicly recommend dividends in respect of ordinary shares and Class A shares subsequent to reporting date, in future financial reports the amount disclosed as “recognised” will be the final dividend in respect of the prior financial year, and the interim dividend in respect of the current financial year.
The consolidated entity’s adjusted franking account balance on a tax paid basis is $7,325 thousand (2006: $5,827 thousand). The company’s adjusted franking account balance on a tax paid basis is $7,325 thousand (2006: $5,827 thousand). The impact on the consolidated entity’s and company’s franking account balance of dividends not recognised is $420 thousand (2006: $1,321 thousand).
Notes to the Financial StatementsFOR THE FINANCIAL YEAR ENDED 30 JUNE 2007

CMI LIMITED ANNUAL REPORT 2007 57
23. EMPLOYEE INCENTIVE SCHEME
The company has an ownership-based remuneration scheme for employees. In accordance with the provisions of the scheme, as approved by shareholders at a general meeting, the Board may invite, on terms and conditions the Board determines, employees to apply for options.
The exercise price of the options will be generally at the weighted average price of shares in the company traded on the ASX in the 20 trading days prior to the issue of the options. However, the scheme provided for an initial option issue to a number of existing employees. The initial options were issued with an exercise price of $1.00.
20% of the options issued to any employee pursuant to the scheme will be able to be exercised by the employee for each year of employment by the company of the employee, to a maximum of 5 years employment. The options can be exercised at any time in the 5 years after the date of their issue, although any employee who leaves the employ of the company will need to exercise their options within 90 days of termination of their employment. All options carry no voting rights and do not entitle the holder to dividends.
Employee incentive scheme 2007 2006
Number of Options
Weighted Average
Exercise Price
Number of Options
Weighted Average
Exercise Price
Balance at beginning of year (i) 142,500 2.22 152,500 2.22
Granted during the financial year (ii) - - - -
Exercised during the financial year (iii) - - - -
Expired during the year - - (10,000) 2.22
Balance at end of the financial year (iv) 142,500 2.22 142,500 2.22
Options were priced using the Black-Scholes option pricing model. Expected volatility is based on the historical share price volatility over the past 12 months.
Inputs into the model
Option Series
Issued 27 April 2004 Issued 29 October 2004
Grant date share price $2.18 $1.96
Exercise price $2.22 $2.22
Expected volatility 30.00% 10.00%
Option life 5 years 5 years
Dividend yield 5.50% 8.00%
Risk-free interest rate 5.25% 5.20%
Fair value at grant date $0.02 $0.42
(i) Balance at beginning of the financial year
2007 Option – Series
No. Grant date Expiry/Exercise date Exercise Price $
Issued 27 April 2004 42,500 27/04/04 27/04/09 2.22
Issued 29 October 2004 100,000 29/10/04 28/10/09 2.22
2006 Option – Series
No. Grant date Expiry/Exercise date Exercise Price $
Issued 27 April 2004 52,500 27/04/04 27/04/09 2.22
Issued 29 October 2004 100,000 29/10/04 28/10/09 2.22
Notes to the Financial StatementsFOR THE FINANCIAL YEAR ENDED 30 JUNE 2007

CMI LIMITED ANNUAL REPORT 200758
23. EMPLOYEE INCENTIVE SCHEME (continued)
(ii) Granted during the financial year
2007 Option – Series No. Grant date Expiry/Exercise date Exercise Price $
- - - - -
2006 Option – Series No. Grant date Expiry/Exercise date Exercise Price $
- - - - -
(iii) Exercised during the financial year
2007 Option – Series
No. of options
exercised
Grant date Exercise date
Expiry date Exercise Price
$
No. of shares issued
Fair value received
$
Fair value of shares at
date of issue
$
- - - - - - - - -
- - - - - - - - -
2006 Option – Series
No. of options
exercised
Grant date Exercise date
Expiry date Exercise Price
$
No. of shares issued
Fair value received
$
Fair value of shares at
date of issue
$
- - - - - - - - -
- - - - - - - - -
The fair value of the shares at the date of issue was based on the market value at that date.
(iv) Balance at end of the financial year
2007 Option – Series
No. Vested No. Unvested No. Grant date Expiry Date Exercise Price $
Issued 27 April 2004 42,500 40,500 2,000 27/04/04 27/04/09 2.22
Issued 29 October 2004 100,000 100,000 - 29/10/04 28/10/09 2.22
2006 Option – Series
No. Vested No. Unvested No. Grant date Expiry Date Exercise Price $
Issued 27 April 2004 42,500 38,500 4,000 27/04/04 27/04/09 2.22
Issued 29 October 2004 100,000 100,000 - 29/10/04 28/10/09 2.22
Notes to the Financial StatementsFOR THE FINANCIAL YEAR ENDED 30 JUNE 2007

CMI LIMITED ANNUAL REPORT 2007 59
24. KEY MANAGEMENT PERSONNEL COMPENSATION
Details of key management personnel
The key management personnel of CMI Limited during the year were:
C.G. Ryan (Chairman, non-executive Director), appointed 28 February 2007
D. Herceg (Non-executive Director), appointed 9 March 2007
R.D. Catelan (Managing Director), appointed 3 July 2007; (Director), appointed 18 May 2007
M.C. Maughan (Non-executive Director), resigned 2 July 2007
M.J. Hofmeister (Chairman, Executive Director), resigned 8 June 2007
J.J.A. Johnson (Non-executive Director), resigned 28 February 2007
W.V. Hill (Non-executive Director), resigned 28 November 2006
V. Misztowt (Vice President – USA Division)
P.R. Meurer (Chief Executive – Engineering Division), resigned 16 November 2006
D.J. Gallagher (Manufacturing Manager – Engineering Division)
M.D. Laidlaw (Chief Financial Officer/Company Secretary)
I.C. Whittle (Managing Director – Capitalcorp Finance & Leasing Pty Ltd)
G.N. Fussell (Corporate Finance Manager)
J.L. Heslington (General Manager – Electrical Components Division)
Key management personnel compensation policy
The remuneration committee reviews the remuneration packages of all key management personnel on an annual basis and makes recommendations to the board. Remuneration packages are reviewed and determined with due regard to current market rates and are benchmarked against comparable industry salaries, adjusted by a performance factor to reflect changes in the performance of the company.
The objective of the company’s remuneration reward framework is to ensure reward for performance is competitive and appropriate for the results delivered. The framework aligns reward with achievement of strategic and financial objectives and the creation of wealth for shareholders.
In order to retain and attract executives of sufficient calibre to facilitate the efficient and effective management of the company’s operations, the remuneration committee seeks the advice of external advisers in connection with the structure of remuneration packages.
The overall level of executive reward takes into account the performance of the consolidated entity over a number of years. Over the past five years, the consolidated entity’s profit from ordinary activities after income tax (but prior to the impairment loss) has grown by 87.7%, and total equity has grown by 55.8%. During the same period, key management personnel’s remuneration has grown by 89.9%.
In accordance with the company’s constitution, the total remuneration payable to specified non-executive directors is not to exceed $390,000 per annum as approved by the shareholders at a general meeting.
Remuneration packages contain the following key elements:
a) Short-term employee benefits - salary/fees, bonuses and non monetary benefits including the provision of motor vehicles, accommodation and interest not charged on loans provided by the company;
b) Post-employment benefits - including superannuation and prescribed benefits; and
c) Share-based payment – shares issued during the financial year and share options granted under the director and employee share option plans approved by shareholders on 23 August 1999.
Notes to the Financial StatementsFOR THE FINANCIAL YEAR ENDED 30 JUNE 2007

CMI LIMITED ANNUAL REPORT 200760
24. KEY MANAGEMENT PERSONNEL COMPENSATION (continued)
Short-term employee benefits – key management personnel are offered a competitive remuneration that comprises the components of base pay and benefits. Base pay for executives is reviewed annually to ensure the executive’s pay is competitive with the market. An executive’s pay is also reviewed on promotion. Specific key management personnel are paid cash bonuses based on performance criteria. The performance criteria used to determine the amount of compensation include revenue, net profit before tax and inventory targets.
Other benefits – executives receive benefits including superannuation as required by the laws in the various jurisdictions in which the company operates. In certain circumstances, additional benefits (e.g. travel, car parking, interest not charged on loans and accommodation) may also be provided.
Equity - further details of the employee incentive scheme are disclosed in note 23 to the financial statements.
Key management personnel are employed through contracts for service which contain the following key conditions:
• Reviewed annually on or about 1 September;
• Require a six month notice period; and
• If employment is terminated by the company before the term of the contract expires, the specified director or executive is entitled to a termination payment based on up to two years of the contract, or the remaining contract period, whichever is greater.
Key management personnel compensation
The aggregate compensation of the key management personnel of the consolidated entity and the company is set out below:
CONSOLIDATED COMPANY
2007 2006 2007 2006 $ $ $ $
Short-term employee benefits 3,040,911 3,080,519 203,014 89,005
Post-employment benefits 195,892 179,073 - -
Other long-term benefits - - - -
Termination benefits 547,913 - - -
Share-based payment 840 54,424 - -
3,785,556 3,314,016 203,014 89,005
Notes to the Financial StatementsFOR THE FINANCIAL YEAR ENDED 30 JUNE 2007

CMI LIMITED ANNUAL REPORT 2007 6�
24. KEY MANAGEMENT PERSONNEL COMPENSATION (continued)
2007
Short-term Employee Benefits Post Employment Benefits Share-based payment
Total $
Salary/Fees
$Bonus
$
Non-monetary
$Other
$Superannuation
$Other
$Shares
$Options
$
C.G. Ryan 53,776 - - - - - - - 53,776
D. Herceg 22,667 - - - 2,040 - - - 24,707
R.D. Catelan - - - - - - - - -
M.J. Hofmeister 1,018,500 - - 241,644 - - - - 1,260,144
J.J.A. Johnson 36,666 - - 8,209 - - - - 44,875
W. V. Hill - - - - - - - - -
M.C. Maughan 89,905 - - - - - - - 89,905
P.R. Meurer 147,791 - - - 33,355 329,047 - - 510,193
D.J. Gallagher 157,586 - 15,000 13,608 103,320 218,866 - - 508,380
I.C. Whittle 300,000 - - 594 - - - - 300,594
M.D. Laidlaw 244,648 - - 19,708 22,019 - - - 286,375
J.L. Heslington 216,333 - 15,000 29,331 19,470 - - - 280,134
V. Misztowt 215,257 - - 16,789 - - - - 232,046
G.N. Fussell 166,312 - - 11,587 15,688 - - 840 (i) 194,427
Total 2,669,441 - 30,000 341,470 195,892 547,913 - 840 3,785,556
2006
Short-term Employee Benefits Post Employment Benefits Share-based payment
Total $
Salary/Fees
$Bonus
$
Non-monetary
$Other
$Superannuation
$Other
$Shares
$Options
$
M.J. Hofmeister 880,000 - - 89,609 - - 53,584 - 1,023,193
J.J.A. Johnson 55,000 - - 10,654 - - - - 65,654
W. V. Hill 168,314 - - 15,429 - - - - 183,743
M.C. Maughan 34,005 - - - - - - - 34,005
V. Misztowt 345,485 - - 16,394 - - - - 361,879
I.C. Whittle 300,000 - - 609 - - - - 300,609
P.R. Meurer 275,229 - - - 24,771 - - - 300,000
D.J. Gallagher 160,329 - 15,000 13,788 100,296 - - - 289,413
M.D. Laidlaw 207,951 - - 19,070 18,716 - - - 245,737
J.L. Heslington 128,000 26,922 15,000 28,867 12,223 - - - 211,012
A. Vlahogenis 120,000 4,800 15,000 203 11,232 - - - 151,235
G.N. Fussell 131,498 - - 3,363 11,835 - - 840 (i) 147,536
Total 2,805,811 31,722 45,000 197,986 179,073 - 53,584 840 3,314,016
(i) Further disclosure is contained in notes 23 and 27 to the financial statements.
Notes to the Financial StatementsFOR THE FINANCIAL YEAR ENDED 30 JUNE 2007

CMI LIMITED ANNUAL REPORT 200762
CONSOLIDATED COMPANY
2007 2006 2007 2006 $ $ $ $
25. REMUNERATION OF AUDITORS
(a) Auditor of the Parent Entity
Auditing the financial report of CMI Limited (including half year review) 226,002 274,719 156,000 172,000
Review of Automotive Competitiveness and Investment Scheme (ACIS) quarterly returns 75,750 75,000 - -
Other assurance related services 1,300 27,010 - -
Tax related services - - - -
303,052 376,729 156,000 140,000
(b) Related practice of the parent entity auditor
Auditing the financial report 27,594 13,399 - -
Taxation services 22,301 15,409 - -
49,895 28,808 - -
The auditor of CMI Limited is Deloitte Touche Tohmatsu. The auditor of CMI Limited (New Zealand) is Deloitte Touche Tohmatsu, New Zealand, an associated firm of Deloitte Touche Tohmatsu, Australia.
Notes to the Financial StatementsFOR THE FINANCIAL YEAR ENDED 30 JUNE 2007

CMI LIMITED ANNUAL REPORT 2007 63
26. SEGMENT INFORMATION
Information on Business Segments (primary reporting format)
BUSINESS
Engineered Components
Electrical Components
Financial Services Division Eliminations Consolidated
30/06/07 $’000
30/06/06 $’000
30/06/07 $’000
30/06/06 $’000
30/06/07 $’000
30/06/06 $’000
30/06/07 $’000
30/06/06 $’000
30/06/07 $’000
30/06/06 $’000
REVENUE External Sales 189,872 217,436 49,290 31,774 26,235 29,494 - - 265,397 278,704
Intersegment Sales 6 7 (3) - - - (3) (7) - -
Total Revenue 189,878 217,443 49,287 31,774 26,235 29,494 (3) (7) 265,397 278,704
RESULTS Segment Result (20,291) 5,004 14,965 9,015 90 1,941 - - (5,236) 15,960
ASSETS Segment Assets 142,621 164,030 30,708 19,055 10,222 10,689 - - 183,551 193,774
LIABILITIES Segment Liabilities 96,463 97,163 4,696 4,816 2,877 3,810 - - 104,036 105,789
Acquisition of property, plant and equipment and intangible assets 6,924 8,271 5,151 356 91 104 - - 12,166 8,731
Depreciation 6,747 7,176 334 236 298 318 - - 7,379 7,730
Impairment losses 18,601 - - - - - - - 18,601 -
Significant other non-cash expenses 961 1,207 12 8 - 1 - - 973 1,216
(i) Intersegment transactions that occurred during the financial year in the wholly-owned group comprised the sale and purchase of goods at cost plus a margin to cover freight and other incidentals where applicable.
Products and Services within each Business Segment
For management purposes, the consolidated entity is organised into three major operating divisions - engineered components, electrical components and financial services. These divisions are the basis on which the consolidated entity reports its primary segment information. The principal products and services of each of these divisions are as follows:
• Engineered & 4WD Components – the manufacture and sale of goods in the metal pressing, wire forming, repetitive engineering, 4WD and engine component industry.
• Electrical Components – the manufacture and sale of electrical cabling and components.
• Financial Services – the provision of chattel finance to both consumer and commercial borrowers.
Information on Geographical Segments (secondary reporting format)
The consolidated entity’s three divisions operate in three principal geographical areas – Australia, New Zealand and the United States. The composition of each geographical segment is as follows:
• Australia – CMI Limited manufactures and sells a broad range of its products and provides financial services in Australia.
• New Zealand – CMI Limited operates an engineered components facility in New Zealand.
• United States – CMI Limited operates an engineered and 4WD components facility in the United States.
Notes to the Financial StatementsFOR THE FINANCIAL YEAR ENDED 30 JUNE 2007

CMI LIMITED ANNUAL REPORT 200764
26. SEGMENT INFORMATION (continued)
GEOGRAPHICAL
Australia New Zealand USA Eliminations Consolidated
30/06/07 $’000
30/06/06 $’000
30/06/07 $’000
30/06/06 $’000
30/06/07 $’000
30/06/06 $’000
30/06/07 $’000
30/06/06 $’000
30/06/07 $’000
30/06/06 $’000
REVENUE
External Sales 251,523 265,050 8,916 7,905 4,958 5,749 - - 265,397 278,704
Intersegment Sales 4,036 4,255 13 11 - - (4,049) (4,266) - -
Total Revenue 255,559 269,305 8,929 7,916 4,958 5,749 (4,049) (4,266) 265,397 278,704
RESULTS
Segment Result (4,665) 16,279 635 363 (1,206) (682) - - (5,236) 15,960
ASSETS
Segment Assets 173,421 182,553 6,990 6,848 3,140 4,373 - - 183,551 193,774
LIABILITIES
Segment Liabilities 100,577 102,199 3,406 3,518 53 72 - - 104,036 105,789
Acquisition of property, plant and equipment and intangible assets 12,022 7,679 143 1,042 1 10 - - 12,166 8,731
Depreciation 7,023 7,457 309 226 47 47 - - 7,379 7,730
Impairment losses 18,133 - - - 468 - - - 18,601 -
Significant other non-cash expenses 973 1,216 - - - - - - 973 1,216
Notes to the Financial StatementsFOR THE FINANCIAL YEAR ENDED 30 JUNE 2007

CMI LIMITED ANNUAL REPORT 2007 65
CONSOLIDATED COMPANY
2007 2006 2007 2006 $’000 $’000 $’000 $’000
27. RELATED PARTY DISCLOSURES
a) Parent entities
The parent entity in the consolidated entity is CMI Limited.
b) Equity interests in subsidiaries
Details of the percentage of ordinary shares held in subsidiaries are disclosed in note 28 to the financial statements. Other transactions that occurred during the financial year between other related parties were the sale and purchase of goods at cost plus a margin to cover freight and other incidentals where applicable.
c) Transactions with other related parties
There are no transactions with other related parties.
d) Receivables
Wholly-Owned Subsidiaries:
CMI Operations Pty Ltd (Note 7(i)) – current - - 14,796 11,394
CMI Operations Pty Ltd – non-current - - 25,000 25,000
CMI Limited (New Zealand) – current - - 2,219 2,471
TJM Products Pty Ltd – current - - 4,748 7,172
- - 46,763 46,037
e) Payables – Current
Wholly-Owned Subsidiaries:
Capitalcorp Finance & Leasing Pty Ltd - - 7,069 6,467
Metlcast Manufacturing Pty Ltd - - - 149
- - 7,069 6,616
f) Transactions with key management personnel and their related entities
Key management personnel compensation
Details of key management personnel compensation are disclosed in Note 24 to the financial statements.
Loans to key management personnel
Loans to key management personnel
Balance at beginning $
Interest charged
$
Interest not charged
$
Balance at end $
Number in group
2007 2,231,052 - 247,589 620,000 5
2006 2,005,642 - 143,612 2,231,052 5
Notes to the Financial StatementsFOR THE FINANCIAL YEAR ENDED 30 JUNE 2007

CMI LIMITED ANNUAL REPORT 200766
27. RELATED PARTY DISCLOSURES (continued)
Key management personnel with loans above $100,000 in the reporting period
2007Balance at beginning
$Interest charged
$Interest not charged
$Balance at end
$Highest in period
$
M.J.Hofmeister 1,461,256 - 194,120 - 4,311,186
J.J.A. Johnson 149,796 - 8,209 - 149,796
V. Misztowt 220,000 - 16,060 220,000 220,000
M.D. Laidlaw 220,000 - 16,060 220,000 220,000
D.J Gallagher 180,000 - 13,140 180,000 180,000
2006Balance at beginning
$Interest charged
$Interest not charged
$Balance at end
$Highest in period
$
M.J.Hofmeister 1,235,846 - 88,862 1,461,256 1,461,256
J.J.A. Johnson 149,796 - 10,654 149,796 149,796
V. Misztowt 220,000 - 15,647 220,000 220,000
M.D. Laidlaw 220,000 - 15,647 220,000 220,000
D.J Gallagher 180,000 - 12,802 180,000 180,000
Key management personnel are not charged interest on loans provided by the company.
Other transactions with key management personnel
Profit from operations includes rent expense calculated at normal commercial terms and conditions that resulted from transactions with key management personnel or their related entities.
CONSOLIDATED COMPANY
2007 2006 2007 2006 $ $ $ $
M.J. Hofmeister as Carluke Capital Pty Ltd:
133-165 Kensington Road, Kensington 664,822 633,163 - -
259 Ruthven Street, Toowoomba 472,706 450,197 - -
M.J. Hofmeister, W. V. Hill, M.D. Laidlaw,
G.N. Fussell and others as Aquifer Properties Pty Ltd:
5 Charlie Triggs Crescent, Bundaberg 75,181 6,250 - -
Rent expense 1,212,709 1,089,610 - -
Notes to the Financial StatementsFOR THE FINANCIAL YEAR ENDED 30 JUNE 2007

CMI LIMITED ANNUAL REPORT 2007 67
27. RELATED PARTY DISCLOSURES (continued)
g) Key management personnel equity holdings
Fully Paid Ordinary Shares issued by CMI Limited
2007
Balance at 1/7/06
No.
Granted as compensation
No.
Received on exercise of
options No.
Net other change No.
Balance at 30/6/07
No.
Balance held nominally
No.
C.G. Ryan - - - - - -
D. Herceg - - - - - -
R.D. Catelan - - - 10,274,943 10,274,943 -
M.J Hofmeister 3,077,031 - 1,000,000 (4,077,031) - -
J.J.A. Johnson 150,000 - - (150,000) - -
W.V. Hill 2,564 - - (2,564) - -
M.C. Maughan 6,000 - - - 6,000 -
D.J Gallagher 120,000 - - (120,000) - -
V. Misztowt 102,564 - - - 102,564 -
M.D. Laidlaw 101,539 - - - 101,539 -
I.C. Whittle 329,104 - - - 329,104 -
G.N. Fussell 2,564 - - - 2,564 -
3,891,366 - 1,000,000 5,925,348 10,816,714 -
2006
Balance at 1/7/05
No.
Granted as compensation
No.
Received on exercise of
options No.
Net other change No.
Balance at 30/6/06
No.
Balance held nominally
No.
M.J Hofmeister 3,077,031 - - - 3,077,031 -
J.J.A. Johnson 150,000 - - - 150,000 -
W.V. Hill 2,564 - - - 2,564 -
M.C. Maughan - - - 6,000 6,000 -
D.J Gallagher 70,000 - - 50,000 120,000 -
V. Misztowt 102,564 - - - 102,564 -
M.D. Laidlaw 101,539 - - - 101,539 -
I.C. Whittle 329,104 - - - 329,104 -
G.N. Fussell 2,564 - - - 2,564 -
3,835,366 - - 56,000 3,891,366 -
Notes to the Financial StatementsFOR THE FINANCIAL YEAR ENDED 30 JUNE 2007

CMI LIMITED ANNUAL REPORT 200768
27. RELATED PARTY DISCLOSURES (continued) Partly Paid Ordinary Shares issued by CMI Limited
2007
Balance at 1/7/06
No.
Granted as compensation
No.
Transferred to Fully Paid Ordinary Shares
No.Balance at 30/6/07
No.
Balance held nominally
No.
M.J Hofmeister 750,000 - (750,000) - -
2006
Balance at 1/7/05
No.
Granted as compensation
No.
Transferred to Fully Paid Ordinary Shares
No.Balance at 30/6/06
No.
Balance held nominally
No.
M.J Hofmeister 750,000 - - 750,000 -
Class A Shares issued by CMI Limited
2007
Balance at 1/7/06
No.
Granted as compensation
No.
Received on exercise of
options No.
Net other change No.
Balance at 30/6/07
No.
Balance held nominally
No.
C.G. Ryan - - - - - -
D. Herceg - - - - - -
R.D. Catelan - - - 964,067 964,067 -
M.J Hofmeister 369,089 - - - 369,089 -
J.J.A. Johnson 20,000 - - (20,000) - -
W.V. Hill 20,250 - - (20,250) - -
D.J Gallagher 150,000 - - 17,504 167,504 -
V. Misztowt 116,667 - - - 116,667 -
M.D. Laidlaw 109,000 - - - 109,000 -
I.C. Whittle 76,284 - - (39,500) 36,784 -
G.N. Fussell 5,000 - - - 5,000 -
866,290 - - 901,821 1,768,111 -
2006
Balance at 1/7/05
No.
Granted as compensation
No.
Received on exercise of
options No.
Net other change No.
Balance at 30/6/06
No.
Balance held nominally
No.
M.J Hofmeister 369,089 - - - 369,089 -
J.J.A. Johnson 20,000 - - - 20,000 -
W.V. Hill 20,250 - - - 20,250 -
D.J Gallagher 150,000 - - - 150,000 -
V. Misztowt 116,667 - - - 116,667 -
M.D. Laidlaw 109,000 - - - 109,000 -
I.C. Whittle 76,284 - - - 76,284 -
G.N. Fussell 5,000 - - - 5,000 -
866,290 - - - 866,290 -
Notes to the Financial StatementsFOR THE FINANCIAL YEAR ENDED 30 JUNE 2007

CMI LIMITED ANNUAL REPORT 2007 69
27. RELATED PARTY DISCLOSURES (continued) Share Options issued by CMI Limited
2007
Balance at 1/7/06
No.
Granted as compens-
ation No.
Exercised No.
Net other change
No.
Balance at 30/6/07
No.
Balance vested at 30/6/07
No.
Vested but not
exercise-able No.
Vested and exercisable
No.
Options vested
during year No.
M.J Hofmeister 1,000,000 - (1,000,000) - - - - - -
J.J.A. Johnson - - - - - - - - -
W.V. Hill 200,000 - - (200,000) - - - - -
D.J Gallagher - - - - - - - - -
V. Misztowt - - - - - - - - -
M.D. Laidlaw 100,000 - - - 100,000 100,000 - 100,000 -
I.C. Whittle - - - - - - - - -
G.N. Fussell 10,000 - - - 10,000 8,000 - 8,000 2,000
J.L. Heslington 10,000 - - - 10,000 10,000 - 10,000 -
A. Vlahogenis 10,000 - - - 10,000 10,000 - 10,000 -
1,330,000 - (1,000,000) (200,000) 130,000 128,000 - 128,000 2,000
2006
Balance at 1/7/05
No.
Granted as compens-
ation No.
Exercised No.
Net other change
No.
Balance at 30/6/06
No.
Balance vested at 30/6/06
No.
Vested but not
exercise-able No.
Vested and exercisable
No.
Options vested
during year No.
M.J Hofmeister 1,000,000 - - - 1,000,000 1,000,000 - 1,000,000 -
J.J.A. Johnson - - - - - - - - -
W.V. Hill 200,000 - - - 200,000 200,000 - 200,000 -
D.J Gallagher - - - - - - - - -
V. Misztowt - - - - - - - - -
M.D. Laidlaw 100,000 - - - 100,000 100,000 - 100,000 -
I.C. Whittle - - - - - - - - -
G.N. Fussell 10,000 - - - 10,000 6,000 - 6,000 2,000
J.L. Heslington 10,000 - - - 10,000 10,000 - 10,000 -
A. Vlahogenis 10,000 - - - 10,000 10,000 - 10,000 -
1,330,000 - - - 1,330,000 1,326,000 - 1,326,000 2,000
Each share option converts into one ordinary share of CMI Limited on exercise. No amounts are paid or payable by the recipient on receipt of the option.
Further details of options are contained in Note 23 to the financial statements.
Notes to the Financial StatementsFOR THE FINANCIAL YEAR ENDED 30 JUNE 2007

CMI LIMITED ANNUAL REPORT 200770
28. SUBSIDIARIES
Name of EntityCountry of
Incorporation
Ownership Interest
2007 %
2006 %
Parent Entity:
CMI Limited Australia
Subsidiaries
CMI Limited New Zealand (i) 100 100
CMI Operations Pty Ltd Australia (ii) 100 100
TJM Products Pty Ltd Australia (ii) 100 100
Metlcast Manufacturing Pty Ltd Australia (ii), (v) - 100
Capitalcorp Finance & Leasing Pty Ltd Australia (ii) 100 100
Australian Automotive Acceptance Pty Ltd Australia (iii) 100 100
Australian Loans & Leasing (Qld) Pty Ltd Australia (iii) 100 100
Capitalcorp Technology Pty Ltd Australia (iii), (v) - 100
Smartdrive Mechanicare Pty Ltd Australia (iii), (iv) - 100
(i) This wholly-owned subsidiary carries on business in New Zealand and is audited by an associated firm of Deloitte Touche Tohmatsu, Australia.
(ii) This wholly-owned subsidiary has entered into a deed of cross guarantee with CMI Limited pursuant to ASIC Class Order 98/1418 and is relieved from the requirement to prepare an audited financial report.
(iii) This wholly-owned subsidiary is a small proprietary company and is not required to prepare an audited financial report.
(iv) This wholly-owned subsidiary was deregistered on 27 August 2006.
(v) These wholly-owned subsidiaries were wound up on 15 June 2007.
The consolidated income statement and balance sheet of entities which are party to the deed of cross guarantee are:
2007 2006 $’000 $’000
Income Statement
Revenue 256,436 270,762
Other income 2,700 2,414
Changes in inventories (1,485) (4,769)
Raw materials expense (113,723) (109,809)
Sub-contractors expense (6,766) (13,347)
Employee benefits expense (76,821) (81,692)
Repairs, maintenance and consumables expense (9,093) (10,231)
ASX and share register expense (215) (219)
Occupancy expense (11,083) (10,826)
Travel and communication expense (4,079) (3,809)
Freight and cartage expense (5,495) (5,538)
Depreciation and amortisation expense (7,070) (7,505)
Finance costs (4,389) (4,043)
Impairment of non-current assets (18,601) -
Other expenses (6,187) (5,791)
Profit/(loss) before income tax expense (5,871) 15,597
Income tax (expense)/benefit 1,608 (4,645)
Profit/(loss) from continuing operations (4,263) 10,952
Notes to the Financial StatementsFOR THE FINANCIAL YEAR ENDED 30 JUNE 2007

CMI LIMITED ANNUAL REPORT 2007 7�
28. SUBSIDIARIES (continued)
2007 2006 $’000 $’000
Balance Sheet
CURRENT ASSETS
Cash and cash equivalents 4,322 2,736
Trade and other receivables 57,496 56,501
Inventories 41,467 40,178
Current tax assets 1,171 -
104,456 99,415
Non-current assets classified as held for sale 1,032 -
TOTAL CURRENT ASSETS 105,488 99,415
NON-CURRENT ASSETS
Trade and other receivables - 100
Other financial assets 1,663 1,663
Property, plant and equipment 40,765 59,358
Goodwill 10,176 6,309
Other intangible assets 22,351 24,215
Deferred tax assets 1,068 -
TOTAL NON-CURRENT ASSETS 76,023 91,645
TOTAL ASSETS 181,511 191,060
CURRENT LIABILITIES
Trade and other payables 30,950 32,154
Borrowings 52,243 7,546
Current tax payables - 406
Provisions 7,002 11,527
TOTAL CURRENT LIABILITIES 90,195 51,633
NON-CURRENT LIABILITIES
Borrowings 6,008 45,279
Deferred tax liabilities 2,299 5,625
Provisions 5,415 2,205
TOTAL NON-CURRENT LIABILITIES 13,722 53,109
TOTAL LIABILITIES 103,917 104,742
NET ASSETS 77,594 86,318
EQUITY
Issued capital 70,103 67,999
Reserves - 120
Retained earnings 7,491 18,199
TOTAL EQUITY 77,594 86,318
Notes to the Financial StatementsFOR THE FINANCIAL YEAR ENDED 30 JUNE 2007

CMI LIMITED ANNUAL REPORT 200772
29. ACQUISITION OF BUSINESSES
Names of Businesses Acquired Principal Activity Date of Acquisition
Proportion of Shares Acquired %
Cost of Acquisition $’000
2007
XLPE Cables Electrical 11/7/06 - 6,929
4WD Megastore Group 4WD Accessories 1/6/07 - 1,879
2006
Curtis Springs Spring Manufacturing 1/5/06 - 1,297
XLPE Cables - Total consideration paid for the acquisition was $6,929 thousand for net assets acquired of $2,347 thousand, consisting primarily of inventories ($2,271 thousand). XLPE Cables principal activity is the sale of electrical cable. This transaction has been accounted for using the acquisition method of accounting. The goodwill arising on the acquisition of XLPE Cables is attributable to the anticipated future operating synergies from the business combination to the consolidated entity’s existing operations. Included in the net profit for the period is profit of $1,248 thousand attributable to the additional business generated by XLPE Cables.
4WD Megastore Group - Total consideration paid for the acquisition was $1,879 thousand for net assets acquired of $863 thousand, consisting primarily of inventories ($848 thousand). 4WD Megastore Group’s principal activity is the sale of 4WD accessories. This transaction has been accounted for using the acquisition method of accounting. The acquisition has been accounted for on a provisional basis.
The goodwill arising on the acquisition of 4WD Megastore Group is attributable to the anticipated future operating synergies from the business combination to the consolidated entity’s existing operations. Included in the net profit for the period is profit of $31 thousand attributable to the additional business generated by 4WD Megastore Group.
Curtis Springs - Total consideration paid for the acquisition was $1,297 thousand for net assets acquired of $1,297 thousand, consisting primarily of plant and equipment ($904 thousand) and inventories ($418 thousand).
Net assets acquired
XLPE Cables
Book Value $’000
Fair Value Adjustment
$’000
Fair Value on Acquisition
$’000
Current assets:
Trade and other receivables 10 - 10
Inventories 2,256 15 2,271
Non-current assets:
Plant and equipment 99 15 114
Deferred tax assets 12 - 12
Current liabilities:
Trade and other payables (25) - (25)
Provisions (39) 4 (35)
2,313 34 2,347
Goodwill on acquisition 4,582
6,929
Notes to the Financial StatementsFOR THE FINANCIAL YEAR ENDED 30 JUNE 2007

CMI LIMITED ANNUAL REPORT 2007 73
29. ACQUISITION OF BUSINESSES (continued)
Net assets acquired
4WD Megastore Group
Book Value $’000
Provisional Fair Value Adjustment
$’000
Provisional Fair Value on Acquisition
$’000
Current assets:
Trade and other receivables 3 - 3
Inventories 853 (5) 848
Non-current assets:
Plant and equipment 51 (12) 39
Deferred tax assets 7 - 7
Current liabilities:
Trade and other payables (11) - (11)
Provisions (23) - (23)
880 (17) 863
Goodwill on acquisition 1,016
1,879
Further details of the businesses acquired during the financial year are disclosed in note 30(c) to the financial statements.
Notes to the Financial StatementsFOR THE FINANCIAL YEAR ENDED 30 JUNE 2007

CMI LIMITED ANNUAL REPORT 200774
CONSOLIDATED COMPANY
2007 2006 2007 2006 $’000 $’000 $’000 $’000
30. NOTES TO THE CASH FLOW STATEMENT
a)Reconciliationofcashandcashequivalents
For the purposes of the cash flow statement, cash and cash equivalents includes cash on hand and in banks and investments in money market instruments, net of outstanding bank overdrafts. Cash and cash equivalents at the end of the year as shown in the cash flow statement is reconciled to the related items in the balance sheet as follows:
Cash and cash equivalents 4,724 3,461 - -
Bank overdraft (62) (28) - -
4,662 3,433 - -
b)Reconciliationofprofitfortheperiodtonetcashflowsfromoperatingactivities
Profit/(loss) for the period (3,840) 11,197 6,999 7,087
(Gain)/Loss on disposal of non-current assets (76) 110 (3) (3)
Depreciation and amortisation of non-current assets 7,379 7,730 - -
Interest income received and receivable (254) (278) - -
Finance lease interest 926 1,162 - -
Impairment of non-current assets 18,601 - - -
Equity settled share-based payment 47 54 - -
Unrealised foreign exchange (gain)/loss (162) 5 - -
Increase/(Decrease) in current tax liability (1,451) (3,255) (1,759) (4,092)
Increase/(Decrease) in deferred tax (4,316) 1,008 128 109
Changes in net assets and liabilities, net of effects from acquisition of businesses:
(Increase)/Decrease in:
Current receivables (1,614) 8,874 - -
Current inventories 2,025 4,786 - -
Increase/(Decrease) in:
Current payables (1,186) (6,437) - -
Current borrowings - - (9,184) (9,434)
Current provisions (4,538) (699) - -
Non-current provisions 3,210 3 - -
Net cash from Operating Activities 14,751 24,260 (3,819) (6,333)
Notes to the Financial StatementsFOR THE FINANCIAL YEAR ENDED 30 JUNE 2007

CMI LIMITED ANNUAL REPORT 2007 75
CONSOLIDATED COMPANY
2007 2006 2007 2006 $’000 $’000 $’000 $’000
30. NOTES TO THE CASH FLOW STATEMENT (Continued)
c)BusinessesAcquired
During the financial year, a business was acquired. Details of the acquisition are as follows (note 29):
Consideration
Cash and cash equivalents 8,808 1,297 - -
Amount payable - - - -
8,808 1,297 - -
Fair Value of Net Assets Acquired
Current Assets
Cash and cash equivalents - - - -
Receivables 13 8 - -
Inventories 3,119 418 - -
Non-Current Assets
Other financial assets - - - -
Property, Plant and Equipment 153 904 - -
Deferred Tax Assets 19 34 - -
Current Liabilities
Payables (36) (33) - -
Borrowings - - - -
Current tax liabilities - - - -
Provisions (58) (34) - -
Non-Current Liabilities
Borrowings - - - -
Provisions - - - -
Net assets acquired 3,210 1,297 - -
Brandname on acquisition - - - -
Goodwill on acquisition 5,598 - - -
8,808 1,297 - -
Net cash (inflow)/outflow on acquisition
Cash and cash equivalents consideration 8,808 1,297 - -
Less cash and cash equivalent balances acquired - - - -
8,808 1,297 - -
d)Non-cashfinancingandinvestingactivities
During the financial year, the consolidated entity acquired plant and equipment with an aggregate fair value of $2,404 thousand (2006: $3,112 thousand) by means of finance leases. These acquisitions are not reflected in the cash flow statement. During the financial year, the economic entity bought back 3,857,020 ordinary shares. Consideration paid was $0.60 cash plus 1 Class A share for every ordinary share bought back. The issue of 1,928,569 Class A shares is not reflected in the cash flow statement. During the financial year, the economic entity issued shares to directors and executives with a total value of $2,850 thousand (2006: $225 thousand) by way of a loan account. These share issues and loans are not reflected in the cash flow statement.
Notes to the Financial StatementsFOR THE FINANCIAL YEAR ENDED 30 JUNE 2007

CMI LIMITED ANNUAL REPORT 200776
CONSOLIDATED COMPANY
2007 2006 2007 2006 $’000 $’000 $’000 $’000
30. NOTES TO THE CASH FLOW STATEMENT (Continued)
e)FinancingFacilities
The consolidated entity has the following finance facilities available:
(i) A Multi-Option and Bill Acceptance/Discount Facility with National Australia Bank Limited, reviewed annually
Amount Used 47,500 39,500 47,500 39,500
Amount Unused 7,325 6,175 7,325 6,175
54,825 45,675 54,825 45,675
31. CONTINGENT LIABILITY
Guarantees issued to bank in respect of overseas purchases, lease of premises and sand mining lease (i) 302 290 301 288
Guarantees arising from the deed of cross-guarantee with other entities in the wholly-owned group (ii) - - 96,848 97,516
302 290 97,149 97,804
(i) A number of contingent liabilities arise as a result of guarantees made directly to financing organisations in respect of overseas purchases, lease of premises, sand mining lease and payment of business. The amount disclosed represents the aggregate amount of such guarantees. The extent to which an outflow of funds will be required is dependent on the satisfaction of the obligations under the terms of the overseas purchases, leases and loans subject to the guarantees.
(ii) As detailed in note 28, the company has entered into a deed of cross-guarantee with certain wholly-owned subsidiaries. The amount disclosed as a contingent liability represents total liabilities of the group of companies party to that class order less the liabilities of the parent entity. The extent to which an outflow of funds will be required is dependent on the future operations of the entities that are party to the deed of cross guarantee being more or less favourable than currently expected. The deed of cross guarantee will continue to operate indefinitely.
Notes to the Financial StatementsFOR THE FINANCIAL YEAR ENDED 30 JUNE 2007

CMI LIMITED ANNUAL REPORT 2007 77
32. FINANCIAL INSTRUMENTS
(a) Financial Risk Management Objectives
The consolidated entity’s corporate treasury function provides services to the business, co-ordinates access to domestic financial markets, and manages the financial risks relating to the operations of the consolidated entity.
The consolidated entity does not enter into or trade financial instruments, including derivative financial instruments, for speculative purposes. The use of financial derivatives is governed by the consolidated entity’s policies approved by the board of directors, which provide written principles on the use of financial derivatives.
The consolidated entity’s activities expose it primarily to the financial risks of changes in foreign currency exchange rates and interest rates.
(b) Significant Accounting Policies
Details of the significant accounting policies and methods adopted, including the criteria for recognition, the basis of measurement and the basis on which income and expenses are recognised, in respect of each class of financial asset, financial liability and equity instrument are disclosed in note 1 to the financial statements.
(c) Interest Rate Risk Management
The consolidated entity is exposed to interest rate risk as it borrows funds at both fixed and floating interest rates. The risk is managed by maintaining an appropriate mix between fixed and floating rate borrowings. The following table details the consolidated entity’s exposure to interest rate risk as at 30 June 2007:
2007
Weighted Average Effective
Interest Rate %
Variable Interest Rate
$’000
Fixed Maturity Dates
Non-Interest Bearing $’000
Total $’000
Less than 1 Year
$’0001 to 5 Years
$’000
Financial Assets
Cash and cash equivalents 5.8 4,710 - - 14 4,724
Trade receivables - - - - 48,823 48,823
Other receivables - - - - 6,411 6,411
Other loans - - - - - -
4,710 - - 55,248 59,958
Financial Liabilities
Trade payables - - - - 18,643 18,643
Other payables - - - - 13,155 13,155
Bank overdraft 11.2 62 - - - 62
Bills of exchange 7.2 24,500 - 23,000 - 47,500
Other loans 10.2 - 51 - - 51
Finance lease liabilities 7.7 - 4,682 6,008 - 10,690
Employee benefits - - - - 12,447 12,447
Make Good - - - - 23 23
Rebates - - - - 234 234
24,562 4,733 29,008 44,502 102,805
Notes to the Financial StatementsFOR THE FINANCIAL YEAR ENDED 30 JUNE 2007

CMI LIMITED ANNUAL REPORT 200778
32. FINANCIAL INSTRUMENTS (continued)
The following table details the consolidated entity’s exposure to interest rate risk as at 30 June 2006:
2006
Weighted Average Effective
Interest Rate %
Fixed Maturity Dates
Non-Interest Bearing $’000
Total $’000
Variable Interest rate
$’000
Less than 1 Year
$’0001 to 5 Years
$’000
Financial Assets
Cash and cash equivalents 5.5 3,452 - - 9 3,461
Trade receivables - - - - 47,248 47,248
Other receivables - - - - 6,319 6,319
Other loans - - - - 100 100
3,452 - - 53,676 57,128
Financial Liabilities
Trade payables - - - - 23,005 23,005
Other payables - - - - 9,867 9,867
Bank overdraft 10.7 28 - - - 28
Bills of exchange 7.1 16,500 - 23,000 - 39,500
Other loans 9.9 - 78 46 - 124
Finance lease liabilities 8.2 - 5,754 7,528 - 13,282
Employee benefits - - - - 13,502 13,502
Make Good - - - - 190 190
Rebates - - - - 259 259
16,528 5,832 30,574 46,823 99,757
(d) Foreign Currency Risk Management
The group undertakes certain transactions denominated in foreign currencies, hence exposures to exchange rate fluctuations arise. Exchange rate exposures are managed within approved policy parameters utilising forward foreign exchange contracts. There were no forward foreign currency contacts outstanding as at the reporting date (2006: Nil).
(e) Credit Risk Management
Credit risk refers to the risk that a counterparty will default on its contractual obligations resulting in financial loss to the consolidated entity. The consolidated entity has adopted the policy of only dealing with creditworthy counterparties and obtaining sufficient collateral or other security where appropriate, as a means of mitigating the risk of financial loss from defaults. The consolidated entity measures credit risk on a fair value basis.
Trade accounts receivable consist of a large number of customers, spread across diverse industries and geographical areas. Ongoing credit evaluation is performed on the financial condition of accounts receivable.
The consolidated entity does not have any significant credit risk exposure to any single counterparty or any group of counterparties having similar characteristics. The credit risk on liquid funds is limited because the counterparties are banks with high credit-ratings assigned by international credit-rating agencies.
The carrying amount of financial assets recorded in the financial statements, net of any allowances for losses, represents the consolidated entity’s maximum exposure to credit risk without taking account of the value of any collateral or other security obtained.
Notes to the Financial StatementsFOR THE FINANCIAL YEAR ENDED 30 JUNE 2007

CMI LIMITED ANNUAL REPORT 2007 79
32. FINANCIAL INSTRUMENTS (continued)
(f) Fair Value of Financial Instruments
The directors consider that the carrying amount of financial assets and financial liabilities recorded in the financial statements approximates their fair values.
The fair values and net fair value of financial assets and financial liabilities have been determined as follows:
• The fair value of financial assets and financial liabilities with standard terms and conditions and traded on active liquid markets are determined with reference to quoted market prices; and
• The fair value of other financial assets and financial liabilities are determined in accordance with generally accepted pricing models based on discounted cash flow theory.
Transaction costs are included in the determination of net fair value.
(g) Liquidity Risk Management
The consolidated entity manages liquidity risk by maintaining adequate reserves and banking facilities and by continuously monitoring forecast and actual cash flows and matching the maturity profiles of financial assets and liabilities.
33. ADDITIONAL COMPANY INFORMATION
CMI Limited is a listed public company, incorporated and operating in Australia, New Zealand and the United States of America.
CMI Limited’s registered office and principal place of business is:
Level 4, 240 Margaret Street Brisbane, Qld, 4000 Tel: (07) 3004 8188
CONSOLIDATED COMPANY
2007 2006 2007 2006 $’000 $’000 $’000 $’000
34. NON-CURRENT ASSETS CLASSIFIED AS HELD FOR SALE
Plant and equipment held for sale (i) 1,032 - - -
(i) The consolidated entity intends to dispose of plant and equipment it no longer utilises in the next 6 months. The plant and equipment was previously used in the consolidated entity’s engineered components operations. A sale agreement for this plant and equipment has been executed. No impairment loss was recognised on reclassification of the plant and equipment as held for sale at reporting date.
Notes to the Financial StatementsFOR THE FINANCIAL YEAR ENDED 30 JUNE 2007

CMI LIMITED ANNUAL REPORT 200780
The following additional information is required by the Australian Stock Exchange Limited.
1. ORDINARY SHAREHOLDER INFORMATION
The following information with respect to 33,752,634 fully paid ordinary shares on issue reflects the Share Register at that date.
a) There were 2,206 holders of fully paid ordinary shares. All fully paid ordinary shares of the company carry one vote per share on poll, or one vote per member on a show of hands.
b) Distribution of shareholders: Number
1 - 1,000 shares 520
1,001 - 5,000 shares 842
5,001 - 10,000 shares 400
10,001 - 100,000 shares 424
100,001 - and over 20
Total 2,206
c) The number of shareholdings held in less than a marketable parcel - 199
d) Twenty largest shareholders:
Shareholder
Fully PaidOrdinaryShares
PercentageFullyPaid
RP Prospects Pty Ltd 10,274,943 30.44
Farallon Capital Pty Ltd 3,012,307 8.92
Cogent Nominees Pty Limited 973,993 2.89
Mr Philip Gordon Greenham 495,844 1.47
Citicorp Nominees Pty Ltd 438,793 1.30
Mellett Super Pty Ltd 384,320 1.14
UKI Capital Pty Limited 329,104 .98
Ms Rosalie Catherine Vaughan 308,052 .91
Almargem Pty Ltd 259,038 .77
Bond Street Custodians Limited 227,086 .67
Donald Cant Pty Ltd 208,128 .62
Bowtrust Pty Ltd 200,000 .59
JP Morgan Nominees Australia Limited 172,718 .51
Contemplator Pty Ltd 170,005 .50
Mr Evan Philip Clucas & Ms Leanne Jane Weston 161,975 .48
Australian Executor Trustees Limited 152,361 .45
Barham Pty Ltd 130,128 .39
Katavi Pty Ltd 125,000 .37
Merged Funds Pty Ltd 115,064 .34
Mr Simon Peter Ferguson 105,000 .31
Total 18,243,859 54.05
Shareholder InformationAS AT 21 SEPTEMBER 2007

CMI LIMITED ANNUAL REPORT 2007 8�
e) The names of substantial shareholders are:
Shareholder Number Percentage
RP Prospects Pty Ltd 10,274,943 30.44
Farallon Capital Pty Ltd 3,012,307 8.92
Cogent Nominees Pty Limited 973,993 2.89
2. CLASS A SHAREHOLDER INFORMATION
The following information with respect to 28,005,311 fully paid Class A shares on issue reflects the Share Register at that date
a) There were 2,090 holders of Class A shares. All issued Class A shares of the company carry one vote per share, however the right to vote is restricted broadly speaking to matters concerning such shareholders.
b) Distribution of shareholders: Number
1 - 1,000 shares 241
1,001 - 5,000 shares 709
5,001 - 10,000 shares 485
10,001 - 100,000 shares 627
100,001 - and over 28
Total 2,090
c) The number of shareholdings held in less than a marketable parcel - 62
d) Twenty largest shareholders:
Shareholder
Fully PaidClass AShares
PercentageFullyPaid
Cooltrac Pty Ltd 1,321,700 4.72
RP Prospects Pty Ltd 964,067 3.44
Contemplator Pty Ltd 528,392 1.89
Cogent Nominees Pty Limited 514,196 1.84
Carluke Capital Pty Ltd 369,089 1.32
Mr Charles Gilbert Farer-Hickey & Mr Claude Farer-Hickey 347,600 1.24
Dovedale Management Pty Ltd 291,888 1.04
JWV Holdings Pty Ltd 233,334 .83
Australian Executor Trustees Limited 227,371 .81
Ago Pty Ltd 214,400 .77
Mrs Margaret Brown 200,000 .71
Mr Simon Christopher Fraser & Mrs Elizabeth Jane Fraser 170,000 .61
Mr Leslie Charles Smith 166,393 .59
Les Smith Nominees Pty Ltd 157,022 .56
Ozone Protected Systems Pty Limited 150,352 .54
General Packaging Pty Ltd 150,100 .54
Mr Daniel James Gallagher 150,000 .54
Mr David Gordon 137,750 .49
Ms Rosalie Catherine Vaughan 126,703 .45
Mr James Wilson & Mrs Barbara Louise Wilson 125,000 .45
Total 6,545,357 23.38
Shareholder InformationAS AT 21 SEPTEMBER 2007

CMI LIMITED ANNUAL REPORT 200782
e) The names of substantial shareholders are:
Shareholder Number Percentage
Cooltrac Pty Ltd 1,321,700 4.72
RP Prospects Pty Ltd 964,067 3.44
Contemplator Pty Ltd 528,392 1.89
3. STOCK EXCHANGE LISTING
Quotation has been granted for all fully paid ordinary and Class A shares of the company on all Member Exchanges of the Australia Stock Exchange Limited.
4. THERE IS NO CONTINGENT LIABILITY REQUIRED FOR TERMINATION BENEFITS UNDER SERVICE AGREEMENTS WITH DIRECTORS.
5. AN AUDIT COMMITTEE WAS IN EXISTENCE DURING THE YEAR.
6. OPTIONS
142,500 options are held by 7 individual option holders. Options do not carry a right to vote.
7. ON MARKET BUY BACK
There is no current on-market buy-back.
Shareholder InformationAS AT 21 SEPTEMBER 2007

CMI LIMITED ANNUAL REPORT 2007 83
Corporate Directory
Registered Office
(Head Office)
Level 4, 240 Margaret Street Brisbane QLD 4000 Telephone: 07 3004 8188 Facsimile: 07 3004 8180 Email: [email protected] www.cmilimited.com.au ACN: 050 542 553
Directors
Colin Ryan AM (Chairman)
Raymond Catelan
Danny Herceg
Secretary
Mark Laidlaw
Auditor
Deloitte Touche Tohmatsu
Level 26, Riverside Centre 123 Eagle Street Brisbane QLD 4000
Bankers
National Australia Bank Limited
Level 20, 100 Creek Street Brisbane QLD 4000
Share Registry
Link Market Services Limited
Locked Bag A14 Sydney South NSW 1235 Telephone: 02 8280 7454 Facsimile: 02 9287 0309
Lawyers
McCullough Robertson Lawyers
Level 11, Central Plaza Two 66 Eagle Street Brisbane QLD 4000
ASX Codes
CMI - ordinary shares
CMIPC - Class A shares

CMI LIMITED ANNUAL REPORT 200784
This page has been left blank intentionally.


CMI Limited Annual Report 2007
CM
I LIM
Ite
d A
nn
uA
L R
epo
Rt
2007


