CME Commodity Trading Manual - Futures Trading … · CME Commodity Trading Manual. This book was...
116
CME Commodity Trading Manual
-
Upload
nguyenkiet -
Category
Documents
-
view
218 -
download
0
Transcript of CME Commodity Trading Manual - Futures Trading … · CME Commodity Trading Manual. This book was...
CME Commodity Trading Manual
This book was originally designed as a guide for teachers of highschool agricultural education programs. It contained supplementalmaterials and study pages, and was one of the first organizedcommodity marketing courses for high school students.
The original course was funded by Chicago Mercantile Exchange(CME) in conjunction with the National FFA Foundation and theStewart-Peterson Advisory Group. Several individuals contributed tothe project, including high school instructors to whom CME is grateful.
The success of the course in the schools has prompted CME to redesignthe book as a textbook, revise and update it once again, and make itavailable to anyone who wishes to gain a comprehensive introductionto commodity marketing.
To the Reader...
Chapter One MARKETING BASICS . . . . . . . . . . . . . . . . . . . . . . . . . . . . . . . . . . . . . . . . . . . . . 1An overview of the futures market and its development; marketing alternatives
Chapter Two FUTURES MARKETS . . . . . . . . . . . . . . . . . . . . . . . . . . . . . . . . . . . . . . . . . . . . . 13How producers use the futures market for the sale or purchase of commodities
Chapter Three THE BROKERAGE ACCOUNT . . . . . . . . . . . . . . . . . . . . . . . . . . . . . . . . . . . . . . 27Practical information regarding choosing a broker and placing orders
Chapter Four SUPPLY AND DEMAND . . . . . . . . . . . . . . . . . . . . . . . . . . . . . . . . . . . . . . . . . . 37Factors that affect supply and demand and the impact on projecting prices for commodities
Chapter Five ANALYTICAL TOOLS . . . . . . . . . . . . . . . . . . . . . . . . . . . . . . . . . . . . . . . . . . . . 49Introduction to technical analysis and charting
Chapter Six OPTIONS TERMS . . . . . . . . . . . . . . . . . . . . . . . . . . . . . . . . . . . . . . . . . . . . . . . 63Introduction to options and how to use them to hedge a sale or purchase
Chapter Seven OPTIONS STRATEGIES . . . . . . . . . . . . . . . . . . . . . . . . . . . . . . . . . . . . . . . . . . . 77Selling and purchasing strategies
Chapter Eight MARKETING MATH . . . . . . . . . . . . . . . . . . . . . . . . . . . . . . . . . . . . . . . . . . . . . 91
Answer Keys for Chapter Exercises . . . . . . . . . . . . . . . . . . . . . . . . . . . . . . . . . . . . . . . 105
Glossary . . . . . . . . . . . . . . . . . . . . . . . . . . . . . . . . . . . . . . . . . . . . . . . . . . . . . . . . . . . . . . . . . . . . . . . . 107
Table of Contents
Chapter One | Marketing Basics
1
Marketing Choices
Producers have four marketing alternatives.
If you are involved in the production of agricultural commodities, you can price your commoditiesusing one or more combinations of these four alternatives:
• Cash sales • Forward contracts • Futures contracts • Options on futures contracts
1. With cash sales you deliver your crop or livestock to the cash markets (such as the grainelevator or meat packer) and receive the price for the day. You get cash right away, and thetransaction is easy to complete. But using this alternative, you have only one chance to sell.You take what you can get. This is actually one of the riskiest marketing alternatives forproducers.
2. A forward contract is negotiated now for delivery later. It is easy to understand. You enter a contract with the buyer who agrees to buy a specified quantity and quality of the commodityat a specified price at the time of delivery. The price is locked in, and you are protected if pricesfall. However, you cannot take advantage of price increases, and you must deliver the specifiedamount, even if you have a crop failure. Both parties have some risk that the other will nothonor the contract.
Chapter 1Marketing Basics
Chapter One Objectives
• To understand the evolution of the commodity marketplace• To understand the role commodity exchanges play in the market• To learn the four marketing alternatives and to be able to describe their advantages and
disadvantages• To introduce the basic vocabulary of the commodities trading marketplace• To learn about cash sales and forward contracts
Commodity Marketing
2
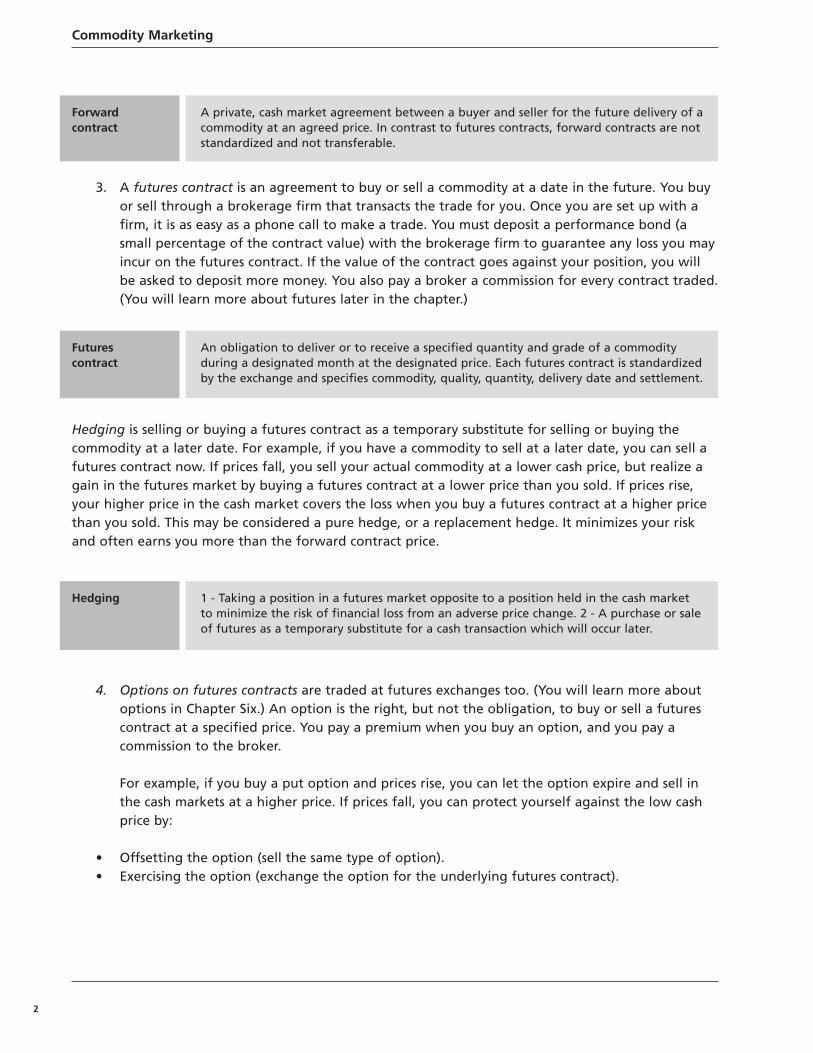
3. A futures contract is an agreement to buy or sell a commodity at a date in the future. You buyor sell through a brokerage firm that transacts the trade for you. Once you are set up with afirm, it is as easy as a phone call to make a trade. You must deposit a performance bond (asmall percentage of the contract value) with the brokerage firm to guarantee any loss you mayincur on the futures contract. If the value of the contract goes against your position, you willbe asked to deposit more money. You also pay a broker a commission for every contract traded.(You will learn more about futures later in the chapter.)
Hedging is selling or buying a futures contract as a temporary substitute for selling or buying thecommodity at a later date. For example, if you have a commodity to sell at a later date, you can sell afutures contract now. If prices fall, you sell your actual commodity at a lower cash price, but realize again in the futures market by buying a futures contract at a lower price than you sold. If prices rise,your higher price in the cash market covers the loss when you buy a futures contract at a higher pricethan you sold. This may be considered a pure hedge, or a replacement hedge. It minimizes your riskand often earns you more than the forward contract price.
4. Options on futures contracts are traded at futures exchanges too. (You will learn more aboutoptions in Chapter Six.) An option is the right, but not the obligation, to buy or sell a futurescontract at a specified price. You pay a premium when you buy an option, and you pay acommission to the broker.
For example, if you buy a put option and prices rise, you can let the option expire and sell inthe cash markets at a higher price. If prices fall, you can protect yourself against the low cashprice by:
• Offsetting the option (sell the same type of option). • Exercising the option (exchange the option for the underlying futures contract).
Forwardcontract
A private, cash market agreement between a buyer and seller for the future delivery of acommodity at an agreed price. In contrast to futures contracts, forward contracts are notstandardized and not transferable.
Futurescontract
An obligation to deliver or to receive a specified quantity and grade of a commodityduring a designated month at the designated price. Each futures contract is standardizedby the exchange and specifies commodity, quality, quantity, delivery date and settlement.
Hedging 1 - Taking a position in a futures market opposite to a position held in the cash marketto minimize the risk of financial loss from an adverse price change. 2 - A purchase or saleof futures as a temporary substitute for a cash transaction which will occur later.
Chapter One | Marketing Basics
3
Cash Sales
Cash sales involve risk for the producer.
As a producer of corn, wheat, soybeans, cattle, hogs or dairy products, you will eventually sell yourcommodity in the cash markets. You can sell directly in your local markets or negotiate a forwardcontract for sale at a later date. Even if you sell futures contracts or buy options to sell futures, you willclose out your position and sell your commodity in the cash markets. Very few futures contracts areactually delivered.
If you are selling grain or livestock on a cash basis, the terms are negotiated when you bring in thegrain or livestock. The price is established then and there, and you make immediate delivery andreceive payment. This type of sale occurs at elevators, terminals, packing houses and auction markets.
Option The right, but not the obligation, to sell or buy the underlying (in this case, a futurescontract) at a specified price on or before a certain expiration date. There are twotypes of options: call options and put options. Each offers an opportunity to takeadvantage of futures price moves without actually having a futures position.
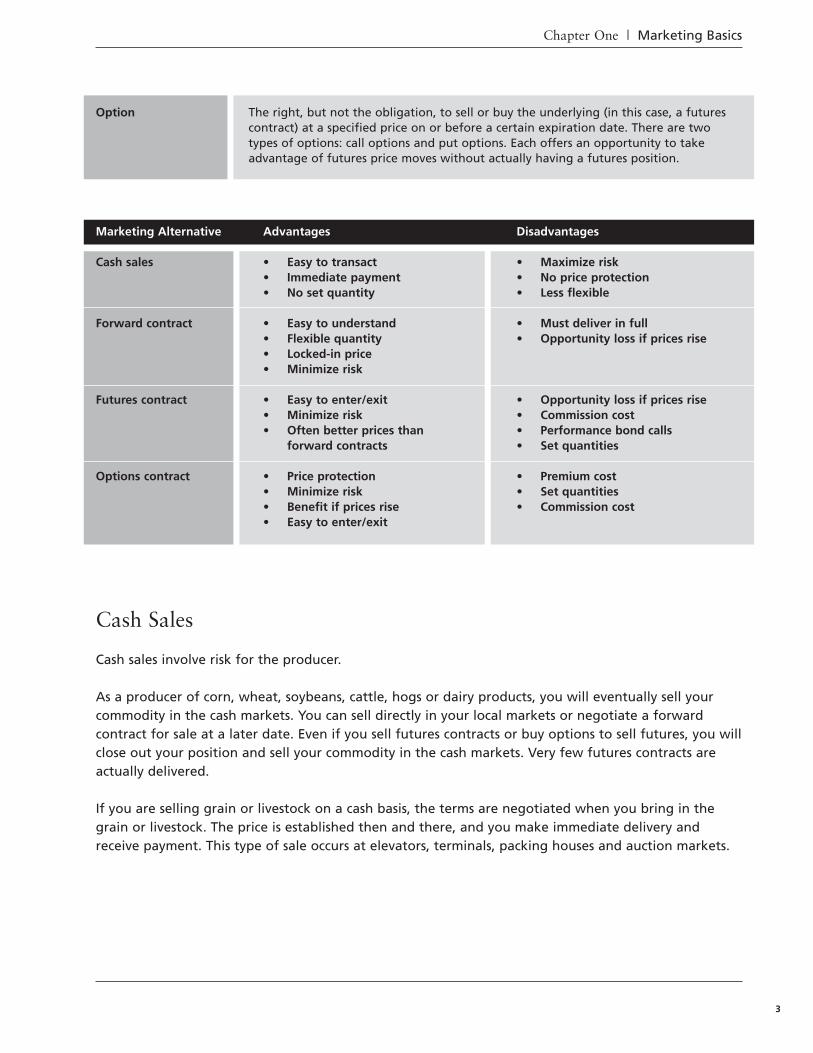
Marketing Alternative
Cash sales
Forward contract
Futures contract
Options contract
Advantages
• Easy to transact • Immediate payment • No set quantity
• Easy to understand • Flexible quantity • Locked-in price • Minimize risk
• Easy to enter/exit • Minimize risk • Often better prices than
forward contracts
• Price protection • Minimize risk • Benefit if prices rise • Easy to enter/exit
Disadvantages
• Maximize risk • No price protection • Less flexible
• Must deliver in full • Opportunity loss if prices rise
• Opportunity loss if prices rise• Commission cost • Performance bond calls • Set quantities
• Premium cost • Set quantities • Commission cost
Commodity Marketing
4
You can choose when to sell grains in the cash market. You can sell at harvest or store the grain untillater when you expect prices to be better. Because of storage costs, there is risk involved in waiting forprices to rise. For example, if it costs you $0.05/bushel per month to store soybeans, then the price fourmonths from now would have to be more than $0.20/bushel ($0.05 x 4 months) better than harvestprices for you to gain any advantage over selling at harvest.
You can also make a cash sale with a deferred pricing agreement. You deliver the commodity andagree with the buyer to price it at a later time. For example, you may deliver corn in October and priceit at any time between then and March. In this way, you transfer the physical risk of having the cornand the storage cost, and you may be able to get a higher price for the corn. Of course, there is theadded risk of the elevator’s financial stability.
Forward Contracts
You can negotiate a forward contract with your local merchant for future delivery of your crop orlivestock. You and the buyer agree on quantity, quality, delivery time, location and price. This shouldbe a written contract. Once you enter into this contract, you eliminate the risk of falling prices.However, if prices go higher at delivery time, you’ll still receive the negotiated price.
When you make delivery, it will be inspected before payment is made. There may be a premium ordiscount in price if quality or quantity vary.
Cash Markets• Cash Sales/Deferred Pricing• Forward Pricing/Basis Contract
A basis contract is another method of forward contracting. In this case, you lock in a basis relating to aspecified futures contract. When you deliver, the price you receive is the current price of the specifiedfutures contract adjusted by the basis you agreed upon. For example, if a basis of $0.20 under wasspecified in the contract and the futures price is $3.04 on the delivery date, then the cash price youreceive is $2.84 ($3.04 + -$0.20 = $2.84). You need to know the local basis patterns before entering intothis type of forward contract.
Basis
The relationship of the local cash market price and futures market price is called basis. The value ofbasis is calculated by subtracting the price of the nearby futures contract from the local cash marketprice. For example, if the cash price for corn is $2.80 and the futures price is $3.00, then the basis is$0.20 under ($2.80 – $3.00 = -$0.20). With a cash price of $2.95 and a futures price of $2.90, the basis is$0.05 over ($2.95 – $2.90 = $0.05).
Basis = Cash Price - Futures Price
Chapter One | Marketing Basics
5
Storable commodity futures prices reflect the cost of delivering a commodity to a specific place. Cashprices reflect the cost of delivering (perhaps a different quality) to a different place. These costsinclude transportation, carrying charges such as storage costs for grain, and marketing costs such asweight shrinkage for livestock. Basis reflects supply and demand for a given commodity in a givenlocation along with the cost of delivering (perhaps a different quality) to a different place.
NOTE: In your area, people may consider basis to be futures minus cash. However, in this course, as inmost works on futures, the formula used is cash minus futures.
Basis varies from one location to another. Depending on the circumstances of the local market, thebasis may be consistently positive (over) or negative (under). Each local market has its own pattern.Storable commodity basis also changes during the life of the futures contract. Basis tends to start wide,but the threat of delivery on the futures contract generally causes the basis to narrow. That is, thefutures price moves closer to the delivery point cash price during the delivery month.
Evolution of Futures
The first futures contracts were established in Chicago.
No one person invented futures trading, and no one invented the futures exchanges at which thistrading takes place. The futures market evolved out of the circumstances of the market and the needto improve the existing marketing system. This evolution took place over a long period of time fromthe practice of forward contracting.
It all started in Chicago. Chicago was a growing city in the 1830s and a center for the sale of grainsgrown nearby to be shipped to the East.
In the 1840s, farmers spread over the countryside farther and farther away from Chicago where saleswere transacted. Local merchants began to buy corn from farmers for subsequent sale in Chicago.
Basis The difference between the spot or cash price and the futures price of the same or arelated commodity. Basis is usually computed to the near future, and may representdifferent time periods, product forms, qualities and locations. The local cash market priceminus the price of the nearby futures contract. A private, cash market agreement betweena buyer and seller for the future delivery of a commodity at an agreed price. In contrast tofutures contracts, forward contracts are not standardized and not transferable.
Basis • Basis is the local cash price for a commodity minus the futures market price. • When basis becomes more positive, it is said to strengthen.• When basis becomes less positive, it is said to weaken.
Commodity Marketing
6
By the early 1850s, the local merchants began to sell corn to the Chicago merchants on time contracts,or forward contracts, to minimize their risk. The farmers risked not having anyone buy their corn orhaving to sell at rock-bottom prices. The merchants risked not having any corn to buy or having to buyat sky-high prices. The forward contract set forth the amount of corn to be sold at a future date at anagreed-upon price. Forward contracts in wheat also started in the early 1850s.
As soon as the forward contract became the usual way of doing business, speculators appeared. Theydid not intend to buy or sell the commodity. Instead, they traded contracts in hope of making a profit.Speculation itself became a business activity. Contracts could change hands many times before theactual delivery of the corn. During this time, contracts were negotiated and traded in public squaresand on street curbs.
The Board of Trade of the City of Chicago (CBOT) had been organized in 1848 with the intention topromote commerce. In 1859, the state of Illinois authorized the Board of Trade to develop qualitystandards and to measure, gauge, weigh and inspect grain. This made the process of buying andselling grain and the trading of forward contracts more efficient. Trading moved from the street to ameeting place that the Board of Trade provided.
At first, there was little control over the trading of forward contracts. Sometimes, people disappearedwhen the time came to settle contracts, and others could not pay. In 1865, the CBOT issued generalrules setting forth:
• A requirement for a margin, or good faith, deposit • Standardized contract terms for quantity and quality of the commodity and delivery procedures • Payment terms
They called these standardized contracts futures contracts. All the ingredients for futures trading werenow in place. In the years following, the Board gradually extended its control and developed furtherrules, driven by disputes and problems that arose.
There were as many as 1600 commodity exchanges formed in the 1880s.
In 1874, merchants formed the Chicago Produce Exchange, which dealt primarily with butter, eggs,poultry and other farm products. It was later named the Chicago Butter and Egg Board. In 1919, itbecame the Chicago Mercantile Exchange (CME).
Across the country a similar evolution was taking place. Forward contracts in cotton were reported inNew York in the 1850s, although it would be 20 years before the New York Cotton Exchange wasorganized. New Orleans started its own cotton exchange in 1870. Grain exchanges began inMinneapolis, Duluth, Milwaukee, Omaha, Kansas City, St. Louis, Toledo, Baltimore, San Francisco andNew York.
Many commodity exchanges have been organized since 1848. Some are still here today. Others haveclosed or merged with other exchanges.
Chapter One | Marketing Basics
7
Futures contracts have evolved over the years. CME developed such features as cash settlement (nophysical delivery is involved; only the change in price is settled at the contract maturity) and electronictrading. But successful futures contracts – those with adequate volume for both hedgers andspeculators – generally have certain features in common.
The underlying cash commodity market should be large, with a substantial deliverable supply (toprevent market manipulation) and easily available, up-to-date price information. The commodityshould also be fungible, meaning that the units of the commodity should be very similar. There is verylittle difference between one bushel of corn and another. The commodity should also have substantialprice volatility, because it is the hedger’s need for risk management that ultimately fuels trading.
Futures trading evolved from the circumstances and needs of the markets, and it is still changing today.Some commodities have been traded for over a hundred years, some have been dropped from theexchanges for lack of trading activity, and others have been added only recently. For example, CMEintroduced futures based on live animals in the 1960s (cattle and hogs), currency futures in the 1970s,stock index and interest rate futures in the 1980s and many new contracts in the 1990s, including milk,butter and cheese futures. CME continues to add contracts: most recently, options and futures on realestate and weather.
Some CME Weather contracts are based on temperature differences from an average, some on thenumber of days frost occurs, and others on the amount of snowfall in a given location. Derivativeproducts are also traded on economic announcements, such as economic growth and unemploymentstatistics.
Futures trading is a global industry, and CME futures can be traded electronically outside the UnitedStates in more than 80 countries and foreign territories through approximately 110 direct connectionsto the CME Globex® electronic trading platform.
Regulation
Both the exchanges and the government play a role in regulating futures market activity.
The rules set forth by the CBOT in 1865 and by the other developing exchanges across the countryformalized the practice of futures trading, but by no means got rid of problems associated with thisspeculative activity. In the years to follow there were situations of fraud and attempts to manipulatethe market. As new problems arose, the commodity exchanges continued to refine the rules ofbehavior required of their members.
Federal Regulation• Grain Futures Act of 1922• Commodity Exchange Act of 1936 • Commodity Futures Trading Act of 1974, birth of CFTC • Commodity Exchange Act of 1981, birth of NFA• Commodity Futures Modernization Act of 2000
Commodity Marketing
8
Government initially took a negative view. Outwardly, few of the benefits of futures trading wereapparent. It looked like feverish speculation, spectacular price fluctuations and trouble for farmers. For50 years from the 1860s onward, bills were introduced in both state legislatures and the FederalCongress to abolish or tax futures trading out of existence, but did not pass. Opposition was highestduring periods of low prices and lowest when prices rose. Over time, the importance of futures tradingto the development of agriculture and trade gradually became apparent.
The Grain Futures Act of 1922 was the first federal law regulating futures trading. It allowed thegovernment some control over the exchanges by requiring them to be licensed and to prevent pricemanipulation by their members. It also provided for a supply of continuous trading information. ThisAct was amended and became the Commodity Exchange Act (CEA) of 1936. It dealt with marketabuses by traders and commission merchants as well as the exchange members. Price manipulationbecame a criminal offense. More amendments were made over the years.
The Commodity Futures Trading Act of 1974 created the Commodity Futures Trading Commission(CFTC), the independent body that oversees all futures trading in the United States. Although thefutures exchanges were essentially self-regulating, they had to obtain CFTC approval for any regulatorychanges or for the introduction of new futures and Commodity Marketing contracts. They also had tohave trading rules, contract terms and disciplinary procedures approved by the CFTC.
The National Futures Association (NFA) was incorporated under the Commodity Exchange Act of 1981.Its purpose was to regulate the activities of its members – brokerage houses and their agents. FuturesCommission Merchants (FCMs), brokerage firms that accept futures orders and funds from the public,must be registered with the NFA.
The Commodity Futures Modernization Act (CFMA) amended the CEA so that the amount of CFTCregulation depends on the kind of market participant and on the type of futures contract traded.Under CFMA, a retail investor has more CFTC protection than a large Wall Street investment bank.Similarly, futures contracts that are more susceptible to market manipulation, like commodities, aretraded on organized futures exchanges such as CME where the exchange and the CFTC can monitoractivity. Other sorts of contracts used primarily by big institutions, such as oil and metals, are regulatedmore lightly. Another purpose of the CFMA was to make it easier for exchanges to innovate andintroduce new contracts.
The Exchanges Today
The exchanges provide the place and the rules under which trading takes place.
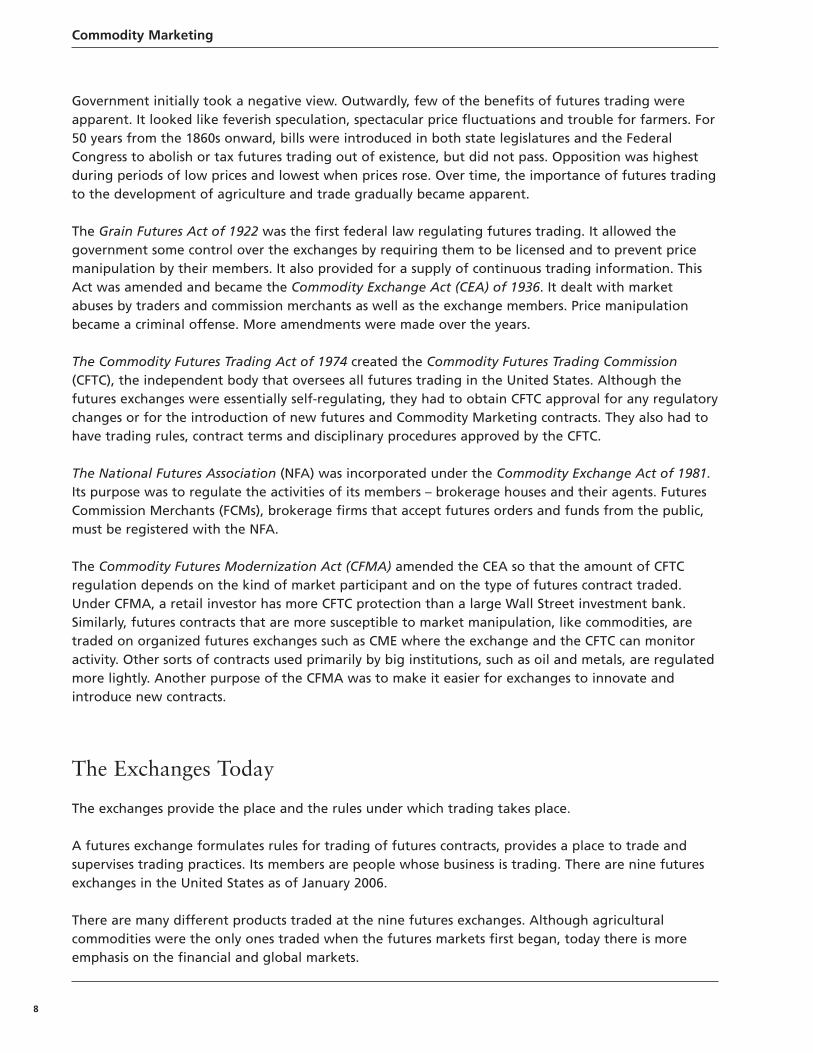
A futures exchange formulates rules for trading of futures contracts, provides a place to trade andsupervises trading practices. Its members are people whose business is trading. There are nine futuresexchanges in the United States as of January 2006.
There are many different products traded at the nine futures exchanges. Although agriculturalcommodities were the only ones traded when the futures markets first began, today there is moreemphasis on the financial and global markets.
Chapter One | Marketing Basics
9
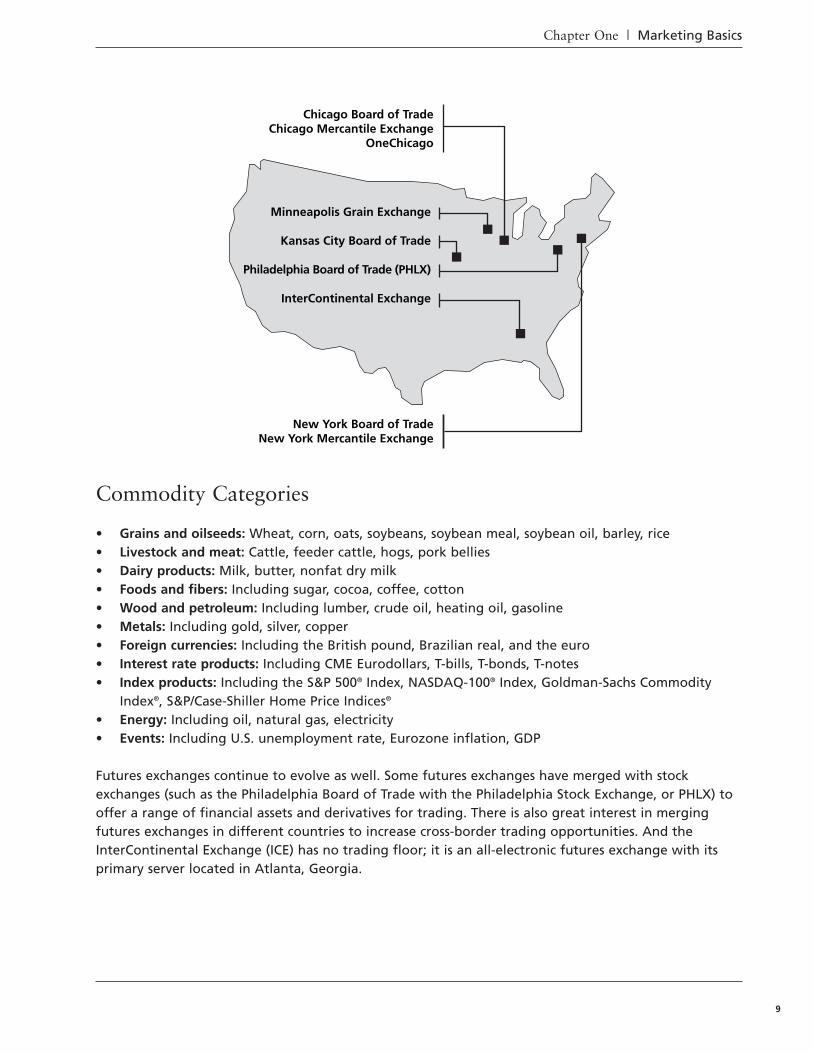
Commodity Categories
• Grains and oilseeds: Wheat, corn, oats, soybeans, soybean meal, soybean oil, barley, rice• Livestock and meat: Cattle, feeder cattle, hogs, pork bellies• Dairy products: Milk, butter, nonfat dry milk• Foods and fibers: Including sugar, cocoa, coffee, cotton• Wood and petroleum: Including lumber, crude oil, heating oil, gasoline • Metals: Including gold, silver, copper• Foreign currencies: Including the British pound, Brazilian real, and the euro• Interest rate products: Including CME Eurodollars, T-bills, T-bonds, T-notes • Index products: Including the S&P 500® Index, NASDAQ-100® Index, Goldman-Sachs Commodity
Index®, S&P/Case-Shiller Home Price Indices®
• Energy: Including oil, natural gas, electricity• Events: Including U.S. unemployment rate, Eurozone inflation, GDP
Futures exchanges continue to evolve as well. Some futures exchanges have merged with stockexchanges (such as the Philadelphia Board of Trade with the Philadelphia Stock Exchange, or PHLX) tooffer a range of financial assets and derivatives for trading. There is also great interest in mergingfutures exchanges in different countries to increase cross-border trading opportunities. And theInterContinental Exchange (ICE) has no trading floor; it is an all-electronic futures exchange with itsprimary server located in Atlanta, Georgia.
Chicago Board of TradeChicago Mercantile Exchange
OneChicago
Minneapolis Grain Exchange
Kansas City Board of Trade
Philadelphia Board of Trade (PHLX)
InterContinental Exchange
New York Board of TradeNew York Mercantile Exchange
Commodity Marketing
10
The Participants
There are various participants involved in futures and options trading:
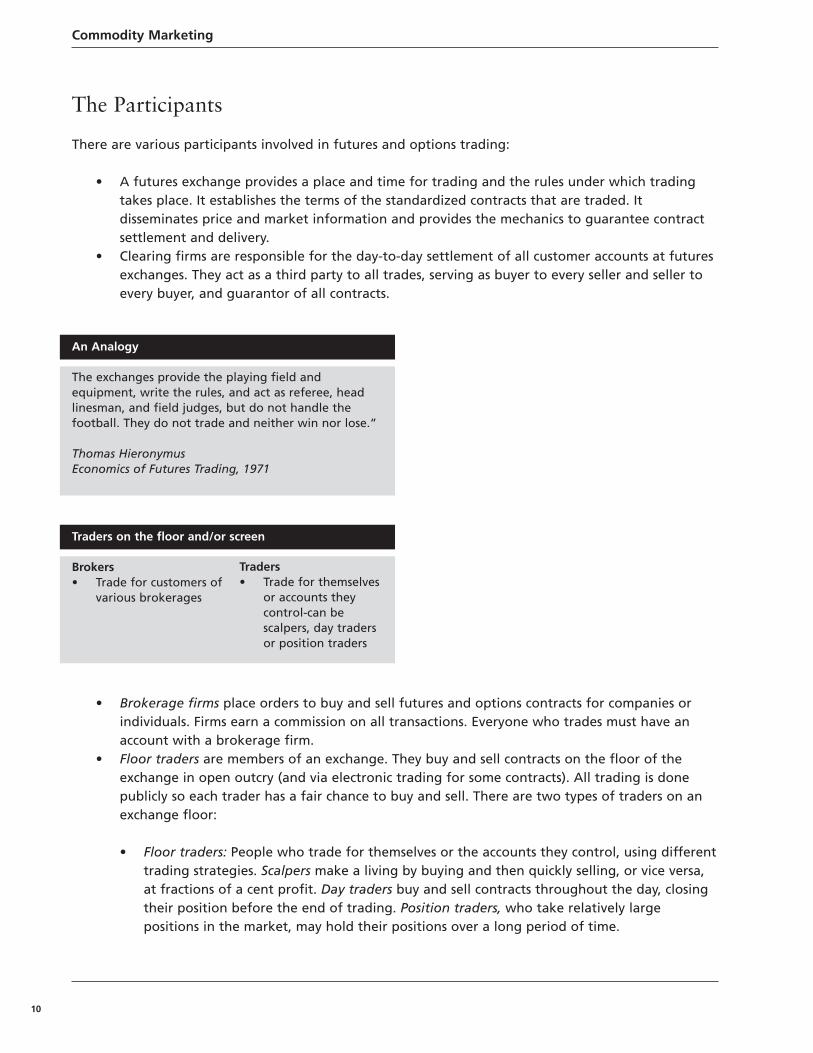
• A futures exchange provides a place and time for trading and the rules under which tradingtakes place. It establishes the terms of the standardized contracts that are traded. Itdisseminates price and market information and provides the mechanics to guarantee contractsettlement and delivery.
• Clearing firms are responsible for the day-to-day settlement of all customer accounts at futuresexchanges. They act as a third party to all trades, serving as buyer to every seller and seller toevery buyer, and guarantor of all contracts.
• Brokerage firms place orders to buy and sell futures and options contracts for companies orindividuals. Firms earn a commission on all transactions. Everyone who trades must have anaccount with a brokerage firm.
• Floor traders are members of an exchange. They buy and sell contracts on the floor of theexchange in open outcry (and via electronic trading for some contracts). All trading is donepublicly so each trader has a fair chance to buy and sell. There are two types of traders on anexchange floor:
• Floor traders: People who trade for themselves or the accounts they control, using differenttrading strategies. Scalpers make a living by buying and then quickly selling, or vice versa,at fractions of a cent profit. Day traders buy and sell contracts throughout the day, closingtheir position before the end of trading. Position traders, who take relatively largepositions in the market, may hold their positions over a long period of time.
An Analogy
The exchanges provide the playing field andequipment, write the rules, and act as referee, headlinesman, and field judges, but do not handle thefootball. They do not trade and neither win nor lose.”
Thomas HieronymusEconomics of Futures Trading, 1971
Traders on the floor and/or screen
Brokers• Trade for customers of
various brokerages
Traders• Trade for themselves
or accounts they control-can be scalpers, day traders or position traders
Chapter One | Marketing Basics
11
• Floor brokers: Floor brokers act as agents for customers by trading futures and optionscontracts on the floor of an exchange for other people.
• E-traders: With the introduction of CME Globex and other electronic trading platforms, tradersno longer need to be physically present on the floor. CME Globex is linked to the CME openoutcry floor system, so electronic trading can take place anywhere there is a CME Globexterminal (and at any time, including after regular floor trading hours). While electronic traderscan choose to trade alone, others come together in small, off-floor areas called trading arcades,which gives electronic traders some of the interaction available on the floor and the chance toshare the overhead expense of computers and information feeds.
• Commodity Pool Operators: CPOs pool investors’ funds and operate much like a mutual fundsfor stocks. Because these funds can make large trades, they can have a significant impact onindividual futures markets and on price trends.
• Speculators try to make money by buying and selling futures and options. They speculate thatprices will change to their advantage. They do not intend to make or take delivery of thecommodities. Speculators assume the risk in the market and provide liquidity.
• Hedgers are people or firms who use futures or options as a substitute for buying and sellingthe actual commodity. They buy and sell contracts to offset the risk of changing prices in thecash markets. Hedgers use futures or options to transfer risk to speculators.
The Futures Market
Hedgers• Avoid risk• Protect against
price changes
Speculators• Accept risk• Try to profit from
price changes
Commodity Marketing
12
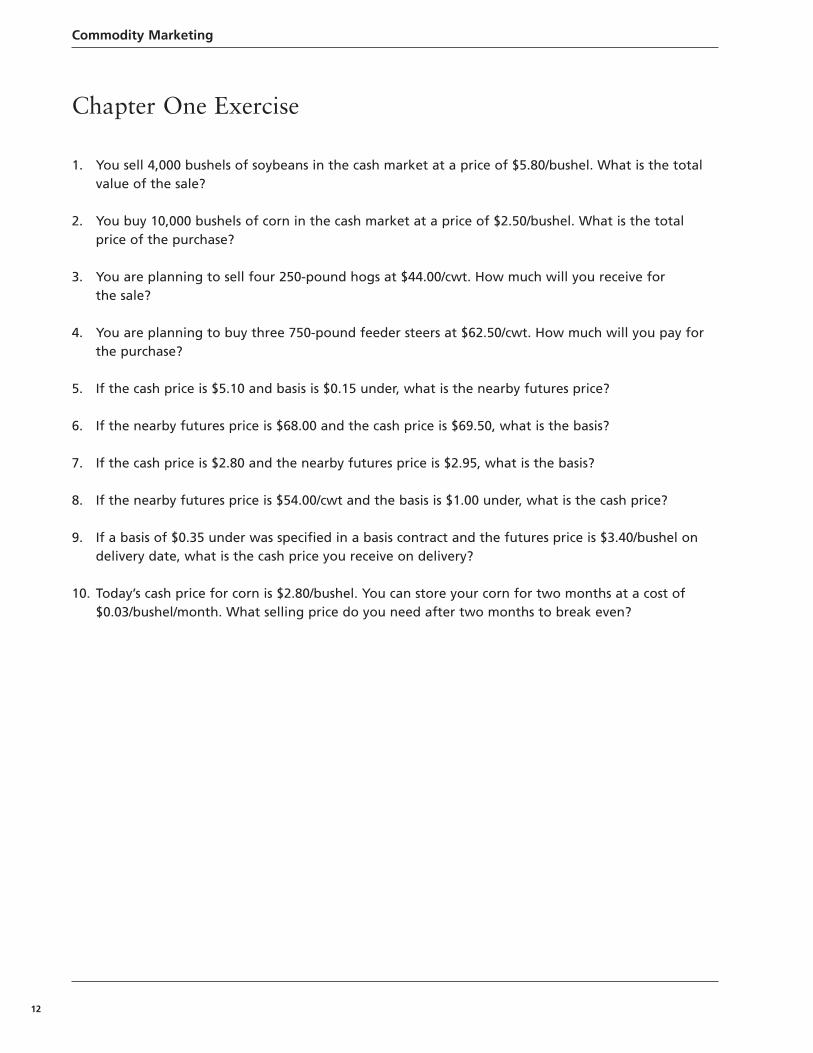
Chapter One Exercise
1. You sell 4,000 bushels of soybeans in the cash market at a price of $5.80/bushel. What is the totalvalue of the sale?
2. You buy 10,000 bushels of corn in the cash market at a price of $2.50/bushel. What is the totalprice of the purchase?
3. You are planning to sell four 250-pound hogs at $44.00/cwt. How much will you receive for the sale?
4. You are planning to buy three 750-pound feeder steers at $62.50/cwt. How much will you pay forthe purchase?
5. If the cash price is $5.10 and basis is $0.15 under, what is the nearby futures price?
6. If the nearby futures price is $68.00 and the cash price is $69.50, what is the basis?
7. If the cash price is $2.80 and the nearby futures price is $2.95, what is the basis?
8. If the nearby futures price is $54.00/cwt and the basis is $1.00 under, what is the cash price?
9. If a basis of $0.35 under was specified in a basis contract and the futures price is $3.40/bushel ondelivery date, what is the cash price you receive on delivery?
10. Today’s cash price for corn is $2.80/bushel. You can store your corn for two months at a cost of$0.03/bushel/month. What selling price do you need after two months to break even?
Chapter Two | Futures Markets
13
Futures Contracts
A futures contract specifies everything but the price.
The activity of trading standardized contracts for commodities to be delivered at a later date began inthe U.S. more than 130 years ago in Chicago. Today, the futures market provides the opportunity forproducers to lock in prices for their commodities and for speculators to trade for profit.
A futures contract is a standardized agreement to buy or sell a commodity at a date in the future. Thefutures contract specifies:
• Commodity (live cattle, feeder cattle, lean hogs, corn, soybeans, wheat, milk, and so on) • Quantity (number of bushels of grain or pounds of livestock as well as the range of weight for
individual animals) • Quality (specific U.S. grades) • Delivery point (location at which to deliver commodity) or cash settlement* • Delivery date (within month that contract terminates)
*Some futures contracts, such as CME Lean Hogs, are cash settled at expiration rather thaninvolving the actual delivery of the commodity.
The only aspect of a futures contract that is not specified is the price at which the commodity is to bebought or sold. The price varies; it is determined on the floor, or electronically, as traders buy and sellthe contracts. The prices they offer and bid reflect the supply and demand for the commodity as wellas their expectations of whether the price will increase or decrease.
Chapter 2Futures Markets
Chapter Two Objectives
• To understand how producers can use the futures market as protection against price risk• To understand the principles of hedging• To learn the mechanics of short and long hedges• To understand the reasons and ways that producers use the futures markets to hedge• To be able to calculate a simple hedge
Commodity Marketing
14
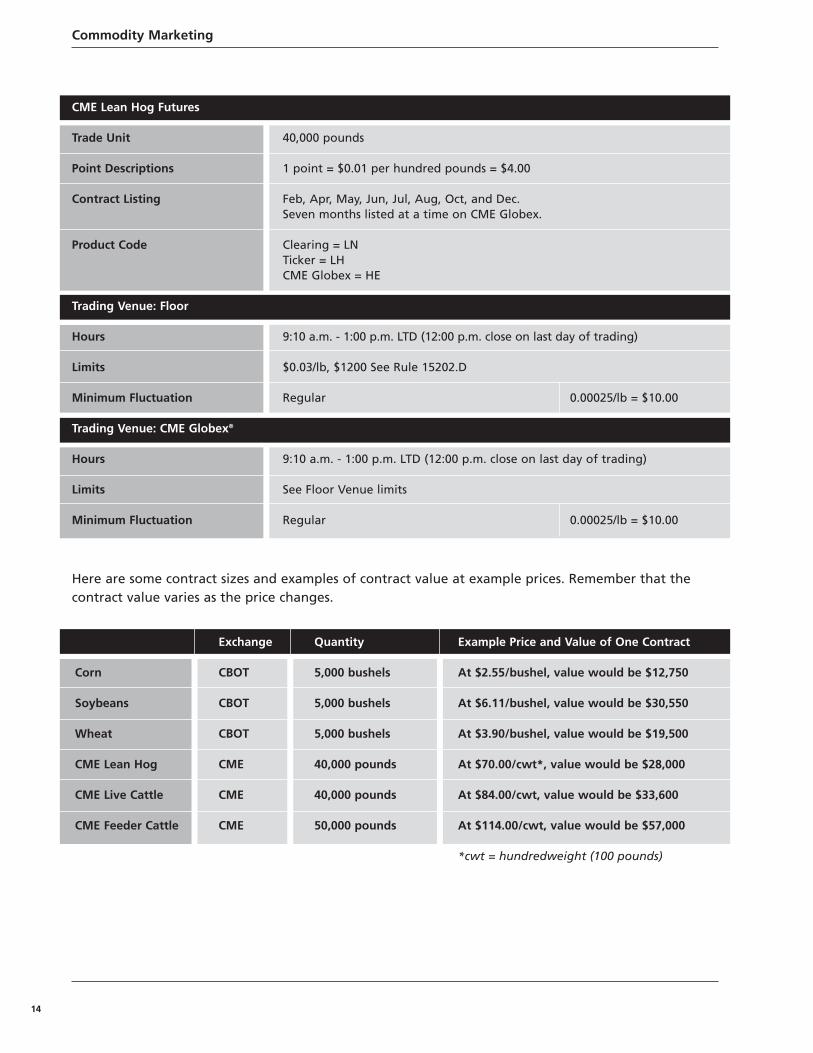
Here are some contract sizes and examples of contract value at example prices. Remember that thecontract value varies as the price changes.
CME Lean Hog Futures
Trade Unit
Point Descriptions
Contract Listing
Product Code
Trading Venue: Floor
Hours
Limits
Minimum Fluctuation
Trading Venue: CME Globex®
Hours
Limits
Minimum Fluctuation
40,000 pounds
1 point = $0.01 per hundred pounds = $4.00
Feb, Apr, May, Jun, Jul, Aug, Oct, and Dec.Seven months listed at a time on CME Globex.
Clearing = LNTicker = LHCME Globex = HE
9:10 a.m. - 1:00 p.m. LTD (12:00 p.m. close on last day of trading)
$0.03/lb, $1200 See Rule 15202.D
Regular 0.00025/lb = $10.00
9:10 a.m. - 1:00 p.m. LTD (12:00 p.m. close on last day of trading)
See Floor Venue limits
Regular 0.00025/lb = $10.00
Exchange Quantity Example Price and Value of One Contract
Corn CBOT 5,000 bushels At $2.55/bushel, value would be $12,750
Soybeans CBOT 5,000 bushels At $6.11/bushel, value would be $30,550
Wheat CBOT 5,000 bushels At $3.90/bushel, value would be $19,500
CME Lean Hog CME 40,000 pounds At $70.00/cwt*, value would be $28,000
CME Live Cattle CME 40,000 pounds At $84.00/cwt, value would be $33,600
CME Feeder Cattle CME 50,000 pounds At $114.00/cwt, value would be $57,000
*cwt = hundredweight (100 pounds)
Chapter Two | Futures Markets
15
Offsetting Futures
Anyone can buy and sell futures contracts.
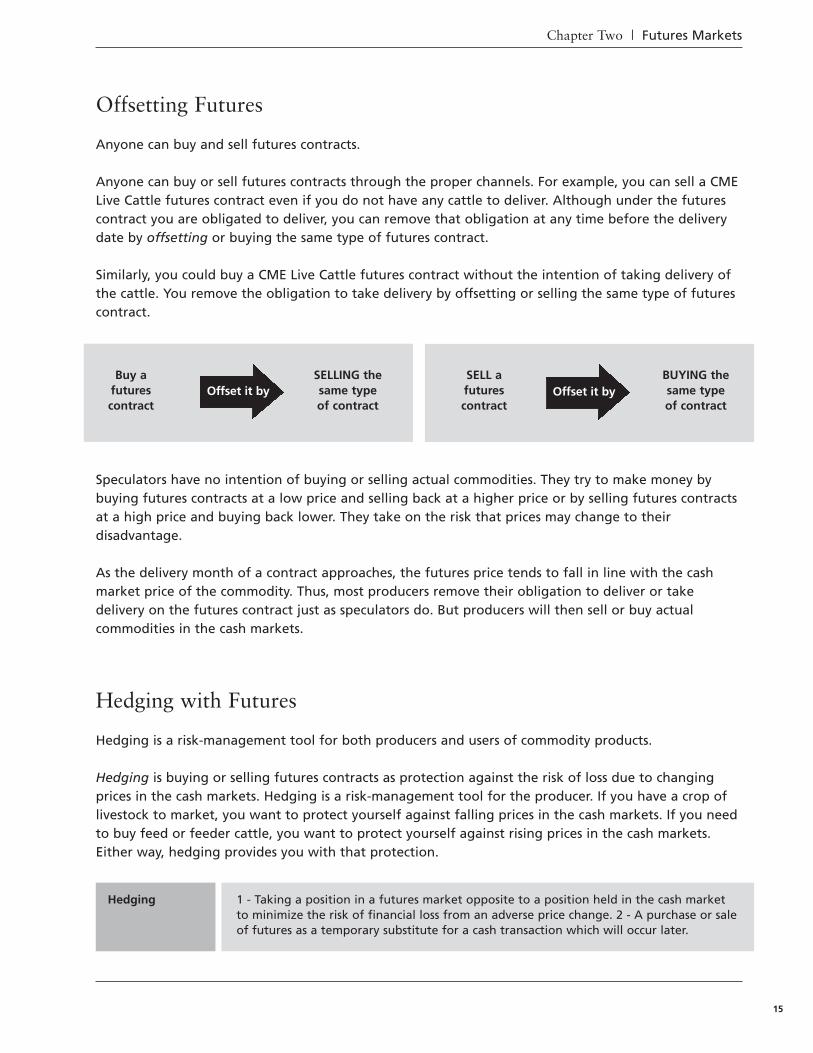
Anyone can buy or sell futures contracts through the proper channels. For example, you can sell a CMELive Cattle futures contract even if you do not have any cattle to deliver. Although under the futurescontract you are obligated to deliver, you can remove that obligation at any time before the deliverydate by offsetting or buying the same type of futures contract.
Similarly, you could buy a CME Live Cattle futures contract without the intention of taking delivery ofthe cattle. You remove the obligation to take delivery by offsetting or selling the same type of futurescontract.
Speculators have no intention of buying or selling actual commodities. They try to make money bybuying futures contracts at a low price and selling back at a higher price or by selling futures contractsat a high price and buying back lower. They take on the risk that prices may change to theirdisadvantage.
As the delivery month of a contract approaches, the futures price tends to fall in line with the cashmarket price of the commodity. Thus, most producers remove their obligation to deliver or takedelivery on the futures contract just as speculators do. But producers will then sell or buy actualcommodities in the cash markets.
Hedging with Futures
Hedging is a risk-management tool for both producers and users of commodity products.
Hedging is buying or selling futures contracts as protection against the risk of loss due to changingprices in the cash markets. Hedging is a risk-management tool for the producer. If you have a crop oflivestock to market, you want to protect yourself against falling prices in the cash markets. If you needto buy feed or feeder cattle, you want to protect yourself against rising prices in the cash markets.Either way, hedging provides you with that protection.
Buy afuturescontract
SELLING thesame typeof contract
SELL afuturescontract
BUYING thesame typeof contract
Offset it by Offset it by
Hedging 1 - Taking a position in a futures market opposite to a position held in the cash marketto minimize the risk of financial loss from an adverse price change. 2 - A purchase or saleof futures as a temporary substitute for a cash transaction which will occur later.
Commodity Marketing
16
There are two basic types of hedges:
• The short hedge, or selling hedge, used when you plan to sell a commodity. The short hedgeprotects the seller of a commodity against falling prices.
• The long hedge, or buying hedge, used when you plan to purchase a commodity. The longhedge protects the buyer of a commodity against rising prices.
Long and Short
If you are long futures, you bought a futures contract. If you made a long hedge, you bought a futurescontract to protect against price increase. (You plan to buy the commodity.)
If you are short futures, you sold a futures contract. If you make a short hedge, you sold a futurescontract to protect against price decrease. (You plan to sell a commodity.)
The Short Hedge
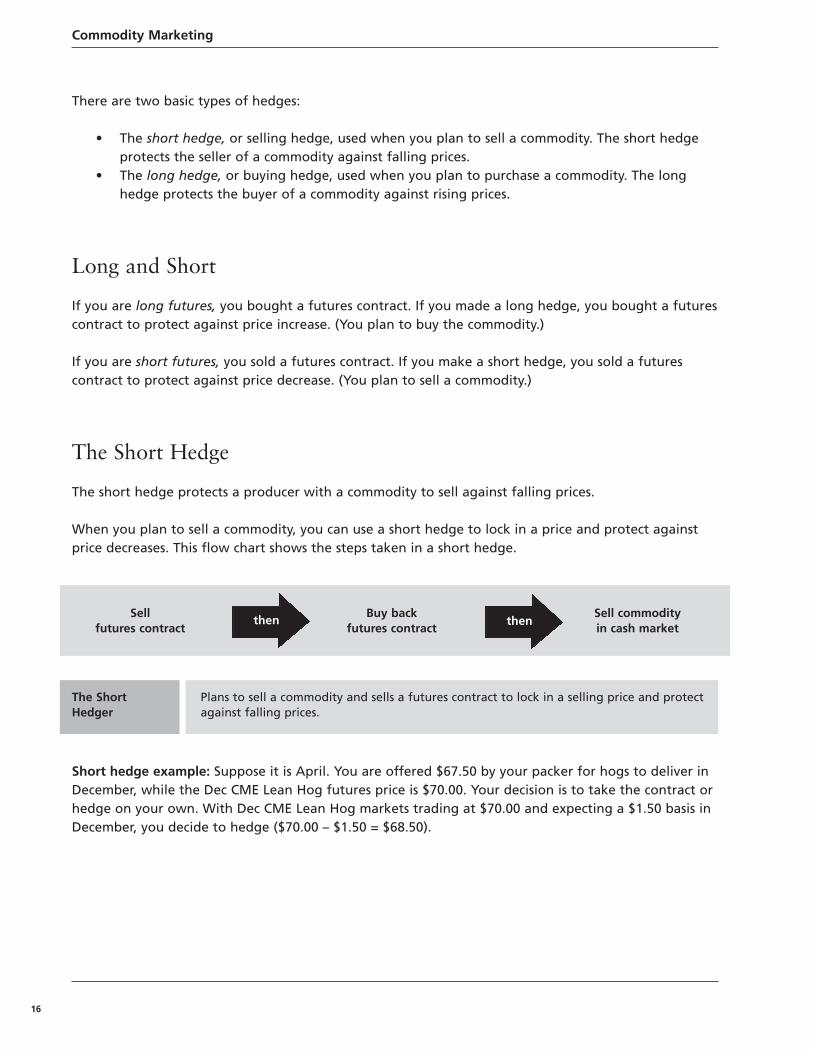
The short hedge protects a producer with a commodity to sell against falling prices.
When you plan to sell a commodity, you can use a short hedge to lock in a price and protect againstprice decreases. This flow chart shows the steps taken in a short hedge.
Short hedge example: Suppose it is April. You are offered $67.50 by your packer for hogs to deliver inDecember, while the Dec CME Lean Hog futures price is $70.00. Your decision is to take the contract orhedge on your own. With Dec CME Lean Hog markets trading at $70.00 and expecting a $1.50 basis inDecember, you decide to hedge ($70.00 – $1.50 = $68.50).
The ShortHedger
Plans to sell a commodity and sells a futures contract to lock in a selling price and protectagainst falling prices.
Sellfutures contract
Buy backfutures contract
Sell commodityin cash market
then then

Chapter Two | Futures Markets
17
The results above show that the cash price has fallen to $65.50 and the futures price to $67.00. Thebasis is $1.50 under. You buy a Dec CME Lean Hog futures contract at $67.00. Because you sold it at$70.00, you receive a gain of $3.00 per pound ($70.00 – $67.00 = $3.00). Then you sell the hogs in thecash market at $65.50. The total price you received is the cash price of $65.50 plus the $3.00 futuresgain, or $68.50. That is $1/cwt more than the price you would have received if you had accepted theforward contract price of April.
What if prices had risen? Suppose the December cash price is $71.00, the futures price is now $72.50and the basis is $1.50 under. You buy a Dec CME Lean Hog futures contract at $72.50 at a loss of $2.50($70.00 – $72.50 = -$2.50). Then you sell in the cash market at $71.00. This time the total price youreceive is the cash price of $71.00 plus -$2.50, the loss in the futures market, or $68.50, as estimated.
Both of these results assume that the basis in April and December is the same at $1.50 under. This iscalled a perfect hedge. We used the example only to show how the mathematics of the short hedgeworks. In real life, it is highly unlikely that the basis will remain the same as expected.
Here are the results showing what happens to a $70.00 hedge when the basis strengthens (becomesmore positive) and when prices fall or rise.
Expected Dec Basis Futures Price Cash Price Futures Gain/Loss Net Price Received
1.50 Buy back 67.00 Sell at 65.50 + 3.00 = 68.50
Forward Contract Offer 67.50
December Futures 70.00Expected Basis – 1.50Expected Hedged Return 68.50
Expected December Basis Futures Price Cash Price Futures Gain/Loss Net Price Received
-1.50 Buy back 72.50 Sell at 71.00 + -2.50 = 68.50
The loss in the market is offset by the higher selling price in the cash market.
The profit in the futures market offsets the lower price in the cash market.
Commodity Marketing
18
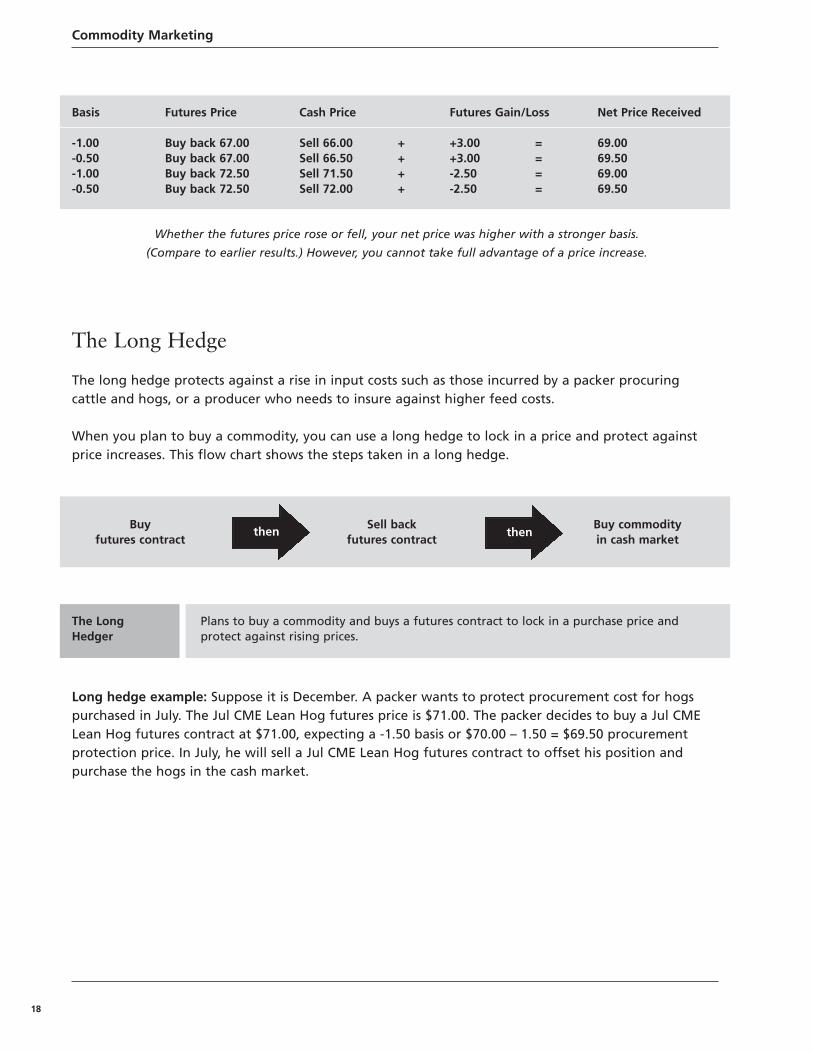
The Long Hedge
The long hedge protects against a rise in input costs such as those incurred by a packer procuringcattle and hogs, or a producer who needs to insure against higher feed costs.
When you plan to buy a commodity, you can use a long hedge to lock in a price and protect againstprice increases. This flow chart shows the steps taken in a long hedge.
Long hedge example: Suppose it is December. A packer wants to protect procurement cost for hogspurchased in July. The Jul CME Lean Hog futures price is $71.00. The packer decides to buy a Jul CMELean Hog futures contract at $71.00, expecting a -1.50 basis or $70.00 – 1.50 = $69.50 procurementprotection price. In July, he will sell a Jul CME Lean Hog futures contract to offset his position andpurchase the hogs in the cash market.
The Long Hedger
Plans to buy a commodity and buys a futures contract to lock in a purchase price andprotect against rising prices.
Buyfutures contract
Sell backfutures contract
Buy commodityin cash market
then then
Basis Futures Price Cash Price Futures Gain/Loss Net Price Received
-1.00 Buy back 67.00 Sell 66.00 + +3.00 = 69.00-0.50 Buy back 67.00 Sell 66.50 + +3.00 = 69.50-1.00 Buy back 72.50 Sell 71.50 + -2.50 = 69.00-0.50 Buy back 72.50 Sell 72.00 + -2.50 = 69.50
Whether the futures price rose or fell, your net price was higher with a stronger basis.
(Compare to earlier results.) However, you cannot take full advantage of a price increase.
Chapter Two | Futures Markets
19
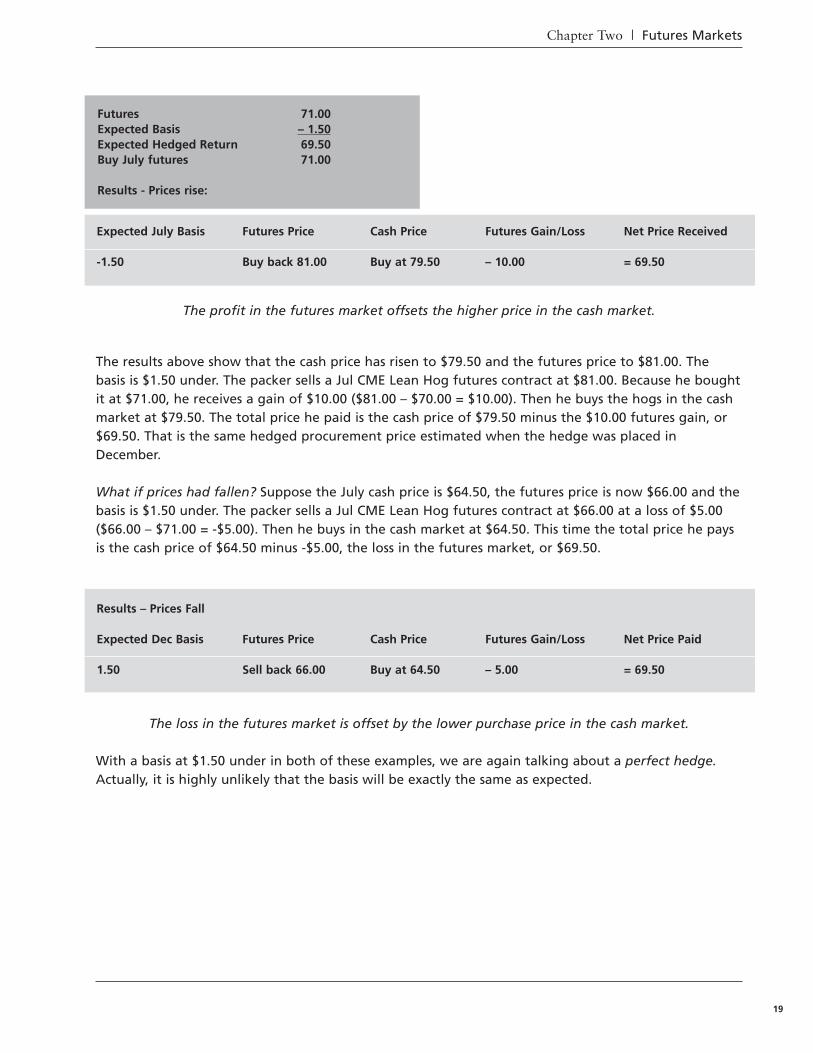
The results above show that the cash price has risen to $79.50 and the futures price to $81.00. Thebasis is $1.50 under. The packer sells a Jul CME Lean Hog futures contract at $81.00. Because he boughtit at $71.00, he receives a gain of $10.00 ($81.00 – $70.00 = $10.00). Then he buys the hogs in the cashmarket at $79.50. The total price he paid is the cash price of $79.50 minus the $10.00 futures gain, or$69.50. That is the same hedged procurement price estimated when the hedge was placed inDecember.
What if prices had fallen? Suppose the July cash price is $64.50, the futures price is now $66.00 and thebasis is $1.50 under. The packer sells a Jul CME Lean Hog futures contract at $66.00 at a loss of $5.00($66.00 – $71.00 = -$5.00). Then he buys in the cash market at $64.50. This time the total price he paysis the cash price of $64.50 minus -$5.00, the loss in the futures market, or $69.50.
Expected July Basis Futures Price Cash Price Futures Gain/Loss Net Price Received
-1.50 Buy back 81.00 Buy at 79.50 – 10.00 = 69.50
Futures 71.00Expected Basis – 1.50Expected Hedged Return 69.50Buy July futures 71.00
Results - Prices rise:
The profit in the futures market offsets the higher price in the cash market.
Results – Prices Fall
Expected Dec Basis Futures Price Cash Price Futures Gain/Loss Net Price Paid
1.50 Sell back 66.00 Buy at 64.50 – 5.00 = 69.50
The loss in the futures market is offset by the lower purchase price in the cash market.
With a basis at $1.50 under in both of these examples, we are again talking about a perfect hedge.Actually, it is highly unlikely that the basis will be exactly the same as expected.
Commodity Marketing
20
Futures Cash Flow
You have to look at the cash required for futures trading.
Before considering some practical hedging examples, we will take a look at the finances of hedging:
• The performance bond, or good faith, deposit • Broker commission
The exchange clearing house requires that clearing members deposit performance bonds to guaranteeperformance on their customers’ open futures contracts. Individuals trading in the market make thedeposit with their brokerage houses.
When you sell a futures contract, you do not receive payment. Instead, you deposit a performancebond (money) with your broker to guarantee payment of immediate losses you may suffer.
The value of your contract is calculated on a daily basis. If the futures price increases significantly andcauses the value of your contract to increase beyond a certain point, you will get a performance bondcall and be asked to deposit more money to cover the loss in your account. A smaller maintenanceperformance bond balance must be maintained to protect against the next day’s possible losses.
Performancebond
The amount of money or collateral deposited by a client with his broker, or by a clearingfirm with CME Clearing on open futures or options contracts before a customer cantrade. The performance bond is not a part payment on a purchase.
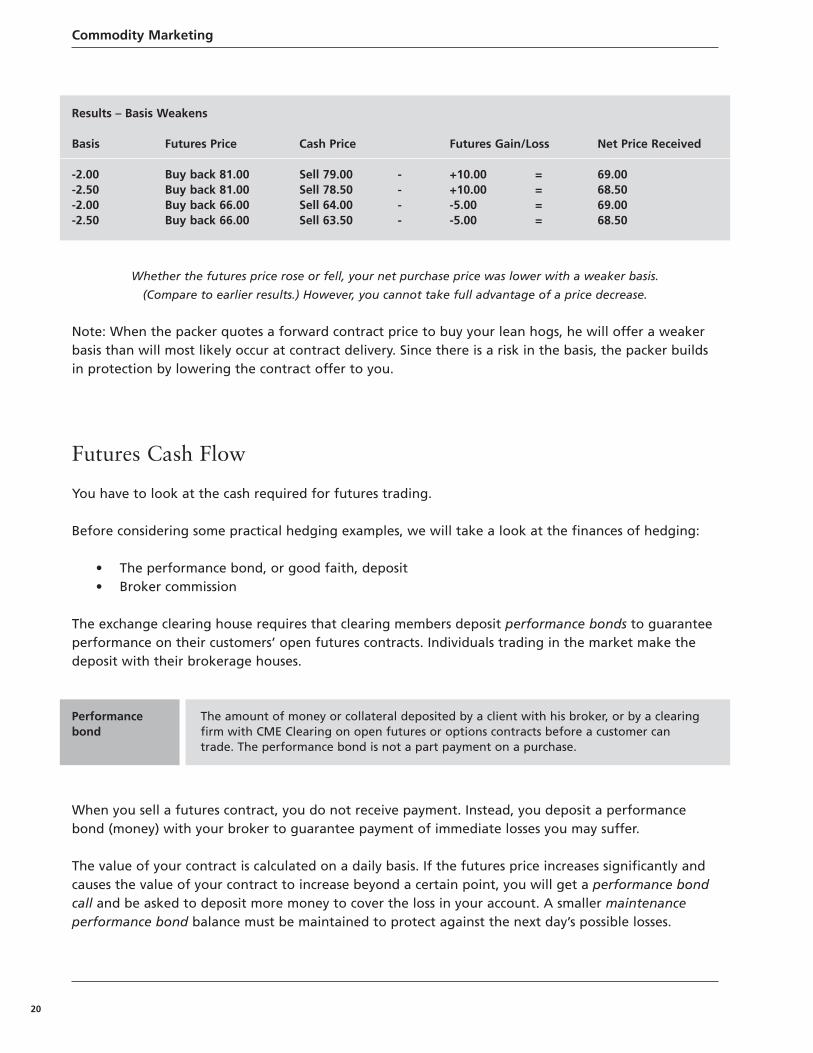
Results – Basis Weakens
Basis Futures Price Cash Price Futures Gain/Loss Net Price Received
-2.00 Buy back 81.00 Sell 79.00 - +10.00 = 69.00-2.50 Buy back 81.00 Sell 78.50 - +10.00 = 68.50-2.00 Buy back 66.00 Sell 64.00 - -5.00 = 69.00-2.50 Buy back 66.00 Sell 63.50 - -5.00 = 68.50
Whether the futures price rose or fell, your net purchase price was lower with a weaker basis.
(Compare to earlier results.) However, you cannot take full advantage of a price decrease.
Note: When the packer quotes a forward contract price to buy your lean hogs, he will offer a weakerbasis than will most likely occur at contract delivery. Since there is a risk in the basis, the packer buildsin protection by lowering the contract offer to you.
Chapter Two | Futures Markets
21
Performance Bond
Performance bond: A deposit to cover any loss you may incur on the futures contract.
Maintenance performance bond: A sum less than the initial performance bond that must bemaintained in your account.
Performance bond call: A demand for an additional deposit to bring your account up to the initialperformance bond level.
Your contract obligation is offset when you buy back (or sell back) a futures contract. The differencebetween the selling price and the buying price is your gain or loss. If the buying price is lower than theselling price, you earn a profit and receive the money. If it is higher, you suffer a loss, which is coveredby the initial performance bond and any additional money you may have deposited with the broker.
If you decide to hedge the sale or purchase of a commodity, be prepared for performance bond calls. Ifyour cash is tight, you may wish to have a lender finance the performance bond deposit and potentialperformance bond calls. If you close your position in the market with a gain, this deposit is yours –although you may want to leave it on deposit for your next hedge.
A flat cost to producers who use the futures market is the commission charged by the broker for eachcontract traded for you. This cost is negotiable and depends on the level of service and the quantity ofcontracts traded.
Short Hedge Strategy
A wheat producer may sell wheat futures to hedge the sale if he or she thinks prices are heading down.
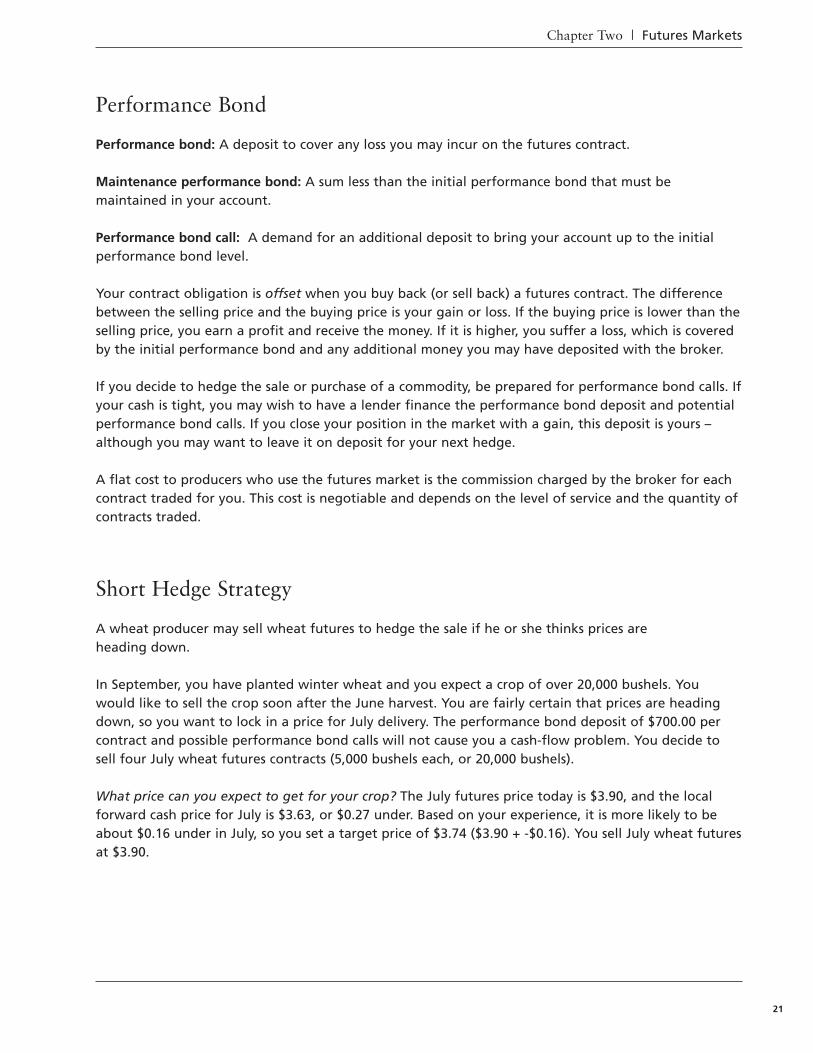
In September, you have planted winter wheat and you expect a crop of over 20,000 bushels. Youwould like to sell the crop soon after the June harvest. You are fairly certain that prices are headingdown, so you want to lock in a price for July delivery. The performance bond deposit of $700.00 percontract and possible performance bond calls will not cause you a cash-flow problem. You decide tosell four July wheat futures contracts (5,000 bushels each, or 20,000 bushels).
What price can you expect to get for your crop? The July futures price today is $3.90, and the localforward cash price for July is $3.63, or $0.27 under. Based on your experience, it is more likely to beabout $0.16 under in July, so you set a target price of $3.74 ($3.90 + -$0.16). You sell July wheat futuresat $3.90.
Commodity Marketing
22
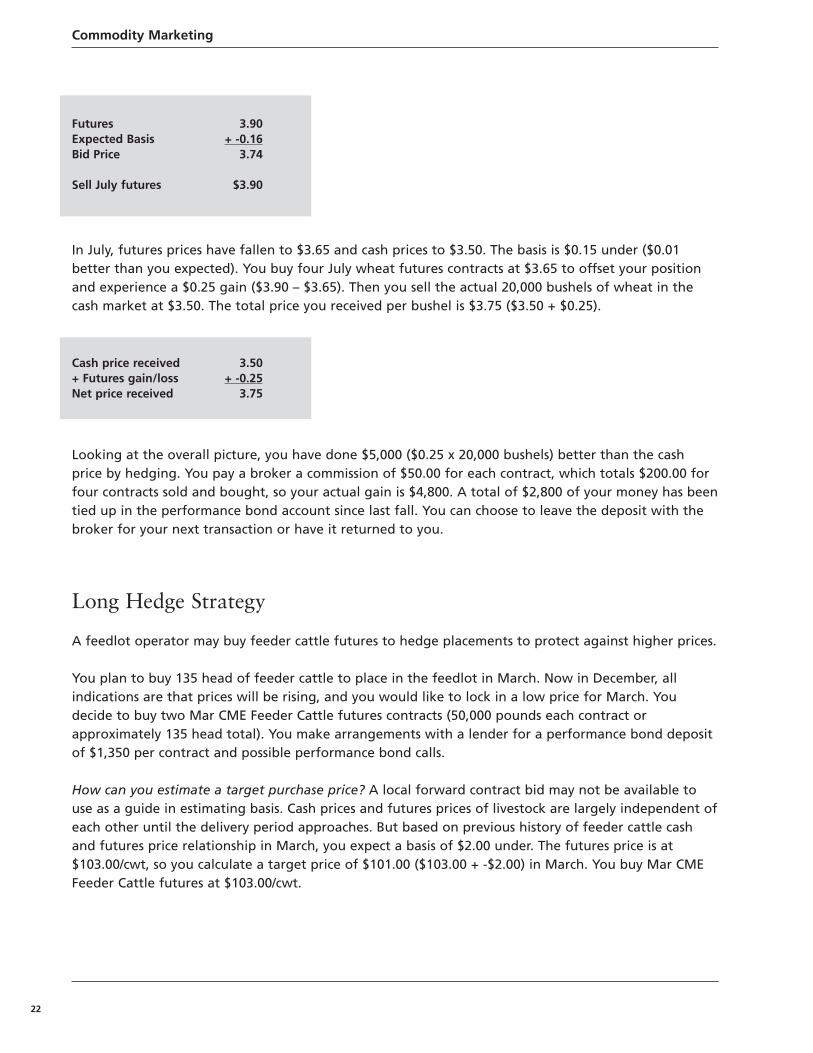
In July, futures prices have fallen to $3.65 and cash prices to $3.50. The basis is $0.15 under ($0.01better than you expected). You buy four July wheat futures contracts at $3.65 to offset your positionand experience a $0.25 gain ($3.90 – $3.65). Then you sell the actual 20,000 bushels of wheat in thecash market at $3.50. The total price you received per bushel is $3.75 ($3.50 + $0.25).
Looking at the overall picture, you have done $5,000 ($0.25 x 20,000 bushels) better than the cashprice by hedging. You pay a broker a commission of $50.00 for each contract, which totals $200.00 forfour contracts sold and bought, so your actual gain is $4,800. A total of $2,800 of your money has beentied up in the performance bond account since last fall. You can choose to leave the deposit with thebroker for your next transaction or have it returned to you.
Long Hedge Strategy
A feedlot operator may buy feeder cattle futures to hedge placements to protect against higher prices.
You plan to buy 135 head of feeder cattle to place in the feedlot in March. Now in December, all indications are that prices will be rising, and you would like to lock in a low price for March. Youdecide to buy two Mar CME Feeder Cattle futures contracts (50,000 pounds each contract orapproximately 135 head total). You make arrangements with a lender for a performance bond depositof $1,350 per contract and possible performance bond calls.
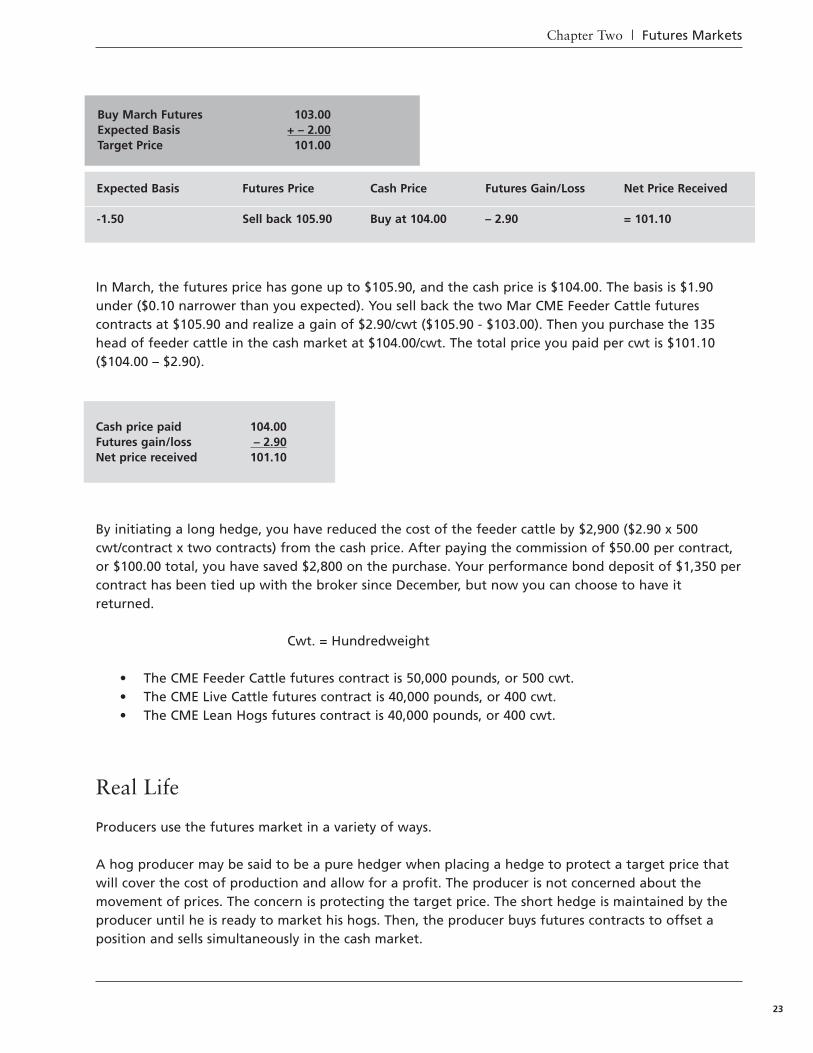
How can you estimate a target purchase price? A local forward contract bid may not be available touse as a guide in estimating basis. Cash prices and futures prices of livestock are largely independent ofeach other until the delivery period approaches. But based on previous history of feeder cattle cashand futures price relationship in March, you expect a basis of $2.00 under. The futures price is at$103.00/cwt, so you calculate a target price of $101.00 ($103.00 + -$2.00) in March. You buy Mar CMEFeeder Cattle futures at $103.00/cwt.
Futures 3.90Expected Basis + -0.16Bid Price 3.74
Sell July futures $3.90
Cash price received 3.50+ Futures gain/loss + -0.25Net price received 3.75
Chapter Two | Futures Markets
23
In March, the futures price has gone up to $105.90, and the cash price is $104.00. The basis is $1.90under ($0.10 narrower than you expected). You sell back the two Mar CME Feeder Cattle futurescontracts at $105.90 and realize a gain of $2.90/cwt ($105.90 - $103.00). Then you purchase the 135head of feeder cattle in the cash market at $104.00/cwt. The total price you paid per cwt is $101.10($104.00 – $2.90).
By initiating a long hedge, you have reduced the cost of the feeder cattle by $2,900 ($2.90 x 500cwt/contract x two contracts) from the cash price. After paying the commission of $50.00 per contract,or $100.00 total, you have saved $2,800 on the purchase. Your performance bond deposit of $1,350 percontract has been tied up with the broker since December, but now you can choose to have itreturned.
Cwt. = Hundredweight
• The CME Feeder Cattle futures contract is 50,000 pounds, or 500 cwt. • The CME Live Cattle futures contract is 40,000 pounds, or 400 cwt.• The CME Lean Hogs futures contract is 40,000 pounds, or 400 cwt.
Real Life
Producers use the futures market in a variety of ways.
A hog producer may be said to be a pure hedger when placing a hedge to protect a target price thatwill cover the cost of production and allow for a profit. The producer is not concerned about themovement of prices. The concern is protecting the target price. The short hedge is maintained by theproducer until he is ready to market his hogs. Then, the producer buys futures contracts to offset aposition and sells simultaneously in the cash market.
Cash price paid 104.00Futures gain/loss – 2.90Net price received 101.10
Expected Basis Futures Price Cash Price Futures Gain/Loss Net Price Received
-1.50 Sell back 105.90 Buy at 104.00 – 2.90 = 101.10
Buy March Futures 103.00Expected Basis + – 2.00Target Price 101.00
Commodity Marketing
24
.
The selective hedger is very common in real life. A milk producer who is a selective hedger would stayout of the futures market if he believes that prices will go up and hedge only if it is perceived thatthere will be a price decrease. Similarly, a hog producer who needs to purchase feed will stay out ofthe futures market if he thinks feed prices are falling and hedge only if a price increase is perceived.Both of them could be wrong.
Some producers wait to place a hedge during the growing season. If they believe prices are going torise and then fall, they want to sell futures contracts near the top of the market and buy back afterprices fall again. Other variations are producers who hedge only part of their production, hedge it instages, or combine cash market sale, forward contracting and hedging.
Without a definite plan, a producer can make the wrong move. For example, a producer who has nothedged his crop waits until prices fall and then decides he had better hedge because he thinks priceswill never stop falling. Or, a producer holds off hedging because she believes that prices will never stoprising. She may wait so long that she watches the top of the market come and go, missing her chance.Making a plan and sticking with it can make all the difference.
PureHedger
A person who places a hedge to lock in a price for a commodity. He or she offsets thehedge and transacts in the cash market simultaneously.
Selectivehedger
A person who hedges only when he or she believes that prices are likely to move againsthim or her.
The Emotional Marketer
“Greed causes a producer to hold his commodity toolong as prices rise. High hopes cause him to hold whenprices collapse. Fear causes him to sell at the bottom ofthe market when he thinks prices will never go upagain.”
Robert and Lyn SennholzStep-by-Step Guide to Developing a ProfitableMarketing Plan, 1986
Chapter Two | Futures Markets
25
Chapter Two Exercise
1. For an expected harvest of 40,000 bushels of wheat, how many CBOT wheat futures contractswould you sell to hedge the sale?
2. You plan to buy 195 head of feeder cattle or about 150,000 pounds. How many CME Feeder Cattlefutures contracts would you buy to hedge the purchase?
3. You sell CME Lean Hog futures contracts at $56.00/cwt. You expect the basis to be $1.50 under.What is your target sales price?
4. You buy corn futures contracts at $2.55/bushel to hedge a corn purchase. You expect the basis tobe $0.20 under. What is your target purchase price?
5. If the futures price is at $6.25/bushel, what is the value of one soybean contract?
6. You bought CME Feeder Cattle futures at $72.00/cwt and sold them back at $75.00. You boughtthe cattle in the cash market at $74.00. What is the total price you paid for the cattle?
7. You bought corn futures at $2.60/bushel and sold them back at $2.50. You bought corn in the cashmarket at $2.25. What is the total price you paid for the corn?
8. You hedged the sale of hogs by selling four contracts and then offsetting four futures contracts.The hedged return was $3.00/cwt. Your broker charged you a total commission of $200. What isyour futures account net gain?

Commodity Marketing
26
Chapter Three | The Brokerage Account
27
You will need to know the practical aspects of futures trading.
You have learned about the development of the futures market and who the participants are. Youhave also studied the mechanics of a futures trade and how to hedge a sale or a purchase usingfutures. But before you can begin to trade futures, there is a lot you need to know about what youactually do when you trade.
Choosing a Broker
If you are a producer who trades futures contracts, you will have to trade through a brokerage firm.First, you will have to find a broker.
The most important aspect of choosing a broker is finding one that is right for you. It depends on howmuch assistance you need in making your hedging decisions. There are basically two different kinds ofbrokers to choose between:
• Full-service brokers• Discount brokers
If you want help in using market information to make hedging decisions, you may want to have a full-service broker. This type of broker will take the time to understand your situation, will be available fordiscussion and advice when you call to place an order and may even call you to suggest what your nextmove should be. The brokerage firm may also send out market information and newsletters, and havetelephone hotlines to keep you informed. Commissions are negotiable and vary from broker to broker.
Chapter 3The Brokerage Account
Chapter Three Objectives
• To learn about choosing a broker• To learn how to open an account with a broker• To learn how to correctly place an order with your broker• To become familiar with trading language• To understand how performance bonds work
Commodity Marketing
28
If you do not need advice to make your own hedging decisions and do not need the broker's opinions,a discount broker may be right for you. In this case, you simply call in an order to the brokerage firm,and without any conversation, the order is placed – clean and simple. Commissions will be lower with adiscount broker.
In any case, you should find out the broker’s commission and fee schedule, which he or she is requiredto disclose to you in a way that is not misleading. Note that commissions – the payment for a broker’sservices – vary between brokers, and can be calculated on a per-trade, or round trip (both initial tradeand offset) basis, and as a fixed charge or a percentage of the price of the option you are purchasing.Since the broker’s fees and commission directly impact your total profit and loss, it is important toknow these costs when you choose a broker.
Suppose you decide to go with a full-service broker. Do not automatically choose the one that is closestto you. Here are a few hints on how to go about finding a broker:
• Talk to other producers and get referrals. Find out which brokers have happy clients. Find outwhich brokers are considered to be outstanding.
• Look for brokers who have a strong farm orientation and have many hedging accounts. Ask ifthe broker has experience with your specific commodity.
• Call or visit the brokers you are considering. You want someone who is down to earth, isinterested in your operation and pays attention to what your situation is. You want arelationship that is compatible. Working through important hedging decisions is personal andsometimes emotional. You want a broker you can talk to and trust.
• The National Futures Association (www.nfa.futures.org) keeps an online data base on firms and individuals registered with the CFTC called BASIC (Background Affiliation StatusInformation Center; http://nfa.futures.org/basic/about.asp). You can search by both individualand firm name for information on regulatory actions and dispute resolution cases in which theywere involved.
Opening an Account
You will need to open an account with a brokerage firm.
After choosing a broker, your next step will be to open an account with the brokerage firm. Becausemoney is involved in hedging – performance bonds when you are trading futures – you may need tocheck with your lender first.
The Broker for You
• Full service or discount, depending on your needs
• Considered by other producers to be outstanding
• A broker with experience in your commodity
• A broker you find compatible
Chapter Three | The Brokerage Account
29
Obtaining Hedging Funds
As a producer, you may choose to use your own money to support your hedging activities. If you arehedging with futures, you will want to be sure that you have enough money to deposit the requiredperformance bonds and be able to meet performance bond calls.
Some producers may be required by their lender to set up a separate line of credit for hedging. Yourlender may be concerned about how well you will handle the hedges and want to have some controlover the situation. In this case, an agreement with the lender will have to be signed. Sometimes, thebroker has to sign the agreement as well. The agreement includes clauses such as:
• The lender agrees to supply funds for hedging only, but not for speculation. • The lender can liquidate your account without your consent and can prohibit you from further
trading. • Hedging profits are applied against your loan balance.
If you set up a hedging line of credit, be sure that your lender understands hedging and howperformance bond calls work. There have been examples of lenders getting nervous when the marketmoves against a producer's position and pulling the producer out of the futures market withoutunderstanding how a futures loss can be offset by a gain in the cash markets. Then, if cash prices fallbefore marketing, the producer, without the protection of the hedge, ends up with losses in both thefutures and cash markets.
Signing the Broker Forms
You will be required to fill in and sign a number of forms when you open your account with thebroker. The forms can be scary, but familiarity should take the anxiety out of this step.
• Personal information will be required when you open your account. The broker will requirename, address, date of birth, social security number, tax identification number for the IRS W-9form, occupation, annual income, net worth, liquid assets and number of years experience as acommodities trader. This information is held confidential.
• The CFTC requires that the broker provide you with risk disclosure information. You sign toindicate that you have read the information. For futures, you are made aware that you mightlose your entire performance bond deposit and performance bond calls. You are warned that ifyou cannot meet a performance bond call, the broker may liquidate your position as a loss to you.
In a multi-page options document, you as an options buyer are warned that you might losethe premium and that, under certain circumstances, you may not be able to offset theoption – for example, if no buyers are interested in the option. This document also disclosesthe risk to the sellers of options and describes the mechanics of options trading.
Commodity Marketing
30
• You will need to sign the brokerage firm's agreement that states what you each agree to.Basically, you give the firm permission to trade according to your instructions. You agree todeposit the required performance bonds, meet performance bond calls and pay premiums andcommissions. There are several clauses relating to how you deposit money and what happens ifyou do not provide funds when they are required.
The brokerage firm agrees to place orders according to your instructions and that alltransactions will be made subject to the rules of the exchanges and CFTC regulations. Thefirm declares that is it not to be held responsible if it cannot place your order due totransmission delay or communications breakdown.
You sign an authorization for the firm to transfer any excess funds you may have in one ofyour accounts to another of your accounts in order to satisfy a deficit. This is included inthe brokerage firm's agreement form.
• You also sign a hedge account designation that says all of your transactions will be hedgesaccording to CFTC regulations. The form will list all the commodities for which you may beconsidered a hedger.
Placing an Order
You must know how to place an order correctly so you get what you want.
In either pit or electronic trading, there are several kinds of orders that can be placed with yourbroker. These are four of the most common:
• Market order: You instruct your broker to place your order as soon as possible at the bestpossible price. For example, you say, "Sell four July CME Lean Hog futures at the market." Thetrade is executed at the best price that can be obtained.
• Price order: You instruct your broker to place your order at a certain price or better. Forexample, you say, "Sell four July CME Lean Hog futures contracts at $70.00." The market has totrade at $70.00 or better (higher) before he or she can execute the trade. (Also called a limitorder.)
Broker Forms and Information Required
• Personal information
• Risk disclosure forms
• Brokerage firm agreement
• Hedge account designation
Chapter Three | The Brokerage Account
31
• Stop order: You instruct your broker to place your order at a certain price level. A sell stopmust be below the market; a buy stop must be above the market. For example, the futuresprice is at $70.00 and you say, "Sell four July CME Lean Hog futures contracts at a stop of$69.50." When the market falls to $69.50 or below, the stop order becomes a market order andis executed.
• Stop close only: This is a stop order that is executed only within the last minute of trading,during the close. You say, "Sell four July CME Lean Hog futures at a stop close only of $69.50"where this price is under the futures price at the time you place the order. You want the orderto be filled only if the market is going to close at or below $69.50. The order will be placedduring the closing period.
Note: CME allows stop close only orders; the CBOT does not.
Trading Language
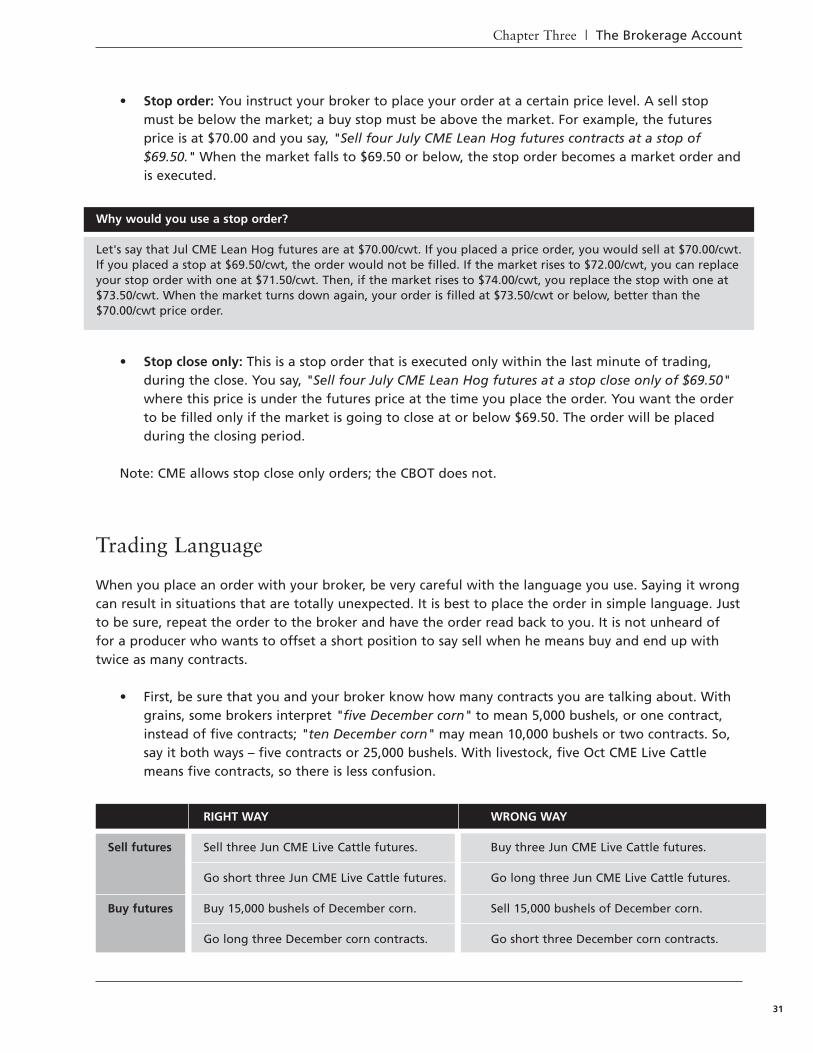
When you place an order with your broker, be very careful with the language you use. Saying it wrongcan result in situations that are totally unexpected. It is best to place the order in simple language. Justto be sure, repeat the order to the broker and have the order read back to you. It is not unheard offor a producer who wants to offset a short position to say sell when he means buy and end up withtwice as many contracts.
• First, be sure that you and your broker know how many contracts you are talking about. Withgrains, some brokers interpret "five December corn" to mean 5,000 bushels, or one contract,instead of five contracts; "ten December corn" may mean 10,000 bushels or two contracts. So,say it both ways – five contracts or 25,000 bushels. With livestock, five Oct CME Live Cattlemeans five contracts, so there is less confusion.
Why would you use a stop order?
Let's say that Jul CME Lean Hog futures are at $70.00/cwt. If you placed a price order, you would sell at $70.00/cwt.If you placed a stop at $69.50/cwt, the order would not be filled. If the market rises to $72.00/cwt, you can replaceyour stop order with one at $71.50/cwt. Then, if the market rises to $74.00/cwt, you replace the stop with one at$73.50/cwt. When the market turns down again, your order is filled at $73.50/cwt or below, better than the$70.00/cwt price order.
RIGHT WAY WRONG WAY
Sell futures Sell three Jun CME Live Cattle futures. Buy three Jun CME Live Cattle futures.
Go short three Jun CME Live Cattle futures. Go long three Jun CME Live Cattle futures.
Buy futures Buy 15,000 bushels of December corn. Sell 15,000 bushels of December corn.
Go long three December corn contracts. Go short three December corn contracts.
Commodity Marketing
32
The Hedging Account
Your account is calculated on a daily basis.
When you sell or buy futures contracts, you are required to place a performance bond deposit withyour broker. The deposit is a small percentage of the value of each contract traded, representing theloss you could incur in the next day's market. While you hold a position in the market, the brokercalculates the value of your position day by day. When the value of your position falls and, thus, youraccount balance falls below a certain amount, the broker will issue a performance bond call, askingyou to put more money in your account.
For example, the initial performance bond deposit may be $405.00 for one CME Live Cattle futurescontract. The maintenance balance may be $300.00 – that is, you will not get a performance bond calluntil the balance falls below $300.00. Then you will be asked to deposit money to bring the balanceback up to the initial $405.00.
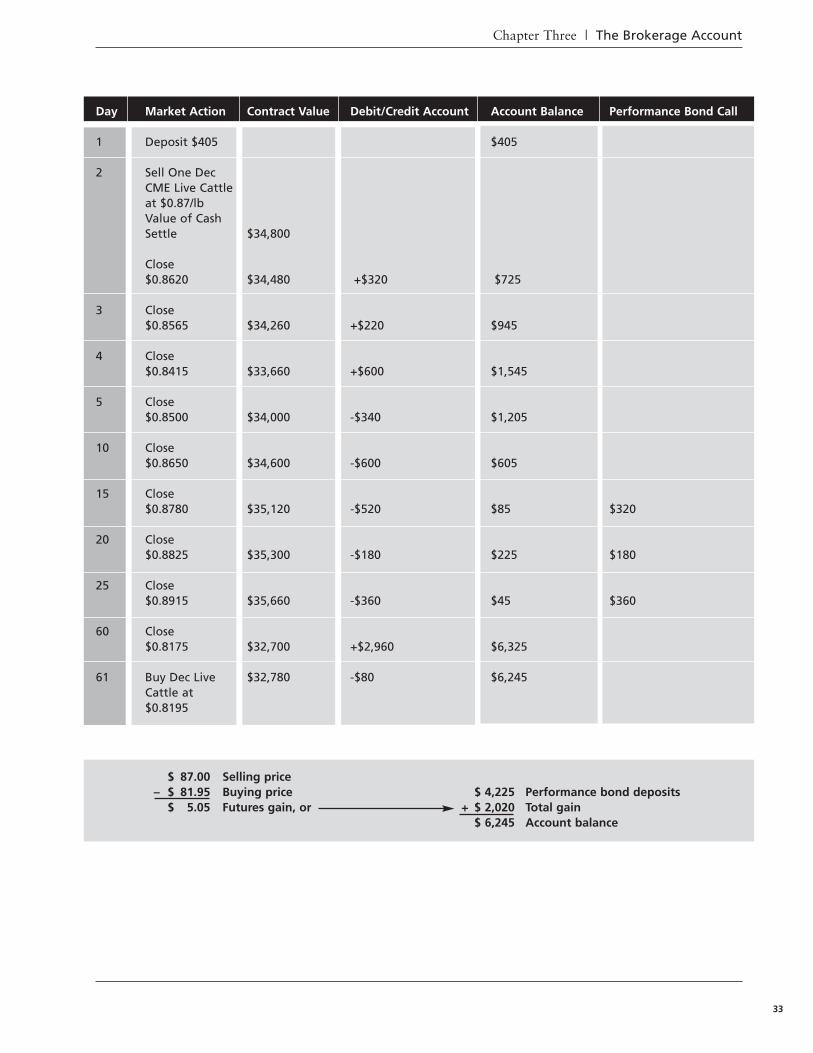
Example: You sell one Dec CME Live Cattle futures contract at $87.00/cwt. The total value of thecontract is $34,800 (400 cwt x $87.00/cwt). You will realize a gain if you buy back a Dec CME Live Cattlefutures contract for less than you sold it. As the futures price falls below the selling price, your positionimproves. But, if the futures price rises above the selling price, your position worsens.
Take a look at the table that follows for the progress on your account.
Your Position
For a gain, the selling price must be higher than the buying price.
When you sell futures, you gain when the price falls below your selling price. Sell high, buy low.
When you buy futures, you gain when the price rises above your buying price. Buy low, sell high.
Chapter Three | The Brokerage Account
33
$ 87.00 Selling price– $ 81.95 Buying price $ 4,225 Performance bond deposits
$ 5.05 Futures gain, or + $ 2,020 Total gain$ 6,245 Account balance
Day Market Action Contract Value Debit/Credit Account Account Balance Performance Bond Call
1 Deposit $405 $405
2 Sell One DecCME Live Cattleat $0.87/lbValue of Cash Settle $34,800
Close$0.8620 $34,480 +$320 $725
3 Close$0.8565 $34,260 +$220 $945
4 Close$0.8415 $33,660 +$600 $1,545
5 Close$0.8500 $34,000 -$340 $1,205
10 Close$0.8650 $34,600 -$600 $605
15 Close$0.8780 $35,120 -$520 $85 $320
20 Close$0.8825 $35,300 -$180 $225 $180
25 Close$0.8915 $35,660 -$360 $45 $360
60 Close$0.8175 $32,700 +$2,960 $6,325
61 Buy Dec Live $32,780 -$80 $6,245 Cattle at $0.8195
Commodity Marketing
34
You start with a performance bond deposit of $405.00. By the end of the second day, the contractdecreases in value by $320.00; that is, you would realize a gain if you bought it back for $320.00 lessthan you paid for it. The $320.00 is credited to your account. Not until the fifth day does the futuresprice begin to rise again. This time the contract value has increased by $340.00 which is subtractedfrom your account balance.
On the fifteenth day, your account balance falls below the $300.00 maintenance balance. You get aperformance bond call and are asked to deposit another $320.00. By the 60th day, the contract valuehas fallen considerably, and you realize a gain by offsetting the contract at this lower price. You decideto buy a Dec CME Live Cattle futures contract the next day at $81.95/cwt.
Your futures gain is $5.05/cwt – or a total of $5,385 for the contract. The account balance of $6,245includes the $5,385 plus your performance bond deposits totaling $860.00. Commission would then bededucted from this amount.
Broker's Statement
Every time you place an order with your broker, you receive written confirmation of that order after itis been filled. Also, at the end of each month, you will receive a monthly statement from the broker.This statement shows the activity in your account during that month.
• Each trade made • Futures gains or losses to date • Market value of options you hold • Cash deposits and withdrawals • Account balance, profit and loss
Most brokers should also be able to provide you with this information on a daily basis. Be sure to keepthis statement. Check it against the order confirmations you received during the month. Check itagainst your own records to be sure that everything is accurate.
Your Own Records
It is important that you keep your own trading journal, both to keep track of your marketing plan andfor tax purposes. A small notebook will do. Be sure to record each trade and write the reasons formaking the trade. Then record offsetting each trade and the gain or loss you incurred.
Your journal will be necessary for tax purposes in case you are audited. There is a limitation on netcapital losses and the IRS allows hedging activities generally to be reflected as ordinary income loss. Ifyou are a producer, you want to be able to prove that your trading activity was done for hedgingpurposes and not for speculating.
Chapter Three | The Brokerage Account
35
Chapter Three Exercise
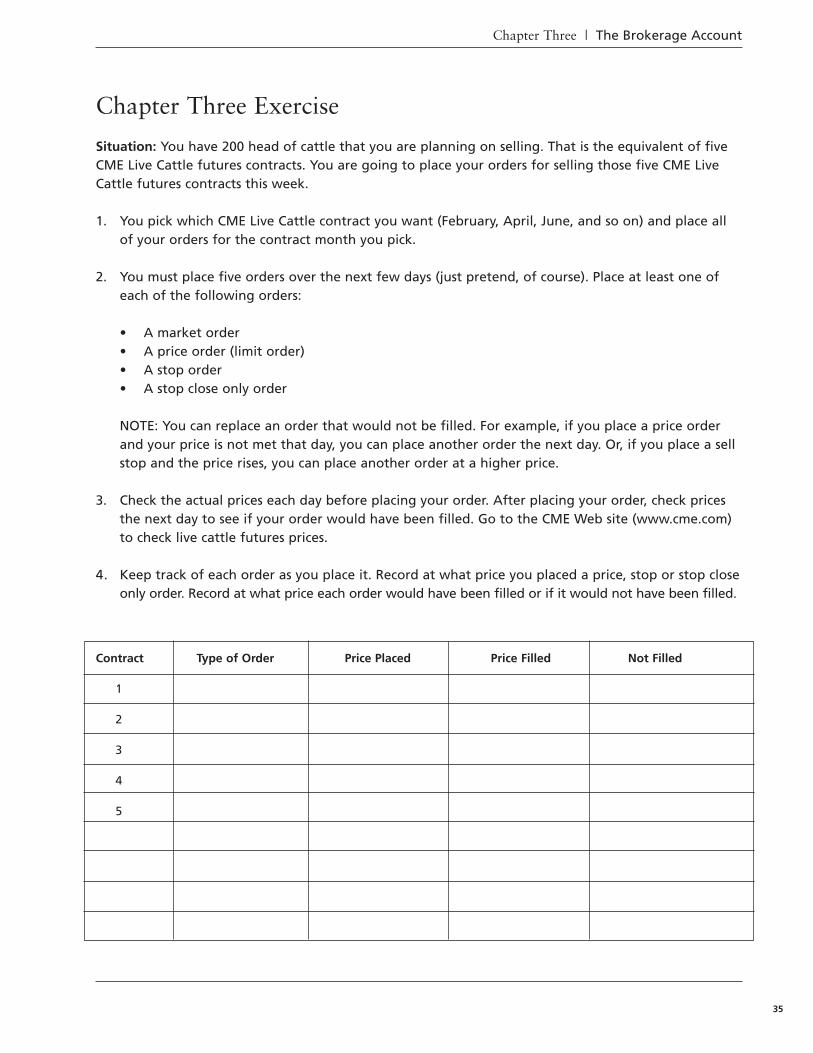
Situation: You have 200 head of cattle that you are planning on selling. That is the equivalent of fiveCME Live Cattle futures contracts. You are going to place your orders for selling those five CME LiveCattle futures contracts this week.
1. You pick which CME Live Cattle contract you want (February, April, June, and so on) and place allof your orders for the contract month you pick.
2. You must place five orders over the next few days (just pretend, of course). Place at least one ofeach of the following orders:
• A market order• A price order (limit order)• A stop order• A stop close only order
NOTE: You can replace an order that would not be filled. For example, if you place a price orderand your price is not met that day, you can place another order the next day. Or, if you place a sellstop and the price rises, you can place another order at a higher price.
3. Check the actual prices each day before placing your order. After placing your order, check pricesthe next day to see if your order would have been filled. Go to the CME Web site (www.cme.com)to check live cattle futures prices.
4. Keep track of each order as you place it. Record at what price you placed a price, stop or stop closeonly order. Record at what price each order would have been filled or if it would not have been filled.
Contract Type of Order Price Placed Price Filled Not Filled
1
2
3
4
5

Commodity Marketing
36
Chapter Four | Supply and Demand
37
Price Prediction
You need to be able to reasonably estimate which way prices will move.
If you are going to be trading futures contracts, it is essential that you know how to make a reasonableestimate of what will happen to prices in the future. Of course, no one can know for certain what priceswill be, but it pays to have an educated opinion as to whether prices will rise or fall.
Price expectation can be derived from two different approaches to analyzing the markets:
• Fundamental analysis uses supply and demand information to determine its anticipated impacton prices.
• Technical analysis interprets historical price movements to predict prices in the future.
While some speculators and hedgers may use only one of these approaches, others use a combinationof fundamental and technical analysis to project prices.
NOTE: There are people – both hedgers and speculators – who weigh the validity of fundamental andtechnical analysis differently. Some advocate one technique, while others advocate both. This chapterpresents fundamental analysis from the viewpoint of those who believe it to be valid.
A fundamentalist (a person who engages in fundamental analysis) looks at causes external to thetrading markets that affect the prices in the markets. Of course, a fundamentalist has to know what tolook for and how to interpret the information available.
Chapter 4Supply and Demand
Chapter Four Objectives
• To understand how fundamental analysis is used to project prices for commodities• To learn how supply and demand determine the market price• To learn about supply and demand factors affecting crop prices• To learn about supply and demand factors affecting livestock prices
Commodity Marketing
38
Supply and Demand
Both supply and demand determine the market price for a commodity.
External factors affect the supply and demand for any commodity. The price of a commodity isdetermined by how much of the commodity there is (supply), how much of it people want (demand)and what they are willing to pay for it.
Supply can be defined as the quantity of a commodity that producers are willing to provide to themarket at a given price. If grain prices are too low, producers may decide to keep the grain in storage,reducing the supply of the grain to the market. If the price of dairy products is too low, farmers maydecide to send milk cows to slaughter, reducing the quantity of dairy goods brought to market. Ifprices are high, producers will release greater quantities of the commodity to the market.
Weather is one of the primary factors influencing commodity supply. Clearly, conditions during thegrowing season and harvest will impact the short-run supply of a commodity. Weather in foreignproducer countries will also affect expected global supply, and hence U.S. prices. If China’s weatherconditions are good, the quantity of an export commodity will be much larger, shifting world supplyand moving prices down. Weather can also affect supply indirectly, but affecting the cost of inputs intoanother commodity market: if feed prices are high, over the long-run fewer livestock will be suppliedto the market. But weather’s effect on prices can be difficult to predict. For instance, an increase infeed corn prices due to bad growing conditions may induce livestock producers to shift to wheat feedrather than reduce output altogether.
Government efforts to promote domestic agriculture through subsidies, protective tariffs, supportprices, preferential access to export markets, marketing boards, and so on, have two principal effectson commodity prices. Because such policies tend to lead to over-production of a protected commodity,prices will be lower overall. In addition, protecting the domestic market generally results in a smallerfree-market supply. Relatively small shifts in world supply can then lead to large price changes, makingworld commodity prices more volatile than they would otherwise be. Also, changes in governmentpolicy, which are difficult to predict, can affect commodity prices in unexpected ways. For instance, the1996 U.S. farm legislation encouraged increased soybean production, with an overall decrease inoilseed prices that affected canola and cottonseed prices (both soybean substitutes) as well.
Finally, many commodities, like corn and soybeans, exhibit seasonal price patterns related to theiryearly production cycle. Since prices after harvest must adjust in order to apportion the availablesupply over time until the next harvest, seasonal price patterns – the differences between current yearprices and long-run averages – are one of the primary fundamental price forecasting tools.
Chapter Four | Supply and Demand
39
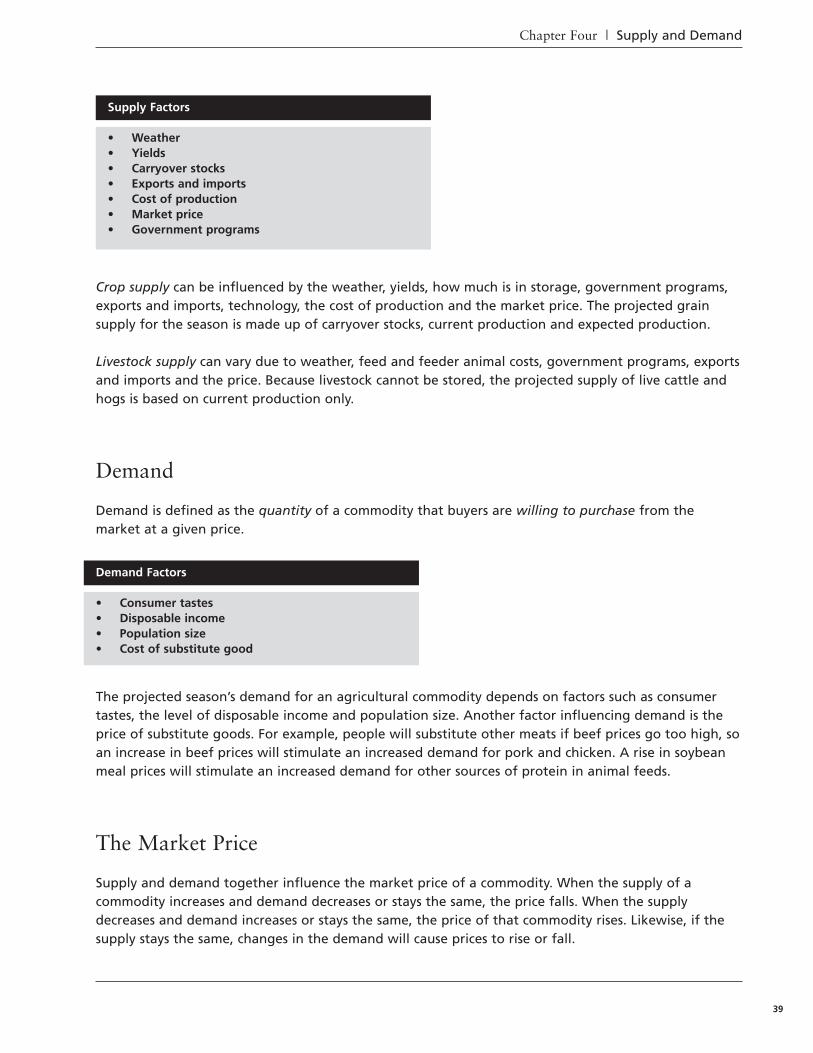
Crop supply can be influenced by the weather, yields, how much is in storage, government programs,exports and imports, technology, the cost of production and the market price. The projected grainsupply for the season is made up of carryover stocks, current production and expected production.
Livestock supply can vary due to weather, feed and feeder animal costs, government programs, exportsand imports and the price. Because livestock cannot be stored, the projected supply of live cattle andhogs is based on current production only.
Demand
Demand is defined as the quantity of a commodity that buyers are willing to purchase from themarket at a given price.
The projected season’s demand for an agricultural commodity depends on factors such as consumertastes, the level of disposable income and population size. Another factor influencing demand is theprice of substitute goods. For example, people will substitute other meats if beef prices go too high, soan increase in beef prices will stimulate an increased demand for pork and chicken. A rise in soybeanmeal prices will stimulate an increased demand for other sources of protein in animal feeds.
The Market Price
Supply and demand together influence the market price of a commodity. When the supply of acommodity increases and demand decreases or stays the same, the price falls. When the supplydecreases and demand increases or stays the same, the price of that commodity rises. Likewise, if thesupply stays the same, changes in the demand will cause prices to rise or fall.
Supply Factors
• Weather • Yields • Carryover stocks • Exports and imports • Cost of production • Market price • Government programs
Demand Factors
• Consumer tastes• Disposable income• Population size• Cost of substitute good
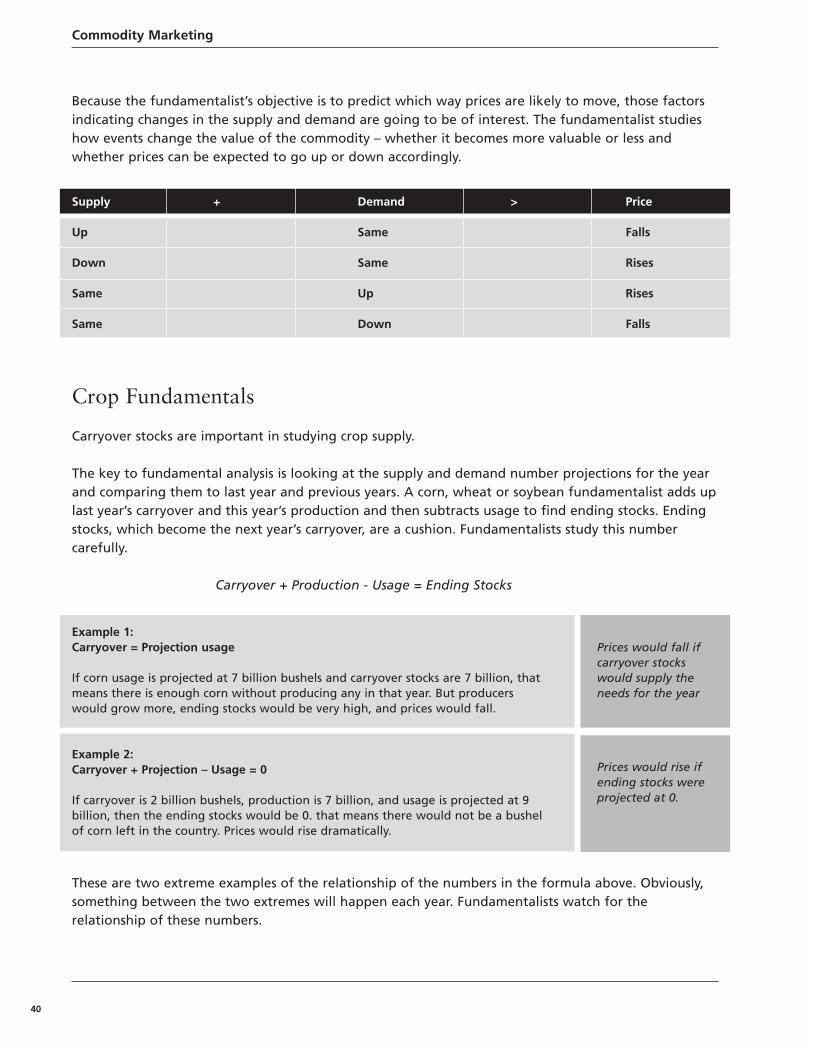
Commodity Marketing
40
Because the fundamentalist’s objective is to predict which way prices are likely to move, those factorsindicating changes in the supply and demand are going to be of interest. The fundamentalist studieshow events change the value of the commodity – whether it becomes more valuable or less andwhether prices can be expected to go up or down accordingly.
Crop Fundamentals
Carryover stocks are important in studying crop supply.
The key to fundamental analysis is looking at the supply and demand number projections for the yearand comparing them to last year and previous years. A corn, wheat or soybean fundamentalist adds uplast year’s carryover and this year’s production and then subtracts usage to find ending stocks. Endingstocks, which become the next year’s carryover, are a cushion. Fundamentalists study this numbercarefully.
Carryover + Production - Usage = Ending Stocks
These are two extreme examples of the relationship of the numbers in the formula above. Obviously,something between the two extremes will happen each year. Fundamentalists watch for therelationship of these numbers.
Supply + Demand > Price
Up Same Falls
Down Same Rises
Same Up Rises
Same Down Falls
Example 1:Carryover = Projection usage
If corn usage is projected at 7 billion bushels and carryover stocks are 7 billion, thatmeans there is enough corn without producing any in that year. But producerswould grow more, ending stocks would be very high, and prices would fall.
Example 2:Carryover + Projection – Usage = 0
If carryover is 2 billion bushels, production is 7 billion, and usage is projected at 9billion, then the ending stocks would be 0. that means there would not be a bushelof corn left in the country. Prices would rise dramatically.
Prices would fall ifcarryover stockswould supply theneeds for the year
Prices would rise ifending stocks wereprojected at 0.
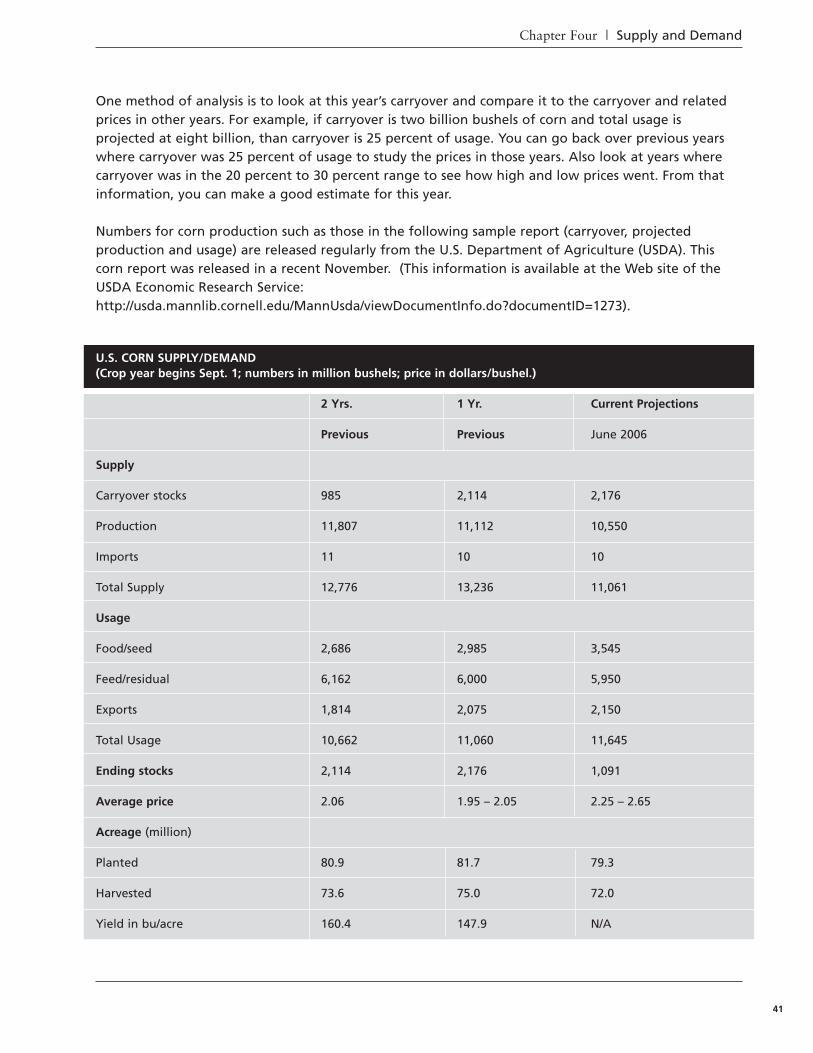
Chapter Four | Supply and Demand
41
One method of analysis is to look at this year’s carryover and compare it to the carryover and relatedprices in other years. For example, if carryover is two billion bushels of corn and total usage isprojected at eight billion, than carryover is 25 percent of usage. You can go back over previous yearswhere carryover was 25 percent of usage to study the prices in those years. Also look at years wherecarryover was in the 20 percent to 30 percent range to see how high and low prices went. From thatinformation, you can make a good estimate for this year.
Numbers for corn production such as those in the following sample report (carryover, projectedproduction and usage) are released regularly from the U.S. Department of Agriculture (USDA). Thiscorn report was released in a recent November. (This information is available at the Web site of theUSDA Economic Research Service:http://usda.mannlib.cornell.edu/MannUsda/viewDocumentInfo.do?documentID=1273).
U.S. CORN SUPPLY/DEMAND(Crop year begins Sept. 1; numbers in million bushels; price in dollars/bushel.)
2 Yrs. 1 Yr. Current Projections
Previous Previous June 2006
Supply
Carryover stocks 985 2,114 2,176
Production 11,807 11,112 10,550
Imports 11 10 10
Total Supply 12,776 13,236 11,061
Usage
Food/seed 2,686 2,985 3,545
Feed/residual 6,162 6,000 5,950
Exports 1,814 2,075 2,150
Total Usage 10,662 11,060 11,645
Ending stocks 2,114 2,176 1,091
Average price 2.06 1.95 – 2.05 2.25 – 2.65
Acreage (million)
Planted 80.9 81.7 79.3
Harvested 73.6 75.0 72.0
Yield in bu/acre 160.4 147.9 N/A
Commodity Marketing
42
Fundamentalists watch the USDA numbers to project the overall trend in the market and translate thatinformation into a realistic price projection. Some go beyond USDA information to watch exports,weather and other economic factors to fine-tune their own supply and demand estimates.
Corn, Wheat and Soybeans
Fundamentalists study specific supply and demand factors for each crop.
Important fundamentals relating to corn supply are acreage and yields. Yields are dependent onmoisture and temperature, especially during the critical months of July and August. Higher-than-normal rainfall causes higher yields. A combination of below-normal rainfall and above-normaltemperatures can cause lower yields. The number of acres planted depends a lot on price. Low pricescan encourage producers to plant other crops or participate in government production controlprograms.
A factor of corn demand is the number of livestock on feed. If the price of meat falls, fewer livestockwill be produced, and when livestock numbers are lower, less corn is needed. If the price of corn risestoo high, livestock producers will reduce their use of corn by reducing the number of animals on feedor the length of time livestock are on feed.
Another demand factor is exports. A world bumper corn crop can reduce the demand for U.S. exports.Also, the U.S. dollar exchange rate affects exports – if the dollar is weak, foreigners can purchase moredollars for a given amount of their own currency and can buy more U.S. corn.
Wheat As with corn, wheat supply is largely dependent on growing conditions. Because there are basicallytwo types of wheat – winter and spring – growing conditions should be watched during winter andsummer. For example, a lack of adequate snow cover during the winter months can damage the winterwheat crop and reduce yields. On the demand side, exports play a large role. One half to two thirds ofU.S. wheat production is exported to other countries such as Japan and Russia each year.
SoybeansMost of the soybean crop is used for soybean meal and oil. Consequently, the demand for soybeansdepends on the demand for meal, used for animal feed and in people food, and oil, used in edible oilproducts and in industry. A number to watch is called the crush margin, a relationship of the cost ofsoybeans to be crushed and the value of the resulting soybean oil and meal. If soybean prices are toohigh, the crush margin may decrease and cause a decline in processing. Then the demand for soybeansalso decreases.
About a third of the U.S. soybean crop is exported to countries such as Germany, the Netherlands andJapan. A fundamentalist would watch growing conditions in competing exporting nations such asArgentina and Brazil.

Chapter Four | Supply and Demand
43
Livestock Fundamentals
When studying livestock, fundamentalists focus on projected supply.
Fundamental analysis for livestock is different from analysis of grains because there are no carryoverstocks. Livestock cannot be stored as grains can. Basically, the livestock that are raised are marketed.Fundamental analysis for livestock is a matter of studying supply and demand to predict prices.
Fundamentalists project the cattle and hog supply based on number in the USDA reports. This exampleis taken from a USDA: National Agricultural Statistics Service Cattle on Feed Report from a typicalrecent June, which relates activity during May. This report shows that the number of cattle on feed onJune 1 in the seven major cattle feeding states is up 4 percent from a year earlier. The current yearpercentage is 104 percent of what it was on June 1 of the previous year. Marketing for May is up 9 percent from the previous year, while placement of more cattle on feed is down 14 percent. (Thisinformation is available online at: http://www.ers.usda.gov/Publications/LDP/LDPTables.htm).
Fundamental analysts will see if livestock numbers are projected to be higher or lower than last year.They look at consumption patterns and decide if demand appears to be better or worse than before.Based on supply and demand patterns over several years, many fundamentalists have developed theirown formulas to calculate what effect a percentage increase or decrease in supply has on prices, giventhat other factors are equal. For example, a hog analyst may have determined that a 1 percentdecrease in supply causes a 1 percent increase in prices. So, if supply is 98 percent of a year ago andthe hog price was $50/cwt, then prices would be projected at $51/cwt.
Livestock analysis is more difficult than crop analysis. On the supply side, cattle and hog producers aregreatly influenced by the cost of feed and the current or expected livestock market price. If feed pricesare too high or livestock prices fall, producers will take steps to raise fewer animals. Their first responseto low prices is to bring more animals to slaughter, which actually increases current supply. This causesprices to fall even lower. Over a period of time, fewer offspring are produced and supplies decrease.
CATTLE ON FEED (From seven states; numbers in million head)
Number as Percentage of:
2 Yrs. Previous 1 Yr. Previous Current Year 2 Yrs. Previous 1 Yr. Previous
On Feed May 1 10,375 10,641 11,559 111% 109%
Placed on Feed During May 2,370 2,223 1,913 81% 86%
Feed Cattle Marketed During May 2,026 1,997 2,170 107% 109%
Other Disappearance During May 79 96 115 146% 120%
On Feed June 1 10,640 10,771 11,187 105% 104%
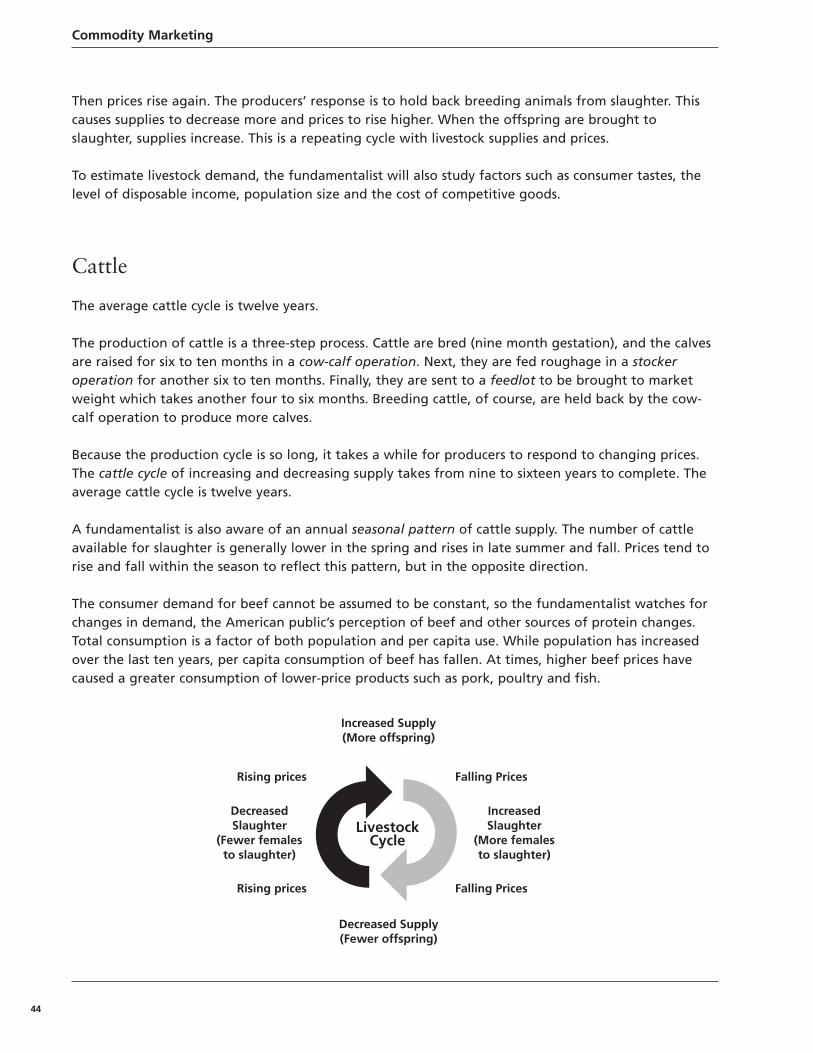
Commodity Marketing
44
Then prices rise again. The producers’ response is to hold back breeding animals from slaughter. Thiscauses supplies to decrease more and prices to rise higher. When the offspring are brought toslaughter, supplies increase. This is a repeating cycle with livestock supplies and prices.
To estimate livestock demand, the fundamentalist will also study factors such as consumer tastes, thelevel of disposable income, population size and the cost of competitive goods.
Cattle
The average cattle cycle is twelve years.
The production of cattle is a three-step process. Cattle are bred (nine month gestation), and the calvesare raised for six to ten months in a cow-calf operation. Next, they are fed roughage in a stockeroperation for another six to ten months. Finally, they are sent to a feedlot to be brought to marketweight which takes another four to six months. Breeding cattle, of course, are held back by the cow-calf operation to produce more calves.
Because the production cycle is so long, it takes a while for producers to respond to changing prices.The cattle cycle of increasing and decreasing supply takes from nine to sixteen years to complete. Theaverage cattle cycle is twelve years.
A fundamentalist is also aware of an annual seasonal pattern of cattle supply. The number of cattleavailable for slaughter is generally lower in the spring and rises in late summer and fall. Prices tend torise and fall within the season to reflect this pattern, but in the opposite direction.
The consumer demand for beef cannot be assumed to be constant, so the fundamentalist watches forchanges in demand, the American public’s perception of beef and other sources of protein changes.Total consumption is a factor of both population and per capita use. While population has increasedover the last ten years, per capita consumption of beef has fallen. At times, higher beef prices havecaused a greater consumption of lower-price products such as pork, poultry and fish.
LivestockCycle
Increased Supply(More offspring)
Decreased Supply(Fewer offspring)
Rising prices Falling Prices
DecreasedSlaughter
(Fewer females to slaughter)
IncreasedSlaughter
(More females to slaughter)
Rising prices Falling Prices
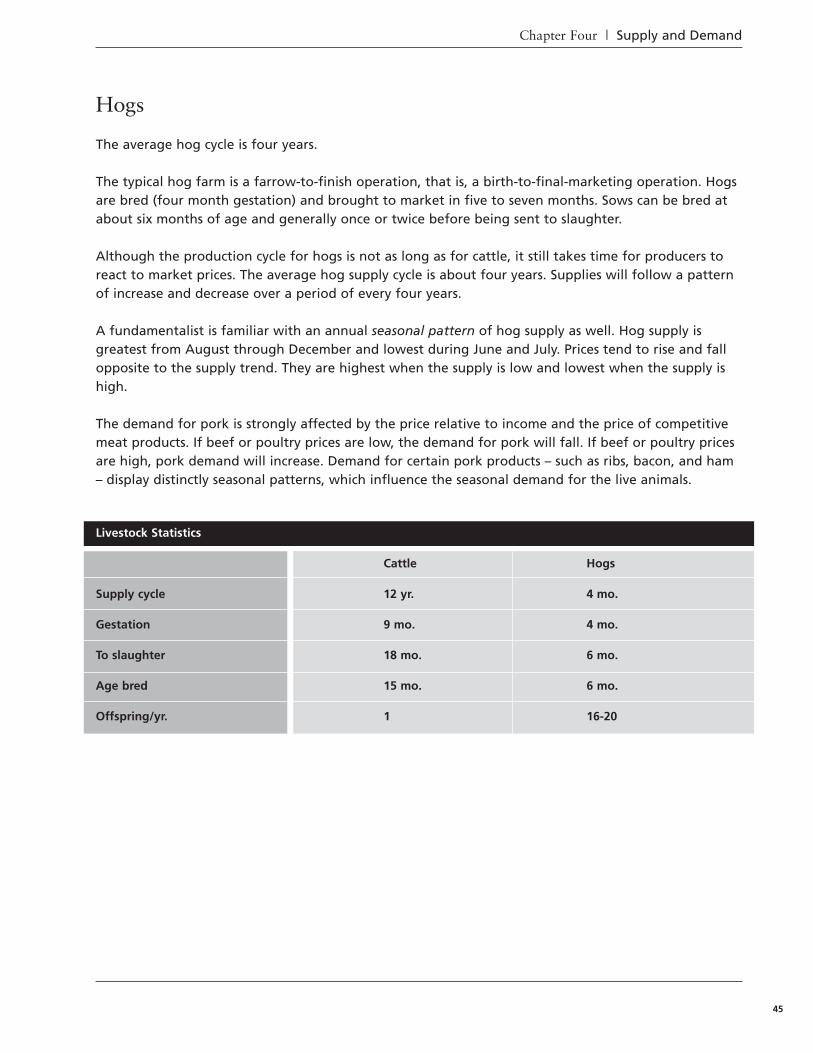
Chapter Four | Supply and Demand
45
Hogs
The average hog cycle is four years.
The typical hog farm is a farrow-to-finish operation, that is, a birth-to-final-marketing operation. Hogsare bred (four month gestation) and brought to market in five to seven months. Sows can be bred atabout six months of age and generally once or twice before being sent to slaughter.
Although the production cycle for hogs is not as long as for cattle, it still takes time for producers toreact to market prices. The average hog supply cycle is about four years. Supplies will follow a patternof increase and decrease over a period of every four years.
A fundamentalist is familiar with an annual seasonal pattern of hog supply as well. Hog supply isgreatest from August through December and lowest during June and July. Prices tend to rise and fallopposite to the supply trend. They are highest when the supply is low and lowest when the supply ishigh.
The demand for pork is strongly affected by the price relative to income and the price of competitivemeat products. If beef or poultry prices are low, the demand for pork will fall. If beef or poultry pricesare high, pork demand will increase. Demand for certain pork products – such as ribs, bacon, and ham– display distinctly seasonal patterns, which influence the seasonal demand for the live animals.
Livestock Statistics
Cattle Hogs
Supply cycle 12 yr. 4 mo.
Gestation 9 mo. 4 mo.
To slaughter 18 mo. 6 mo.
Age bred 15 mo. 6 mo.
Offspring/yr. 1 16-20
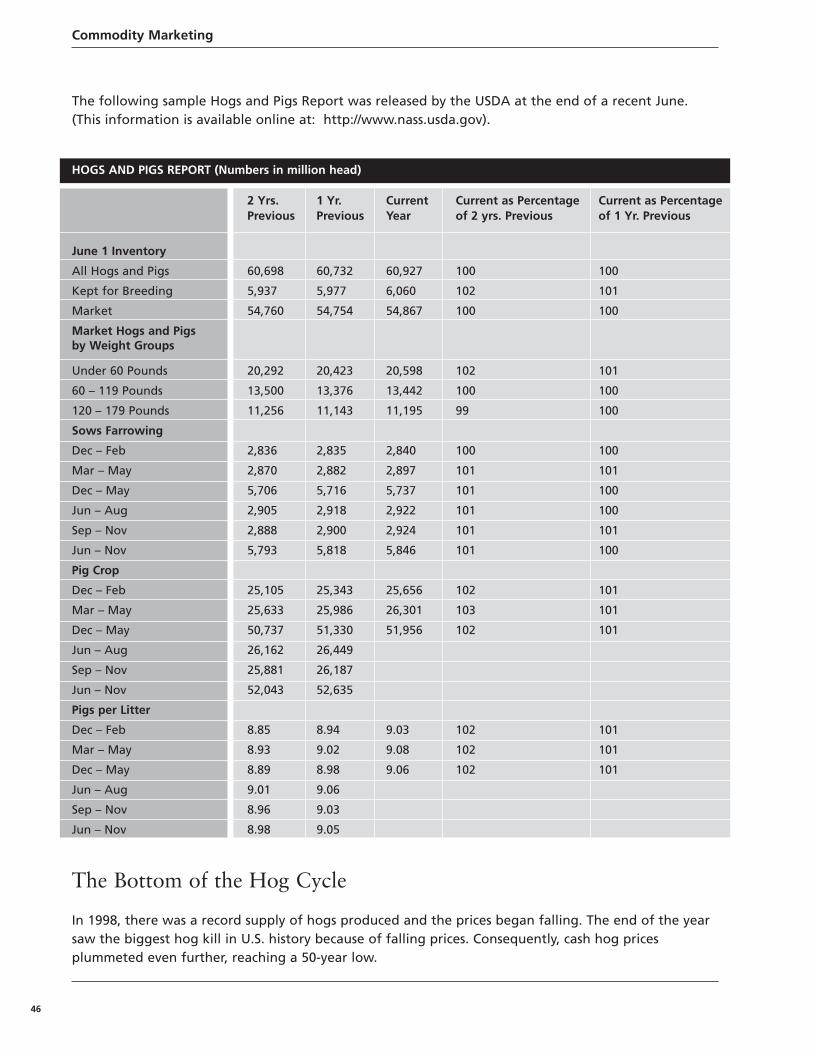
Commodity Marketing
46
The following sample Hogs and Pigs Report was released by the USDA at the end of a recent June.(This information is available online at: http://www.nass.usda.gov).
The Bottom of the Hog Cycle
In 1998, there was a record supply of hogs produced and the prices began falling. The end of the yearsaw the biggest hog kill in U.S. history because of falling prices. Consequently, cash hog pricesplummeted even further, reaching a 50-year low.
HOGS AND PIGS REPORT (Numbers in million head)
2 Yrs. 1 Yr. Current Current as Percentage Current as Percentage Previous Previous Year of 2 yrs. Previous of 1 Yr. Previous
June 1 Inventory
All Hogs and Pigs 60,698 60,732 60,927 100 100
Kept for Breeding 5,937 5,977 6,060 102 101
Market 54,760 54,754 54,867 100 100
Market Hogs and Pigsby Weight Groups
Under 60 Pounds 20,292 20,423 20,598 102 101
60 – 119 Pounds 13,500 13,376 13,442 100 100
120 – 179 Pounds 11,256 11,143 11,195 99 100
Sows Farrowing
Dec – Feb 2,836 2,835 2,840 100 100
Mar – May 2,870 2,882 2,897 101 101
Dec – May 5,706 5,716 5,737 101 100
Jun – Aug 2,905 2,918 2,922 101 100
Sep – Nov 2,888 2,900 2,924 101 101
Jun – Nov 5,793 5,818 5,846 101 100
Pig Crop
Dec – Feb 25,105 25,343 25,656 102 101
Mar – May 25,633 25,986 26,301 103 101
Dec – May 50,737 51,330 51,956 102 101
Jun – Aug 26,162 26,449
Sep – Nov 25,881 26,187
Jun – Nov 52,043 52,635
Pigs per Litter
Dec – Feb 8.85 8.94 9.03 102 101
Mar – May 8.93 9.02 9.08 102 101
Dec – May 8.89 8.98 9.06 102 101
Jun – Aug 9.01 9.06
Sep – Nov 8.96 9.03
Jun – Nov 8.98 9.05
Chapter Four | Supply and Demand
47
Chapter Four Exercise
Reading: Take a look at the latest Cattle on Feed Report from the USDA athttp://usda.mannlib.cornell.edu/MannUsda/viewDocumentInfo.do?documentID=1020. Select the latest year and then select the latest report.
Reading: You can also see the USDA Hogs and Pigs Report athttp://usda.mannlib.cornell.edu/MannUsda/viewDocumentInfo.do?documentID=1086. Select the latest year and then select the latest report.
Reading: Explore the resources that offer news and information on agricultural commodities. Go to www.cme.com to see a list of resources. Select news organizations and read some articles forfundamental information. What effect does this information have on the current price of thecommodity?
Commodity Marketing
48
Chapter Five | Analytical Tools
49
Price Prediction
Technical analysis uses historical price patterns to help predict futures prices.
Technical analysts take a different approach to studying the markets. They believe that everything thatcan affect the market – including all the fundamental, psychological, and political factors – mustultimately be reflected in the price of the commodity. Instead of concerning themselves with the actualreasons why market prices are moving up or down, technical analysts study the market action itself. Inthis sense, they use a shortcut form of fundamental analysis.
Prices move because of changes in supply and demand, which includes what traders hope or fearmight happen. Day-by-day market action is the result of both the fundamental factors we have studiedand the reaction of traders.
From the technical analyst’s point of view, it is all reflected in the price. The analyst has studiedhistorical price patterns, and he or she charts current market activity. Based on patterns in the currentactivity, the analyst tries to predict where prices are going.
As seen, technical analysis approaches price forecasting in a very different way than fundamentalanalysis. Technical analysis tools can be applied to many different markets, while a fundamentalapproach requires detailed knowledge about supply and demand factors and how those factorsinfluence prices. Fundamental analysis assumes that it is new information about those supply anddemand factors that will determine future prices. This kind of market behavior is described as efficient:current prices reflect all of the information available to the market (as well as expectations about thefuture based on that information). Only new, unexpected information will change prices, and past
Chapter 5Analytical Tools
Chapter Five Objectives
• To understand how technical analysis is used to project prices for commodities• To learn how to read the bar charts that analysts use• To learn some of the signals used to project price trends and price reversals• To understand that point and figure and moving average charts are forecasting tools too
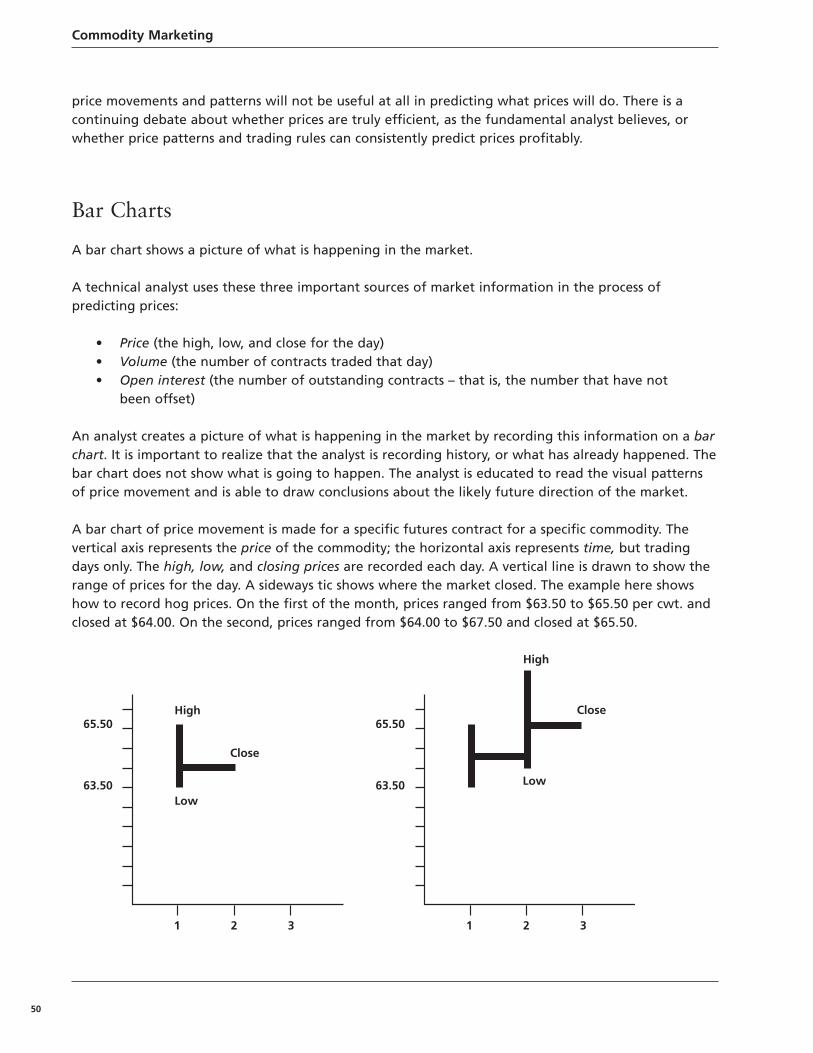
Commodity Marketing
50
price movements and patterns will not be useful at all in predicting what prices will do. There is acontinuing debate about whether prices are truly efficient, as the fundamental analyst believes, orwhether price patterns and trading rules can consistently predict prices profitably.
Bar Charts
A bar chart shows a picture of what is happening in the market.
A technical analyst uses these three important sources of market information in the process ofpredicting prices:
• Price (the high, low, and close for the day) • Volume (the number of contracts traded that day) • Open interest (the number of outstanding contracts – that is, the number that have not
been offset)
An analyst creates a picture of what is happening in the market by recording this information on a barchart. It is important to realize that the analyst is recording history, or what has already happened. Thebar chart does not show what is going to happen. The analyst is educated to read the visual patternsof price movement and is able to draw conclusions about the likely future direction of the market.
A bar chart of price movement is made for a specific futures contract for a specific commodity. Thevertical axis represents the price of the commodity; the horizontal axis represents time, but tradingdays only. The high, low, and closing prices are recorded each day. A vertical line is drawn to show therange of prices for the day. A sideways tic shows where the market closed. The example here showshow to record hog prices. On the first of the month, prices ranged from $63.50 to $65.50 per cwt. andclosed at $64.00. On the second, prices ranged from $64.00 to $67.50 and closed at $65.50.
65.50High
Low
Close
63.50
1 2 3
65.50
High
Low
Close
63.50
1 2 3
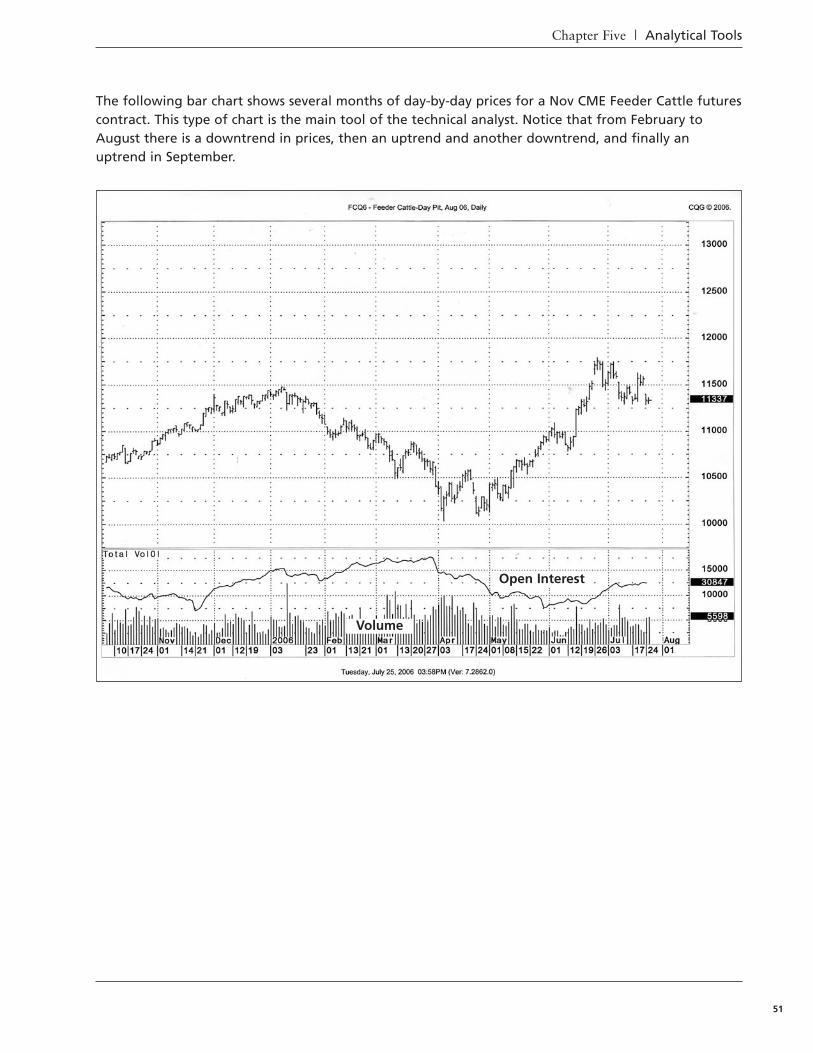
Chapter Five | Analytical Tools
51
The following bar chart shows several months of day-by-day prices for a Nov CME Feeder Cattle futurescontract. This type of chart is the main tool of the technical analyst. Notice that from February toAugust there is a downtrend in prices, then an uptrend and another downtrend, and finally anuptrend in September.
Open Interest
Volume
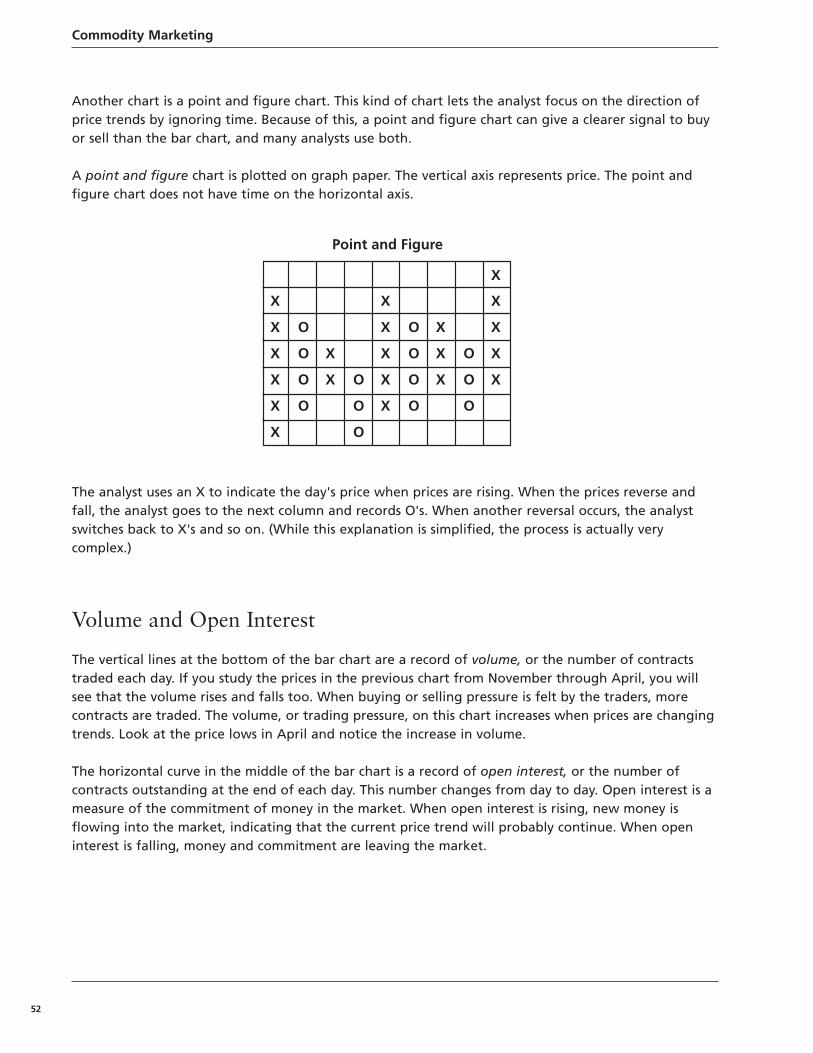
Commodity Marketing
52
Another chart is a point and figure chart. This kind of chart lets the analyst focus on the direction ofprice trends by ignoring time. Because of this, a point and figure chart can give a clearer signal to buyor sell than the bar chart, and many analysts use both.
A point and figure chart is plotted on graph paper. The vertical axis represents price. The point andfigure chart does not have time on the horizontal axis.
The analyst uses an X to indicate the day's price when prices are rising. When the prices reverse andfall, the analyst goes to the next column and records O's. When another reversal occurs, the analystswitches back to X's and so on. (While this explanation is simplified, the process is actually verycomplex.)
Volume and Open Interest
The vertical lines at the bottom of the bar chart are a record of volume, or the number of contractstraded each day. If you study the prices in the previous chart from November through April, you willsee that the volume rises and falls too. When buying or selling pressure is felt by the traders, morecontracts are traded. The volume, or trading pressure, on this chart increases when prices are changingtrends. Look at the price lows in April and notice the increase in volume.
The horizontal curve in the middle of the bar chart is a record of open interest, or the number ofcontracts outstanding at the end of each day. This number changes from day to day. Open interest is ameasure of the commitment of money in the market. When open interest is rising, new money isflowing into the market, indicating that the current price trend will probably continue. When openinterest is falling, money and commitment are leaving the market.
X
X
X
X
X
X
O
O
O
O
X
X O
O
O
X
X
X
X
X
O
O
O
O
X
X
X
O
O
O
X
X
X
X
X
Point and Figure
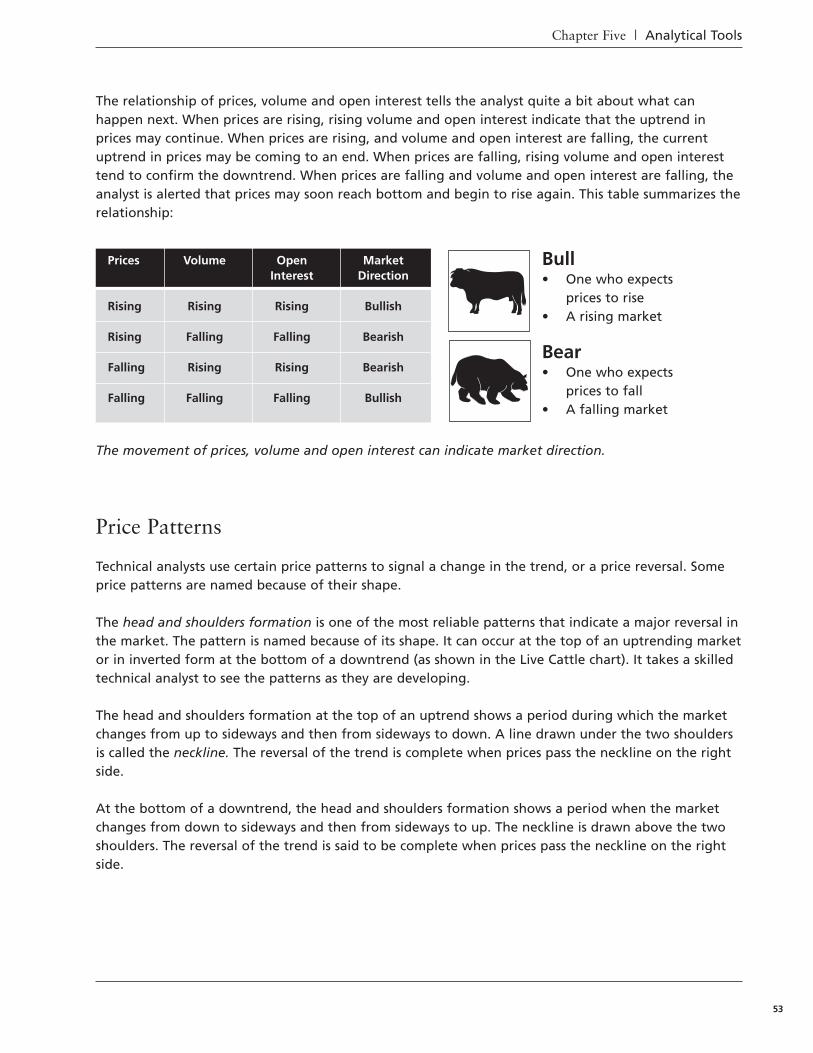
Chapter Five | Analytical Tools
53
The relationship of prices, volume and open interest tells the analyst quite a bit about what canhappen next. When prices are rising, rising volume and open interest indicate that the uptrend inprices may continue. When prices are rising, and volume and open interest are falling, the currentuptrend in prices may be coming to an end. When prices are falling, rising volume and open interesttend to confirm the downtrend. When prices are falling and volume and open interest are falling, theanalyst is alerted that prices may soon reach bottom and begin to rise again. This table summarizes therelationship:
Price Patterns
Technical analysts use certain price patterns to signal a change in the trend, or a price reversal. Someprice patterns are named because of their shape.
The head and shoulders formation is one of the most reliable patterns that indicate a major reversal inthe market. The pattern is named because of its shape. It can occur at the top of an uptrending marketor in inverted form at the bottom of a downtrend (as shown in the Live Cattle chart). It takes a skilledtechnical analyst to see the patterns as they are developing.
The head and shoulders formation at the top of an uptrend shows a period during which the marketchanges from up to sideways and then from sideways to down. A line drawn under the two shouldersis called the neckline. The reversal of the trend is complete when prices pass the neckline on the rightside.
At the bottom of a downtrend, the head and shoulders formation shows a period when the marketchanges from down to sideways and then from sideways to up. The neckline is drawn above the twoshoulders. The reversal of the trend is said to be complete when prices pass the neckline on the rightside.
Prices Volume Open Market Interest Direction
Rising Rising Rising Bullish
Rising Falling Falling Bearish
Falling Rising Rising Bearish
Falling Falling Falling Bullish
Bull• One who expects
prices to rise• A rising market
Bear• One who expects
prices to fall• A falling market
The movement of prices, volume and open interest can indicate market direction.
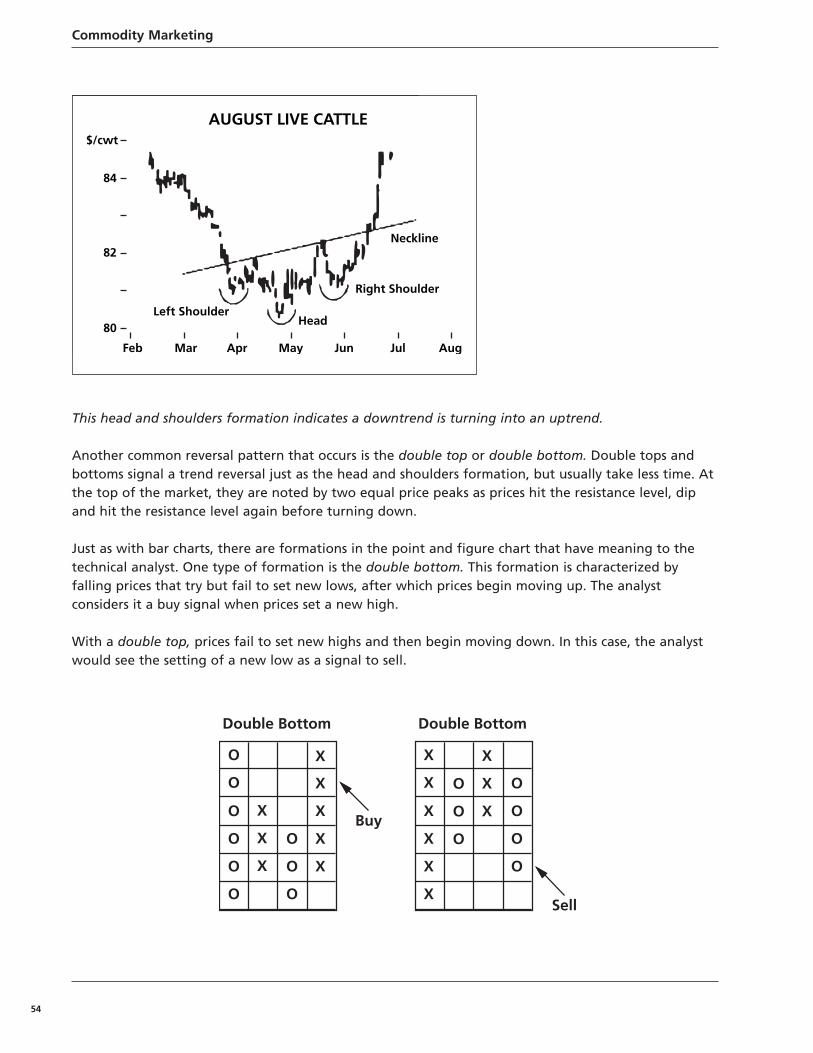
Commodity Marketing
54
This head and shoulders formation indicates a downtrend is turning into an uptrend.
Another common reversal pattern that occurs is the double top or double bottom. Double tops andbottoms signal a trend reversal just as the head and shoulders formation, but usually take less time. Atthe top of the market, they are noted by two equal price peaks as prices hit the resistance level, dipand hit the resistance level again before turning down.
Just as with bar charts, there are formations in the point and figure chart that have meaning to thetechnical analyst. One type of formation is the double bottom. This formation is characterized byfalling prices that try but fail to set new lows, after which prices begin moving up. The analystconsiders it a buy signal when prices set a new high.
With a double top, prices fail to set new highs and then begin moving down. In this case, the analystwould see the setting of a new low as a signal to sell.
O
O
O
O
O
O
X
X
X
O
O
O
X
X
X
X
X
Double Bottom
BuyX
X
X
X
X
X
O
O
O
X
X
X
O
O
O
O
Double Bottom
Sell
$/cwt
84
82
80
Feb Mar Apr May Jun Jul Aug
Neckline
Right Shoulder
Left Shoulder
AUGUST LIVE CATTLE
Head
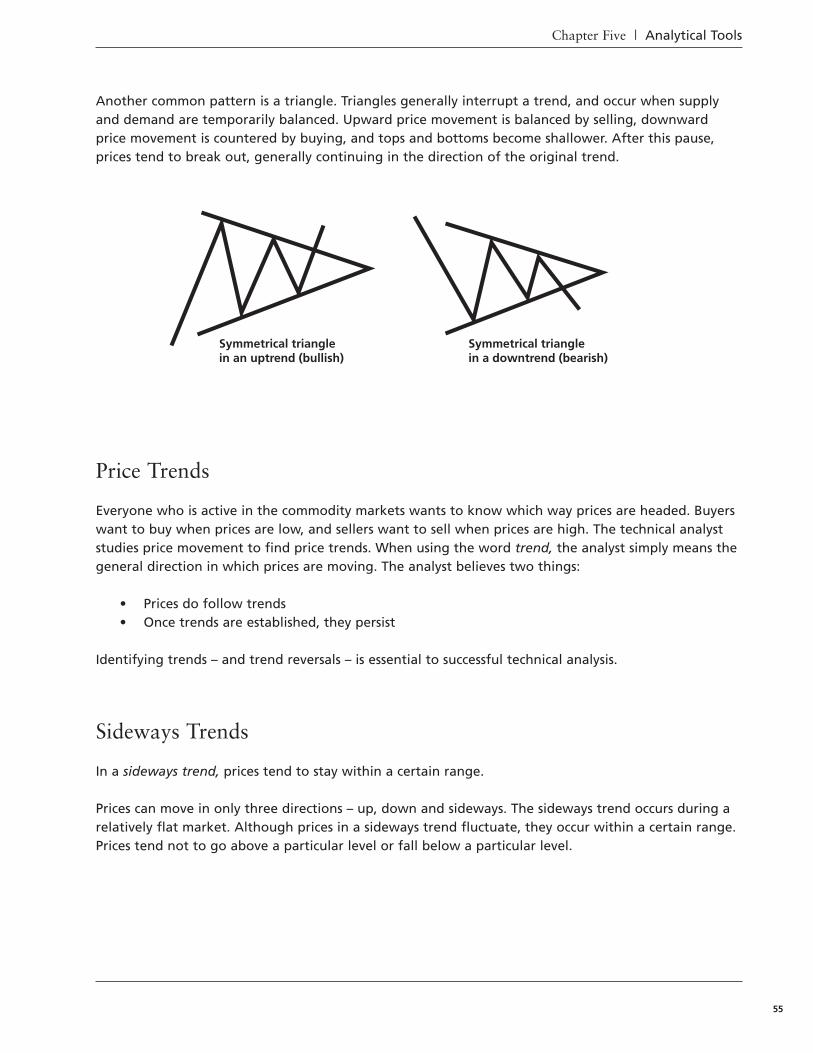
Chapter Five | Analytical Tools
55
Another common pattern is a triangle. Triangles generally interrupt a trend, and occur when supplyand demand are temporarily balanced. Upward price movement is balanced by selling, downwardprice movement is countered by buying, and tops and bottoms become shallower. After this pause,prices tend to break out, generally continuing in the direction of the original trend.
Price Trends
Everyone who is active in the commodity markets wants to know which way prices are headed. Buyerswant to buy when prices are low, and sellers want to sell when prices are high. The technical analyststudies price movement to find price trends. When using the word trend, the analyst simply means thegeneral direction in which prices are moving. The analyst believes two things:
• Prices do follow trends• Once trends are established, they persist
Identifying trends – and trend reversals – is essential to successful technical analysis.
Sideways Trends
In a sideways trend, prices tend to stay within a certain range.
Prices can move in only three directions – up, down and sideways. The sideways trend occurs during arelatively flat market. Although prices in a sideways trend fluctuate, they occur within a certain range.Prices tend not to go above a particular level or fall below a particular level.
Symmetrical triangle in an uptrend (bullish)
Symmetrical triangle in a downtrend (bearish)
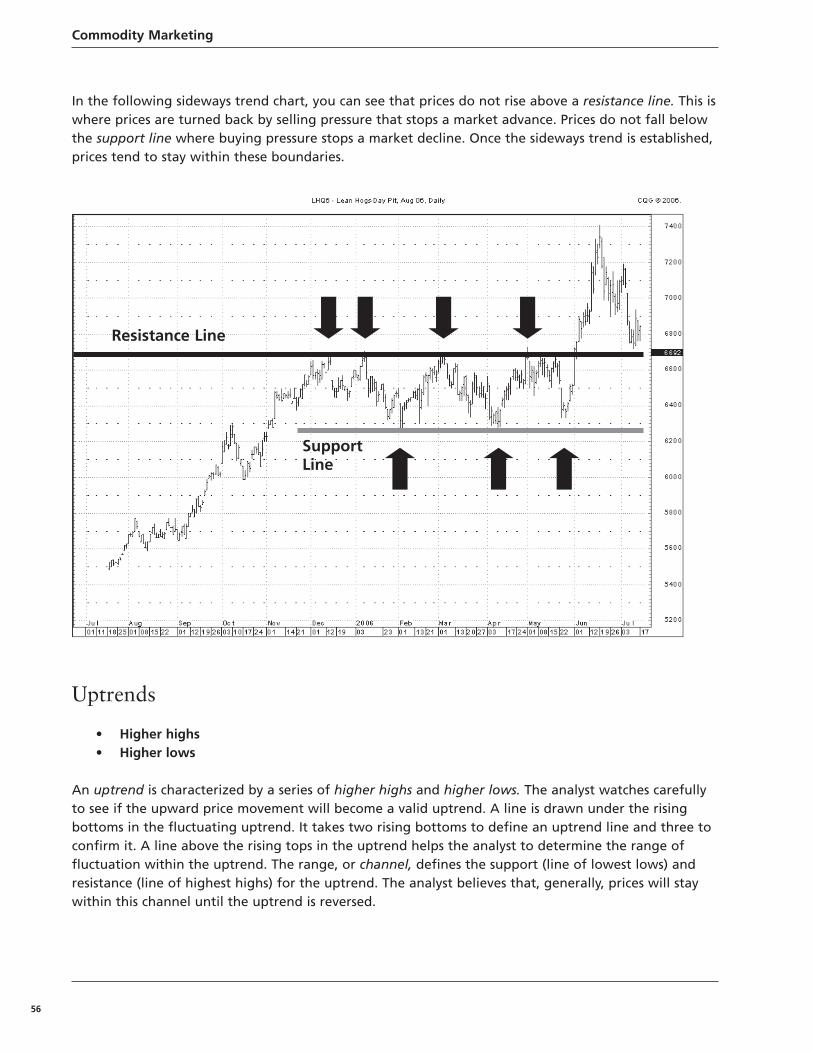
Commodity Marketing
56
In the following sideways trend chart, you can see that prices do not rise above a resistance line. This iswhere prices are turned back by selling pressure that stops a market advance. Prices do not fall belowthe support line where buying pressure stops a market decline. Once the sideways trend is established,prices tend to stay within these boundaries.
Uptrends
• Higher highs• Higher lows
An uptrend is characterized by a series of higher highs and higher lows. The analyst watches carefullyto see if the upward price movement will become a valid uptrend. A line is drawn under the risingbottoms in the fluctuating uptrend. It takes two rising bottoms to define an uptrend line and three toconfirm it. A line above the rising tops in the uptrend helps the analyst to determine the range offluctuation within the uptrend. The range, or channel, defines the support (line of lowest lows) andresistance (line of highest highs) for the uptrend. The analyst believes that, generally, prices will staywithin this channel until the uptrend is reversed.
Resistance Line
SupportLine
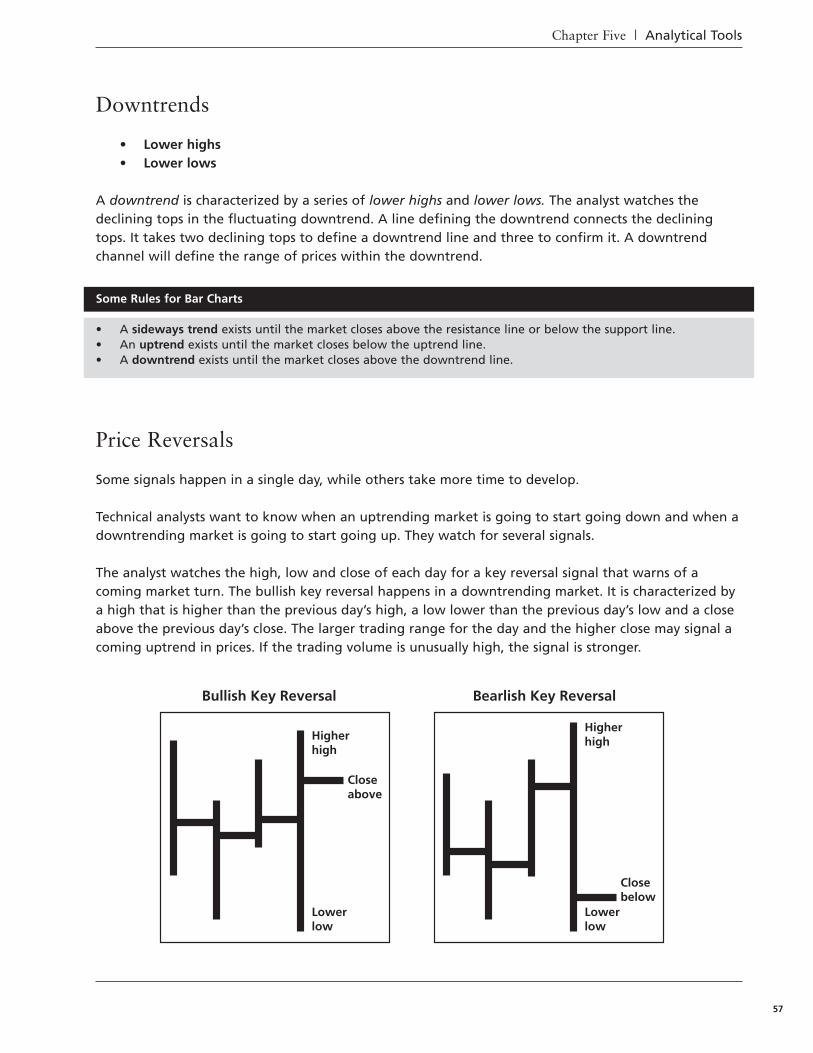
Chapter Five | Analytical Tools
57
Downtrends
• Lower highs • Lower lows
A downtrend is characterized by a series of lower highs and lower lows. The analyst watches thedeclining tops in the fluctuating downtrend. A line defining the downtrend connects the decliningtops. It takes two declining tops to define a downtrend line and three to confirm it. A downtrendchannel will define the range of prices within the downtrend.
Price Reversals
Some signals happen in a single day, while others take more time to develop.
Technical analysts want to know when an uptrending market is going to start going down and when adowntrending market is going to start going up. They watch for several signals.
The analyst watches the high, low and close of each day for a key reversal signal that warns of acoming market turn. The bullish key reversal happens in a downtrending market. It is characterized bya high that is higher than the previous day’s high, a low lower than the previous day’s low and a closeabove the previous day’s close. The larger trading range for the day and the higher close may signal acoming uptrend in prices. If the trading volume is unusually high, the signal is stronger.
Higherhigh
Bullish Key Reversal Bearlish Key Reversal
Lowerlow
Closeabove
Higherhigh
Lowerlow
Closebelow
Some Rules for Bar Charts
• A sideways trend exists until the market closes above the resistance line or below the support line. • An uptrend exists until the market closes below the uptrend line. • A downtrend exists until the market closes above the downtrend line.
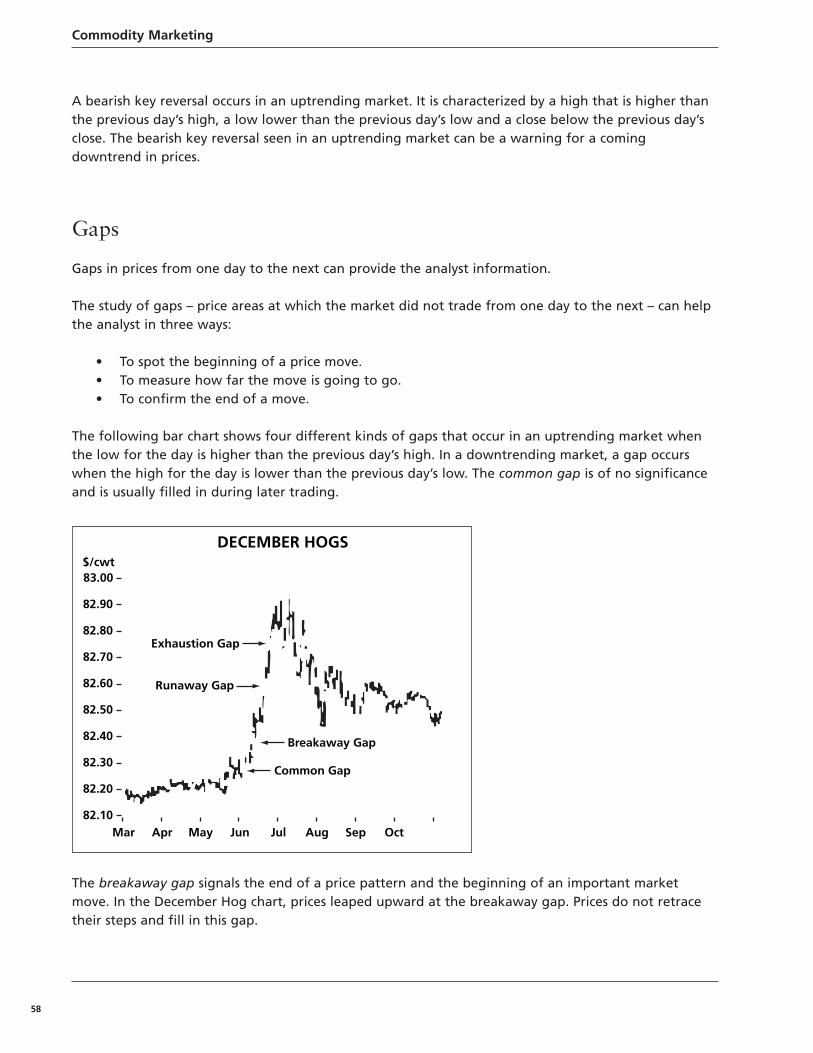
Commodity Marketing
58
A bearish key reversal occurs in an uptrending market. It is characterized by a high that is higher thanthe previous day’s high, a low lower than the previous day’s low and a close below the previous day’sclose. The bearish key reversal seen in an uptrending market can be a warning for a comingdowntrend in prices.
Gaps
Gaps in prices from one day to the next can provide the analyst information.
The study of gaps – price areas at which the market did not trade from one day to the next – can helpthe analyst in three ways:
• To spot the beginning of a price move. • To measure how far the move is going to go. • To confirm the end of a move.
The following bar chart shows four different kinds of gaps that occur in an uptrending market whenthe low for the day is higher than the previous day’s high. In a downtrending market, a gap occurswhen the high for the day is lower than the previous day’s low. The common gap is of no significanceand is usually filled in during later trading.
The breakaway gap signals the end of a price pattern and the beginning of an important marketmove. In the December Hog chart, prices leaped upward at the breakaway gap. Prices do not retracetheir steps and fill in this gap.
$/cwt83.00
82.90
82.80
82.70
82.60
82.50
82.40
82.30
82.20
82.10Mar Apr May Jun Jul Aug Sep Oct
Common Gap
Breakaway Gap
Runaway Gap
Exhaustion Gap
DECEMBER HOGS
Chapter Five | Analytical Tools
59
A breakaway gap occurs when prices do not retrace their steps and fill in this gap.
A runaway gap occurs after the trend has begun. In the December Hog chart, prices again leaped upsuddenly. The runaway gap is called the measuring gap because it often marks the halfway point ofthe market move. It shows that prices will probably move again as much as they already have.
An exhaustion gap occurs near the top (or bottom) of a move and warns that the top (or bottom) ofthe market will be reached soon. It foretells an abrupt turn in the market.
Moving Average Charts
Average prices provide a tool for identifying buy and sell signals.
A moving average is the arithmetic average of prices over a period of time. For example, a three-daymoving average of Milk prices would be the average of the closing prices of the past three days. Tofind the average, you add the closing prices from the last three days and divide by three. The next day,you calculate a new average and so on. The moving averages can then be plotted on a graph.
Analysts can use three-day, five-day, ten-day or twenty-day moving averages - whatever suits them – towatch price moves. The analyst interested in short-term moves would use shorter-term movingaverages.
The moving average chart below records both three-day and ten-day moving averages of wheat prices.Some of the typical rules the analyst will follow are:
• Buy when the short-term (three-day) moving average moves above the long-term (ten-daymoving average).
• Sell when the short-term (three-day) moving average moves below the long-term movingaverage.
Gaps
• Breakaway gap: Signals the beginning of a price move.
• Runaway gap: Measures how far prices can be expected to move.
• Exhaustion gap:Warns that the move will soon end.
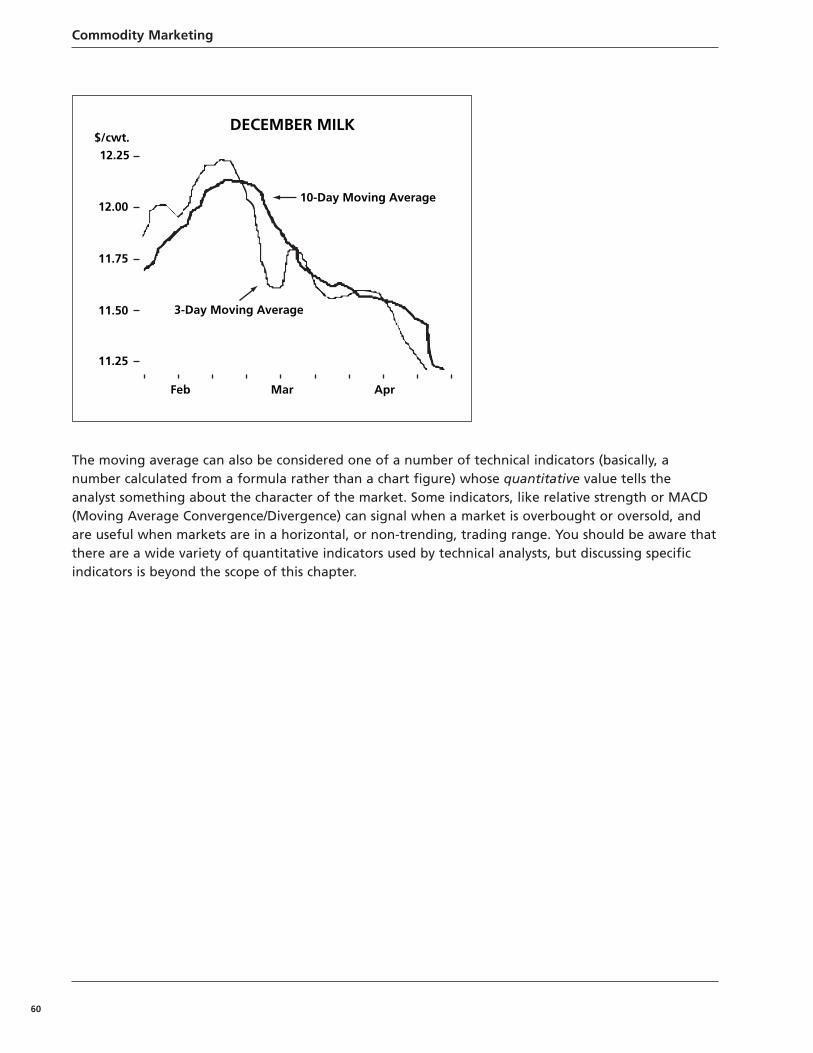
Commodity Marketing
60
The moving average can also be considered one of a number of technical indicators (basically, anumber calculated from a formula rather than a chart figure) whose quantitative value tells theanalyst something about the character of the market. Some indicators, like relative strength or MACD(Moving Average Convergence/Divergence) can signal when a market is overbought or oversold, andare useful when markets are in a horizontal, or non-trending, trading range. You should be aware thatthere are a wide variety of quantitative indicators used by technical analysts, but discussing specificindicators is beyond the scope of this chapter.
12.25$/cwt.
12.00
11.75
11.50
11.25
Feb Mar Apr
3-Day Moving Average
10-Day Moving Average
DECEMBER MILK
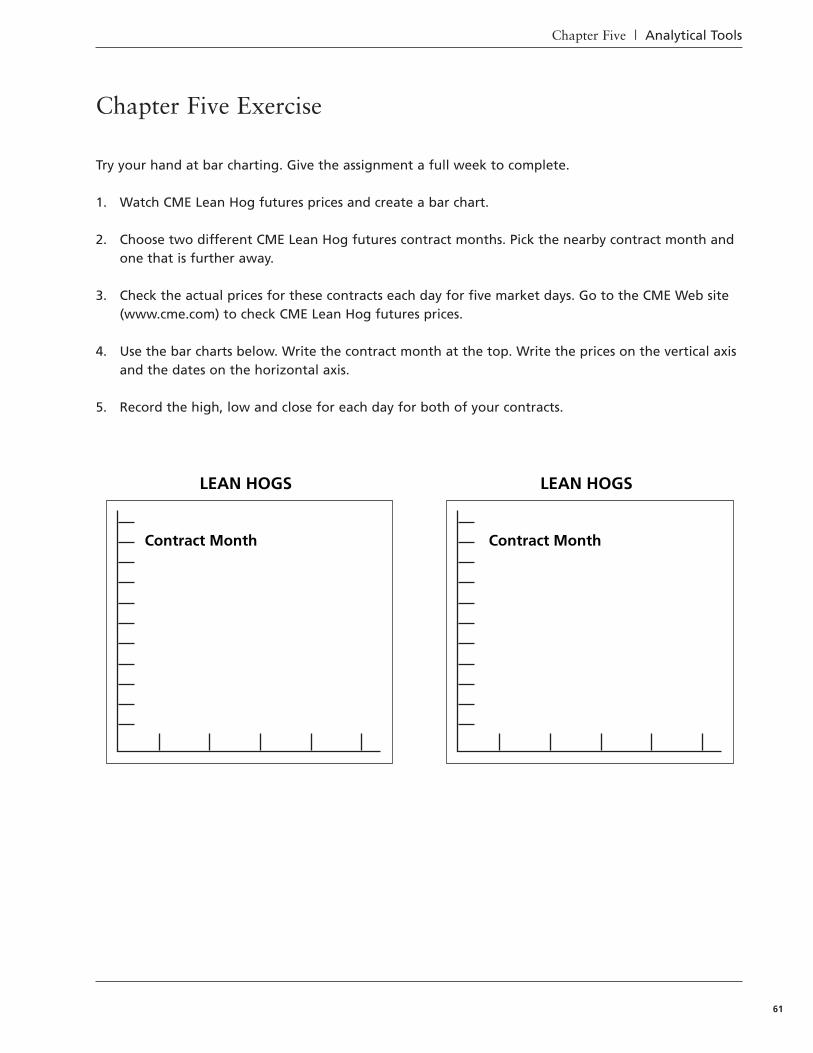
Chapter Five | Analytical Tools
61
Chapter Five Exercise
Try your hand at bar charting. Give the assignment a full week to complete.
1. Watch CME Lean Hog futures prices and create a bar chart.
2. Choose two different CME Lean Hog futures contract months. Pick the nearby contract month andone that is further away.
3. Check the actual prices for these contracts each day for five market days. Go to the CME Web site(www.cme.com) to check CME Lean Hog futures prices.
4. Use the bar charts below. Write the contract month at the top. Write the prices on the vertical axisand the dates on the horizontal axis.
5. Record the high, low and close for each day for both of your contracts.
Contract Month
LEAN HOGS
Contract Month
LEAN HOGS

Commodity Marketing
62
Chapter Six | Options Terms
63
Options on Futures
Like futures, producers can use options on futures to lock in prices and benefit from price changes. Hedging with futures is a risk-management technique that provides protection against falling pricesfor those producers who have a commodity to sell and against rising prices for those who plan to buya commodity. In both cases, producers can use futures to lock in a price.
The hedger who plans to sell will be pleased with the locked-in price if prices fall, but on the otherhand, may wish he or she had not hedged if those prices rise. The same is true about the hedger whoplans to buy – happy with the locked-in price if prices rise, but not if prices fall.
Buying options on futures is another market alternative. Options provide the producer with priceprotection just as futures do, but they also provide the opportunity to benefit from favorable pricechanges. And option buyers do not have to worry about performance bonds.
An option on a futures contract is an agreement that grants the right, but not the obligation, to buyor sell an underlying futures contract at a specified price before a specified time. When you own anoption, you have the right to buy or sell the underlying futures contract, but you do not have to. Youcan instead let the option expire. The ability to choose to use the option, or not, means that theoption hedge will give producers the locked-in price they need, but, unlike a futures contract, will alsoallow them to take advantage of price movements in their favor.
Chapter 6Options Terms
Chapter Six Objectives
• To learn what options on futures contracts are and the terms associated with them• To understand how producers can use options to lock in prices and benefit from price changes• To understand how the option premium is determined• To learn the mechanics of using puts and calls
Options
• Producers use options to lock in a price and also take advantage of prices moving to their benefit. • Speculators trade options to make a profit on price movements and on the premiums.
Commodity Marketing
64
Options Terms
Each option specifies:
• The type of option
There are two kinds of options. A put option grants you the right, but not the obligation, to sell afutures contract at the strike price specified. A call option grants you the right, but not the obligation,to buy a futures contract at the strike price specified.
• The commodity and the contract month of the underlying futures contract
For instance, the February call option on CME Lean Hog futures gives the owner the right to a longposition in the February CME Lean Hog futures contract.
• The maturity of the option
The life of an option is determined by the futures contract month it covers. For example, a Decemberoption in a deliverable contract may expire one to two weeks before the first delivery of the Decemberfutures contract.
• The price at which the futures will be bought or sold
An option on a futures contract states the price at which you may buy or sell the underlying futurescontract. This price is called the strike price. The strike price of the option does not change. If the strikeprice is $70.00/cwt., that price stays the same throughout the life of the option.
Since the option is a valuable asset in its own right, when you buy an option, you pay a price for it:
• The premium of the option
The premium for each option is determined on the exchange floor by open outcry as the traders makebids and offers to buy and sell the options. Depending on the comparison of the strike price to thecurrent futures price and other factors, a premium can be high or low. The seller of the option receivesthe premium.
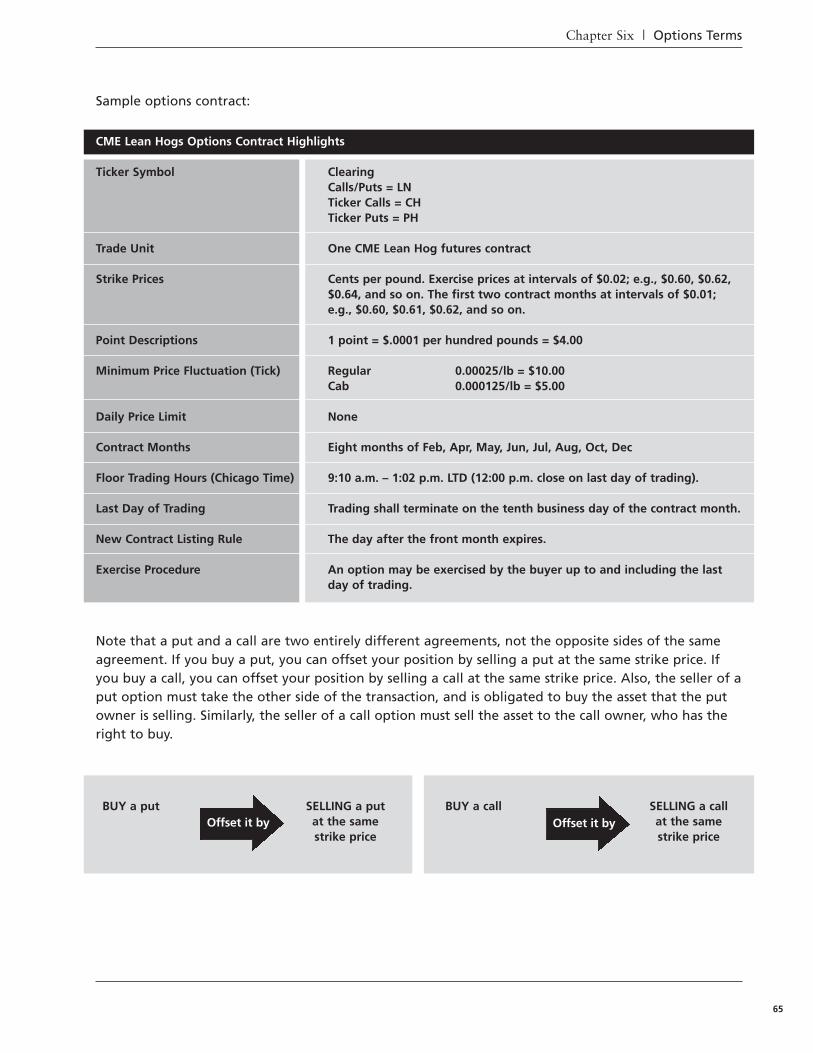
Chapter Six | Options Terms
65
Sample options contract:
Note that a put and a call are two entirely different agreements, not the opposite sides of the sameagreement. If you buy a put, you can offset your position by selling a put at the same strike price. Ifyou buy a call, you can offset your position by selling a call at the same strike price. Also, the seller of aput option must take the other side of the transaction, and is obligated to buy the asset that the putowner is selling. Similarly, the seller of a call option must sell the asset to the call owner, who has theright to buy.
CME Lean Hogs Options Contract Highlights
Ticker Symbol
Trade Unit
Strike Prices
Point Descriptions
Minimum Price Fluctuation (Tick)
Daily Price Limit
Contract Months
Floor Trading Hours (Chicago Time)
Last Day of Trading
New Contract Listing Rule
Exercise Procedure
ClearingCalls/Puts = LNTicker Calls = CHTicker Puts = PH
One CME Lean Hog futures contract
Cents per pound. Exercise prices at intervals of $0.02; e.g., $0.60, $0.62,$0.64, and so on. The first two contract months at intervals of $0.01;e.g., $0.60, $0.61, $0.62, and so on.
1 point = $.0001 per hundred pounds = $4.00
Regular 0.00025/lb = $10.00Cab 0.000125/lb = $5.00
None
Eight months of Feb, Apr, May, Jun, Jul, Aug, Oct, Dec
9:10 a.m. – 1:02 p.m. LTD (12:00 p.m. close on last day of trading).
Trading shall terminate on the tenth business day of the contract month.
The day after the front month expires.
An option may be exercised by the buyer up to and including the lastday of trading.
BUY a put SELLING a putat the samestrike price
BUY a call SELLING a callat the samestrike price
Offset it by Offset it by
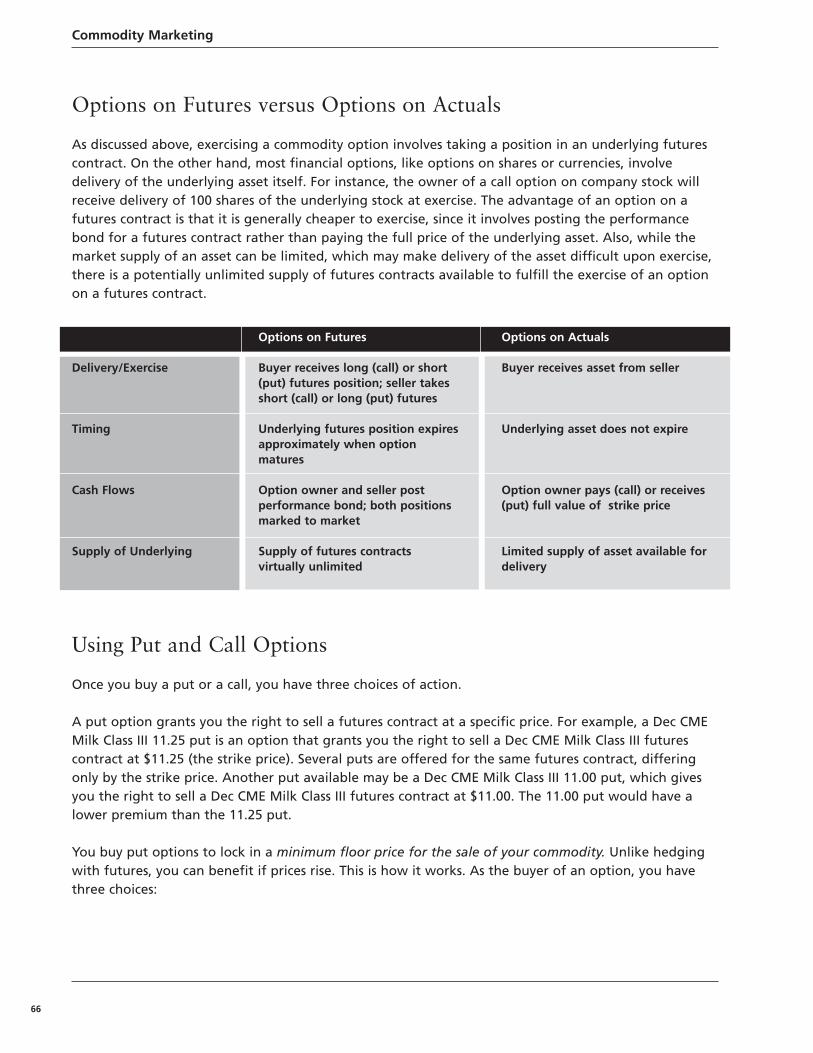
Commodity Marketing
66
Options on Futures versus Options on Actuals
As discussed above, exercising a commodity option involves taking a position in an underlying futurescontract. On the other hand, most financial options, like options on shares or currencies, involvedelivery of the underlying asset itself. For instance, the owner of a call option on company stock willreceive delivery of 100 shares of the underlying stock at exercise. The advantage of an option on afutures contract is that it is generally cheaper to exercise, since it involves posting the performancebond for a futures contract rather than paying the full price of the underlying asset. Also, while themarket supply of an asset can be limited, which may make delivery of the asset difficult upon exercise,there is a potentially unlimited supply of futures contracts available to fulfill the exercise of an optionon a futures contract.
Using Put and Call Options
Once you buy a put or a call, you have three choices of action.
A put option grants you the right to sell a futures contract at a specific price. For example, a Dec CMEMilk Class III 11.25 put is an option that grants you the right to sell a Dec CME Milk Class III futurescontract at $11.25 (the strike price). Several puts are offered for the same futures contract, differingonly by the strike price. Another put available may be a Dec CME Milk Class III 11.00 put, which givesyou the right to sell a Dec CME Milk Class III futures contract at $11.00. The 11.00 put would have alower premium than the 11.25 put.
You buy put options to lock in a minimum floor price for the sale of your commodity. Unlike hedgingwith futures, you can benefit if prices rise. This is how it works. As the buyer of an option, you havethree choices:
Delivery/Exercise
Timing
Cash Flows
Supply of Underlying
Options on Futures
Buyer receives long (call) or short(put) futures position; seller takesshort (call) or long (put) futures
Underlying futures position expiresapproximately when optionmatures
Option owner and seller postperformance bond; both positionsmarked to market
Supply of futures contractsvirtually unlimited
Options on Actuals
Buyer receives asset from seller
Underlying asset does not expire
Option owner pays (call) or receives(put) full value of strike price
Limited supply of asset available fordelivery
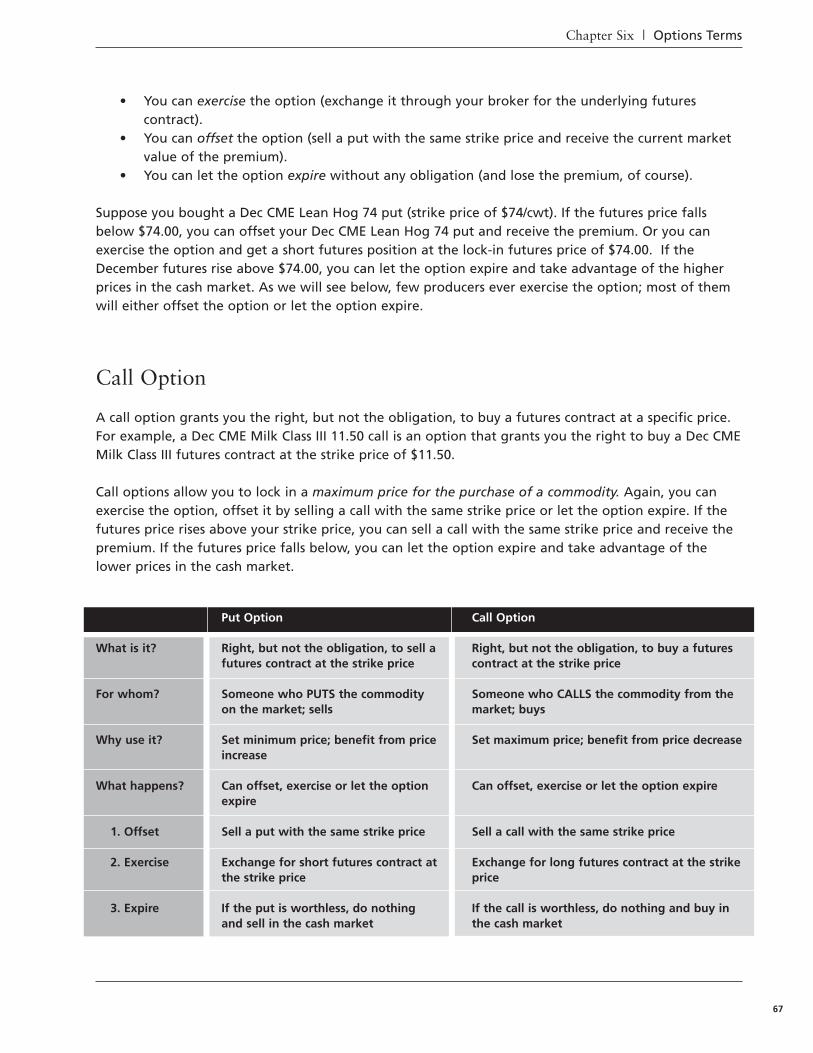
Chapter Six | Options Terms
67
• You can exercise the option (exchange it through your broker for the underlying futurescontract).
• You can offset the option (sell a put with the same strike price and receive the current marketvalue of the premium).
• You can let the option expire without any obligation (and lose the premium, of course).
Suppose you bought a Dec CME Lean Hog 74 put (strike price of $74/cwt). If the futures price fallsbelow $74.00, you can offset your Dec CME Lean Hog 74 put and receive the premium. Or you canexercise the option and get a short futures position at the lock-in futures price of $74.00. If theDecember futures rise above $74.00, you can let the option expire and take advantage of the higherprices in the cash market. As we will see below, few producers ever exercise the option; most of themwill either offset the option or let the option expire.
Call Option
A call option grants you the right, but not the obligation, to buy a futures contract at a specific price.For example, a Dec CME Milk Class III 11.50 call is an option that grants you the right to buy a Dec CMEMilk Class III futures contract at the strike price of $11.50.
Call options allow you to lock in a maximum price for the purchase of a commodity. Again, you canexercise the option, offset it by selling a call with the same strike price or let the option expire. If thefutures price rises above your strike price, you can sell a call with the same strike price and receive thepremium. If the futures price falls below, you can let the option expire and take advantage of thelower prices in the cash market.
What is it?
For whom?
Why use it?
What happens?
1. Offset
2. Exercise
3. Expire
Put Option
Right, but not the obligation, to sell afutures contract at the strike price
Someone who PUTS the commodityon the market; sells
Set minimum price; benefit from priceincrease
Can offset, exercise or let the optionexpire
Sell a put with the same strike price
Exchange for short futures contract atthe strike price
If the put is worthless, do nothingand sell in the cash market
Call Option
Right, but not the obligation, to buy a futurescontract at the strike price
Someone who CALLS the commodity from themarket; buys
Set maximum price; benefit from price decrease
Can offset, exercise or let the option expire
Sell a call with the same strike price
Exchange for long futures contract at the strikeprice
If the call is worthless, do nothing and buy inthe cash market
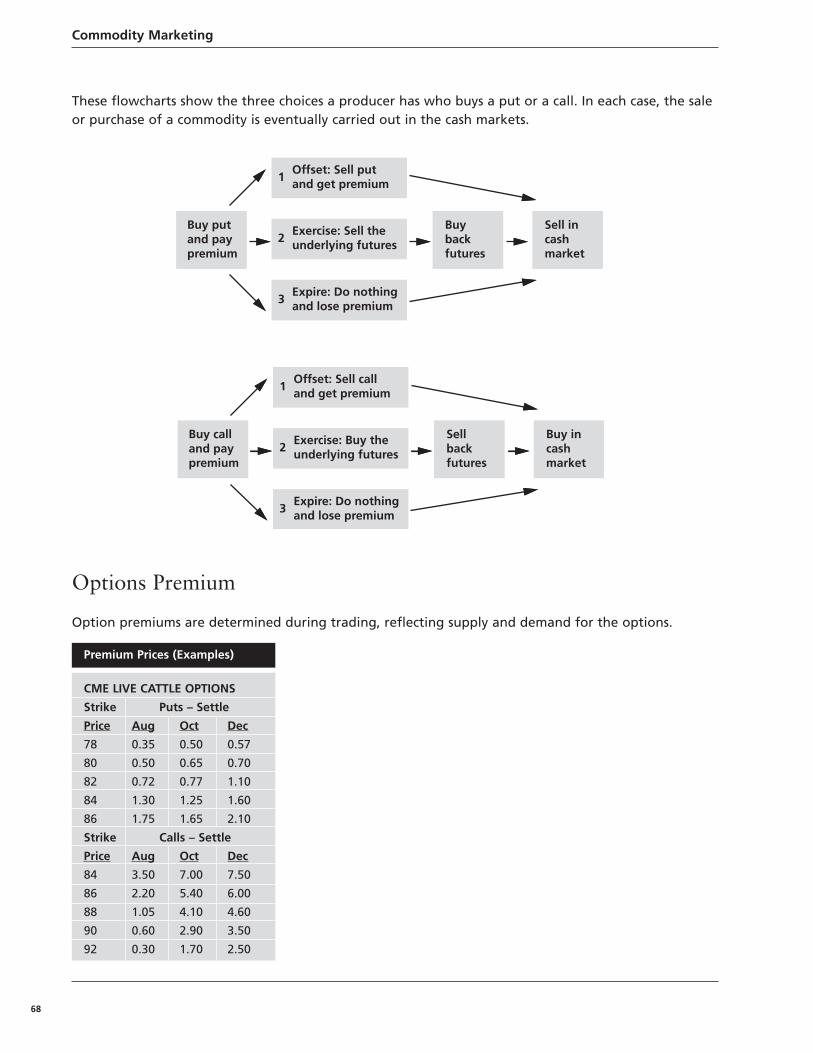
Commodity Marketing
68
These flowcharts show the three choices a producer has who buys a put or a call. In each case, the saleor purchase of a commodity is eventually carried out in the cash markets.
Options Premium
Option premiums are determined during trading, reflecting supply and demand for the options.
Premium Prices (Examples)
CME LIVE CATTLE OPTIONS
Strike Puts – Settle
Price Aug Oct Dec
78 0.35 0.50 0.57
80 0.50 0.65 0.70
82 0.72 0.77 1.10
84 1.30 1.25 1.60
86 1.75 1.65 2.10
Strike Calls – Settle
Price Aug Oct Dec
84 3.50 7.00 7.50
86 2.20 5.40 6.00
88 1.05 4.10 4.60
90 0.60 2.90 3.50
92 0.30 1.70 2.50
Offset: Sell calland get premium1
Exercise: Buy theunderlying futures2
Expire: Do nothingand lose premium3
Buy calland paypremium
Sell back futures
Buy incash market
Offset: Sell putand get premium1
Exercise: Sell theunderlying futures2
Expire: Do nothingand lose premium3
Buy putand paypremium
Buy back futures
Sell incash market
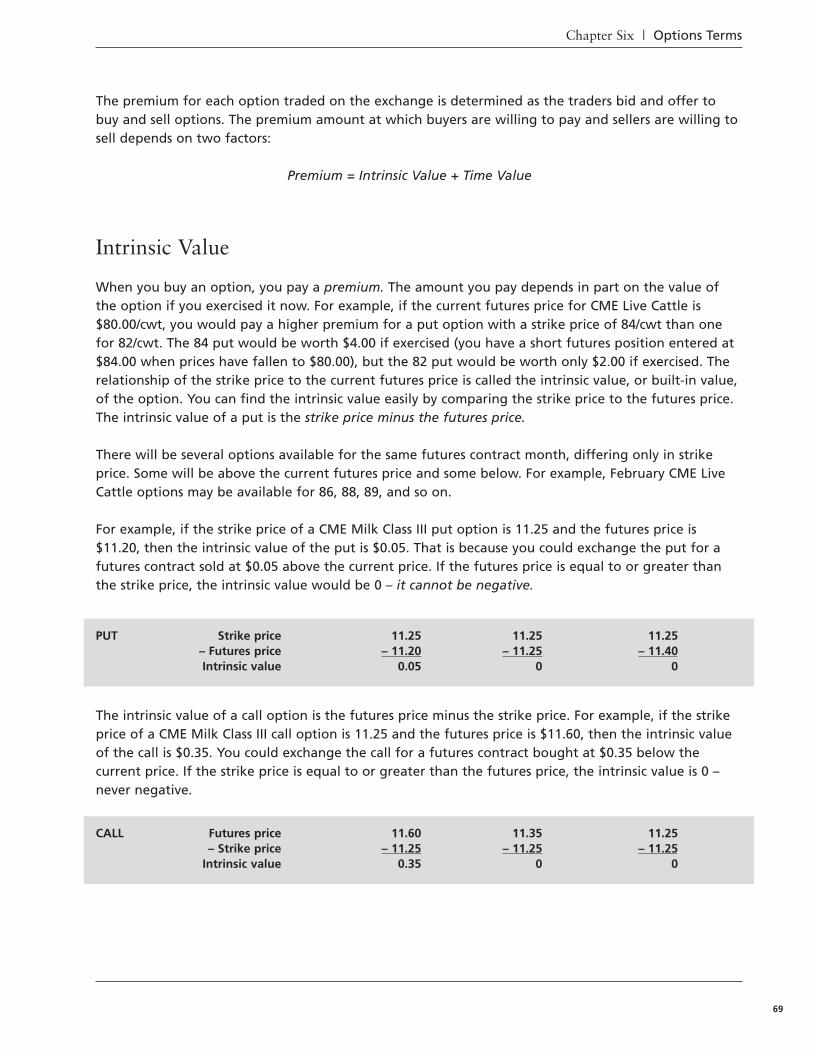
Chapter Six | Options Terms
69
The premium for each option traded on the exchange is determined as the traders bid and offer tobuy and sell options. The premium amount at which buyers are willing to pay and sellers are willing tosell depends on two factors:
Premium = Intrinsic Value + Time Value
Intrinsic Value
When you buy an option, you pay a premium. The amount you pay depends in part on the value ofthe option if you exercised it now. For example, if the current futures price for CME Live Cattle is$80.00/cwt, you would pay a higher premium for a put option with a strike price of 84/cwt than onefor 82/cwt. The 84 put would be worth $4.00 if exercised (you have a short futures position entered at$84.00 when prices have fallen to $80.00), but the 82 put would be worth only $2.00 if exercised. Therelationship of the strike price to the current futures price is called the intrinsic value, or built-in value,of the option. You can find the intrinsic value easily by comparing the strike price to the futures price.The intrinsic value of a put is the strike price minus the futures price.
There will be several options available for the same futures contract month, differing only in strikeprice. Some will be above the current futures price and some below. For example, February CME LiveCattle options may be available for 86, 88, 89, and so on.
For example, if the strike price of a CME Milk Class III put option is 11.25 and the futures price is$11.20, then the intrinsic value of the put is $0.05. That is because you could exchange the put for afutures contract sold at $0.05 above the current price. If the futures price is equal to or greater thanthe strike price, the intrinsic value would be 0 – it cannot be negative.
The intrinsic value of a call option is the futures price minus the strike price. For example, if the strikeprice of a CME Milk Class III call option is 11.25 and the futures price is $11.60, then the intrinsic valueof the call is $0.35. You could exchange the call for a futures contract bought at $0.35 below thecurrent price. If the strike price is equal to or greater than the futures price, the intrinsic value is 0 –never negative.
PUT Strike price 11.25 11.25 11.25– Futures price – 11.20 – 11.25 – 11.40Intrinsic value 0.05 0 0
CALL Futures price 11.60 11.35 11.25– Strike price – 11.25 – 11.25 – 11.25
Intrinsic value 0.35 0 0
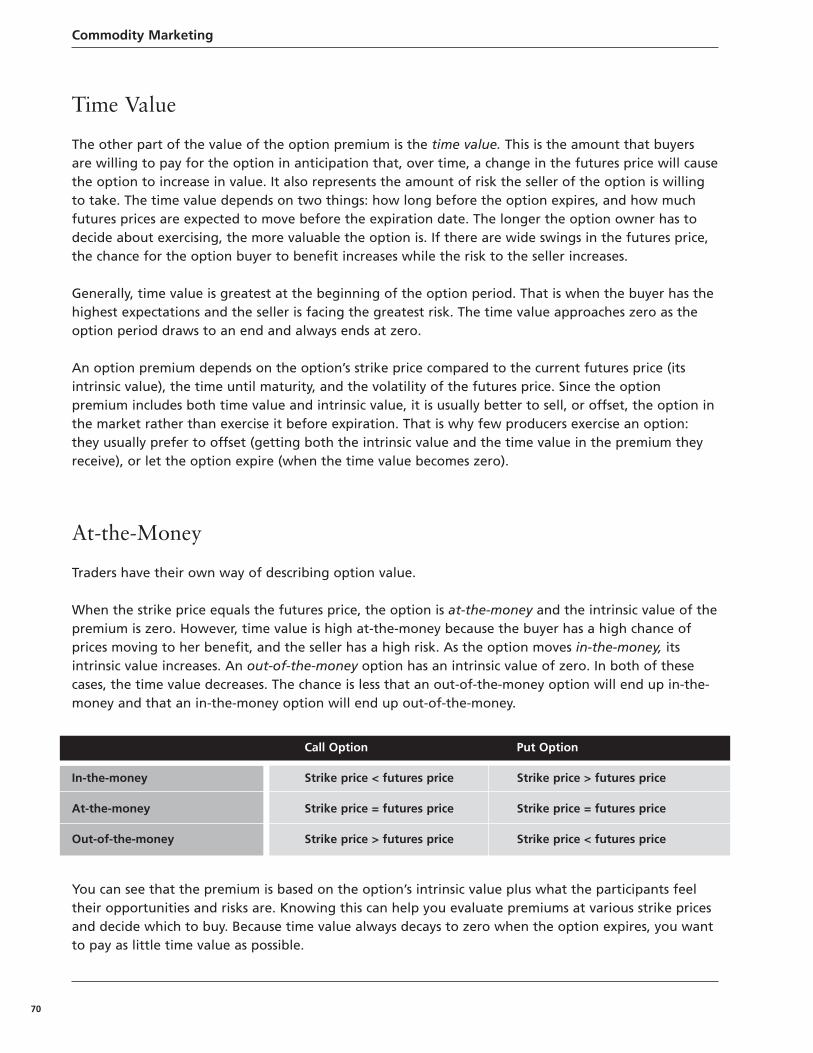
Commodity Marketing
70
Time Value
The other part of the value of the option premium is the time value. This is the amount that buyersare willing to pay for the option in anticipation that, over time, a change in the futures price will causethe option to increase in value. It also represents the amount of risk the seller of the option is willingto take. The time value depends on two things: how long before the option expires, and how muchfutures prices are expected to move before the expiration date. The longer the option owner has todecide about exercising, the more valuable the option is. If there are wide swings in the futures price,the chance for the option buyer to benefit increases while the risk to the seller increases.
Generally, time value is greatest at the beginning of the option period. That is when the buyer has thehighest expectations and the seller is facing the greatest risk. The time value approaches zero as theoption period draws to an end and always ends at zero.
An option premium depends on the option’s strike price compared to the current futures price (itsintrinsic value), the time until maturity, and the volatility of the futures price. Since the optionpremium includes both time value and intrinsic value, it is usually better to sell, or offset, the option inthe market rather than exercise it before expiration. That is why few producers exercise an option:they usually prefer to offset (getting both the intrinsic value and the time value in the premium theyreceive), or let the option expire (when the time value becomes zero).
At-the-Money
Traders have their own way of describing option value.
When the strike price equals the futures price, the option is at-the-money and the intrinsic value of thepremium is zero. However, time value is high at-the-money because the buyer has a high chance ofprices moving to her benefit, and the seller has a high risk. As the option moves in-the-money, itsintrinsic value increases. An out-of-the-money option has an intrinsic value of zero. In both of thesecases, the time value decreases. The chance is less that an out-of-the-money option will end up in-the-money and that an in-the-money option will end up out-of-the-money.
You can see that the premium is based on the option’s intrinsic value plus what the participants feeltheir opportunities and risks are. Knowing this can help you evaluate premiums at various strike pricesand decide which to buy. Because time value always decays to zero when the option expires, you wantto pay as little time value as possible.
Call Option Put Option
In-the-money Strike price < futures price Strike price > futures price
At-the-money Strike price = futures price Strike price = futures price
Out-of-the-money Strike price > futures price Strike price < futures price
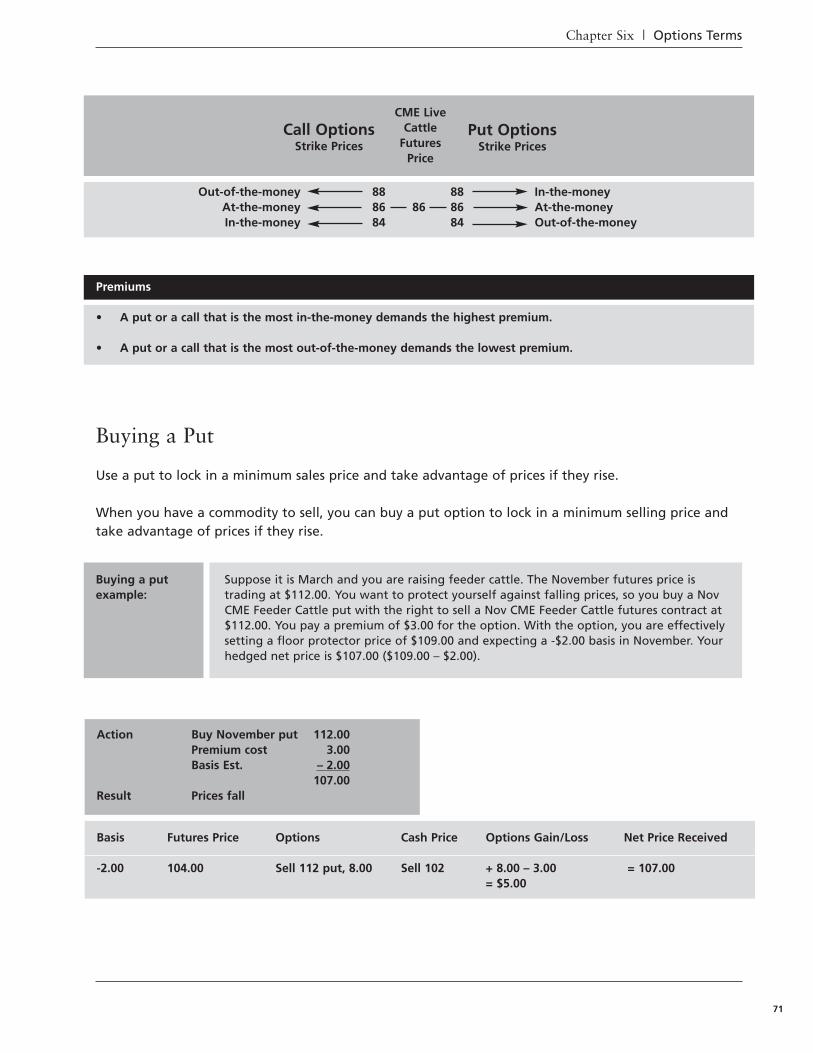
Chapter Six | Options Terms
71
Buying a Put
Use a put to lock in a minimum sales price and take advantage of prices if they rise.
When you have a commodity to sell, you can buy a put option to lock in a minimum selling price andtake advantage of prices if they rise.
Premiums
• A put or a call that is the most in-the-money demands the highest premium.
• A put or a call that is the most out-of-the-money demands the lowest premium.
Out-of-the-money 88 88 In-the-moneyAt-the-money 86 86 86 At-the-moneyIn-the-money 84 84 Out-of-the-money
Buying a putexample:
Suppose it is March and you are raising feeder cattle. The November futures price istrading at $112.00. You want to protect yourself against falling prices, so you buy a NovCME Feeder Cattle put with the right to sell a Nov CME Feeder Cattle futures contract at$112.00. You pay a premium of $3.00 for the option. With the option, you are effectivelysetting a floor protector price of $109.00 and expecting a -$2.00 basis in November. Yourhedged net price is $107.00 ($109.00 – $2.00).
Basis Futures Price Options Cash Price Options Gain/Loss Net Price Received
-2.00 104.00 Sell 112 put, 8.00 Sell 102 + 8.00 – 3.00 = 107.00= $5.00
Action Buy November put 112.00Premium cost 3.00Basis Est. – 2.00
107.00Result Prices fall
Call Options Strike Prices
Put Options Strike Prices
CME LiveCattle
FuturesPrice
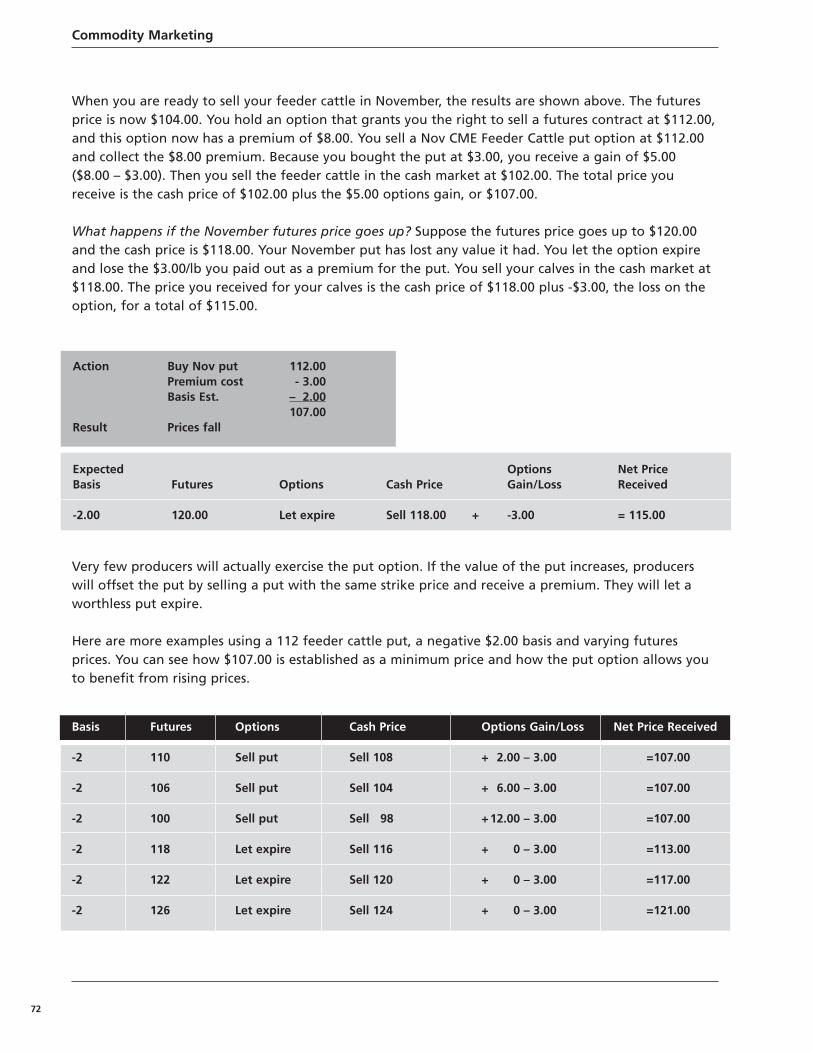
Commodity Marketing
72
When you are ready to sell your feeder cattle in November, the results are shown above. The futuresprice is now $104.00. You hold an option that grants you the right to sell a futures contract at $112.00,and this option now has a premium of $8.00. You sell a Nov CME Feeder Cattle put option at $112.00and collect the $8.00 premium. Because you bought the put at $3.00, you receive a gain of $5.00 ($8.00 – $3.00). Then you sell the feeder cattle in the cash market at $102.00. The total price youreceive is the cash price of $102.00 plus the $5.00 options gain, or $107.00.
What happens if the November futures price goes up? Suppose the futures price goes up to $120.00and the cash price is $118.00. Your November put has lost any value it had. You let the option expireand lose the $3.00/lb you paid out as a premium for the put. You sell your calves in the cash market at$118.00. The price you received for your calves is the cash price of $118.00 plus -$3.00, the loss on theoption, for a total of $115.00.
Very few producers will actually exercise the put option. If the value of the put increases, producerswill offset the put by selling a put with the same strike price and receive a premium. They will let aworthless put expire.
Here are more examples using a 112 feeder cattle put, a negative $2.00 basis and varying futuresprices. You can see how $107.00 is established as a minimum price and how the put option allows youto benefit from rising prices.
Expected Options Net PriceBasis Futures Options Cash Price Gain/Loss Received
-2.00 120.00 Let expire Sell 118.00 + -3.00 = 115.00
Action Buy Nov put 112.00Premium cost - 3.00Basis Est. – 2.00
107.00Result Prices fall
Basis Futures Options Cash Price Options Gain/Loss Net Price Received
-2 110 Sell put Sell 108 + 2.00 – 3.00 =107.00
-2 106 Sell put Sell 104 + 6.00 – 3.00 =107.00
-2 100 Sell put Sell 98 +12.00 – 3.00 =107.00
-2 118 Let expire Sell 116 + 0 – 3.00 =113.00
-2 122 Let expire Sell 120 + 0 – 3.00 =117.00
-2 126 Let expire Sell 124 + 0 – 3.00 =121.00
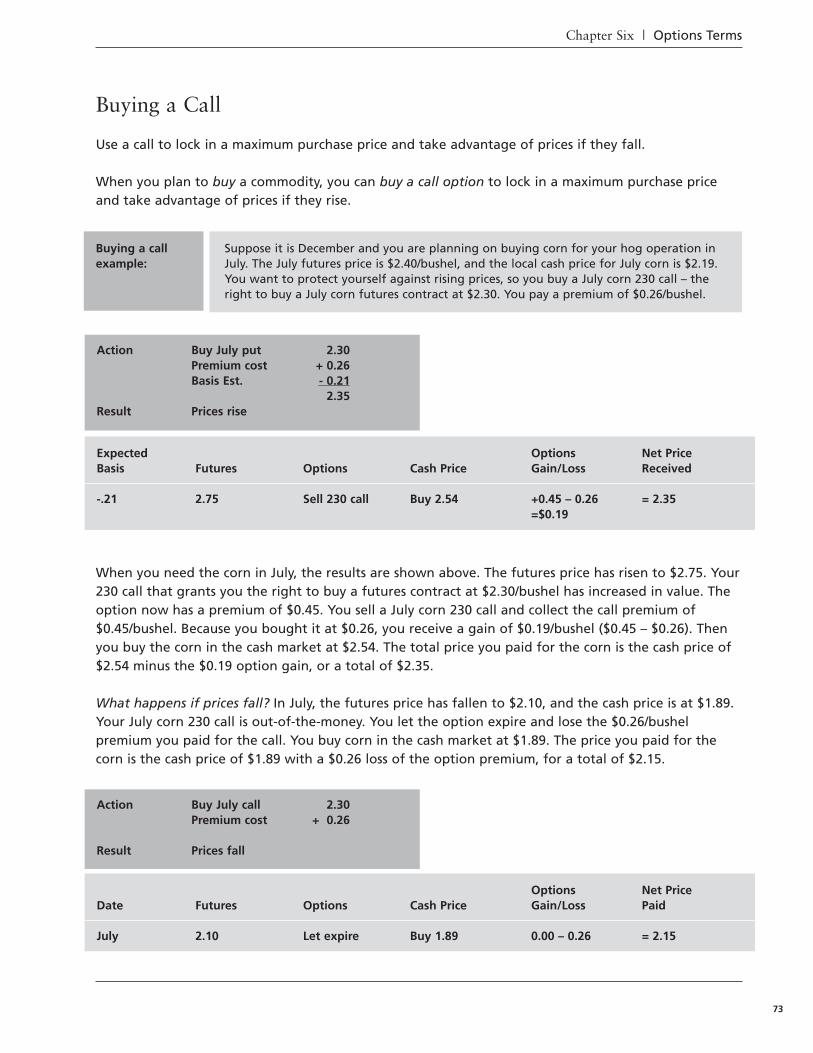
Chapter Six | Options Terms
73
Buying a Call
Use a call to lock in a maximum purchase price and take advantage of prices if they fall.
When you plan to buy a commodity, you can buy a call option to lock in a maximum purchase priceand take advantage of prices if they rise.
When you need the corn in July, the results are shown above. The futures price has risen to $2.75. Your230 call that grants you the right to buy a futures contract at $2.30/bushel has increased in value. Theoption now has a premium of $0.45. You sell a July corn 230 call and collect the call premium of$0.45/bushel. Because you bought it at $0.26, you receive a gain of $0.19/bushel ($0.45 – $0.26). Thenyou buy the corn in the cash market at $2.54. The total price you paid for the corn is the cash price of$2.54 minus the $0.19 option gain, or a total of $2.35.
What happens if prices fall? In July, the futures price has fallen to $2.10, and the cash price is at $1.89.Your July corn 230 call is out-of-the-money. You let the option expire and lose the $0.26/bushelpremium you paid for the call. You buy corn in the cash market at $1.89. The price you paid for thecorn is the cash price of $1.89 with a $0.26 loss of the option premium, for a total of $2.15.
Options Net PriceDate Futures Options Cash Price Gain/Loss Paid
July 2.10 Let expire Buy 1.89 0.00 – 0.26 = 2.15
Action Buy July call 2.30Premium cost + 0.26
Result Prices fall
Expected Options Net PriceBasis Futures Options Cash Price Gain/Loss Received
-.21 2.75 Sell 230 call Buy 2.54 +0.45 – 0.26 = 2.35=$0.19
Action Buy July put 2.30Premium cost + 0.26Basis Est. - 0.21
2.35Result Prices rise
Buying a callexample:
Suppose it is December and you are planning on buying corn for your hog operation inJuly. The July futures price is $2.40/bushel, and the local cash price for July corn is $2.19.You want to protect yourself against rising prices, so you buy a July corn 230 call – theright to buy a July corn futures contract at $2.30. You pay a premium of $0.26/bushel.
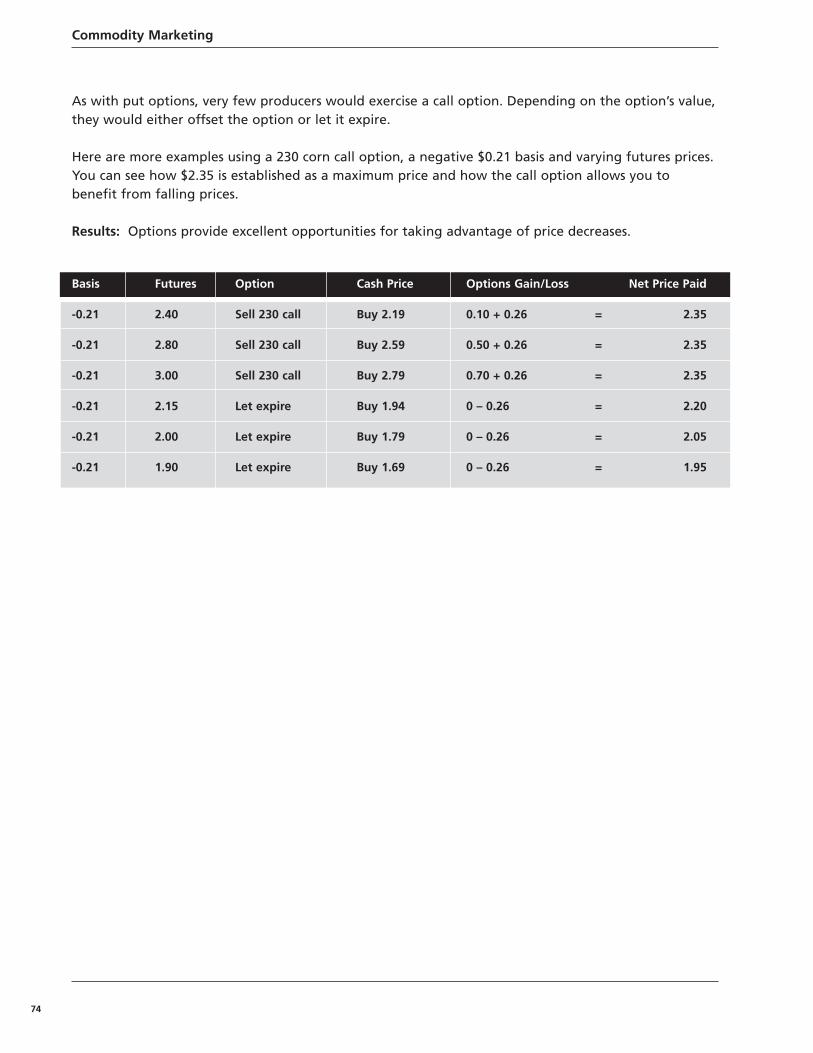
Commodity Marketing
74
As with put options, very few producers would exercise a call option. Depending on the option’s value,they would either offset the option or let it expire.
Here are more examples using a 230 corn call option, a negative $0.21 basis and varying futures prices.You can see how $2.35 is established as a maximum price and how the call option allows you tobenefit from falling prices.
Results: Options provide excellent opportunities for taking advantage of price decreases.
Basis Futures Option Cash Price Options Gain/Loss Net Price Paid
-0.21 2.40 Sell 230 call Buy 2.19 0.10 + 0.26 = 2.35
-0.21 2.80 Sell 230 call Buy 2.59 0.50 + 0.26 = 2.35
-0.21 3.00 Sell 230 call Buy 2.79 0.70 + 0.26 = 2.35
-0.21 2.15 Let expire Buy 1.94 0 – 0.26 = 2.20
-0.21 2.00 Let expire Buy 1.79 0 – 0.26 = 2.05
-0.21 1.90 Let expire Buy 1.69 0 – 0.26 = 1.95
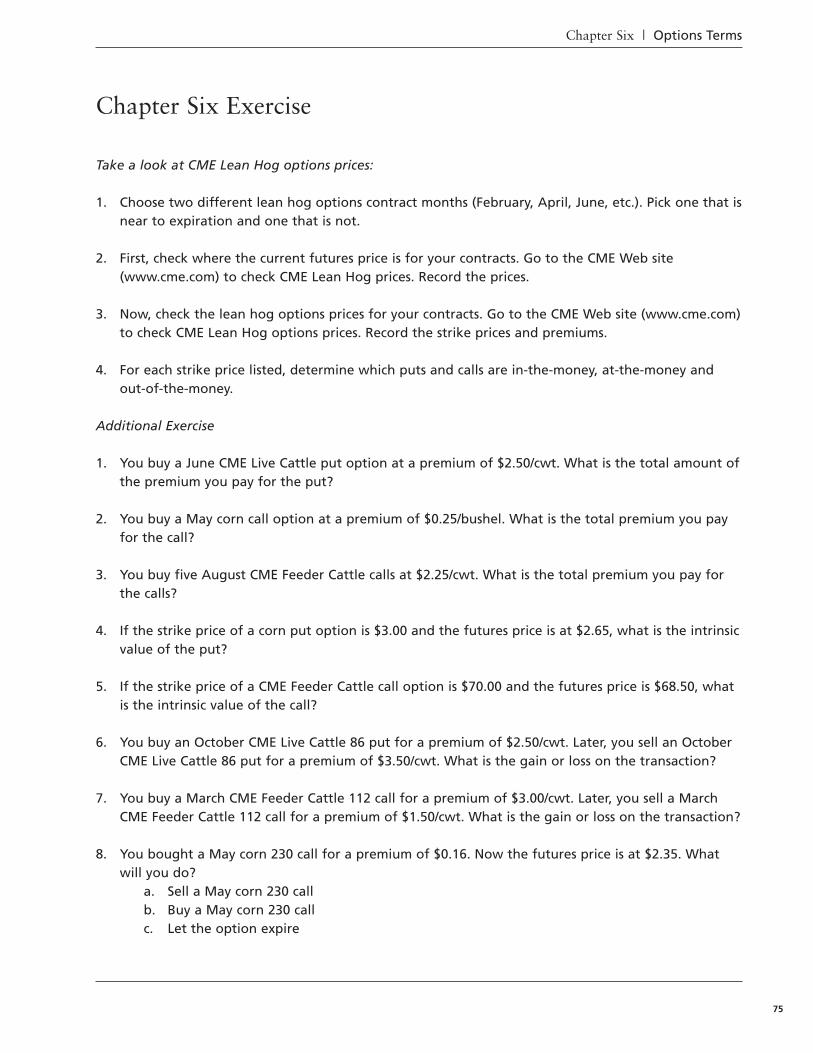
Chapter Six | Options Terms
75
Chapter Six Exercise
Take a look at CME Lean Hog options prices:
1. Choose two different lean hog options contract months (February, April, June, etc.). Pick one that isnear to expiration and one that is not.
2. First, check where the current futures price is for your contracts. Go to the CME Web site(www.cme.com) to check CME Lean Hog prices. Record the prices.
3. Now, check the lean hog options prices for your contracts. Go to the CME Web site (www.cme.com)to check CME Lean Hog options prices. Record the strike prices and premiums.
4. For each strike price listed, determine which puts and calls are in-the-money, at-the-money andout-of-the-money.
Additional Exercise
1. You buy a June CME Live Cattle put option at a premium of $2.50/cwt. What is the total amount ofthe premium you pay for the put?
2. You buy a May corn call option at a premium of $0.25/bushel. What is the total premium you payfor the call?
3. You buy five August CME Feeder Cattle calls at $2.25/cwt. What is the total premium you pay forthe calls?
4. If the strike price of a corn put option is $3.00 and the futures price is at $2.65, what is the intrinsicvalue of the put?
5. If the strike price of a CME Feeder Cattle call option is $70.00 and the futures price is $68.50, whatis the intrinsic value of the call?
6. You buy an October CME Live Cattle 86 put for a premium of $2.50/cwt. Later, you sell an OctoberCME Live Cattle 86 put for a premium of $3.50/cwt. What is the gain or loss on the transaction?
7. You buy a March CME Feeder Cattle 112 call for a premium of $3.00/cwt. Later, you sell a MarchCME Feeder Cattle 112 call for a premium of $1.50/cwt. What is the gain or loss on the transaction?
8. You bought a May corn 230 call for a premium of $0.16. Now the futures price is at $2.35. Whatwill you do?
a. Sell a May corn 230 callb. Buy a May corn 230 callc. Let the option expire

Commodity Marketing
76
Chapter Seven | Options Strategies
77
Options Costs and Hedging
There are costs associated with buying options.
The options strategies presented in this chapter include the practical financial aspects of using optionssuch as:
• Premium costs• Broker commissions
As a buyer of a put option or a call option, a producer will pay a premium for an option up front; theseller of the option receives the premium. For example, a premium for a current live cattle put optionmay be $0.80/cwt, or a total of $320.00 per option ($0.80 x 400 cwt per option). A producer buying thislive cattle put pays the premium of $320.00 at the time of purchase. The seller of the put is creditedwith $320.00.
Buyers of the live cattle put know their risk. They paid $320 for protecting a minimum sales price. Ifthe option is worthless at the time they are ready to sell their live cattle, they will let the option expireand lose the premium. If the value of the option is above zero, they can offset their position by sellinga put with the same strike price and perhaps earn a profit on the premium. Unlike with a futurescontract, put buyers do not have to make a performance bond deposit or face performance bond callswhile they hold the option.
Chapter 7Options Strategies
Chapter Seven Objectives
• To understand the difference between hedging with options and hedging with futures• To learn how to use put options to protect a delivery price• To learn how to use put options to protect the price of a stored crop• To learn how to use call options to protect a purchase price• To experience buying put options to lock in a selling price for live cattle• To understand the options hedge ratio and how it applies to an option strategy
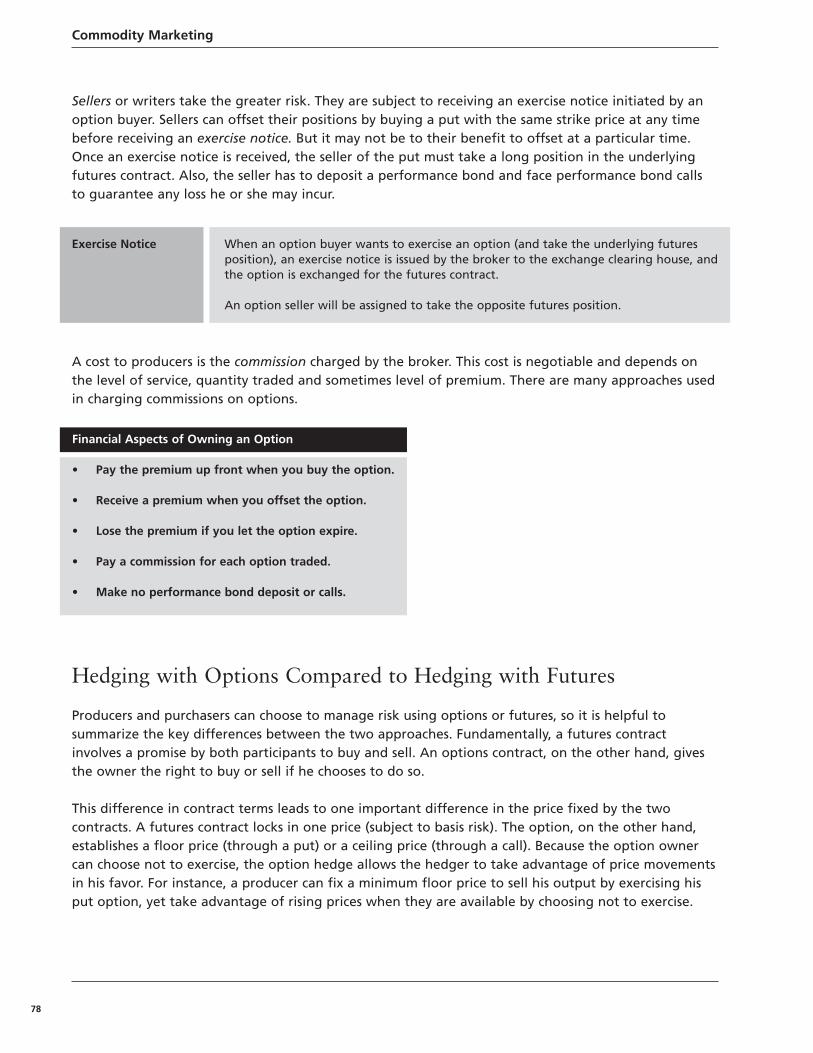
Commodity Marketing
78
Sellers or writers take the greater risk. They are subject to receiving an exercise notice initiated by anoption buyer. Sellers can offset their positions by buying a put with the same strike price at any timebefore receiving an exercise notice. But it may not be to their benefit to offset at a particular time.Once an exercise notice is received, the seller of the put must take a long position in the underlyingfutures contract. Also, the seller has to deposit a performance bond and face performance bond callsto guarantee any loss he or she may incur.
A cost to producers is the commission charged by the broker. This cost is negotiable and depends onthe level of service, quantity traded and sometimes level of premium. There are many approaches usedin charging commissions on options.
Hedging with Options Compared to Hedging with Futures
Producers and purchasers can choose to manage risk using options or futures, so it is helpful tosummarize the key differences between the two approaches. Fundamentally, a futures contractinvolves a promise by both participants to buy and sell. An options contract, on the other hand, givesthe owner the right to buy or sell if he chooses to do so.
This difference in contract terms leads to one important difference in the price fixed by the twocontracts. A futures contract locks in one price (subject to basis risk). The option, on the other hand,establishes a floor price (through a put) or a ceiling price (through a call). Because the option ownercan choose not to exercise, the option hedge allows the hedger to take advantage of price movementsin his favor. For instance, a producer can fix a minimum floor price to sell his output by exercising hisput option, yet take advantage of rising prices when they are available by choosing not to exercise.
Exercise Notice When an option buyer wants to exercise an option (and take the underlying futuresposition), an exercise notice is issued by the broker to the exchange clearing house, andthe option is exchanged for the futures contract.
An option seller will be assigned to take the opposite futures position.
Financial Aspects of Owning an Option
• Pay the premium up front when you buy the option.
• Receive a premium when you offset the option.
• Lose the premium if you let the option expire.
• Pay a commission for each option traded.
• Make no performance bond deposit or calls.
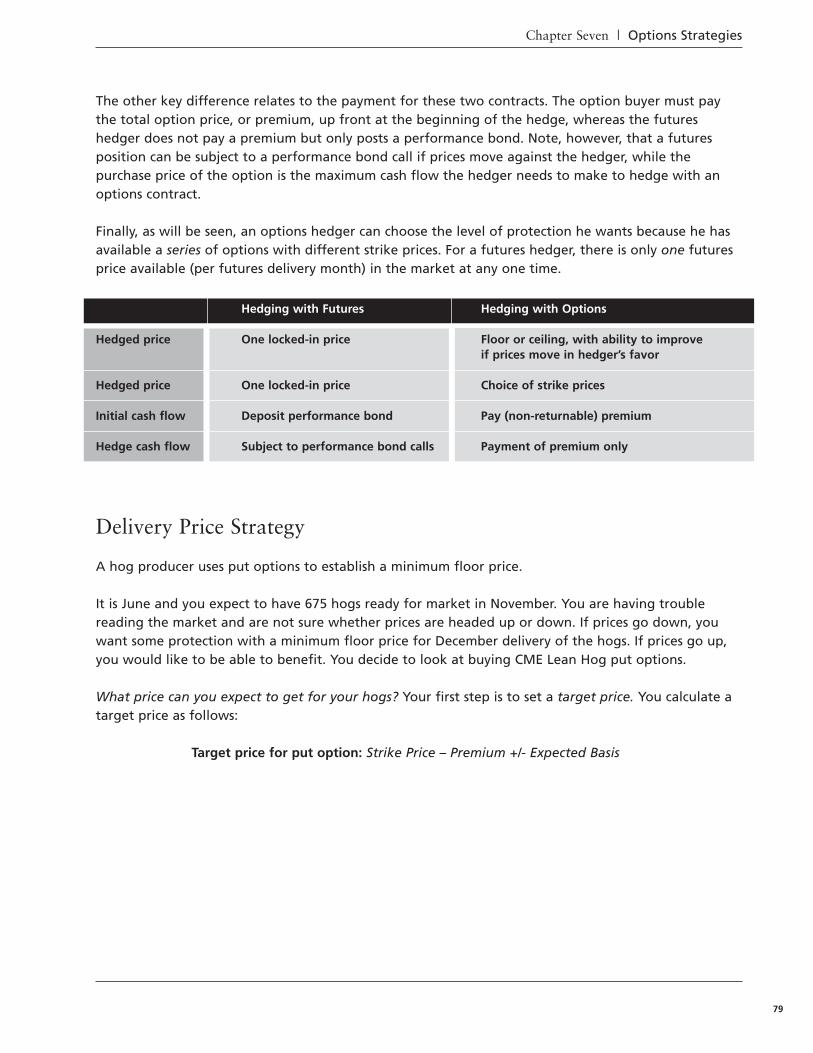
Chapter Seven | Options Strategies
79
The other key difference relates to the payment for these two contracts. The option buyer must paythe total option price, or premium, up front at the beginning of the hedge, whereas the futureshedger does not pay a premium but only posts a performance bond. Note, however, that a futuresposition can be subject to a performance bond call if prices move against the hedger, while thepurchase price of the option is the maximum cash flow the hedger needs to make to hedge with anoptions contract.
Finally, as will be seen, an options hedger can choose the level of protection he wants because he hasavailable a series of options with different strike prices. For a futures hedger, there is only one futuresprice available (per futures delivery month) in the market at any one time.
Delivery Price Strategy
A hog producer uses put options to establish a minimum floor price.
It is June and you expect to have 675 hogs ready for market in November. You are having troublereading the market and are not sure whether prices are headed up or down. If prices go down, youwant some protection with a minimum floor price for December delivery of the hogs. If prices go up,you would like to be able to benefit. You decide to look at buying CME Lean Hog put options.
What price can you expect to get for your hogs? Your first step is to set a target price. You calculate atarget price as follows:
Target price for put option: Strike Price – Premium +/- Expected Basis
Hedging with Futures Hedging with Options
Hedged price One locked-in price Floor or ceiling, with ability to improve if prices move in hedger’s favor
Hedged price One locked-in price Choice of strike prices
Initial cash flow Deposit performance bond Pay (non-returnable) premium
Hedge cash flow Subject to performance bond calls Payment of premium only
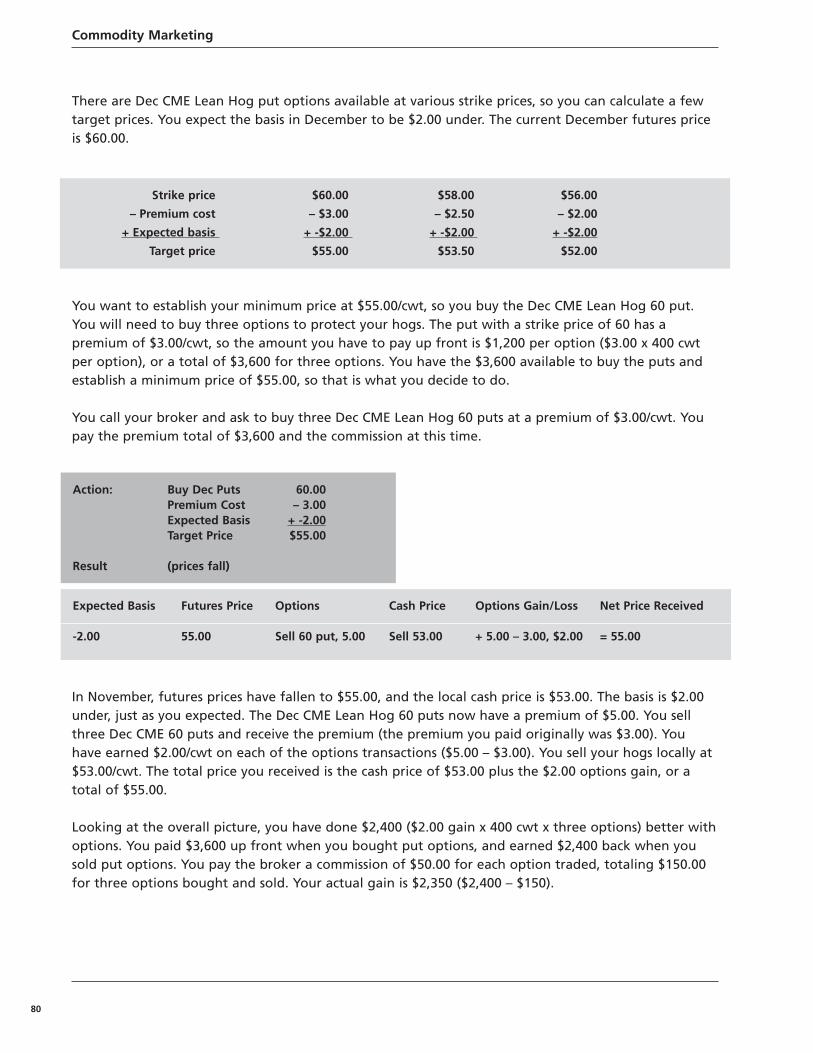
Commodity Marketing
80
There are Dec CME Lean Hog put options available at various strike prices, so you can calculate a fewtarget prices. You expect the basis in December to be $2.00 under. The current December futures priceis $60.00.
You want to establish your minimum price at $55.00/cwt, so you buy the Dec CME Lean Hog 60 put.You will need to buy three options to protect your hogs. The put with a strike price of 60 has apremium of $3.00/cwt, so the amount you have to pay up front is $1,200 per option ($3.00 x 400 cwtper option), or a total of $3,600 for three options. You have the $3,600 available to buy the puts andestablish a minimum price of $55.00, so that is what you decide to do.
You call your broker and ask to buy three Dec CME Lean Hog 60 puts at a premium of $3.00/cwt. Youpay the premium total of $3,600 and the commission at this time.
In November, futures prices have fallen to $55.00, and the local cash price is $53.00. The basis is $2.00under, just as you expected. The Dec CME Lean Hog 60 puts now have a premium of $5.00. You sellthree Dec CME 60 puts and receive the premium (the premium you paid originally was $3.00). Youhave earned $2.00/cwt on each of the options transactions ($5.00 – $3.00). You sell your hogs locally at$53.00/cwt. The total price you received is the cash price of $53.00 plus the $2.00 options gain, or atotal of $55.00.
Looking at the overall picture, you have done $2,400 ($2.00 gain x 400 cwt x three options) better withoptions. You paid $3,600 up front when you bought put options, and earned $2,400 back when yousold put options. You pay the broker a commission of $50.00 for each option traded, totaling $150.00for three options bought and sold. Your actual gain is $2,350 ($2,400 – $150).
Strike price $60.00 $58.00 $56.00
– Premium cost – $3.00 – $2.50 – $2.00
+ Expected basis + -$2.00 + -$2.00 + -$2.00
Target price $55.00 $53.50 $52.00
Expected Basis Futures Price Options Cash Price Options Gain/Loss Net Price Received
-2.00 55.00 Sell 60 put, 5.00 Sell 53.00 + 5.00 – 3.00, $2.00 = 55.00
Action: Buy Dec Puts 60.00Premium Cost – 3.00Expected Basis + -2.00Target Price $55.00
Result (prices fall)
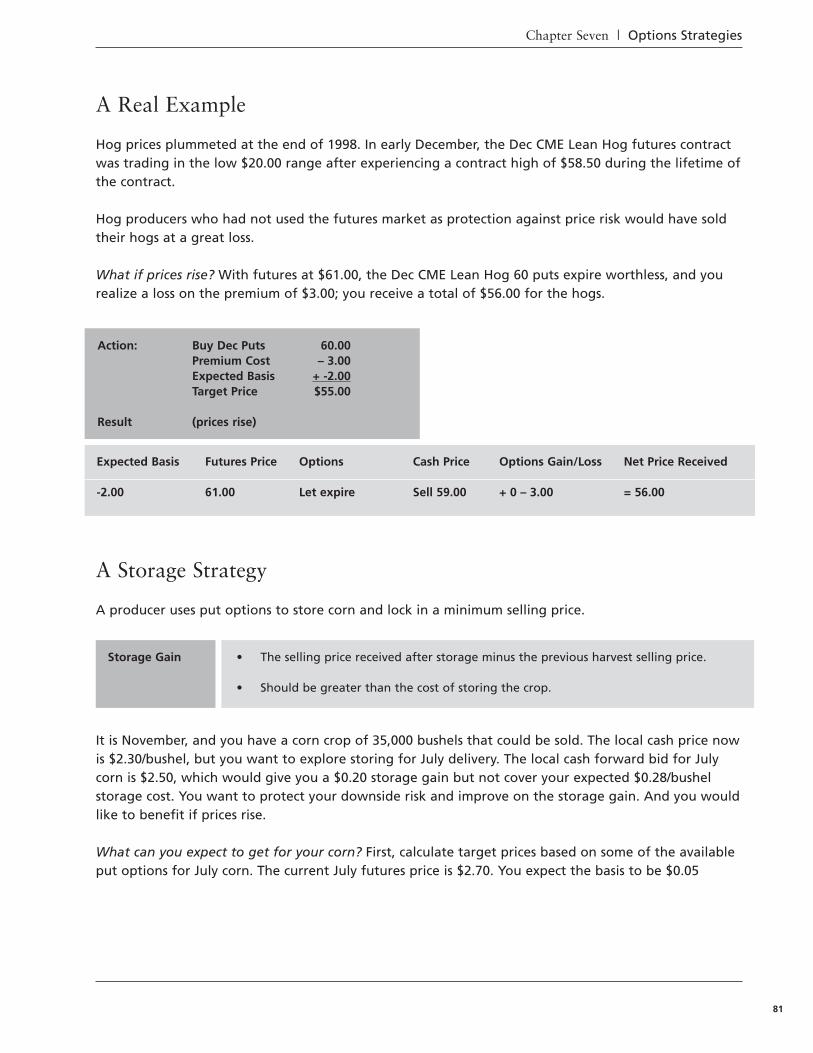
Chapter Seven | Options Strategies
81
A Real Example
Hog prices plummeted at the end of 1998. In early December, the Dec CME Lean Hog futures contractwas trading in the low $20.00 range after experiencing a contract high of $58.50 during the lifetime ofthe contract.
Hog producers who had not used the futures market as protection against price risk would have soldtheir hogs at a great loss.
What if prices rise? With futures at $61.00, the Dec CME Lean Hog 60 puts expire worthless, and yourealize a loss on the premium of $3.00; you receive a total of $56.00 for the hogs.
A Storage Strategy
A producer uses put options to store corn and lock in a minimum selling price.
It is November, and you have a corn crop of 35,000 bushels that could be sold. The local cash price nowis $2.30/bushel, but you want to explore storing for July delivery. The local cash forward bid for Julycorn is $2.50, which would give you a $0.20 storage gain but not cover your expected $0.28/bushelstorage cost. You want to protect your downside risk and improve on the storage gain. And you wouldlike to benefit if prices rise.
What can you expect to get for your corn? First, calculate target prices based on some of the availableput options for July corn. The current July futures price is $2.70. You expect the basis to be $0.05
Storage Gain • The selling price received after storage minus the previous harvest selling price.
• Should be greater than the cost of storing the crop.
Expected Basis Futures Price Options Cash Price Options Gain/Loss Net Price Received
-2.00 61.00 Let expire Sell 59.00 + 0 – 3.00 = 56.00
Action: Buy Dec Puts 60.00Premium Cost – 3.00Expected Basis + -2.00Target Price $55.00
Result (prices rise)
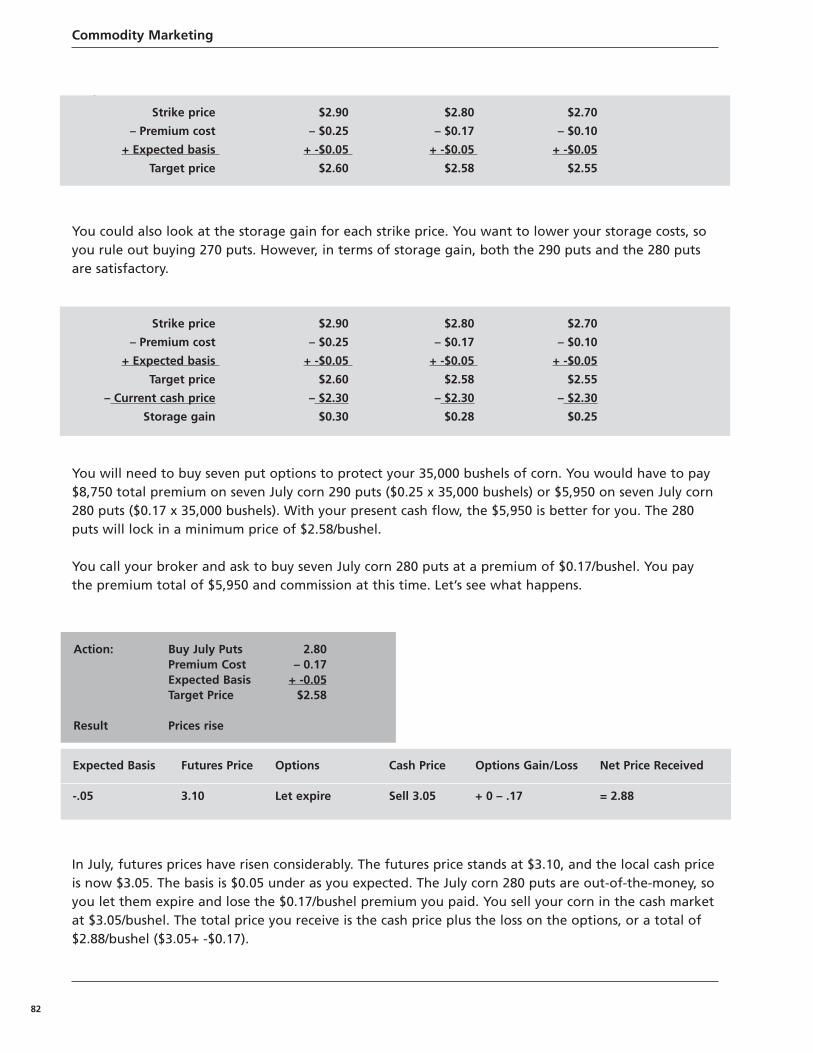
Commodity Marketing
82
under.
You could also look at the storage gain for each strike price. You want to lower your storage costs, soyou rule out buying 270 puts. However, in terms of storage gain, both the 290 puts and the 280 putsare satisfactory.
You will need to buy seven put options to protect your 35,000 bushels of corn. You would have to pay$8,750 total premium on seven July corn 290 puts ($0.25 x 35,000 bushels) or $5,950 on seven July corn280 puts ($0.17 x 35,000 bushels). With your present cash flow, the $5,950 is better for you. The 280puts will lock in a minimum price of $2.58/bushel.
You call your broker and ask to buy seven July corn 280 puts at a premium of $0.17/bushel. You paythe premium total of $5,950 and commission at this time. Let’s see what happens.
In July, futures prices have risen considerably. The futures price stands at $3.10, and the local cash priceis now $3.05. The basis is $0.05 under as you expected. The July corn 280 puts are out-of-the-money, soyou let them expire and lose the $0.17/bushel premium you paid. You sell your corn in the cash marketat $3.05/bushel. The total price you receive is the cash price plus the loss on the options, or a total of$2.88/bushel ($3.05+ -$0.17).
Strike price $2.90 $2.80 $2.70
– Premium cost – $0.25 – $0.17 – $0.10
+ Expected basis + -$0.05 + -$0.05 + -$0.05
Target price $2.60 $2.58 $2.55
Strike price $2.90 $2.80 $2.70
– Premium cost – $0.25 – $0.17 – $0.10
+ Expected basis + -$0.05 + -$0.05 + -$0.05
Target price $2.60 $2.58 $2.55
– Current cash price – $2.30 – $2.30 – $2.30
Storage gain $0.30 $0.28 $0.25
Expected Basis Futures Price Options Cash Price Options Gain/Loss Net Price Received
-.05 3.10 Let expire Sell 3.05 + 0 – .17 = 2.88
Action: Buy July Puts 2.80Premium Cost – 0.17Expected Basis + -0.05Target Price $2.58
Result Prices rise
Chapter Seven | Options Strategies
83
If you had not placed this storage hedge, you would have sold your corn in November at $2.30/bushel.By buying put options, you have made a storage gain of $0.58/bushel ($2.88-$2.30). Overall, you haveearned $20,300 ($0.58 x 35,000 bushels) more by storing the corn and buying options. Subtracting yourpremium cost of $5,950, commission cost of $350.00 ($50.00 per option x seven options), storage costsof $9,800 ($0.28/bushel storage cost x 35,000 bushels), the net gain is $4,200.
Calculating an Options Hedge Ratio
In the prior example, the producer needed seven options to hedge his 35,000 bushel corn crop (7contracts x 5,000 bu/contract = 35,000 bushels). The hedge position is based on the size, or units, of theposition to be hedged. A different approach that is used, particularly in short-term hedges (ones thatwill be lifted before contract maturity), is to consider price changes rather than physical units.Ultimately, it is the dollar value of the purchase or sale that the hedger is trying to protect.
If the hedger plans to close out his or her hedge before contract maturity and is looking for equaloption protection and a futures hedge, he or she may want to adjust the number of option contractsused as a hedge. Futures prices tend to move uniformly with the underlying cash position price: if thelive hog cash price changes by $0.10/cwt, the futures price will tend to change by $0.10 as well.Options prices, on the other hand, do not usually change as much as the underlying cash price. If thehog cash price changes by $0.10, generally the options price will change by roughly half that, or$0.05/cwt. The technical term for this relative price change is called the option’s delta. Here, thechange in the options price compared to the change in the cash price was one-half, or 0.50, so theoption’s delta is 0.50. The hedge in this case would need two options contracts (2 contracts x $0.05/cwtchange = $0.10) to hedge the loss in his cash position of ten cents. An option delta gives the short-term hedge ratio: the number of contracts is 2 (1/option delta, or 1/0.50).
The delta of an option, and thus the size of the options position needed to hedge dollar value, canchange over the option’s life. For instance, an at-the-money option will have a delta close to 0.50, butas the option moves into the money, the delta rises towards a value of one. The reason behind thisincrease is that, as the option becomes more likely to be exercised, its price movements will mimic theunderlying cash. Similarly, if the option moves very far out-of-the money, it is extremely unlikely that itwill be exercised, and its delta moves toward zero.
A Purchase Strategy
A feedlot operator uses call options to lock in a maximum purchase price.
As a purchaser of feeder cattle, you can buy call options to protect yourself against price increaseswhile leaving yourself open to profit from price decreases.
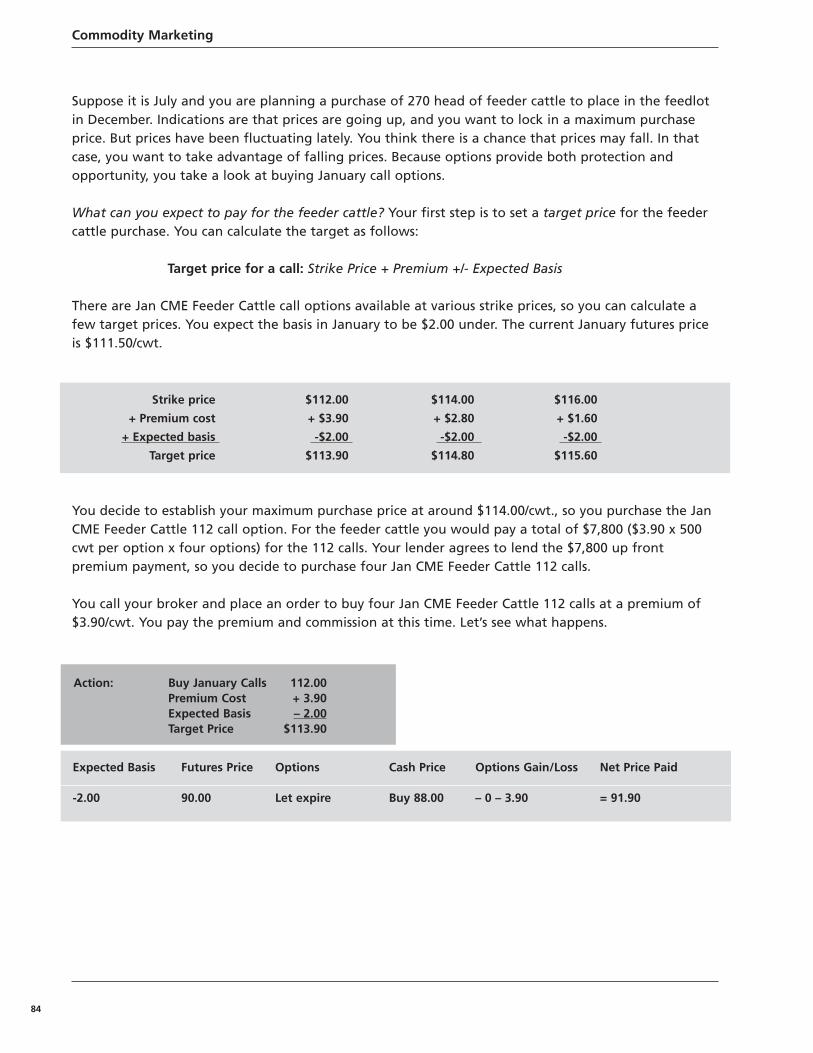
Commodity Marketing
84
Suppose it is July and you are planning a purchase of 270 head of feeder cattle to place in the feedlotin December. Indications are that prices are going up, and you want to lock in a maximum purchaseprice. But prices have been fluctuating lately. You think there is a chance that prices may fall. In thatcase, you want to take advantage of falling prices. Because options provide both protection andopportunity, you take a look at buying January call options.
What can you expect to pay for the feeder cattle? Your first step is to set a target price for the feedercattle purchase. You can calculate the target as follows:
Target price for a call: Strike Price + Premium +/- Expected Basis
There are Jan CME Feeder Cattle call options available at various strike prices, so you can calculate afew target prices. You expect the basis in January to be $2.00 under. The current January futures priceis $111.50/cwt.
You decide to establish your maximum purchase price at around $114.00/cwt., so you purchase the JanCME Feeder Cattle 112 call option. For the feeder cattle you would pay a total of $7,800 ($3.90 x 500cwt per option x four options) for the 112 calls. Your lender agrees to lend the $7,800 up frontpremium payment, so you decide to purchase four Jan CME Feeder Cattle 112 calls.
You call your broker and place an order to buy four Jan CME Feeder Cattle 112 calls at a premium of$3.90/cwt. You pay the premium and commission at this time. Let’s see what happens.
Strike price $112.00 $114.00 $116.00
+ Premium cost + $3.90 + $2.80 + $1.60
+ Expected basis -$2.00 -$2.00 -$2.00
Target price $113.90 $114.80 $115.60
Expected Basis Futures Price Options Cash Price Options Gain/Loss Net Price Paid
-2.00 90.00 Let expire Buy 88.00 – 0 – 3.90 = 91.90
Action: Buy January Calls 112.00Premium Cost + 3.90Expected Basis – 2.00Target Price $113.90
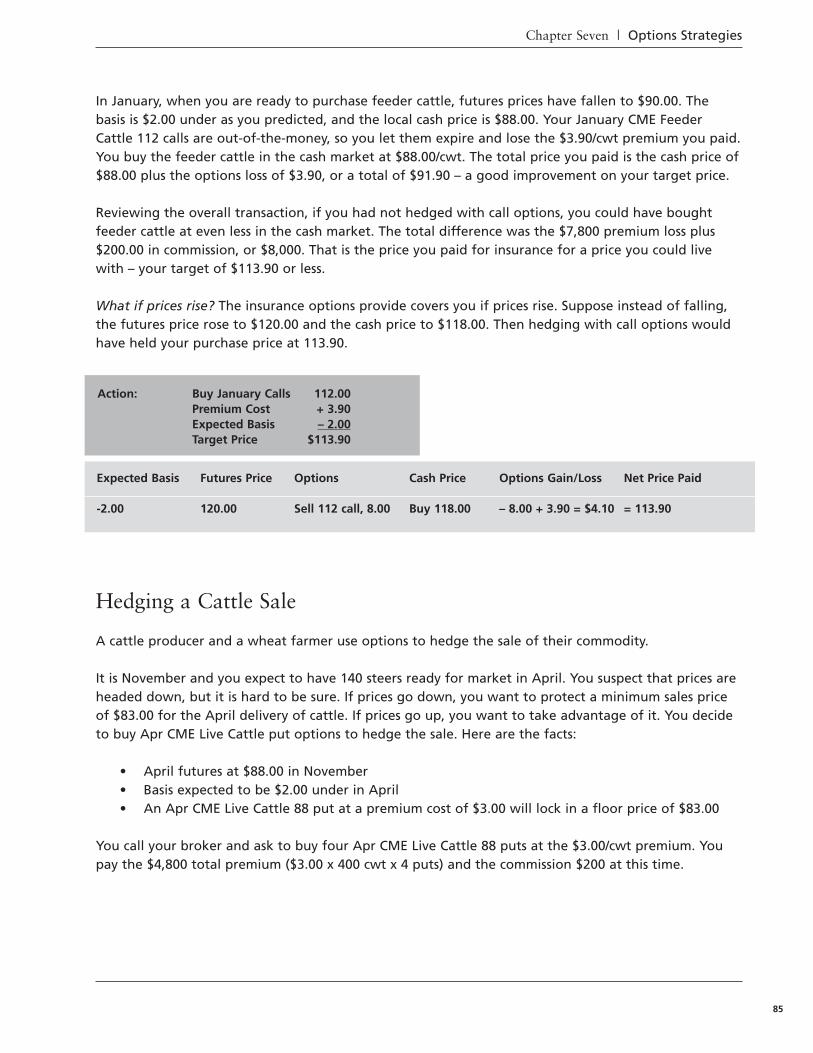
Chapter Seven | Options Strategies
85
In January, when you are ready to purchase feeder cattle, futures prices have fallen to $90.00. Thebasis is $2.00 under as you predicted, and the local cash price is $88.00. Your January CME FeederCattle 112 calls are out-of-the-money, so you let them expire and lose the $3.90/cwt premium you paid.You buy the feeder cattle in the cash market at $88.00/cwt. The total price you paid is the cash price of$88.00 plus the options loss of $3.90, or a total of $91.90 – a good improvement on your target price.
Reviewing the overall transaction, if you had not hedged with call options, you could have boughtfeeder cattle at even less in the cash market. The total difference was the $7,800 premium loss plus$200.00 in commission, or $8,000. That is the price you paid for insurance for a price you could livewith – your target of $113.90 or less.
What if prices rise? The insurance options provide covers you if prices rise. Suppose instead of falling,the futures price rose to $120.00 and the cash price to $118.00. Then hedging with call options wouldhave held your purchase price at 113.90.
Hedging a Cattle Sale
A cattle producer and a wheat farmer use options to hedge the sale of their commodity.
It is November and you expect to have 140 steers ready for market in April. You suspect that prices areheaded down, but it is hard to be sure. If prices go down, you want to protect a minimum sales priceof $83.00 for the April delivery of cattle. If prices go up, you want to take advantage of it. You decideto buy Apr CME Live Cattle put options to hedge the sale. Here are the facts:
• April futures at $88.00 in November• Basis expected to be $2.00 under in April• An Apr CME Live Cattle 88 put at a premium cost of $3.00 will lock in a floor price of $83.00
You call your broker and ask to buy four Apr CME Live Cattle 88 puts at the $3.00/cwt premium. Youpay the $4,800 total premium ($3.00 x 400 cwt x 4 puts) and the commission $200 at this time.
Expected Basis Futures Price Options Cash Price Options Gain/Loss Net Price Paid
-2.00 120.00 Sell 112 call, 8.00 Buy 118.00 – 8.00 + 3.90 = $4.10 = 113.90
Action: Buy January Calls 112.00Premium Cost + 3.90Expected Basis – 2.00Target Price $113.90
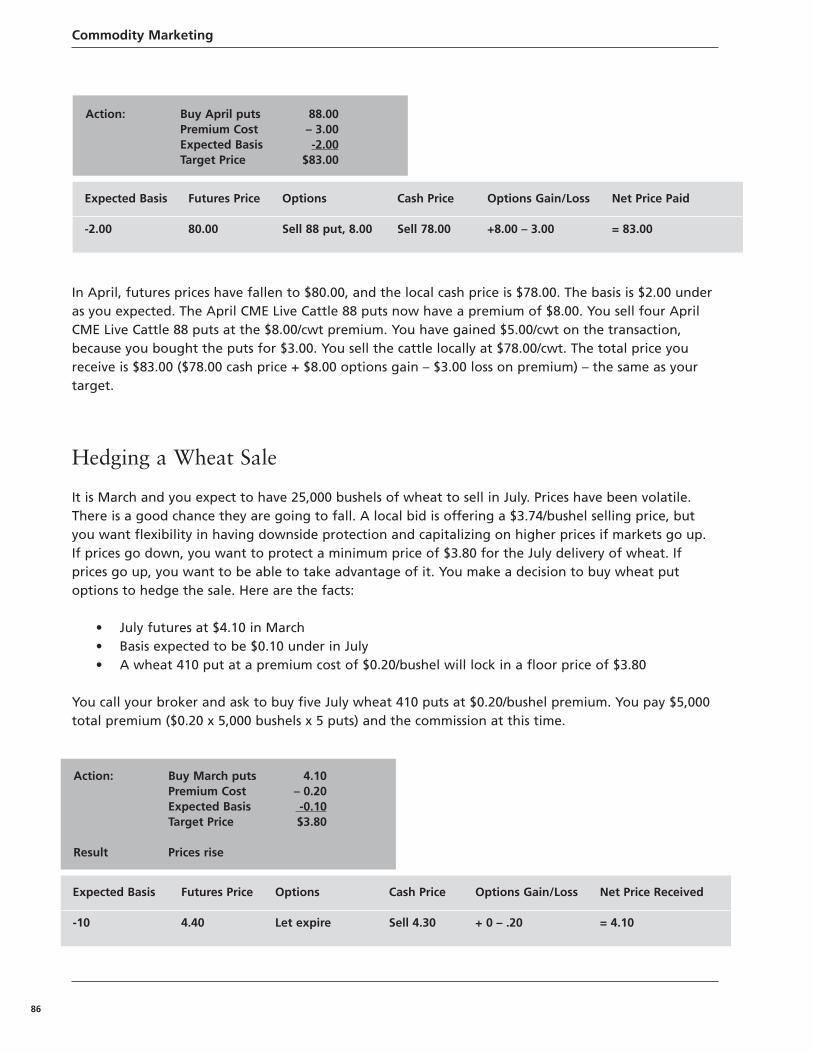
Commodity Marketing
86
In April, futures prices have fallen to $80.00, and the local cash price is $78.00. The basis is $2.00 underas you expected. The April CME Live Cattle 88 puts now have a premium of $8.00. You sell four AprilCME Live Cattle 88 puts at the $8.00/cwt premium. You have gained $5.00/cwt on the transaction,because you bought the puts for $3.00. You sell the cattle locally at $78.00/cwt. The total price youreceive is $83.00 ($78.00 cash price + $8.00 options gain – $3.00 loss on premium) – the same as yourtarget.
Hedging a Wheat Sale
It is March and you expect to have 25,000 bushels of wheat to sell in July. Prices have been volatile.There is a good chance they are going to fall. A local bid is offering a $3.74/bushel selling price, butyou want flexibility in having downside protection and capitalizing on higher prices if markets go up.If prices go down, you want to protect a minimum price of $3.80 for the July delivery of wheat. Ifprices go up, you want to be able to take advantage of it. You make a decision to buy wheat putoptions to hedge the sale. Here are the facts:
• July futures at $4.10 in March• Basis expected to be $0.10 under in July• A wheat 410 put at a premium cost of $0.20/bushel will lock in a floor price of $3.80
You call your broker and ask to buy five July wheat 410 puts at $0.20/bushel premium. You pay $5,000total premium ($0.20 x 5,000 bushels x 5 puts) and the commission at this time.
Expected Basis Futures Price Options Cash Price Options Gain/Loss Net Price Paid
-2.00 80.00 Sell 88 put, 8.00 Sell 78.00 +8.00 – 3.00 = 83.00
Action: Buy April puts 88.00Premium Cost – 3.00Expected Basis -2.00Target Price $83.00
Expected Basis Futures Price Options Cash Price Options Gain/Loss Net Price Received
-10 4.40 Let expire Sell 4.30 + 0 – .20 = 4.10
Action: Buy March puts 4.10Premium Cost – 0.20Expected Basis -0.10Target Price $3.80
Result Prices rise
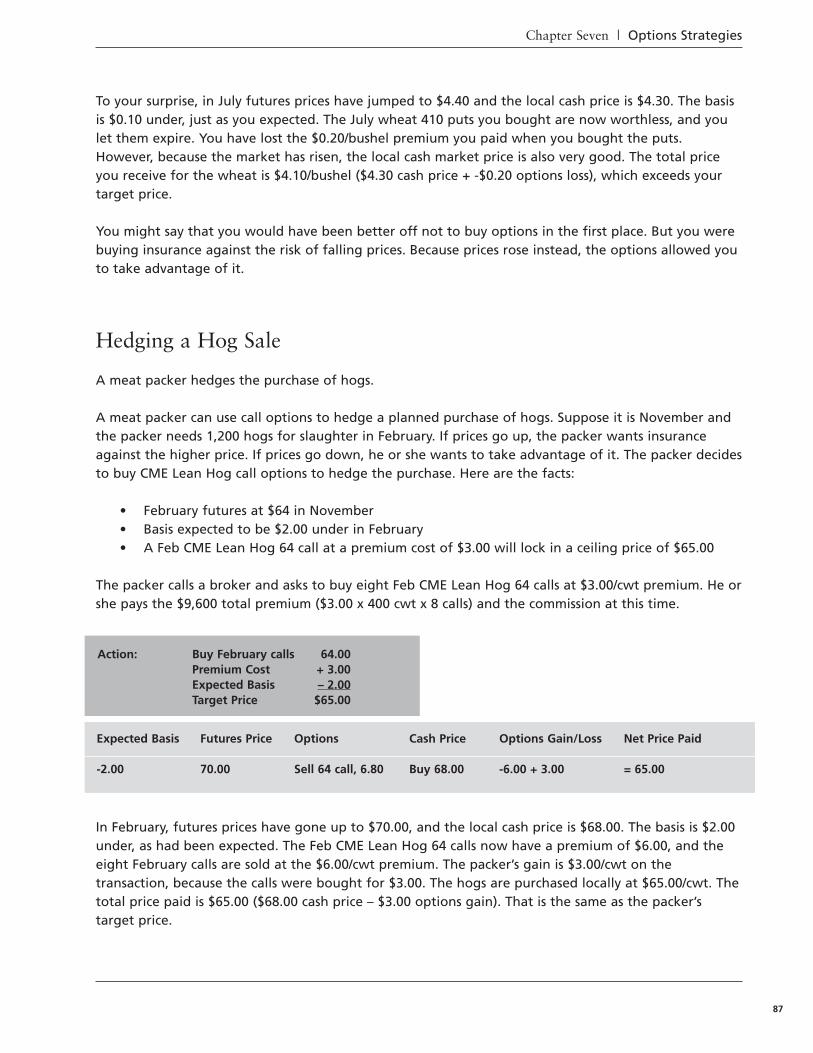
Chapter Seven | Options Strategies
87
To your surprise, in July futures prices have jumped to $4.40 and the local cash price is $4.30. The basisis $0.10 under, just as you expected. The July wheat 410 puts you bought are now worthless, and youlet them expire. You have lost the $0.20/bushel premium you paid when you bought the puts.However, because the market has risen, the local cash market price is also very good. The total priceyou receive for the wheat is $4.10/bushel ($4.30 cash price + -$0.20 options loss), which exceeds yourtarget price.
You might say that you would have been better off not to buy options in the first place. But you werebuying insurance against the risk of falling prices. Because prices rose instead, the options allowed youto take advantage of it.
Hedging a Hog Sale
A meat packer hedges the purchase of hogs.
A meat packer can use call options to hedge a planned purchase of hogs. Suppose it is November andthe packer needs 1,200 hogs for slaughter in February. If prices go up, the packer wants insuranceagainst the higher price. If prices go down, he or she wants to take advantage of it. The packer decidesto buy CME Lean Hog call options to hedge the purchase. Here are the facts:
• February futures at $64 in November • Basis expected to be $2.00 under in February • A Feb CME Lean Hog 64 call at a premium cost of $3.00 will lock in a ceiling price of $65.00
The packer calls a broker and asks to buy eight Feb CME Lean Hog 64 calls at $3.00/cwt premium. He orshe pays the $9,600 total premium ($3.00 x 400 cwt x 8 calls) and the commission at this time.
In February, futures prices have gone up to $70.00, and the local cash price is $68.00. The basis is $2.00under, as had been expected. The Feb CME Lean Hog 64 calls now have a premium of $6.00, and theeight February calls are sold at the $6.00/cwt premium. The packer’s gain is $3.00/cwt on thetransaction, because the calls were bought for $3.00. The hogs are purchased locally at $65.00/cwt. Thetotal price paid is $65.00 ($68.00 cash price – $3.00 options gain). That is the same as the packer’starget price.
Expected Basis Futures Price Options Cash Price Options Gain/Loss Net Price Paid
-2.00 70.00 Sell 64 call, 6.80 Buy 68.00 -6.00 + 3.00 = 65.00
Action: Buy February calls 64.00Premium Cost + 3.00Expected Basis – 2.00Target Price $65.00
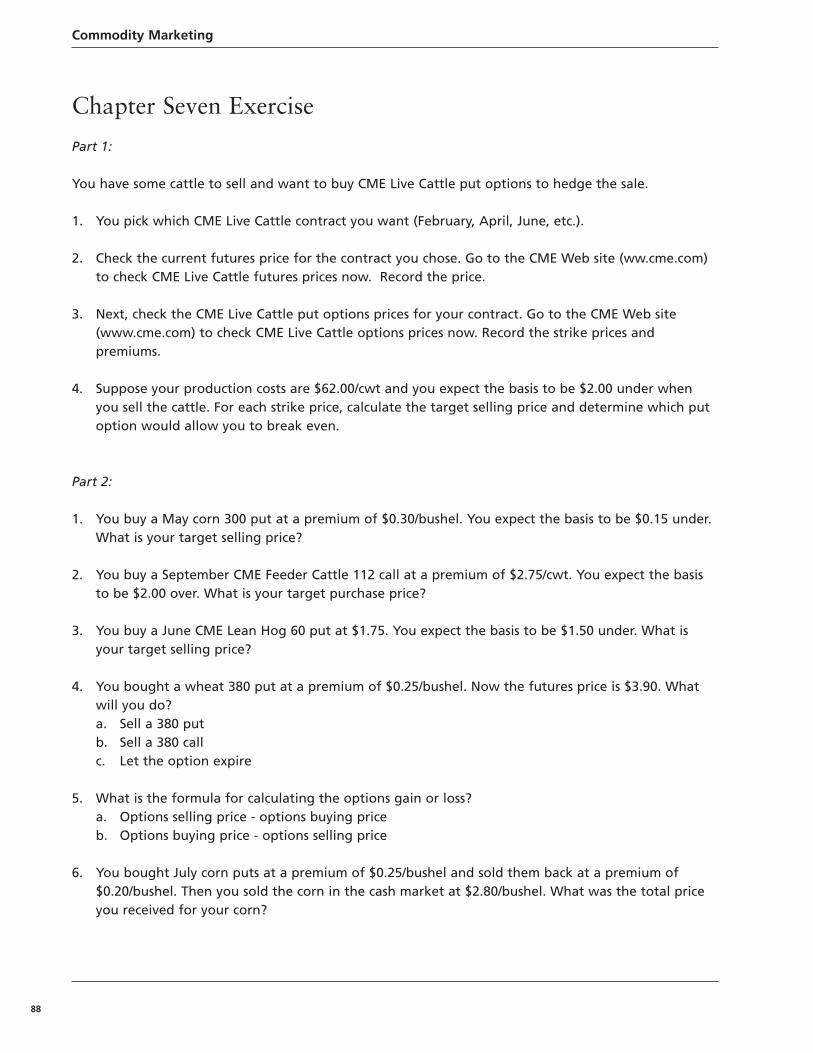
Commodity Marketing
88
Chapter Seven Exercise
Part 1:
You have some cattle to sell and want to buy CME Live Cattle put options to hedge the sale.
1. You pick which CME Live Cattle contract you want (February, April, June, etc.).
2. Check the current futures price for the contract you chose. Go to the CME Web site (ww.cme.com)to check CME Live Cattle futures prices now. Record the price.
3. Next, check the CME Live Cattle put options prices for your contract. Go to the CME Web site(www.cme.com) to check CME Live Cattle options prices now. Record the strike prices andpremiums.
4. Suppose your production costs are $62.00/cwt and you expect the basis to be $2.00 under whenyou sell the cattle. For each strike price, calculate the target selling price and determine which putoption would allow you to break even.
Part 2:
1. You buy a May corn 300 put at a premium of $0.30/bushel. You expect the basis to be $0.15 under.What is your target selling price?
2. You buy a September CME Feeder Cattle 112 call at a premium of $2.75/cwt. You expect the basisto be $2.00 over. What is your target purchase price?
3. You buy a June CME Lean Hog 60 put at $1.75. You expect the basis to be $1.50 under. What isyour target selling price?
4. You bought a wheat 380 put at a premium of $0.25/bushel. Now the futures price is $3.90. Whatwill you do?a. Sell a 380 putb. Sell a 380 callc. Let the option expire
5. What is the formula for calculating the options gain or loss?a. Options selling price - options buying priceb. Options buying price - options selling price
6. You bought July corn puts at a premium of $0.25/bushel and sold them back at a premium of$0.20/bushel. Then you sold the corn in the cash market at $2.80/bushel. What was the total priceyou received for your corn?
Chapter Seven | Options Strategies
89
7. You bought July corn calls at a premium of $0.10/bushel and sold them back at a premium of$0.20/bushel. Then you bought the corn in the cash market at $2.65/bushel. What was the totalprice you paid for the corn?
8. You bought April Live Cattle 74 puts at a premium of $2.50/cwt. Now the 74 puts are worthless.You sell your cattle in the cash market for $78.50/cwt. What was the total price you received forthe cattle?
9. You are planning to sell feeder cattle. Your target price is $75.00/cwt or more. You expect the basisto be $1.00 over. You can afford to spend $2,000 total premium. Which put should you buy?a. 74 put at a premium of 82¢/cwtb. 76 put at a premium of $2.02/cwtc. 78 put at a premium of $3.82/cwtd. 80 put at a premium of $5.77/cwt

Commodity Marketing
90
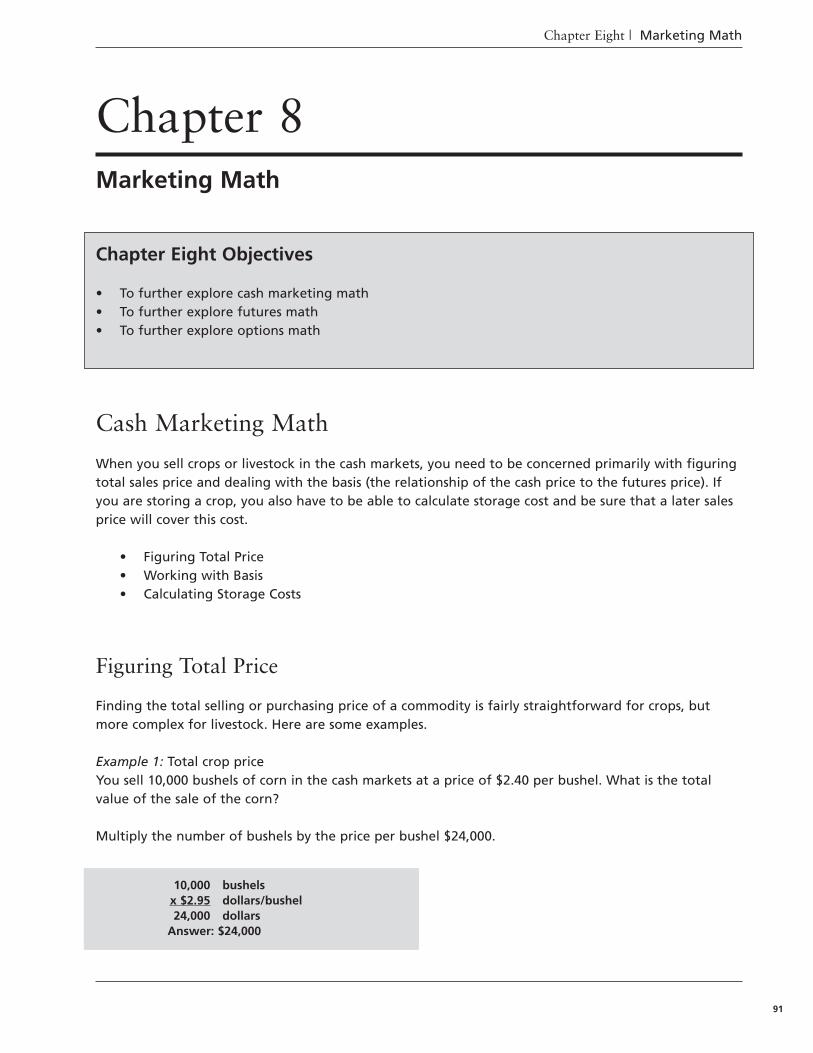
Chapter Eight | Marketing Math
91
Cash Marketing Math
When you sell crops or livestock in the cash markets, you need to be concerned primarily with figuringtotal sales price and dealing with the basis (the relationship of the cash price to the futures price). Ifyou are storing a crop, you also have to be able to calculate storage cost and be sure that a later salesprice will cover this cost.
• Figuring Total Price• Working with Basis• Calculating Storage Costs
Figuring Total Price
Finding the total selling or purchasing price of a commodity is fairly straightforward for crops, butmore complex for livestock. Here are some examples.
Example 1: Total crop priceYou sell 10,000 bushels of corn in the cash markets at a price of $2.40 per bushel. What is the totalvalue of the sale of the corn?
Multiply the number of bushels by the price per bushel $24,000.
10,000 bushelsx $2.95 dollars/bushel24,000 dollars
Answer: $24,000
Chapter 8Marketing Math
Chapter Eight Objectives
• To further explore cash marketing math • To further explore futures math • To further explore options math
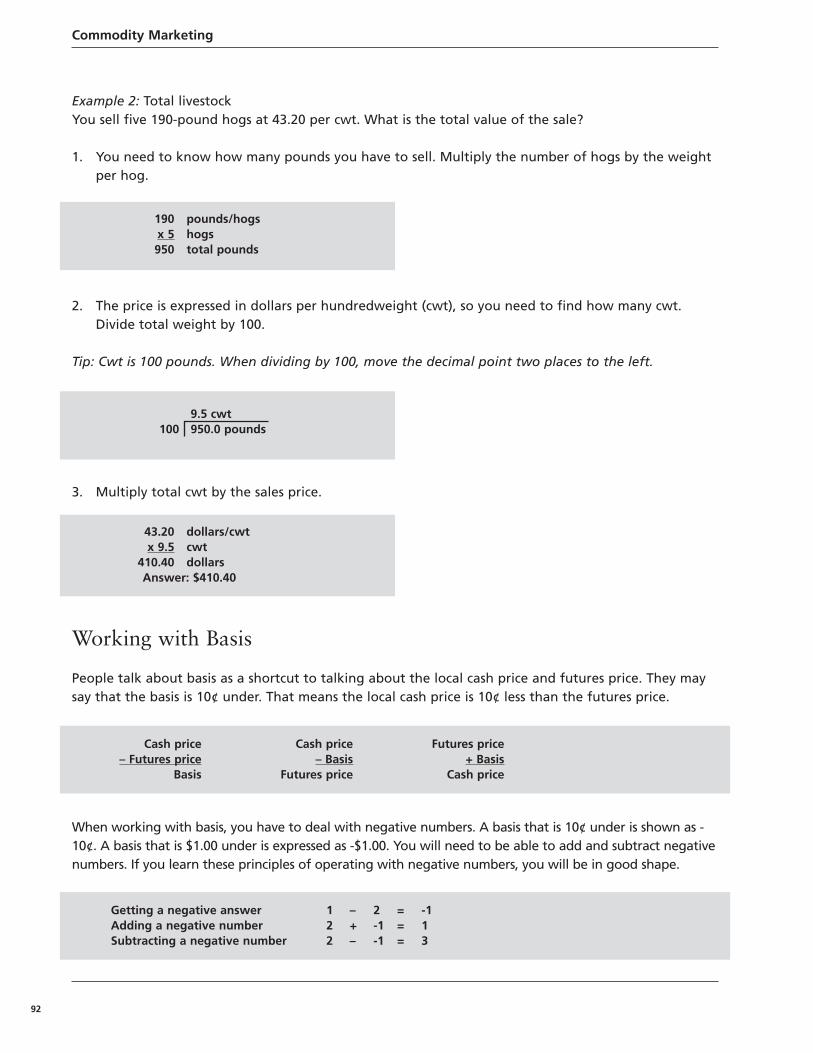
Commodity Marketing
92
190 pounds/hogsx 5 hogs950 total pounds
43.20 dollars/cwtx 9.5 cwt
410.40 dollarsAnswer: $410.40
Example 2: Total livestockYou sell five 190-pound hogs at 43.20 per cwt. What is the total value of the sale?
1. You need to know how many pounds you have to sell. Multiply the number of hogs by the weightper hog.
2. The price is expressed in dollars per hundredweight (cwt), so you need to find how many cwt.Divide total weight by 100.
Tip: Cwt is 100 pounds. When dividing by 100, move the decimal point two places to the left.
3. Multiply total cwt by the sales price.
Working with Basis
People talk about basis as a shortcut to talking about the local cash price and futures price. They maysay that the basis is 10¢ under. That means the local cash price is 10¢ less than the futures price.
When working with basis, you have to deal with negative numbers. A basis that is 10¢ under is shown as -10¢. A basis that is $1.00 under is expressed as -$1.00. You will need to be able to add and subtract negativenumbers. If you learn these principles of operating with negative numbers, you will be in good shape.
9.5 cwt100 950.0 pounds
Cash price– Futures price
Basis
Cash price– Basis
Futures price
Futures price+ Basis
Cash price
Getting a negative answer 1 – 2 = -1Adding a negative number 2 + -1 = 1Subtracting a negative number 2 – -1 = 3
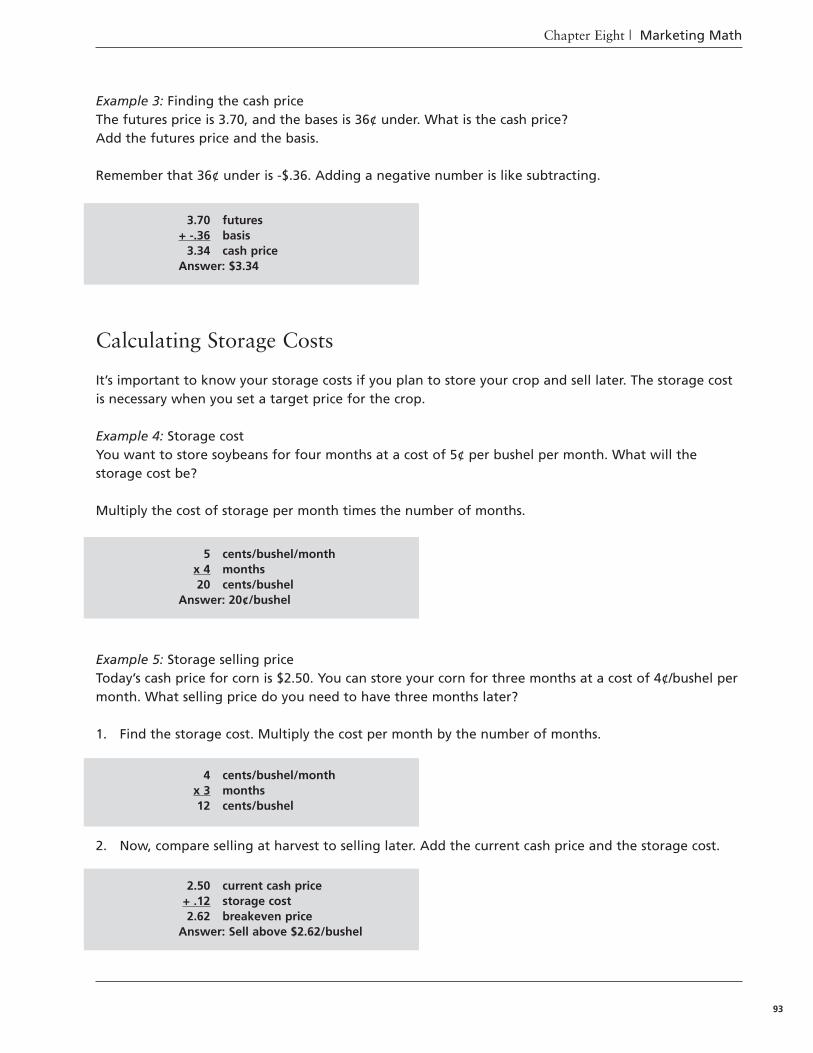
Chapter Eight | Marketing Math
93
Example 3: Finding the cash priceThe futures price is 3.70, and the bases is 36¢ under. What is the cash price?Add the futures price and the basis.
Remember that 36¢ under is -$.36. Adding a negative number is like subtracting.
Calculating Storage Costs
It’s important to know your storage costs if you plan to store your crop and sell later. The storage costis necessary when you set a target price for the crop.
Example 4: Storage costYou want to store soybeans for four months at a cost of 5¢ per bushel per month. What will thestorage cost be?
Multiply the cost of storage per month times the number of months.
Example 5: Storage selling priceToday’s cash price for corn is $2.50. You can store your corn for three months at a cost of 4¢/bushel permonth. What selling price do you need to have three months later?
1. Find the storage cost. Multiply the cost per month by the number of months.
2. Now, compare selling at harvest to selling later. Add the current cash price and the storage cost.
4 cents/bushel/monthx 3 months12 cents/bushel
3.70 futures+ -.36 basis
3.34 cash priceAnswer: $3.34
2.50 current cash price+ .12 storage cost2.62 breakeven price
Answer: Sell above $2.62/bushel
5 cents/bushel/monthx 4 months20 cents/bushel
Answer: 20¢/bushel
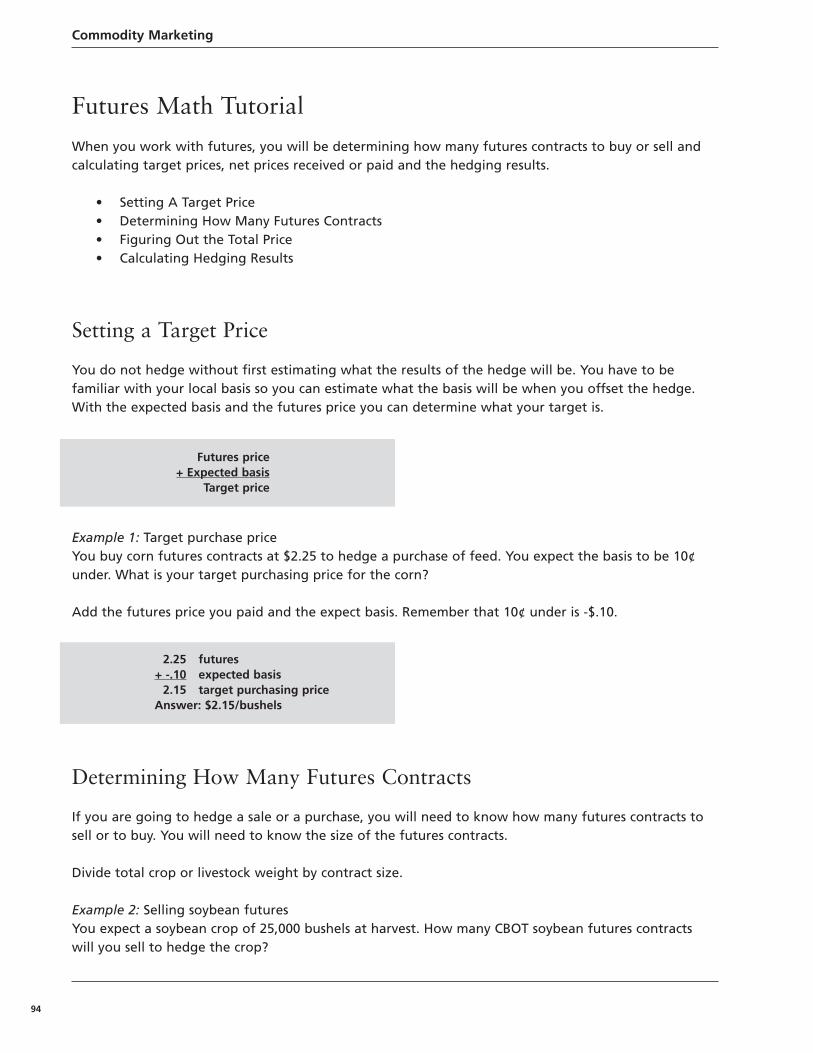
Commodity Marketing
94
Futures Math Tutorial
When you work with futures, you will be determining how many futures contracts to buy or sell andcalculating target prices, net prices received or paid and the hedging results.
• Setting A Target Price• Determining How Many Futures Contracts• Figuring Out the Total Price• Calculating Hedging Results
Setting a Target Price
You do not hedge without first estimating what the results of the hedge will be. You have to befamiliar with your local basis so you can estimate what the basis will be when you offset the hedge.With the expected basis and the futures price you can determine what your target is.
Example 1: Target purchase priceYou buy corn futures contracts at $2.25 to hedge a purchase of feed. You expect the basis to be 10¢under. What is your target purchasing price for the corn?
Add the futures price you paid and the expect basis. Remember that 10¢ under is -$.10.
Determining How Many Futures Contracts
If you are going to hedge a sale or a purchase, you will need to know how many futures contracts tosell or to buy. You will need to know the size of the futures contracts.
Divide total crop or livestock weight by contract size.
Example 2: Selling soybean futuresYou expect a soybean crop of 25,000 bushels at harvest. How many CBOT soybean futures contractswill you sell to hedge the crop?
Futures price+ Expected basis
Target price
2.25 futures+ -.10 expected basis
2.15 target purchasing priceAnswer: $2.15/bushels
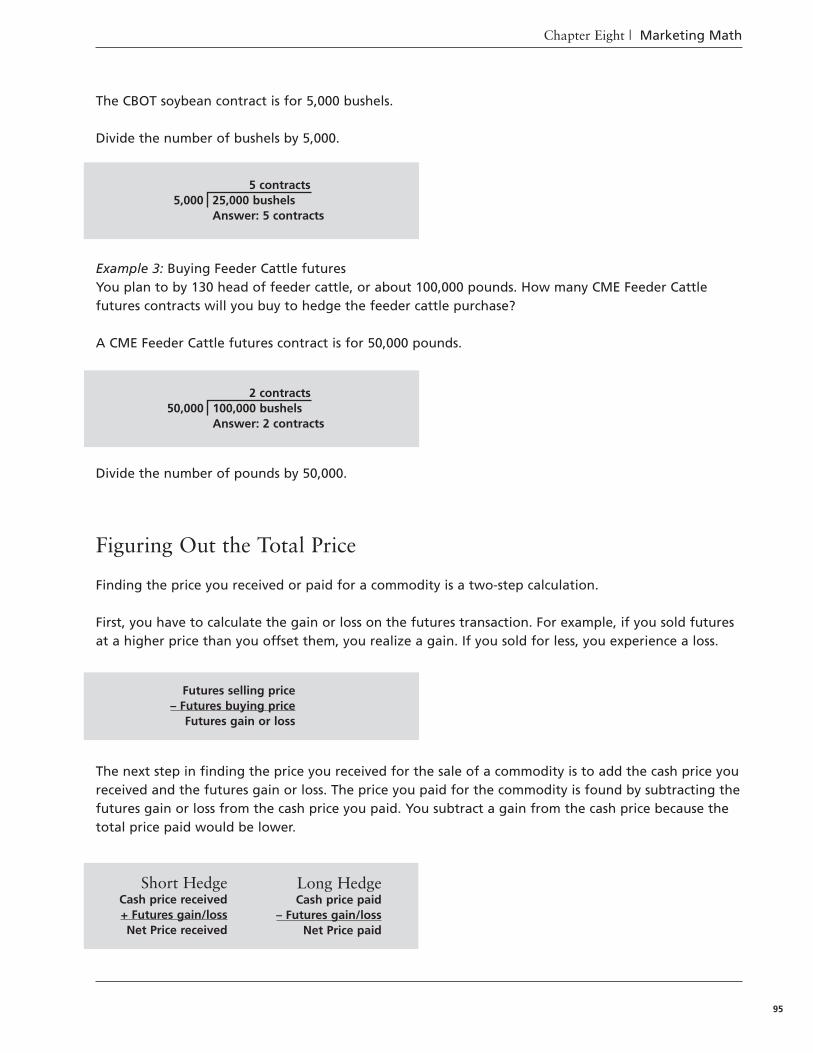
Chapter Eight | Marketing Math
95
The CBOT soybean contract is for 5,000 bushels.
Divide the number of bushels by 5,000.
Example 3: Buying Feeder Cattle futuresYou plan to by 130 head of feeder cattle, or about 100,000 pounds. How many CME Feeder Cattlefutures contracts will you buy to hedge the feeder cattle purchase?
A CME Feeder Cattle futures contract is for 50,000 pounds.
Divide the number of pounds by 50,000.
Figuring Out the Total Price
Finding the price you received or paid for a commodity is a two-step calculation.
First, you have to calculate the gain or loss on the futures transaction. For example, if you sold futuresat a higher price than you offset them, you realize a gain. If you sold for less, you experience a loss.
The next step in finding the price you received for the sale of a commodity is to add the cash price youreceived and the futures gain or loss. The price you paid for the commodity is found by subtracting thefutures gain or loss from the cash price you paid. You subtract a gain from the cash price because thetotal price paid would be lower.
2 contracts50,000 100,000 bushels
Answer: 2 contracts
5 contracts5,000 25,000 bushels
Answer: 5 contracts
Futures selling price– Futures buying price
Futures gain or loss
Short HedgeCash price received+ Futures gain/lossNet Price received
Long HedgeCash price paid
– Futures gain/lossNet Price paid
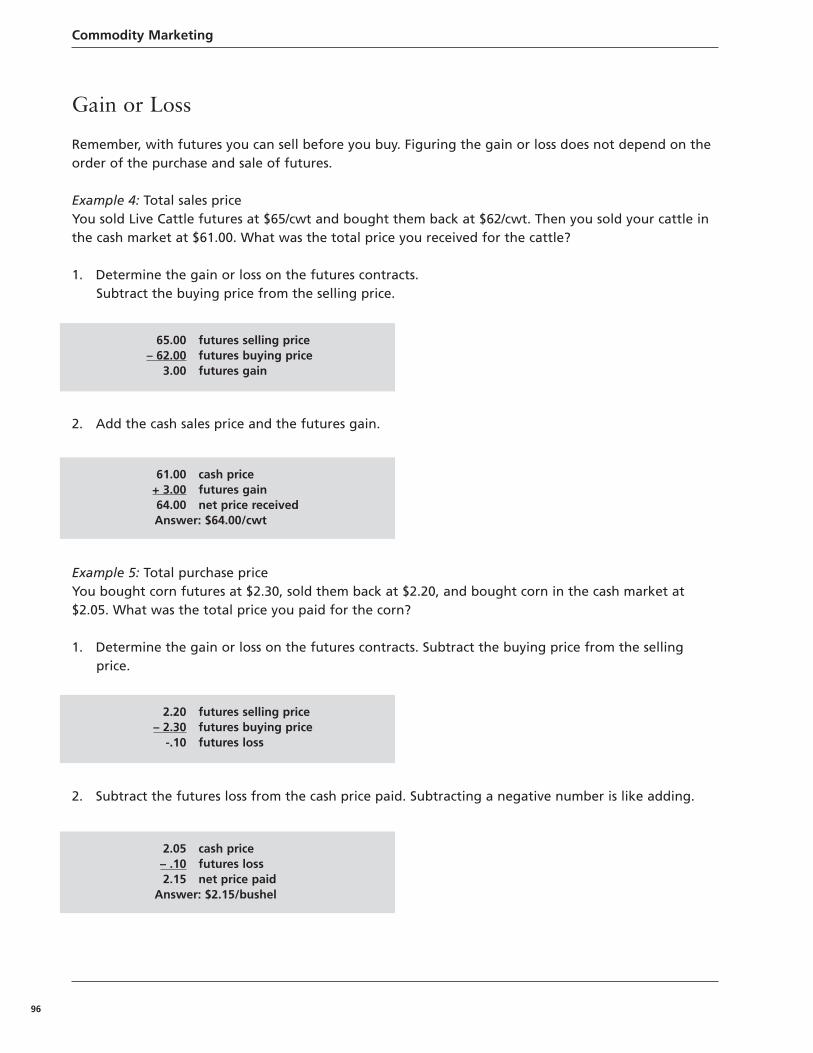
Commodity Marketing
96
Gain or Loss
Remember, with futures you can sell before you buy. Figuring the gain or loss does not depend on theorder of the purchase and sale of futures.
Example 4: Total sales priceYou sold Live Cattle futures at $65/cwt and bought them back at $62/cwt. Then you sold your cattle inthe cash market at $61.00. What was the total price you received for the cattle?
1. Determine the gain or loss on the futures contracts. Subtract the buying price from the selling price.
2. Add the cash sales price and the futures gain.
Example 5: Total purchase priceYou bought corn futures at $2.30, sold them back at $2.20, and bought corn in the cash market at$2.05. What was the total price you paid for the corn?
1. Determine the gain or loss on the futures contracts. Subtract the buying price from the selling price.
2. Subtract the futures loss from the cash price paid. Subtracting a negative number is like adding.
65.00 futures selling price– 62.00 futures buying price
3.00 futures gain
2.20 futures selling price– 2.30 futures buying price
-.10 futures loss
61.00 cash price+ 3.00 futures gain64.00 net price receivedAnswer: $64.00/cwt
2.05 cash price– .10 futures loss2.15 net price paid
Answer: $2.15/bushel
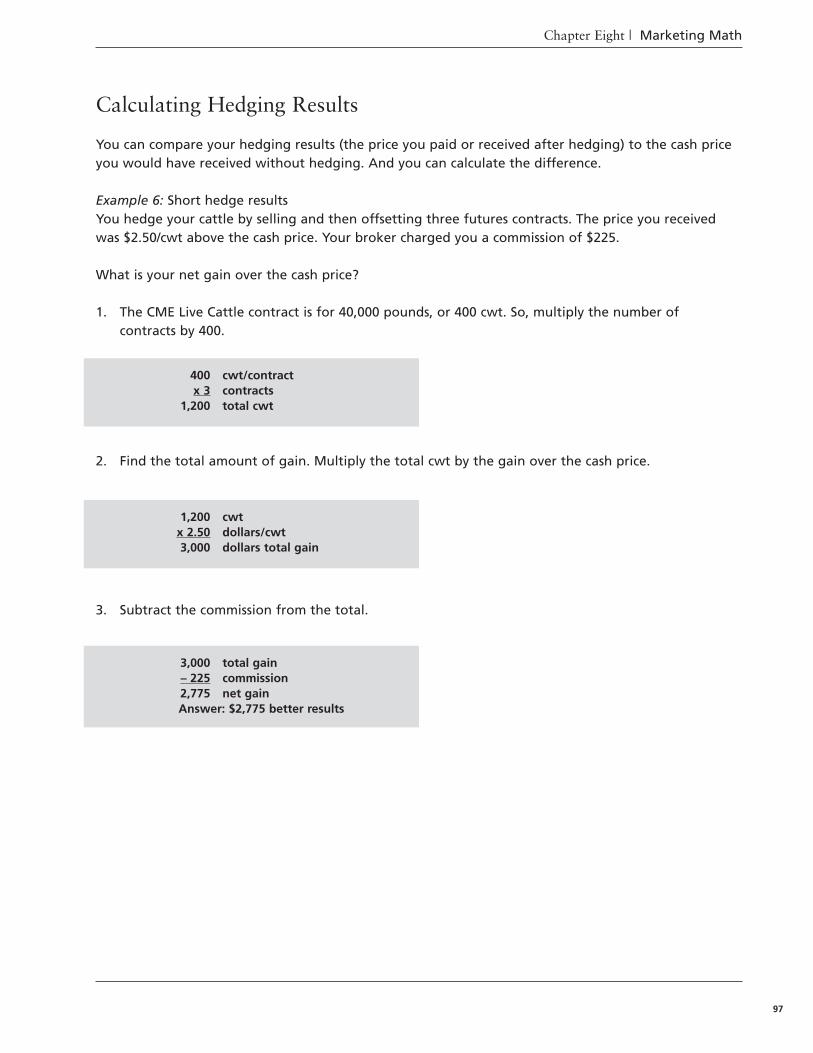
Chapter Eight | Marketing Math
97
Calculating Hedging Results
You can compare your hedging results (the price you paid or received after hedging) to the cash priceyou would have received without hedging. And you can calculate the difference.
Example 6: Short hedge resultsYou hedge your cattle by selling and then offsetting three futures contracts. The price you receivedwas $2.50/cwt above the cash price. Your broker charged you a commission of $225.
What is your net gain over the cash price?
1. The CME Live Cattle contract is for 40,000 pounds, or 400 cwt. So, multiply the number of contracts by 400.
2. Find the total amount of gain. Multiply the total cwt by the gain over the cash price.
3. Subtract the commission from the total.
400 cwt/contractx 3 contracts
1,200 total cwt
1,200 cwtx 2.50 dollars/cwt3,000 dollars total gain
3,000 total gain– 225 commission2,775 net gainAnswer: $2,775 better results
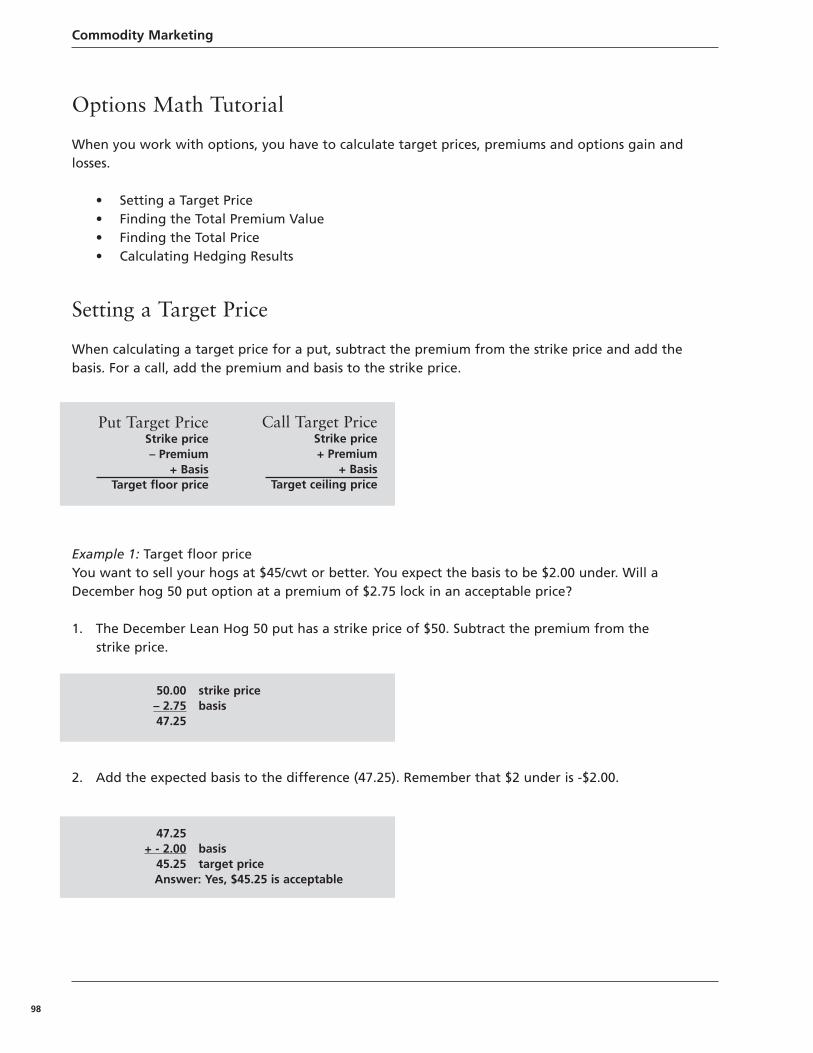
Commodity Marketing
98
Options Math Tutorial
When you work with options, you have to calculate target prices, premiums and options gain andlosses.
• Setting a Target Price• Finding the Total Premium Value• Finding the Total Price• Calculating Hedging Results
Setting a Target Price
When calculating a target price for a put, subtract the premium from the strike price and add thebasis. For a call, add the premium and basis to the strike price.
Example 1: Target floor priceYou want to sell your hogs at $45/cwt or better. You expect the basis to be $2.00 under. Will aDecember hog 50 put option at a premium of $2.75 lock in an acceptable price?
1. The December Lean Hog 50 put has a strike price of $50. Subtract the premium from thestrike price.
2. Add the expected basis to the difference (47.25). Remember that $2 under is -$2.00.
50.00 strike price– 2.75 basis47.25
47.25 + - 2.00 basis
45.25 target priceAnswer: Yes, $45.25 is acceptable
Put Target PriceStrike price– Premium
+ BasisTarget floor price
Call Target PriceStrike price+ Premium
+ BasisTarget ceiling price
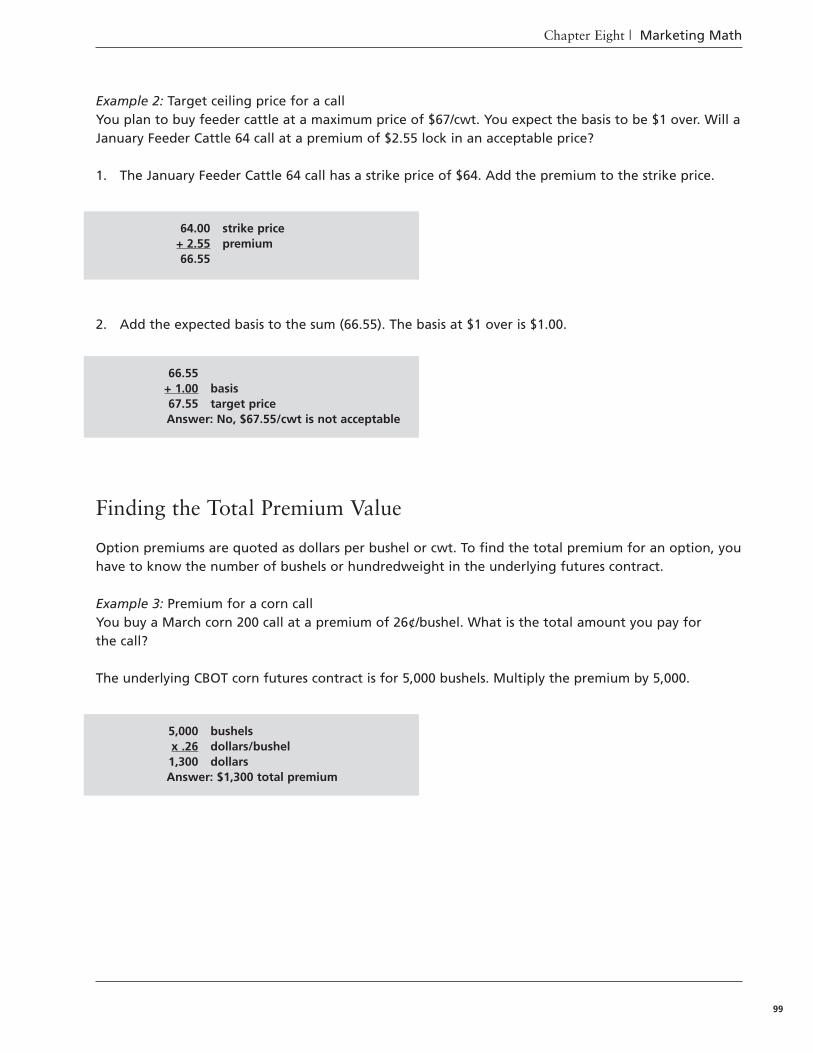
Chapter Eight | Marketing Math
99
Example 2: Target ceiling price for a callYou plan to buy feeder cattle at a maximum price of $67/cwt. You expect the basis to be $1 over. Will aJanuary Feeder Cattle 64 call at a premium of $2.55 lock in an acceptable price?
1. The January Feeder Cattle 64 call has a strike price of $64. Add the premium to the strike price.
2. Add the expected basis to the sum (66.55). The basis at $1 over is $1.00.
Finding the Total Premium Value
Option premiums are quoted as dollars per bushel or cwt. To find the total premium for an option, youhave to know the number of bushels or hundredweight in the underlying futures contract.
Example 3: Premium for a corn callYou buy a March corn 200 call at a premium of 26¢/bushel. What is the total amount you pay for the call?
The underlying CBOT corn futures contract is for 5,000 bushels. Multiply the premium by 5,000.
66.55 + 1.00 basis67.55 target priceAnswer: No, $67.55/cwt is not acceptable
64.00 strike price+ 2.55 premium66.55
5,000 bushelsx .26 dollars/bushel1,300 dollarsAnswer: $1,300 total premium
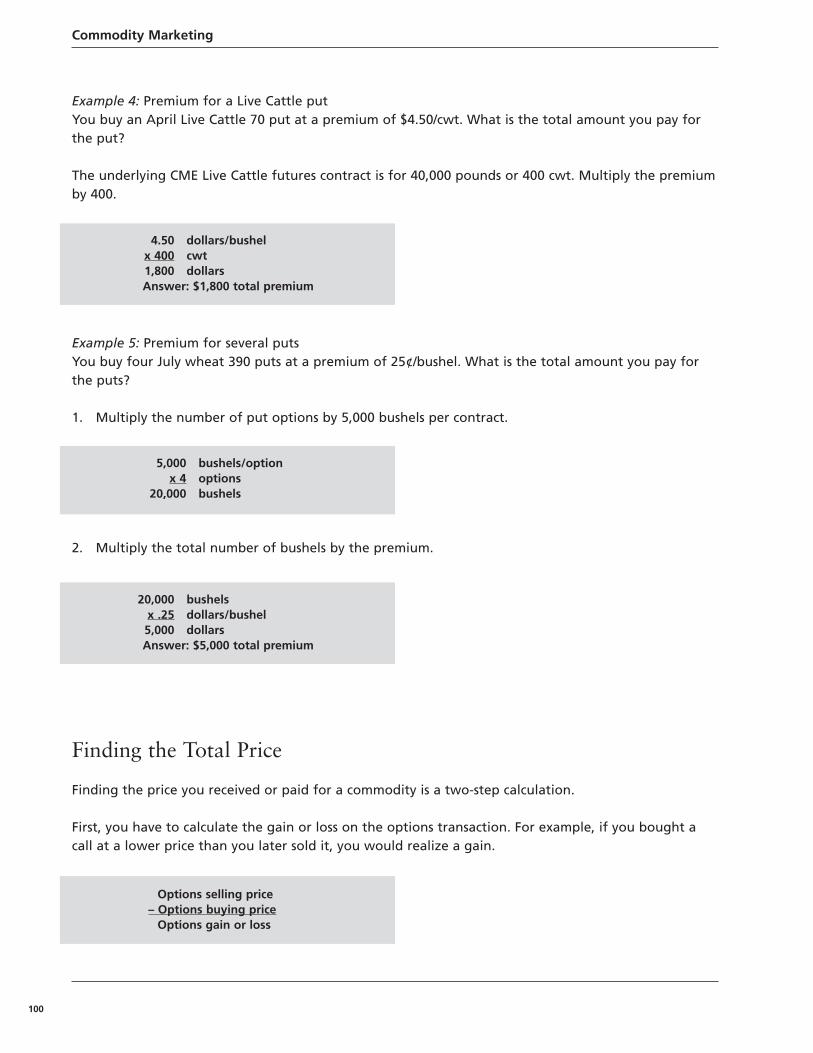
Commodity Marketing
100
Example 4: Premium for a Live Cattle putYou buy an April Live Cattle 70 put at a premium of $4.50/cwt. What is the total amount you pay forthe put?
The underlying CME Live Cattle futures contract is for 40,000 pounds or 400 cwt. Multiply the premiumby 400.
Example 5: Premium for several putsYou buy four July wheat 390 puts at a premium of 25¢/bushel. What is the total amount you pay forthe puts?
1. Multiply the number of put options by 5,000 bushels per contract.
2. Multiply the total number of bushels by the premium.
Finding the Total Price
Finding the price you received or paid for a commodity is a two-step calculation.
First, you have to calculate the gain or loss on the options transaction. For example, if you bought acall at a lower price than you later sold it, you would realize a gain.
20,000 bushelsx .25 dollars/bushel5,000 dollarsAnswer: $5,000 total premium
5,000 bushels/optionx 4 options
20,000 bushels
4.50 dollars/bushelx 400 cwt1,800 dollarsAnswer: $1,800 total premium
Options selling price– Options buying price
Options gain or loss
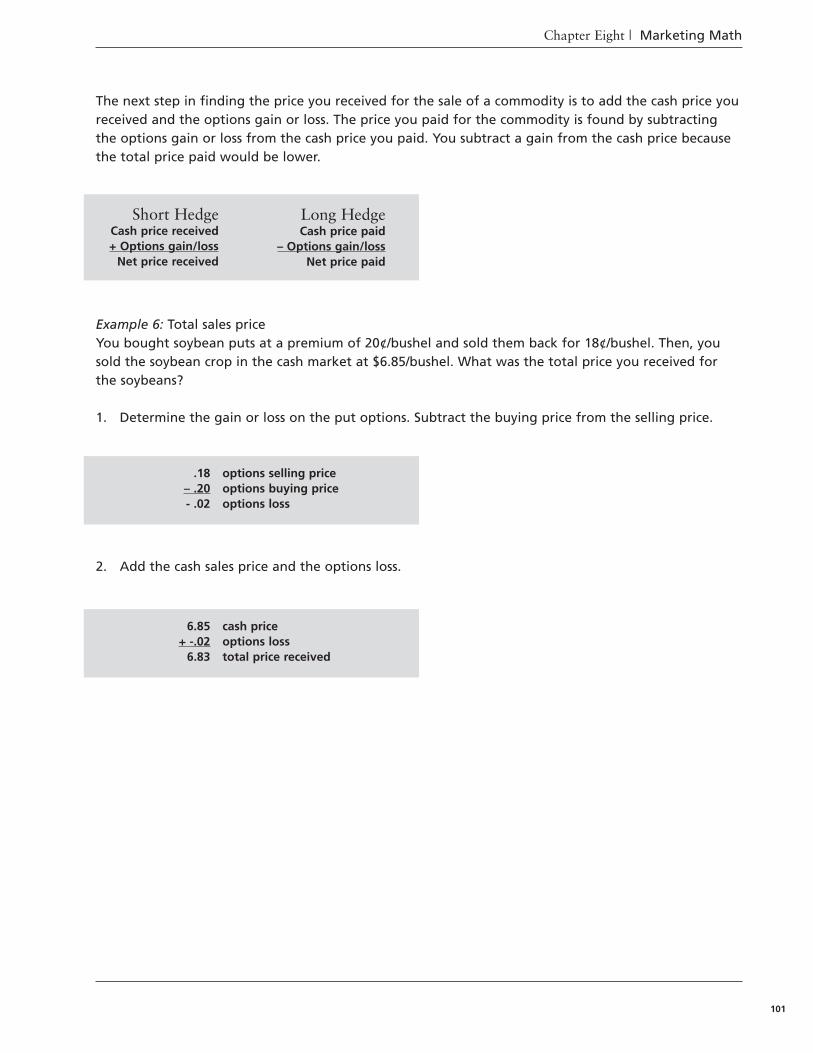
Chapter Eight | Marketing Math
101
The next step in finding the price you received for the sale of a commodity is to add the cash price youreceived and the options gain or loss. The price you paid for the commodity is found by subtractingthe options gain or loss from the cash price you paid. You subtract a gain from the cash price becausethe total price paid would be lower.
Example 6: Total sales priceYou bought soybean puts at a premium of 20¢/bushel and sold them back for 18¢/bushel. Then, yousold the soybean crop in the cash market at $6.85/bushel. What was the total price you received forthe soybeans?
1. Determine the gain or loss on the put options. Subtract the buying price from the selling price.
2. Add the cash sales price and the options loss.
Short HedgeCash price received+ Options gain/loss
Net price received
Long HedgeCash price paid
– Options gain/lossNet price paid
.18 options selling price– .20 options buying price- .02 options loss
6.85 cash price+ -.02 options loss
6.83 total price received
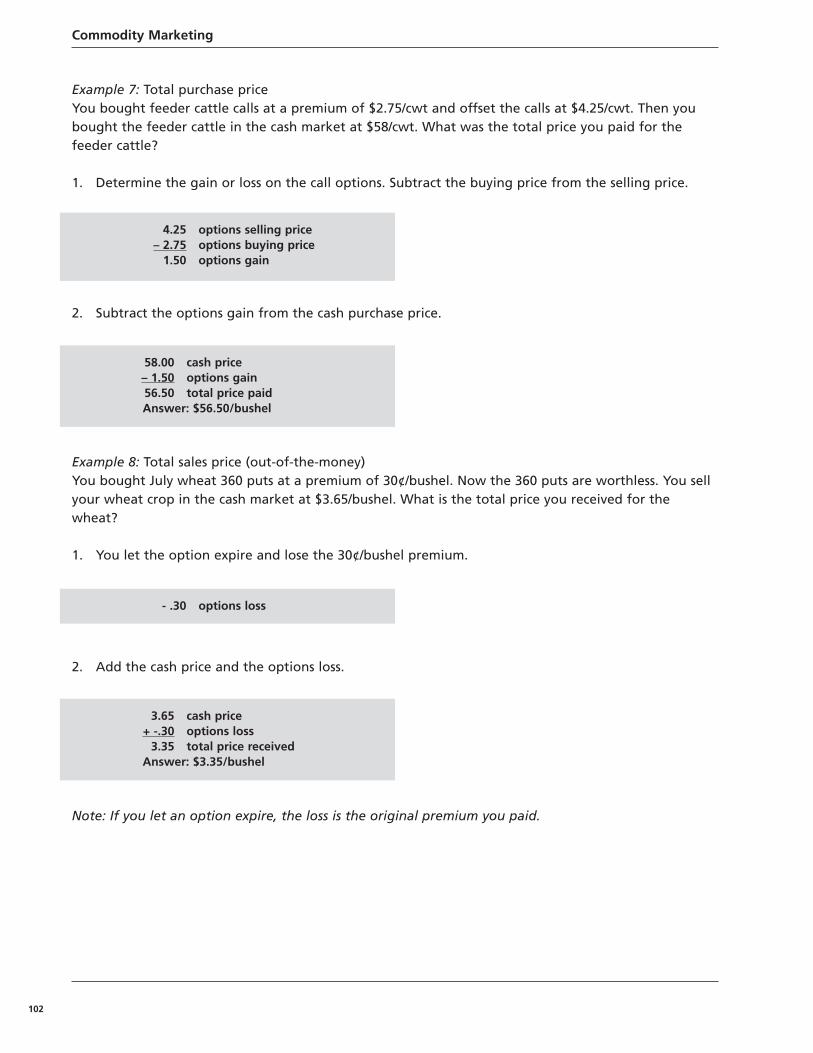
Commodity Marketing
102
Example 7: Total purchase priceYou bought feeder cattle calls at a premium of $2.75/cwt and offset the calls at $4.25/cwt. Then youbought the feeder cattle in the cash market at $58/cwt. What was the total price you paid for thefeeder cattle?
1. Determine the gain or loss on the call options. Subtract the buying price from the selling price.
2. Subtract the options gain from the cash purchase price.
Example 8: Total sales price (out-of-the-money)You bought July wheat 360 puts at a premium of 30¢/bushel. Now the 360 puts are worthless. You sellyour wheat crop in the cash market at $3.65/bushel. What is the total price you received for thewheat?
1. You let the option expire and lose the 30¢/bushel premium.
2. Add the cash price and the options loss.
Note: If you let an option expire, the loss is the original premium you paid.
58.00 cash price – 1.50 options gain56.50 total price paidAnswer: $56.50/bushel
4.25 options selling price– 2.75 options buying price
1.50 options gain
3.65 cash price + -.30 options loss
3.35 total price receivedAnswer: $3.35/bushel
- .30 options loss
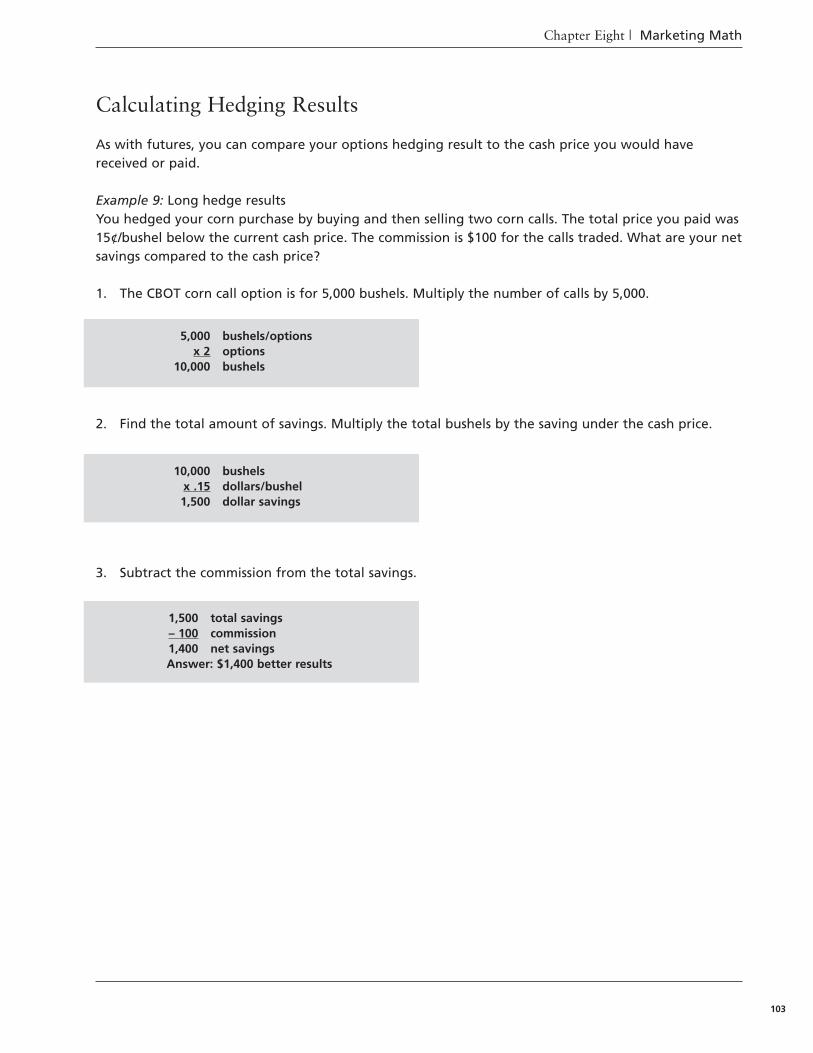
Chapter Eight | Marketing Math
103
Calculating Hedging Results
As with futures, you can compare your options hedging result to the cash price you would havereceived or paid.
Example 9: Long hedge resultsYou hedged your corn purchase by buying and then selling two corn calls. The total price you paid was15¢/bushel below the current cash price. The commission is $100 for the calls traded. What are your netsavings compared to the cash price?
1. The CBOT corn call option is for 5,000 bushels. Multiply the number of calls by 5,000.
2. Find the total amount of savings. Multiply the total bushels by the saving under the cash price.
3. Subtract the commission from the total savings.
5,000 bushels/optionsx 2 options
10,000 bushels
10,000 bushelsx .15 dollars/bushel1,500 dollar savings
1,500 total savings– 100 commission1,400 net savingsAnswer: $1,400 better results

Commodity Marketing
104
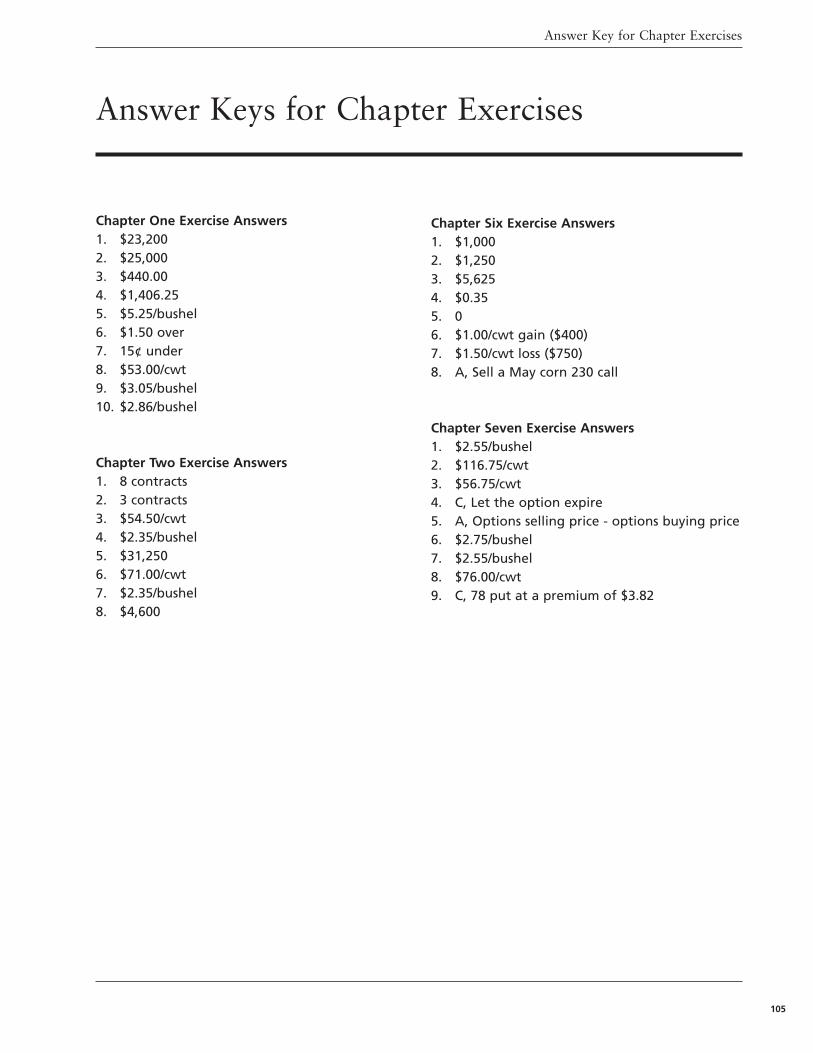
Answer Key for Chapter Exercises
105
Chapter One Exercise Answers1. $23,2002. $25,0003. $440.004. $1,406.255. $5.25/bushel6. $1.50 over7. 15¢ under8. $53.00/cwt9. $3.05/bushel10. $2.86/bushel
Chapter Two Exercise Answers1. 8 contracts2. 3 contracts3. $54.50/cwt4. $2.35/bushel5. $31,2506. $71.00/cwt7. $2.35/bushel8. $4,600
Chapter Six Exercise Answers1. $1,0002. $1,2503. $5,6254. $0.355. 06. $1.00/cwt gain ($400)7. $1.50/cwt loss ($750)8. A, Sell a May corn 230 call
Chapter Seven Exercise Answers1. $2.55/bushel2. $116.75/cwt3. $56.75/cwt4. C, Let the option expire5. A, Options selling price - options buying price6. $2.75/bushel7. $2.55/bushel8. $76.00/cwt9. C, 78 put at a premium of $3.82
Answer Keys for Chapter Exercises

Commodity Marketing
106
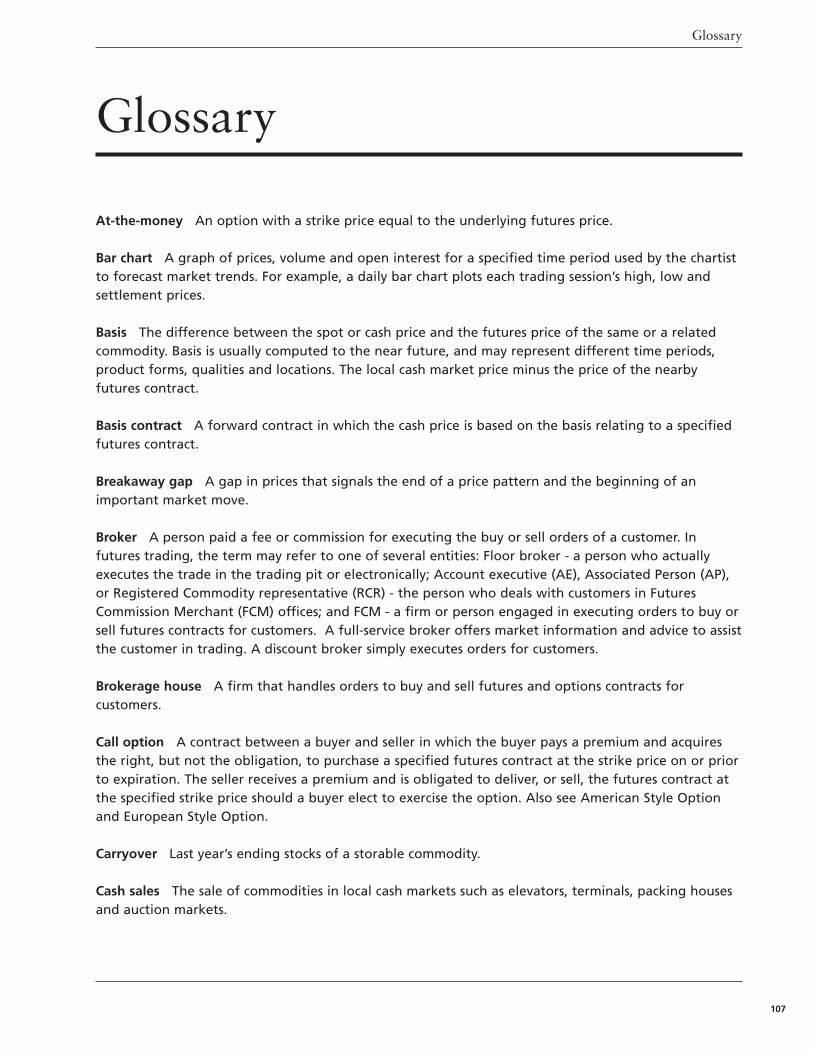
Glossary
107
At-the-money An option with a strike price equal to the underlying futures price.
Bar chart A graph of prices, volume and open interest for a specified time period used by the chartistto forecast market trends. For example, a daily bar chart plots each trading session’s high, low andsettlement prices.
Basis The difference between the spot or cash price and the futures price of the same or a relatedcommodity. Basis is usually computed to the near future, and may represent different time periods,product forms, qualities and locations. The local cash market price minus the price of the nearbyfutures contract.
Basis contract A forward contract in which the cash price is based on the basis relating to a specifiedfutures contract.
Breakaway gap A gap in prices that signals the end of a price pattern and the beginning of animportant market move.
Broker A person paid a fee or commission for executing the buy or sell orders of a customer. Infutures trading, the term may refer to one of several entities: Floor broker - a person who actuallyexecutes the trade in the trading pit or electronically; Account executive (AE), Associated Person (AP),or Registered Commodity representative (RCR) - the person who deals with customers in FuturesCommission Merchant (FCM) offices; and FCM - a firm or person engaged in executing orders to buy orsell futures contracts for customers. A full-service broker offers market information and advice to assistthe customer in trading. A discount broker simply executes orders for customers.
Brokerage house A firm that handles orders to buy and sell futures and options contracts forcustomers.
Call option A contract between a buyer and seller in which the buyer pays a premium and acquiresthe right, but not the obligation, to purchase a specified futures contract at the strike price on or priorto expiration. The seller receives a premium and is obligated to deliver, or sell, the futures contract atthe specified strike price should a buyer elect to exercise the option. Also see American Style Optionand European Style Option.
Carryover Last year’s ending stocks of a storable commodity.
Cash sales The sale of commodities in local cash markets such as elevators, terminals, packing housesand auction markets.
Glossary

Commodity Marketing
108
Clearing house An agency or separate corporation of a futures exchange that is responsible forsettling trading accounts, collecting and maintaining margin monies, regulating delivery and reportingtrade data (i.e., CME Clearing is the clearing house for CME).
Commission For futures contracts, the one-time fee charged by a broker to cover the trades a clientmakes to open and close each position. It is payable when the client exits the position. Also called around-turn. Commissions on options are usually half on initiation and paid half on liquidation.
Commodity The underlying instrument upon which a futures contract is based.
Commodity exchange An exchange that lists designated futures contracts for the trading of varioustypes of derivative products and allows use of its facilities by traders. Must comply with rules set forthby the Commodity Futures Trading Commission (CFTC).
Commodity Futures Trading Commission The independent body that oversees all futures trading inthe United States.
Deferred pricing agreement A cash sale in which the seller delivers a commodity and agrees with thebuyer to price it at a later time.
Delivery day The calendar date on which a delivery transaction is to be completed.
Delivery point Those locations designated by the exchange at which actual commodities may bedelivered in fulfillment of a futures contract.
Demand The quantity of a commodity that buyers are willing to purchase in the market at a givenprice.
Discount broker See Broker.
Double top, bottom A bar chart formation that signals a possible price trend reversal. In a point andfigure chart, double tops and bottoms are used for buy and sell signals.
Downtrend A price trend characterized by a series of lower highs and lower lows.
E-trader Traders no longer need to be physically present on the floor but use electronic tradingplatforms such as CME Globex.
Exhaustion gap A gap in prices near the top or bottom of a price move that signals an abrupt turn inthe market.
Floor broker An individual who is registered with the CFTC to execute orders on the floor of anexchange for the account of another. He/she receives a fee for doing so by clearing members or theircustomers.
Glossary
109
Forward contract A private, cash-market agreement between a buyer and seller for the futuredelivery of a commodity at an agreed price. In contrast to futures contracts, forward contracts are notstandardized and not transferable.
Full-service broker Broker that provides general brokerage services, trade execution, as well asstrategic planning for each trader individually. Also is availability for trade discussions, advising duringorder placement, and provide suggestions for “next move” post trade. See Broker.
Fundamental analysis The study of supply and demand information to aid in anticipating futuresprice trends.
Futures contract An obligation to deliver or to receive a specified quantity and grade of a commodityduring a designated month at the designated price. Each futures contract is standardized and specifiescommodity, quality, quantity, delivery date and settlement.
Head and shoulders A sideways price formation at the top or bottom of the market that indicates amajor market reversal.
Hedger An individual or firm who uses the futures market to offset price risk when intending to sellor buy the actual commodity. See Pure Hedger, Selective Hedger.
Hedging 1 - Taking a position in a futures market opposite to a position held in the cash market tominimize the risk of financial loss from an adverse price change. 2 - A purchase or sale of futures as atemporary substitute for a cash transaction which will occur later. See Long Hedge and Short Hedge.
In-the-money A call option with a strike price lower (or a put option with a strike price higher) thanthe current market value of the underlying futures commodity.
Intrinsic value The relationship of an option’s in-the-money strike price to the current futures price.For a put: strike price minus futures price. For a call: futures price minus strike price.
Line of credit Signed agreement between the producer and the lender to supply funds for hedgingonly, but not for speculation and to liquidate one’s account without the producer’s consent and toprohibit from further trading.
Long hedge The purchase of a futures contract in anticipation of an actual purchase in the cashcommodity market. Used by processors or exporters as protection against an advance in the cash price.See Hedge.
Margin See Performance Bond.
Margin call See Performance Bond Call.
Market order (MO) An order submitted at any time within a trading session, executable immediatelyat the current market price.
Commodity Marketing
110
Maturity Period within which a futures contract can be settled by delivery of the actual commodity;the period between the first notice day and the last trading day of a commodity futures contract.
Maximum price fluctuation The maximum amount the contract price can change up or down duringone trading session, as stipulated by exchange rules. Consult CME Clearing contract specifications forspecific price limit information.
Moving averages A type of technical analysis using the averages of settlement prices.
National Futures Association (NFA) The self regulatory organization of the futures industry. Charteredby Congress in 1981, the NFA regulates the activities of its member brokerage firms and theiremployees. Overseen by the Commodity Futures Trading Commission (CFTC).
Offset 1 - To remove a position from an account by establishing a position opposite an existingposition, making or taking delivery, or exercising an option (i.e., selling if one has bought, or buying ifone has sold). 2 - To report reductions of a firm’s inventory of open long purchase dates to CMEClearing.
Open interest The total number of futures contracts long or short in a delivery month or market thathas been entered into and not yet liquidated by an offsetting transaction or fulfilled by delivery Alsoknown as Open Contracts or Open Commitments. Each open transaction has a buyer and a seller, butfor calculation of open interest, only one side of the contract is counted.
Open outcry The method of trading that the CFTC requires in the exchange trading pits whereby alltrades are made with verbal bids and offers. In open outcry, only the highest Bid and lowest Offerprices can compete (that is, be shouted, accompanied by hand signals, by the floor brokers and floortraders) on the trading floor at any given moment.
Option The right, but not the obligation, to sell or buy the underlying (in this case, a futures contract)at a specified price on or before a certain expiration date. There are two types of options: call optionsand put options. Each offers an opportunity to take advantage of futures price moves without actuallyhaving a futures position.
Out-of-the-money A term used to describe an option that has no intrinsic value. A call option with astrike price higher (or a put with a strike price lower) than the current market value of the underlyingfutures commodity. Since it depends on current prices, an option can vary from in the money to out ofthe money with market price movements during the life of the options contract.
Performance bond The amount of money or collateral deposited by a client with his broker, or by aclearing firm with CME Clearing on open futures or options contracts before a customer can trade. Theperformance bond is not a part payment on a purchase. 1 - Initial performance bond is the totalamount of margin per contract required by the broker when an account is opened, or when the equityin the account falls below CME Clearing minimum maintenance requirements. 2 - Maintenanceperformance bond is a sum which must be maintained on deposit at all times. If a customer’s equity inany futures position falls below the maintenance level because of adverse price movement, the brokermust issue a margin call to the minimum CME Clearing initial margin requirement to restore thecustomer’s equity. Consult the Contract Specifications for margin requirements of specific contracts.
Glossary
111
Performance bond call 1 - A request from a brokerage firm to a customer to bring performance bonddeposits up to minimum levels. 2 - A request by CME Clearing to a clearing firm to bring clearingperformance bonds back to levels required by the Exchange Rules. Most exchanges refer to this as a“margin call.”
Premium 1 - The price paid by the purchaser of an option to the grantor (seller). 2 - The amount bywhich a cash commodity price trades over a futures price or another cash commodity price.
Price Price to which the given instrument should be traded in an order or a trade. Also called limit.
Price order An order to sell or buy at a certain price or better.
Pure hedger A person who places a hedge to lock in a price for a commodity. He or she offsets thehedge and transacts in the cash market simultaneously.
Put option A contract that provides the purchaser the right (but not the obligation) to sell a futurescontract at an agreed price (the strike price) at any time during the life of the option. A put option ispurchased in the expectation of a decline in price.
Runaway gap A gap in prices after a trend has begun that signals the halfway point of a marketmove.
Short hedge The sale of a futures contract in anticipation of a later cash market sale. Used toeliminate or minimize the possible decline in value of ownership of an approximately equal amount ofthe cash financial instrument or physical commodity. See Hedge.
Sideways trend Seen in a bar chart when prices tend not to go above or below a certain range oflevels.
Speculator An individual who does not hedge, but who trades in commodity futures or options withthe objective of achieving profits through the successful anticipation of price movements. Thespeculator has no interest in taking delivery.
Stop order An order specifying a price at which it is activated and becomes a limit order. A buy stop isentered above the current market and becomes a limit order when the commodity trades at or abovethe specified stop trigger price. A sell stop is entered below the current market. It becomes a limitorder when the commodity trades at the stop price or below. The stop can immediately execute up tothe limit price.
Strike (price) The price at which the option buyer may purchase or sell the underlying futurescontract upon exercise. See Exercise Price.
Strike price The price at which the option may be exercised (price at which the option buyer maypurchase or sell the underlying futures contract). Strike prices on options are at exchange designatedintervals. See Exercise Price.
Commodity Marketing
112
Substitution The principle by which CME Clearing becomes the buyer to every seller and the seller toevery buyer upon the successful matching of two trade records or upon the successful completion ofinitial settlement for ex-pit transactions.
Supply The quantity of a commodity that producers are willing to provide to the market at a givenprice.
Target price An expected selling or buying price. For long and short hedges with futures: futures price+ expected basis. For puts: futures price – premium + expected basis. For calls: futures price + premium+ expected basis.
Technical analysis The study of historical price patterns to help forecast futures prices.
Time value The amount by which an option’s premium exceeds its intrinsic value. Usually relative tothe time remaining before the option expires.
Trader 1 - A person who takes positions in the futures market, usually without the intention of making or taking delivery. 2 - A member of the exchange who buys and sells futures andoptions through the floor of the exchange. See Day Trader, Floor Broker, Position Trader, and Scalper.
Uptrend A price trend characterized by a series of higher highs and higher lows.
Volatility An annualized measure of the fluctuation in the price of a futures contract. Historicalvolatility is the actual measure of futures price movement from the past. Implied volatility is a measureof what the market implies it is, as reflected in the option’s price.
Volume The number of contracts in futures or options on futures made during a specified period oftime. At CME, it refers to “aggregated quantity” (i.e., total traded volume of the day). The publishedexchange volume figure consists of all trades executed on the trading floor, CME Globex and byExchange-For-Physical (EFP).
The Globe Logo, CME® and Globex® are trademarks of CME. All other trademarks are the property of theirrespective owners, used with license.
The information within this manual has been compiled by CME for general purposes only. Although every attempthas been made to ensure the accuracy of the information, CME assumes no responsibility for any errors oromissions. Additionally, all examples in this manual are hypothetical fact situations, used for explanation purposesonly, and should not be considered investment advice. All matters pertaining to rules and specifications herein aremade subject to and are superseded by official CME rules. Current rules should be consulted in all cases concerningcontract specifications.
Copyright © 2006 CMEEmail: [email protected]
AC050/250/0906