CMA-CGM Announces New Intermodal Fee. JOC quotes the carrier’s February 20 announcement, ... Farm...
22
A weekly publication of the Agricultural Marketing Service www.ams.usda.gov/GTR March 1, 2018 Contents Article/ Calendar Grain Transportation Indicators Rail Barge Truck Exports Ocean Brazil Mexico Grain Truck/Ocean Rate Advisory Datasets Specialists Subscription Information -------------- The next release is March 8, 2018 Preferred citation: U.S. Dept. of Agriculture, Agricultural Marketing Service. Grain Transportation Report. March 1, 2018. Web: http://dx.doi.org/10.9752/TS056.03-01-2018 Grain Transportation Report Contact Us WEEKLY HIGHLIGHTS High Water Disrupts Navigation Across Much of the Mississippi River System Heavy rainfall, from the middle to lower Mississippi River Valley eastward across much of the Ohio River Basin, has resulted in widespread river flooding along Cincinnati, Cairo, Memphis, and other locations. High water has caused navigation disruptions on sections of the Ohio, Illinois, Tennessee, and Arkansas Rivers. In response, the Army Corps of Engineers (Corps) closed the Markland Locks, McAlpine Locks, and Smithland Locks. In addition, large volumes of water from the aforementioned rivers are flowing into the Mississippi River and causing its lower portion to reach flood stage at multiple locations. Barge tow sizes have been reduced from 40 to 30 barges on the lower Mississippi River, and will likely be restricted for several weeks. Barge traffic is also restricted to daylight passage at Vicksburg and Memphis. River restrictions are set by the Waterway Action Plan, a joint effort of the U.S. Coast Guard, Corps, and senior leaders of the towing industry. Presentations Available from USDA’s 2018 Agricultural Outlook Forum USDA has posted presentation slides and a video recording of the opening and plenary sessions of the 94 th Agricultural Outlook Forum, held last week. The Forum covered a variety of topics, including food prices, international markets and trade, and innovation in agriculture. During the plenary, Cargill’s Joe Stone listed investing in infrastructure as one of “three imperatives for continued prosperity of the U.S. agricultural economy.” In addition, as part of the event, USDA released its outlook reports for grain and oilseeds, livestock and poultry, and other commodities. The commodity outlooks contain the latest projections on prices, supply, and demand for 2018/19. For instance, USDA projects total exports of corn, soybeans, and wheat to remain similar to last year, with year- over-year corn exports decreasing 150 million bushels (7 percent) and soybeans increasing 200 million bushels (10 percent). USDA will update these projections in its May World Agricultural Supply and Demand Estimates report. CMA-CGM Announces New Intermodal Fee According to a recent article by the Journal of Commerce (JOC), ocean container carrier CMA-CGM announced an emergency intermodal fee, effective March 13, 2018. The fee will apply to all shipments where CMA-CGM is responsible for the inland transportation. JOC quotes the carrier’s February 20 announcement, which cites the “new regulations requiring commercial trucks to be equipped with electronic logging devices” and “fewer drivers in the market” as reasons for the additional fee. Snapshots by Sector Export Sales For the week ending February 15, unshipped balances of wheat, corn, and soybeans totaled 33.6 mmt, down 6 percent from the same time last year. Net weekly wheat export sales were .329 mmt, up 6 percent from the previous week. Net corn export sales were 1.56 mmt, down 21 percent from the previous week. Net soybean export sales were negative .109 mmt for the same period. Rail U.S. Class I railroads originated 21,495 grain carloads for the week ending February 17; up 13 percent from the previous week, down 6 percent from last year, and down 6 percent from the 3-year average. Average March shuttle secondary railcar bids/offers per car were $1,069 above tariff, for the week ending February 22; up $581 from last week, and $719 lower than last year. There were no non-shuttle bids/offers this week. Barge For the week ending February 24, barge grain movements totaled 418,480 tons, 27 percent lower than the previous week and down 22 percent from the same period last year. For the week ending February 24, 264 grain barges moved down river, down 27 percent from last week. There were 800 grain barges unloaded in New Orleans, 47 percent higher the previous week. Ocean For the week ending February 22, 37 ocean-going grain vessels were loaded in the Gulf, 28 percent less than the same period last year. Fifty-six vessels are expected to be loaded within the next 10 days, 27 percent less than the same period last year. For the week ending February 22, the ocean freight rate for shipping bulk grain from the Gulf to Japan was $44 per metric ton, up 2 percent from the previous week. The cost of shipping from the PNW to Japan was $23.75 per metric ton, up 2 percent from the previous week. Fuel During the week ending February 26, average diesel fuel prices decreased 2 cents from the previous week at $3.01 per gallon, 43 cents higher than the same week last year.
Transcript of CMA-CGM Announces New Intermodal Fee. JOC quotes the carrier’s February 20 announcement, ... Farm...
A weekly publication of the Agricultural Marketing Service www.ams.usda.gov/GTR
March 1, 2018
Contents
Article/ Calendar
Grain
Transportation Indicators
Rail
Barge
Truck
Exports
Ocean
Brazil
Mexico
Grain Truck/Ocean Rate Advisory
Datasets
Specialists
Subscription Information
--------------
The next release is
March 8, 2018
Preferred citation: U.S. Dept. of Agriculture, Agricultural Marketing Service. Grain Transportation Report. March 1, 2018. Web: http://dx.doi.org/10.9752/TS056.03-01-2018
Grain Transportation Report
Contact Us
WEEKLY HIGHLIGHTS
High Water Disrupts Navigation Across Much of the Mississippi River System
Heavy rainfall, from the middle to lower Mississippi River Valley eastward across much of the Ohio River Basin, has resulted in
widespread river flooding along Cincinnati, Cairo, Memphis, and other locations. High water has caused navigation disruptions on
sections of the Ohio, Illinois, Tennessee, and Arkansas Rivers. In response, the Army Corps of Engineers (Corps) closed the Markland
Locks, McAlpine Locks, and Smithland Locks. In addition, large volumes of water from the aforementioned rivers are flowing into
the Mississippi River and causing its lower portion to reach flood stage at multiple locations. Barge tow sizes have been reduced from
40 to 30 barges on the lower Mississippi River, and will likely be restricted for several weeks. Barge traffic is also restricted to
daylight passage at Vicksburg and Memphis. River restrictions are set by the Waterway Action Plan, a joint effort of the U.S. Coast
Guard, Corps, and senior leaders of the towing industry.
Presentations Available from USDA’s 2018 Agricultural Outlook Forum
USDA has posted presentation slides and a video recording of the opening and plenary sessions of the 94th Agricultural Outlook
Forum, held last week. The Forum covered a variety of topics, including food prices, international markets and trade, and innovation
in agriculture. During the plenary, Cargill’s Joe Stone listed investing in infrastructure as one of “three imperatives for continued
prosperity of the U.S. agricultural economy.” In addition, as part of the event, USDA released its outlook reports for grain and
oilseeds, livestock and poultry, and other commodities. The commodity outlooks contain the latest projections on prices, supply, and
demand for 2018/19. For instance, USDA projects total exports of corn, soybeans, and wheat to remain similar to last year, with year-
over-year corn exports decreasing 150 million bushels (7 percent) and soybeans increasing 200 million bushels (10 percent). USDA
will update these projections in its May World Agricultural Supply and Demand Estimates report.
CMA-CGM Announces New Intermodal Fee
According to a recent article by the Journal of Commerce (JOC), ocean container carrier CMA-CGM announced an emergency
intermodal fee, effective March 13, 2018. The fee will apply to all shipments where CMA-CGM is responsible for the inland
transportation. JOC quotes the carrier’s February 20 announcement, which cites the “new regulations requiring commercial trucks to
be equipped with electronic logging devices” and “fewer drivers in the market” as reasons for the additional fee.
Snapshots by Sector
Export Sales
For the week ending February 15, unshipped balances of wheat, corn, and soybeans totaled 33.6 mmt, down 6 percent from the same
time last year. Net weekly wheat export sales were .329 mmt, up 6 percent from the previous week. Net corn export sales were 1.56
mmt, down 21 percent from the previous week. Net soybean export sales were negative .109 mmt for the same period.
Rail
U.S. Class I railroads originated 21,495 grain carloads for the week ending February 17; up 13 percent from the previous week, down
6 percent from last year, and down 6 percent from the 3-year average.
Average March shuttle secondary railcar bids/offers per car were $1,069 above tariff, for the week ending February 22; up $581
from last week, and $719 lower than last year. There were no non-shuttle bids/offers this week.
Barge For the week ending February 24, barge grain movements totaled 418,480 tons, 27 percent lower than the previous week and down
22 percent from the same period last year.
For the week ending February 24, 264 grain barges moved down river, down 27 percent from last week. There were 800 grain barges
unloaded in New Orleans, 47 percent higher the previous week.
Ocean
For the week ending February 22, 37 ocean-going grain vessels were loaded in the Gulf, 28 percent less than the same period last
year. Fifty-six vessels are expected to be loaded within the next 10 days, 27 percent less than the same period last year.
For the week ending February 22, the ocean freight rate for shipping bulk grain from the Gulf to Japan was $44 per metric ton, up 2
percent from the previous week. The cost of shipping from the PNW to Japan was $23.75 per metric ton, up 2 percent from the
previous week.
Fuel
During the week ending February 26, average diesel fuel prices decreased 2 cents from the previous week at $3.01 per gallon, 43
cents higher than the same week last year.

March 1, 2018
Grain Transportation Report 2
Feature Article/Calendar
Despite Increased Transportation Costs, Mexico Imported More U.S. Corn During the Fourth Quarter
During the fourth quarter of 2017, Mexico imported 14 percent more corn from the United States, but 3
percent less soybeans and 31 percent less wheat, compared to the same period a year earlier (USDA,
Foreign Agricultural Service, GATS data). Despite a hike in transportation costs, Mexico imported 7
percent more U.S. corn, 8 percent more soybeans, and 34 percent more wheat, during calendar year 2017
compared to 2016.
The transportation costs of shipping corn and soybeans from the United States to Veracruz, Mexico via
water increased 10 percent and the cost of shipping wheat increased 12 percent (see table below). The
cost of shipping U.S. corn and wheat by land to Guadalajara, Mexico increased 3 and 2 percent,
respectively, while the cost of shipping soybeans decreased 1 percent. The increase in transportation costs
of shipping U.S. corn and soybeans, over the water route, was due to higher truck, barge, and ocean rates
during the quarter. As for the land route, the tariff rail rate for shipping corn increased as well.
$/metric ton $/metric ton
2016 2017 2017 2016 2017 2017
4th
qtr. 3rd
qtr. 4th
qtr. Yr. to Yr.Qtr. to Qtr. 4th
qtr. 3rd
qtr. 4th
qtr. Yr. to Yr. Qtr. to Qtr.
Origin
Truck 10.58 13.02 14.39 36.0 10.5 3.94 4.00 4.91 24.6 22.8
Rail 1
84.85 85.68 87.27 2.9 1.9
Barge 16.52 17.75 19.59 18.6 10.4
Ocean2
13.26 12.98 14.26 7.5 9.9
Total transportation cost3
40.36 43.75 48.24 19.5 10.3 88.79 89.68 92.18 3.8 2.8
Farm Value4
132.41 132.80 128.60 -2.9 -3.2 128.21 128.60 125.58 -2.1 -2.3
Landed Cost5
172.77 176.55 176.84 2.4 0.2 217.00 218.28 217.76 0.4 -0.2
Transport % of landed cost 23 25 27 41 41 42
Origin
Truck 10.58 13.02 14.39 36.0 10.5 3.94 4.00 4.91 24.6 22.8
Rail 92.64 93.53 91.23 -1.5 -2.5
Barge 16.52 17.75 19.59 18.6 10.4
Ocean 13.26 12.98 14.26 7.5 9.9
Total transportation cost 40.36 43.75 48.24 19.5 10.3 96.58 97.53 96.14 -0.5 -1.4
Farm Value 359.11 351.27 349.07 -2.8 -0.6 338.29 332.65 329.10 -2.7 -1.1
Landed Cost 399.47 395.02 397.31 -0.5 0.6 434.87 430.18 425.24 -2.2 -1.1
Transport % of landed cost 10 11 12 22 23 23
Origin
Truck 3.94 4.00 4.91 24.6 22.8 3.94 4.00 4.91 24.6 22.8
Rail 38.30 41.42 41.42 8.1 0.0 73.69 77.19 77.46 5.1 0.3
Ocean 13.26 12.98 14.26 7.5 9.9
Total transportation cost 55.50 58.40 60.59 9.2 3.7 77.63 81.19 82.37 6.1 1.5
Farm Value 106.92 146.36 128.97 20.6 -11.9 106.92 146.36 128.97 20.6 -11.9
Landed Cost 162.42 204.76 189.56 16.7 -7.4 184.55 227.55 211.34 14.5 -7.1
Transport % of landed cost 34 29 32 42 36 391Rail rates include U.S. and Mexico portions of the movement. Mexico rail rates are estimated based on
actual quoted market rates. BNSF and Union Pacific quoted rail tariff rates are through rates for shuttle trains.
Rail rates include fuel surcharges, but do not include the cost of purchasing empty rail cars in the secondary market, which could exceed the
rail tariff rate plus fuel surcharge shown in the table. 2Source: O'Neil Commodity Consulting 3Transportation costs for Kansas wheat transported via water route were revised from previous estimates4Source: USDA/NASS5Landed cost is total transportation cost plus farm value
Wheat
KS KS
Corn
IL IA
Soybeans
Quarterly costs of transporting U.S. grain to Veracruz and Guadalajara, Mexico
Water route (to Veracruz) Land route (to Guadalajara)
Percent change Percent change
IL NE

March 1, 2018
Grain Transportation Report 3
The increase in the trucking rates was partly due to higher diesel prices and increased demand for
trucking services. Barge rates increased as a result of the seasonal increase in the demand for barge
services during the quarter. A strong thermal coal and grain trade pushed up ocean freight rates during the
quarter (February 8, 2018 Grain
Transportation Report).
Despite an overall increase in
transportation costs, quarter-to-quarter
landed costs for waterborne U.S. wheat
decreased 7 percent, but corn and
soybeans remained relatively the same.
The landed costs for soybean and
wheat transported by land decreased 1
and 7 percent, respectively. The landed
cost for corn by land remained the
same. Lower or reduced landed costs
were a result of the decline in the farm
values. Landed costs ranged from $177
to $397 per metric ton (mt) for the
water route (see table and figure 1) and
$211 to $425 per mt (see table and
figure 2) for the land route. The
transportation share of the landed costs
ranged from 12 to 32 percent for the
water route and 23 to 42 percent for the
land route (see table).
Market Analysis and Outlook:
Although grain prices are currently at
low levels, Mexico is expected to
import slightly less corn during the
2017/18 marketing year (MY) than
during the previous marketing year; still
much higher than the historical average
of the last few years. According to
USDA’s Foreign Agricultural Service,
Mexico’s corn imports for MY 2017/18
are estimated at 15.6 million metric
tons (mmt) (FAS, GAIN Report #:
MX8002). Mexico’s imports of U.S.
wheat for MY 2017/18 are also
estimated at 4.1 mmt. Corn imports
were revised downward slightly from the previous official USDA estimate because of higher-than-
estimated production and potential economic uncertainty in 2018, such as Mexican presidential elections
and ongoing NAFTA negotiations (FAS, GAIN Report #: MX8002). Despite the economic uncertainties,
U.S. proximity to Mexico provides a competitive advantage over other suppliers to the Mexican market.
In addition, the currently low grain prices may make U.S. exports more attractive to Mexican consumers.
Barge BargeRailOcean Ocean
Ocean
Truck$14.39
Truck$4.91
Farm value$128.60
Farm value$349.07
Farm value$134.36
0.00
50.00
100.00
150.00
200.00
250.00
300.00
350.00
400.00
450.00
IL: Corn IL: Soybeans KS: Wheat
$/m
t
Figure 1. Water route shipment costs ($/mt) to Veracruz, Mexico
Total=$176.84Total=$204.76
Total=$397.31
$14.26 $41.42
$14.26$19.59
Source: USDA, Agricultural Marketing Service
Rail$87.27
Rail$77.46
Farm value$125.58
Farm value$329.10
Farm value$128.97
0.00
50.00
100.00
150.00
200.00
250.00
300.00
350.00
400.00
450.00
IA: Corn NE: Soybeans KS: Wheat
$/m
t
Figure 2. Land route shipment costs ($/mt) to Guadalajara, Mexico
Total=$425.24
Total=$211.34Total=$217.76
Rail$91.23
Truck$4.91 Truck
$4.91
Source: USDA, Agricultural Marketing Service

March 1, 2018
Grain Transportation Report 4
Grain Transportation Indicators
The grain bid summary illustrates the market relationships for commodities. Positive and negative adjustments in differential be-
tween terminal and futures markets, and the relationship to inland market points, are indicators of changes in fundamental market
supply and demand. The map may be used to monitor market and time differentials.
Table 1
Grain Transport Cost Indicators1
Truck Barge Ocean
For the week ending Unit Train Shuttle Gulf Pacific
02/28/18 202 273 259 217 197 168-1% # DIV/0 ! 3 % 2 % 2 %
02/21/18 203 273 235 211 192 165
Source: Transportation & Marketing Programs/AMS/USDA
Rail
1Indicator: Base year 2000 = 100; Weekly updates include truck = diesel ($/gallon); rail = near-month secondary rail market bid and
monthly tariff rate with fuel surcharge ($/car); barge = Illinois River barge rate (index = percent of tariff rate); and ocean = routes to Japan ($/metric ton)
Table 2
Market Update: U.S. Origins to Export Position Price Spreads ($/bushel)
Commodity Origin--Destination 2/23/2018 2/16/2018
Corn IL--Gulf -0.73 -0.70
Corn NE--Gulf -0.86 -0.82
Soybean IA--Gulf -1.16 -1.12
HRW KS--Gulf -2.45 -2.40
HRS ND--Portland -1.76 -1.83
Note: nq = no quote; n/a = not available
Source: Transportation & Marketing Programs/AMS/USDA
Figure 1 Grain Bid Summary

March 1, 2018
Grain Transportation Report 5
Rail Transportation
Railroads originate approximately 24 percent of U.S. grain shipments. Trends in these loadings are indicative of
market conditions and expectations.
Figure 2
Rail Deliveries to Port
0
1,000
2,000
3,000
4,000
5,000
6,000
7,000
8,000
9,000
10,000
07
/03
/13
08
/28
/13
10/2
3/1
3
12
/18
/13
02/1
2/1
4
04
/09
/14
06
/04
/14
07/3
0/1
4
09
/24
/14
11/1
9/1
4
01
/14
/15
03
/11
/15
05/0
6/1
5
07
/01
/15
08/2
6/1
5
10
/21
/15
12
/16
/15
02
/10
/16
04
/06
/16
06/0
1/1
6
07
/27
/16
09
/21
/16
11
/16
/16
01
/11
/17
03/0
8/1
7
05
/03
/17
06
/28
/17
08
/23
/17
10
/18
/17
12/1
3/1
7
02
/07
/18
04/0
4/1
8
05
/30
/18
Ca
rlo
ad
s -
4-w
eek
runnin
g
avera
ge
Pacific Northwest: 4 wks. ending 2/21--up 3% from same period last year; up 11% from 4-year average
Texas Gulf: 4 wks. ending 2/21--down 27% from same period last year; down 7% from the 4-year average
Miss. River: 4 wks. ending 2/21--down 51% from same period last year; down 53% from 4-year average
Cross-border: 4 wks. ending 2/17--down 13% from same period last year; unchanged from the 4-year average
Source: Transportation & Marketing Programs/AMS/USDA
Table 3
Rail Deliveries to Port (carloads)1
Mississippi Pacific Atlantic & Cross-Border
For the Week Ending Gulf Texas Gulf Northwest East Gulf Total Week ending Mexico3
02/21/2018p
212 1,026 4,807 258 7,983 2/17/2018 2,292
02/14/2018r
420 1,516 6,087 371 8,394 2/10/2018 1,461
2018 YTDr
4,086 11,787 49,442 2,117 67,432 2018 YTD 14,362
2017 YTDr
6,536 15,327 48,339 5,997 76,199 2017 YTD 16,482
2018 YTD as % of 2017 YTD 63 77 102 35 88 % change YTD 87
Last 4 weeks as % of 20172
49 73 103 48 89 Last 4wks % 2017 87
Last 4 weeks as % of 4-year avg.2
47 93 111 40 96 Last 4wks % 4 yr 100
Total 2017 28,766 76,045 289,178 21,999 415,988 Total 2017 119,661
Total 2016 36,925 87,863 299,606 29,007 453,401 Total 2016 92,9821
Data is incomplete as it is voluntarily provided2 Compared with same 4-weeks in 2017 and prior 4-year average.
3 Cross-border weekly data is approximately 15 percent below the Association of American Railroads' reported weekly carloads received by Mexican railroads
to reflect switching between KCSM and Grupo Mexico.
YTD = year-to-date; p = preliminary data; r = revised data; n/a = not available
Source: Transportation & Marketing Programs/AMS/USDA

March 1, 2018
Grain Transportation Report 6
Table 4
Class I Rail Carrier Grain Car Bulletin (grain carloads originated)
For the week ending:
2/17/2018 CSXT NS BNSF KCS UP CN CP
This week 1,980 2,248 11,204 1,081 4,982 21,495 2,491 4,783
This week last year 1,780 2,146 11,903 1,059 5,923 22,811 3,680 4,447
2018 YTD 12,747 16,708 80,724 6,948 35,486 152,613 23,382 30,126
2017 YTD 14,291 20,170 78,392 7,386 42,049 162,288 26,230 29,599
2018 YTD as % of 2017 YTD 89 83 103 94 84 94 89 102
Last 4 weeks as % of 2017* 86 87 106 95 84 96 82 98
Last 4 weeks as % of 3-yr avg.** 84 81 106 110 88 96 84 100
Total 2017 89,465 142,827 578,964 50,223 289,574 1,151,053 198,756 244,766
*The past 4 weeks of this year as a percent of the same 4 weeks last year.
**The past 4 weeks as a percent of the same period from the prior 3-year average. YTD = year-to-date.
Source: Association of American Railroads (www.aar.org)
East WestU.S. total
Canada
Table 5
Railcar Auction Offerings1
($/car)2
Mar-18 Mar-17 Apr-18 Apr-17 May-18 May-17 Jun-18 Jun-17
COT grain units 0 62 0 5 0 0 0 0
COT grain single-car5 65 119 0 no bids no bids 31 no bids 12
GCAS/Region 1 no bids no offer 10 no bids no bids no bids n/a n/a
GCAS/Region 2 10 no offer no bids 11 no bids no offer n/a n/a
1Au ction offerin g s are for s in g le-car an d u n it train s h ip m en ts on ly.
2Averag e p rem iu m /d is cou n t to tariff, las t au ction
3BNS F - COT = Certificate of Tran s p ortation ; n orth g rain an d s ou th g rain b id s were com b in ed effective th e week en d in g 6/24/06.
4UP - GCAS = Grain Car Allocation S ys tem
Reg ion 1 in clu d es : AR, IL, LA, MO, NM, OK, TX, W I, an d Du lu th , MN.
Reg ion 2 in clu d es : CO, IA, KS , MN, NE, W Y, an d Kan s as City an d S t. J os ep h , MO.
5Ran g e is s h own b ecau s e averag e is n ot availab le . Not availab le = n /a .
S ou rce: Tran s p ortation & Marketin g P rog ram s /AMS /US DA.
UP4
Delivery period
BNSF3
For the week ending:
2/22/2018
Figure 3
Total Weekly U.S. Class I Railroad Grain Car Loadings
15,000
17,000
19,000
21,000
23,000
25,000
27,000
29,000
Car
load
s
Prior 3-year, 4-week average Current 4-week average
For the 4 weeks ending February 17, grain carloadings were down 2 percent from the previous week, down 4 percent from last year, and down 4 percent from the 3-year average.
Source: Association of American Railroads

March 1, 2018
Grain Transportation Report 7
The secondary rail market information reflects trade values for service that was originally purchased from the railroad carrier as some form of guaranteed freight. The auction and secondary rail values are indicators of rail service quality and demand/supply.
Figure 4
Bids/Offers for Railcars to be Delivered in March 2018, Secondary Market
-400
-200
0
200
400
600
800
1000
1200
7/2
7/2
01
7
8/1
0/2
017
8/2
4/2
01
7
9/7
/20
17
9/2
1/2
017
10/5
/2017
10/1
9/2
017
11/2
/2017
11/1
6/2
017
11/3
0/2
017
12/1
4/2
017
12/2
8/2
01
7
1/1
1/2
018
1/2
5/2
01
8
2/8
/20
18
2/2
2/2
01
8
3/8
/20
18
Av
era
ge p
rem
ium
/dis
co
un
t to
tari
ff
($/c
ar)
Shuttle Non-Shuttle
Shuttle prior 3-yr avg. (same week) Non-Shuttle prior 3-yr avg. (same week)2/22/2018
Non-shuttle bids include unit-train and single-car bids. n/a = not available.
Source: Transportation & Marketing Programs/AMS/USDA
n/a
UPBNSF
$1,550
n/a
$588Shuttle
Non-Shuttle
There were no Non-Shuttle bids/offers this week.Average Shuttle bids/offers rose $581 this week and are at the peak.
Figure 5
Bids/Offers for Railcars to be Delivered in April 2018, Secondary Market
-250
-200
-150
-100
-50
0
50
100
150
8/3
1/2
01
7
9/1
4/2
017
9/2
8/2
01
7
10/1
2/2
017
10/2
6/2
017
11/9
/2017
11/2
3/2
017
12/7
/2017
12/2
1/2
017
1/4
/20
18
1/1
8/2
018
2/1
/20
18
2/1
5/2
018
3/1
/20
18
3/1
5/2
018
3/2
9/2
01
8
4/1
2/2
018
Av
era
ge p
rem
ium
/dis
co
un
t to
tari
ff
($/c
ar)
Shuttle Non-Shuttle
Shuttle prior 3-yr avg. (same week) Non-Shuttle prior 3-yr avg. (same week)2/22/2018
Non-shuttle bids include unit-train and single-car bids. n/a = not available.
Source: Transportation & Marketing Programs/AMS/USDA
n/a
UPBNSF
n/a
n/a
$0Shuttle
Non-Shuttle
There were no Non-Shuttle bids/offers this week.There were no Shuttle bids/offers last week. Average Non-Shuttle bids/offers this week are at the peak.

March 1, 2018
Grain Transportation Report 8
Figure 6
Bids/Offers for Railcars to be Delivered in May 2018, Secondary Market
-400
-350
-300
-250
-200
-150
-100
-50
09
/28
/20
17
10/1
2/2
017
10/2
6/2
01
7
11
/9/2
01
7
11/2
3/2
017
12
/7/2
01
7
12/2
1/2
017
1/4
/2018
1/1
8/2
01
8
2/1
/2018
2/1
5/2
01
8
3/1
/201
8
3/1
5/2
01
8
3/2
9/2
01
8
4/1
2/2
01
8
4/2
6/2
01
8
5/1
0/2
01
8
Aver
age
pre
miu
m/d
isco
unt
to tar
iff
($/c
ar)
Shuttle Non-Shuttle
Shuttle prior 3-yr avg. (same week) Non-Shuttle prior 3-yr avg. (same week)2/22/2018
Non-shuttle bids include unit-train and single-car bids. n/a = not available.
Source: Transportation & Marketing Programs/AMS/USDA
n/a
UPBNSF
n/a
n/a
-$175Shuttle
Non-Shuttle
There were no Non-Shuttle bids/offers this week.There were no Shuttle bids/offers last week. Average Non-Shuttle bids/offers this week are $75 below the peak.
Table 6
Weekly Secondary Railcar Market ($/car)1
Mar-18 Apr-18 May-18 Jun-18 Jul-18 Aug-18
BNSF-GF n/a n/a n/a n/a n/a n/a
Change from last week n/a n/a n/a n/a n/a n/a
Change from same week 2017 n/a n/a n/a n/a n/a n/a
UP-Pool n/a n/a n/a n/a n/a n/a
Change from last week n/a n/a n/a n/a n/a n/a
Change from same week 2017 n/a n/a n/a n/a n/a n/a
BNSF-GF 1550 n/a n/a n/a n/a n/a
Change from last week 625 n/a n/a n/a n/a n/a
Change from same week 2017 (1150) n/a n/a n/a n/a n/a
UP-Pool 588 0 (175) n/a n/a n/a
Change from last week 538 n/a n/a n/a n/a n/a
Change from same week 2017 (288) (500) (275) n/a n/a n/a
1Averag e p rem iu m /d is cou n t to tariff, $/car-las t week
Note: Bid s lis ted are m arket INDICATORS on ly & are NOT g u aran teed p rices ,
n /a = n ot availab le; GF = g u aran teed freig h t; P ool = g u aran teed p ool
S ou rces : Tran s p ortation an d Marketin g P rog ram s /AMS /US DA
Data from J am es B. J oin er Co., Trad ewes t Brokerag e Co.
Non
-sh
utt
le
For the week ending:
2/22/2018
Sh
utt
le
Delivery period
March 1, 2018
Grain Transportation Report 9
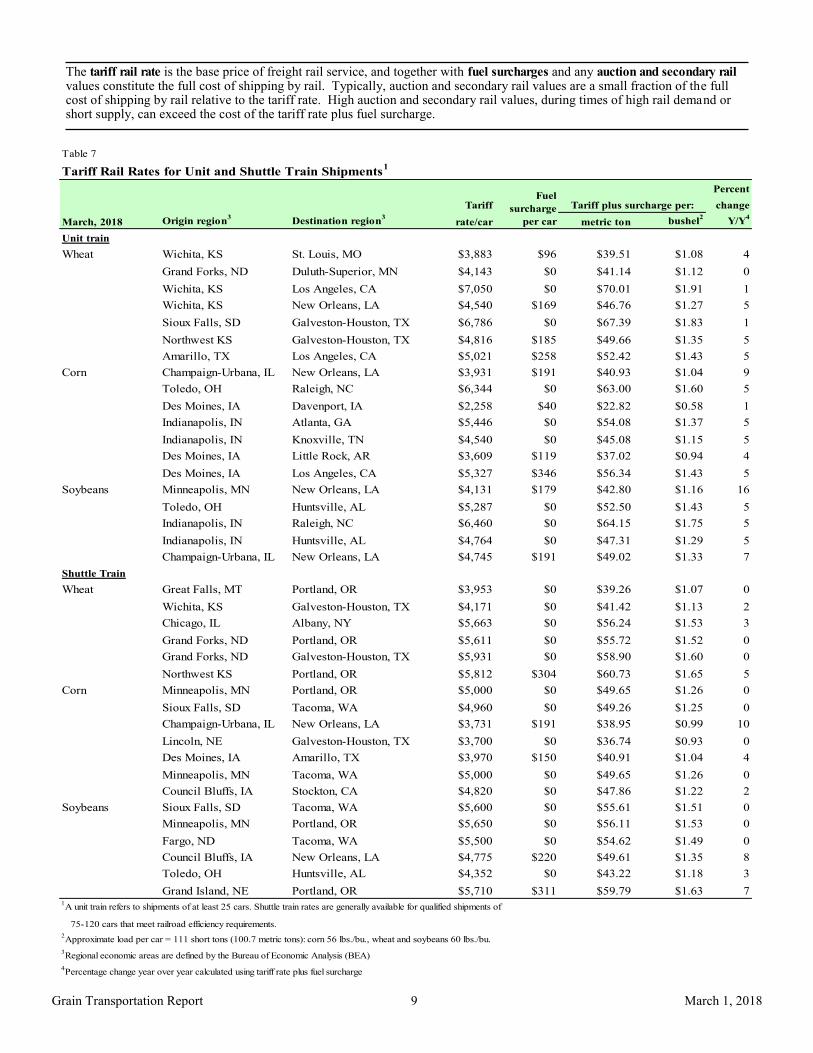
The tariff rail rate is the base price of freight rail service, and together with fuel surcharges and any auction and secondary rail values constitute the full cost of shipping by rail. Typically, auction and secondary rail values are a small fraction of the full cost of shipping by rail relative to the tariff rate. High auction and secondary rail values, during times of high rail demand or short supply, can exceed the cost of the tariff rate plus fuel surcharge.
Table 7
Tariff Rail Rates for Unit and Shuttle Train Shipments1
Percent
Tariff change
March, 2018 Origin region3
Destination region3
rate/car metric ton bushel2
Y/Y4
Unit train
Wheat Wichita, KS St. Louis, MO $3,883 $96 $39.51 $1.08 4
Grand Forks, ND Duluth-Superior, MN $4,143 $0 $41.14 $1.12 0
Wichita, KS Los Angeles, CA $7,050 $0 $70.01 $1.91 1
Wichita, KS New Orleans, LA $4,540 $169 $46.76 $1.27 5
Sioux Falls, SD Galveston-Houston, TX $6,786 $0 $67.39 $1.83 1
Northwest KS Galveston-Houston, TX $4,816 $185 $49.66 $1.35 5
Amarillo, TX Los Angeles, CA $5,021 $258 $52.42 $1.43 5
Corn Champaign-Urbana, IL New Orleans, LA $3,931 $191 $40.93 $1.04 9
Toledo, OH Raleigh, NC $6,344 $0 $63.00 $1.60 5
Des Moines, IA Davenport, IA $2,258 $40 $22.82 $0.58 1
Indianapolis, IN Atlanta, GA $5,446 $0 $54.08 $1.37 5
Indianapolis, IN Knoxville, TN $4,540 $0 $45.08 $1.15 5
Des Moines, IA Little Rock, AR $3,609 $119 $37.02 $0.94 4
Des Moines, IA Los Angeles, CA $5,327 $346 $56.34 $1.43 5
Soybeans Minneapolis, MN New Orleans, LA $4,131 $179 $42.80 $1.16 16
Toledo, OH Huntsville, AL $5,287 $0 $52.50 $1.43 5
Indianapolis, IN Raleigh, NC $6,460 $0 $64.15 $1.75 5
Indianapolis, IN Huntsville, AL $4,764 $0 $47.31 $1.29 5
Champaign-Urbana, IL New Orleans, LA $4,745 $191 $49.02 $1.33 7
Shuttle Train
Wheat Great Falls, MT Portland, OR $3,953 $0 $39.26 $1.07 0
Wichita, KS Galveston-Houston, TX $4,171 $0 $41.42 $1.13 2
Chicago, IL Albany, NY $5,663 $0 $56.24 $1.53 3
Grand Forks, ND Portland, OR $5,611 $0 $55.72 $1.52 0
Grand Forks, ND Galveston-Houston, TX $5,931 $0 $58.90 $1.60 0
Northwest KS Portland, OR $5,812 $304 $60.73 $1.65 5
Corn Minneapolis, MN Portland, OR $5,000 $0 $49.65 $1.26 0
Sioux Falls, SD Tacoma, WA $4,960 $0 $49.26 $1.25 0
Champaign-Urbana, IL New Orleans, LA $3,731 $191 $38.95 $0.99 10
Lincoln, NE Galveston-Houston, TX $3,700 $0 $36.74 $0.93 0
Des Moines, IA Amarillo, TX $3,970 $150 $40.91 $1.04 4
Minneapolis, MN Tacoma, WA $5,000 $0 $49.65 $1.26 0
Council Bluffs, IA Stockton, CA $4,820 $0 $47.86 $1.22 2
Soybeans Sioux Falls, SD Tacoma, WA $5,600 $0 $55.61 $1.51 0
Minneapolis, MN Portland, OR $5,650 $0 $56.11 $1.53 0
Fargo, ND Tacoma, WA $5,500 $0 $54.62 $1.49 0
Council Bluffs, IA New Orleans, LA $4,775 $220 $49.61 $1.35 8
Toledo, OH Huntsville, AL $4,352 $0 $43.22 $1.18 3
Grand Island, NE Portland, OR $5,710 $311 $59.79 $1.63 71A unit train refers to shipments of at least 25 cars. Shuttle train rates are generally available for qualified shipments of
75-120 cars that meet railroad efficiency requirements.
2Approximate load per car = 111 short tons (100.7 metric tons): corn 56 lbs./bu., wheat and soybeans 60 lbs./bu.
3Regional economic areas are defined by the Bureau of Economic Analysis (BEA)
4Percentage change year over year calculated using tariff rate plus fuel surcharge
Tariff plus surcharge per:Fuel
surcharge
per car

March 1, 2018
Grain Transportation Report 10
Figure 7
Railroad Fuel Surcharges, North American Weighted Average1
-$0.10
$0.00
$0.10
$0.20
$0.30
$0.40
$0.50
$0.60
$0.70
Dolla
rs p
er r
ailc
ar m
ile
3-Year Monthly Average
Fuel Surcharge* ($/mile/railcar)
March, 2018: $0.13, up 1 cent from last month's surcharge of $0.12/mile; up 8 cents from the March 2017 surcharge of $0.05/mile; and up 8 cents from the March prior 3-year average of $0.05/mile.
1 Weighted by each Class I railroad's proportion of grain traffic for the prior year. * Beginning January 2009, the Canadian Pacific fuel surcharge is computed by a monthly average of the bi-weekly fuel surcharge.
**CSX strike price changed from $2.00/gal. to $3.75/gal. starting January 1, 2015.Sources: www.bnsf.com, www.cn.ca, www.cpr.ca, www.csx.com, www.kcsi.com, www.nscorp.com, www.uprr.com
Table 8
Tariff Rail Rates for U.S. Bulk Grain Shipments to Mexico
Date: Percent
Tariff change4
Commodity Destination region rate/car1
metric ton3
bushel3
Y/Y
Wheat MT Chihuahua, CI $7,459 $0 $76.21 $2.07 0
OK Cuautitlan, EM $6,631 $132 $69.10 $1.88 1
KS Guadalajara, JA $7,309 $311 $77.85 $2.12 2
TX Salinas Victoria, NL $4,292 $80 $44.67 $1.21 2
Corn IA Guadalajara, JA $8,313 $284 $87.85 $2.23 2
SD Celaya, GJ $7,700 $0 $78.68 $2.00 2
NE Queretaro, QA $8,013 $271 $84.64 $2.15 3
SD Salinas Victoria, NL $6,743 $0 $68.90 $1.75 2
MO Tlalnepantla, EM $7,379 $264 $78.09 $1.98 3
SD Torreon, CU $7,300 $0 $74.59 $1.89 2
Soybeans MO Bojay (Tula), HG $8,134 $265 $85.81 $2.33 -5
NE Guadalajara, JA $8,692 $290 $91.76 $2.49 -2
IA El Castillo, JA $8,960 $0 $91.55 $2.49 0
KS Torreon, CU $7,489 $214 $78.70 $2.14 1
Sorghum NE Celaya, GJ $7,345 $264 $77.74 $1.97 3
KS Queretaro, QA $7,819 $165 $81.58 $2.07 4
NE Salinas Victoria, NL $6,452 $133 $67.28 $1.71 5
NE Torreon, CU $6,790 $207 $71.48 $1.81 41Rates are based upon published tariff rates for high-capacity shuttle trains. Shuttle trains are available for qualified
shipments of 75--110 cars that meet railroad efficiency requirements.2Fuel surcharge adjusted to reflect the change in Ferrocarril Mexicano, S.A. de C.V railroad fuel surcharge policy as of 10/01/2009
3Approximate load per car = 97.87 metric tons: Corn & Sorghum 56 lbs/bu, Wheat & Soybeans 60 lbs/bu
4Percentage change calculated using tariff rate plus fuel surchage
Sources: www.bnsf.com, www.uprr.com, www.kcsouthern.com
Fuel
surcharge
per car2
Tariff plus surcharge per:Origin
state
March, 2018

March 1, 2018
Grain Transportation Report 11
Barge Transportation
Figure 9 Benchmark tariff rates Calculating barge rate per ton: (Rate * 1976 tariff benchmark rate per ton)/100
Select applicable index from market quotes included in tables on this page. The 1976 benchmark rates per ton are provided in map.
Twin Cities 6.19
Mid-Mississippi 5.32
St. Louis 3.99
Cairo-Memphis 3.14
Illinois 4.64 Cincinnati 4.69
Lower Ohio 4.04
Figure 8
Illinois River Barge Freight Rate1,2
1Rate = percent of 1976 tariff benchmark index (1976 = 100 percent);
24-week moving average of the 3-year average.
Source: Transportation & Marketing Programs/AMS/USDA
0
200
400
600
800
1000
12000
2/2
8/1
7
03/1
4/1
7
03/2
8/1
7
04/1
1/1
7
04/2
5/1
7
05/0
9/1
7
05/2
3/1
7
06/0
6/1
7
06/2
0/1
7
07/0
4/1
7
07/1
8/1
7
08/0
1/1
7
08/1
5/1
7
08/2
9/1
7
09/1
2/1
7
09/2
6/1
7
10/1
0/1
7
10/2
4/1
7
11/0
7/1
7
11/2
1/1
7
12/0
5/1
7
12/1
9/1
7
01/0
2/1
8
01/1
6/1
8
01/3
0/1
8
02/1
3/1
8
02/2
7/1
8
Perc
en
t o
f ta
riff
Weekly rate
3-year avg. forthe week
For the week ending February 27: 3 percent higher than last week, 27 percent higher than last year, and 18 percent higher than the 3-year average.
Table 9
Weekly Barge Freight Rates: Southbound Only
Twin
Cities
Mid-
Mississippi
Lower
Illinois
River St. Louis Cincinnati
Lower
Ohio
Cairo-
Memphis
Rate1
2/27/2018 - - 390 297 - - 244
2/20/2018 - - 380 293 325 325 220
$/ton 2/27/2018 - - 18.10 11.85 - - 7.66
2/20/2018 - - 17.63 11.69 15.24 13.13 6.91
Current week % change from the same week:
Last year - - 27 40 - - 34
3-year avg. 2
- - 18 32 - - 28-2 6 6
Rate1
March - 392 388 296 - - 239
May 422 369 353 271 288 288 234
Source: Transportation & Marketing Programs/AMS/USDA
1Rate = percent of 1976 tariff benchmark index (1976 = 100 percent);
24-week moving average; ton = 2,000 pounds; "-" = closed

March 1, 2018
Grain Transportation Report 12
Figure 10
Barge Movements on the Mississippi River1 (Locks 27 - Granite City, IL)
1 The 3-year average is a 4-week moving average.
Source: U.S. Army Corps of Engineers
0
200
400
600
800
1,000
1,200
1,4000
2/2
5/1
7
03
/11
/17
03
/25
/17
04
/08
/17
04
/22
/17
05
/06
/17
05
/20
/17
06
/03
/17
06
/17
/17
07
/01
/17
07
/15
/17
07
/29
/17
08
/12
/17
08
/26
/17
09
/09
/17
09
/23
/17
10
/07
/17
10
/21
/17
11
/04
/17
11
/18
/17
12
/02
/17
12
/16
/17
12
/30
/17
01
/13
/18
01
/27
/18
02
/10
/18
02
/24
/18
03
/10
/18
1,0
00
to
ns
Soybeans
Wheat
Corn
3-Year Average
For the week ending February 24: no change from last year, and6 percent higher than the 3-yr avg.
Table 10
Barge Grain Movements (1,000 tons)
For the week ending 02/24/2018 Corn Wheat Soybeans Other Total
Mississippi River
Rock Island, IL (L15) 0 0 0 0 0
Winfield, MO (L25) 26 0 10 0 35
Alton, IL (L26) 201 5 67 2 273
Granite City, IL (L27) 210 6 74 2 292
Illinois River (L8) 213 8 75 0 296
Ohio River (L52) 66 4 29 0 98
Arkansas River (L1) 0 15 13 0 28
Weekly total - 2018 276 25 116 2 418
Weekly total - 2017 346 34 150 9 538
2018 YTD1
1,749 203 1,966 25 3,942
2017 YTD 2,752 269 2,369 117 5,507
2018 as % of 2017 YTD 64 76 83 21 72
Last 4 weeks as % of 20172
78 106 107 46 90
Total 2017 22,242 2,210 16,123 360 40,936
2 As a percent of same period in 2017.
Source: U.S. Army Corps of Engineers
Note: Total may not add exactly, due to rounding.
1 Weekly total, YTD (year-to-date) and calendar year total includes Miss/27, Ohio/52, and Ark/1; "Other" refers to oats, barley, sorghum, and rye.
March 1, 2018
Grain Transportation Report 13
Figure 12
Grain Barges for Export in New Orleans Region
Source: U.S. Army Corps of Engineers and GIPSA
0
200
400
600
800
1000
1200
11/5
/16
11/1
9/1
6
12/3
/16
12/1
7/1
6
12/3
1/1
6
1/1
4/1
7
1/2
8/1
7
2/1
1/1
7
2/2
5/1
7
3/1
1/1
7
3/2
5/1
7
4/8
/17
4/2
2/1
7
5/6
/17
5/2
0/1
7
6/3
/17
6/1
7/1
7
7/1
/17
7/1
5/1
7
7/2
9/1
7
8/1
2/1
7
8/2
6/1
7
9/9
/17
9/2
3/1
7
10/7
/17
10/2
1/1
7
11/4
/17
11/1
8/1
7
12/2
/17
12/1
6/1
7
12/3
0/1
7
1/1
3/1
8
1/2
7/1
8
2/1
0/1
8
2/2
4/1
8
Downbound Grain Barges Locks 27, 1, and 52
Grain Barges Unloaded in New Orleans
Nu
mb
er
of
ba
rge
s
For the week ending February 24: 264 grain barges moved down river, 27 percent lower than last week; 800 grain
barges were unloaded in New Orleans, 47 percent higher than the previous week.
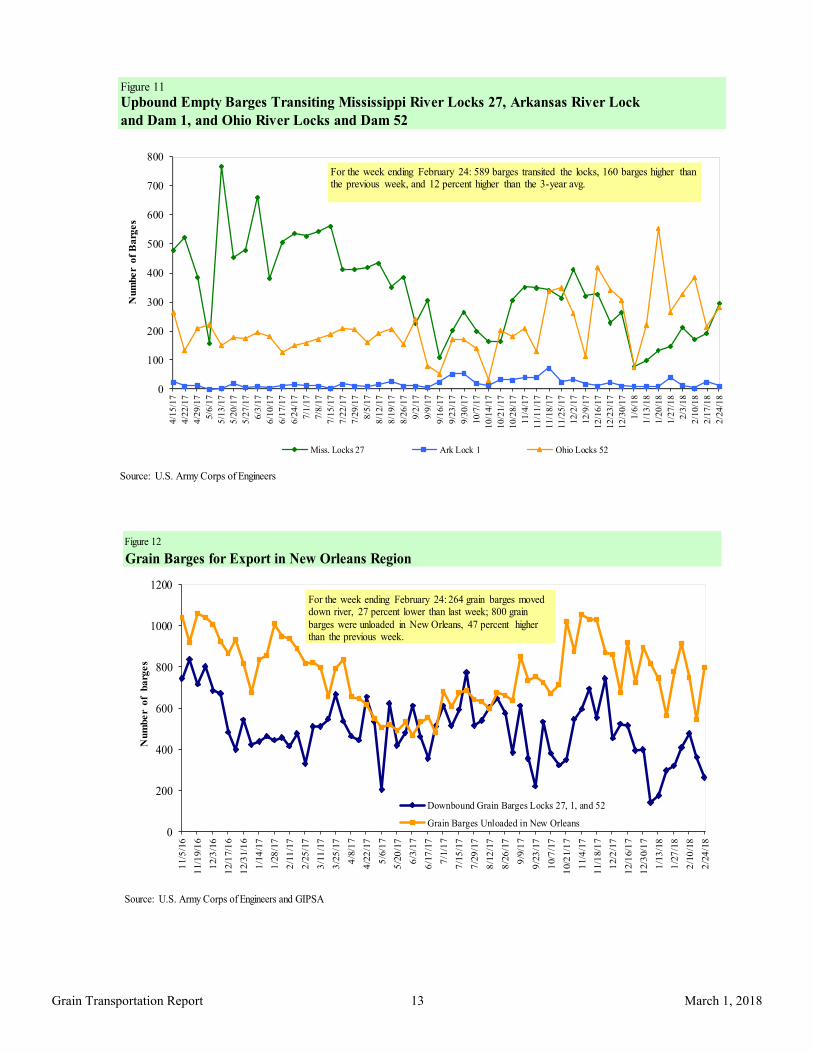
Figure 11
Source: U.S. Army Corps of Engineers
Upbound Empty Barges Transiting Mississippi River Locks 27, Arkansas River Lock
and Dam 1, and Ohio River Locks and Dam 52
0
100
200
300
400
500
600
700
800
4/1
5/1
7
4/2
2/1
7
4/2
9/1
7
5/6
/17
5/1
3/1
7
5/2
0/1
7
5/2
7/1
7
6/3
/17
6/1
0/1
7
6/1
7/1
7
6/2
4/1
7
7/1
/17
7/8
/17
7/1
5/1
7
7/2
2/1
7
7/2
9/1
7
8/5
/17
8/1
2/1
7
8/1
9/1
7
8/2
6/1
7
9/2
/17
9/9
/17
9/1
6/1
7
9/2
3/1
7
9/3
0/1
7
10/7
/17
10/1
4/1
7
10/2
1/1
7
10/2
8/1
7
11/4
/17
11/1
1/1
7
11/1
8/1
7
11/2
5/1
7
12/2
/17
12/9
/17
12/1
6/1
7
12/2
3/1
7
12/3
0/1
7
1/6
/18
1/1
3/1
8
1/2
0/1
8
1/2
7/1
8
2/3
/18
2/1
0/1
8
2/1
7/1
8
2/2
4/1
8
Num
ber
of
Barg
es
Miss. Locks 27 Ark Lock 1 Ohio Locks 52
For the week ending February 24: 589 barges transited the locks, 160 barges higher than the previous week, and 12 percent higher than the 3-year avg.
March 1, 2018
Grain Transportation Report 14
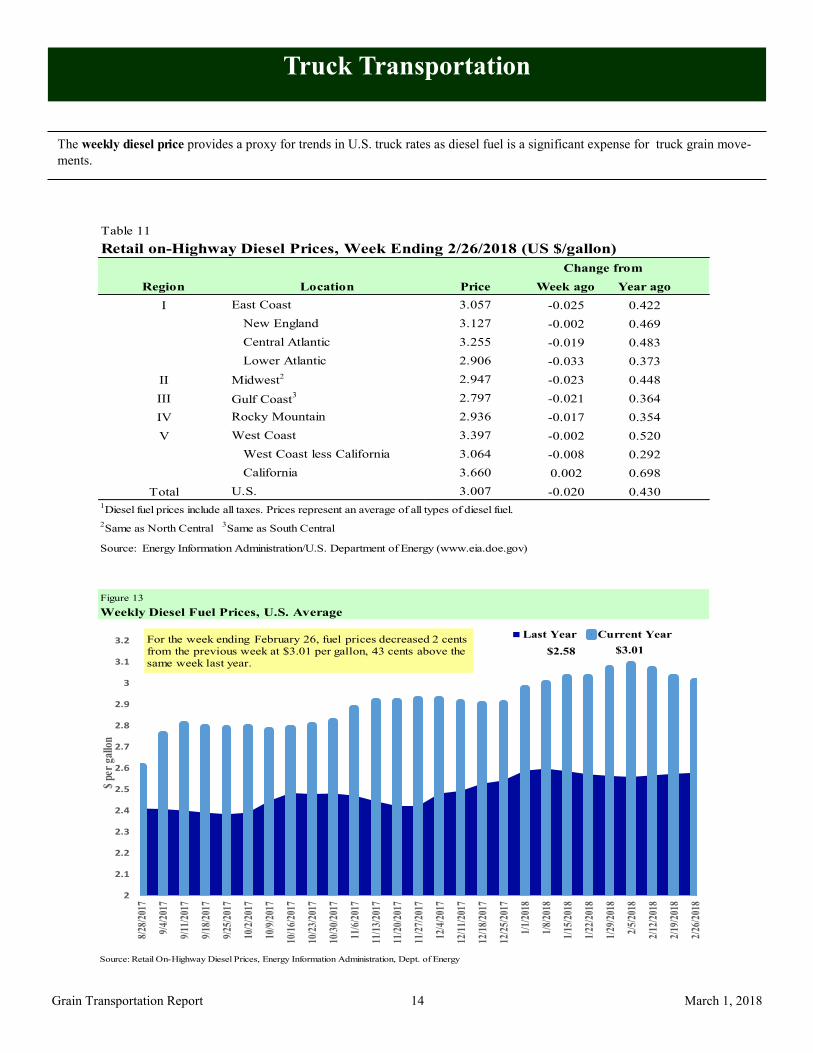
The weekly diesel price provides a proxy for trends in U.S. truck rates as diesel fuel is a significant expense for truck grain move-
ments.
Truck Transportation
Table 11
Change from
Region Location Price Week ago Year ago
I East Coast 3.057 -0.025 0.422
New England 3.127 -0.002 0.469
Central Atlantic 3.255 -0.019 0.483
Lower Atlantic 2.906 -0.033 0.373
II Midwest2 2.947 -0.023 0.448
III Gulf Coast3 2.797 -0.021 0.364
IV Rocky Mountain 2.936 -0.017 0.354
V West Coast 3.397 -0.002 0.520
West Coast less California 3.064 -0.008 0.292
California 3.660 0.002 0.698
Total U.S. 3.007 -0.020 0.4301Diesel fuel prices include all taxes. Prices represent an average of all types of diesel fuel.
2Same as North Central
3Same as South Central
Source: Energy Information Administration/U.S. Department of Energy (www.eia.doe.gov)
Retail on-Highway Diesel Prices, Week Ending 2/26/2018 (US $/gallon)
Figure 13
Weekly Diesel Fuel Prices, U.S. Average
Source: Retail On-Highway Diesel Prices, Energy Information Administration, Dept. of Energy
$2.58 $3.01
2
2.1
2.2
2.3
2.4
2.5
2.6
2.7
2.8
2.9
3
3.1
3.2
8/28
/201
7
9/4/
2017
9/11
/201
7
9/18
/201
7
9/25
/201
7
10/2
/201
7
10/9
/201
7
10/1
6/20
17
10/2
3/20
17
10/3
0/20
17
11/6
/201
7
11/1
3/20
17
11/2
0/20
17
11/2
7/20
17
12/4
/201
7
12/1
1/20
17
12/1
8/20
17
12/2
5/20
17
1/1/
2018
1/8/
2018
1/15
/201
8
1/22
/201
8
1/29
/201
8
2/5/
2018
2/12
/201
8
2/19
/201
8
2/26
/201
8
$ pe
r ga
llon
Last Year Current YearFor the week ending February 26, fuel prices decreased 2 cents
from the previous week at $3.01 per gallon, 43 cents above the
same week last year.

March 1, 2018
Grain Transportation Report 15
Grain Exports
Table 12
U.S. Export Balances and Cumulative Exports (1,000 metric tons)
Wheat Corn Soybeans Total
For the week ending HRW SRW HRS SWW DUR All wheat
Export Balances1
2/15/2018 1,636 647 1,493 956 78 4,810 21,063 7,770 33,642
This week year ago 2,306 564 2,437 1,414 111 6,833 19,458 9,569 35,860
Cumulative exports-marketing year 2
2017/18 YTD 6,971 1,511 4,140 3,739 273 16,635 16,489 36,943 70,067
2016/17 YTD 7,597 1,554 5,216 2,881 306 17,553 23,258 42,506 83,317
YTD 2017/18 as % of 2016/17 92 97 79 130 89 95 71 87 84
Last 4 wks as % of same period 2016/17 80 121 59 66 63 73 102 95 94
2016/17 Total 11,096 2,285 7,923 4,254 484 26,042 41,864 51,156 119,062
2015/16 Total 5,538 3,057 6,285 3,551 670 19,101 45,564 49,821 114,4861 Current unshipped (outstanding) export sales to date
2 Shipped export sales to date; new marketing year now in effect for wheat, corn, and soybeans
Note: YTD = year-to-date. Marketing Year: wheat = 6/01-5/31, corn & soybeans = 9/01-8/31
Source: Foreign Agricultural Service/USDA (www.fas.usda.gov)
Table 13
Top 5 Importers1 of U.S. Corn
For the week ending 2/15/2018 % change Exports3
2017/18 2016/17 current MY 3-year avg
Current MY Last MY from last MY 2014-2016
Mexico 10,729 10,551 2 12,297
Japan 6,199 7,745 (20) 11,450
Korea 2,227 3,505 (36) 4,494
Colombia 2,705 2,908 (7) 4,179
Peru 2,046 2,090 (2) 2,693
Top 5 Importers 23,905 26,799 (11) 35,113
Total US corn export sales 37,551 42,716 (12) 49,308
% of Projected 72% 73%
Change from prior week2
1,555 743
Top 5 importers' share of U.S. corn
export sales 64% 63% 71%
USDA forecast, February 2018 52,163 58,346 (11)
Corn Use for Ethanol USDA
forecast, February 2018 140,335 138,151 2
1Based on FAS Marketing Year Ranking Reports for 2016/17 - www.fas.usda.gov; Marketing year (MY) = Sep 1 - Aug 31.
Total Commitments2
3FAS Marketing Year Ranking Reports - http://apps.fas.usda.gov/export-sales/myrkaug.htm; 3-yr average
2Cumulative Exports (shipped) + Outstanding Sales (unshipped), FAS Weekly Export Sales Report, or Export Sales Query--
http://www.fas.usda.gov/esrquery/. Total commitments change (net sales) from prior week could include revisions from previous week's outstanding sales
or accumulated sales.

March 1, 2018
Grain Transportation Report 16
Table 14
Top 5 Importers1 of U.S. Soybeans
For the week ending 2/15/2018 % change
Exports3
2017/18 2016/17 current MY 3-yr avg.
Current MY Last MY from last MY 2014-2016
- 1,000 mt - - 1,000 mt -
China 26,201 34,051 (23) 31,881
Mexico 2,850 2,769 3 3,452
Indonesia 1,255 1,321 (5) 1,987
Japan 1,495 1,584 (6) 2,067
Netherlands 916 1,105 (17) 2,098
Top 5 importers 32,717 40,830 (20) 41,486
Total US soybean export sales 44,713 52,075 (14) 52,919
% of Projected 78% 88%
Change from prior week2
(109) 337
Top 5 importers' share of U.S.
soybean export sales 73% 78% 78%
USDA forecast, February 2018 57,221 59,237 97
1Bas ed on FAS Marketin g Year Ran kin g Rep orts for 2016/17 - www.fas .u s d a.g ov; Marketin g year (MY) = S ep 1 - Au g 31.
3 FAS Marketin g Year Fin al Rep orts - www.fas .u s d a.g ov/exp ort-s ales /m yfi_rp t.h tm . (Carryover p lu s Accu m u lated Exp orts )
(n) indicates negative number.
2Cu m u lative Exp orts (s h ip p ed ) + Ou ts tan d in g S ales (u n s h ip p ed ), FAS W eekly Exp ort S ales Rep ort, or Exp ort S ales Qu ery--h ttp ://www.fas .u s d a.g ov/es rq u ery/. Th e total com m itm en ts ch an g e
(n et s ales ) from p rior week cou ld in clu d e reivis ion s from p reviou s week's ou ts tan d in g s ales an d /or accu m u lated s ales
Total Commitments2
Table 15
Top 10 Importers1 of All U.S. Wheat
For the week ending 2/15/2018 % change Exports3
2017/18 2016/17 current MY 3-yr avg
Current MY Last MY from last MY 2014-2016
- 1,000 mt -
Japan 2,563 2,266 13 2,620
Mexico 2,669 2,640 1 2,743
Philippines 2,422 2,270 7 2,395
Brazil 111 1,126 (90) 862
Nigeria 1,051 1,258 (16) 1,254
Korea 1,313 1,190 10 1,104
China 890 1,061 (16) 1,623
Taiwan 1,008 889 13 768
Indonesia 1,163 848 37 726
Colombia 558 717 (22) 635
Top 10 importers 13,748 14,265 (4) 14,729
Total US wheat export sales 21,444 24,386 (12) 22,804
% of Projected 83% 85%
Change from prior week2
329 451
Top 10 importers' share of U.S.
wheat export sales 64% 58% 65%
USDA forecast, February 2018 25,886 28,747 (10)
1 Based on FAS Marketing Year Ranking Reports for 2016/17 - www.fas.usda.gov; Marketing year = Jun 1 - May 31.
outstanding and/or accumulated sales
Total Commitments2
3 FAS Marketing Year Final Reports - www.fas.usda.gov/export-sales/myfi_rpt.htm.
(n) indicates negative number.
2 Cumulative Exports (shipped) + Outstanding Sales (unshipped), FAS Weekly Export Sales Report, or Export Sales Query--http://www.fas.usda.gov/esrquery/. Total
commitments change (net sales) from prior week could include revisions from the previous week's
- 1,000 mt -

March 1, 2018
Grain Transportation Report 17
The United States exports approximately one-quarter of the grain it produces. On average, this includes nearly 45 percent of U.S.-grown wheat, 35 percent of U.S.-grown soybeans, and 20 percent of the U.S.-grown corn. Approximately 55 percent of the U.S. export grain ship-ments departed through the U.S. Gulf region in 2017.
Table 16
Grain Inspections for Export by U.S. Port Region (1,000 metric tons)
For the Week Ending Previous Current Week 2018 YTD as
02/22/18 Week1
as % of Previous 2017 YTD % of 2017 YTD Last Year Prior 3-yr. avg.
Pacific Northwest
Wheat 197 181 109 1,744 1,685 103 79 80 14,805
Corn 444 301 147 2,082 1,696 123 150 223 10,928
Soybeans 209 210 99 2,499 2,498 100 101 81 13,246
Total 850 693 123 6,325 5,879 108 107 108 38,978
Mississippi Gulf
Wheat 35 124 29 597 674 89 67 83 4,198
Corn 712 491 145 3,722 5,549 67 64 91 28,690
Soybeans 480 618 78 5,581 6,401 87 94 84 32,911
Total 1,227 1,232 100 9,900 12,624 78 77 87 65,800
Texas Gulf
Wheat 55 80 69 711 851 83 78 135 6,354
Corn 0 0 n/a 63 181 35 49 42 733
Soybeans 0 0 n/a 0 0 n/a n/a 0 292
Total 55 80 69 773 1,032 75 75 109 7,379
Interior
Wheat 7 62 11 234 292 80 113 143 1,727
Corn 128 130 98 1,029 1,037 99 96 116 8,733
Soybeans 93 112 83 821 862 95 97 109 5,496
Total 228 304 75 2,085 2,192 95 98 116 15,956
Great Lakes
Wheat 0 0 n/a 19 0 n/a n/a 0 711
Corn 0 0 n/a 0 0 n/a n/a n/a 192
Soybeans 0 0 n/a 0 0 n/a n/a n/a 890
Total 0 0 n/a 19 0 n/a n/a 0 1,793
Atlantic
Wheat 0 0 n/a 0 36 0 0 0 46
Corn 0 0 n/a 0 0 n/a n/a 0 32
Soybeans 20 72 27 366 506 72 130 83 1,996
Total 20 72 27 366 541 68 107 73 2,075
U.S. total from ports
Wheat 295 447 66 3,305 3,539 93 77 92 27,841
Corn 1,283 922 139 6,896 8,462 81 83 116 49,308
Soybeans 801 1,012 79 9,267 10,267 90 97 85 54,831
Total 2,379 2,381 100 19,468 22,268 87 88 96 131,9801 Data includes revisions from prior weeks; some regional and U.S. totals may not add exactly due to rounding.
Source: Grain Inspection, Packers and Stockyards Administration/USDA (www.gipsa.usda.gov); YTD= year-to-date; n/a = not applicable
Last 4-weeks as % of:
Port Regions 2017 Total2018 YTD
March 1, 2018
Grain Transportation Report 18
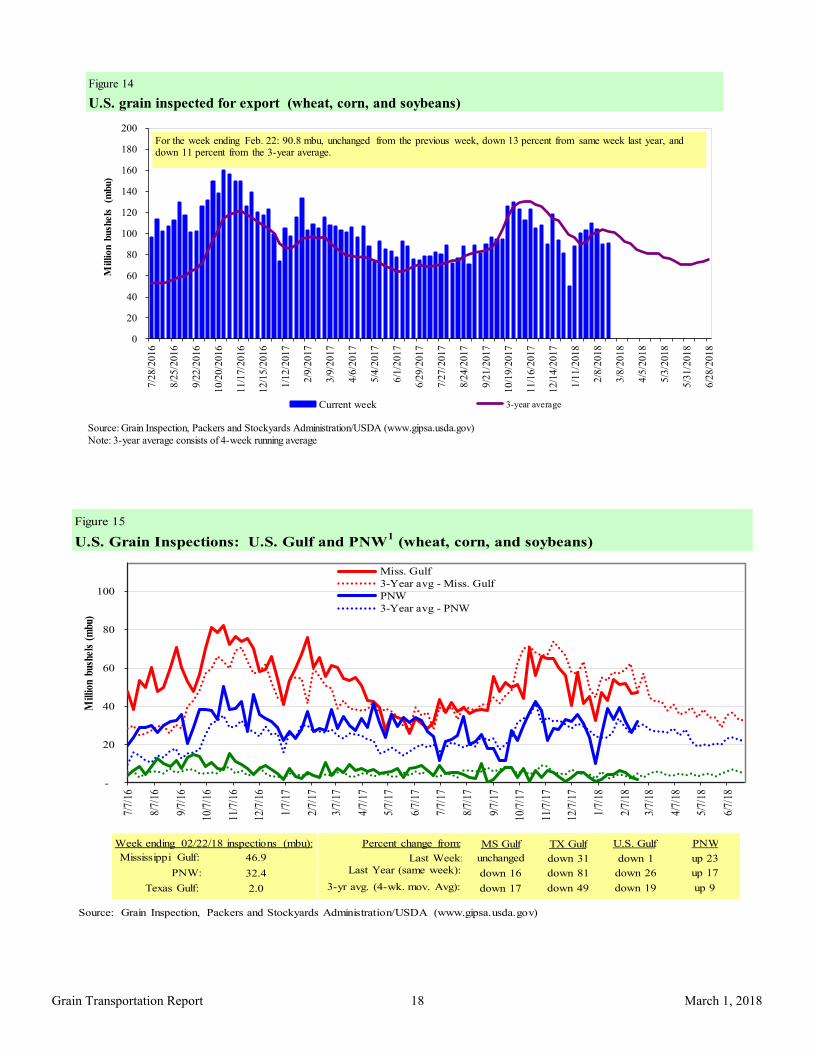
Figure 14
U.S. grain inspected for export (wheat, corn, and soybeans)
Source: Grain Inspection, Packers and Stockyards Administration/USDA (www.gipsa.usda.gov)
Note: 3-year average consists of 4-week running average
0
20
40
60
80
100
120
140
160
180
200
7/2
8/2
01
6
8/2
5/2
01
6
9/2
2/2
01
6
10
/20
/20
16
11
/17
/20
16
12
/15
/20
16
1/1
2/2
01
7
2/9
/20
17
3/9
/20
17
4/6
/20
17
5/4
/20
17
6/1
/20
17
6/2
9/2
01
7
7/2
7/2
01
7
8/2
4/2
01
7
9/2
1/2
01
7
10
/19
/20
17
11
/16
/20
17
12
/14
/20
17
1/1
1/2
01
8
2/8
/20
18
3/8
/20
18
4/5
/20
18
5/3
/20
18
5/3
1/2
01
8
6/2
8/2
01
8
Millio
n b
ush
els
(m
bu)
Current week 3-year average
For the week ending Feb. 22: 90.8 mbu, unchanged from the previous week, down 13 percent from same week last year, and down 11 percent from the 3-year average.
Figure 15
U.S. Grain Inspections: U.S. Gulf and PNW1 (wheat, corn, and soybeans)
-
20
40
60
80
100
7/7/
16
8/7/
16
9/7/
16
10/7
/16
11/7
/16
12/7
/16
1/7/
17
2/7/
17
3/7/
17
4/7/
17
5/7/
17
6/7/
17
7/7/
17
8/7/
17
9/7/
17
10/7
/17
11/7
/17
12/7
/17
1/7/
18
2/7/
18
3/7/
18
4/7/
18
5/7/
18
6/7/
18
Mill
ion
bush
els
(mbu
)
Miss. Gulf
3-Year avg - Miss. Gulf
PNW
3-Year avg - PNW
Source: Grain Inspection, Packers and Stockyards Administration/USDA (www.gipsa.usda.gov)
Last Week:
Last Year (same week):
3-yr avg. (4-wk. mov. Avg):
MS Gulf TX Gulf U.S. Gulf PNW
unchanged
down 16
down 17
down 31
down 81
down 49
down 1
down 26
down 19
up 23
up 17
up 9
Percent change from:Week ending 02/22/18 inspections (mbu):
Mississippi Gulf:
PNW:
Texas Gulf:
46.9
32.4
2.0

March 1, 2018
Grain Transportation Report 19
Ocean Transportation
Figure 16
U.S. Gulf Vessel Loading Activity
0
10
20
30
40
50
60
70
10/0
5/2
017
10/1
2/2
017
10/1
9/2
017
10/2
6/2
017
11/0
2/2
017
11/0
9/2
017
11/1
6/2
017
11/2
3/2
017
11/3
0/2
017
12/0
7/2
017
12/1
4/2
017
12/2
1/2
017
12/2
8/2
017
1/0
4/2
01
8
1/1
1/2
01
8
1/1
8/2
01
8
01/2
5/1
8
02/0
1/1
8
02/0
8/1
8
02/1
5/1
8
02/2
2/1
8
Nu
mb
er
of
vess
els
Loaded Last 7 Days Due Next 10 days Loaded 4 Year Average
Source:Transportation & Marketing Programs/AMS/USDA1U.S. Gulf includes Mississippi, Texas, and East Gulf.
For the week ending February 22 Loaded Due
Change from last year -27.5% -27.3%
Change from 4-year avg. -12.4% -13.8%
Table 17
Weekly Port Region Grain Ocean Vessel Activity (number of vessels)
Pacific
Gulf Northwest
Loaded Due next
Date In port 7-days 10-days In port
2/22/2018 68 37 56 19
2/15/2018 57 36 47 23
2017 range (25..66) (28..54) (37..87) (5..44)
2017 avg. 46 38 56 20
Source: Transportation & Marketing Programs/AMS/USDA

March 1, 2018
Grain Transportation Report 20
Figure 17
Grain Vessel Rates, U.S. to Japan
Data Source: O'Neil Commodity Consulting
0
5
10
15
20
25
30
35
40
45
50
Feb
. 16
Apr
. 16
June
16
Aug
. 16
Oct
. 16
Dec
. 16
Feb
. 17
Apr
. 17
June
17
Aug
. 17
Oct
. 17
Dec
. 17
Feb
. 18
US
$/m
etri
c to
n
Spread Gulf vs. PNW to Japan Rate Gulf to Japan Rate PNW to Japan
Gulf PNW Spread Ocean rates for February '18 $43.56 $23.94 $19.62
Change from February '17 21.6% 30.3% 12.6% Change from 4-year avg. 24.1% 26.9% 20.9%
Table 18
Ocean Freight Rates For Selected Shipments, Week Ending 02/24/2018
Export Import Grain Loading Volume loads Freight rate
region region types date (metric tons) (US$/metric ton)
U.S. Gulf China Heavy Grain Jan 1/10 60,000 45.50
U.S. Gulf China Heavy Grain Dec 15/20 60,000 44.00
U.S. Gulf China Heavy Grain Dec 10/20 60,000 43.25
U.S. Gulf China Heavy Grain Nov 27/Dec 5 47,700 40.50
U.S. Gulf China Heavy Grain Nov 20/30 66,000 41.25
U.S. Gulf China Heavy Grain Nov 20/30 66,000 42.00
U.S. Gulf China Heavy Grain Nov 15/25 65,000 43.85
U.S. Gulf China Heavy Grain Nov 10/20 66,000 43.75
U.S. Gulf Djibouti Sorghum Apr 10/20 5,000 136.11*
U.S. Gulf Djibouti Wheat Apr 10/20 34,000 136.11*
PNW Bangladesh Wheat Apr 6/16 43,500 46.61*
PNW China Heavy Grain Dec 23/30 60,000 22.25
PNW China Heavy Grain Dec 15/24 60,000 23.75
PNW South Korea Heavy Grain Dec 14/20 60,000 24.00
Brazil China Heavy Grain Mar 1/10 66,000 30.00
Brazil China Heavy Grain Dec 1/10 60,000 31.90
Brazil South Korea Heavy Grain Nov 22/29 63,000 33.25
France Morocco Heavy Grain Jan 6/12 30,000 15.00
Portugal China Heavy Grain Feb 10 65,000 38.00
Rates shown are per metric ton (2,204.62 lbs. = 1 metric ton), F.O.B., except where otherwise indicated; op = option *50 percent of food aid from the United States is required to be shipped on U.S.-flag vessels.
Source: Maritime Research Inc. (www.maritime-research.com)

March 1, 2018
Grain Transportation Report 21
In 2017, containers were used to transport 7 percent of total U.S. waterborne grain exports. Approximately 62 percent of U.S. wa-terborne grain exports in 2017 went to Asia, of which 10 percent were moved in containers. Approximately 93 percent of U.S. wa-terborne containerized grain exports were destined for Asia.
Figure 18
Top 10 Destination Markets for U.S. Containerized Grain Exports, January-December 2017
Source: USDA/Agricultural Marketing Service/Transportation Services Division analysis of Port Import Export Reporting Service (PIERS) data
Note: The following Harmonized Tariff Codes are used to calculate containerized grains movements: 100190, 100200, 100300, 100400, 100590,
100700, 110100, 230310, 110220, 110290, 120100, 230210, 230990, 230330, and 120810.
Taiwan19%
Indonesia17%
Thailand11%
China9% Korea
9%
Vietnam5%
Japan5%
Malaysia5%
Philippines2%
Bangladesh2%
Other16%
Figure 19
Monthly Shipments of Containerized Grain to Asia
Source: USDA/Agricultural Marketing Service/Transportation Services Division analysis of Port Import Export Reporting Service (PIERS) data.
Note: The following Harmonized Tariff Codes are used to calculate containerized grains movements: 100190, 100200, 100300, 100400, 100590, 100700, 110100, 110220,
110290, 120100, 120810, 230210, 230310, 230330, and 230990.
0
5
10
15
20
25
30
35
40
45
50
55
60
65
70
75
80
Jan.
Feb.
Mar.
Ap
r.
May
Jun.
Jul.
Au
g.
Sep.
Oct.
No
v.
Dec.
Thousa
nd 20
-ft
equiv
ale
nt
unit
s
2016
2017
5-year avg
Dec 2017: Up 9% from last year and 4% higher than the 5-year average

March 1, 2018
Grain Transportation Report 22
Coordinators Surajudeen (Deen) Olowolayemo [email protected] (202) 720 - 0119 Pierre Bahizi [email protected] (202) 690 - 0992 Adam Sparger [email protected] (202) 205 - 8701
Weekly Highlight Editors Surajudeen (Deen) Olowolayemo [email protected] (202) 720 - 0119 April Taylor [email protected] (202) 720 - 7880 Nicholas Marathon [email protected] (202) 690 - 4430
Grain Transportation Indicators Surajudeen (Deen) Olowolayemo [email protected] (202) 720 - 0119
Rail Transportation Adam Sparger [email protected] (202) 205 - 8701 Johnny Hill [email protected] (202) 690 - 3295 Jesse Gastelle [email protected] (202) 690 - 1144 Peter Caffarelli [email protected] (202) 690 - 3244
Barge Transportation Nicholas Marathon [email protected] (202) 690 - 4430 April Taylor [email protected] (202) 720 - 7880 Matt Chang [email protected] (202) 720 - 0299
Truck Transportation April Taylor [email protected] (202) 720 - 7880 Sergio Sotelo [email protected] (202) 756 - 2577
Grain Exports Johnny Hill [email protected] (202) 690 - 3295 Ocean Transportation Surajudeen (Deen) Olowolayemo [email protected] (202) 720 - 0119 (Freight rates and vessels) April Taylor [email protected] (202) 720 - 7880 (Container movements)
Subscription Information: Send relevant information to [email protected] for an electronic copy (printed copies are also available upon request).
Preferred citation: U.S. Dept. of Agriculture, Agricultural Marketing Service. Grain Transportation Report. March 1, 2018. Web: http://dx.doi.org/10.9752/TS056.03-01-2018
Contacts and Links
In accordance with Federal civil rights law and U.S. Department of Agriculture (USDA) civil rights regulations and policies, the USDA, its Agencies, offices, and employees, and institutions participating in or administering USDA programs are prohibited from discriminating based on race, color, national origin, religion, sex, gender identity (including gender expression), sexual orientation, disability, age, marital status, family/parental status, income derived from a public assistance program, political beliefs, or reprisal or retaliation for prior civil rights activity, in any program or activity conducted or funded by USDA (not all bases apply to all programs). Remedies and complaint filing deadlines vary by pro-gram or incident. Persons with disabilities who require alternative means of communication for program information (e.g., Braille, large print, audiotape, American Sign Language, etc.) should contact the responsible Agency or USDA's TARGET Center at (202) 720-2600 (voice and TTY) or contact USDA through the Federal Relay Service at (800) 877-8339. Additionally, program information may be made available in languages other than English. To file a program discrimination complaint, complete the USDA Program Discrimination Complaint Form, AD-3027, found online at How to File a Program Discrimination Complaint and at any USDA office or write a letter addressed to USDA and provide in the letter all of the infor-mation requested in the form. To request a copy of the complaint form, call (866) 632-9992. Submit your completed form or letter to USDA by: (1) mail: U.S. Department of Agriculture, Office of the Assistant Secretary for Civil Rights, 1400 Independence Avenue, SW, Washington, D.C. 20250-9410; (2) fax: (202) 690-7442; or (3) email: [email protected]. USDA is an equal opportunity provider, employer, and lender.