Clustering and mapper - INEGI · Clustering and mapper Andrew J. Blumberg...
45
Clustering and mapper Andrew J. Blumberg ([email protected]) June 17th, 2014 Andrew J. Blumberg ([email protected]) Clustering and mapper
Transcript of Clustering and mapper - INEGI · Clustering and mapper Andrew J. Blumberg...
Clustering and mapper
Andrew J. Blumberg ([email protected])
June 17th, 2014
Andrew J. Blumberg ([email protected]) Clustering and mapper
Overview
Goal of talk
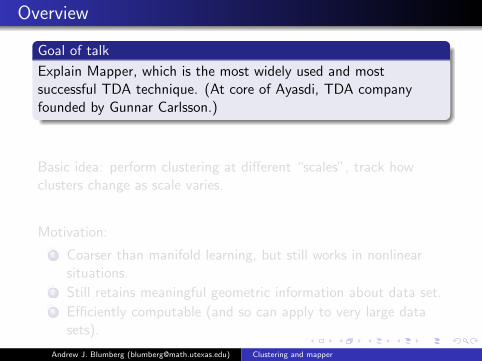
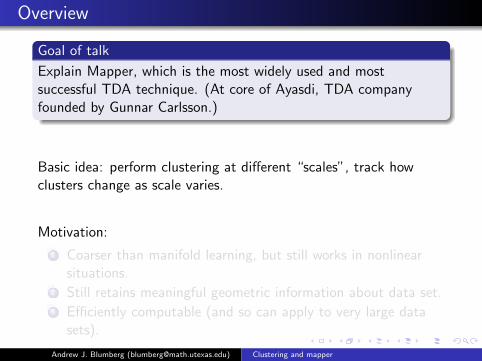
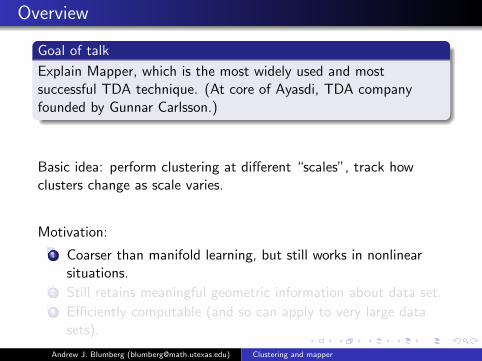
Explain Mapper, which is the most widely used and mostsuccessful TDA technique. (At core of Ayasdi, TDA companyfounded by Gunnar Carlsson.)
Basic idea: perform clustering at different “scales”, track howclusters change as scale varies.
Motivation:
1 Coarser than manifold learning, but still works in nonlinearsituations.
2 Still retains meaningful geometric information about data set.3 Efficiently computable (and so can apply to very large data
sets).
Andrew J. Blumberg ([email protected]) Clustering and mapper

Overview
Goal of talk
Explain Mapper, which is the most widely used and mostsuccessful TDA technique. (At core of Ayasdi, TDA companyfounded by Gunnar Carlsson.)
Basic idea: perform clustering at different “scales”, track howclusters change as scale varies.
Motivation:
1 Coarser than manifold learning, but still works in nonlinearsituations.
2 Still retains meaningful geometric information about data set.3 Efficiently computable (and so can apply to very large data
sets).
Andrew J. Blumberg ([email protected]) Clustering and mapper
Morse theory
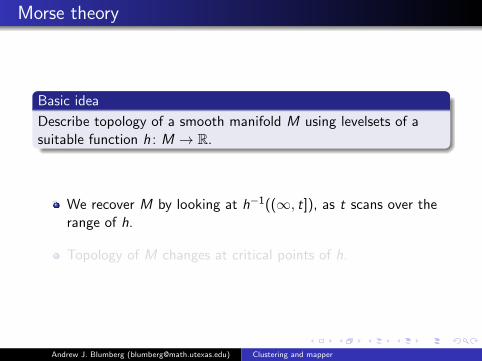
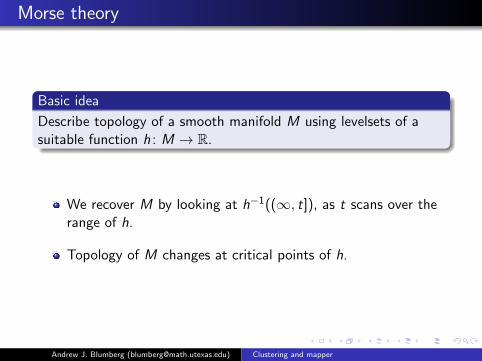
Basic idea
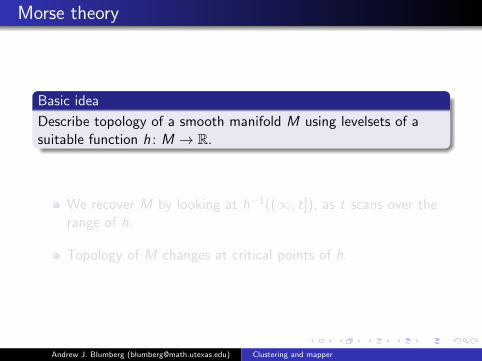
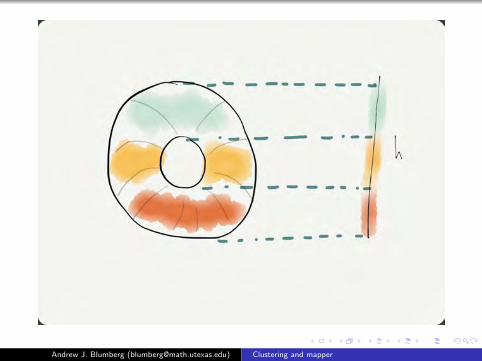
Describe topology of a smooth manifold M using levelsets of asuitable function h : M → R.
We recover M by looking at h−1((∞, t]), as t scans over therange of h.
Topology of M changes at critical points of h.
Andrew J. Blumberg ([email protected]) Clustering and mapper
Morse theory
Basic idea
Describe topology of a smooth manifold M using levelsets of asuitable function h : M → R.
We recover M by looking at h−1((∞, t]), as t scans over therange of h.
Topology of M changes at critical points of h.
Andrew J. Blumberg ([email protected]) Clustering and mapper
Morse theory
Basic idea
Describe topology of a smooth manifold M using levelsets of asuitable function h : M → R.
We recover M by looking at h−1((∞, t]), as t scans over therange of h.
Topology of M changes at critical points of h.
Andrew J. Blumberg ([email protected]) Clustering and mapper

Andrew J. Blumberg ([email protected]) Clustering and mapper
Andrew J. Blumberg ([email protected]) Clustering and mapper

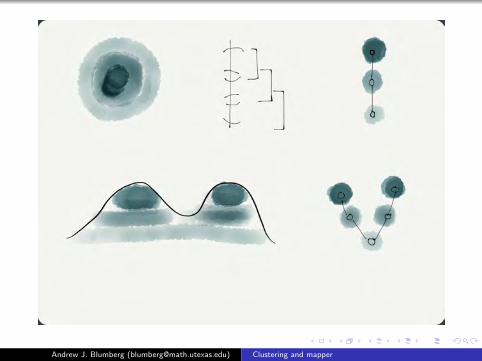
Reeb graphs
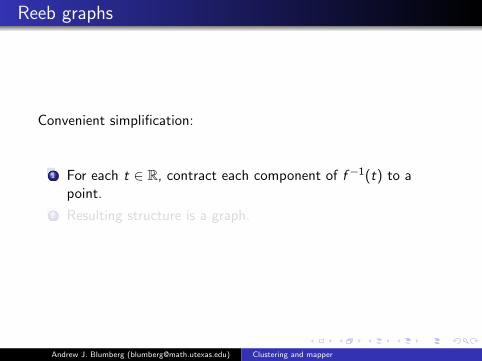
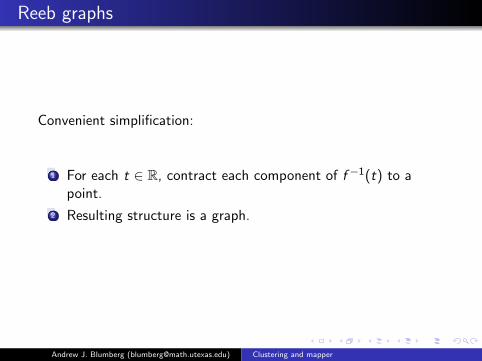
Convenient simplification:
1 For each t ∈ R, contract each component of f −1(t) to apoint.
2 Resulting structure is a graph.
Andrew J. Blumberg ([email protected]) Clustering and mapper
Reeb graphs
Convenient simplification:
1 For each t ∈ R, contract each component of f −1(t) to apoint.
2 Resulting structure is a graph.
Andrew J. Blumberg ([email protected]) Clustering and mapper
Reeb graphs
Convenient simplification:
1 For each t ∈ R, contract each component of f −1(t) to apoint.
2 Resulting structure is a graph.
Andrew J. Blumberg ([email protected]) Clustering and mapper

Andrew J. Blumberg ([email protected]) Clustering and mapper

Mapper
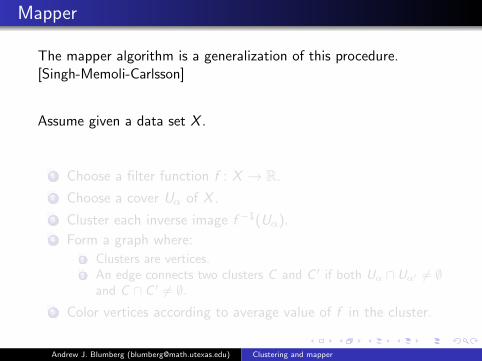
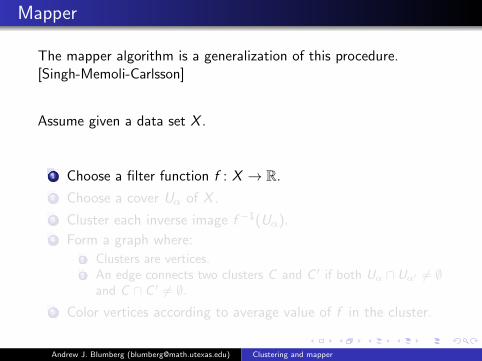
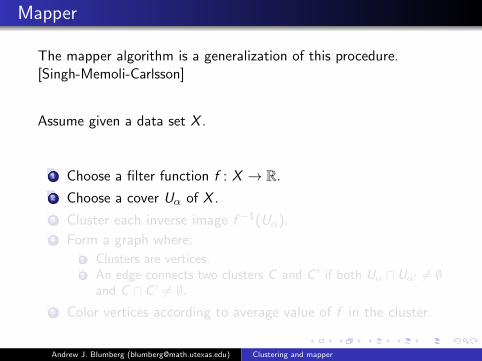
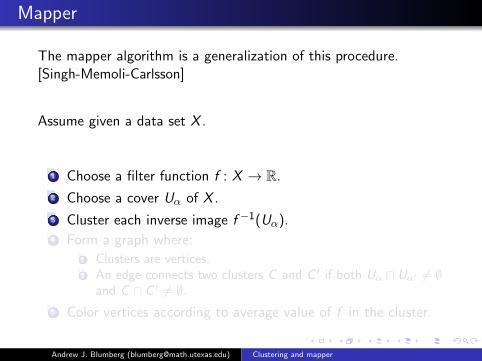
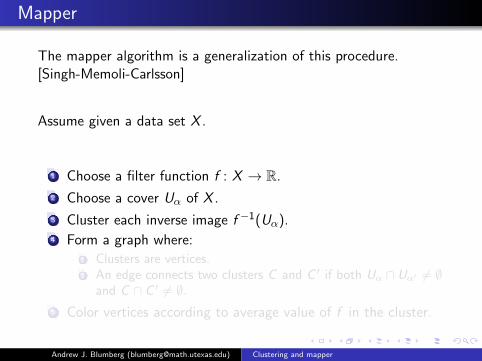
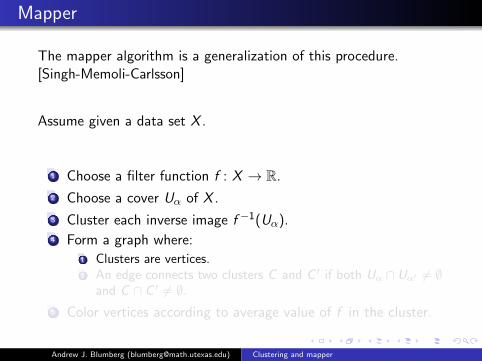
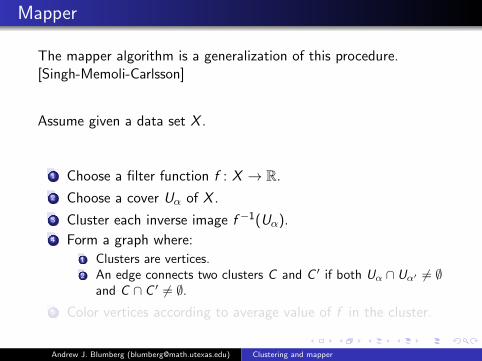
The mapper algorithm is a generalization of this procedure.[Singh-Memoli-Carlsson]
Assume given a data set X .
1 Choose a filter function f : X → R.
2 Choose a cover Uα of X .
3 Cluster each inverse image f −1(Uα).4 Form a graph where:
1 Clusters are vertices.2 An edge connects two clusters C and C ′ if both Uα ∩ Uα′ 6= ∅
and C ∩ C ′ 6= ∅.
5 Color vertices according to average value of f in the cluster.
Andrew J. Blumberg ([email protected]) Clustering and mapper
Mapper
The mapper algorithm is a generalization of this procedure.[Singh-Memoli-Carlsson]
Assume given a data set X .
1 Choose a filter function f : X → R.
2 Choose a cover Uα of X .
3 Cluster each inverse image f −1(Uα).4 Form a graph where:
1 Clusters are vertices.2 An edge connects two clusters C and C ′ if both Uα ∩ Uα′ 6= ∅
and C ∩ C ′ 6= ∅.
5 Color vertices according to average value of f in the cluster.
Andrew J. Blumberg ([email protected]) Clustering and mapper

Filter functions
Clearly, choice of filter function is essential.
Some kind of density measure.
A score measure difference (distance) from some baseline.
An eccentricity measure.
Andrew J. Blumberg ([email protected]) Clustering and mapper
Filter functions
Clearly, choice of filter function is essential.
Some kind of density measure.
A score measure difference (distance) from some baseline.
An eccentricity measure.
Andrew J. Blumberg ([email protected]) Clustering and mapper

Filter functions
Clearly, choice of filter function is essential.
Some kind of density measure.
A score measure difference (distance) from some baseline.
An eccentricity measure.
Andrew J. Blumberg ([email protected]) Clustering and mapper
Filter functions
Clearly, choice of filter function is essential.
Some kind of density measure.
A score measure difference (distance) from some baseline.
An eccentricity measure.
Andrew J. Blumberg ([email protected]) Clustering and mapper
Andrew J. Blumberg ([email protected]) Clustering and mapper
Breast cancer example
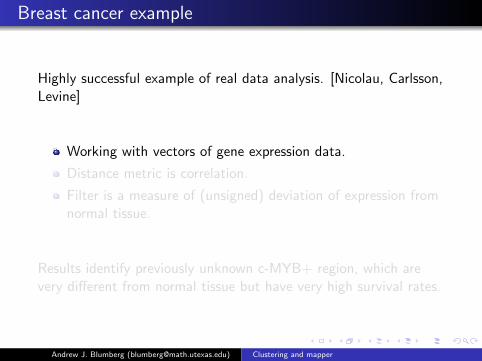
Highly successful example of real data analysis. [Nicolau, Carlsson,Levine]
Working with vectors of gene expression data.
Distance metric is correlation.
Filter is a measure of (unsigned) deviation of expression fromnormal tissue.
Results identify previously unknown c-MYB+ region, which arevery different from normal tissue but have very high survival rates.
Andrew J. Blumberg ([email protected]) Clustering and mapper
Breast cancer example
Highly successful example of real data analysis. [Nicolau, Carlsson,Levine]
Working with vectors of gene expression data.
Distance metric is correlation.
Filter is a measure of (unsigned) deviation of expression fromnormal tissue.
Results identify previously unknown c-MYB+ region, which arevery different from normal tissue but have very high survival rates.
Andrew J. Blumberg ([email protected]) Clustering and mapper

Andrew J. Blumberg ([email protected]) Clustering and mapper
NBA example
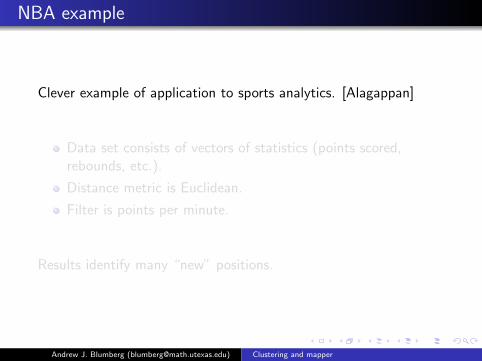
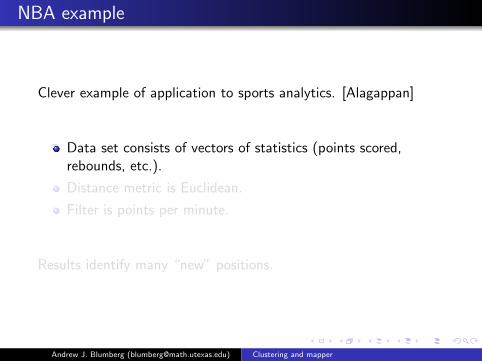
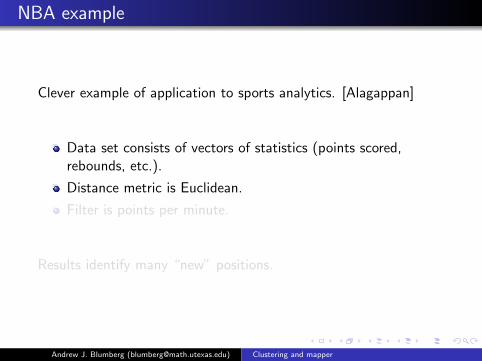
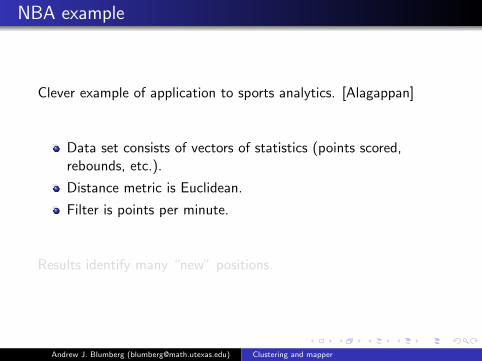
Clever example of application to sports analytics. [Alagappan]
Data set consists of vectors of statistics (points scored,rebounds, etc.).
Distance metric is Euclidean.
Filter is points per minute.
Results identify many “new” positions.
Andrew J. Blumberg ([email protected]) Clustering and mapper
NBA example
Clever example of application to sports analytics. [Alagappan]
Data set consists of vectors of statistics (points scored,rebounds, etc.).
Distance metric is Euclidean.
Filter is points per minute.
Results identify many “new” positions.
Andrew J. Blumberg ([email protected]) Clustering and mapper

Role Player
Scoring Rebounder
One-of-a-kind
Role-Playing Ball-Handler
Shooting Ball-Handler
Combo Ball-Handler Offensive Ball-
Handler Defensive Ball-
Handler
All-NBA 1st Team All-NBA 2nd Team
Scoring Paint Protector
3PT Rebounder
Paint Protector
Andrew J. Blumberg ([email protected]) Clustering and mapper

Summary
Claim
Mapper can be successfully applied to analysis of geometricstructures in large data sets from a wide variety of domains.
Key idea: clustering across “scales”, represent relationshipsbetween clusters as scale varies
Choice of filter function(s) is critical to successful aplication.
Andrew J. Blumberg ([email protected]) Clustering and mapper