AlbaSim Project Management Dominique Jaccard dominique.jaccard (a) heig-vd.ch Publication: .
Data Mining:Concepts and Techniques
February 25, 2011 Data Mining: Concepts and Techniques 1
Cluster Analysis
Li Xiong
Slide credits: Jiawei Han and Micheline Kamber
Tan, Steinbach, Kumar
Cluster Analysis
� Overview
� Partitioning methods
� Hierarchical methods
� Density-based methods
� Other Methods
February 25, 2011 Data Mining: Concepts and Techniques 2
� Other Methods
� Outlier analysis
� Summary
What is Cluster Analysis?
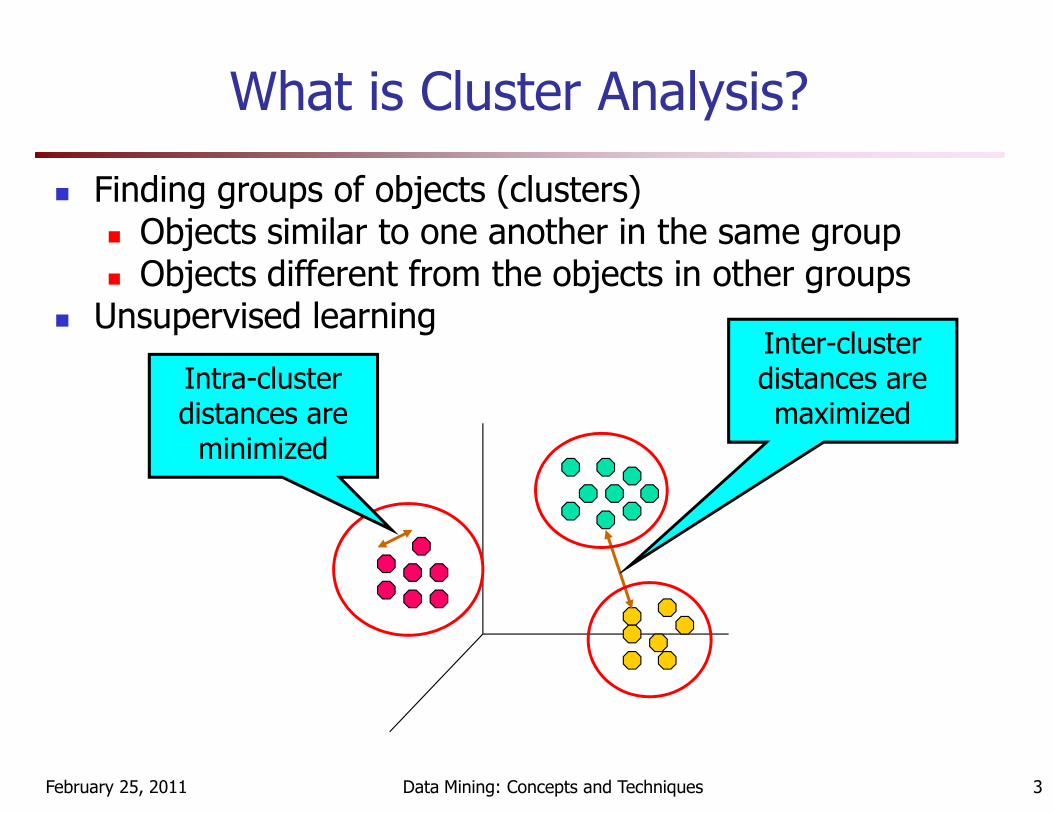
� Finding groups of objects (clusters)� Objects similar to one another in the same group � Objects different from the objects in other groups
� Unsupervised learningInter-cluster distances are maximized
Intra-cluster distances are
February 25, 2011 Data Mining: Concepts and Techniques 3
maximizeddistances are minimized
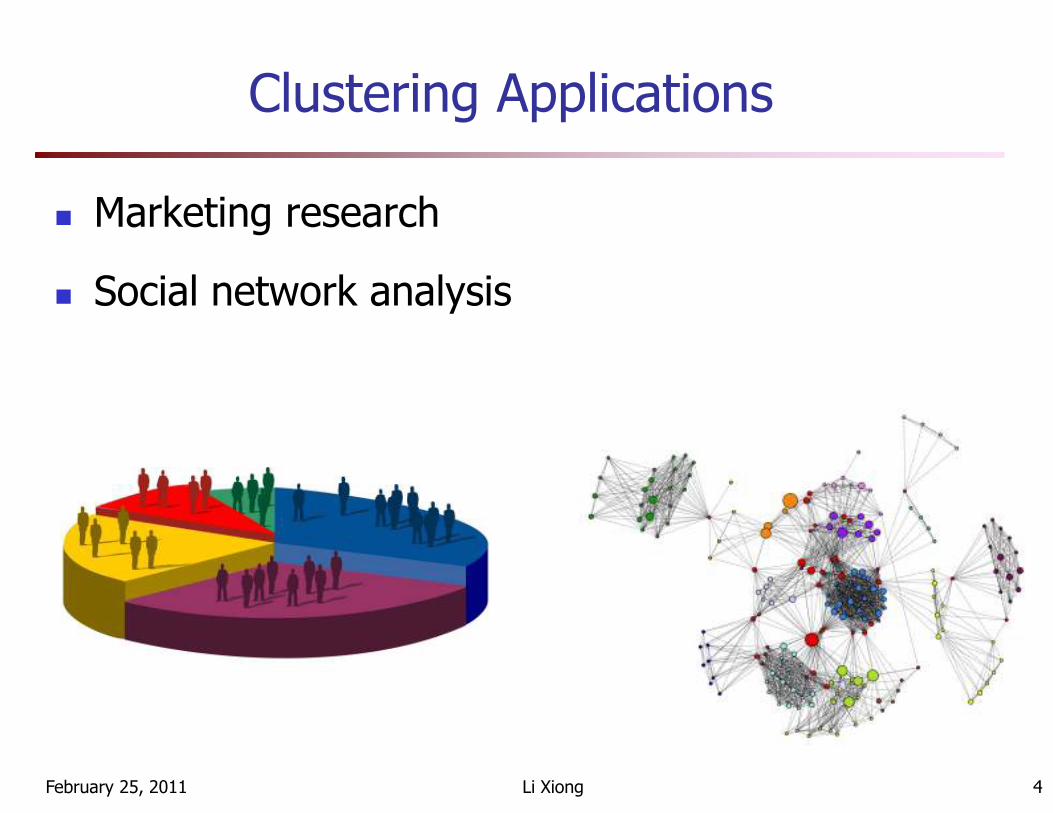
Clustering Applications
� Marketing research
� Social network analysis
February 25, 2011 Li Xiong 4

Clustering Applications
� WWW: Documents and search results clustering
February 25, 2011 Data Mining: Concepts and Techniques 5
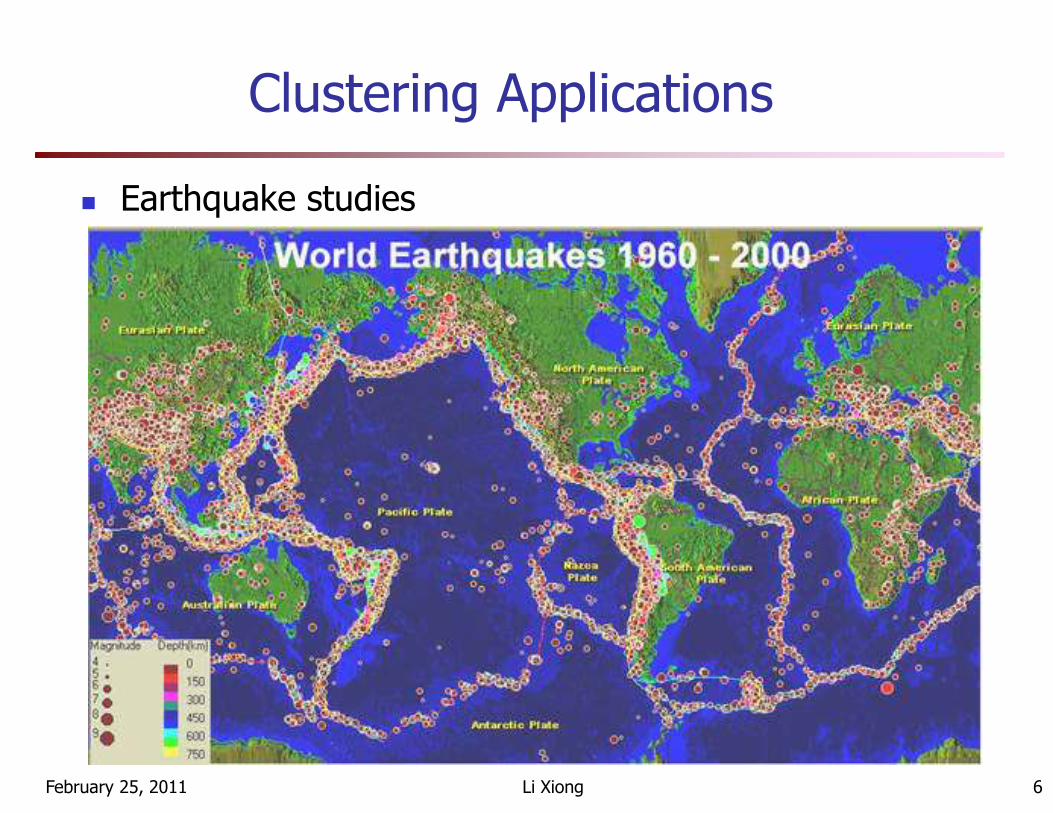
Clustering Applications
� Earthquake studies
February 25, 2011 Li Xiong 6

Clustering Applications
� Biology: plants and animals
� Bioinformatics: microarray data, flow cytometry data, genes and
sequences
February 25, 2011 Li Xiong 7
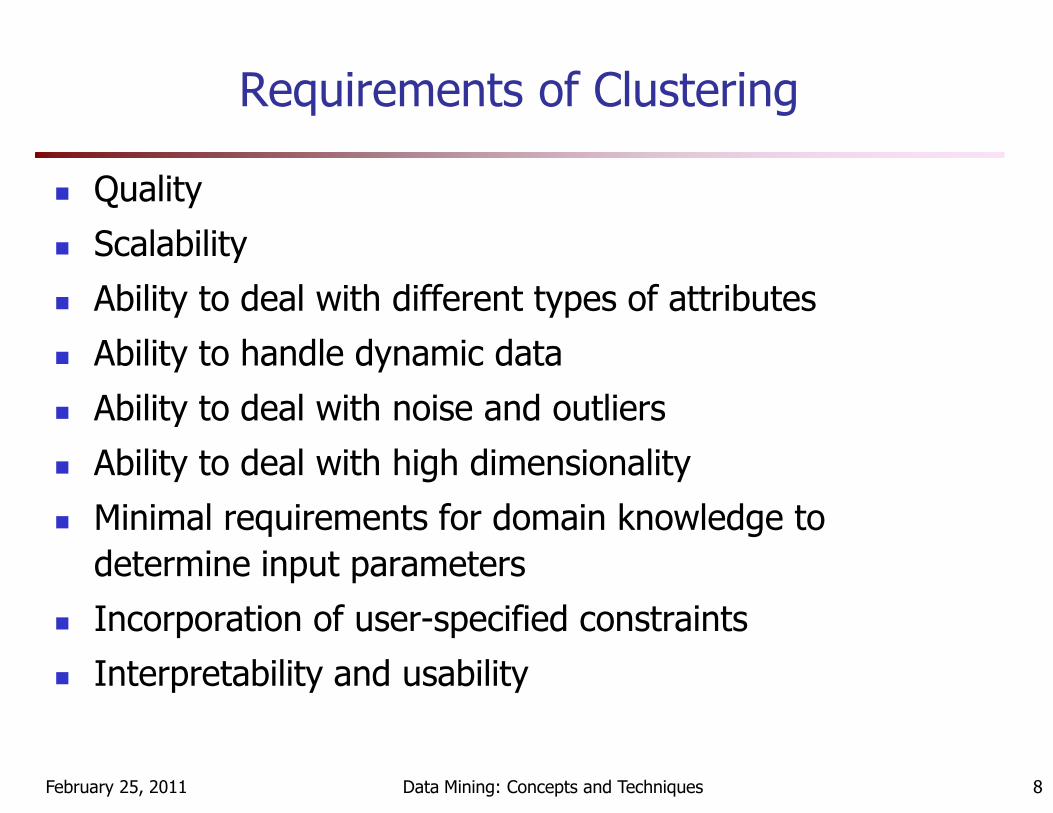
Requirements of Clustering
� Quality
� Scalability
� Ability to deal with different types of attributes
� Ability to handle dynamic data
� Ability to deal with noise and outliers
February 25, 2011 Data Mining: Concepts and Techniques 8
� Ability to deal with noise and outliers
� Ability to deal with high dimensionality
� Minimal requirements for domain knowledge to
determine input parameters
� Incorporation of user-specified constraints
� Interpretability and usability

Quality: What Is Good Clustering?
� Agreement with “ground truth”
� A good clustering will produce high quality clusters with
� Homogeneity - high intra-class similarity
� Separation - low inter-class similarity Inter-cluster distances are Intra-cluster
February 25, 2011 Data Mining: Concepts and Techniques 9
distances are maximized
Intra-cluster distances are minimized
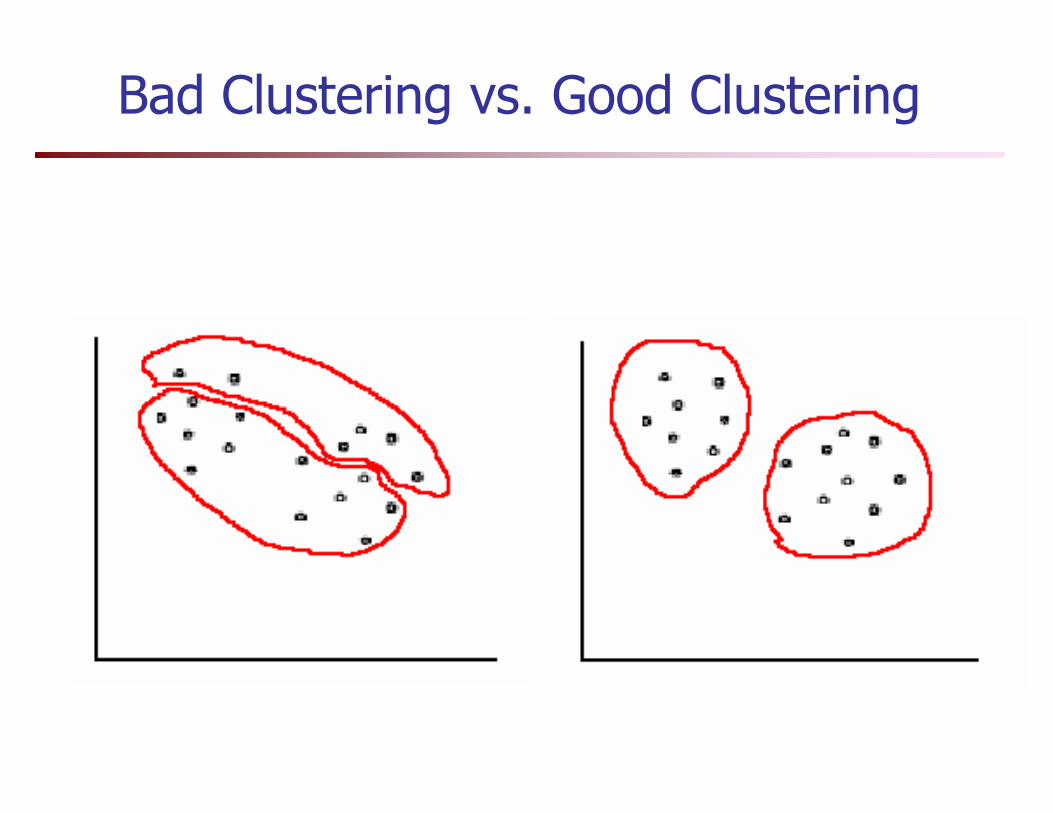
Bad Clustering vs. Good Clustering

Similarity or Dissimilarity between Data Objects
� Euclidean distance
222 −++−+−=
npx...nfx...n1x
...............
ipx...ifx...i1x
...............
1px...1fx...11x
February 25, 2011 11
� Manhattan distance
� Minkowski distance
� Chebyshev distance
||...||||),(2211 pp j
xix
jx
ix
jx
ixjid −++−+−=
)||...|||(|),( 22
22
2
11 pp jx
ix
jx
ix
jx
ixjid −++−+−=
pp
jx
ix
jx
ix
jx
ixjid )||...|||(|),(
2211−++−+−=

Chebyshev distance
a b c d e f g h
8 8
7 7
6 6
5 5
4 4
3 3
2 2
1 1
a b c d e f g h

Other Similarity or Dissimilarity Metrics
npx...nfx...n1x
...............
ipx...ifx...i1x
...............
1px...1fx...11x
February 25, 2011 Li Xiong 13
� Pearson correlation
� Cosine measure
� Jaccard coefficient
� KL divergence, Bregman divergence, …
||||||||jX
iX
jX
iX
⋅
•

Different Attribute Types
� To compute
� f is numeric (interval or ratio scale)� Normalization if necessary
� f is ordinal1−rz
||ff j
xix −
February 25, 2011 Data Mining: Concepts and Techniques 14
� f is ordinal� Mapping by rank
� f is nominal� Mapping function
= 0 if xif = xjf , or 1 otherwise� Hamming distance (edit distance) for strings
1
1
−
−=
f
if
Mrz
if
||ff j
xix −

Clustering Approaches
� Partitioning approach:
� Construct various partitions and then evaluate them by some criterion,
e.g., minimizing the sum of square errors
� Typical methods: k-means, k-medoids, CLARANS
� Hierarchical approach:
February 25, 2011 Data Mining: Concepts and Techniques 15
� Create a hierarchical decomposition of the set of data (or objects) using
some criterion
� Typical methods: Diana, Agnes, BIRCH, ROCK, CAMELEON
� Density-based approach:
� Based on connectivity and density functions
� Typical methods: DBSACN, OPTICS, DenClue
� Others
Cluster Analysis
� Overview
� Partitioning methods
� Hierarchical methods
� Density-based methods
� Other Methods
February 25, 2011 Data Mining: Concepts and Techniques 16
� Other Methods
� Outlier analysis
� Summary

Partitioning Algorithms: Basic Concept
� Partitioning method: Construct a partition of a database D of n objects
into a set of k clusters, s.t., the sum of squared distance is minimized
� Given a k, find a partition of k clusters that optimizes the chosen
partitioning criterion
2
1 )( iCp
k
i mpi
−ΣΣ ∈=
February 25, 2011 Data Mining: Concepts and Techniques 17
partitioning criterion
� Global optimal: exhaustively enumerate all partitions
� Heuristic methods: k-means and k-medoids algorithms
� k-means (MacQueen’67): Each cluster is represented by the center
of the cluster
� k-medoids or PAM (Partition around medoids) (Kaufman &
Rousseeuw’87): Each cluster is represented by one of the objects
in the cluster

K-Means Clustering: Lloyd Algorithm
� Given k, and randomly choose k initial cluster centers
� Partition objects into k nonempty subsets by assigning
each object to the cluster with the nearest centroid
� Update centroid, i.e. mean point of the cluster
February 25, 2011 Data Mining: Concepts and Techniques 18
� Go back to Step 2, stop when no more new
assignment

The K-Means Clustering Method
� Example
2
3
4
5
6
7
8
9
10
2
3
4
5
6
7
8
9
10
3
4
5
6
7
8
9
10
Assign each
Update the
February 25, 2011 Data Mining: Concepts and Techniques 19
0
1
2
0 1 2 3 4 5 6 7 8 9 10
0
1
2
0 1 2 3 4 5 6 7 8 9 10
0
1
2
3
4
5
6
7
8
9
10
0 1 2 3 4 5 6 7 8 9 10
0
1
2
3
4
5
6
7
8
9
10
0 1 2 3 4 5 6 7 8 9 10
0
1
2
0 1 2 3 4 5 6 7 8 9 10
K=2
Arbitrarily choose K object as initial cluster center
each objects to most similar center
the cluster means
Update the cluster means
reassignreassign
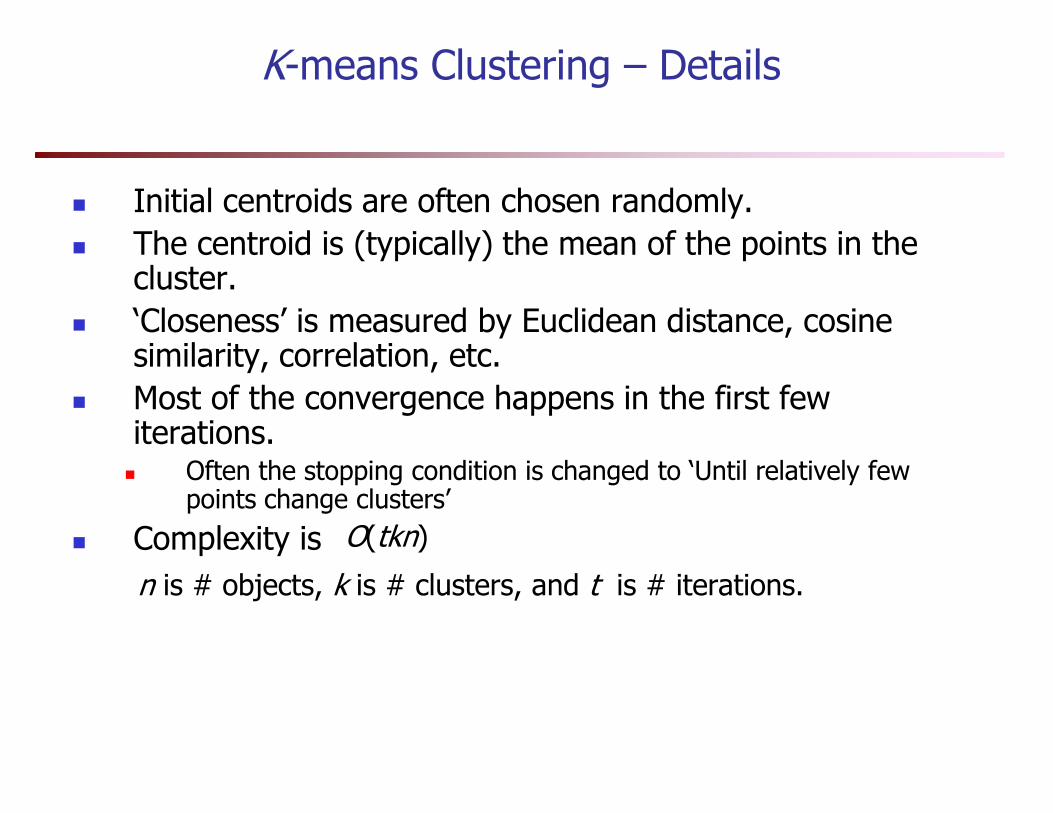
K-means Clustering – Details
� Initial centroids are often chosen randomly.
� The centroid is (typically) the mean of the points in the cluster.
� ‘Closeness’ is measured by Euclidean distance, cosine similarity, correlation, etc.
� Most of the convergence happens in the first few � Most of the convergence happens in the first few iterations.
� Often the stopping condition is changed to ‘Until relatively few points change clusters’
� Complexity is
n is # objects, k is # clusters, and t is # iterations.
O(tkn)

Comments on the K-Means Method
� Strength
� Simple and works well for “regular” disjoint clusters
� Relatively efficient and scalable (normally, k, t << n)
� Weakness
� Need to specify k, the number of clusters, in advance
February 25, 2011 Data Mining: Concepts and Techniques 21
� Need to specify k, the number of clusters, in advance
� Depending on initial centroids, may terminate at a local optimum
� Potential solutions
� Unable to handle noisy data and outliers
� Not suitable for clusters of
� Different sizes
� Non-convex shapes

Importance of Choosing Initial Centroids – Case 1
-2 -1.5 -1 -0.5 0 0.5 1 1.5 2
0
0.5
1
1.5
2
2.5
3
x
y
Iteration 1
-2 -1.5 -1 -0.5 0 0.5 1 1.5 2
0
0.5
1
1.5
2
2.5
3
x
y
Iteration 2
-2 -1.5 -1 -0.5 0 0.5 1 1.5 2
0
0.5
1
1.5
2
2.5
3
x
y
Iteration 3
-2 -1.5 -1 -0.5 0 0.5 1 1.5 2
0
0.5
1
1.5
2
2.5
3
x
y
Iteration 4
-2 -1.5 -1 -0.5 0 0.5 1 1.5 2
0
0.5
1
1.5
2
2.5
3
x
y
Iteration 5
-2 -1.5 -1 -0.5 0 0.5 1 1.5 2
0
0.5
1
1.5
2
2.5
3
x
y
Iteration 6

Importance of Choosing Initial Centroids – Case 2
-2 -1.5 -1 -0.5 0 0.5 1 1.5 2
0
0.5
1
1.5
2
2.5
3
y
Iteration 1
-2 -1.5 -1 -0.5 0 0.5 1 1.5 2
0
0.5
1
1.5
2
2.5
3
y
Iteration 2
-2 -1.5 -1 -0.5 0 0.5 1 1.5 2
x-2 -1.5 -1 -0.5 0 0.5 1 1.5 2
x
-2 -1.5 -1 -0.5 0 0.5 1 1.5 2
0
0.5
1
1.5
2
2.5
3
x
y
Iteration 3
-2 -1.5 -1 -0.5 0 0.5 1 1.5 2
0
0.5
1
1.5
2
2.5
3
x
y
Iteration 4
-2 -1.5 -1 -0.5 0 0.5 1 1.5 2
0
0.5
1
1.5
2
2.5
3
xy
Iteration 5

Limitations of K-means: Differing Sizes
Original Points K-means (3 Clusters)

Limitations of K-means: Non-convex Shapes
Original Points K-means (2 Clusters)

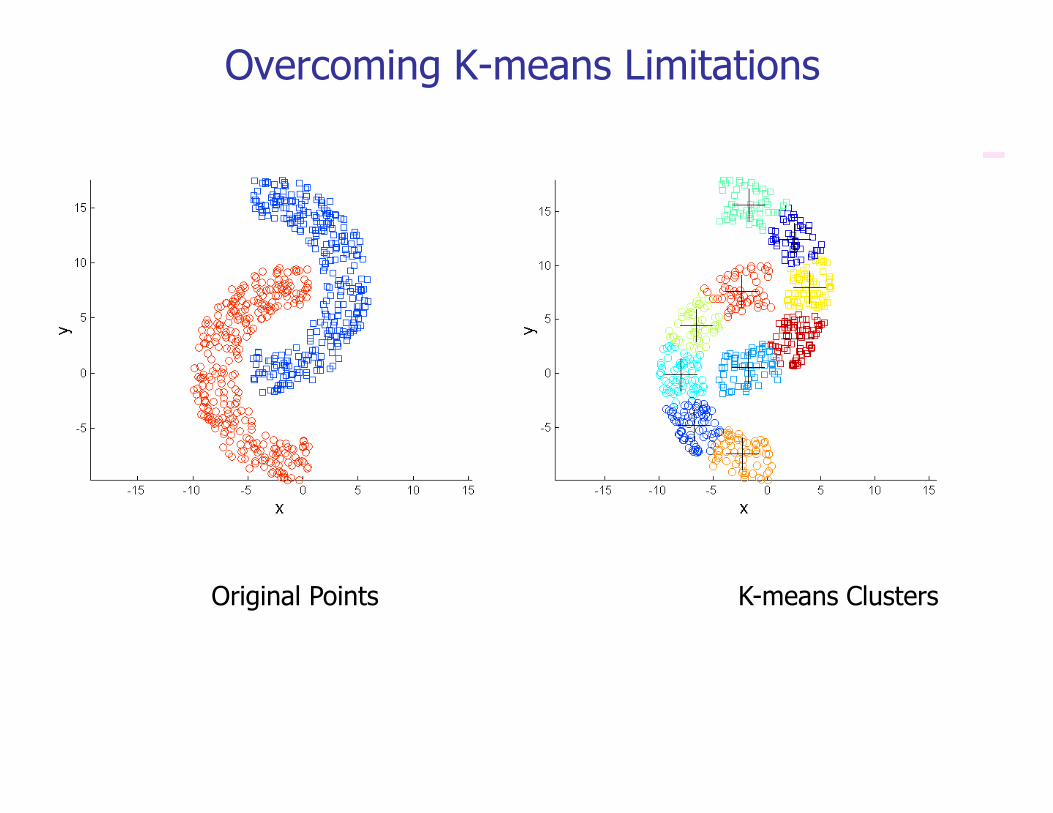
Overcoming K-means Limitations
Original Points K-means Clusters
Overcoming K-means Limitations
Original Points K-means Clusters

Variations of the K-Means Method
� A few variants of the k-means which differ in
� Selection of the initial k means
� Dissimilarity calculations
� Strategies to calculate cluster means
February 25, 2011 Data Mining: Concepts and Techniques 28
Strategies to calculate cluster means
� Handling categorical data: k-modes (Huang’98)
� Replacing means of clusters with modes
� Using new dissimilarity measures to deal with categorical objects
� Using a frequency-based method to update modes of clusters
� A mixture of categorical and numerical data: k-prototype method

K-Medoids Method?
� The k-means algorithm is sensitive to outliers !
� Since an object with an extremely large value may
substantially distort the distribution of the data.
� K-Medoids: Instead of taking the mean value of the object
February 25, 2011 Data Mining: Concepts and Techniques 29
in a cluster as a reference point, medoids can be used,
which is the most centrally located object in a cluster.
0
1
2
3
4
5
6
7
8
9
10
0 1 2 3 4 5 6 7 8 9 10
0
1
2
3
4
5
6
7
8
9
10
0 1 2 3 4 5 6 7 8 9 10
The K-Medoids Clustering Method
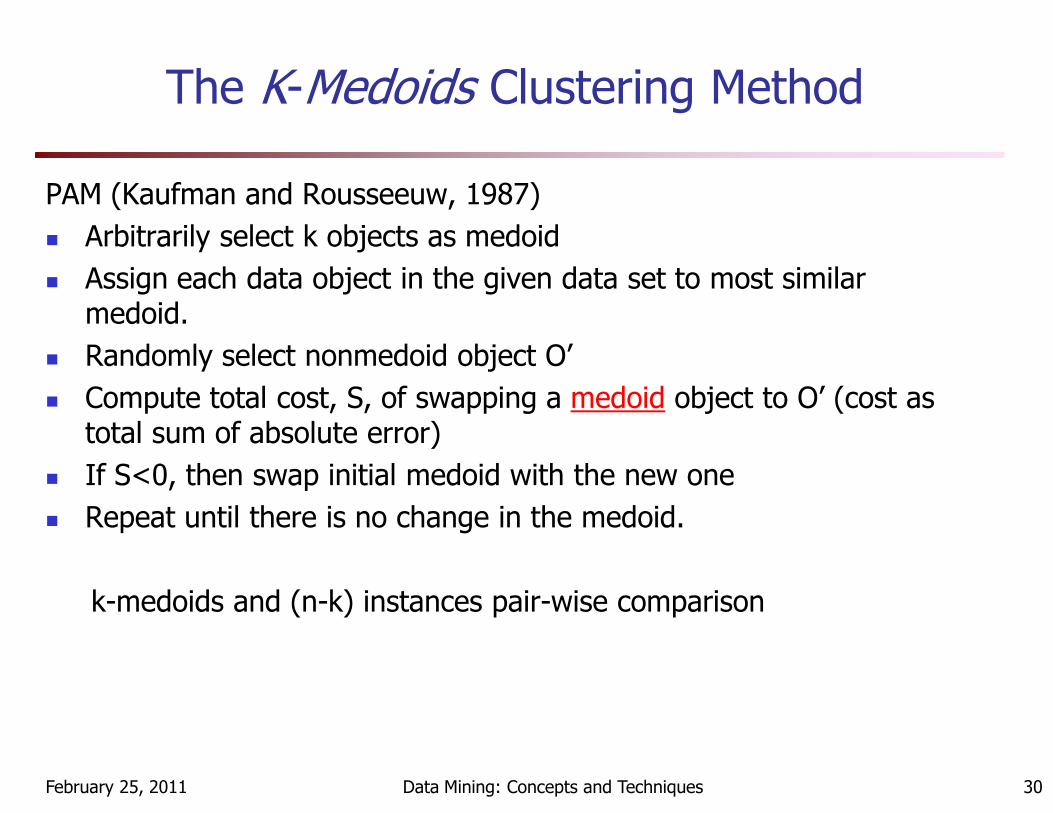
PAM (Kaufman and Rousseeuw, 1987)
� Arbitrarily select k objects as medoid
� Assign each data object in the given data set to most similar medoid.
� Randomly select nonmedoid object O’
� Compute total cost, S, of swapping a medoid object to O’ (cost as
February 25, 2011 Data Mining: Concepts and Techniques 30
� Compute total cost, S, of swapping a medoid object to O’ (cost as total sum of absolute error)
� If S<0, then swap initial medoid with the new one
� Repeat until there is no change in the medoid.
k-medoids and (n-k) instances pair-wise comparison
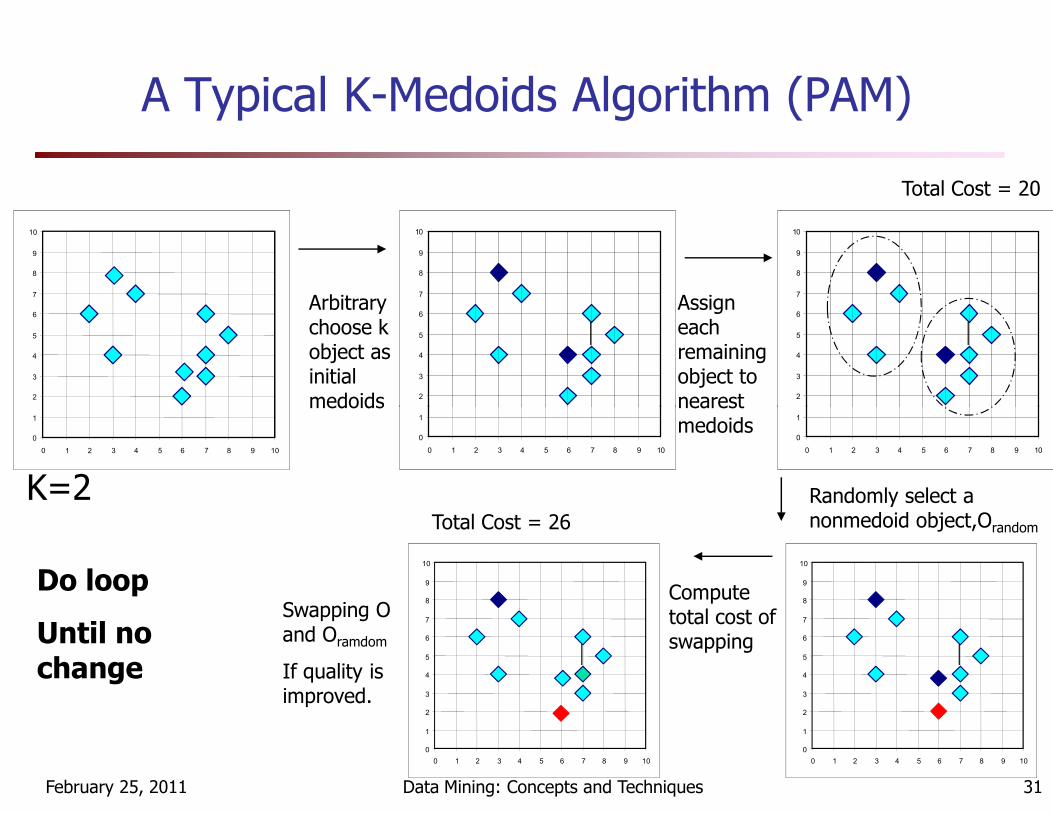
A Typical K-Medoids Algorithm (PAM)
2
3
4
5
6
7
8
9
10
Total Cost = 20
2
3
4
5
6
7
8
9
10
Arbitrary choose k object as initial medoids 2
3
4
5
6
7
8
9
10
Assign each remaining object to nearest
February 25, 2011 Data Mining: Concepts and Techniques 31
0
1
0 1 2 3 4 5 6 7 8 9 10
0
1
0 1 2 3 4 5 6 7 8 9 10
K=2
medoids
0
1
0 1 2 3 4 5 6 7 8 9 10
nearest medoids
Randomly select a nonmedoid object,Orandom
Compute total cost of swapping
0
1
2
3
4
5
6
7
8
9
10
0 1 2 3 4 5 6 7 8 9 10
Total Cost = 26
Swapping O and Oramdom
If quality is improved.
Do loop
Until no change
0
1
2
3
4
5
6
7
8
9
10
0 1 2 3 4 5 6 7 8 9 10

What Is the Problem with PAM?
� Pam is more robust than k-means in the presence of
noise and outliers
� Pam works efficiently for small data sets but does not
scale well for large data sets.
February 25, 2011 Data Mining: Concepts and Techniques 32
� Complexity? O(k(n-k)2t)
n is # of data,k is # of clusters, t is # of iterations
�Sampling based method,
CLARA(Clustering LARge Applications)

CLARA (Clustering Large Applications) (1990)
� CLARA (Kaufmann and Rousseeuw in 1990)
� It draws multiple samples of the data set, applies PAM on
each sample, and gives the best clustering as the output
� Strength: deals with larger data sets than PAM
February 25, 2011 Data Mining: Concepts and Techniques 33
� Weakness:
� Efficiency depends on the sample size
� A good clustering based on samples will not
necessarily represent a good clustering of the whole
data set if the sample is biased

CLARANS (“Randomized” CLARA) (1994)
� CLARANS (A Clustering Algorithm based on Randomized
Search) (Ng and Han’94)
� The clustering process can be presented as searching a
graph where every node is a potential solution, that is, a
set of k medoids
February 25, 2011 Data Mining: Concepts and Techniques 34
set of k medoids
� PAM examines neighbors for local minimum
� CLARA works on subgraphs of samples
� CLARANS examines neighbors dynamically
� If local optimum is found, starts with new randomly selected
node in search for a new local optimum

Cluster Analysis
� Overview
� Partitioning methods
� Hierarchical methods and graph-based methods
� Density-based methods
� Other Methods
February 25, 2011 Data Mining: Concepts and Techniques 35
� Other Methods
� Outlier analysis
� Summary

Hierarchical Clustering
� Produces a set of nested clusters organized as a hierarchical tree
� Can be visualized as a dendrogram, a tree like diagram
� Clustering obtained by cutting at desired level
� Do not have to assume any particular number of clusters� Do not have to assume any particular number of clusters
� May correspond to meaningful taxonomies
1 3 2 5 4 60
0.05
0.1
0.15
0.2
1
2
3
4
5
6
1
23 4
5
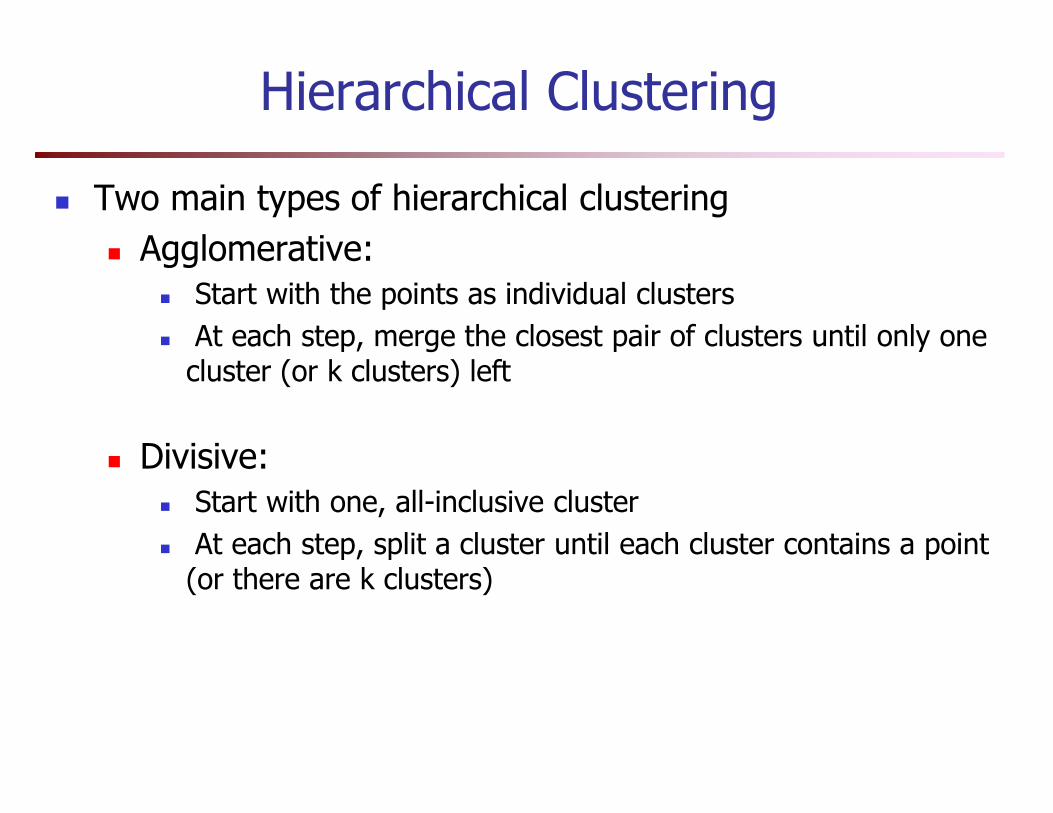
Hierarchical Clustering
� Two main types of hierarchical clustering
� Agglomerative:
� Start with the points as individual clusters
� At each step, merge the closest pair of clusters until only one cluster (or k clusters) left
� Divisive:
� Start with one, all-inclusive cluster
� At each step, split a cluster until each cluster contains a point (or there are k clusters)

Agglomerative Clustering Algorithm
1. Compute the proximity matrix
2. Let each data point be a cluster
3. Repeat
4. Merge the two closest clusters4. Merge the two closest clusters
5. Update the proximity matrix
6. Until only a single cluster remains

Starting Situation
� Start with clusters of individual points and a proximity matrix
p1
p3
p4
p2
p1 p2 p3 p4 p5 . . .
p5
p4
.
.
. Proximity Matrix
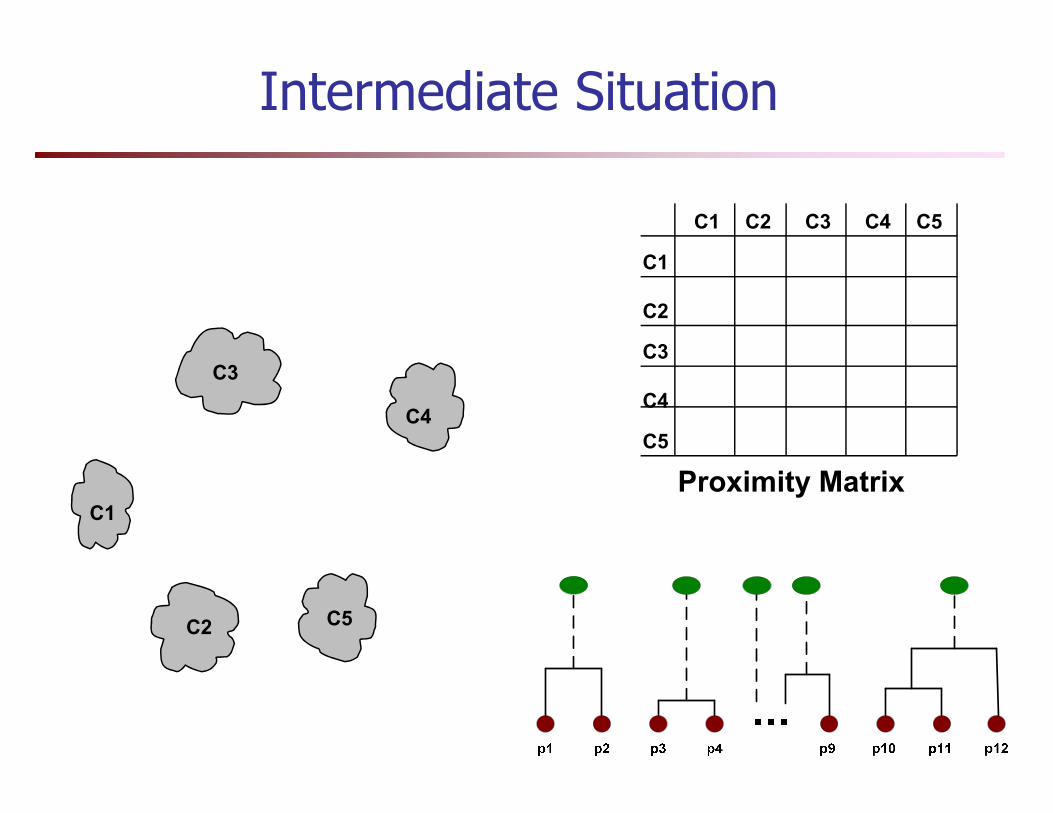
Intermediate Situation
C4
C3
C2C1
C1
C3
C4
C2
C3 C4 C5
C1
C4
C2 C5
C5
C4
Proximity Matrix
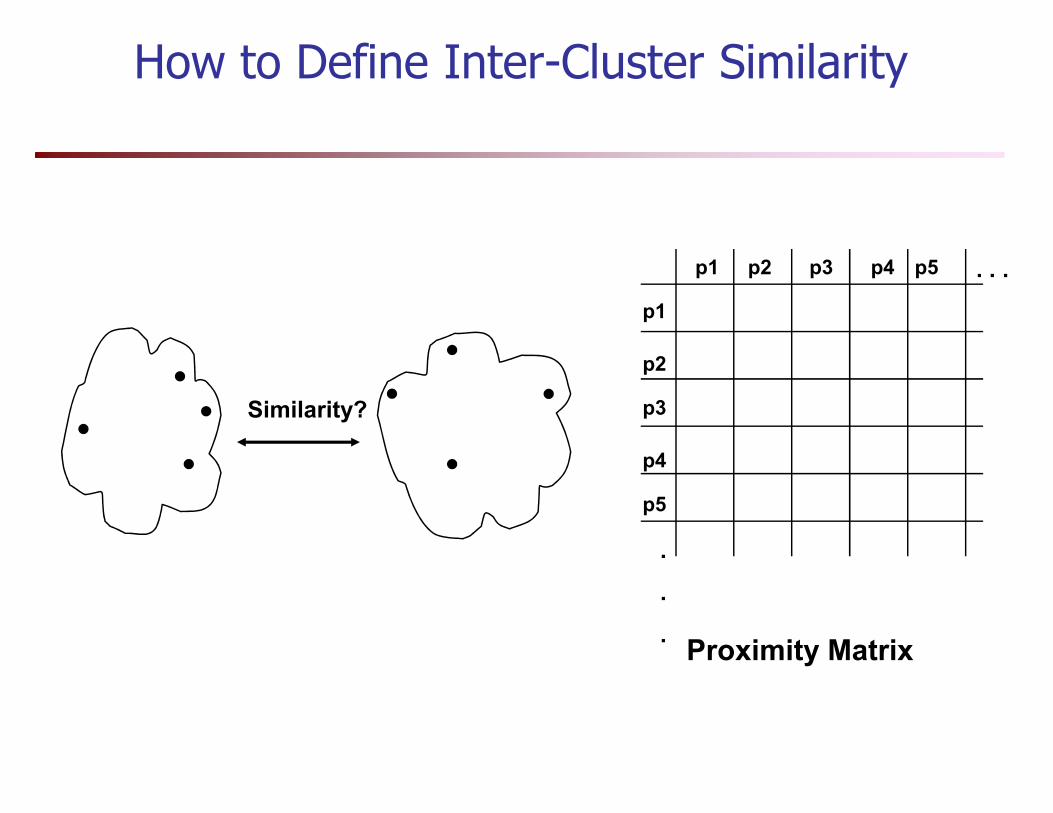
How to Define Inter-Cluster Similarity
p1
p3
p2
p1 p2 p3 p4 p5 . . .
Similarity? p3
p5
p4
.
.
.
Similarity?
Proximity Matrix

Distance Between Clusters
� Single Link: smallest distance between points
� Complete Link: largest distance between points
� Average Link: average distance between pointsAverage Link: average distance between points
� Centroid: distance between centroids
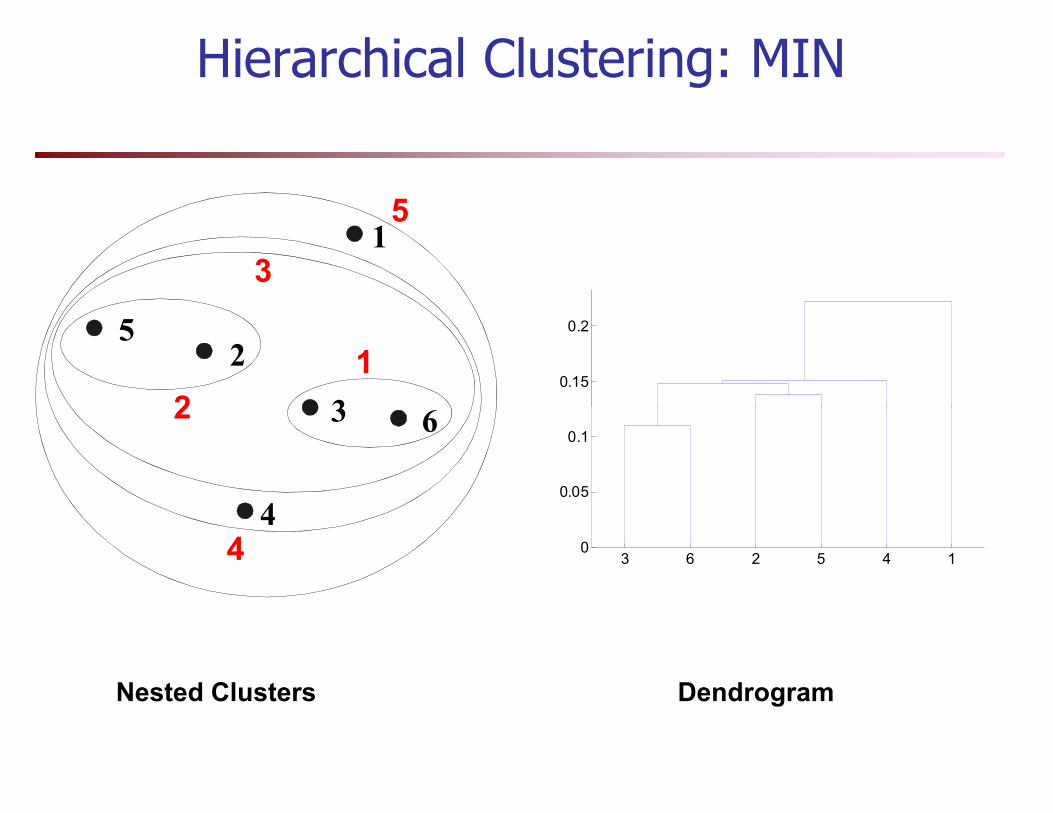
Hierarchical Clustering: MIN
1
2
3
5
6
1
2
3
5
0.15
0.2
Nested Clusters Dendrogram
3
4
62
4 3 6 2 5 4 10
0.05
0.1

MST (Minimum Spanning Tree)
� An aggolomerative algorithm using minimum distance can be also called a minimal spanning tree (MST) algorithm
� Start with a tree that consists of any point
� In successive steps, look for the closest pair of points (p, q) such that one point (p) is in the current tree but the other (q) is not; add q to the tree and put an edge between p and q
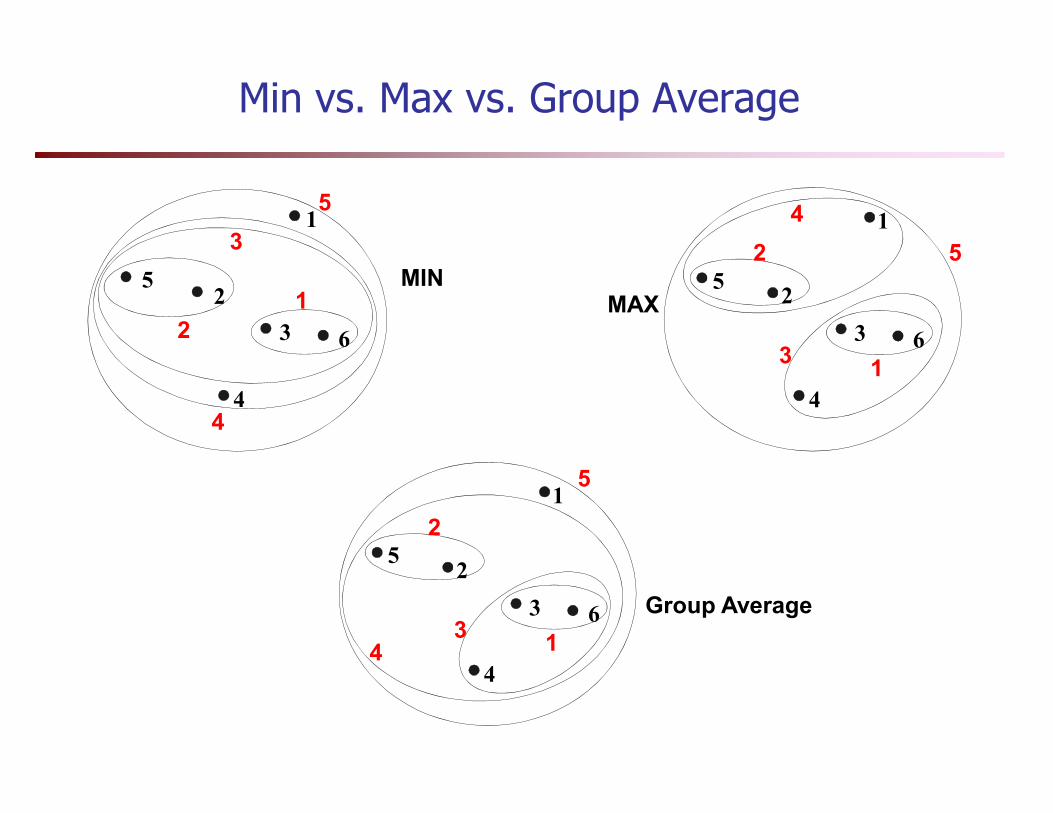
Min vs. Max vs. Group Average
MINMAX
1
2
3
4
5
6
1
2 5
3
41
2
3
4
5
6
1
2
3
5
Group Average
1
2
3
4
5
6
1
2
5
34
44
4

Strength of MIN
Original Points Two Clusters
• Can handle non-elliptical shapes

Limitations of MIN
Original Points Two Clusters
• Sensitive to noise and outliers
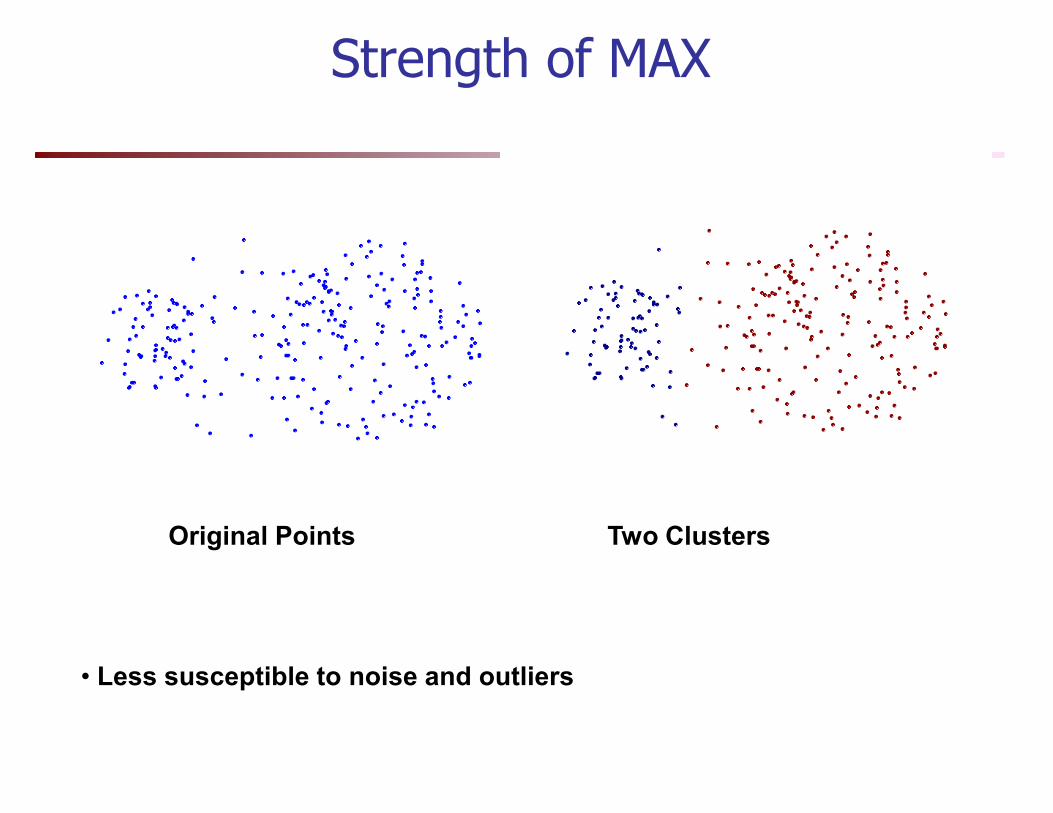
Strength of MAX
Original Points Two Clusters
• Less susceptible to noise and outliers
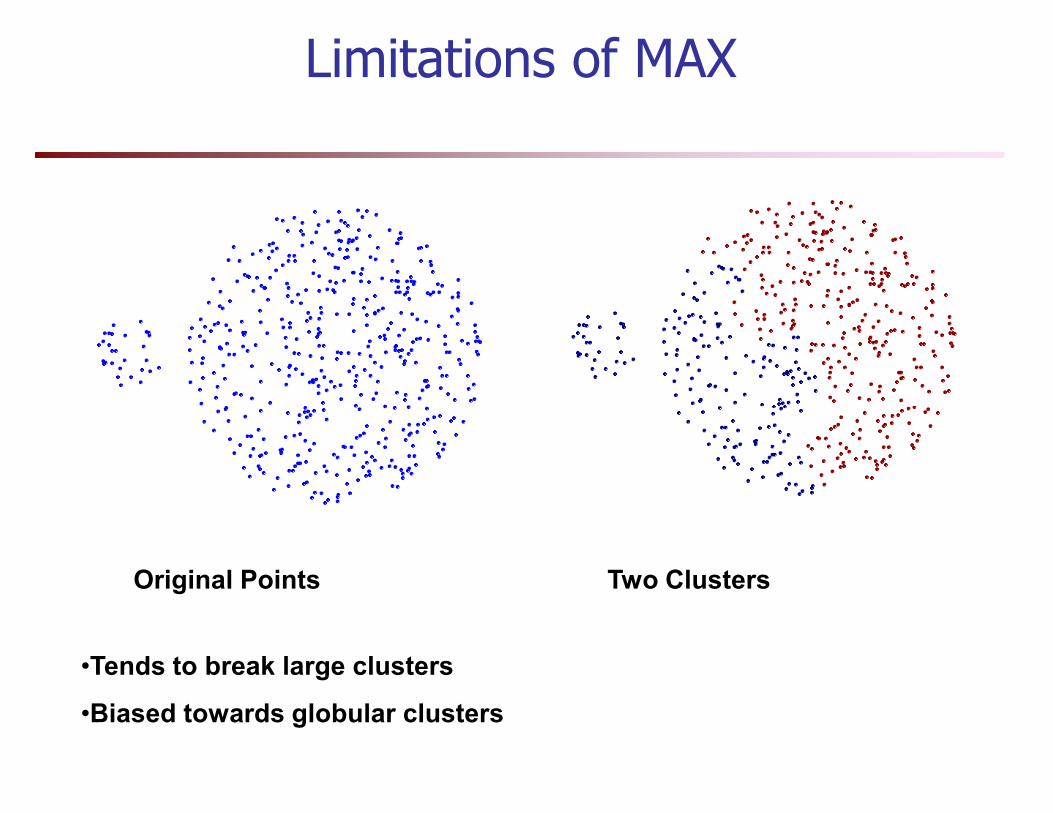
Limitations of MAX
Original Points Two Clusters
•Tends to break large clusters
•Biased towards globular clusters

Hierarchical Clustering: Group Average
� Compromise between Single and Complete Link
� Strengths� Strengths
� Less susceptible to noise and outliers
� Limitations
� Biased towards globular clusters
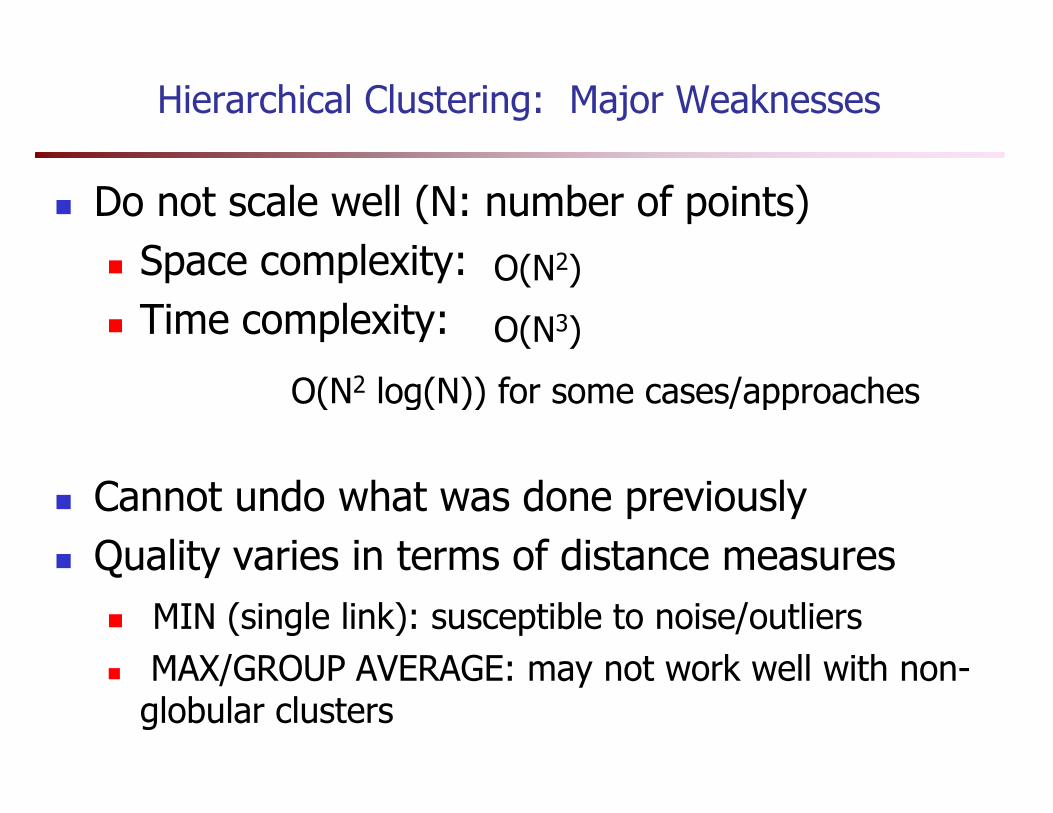
Hierarchical Clustering: Major Weaknesses
� Do not scale well (N: number of points)
� Space complexity:
� Time complexity:
O(N2)
O(N3)
O(N2 log(N)) for some cases/approaches
� Cannot undo what was done previously
� Quality varies in terms of distance measures
� MIN (single link): susceptible to noise/outliers
� MAX/GROUP AVERAGE: may not work well with non-globular clusters
O(N log(N)) for some cases/approaches

Cluster Analysis
� Overview
� Partitioning methods
� Hierarchical methods
� Classical methods
� Recent methods
February 25, 2011 Data Mining: Concepts and Techniques 52
� Recent methods
� Density-based methods
� Other Methods
� Outlier analysis
� Summary