CLP Holdings 2020 Annual Results
56
Information Classification: Confidential/Proprietary CLP Holdings 2020 Annual Results Analyst Briefing 22 February 2021
Transcript of CLP Holdings 2020 Annual Results

Information Classification: Confidential/Proprietary
CLP Holdings2020 Annual ResultsAnalyst Briefing
22 February 2021

2
Disclaimer
Potential investors, analysts and shareholders of CLP Holdings Limited (the Company) and other recipients of this document are reminded that this document and any oral discussion made together with this document (the presentation) are provided for your information purposes only and you may not forward, publish, distribute, release or disseminate any part of the presentation directly or indirectly to any other person.
It is important to note that the contents of the presentation have not been audited or independently verified. Maps included in the presentation are indicative only. They are provided for the purpose of showing the approximate location of the Company's assets, and do not purport to show the official political borders between different countries. Some comments, including comments relating to future events and our expectations about the performance of CLP's business, are based on a number of factors that we cannot accurately predict or control. We do not make, and expressly disclaim, any representations and warranties in respect of any matters contained in the presentation. We cannot provide any assurance that the information contained in the presentation is or will be accurate or complete and so they should not be relied on. We assume no liability whatsoever for any loss howsoever arising from use of, or in connection with, any of the information and data contained in this presentation. From time to time as circumstances change we may update our website at www.clpgroup.com and will update the Hong Kong Stock Exchange when relevant to comply with our continuous disclosure obligations.
This presentation is not, and is not intended to be, for publication, distribution, release or dissemination, directly or indirectly, in or into any other jurisdiction which to do so would be restricted, unlawful or a breach of a legal or regulatory requirement.
This presentation does not constitute a public offer for the purposes of any applicable law or an offer to sell or solicitation of any offer to purchase any securities or other financial instruments or any recommendation in respect of such securities or instruments.
By attending or reading this presentation, you will be deemed to have agreed to the terms, obligations and restrictions set out herein.

Performance Overview
Group Financial Performance
Performance by Business Units
Business Trends and Outlook
Questions and Answers
Appendices
Agenda
3

PerformanceOverview
Staff working under COVID-19 to maintain safe and reliable service, whether working on site or at homeJinchang Solar Farm, Gansu, Mainland China EnergyAustralia virtual meeting Black Point Power Station, Hong Kong

• Safe and reliable service maintained for our customers
• Progress on decarbonisation investments and customer services
• Steady contribution from diversified portfolio
• Pressure on earnings from lower wholesale prices and retail price caps
• Underlying earnings (ACOI) broadly in line with 2019
Operating Earnings up 4.1% including favourable non-cash fair-value change
• Met 2020 carbon intensity target set out in Climate Vision 2050
• For 2021 focus on
5
✓ Operational resilience
✓ Business performance
✓ Accelerated energy transition
✓ Caring for our people, customers and communities
Resilient business performance amid COVID-19

Higher Operating Earnings, 4th interim dividend increased by 1.7%
6
HK$11,577m +4.1%
Operating Earnings
HK$1.21 +1.7%
Fourth Interim Dividend
HK$11,456m +146%2019 included a HK$6.4bn goodwill impairment for EA
Total Earnings
Credit Ratings
S&P Moody’s
CLP Holdings A A2
CLP Power A+ A1
CAPCO AA- A1
EnergyAustralia (EA) BBB+ -
HK$4.58 +4.1%
Operating Earnings Per Share
HK$3.10 +0.6%
Total 2020 Dividend
HK$4.53 +146%
Total Earnings Per Share
SoC Capex HK$8.7bn
Other Capex HK$3.0bn
Net debt to total capital 25.1%(1) On cash basis
Capital Investment (1) and Leverage

Average minutes lost pa (rolling 3 years)Excluding Typhoon Mangkhut 0.92 -0.35
Including Typhoon Mangkhut 9.77 -0.36
Reliability in Hong Kong (1)
Hong Kong (local sales) 34.0 TWh -0.9%
Australia 17.6 TWh -4.4%
Electricity Sales
In operation 24.1 GW +0.7
Non-carbon Emitting (3) 6.0 GW +0.1
In construction 0.6 GW -0.1
Generation and Storage Capacity (2)
Operating performance
7
Total recordable injury rate
0.32 -0.06
Safety
Hong Kong 2.672m +36k
Australia 2.449m -31k
Customer Accounts
Electricity sent out (2)
85.9 TWh -3.0%
Generation Performance
(1) Unplanned customer minutes lost - average of the past 36 months(2) Equity basis plus long-term capacity and energy purchase arrangements. Includes battery discharge capacity(3) Non-carbon emitting includes wind, hydro, solar and nuclear

Group Financial Performance
D1, Black Point Power Station, Hong Kong

9
HK$M 2020 2019 Change
Revenue 79,590 85,689 7.1%
Operating Earnings
Hong Kong electricity and related activities 8,088 7,659 5.6%
Local electricity business 7,818 7,448
PSDC and Hong Kong Branch Line 270 211
Outside Hong Kong 4,484 4,441 1.0%
Mainland China 2,233 2,277
India 175 263
Southeast Asia and Taiwan 386 335
Australia 1,690 1,566
Other earnings and unallocated items (995) (979)
Operating Earnings 11,577 11,121 4.1%
Items affecting comparability (1) (121) (6,464)
Total Earnings 11,456 4,657 146%
Higher Operating Earnings including positive fair value change
(1) Item affecting comparability represented revaluation loss on investment property and the impairment of retail goodwill for EnergyAustralia in 2019. For details please refer to page 28

HK$M 2020 2019 Change
Operating Earnings(Attributable to CLP)
11,577 11,121 4.1%
Exclude:
Fair value adjustments
460 (176)
Net finance costs (1) (1,875) (2,033)
Income tax expense (2,993) (2,787)
Non-controlling interests
(914) (885)
ACOI 16,899 17,002 0.6%
Adjusted Current Operating Income or ACOI
• ACOI equals EBIT excluding items affecting
comparability and fair value adjustments, and
includes the Group’s share in net earnings from
joint ventures and associates
Fair value adjustments
• Predominantly favourable movement as a result
of EnergyAustralia’s net sold energy derivative
contracts impacted by lower forward electricity
prices
Net finance costs (1)
• Decrease in net finance cost mainly attributable
to reduced amount of perpetual capital
securities and lower borrowing rates
Income tax expense
• In line with higher operating profits, in
particular the fair value adjustments
Non-controlling interests
• CSG’s 30% share of CAPCO
• CDPQ’s 40% share of CLP India
(1) Included the distribution to perpetual capital securities holders
Reconciliation of Operating Earnings to ACOI
10
36 17,038 16,89917,002 388
(161) (85) (62)(261)
(2,000)
2,000
6,000
10,000
14,000
18,000
22,000
2019 FX Normalised2019
Hong Kong MainlandChina
India SEA andTaiwan
Australia Unallocatedand others
2020
HK$m
HK$M 2020 2019
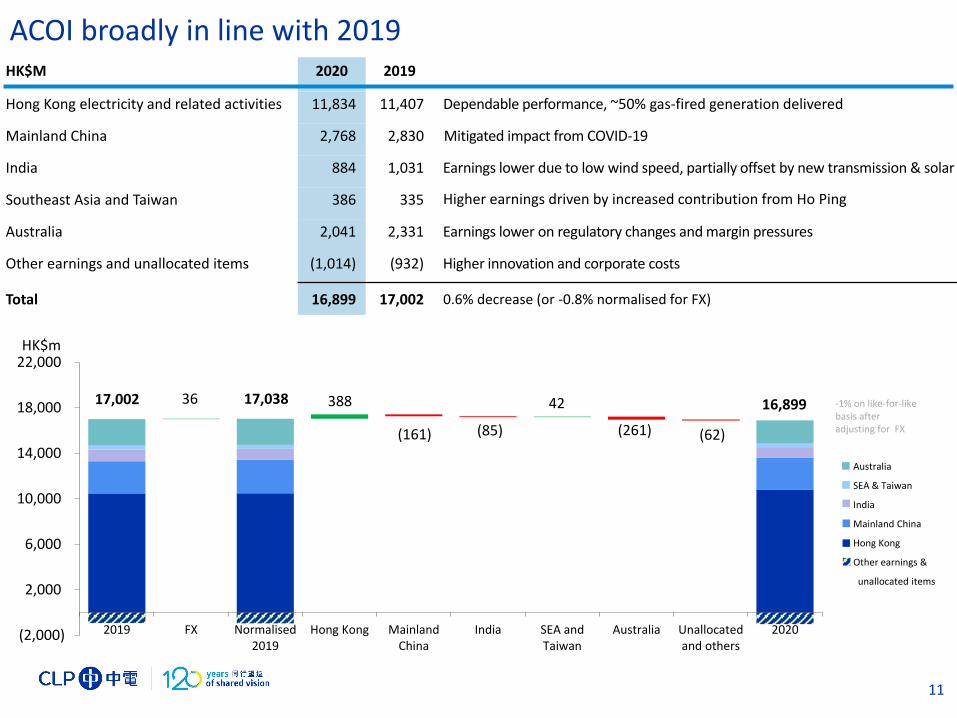
Hong Kong electricity and related activities 11,834 11,407 Dependable performance, ~50% gas-fired generation delivered
Mainland China 2,768 2,830 Mitigated impact from COVID-19
India 884 1,031 Earnings lower due to low wind speed, partially offset by new transmission & solar
Southeast Asia and Taiwan 386 335 Higher earnings driven by increased contribution from Ho Ping
Australia 2,041 2,331 Earnings lower on regulatory changes and margin pressures
Other earnings and unallocated items (1,014) (932) Higher innovation and corporate costs
Total 16,899 17,002 0.6% decrease (or -0.8% normalised for FX)
-1% on like-for-like basis after adjusting for FX
ACOI broadly in line with 2019
11
Australia
SEA & Taiwan
India
Mainland China
Hong Kong
Other earnings &
unallocated items
42

Performance by Business Units
Laiwu III Wind Farm, Shandong, Mainland China

11,407 39 11,446 380 8 11,834
0
4,000
8,000
12,000
16,000
2019 FX Normalised 2019 Return on higherfixed assets
Others 2020
HK$m
Hong Kong ACOI
Dependable performance, ~50% gas-fired generation delivered
13
High supply reliability >99.999% (1)
Local sales down 0.9% with higher sales to residential and lower sales to other sectors
Significant progress in decarbonisation
First CCGT unit commissioned and early civil works for the second CCGT unit commenced
Offshore LNG terminal construction continued, and marine installation commenced
Waste-to-energy project commissioned
Over 840,000 smart meters installed by end-2020 and a total of around 175MW applications for Feed-in Tariff approved
Higher earnings predominantly reflecting investment in fixed assets
Capex incurred in 2020 (accrual basis)
• T&D capex HK$4.5 bn• Generation capex HK$4.4 bn
Higher Basic Tariff in 2021 reflecting ongoing investment. Net tariff flat
Engage with Hong Kong Government on plans to become carbon neutral in electricity sector by 2050
Continue investments in major projects under the current 5-year Development Plan for 2018-2023
Accelerate digitalisation adoption within the business, pursue renewable energy and energy efficiency & conservation initiatives
Maintain highly reliable power supply, while supporting our customers, communities and employees
Operational Performance
Increase on like-for-like basis after adjusting for FX
(1) Supply reliability based on average unplanned customer minutes lost per year
+3%

-
2,830
99
2,929
(86)
23
(63)
(128)
1,725
951
(500)
0
500
1,000
1,500
2,000
2,500
3,000
3,500
2019 FX Normalised2019
Nuclear Renewables Thermal Others 2020
HK$m Mainland China ACOI
220
Mitigated impact from COVID-19
Renewables
Nuclear
Thermal
Others
14
(35)
2,768
Decrease on like-for-like basis after adjusting for FX
-5%
Nuclear• Daya Bay: Steady output • Yangjiang: Higher generation with Unit 6 in
operation, partially offset by lower Q1 demand
Renewables • Solid performance from diversified portfolio• Laiwu III Wind commissioned in Sept 2020
Thermal• Reliable operation. Higher demand at
Fangchenggang (FCG) offset by lower sent-out from other assets
New opportunities• FCG Incremental Distribution Network
commenced supply to customers in April 2020
Nuclear• Contributed ~60% of Mainland China earnings• Stable earnings from Daya Bay• Lower CLP earnings from Yangjiang driven by higher
costs and taxes partially offset by higher generation
Renewables• Higher earnings reflecting contribution from new
projects of CLP Laizhou II Wind and Laiwu III Wind• Continuing delay in payment of renewable national
subsidies impacted cash flow
Thermal• Lower contribution from FCG and minority assets
Pursue opportunities resulting from carbon neutral targets
Develop energy infrastructure initiatives and energy-as-a-service opportunities in the Greater Bay Area
Monitor the evolution of market regulations and carbon trading. Market competition anticipated to continue with increased pressure on margins
Operational Performance

1,031
(62)
21969
(93)
45
(115)
26
506
0
200
400
600
800
1,000
1,200
2019 FX Normalised2019
Renewables New Solarprojects
Thermal Transmission Others 2020
HK$mIndia ACOI
Earnings lower due to low wind speed, partially offset by new transmission and solar
Renewables
Transmission
Thermal
15
Decrease on like-for-like basis after adjusting for FX
57
352
884
Renewables
• Lower wind generation due to lower wind resource
• Solar generation in line with previous year and two new solar projects added
Thermal
• Steady performance from Jhajjar
• No generation at Paguthan plant
Transmission
• Reliable operation with 100% availability
Renewables
• Lower earnings from wind projects, partially offset by two new solar projects added
• Continued challenge in the collection of receivables
Thermal
• Lower costs at Paguthan and Jhajjar, partially offset by lower capacity tariff at Jhajjar
Transmission
• Full year contribution from the first asset
Others
• Lower revenue received on delayed payment from renewable debtors
• Impairment of Khandke Wind and Paguthan
Continue to pursue investments in non-carbon assets subject to the new foreign direct investment rules announced in April 2020
Progress construction of Sidhpur wind farm
Actively pursue overdue receivables for renewable generation
Operational Performance
-9%
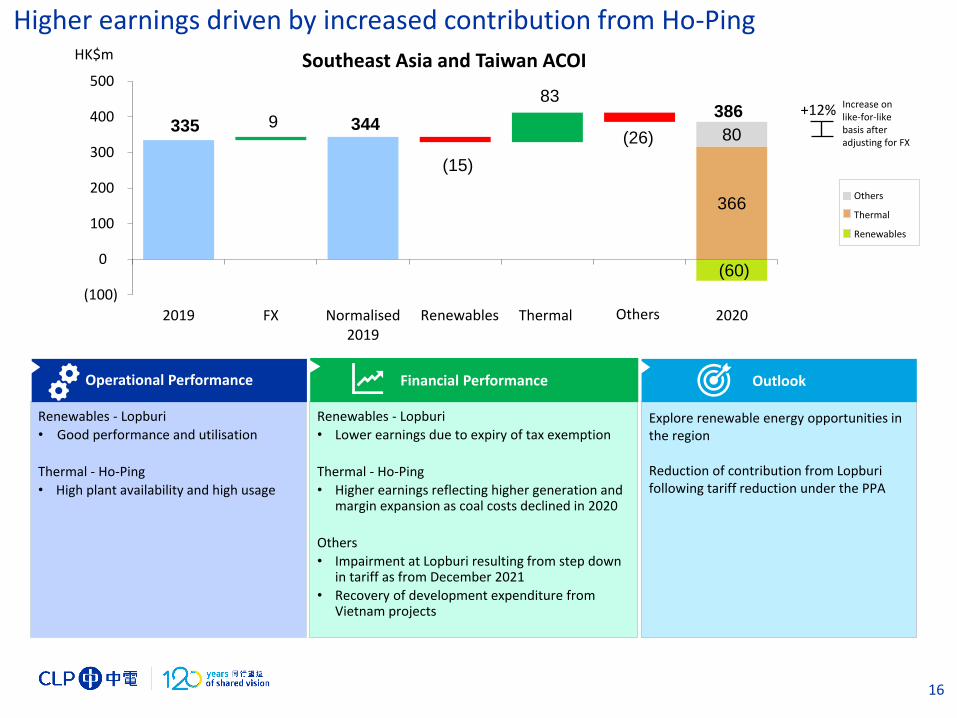
344 386
366
335 9
(15)
83
(26)
(60)
80
(100)
0
100
200
300
400
500
2019 FX Normalised2019
Lopburiearnings
Thermal Opex & Devex 2020
HK$m Southeast Asia and Taiwan ACOI
Renewables
Higher earnings driven by increased contribution from Ho-Ping
16
+12% Increase on like-for-like basis after adjusting for FX
Renewables - Lopburi
• Good performance and utilisation
Thermal - Ho-Ping
• High plant availability and high usage
Renewables - Lopburi
• Lower earnings due to expiry of tax exemption
Thermal - Ho-Ping
• Higher earnings reflecting higher generation and margin expansion as coal costs declined in 2020
Others
• Impairment at Lopburi resulting from step down in tariff as from December 2021
• Recovery of development expenditure from Vietnam projects
Explore renewable energy opportunities in the region
Reduction of contribution from Lopburifollowing tariff reduction under the PPA
Operational Performance
Others
Thermal
Renewables
Others
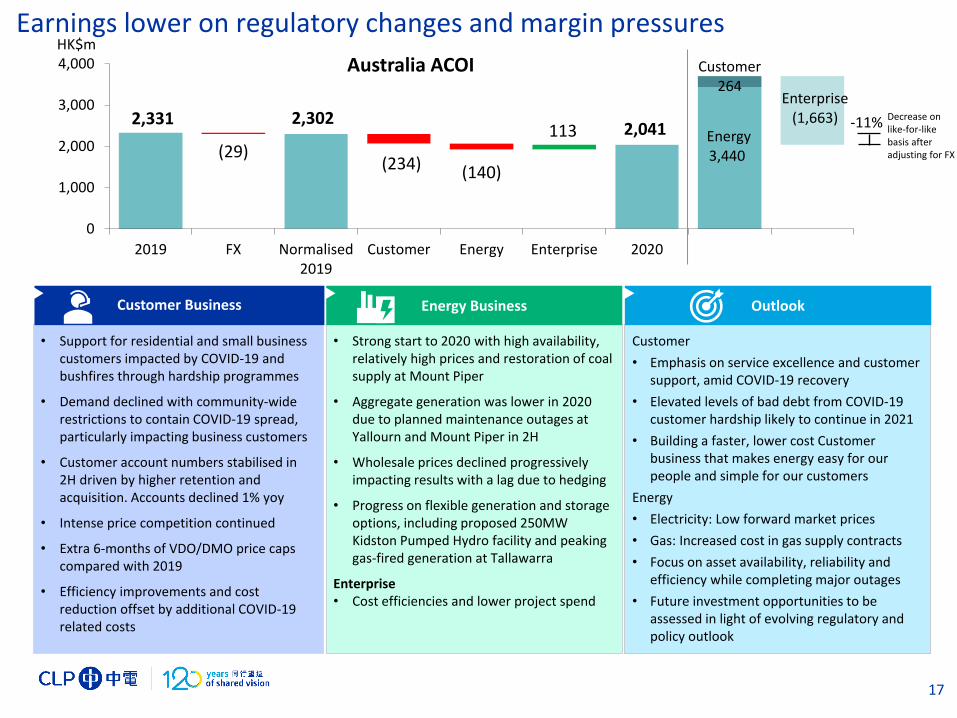
2,331
(29)
2,302
(234) (140)
113 2,041 Energy3,440
Enterprise(1,663)
Customer264
0
1,000
2,000
3,000
4,000
2019 FX Normalised2019
Customer Energy Enterprise 2020
HK$m
Australia ACOI
17
• Support for residential and small business customers impacted by COVID-19 and bushfires through hardship programmes
• Demand declined with community-wide restrictions to contain COVID-19 spread, particularly impacting business customers
• Customer account numbers stabilised in 2H driven by higher retention and acquisition. Accounts declined 1% yoy
• Intense price competition continued
• Extra 6-months of VDO/DMO price caps compared with 2019
• Efficiency improvements and cost reduction offset by additional COVID-19 related costs
• Strong start to 2020 with high availability, relatively high prices and restoration of coal supply at Mount Piper
• Aggregate generation was lower in 2020 due to planned maintenance outages at Yallourn and Mount Piper in 2H
• Wholesale prices declined progressively impacting results with a lag due to hedging
• Progress on flexible generation and storage options, including proposed 250MW Kidston Pumped Hydro facility and peaking gas-fired generation at Tallawarra
Enterprise• Cost efficiencies and lower project spend
Customer
• Emphasis on service excellence and customer support, amid COVID-19 recovery
• Elevated levels of bad debt from COVID-19 customer hardship likely to continue in 2021
• Building a faster, lower cost Customer business that makes energy easy for our people and simple for our customers
Energy
• Electricity: Low forward market prices
• Gas: Increased cost in gas supply contracts
• Focus on asset availability, reliability and efficiency while completing major outages
• Future investment opportunities to be assessed in light of evolving regulatory and policy outlook
Customer Business
-11% Decrease on like-for-like basis after adjusting for FX
Earnings lower on regulatory changes and margin pressures

Net DebtNet Debt/Total Capital
44.0 42.6
26.7% 25.1%
0%
10%
20%
30%
40%
50%
60%
0
10
20
30
40
50
60
31 Dec 2019 31 Dec 2020
Tho
usa
nd
s
HK$bn
-3.1%
Capital Investments
8.88.7
1.1 2.00.6 0.51.1 0.4
0.2 0.211.9 11.7
0
5
10
15
20
25
2019 2020
SoC MaintenanceGrowth OthersAcquisitions
HK$bn
-1.4%
Operating Return on Equity *
Cash Flow Dividend paid
18
Credit Ratings S&P Moody’s
CLP HoldingsA
Stable A2
Stable
CLP Power Hong Kong
A+ Stable
A1 Stable
CAPCOAA-
Stable A1
Stable
EnergyAustraliaBBB+Stable
-
Details on Page 33
Capital investments and dividend supported by cash flow
20.0 20.4
1.40.2
21.5 20.6
0
5
10
15
20
25
2019 2020
Cash from divestment
Free Cash FlowHK$b
-4.0%
10.4% 10.6%
0%
2%
4%
6%
8%
10%
12%
14%
2019 2020
+0.2%
* Operating Earnings/Average Shareholders’ fund
7.8 7.8
0
5
10
15
20
25
2019 2020
HK$bn

Business Trends and Outlook
In 2021 CLP celebrates its 120th Anniversary

The energy transition and decarbonisation journey in Hong Kong continues
D1 commissioned and gas-fired generation increased to around 50% in 2020. Early civil works for D2 commenced
Construction of the Offshore LNG terminal
Feed-in Tariff scheme and Renewable Energy Certificates programme
Solar panels installed at the rooftop of buildings in
Black Point Power Station
Roll out of smart meters
20
Simulated photo
D1Simulated D2
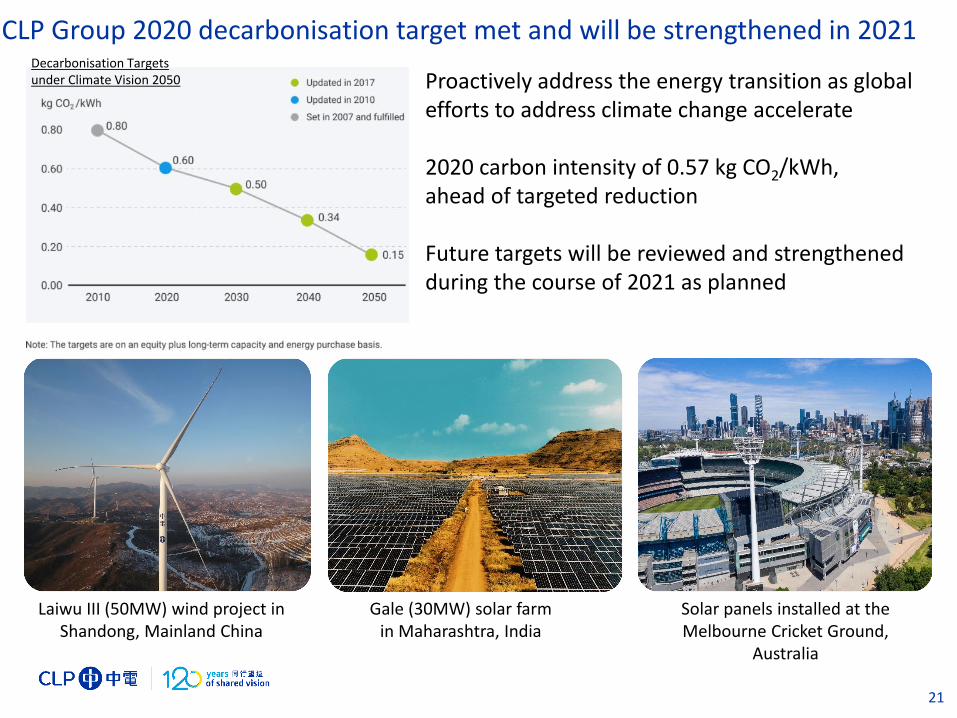
CLP Group 2020 decarbonisation target met and will be strengthened in 2021
Proactively address the energy transition as global efforts to address climate change accelerate
2020 carbon intensity of 0.57 kg CO2/kWh, ahead of targeted reduction
Future targets will be reviewed and strengthened during the course of 2021 as planned
Laiwu III (50MW) wind project in Shandong, Mainland China
Solar panels installed at the Melbourne Cricket Ground,
Australia
Gale (30MW) solar farm in Maharashtra, India
21
Decarbonisation Targets under Climate Vision 2050

Towards the Utility of the Future
22
Energy Management Systems
Building energy solutions
Clean energy and smart city technology
Global energy start-up programme
Partnership
Sustainability & resource efficiency
Empowering Energy Digitalisation
New Technology,Investments &Partnerships
Mobilising the Energy-as-a-
Service Strategy
Advanced Energy
Infrastructure
Smart energy technologies
CLP joins CSG Energy Innovation Equity
Investment Fund in GBA

Focus > Delivery > Growth > to build the Utility of the Future
Australia
SEA & Taiwan
Hong KongDeliver clean energy
infrastructure and enhance customer experience
India
Climate Vision 2050
Work towards ourdecarbonisation goals
Digital Transformation
Implement innovation initiatives
Pursue growth
opportunities, with focus
in the Greater Bay Area
Focus on
customer
experience,
efficiency and
asset reliability
Investments along
the low-carbon
electricity
supply chain
23
Mainland China
Business optimisation
Customer Centricity
Focus on the customer

Questions and Answers
CLP Laizhou II Wind Farm, Shandong, ChinaBattery Storage Systems at Ballarat and Gannawarra, Victoria, AustraliaTornado Solar Farm, Maharashtra, India(clockwise from top left)

Appendices
Installation of solar panels by CLPe Solutions at HSBC Building Tseung Kwan O

Financial Information 2020 2019 Change
Operating earnings (HK$M) 11,577 11,121 +4.1%
Total earnings (HK$M) 11,456 4,657 +146%
Operating earnings per share (HK$) 4.58 4.40 +4.1%
Total earnings per share (HK$) 4.53 1.84 +146%
Dividends per share (HK$)
First to third interim dividendFourth interim dividend
1.891.21
1.891.19
-+1.7%
Total interim dividends 3.10 3.08 +0.6%
Capex (HK$M) - Cash basis
SoC CapexOther Capex
8,6863,005
8,8463,015
-1.8%-0.3%
31 Dec 2020 31 Dec 2019
Leverage
Net Debt (HK$M) 42,640 44,023 -3.1%
Net Debt/Total Capital (%) 25.1% 26.7% -1.6%
CLP Group – Financial Highlights – Additional Information
26

(1) Equity basis plus long-term capacity and energy purchase arrangements. Includes battery discharge capacity(2) Non-carbon emitting includes wind, hydro, solar and nuclear(3) Unplanned customer minutes lost - average of the past 36 months
Operating Information 2020 2019 Change
Safety (Total Recordable Injury Rate) 0.32 0.38 -0.06
Electricity sent out (TWh) (1) 85.9 88.6 -3.0%
Generation and Storage Capacity (GW) (1)
Total in Operation 24.1 23.4 +0.7
Non-Carbon Emitting (2) 6.0 5.9 +0.1
Committed / Under Construction 0.6 0.6 -0.1
Customer Accounts (Thousand)
Hong Kong
Australia
2,672
2,449
2,636
2,480
+36
-31
Hong Kong local electricity sales (TWh) 34.0 34.3 -0.3
Reliability in Hong Kong (minutes lost pa) (3)
Excluding Typhoon Mangkhut
Including Typhoon Mangkhut
0.92
9.77
1.27
10.13
-0.35
-0.36
CLP Group – Operating Highlights – Additional Information
27

HK$M 2020 2019
Hong Kong
Revaluation loss on investment property (121) (83)
Australia
Impairment on retail goodwill - (6,381)
Items affecting comparability (121) (6,464)
Items affecting comparability
Hong Kong Revaluation loss on investment property
• Relates to the retail portion of the Laguna Mall in Hong Kong
Australia Impairment of retail goodwill in 2019
• During the first half of 2019, the Default Market Offer and Victorian Default Offer wereannounced in Australia. These retail tariffs applied to customers on “standing offer tariffs” whichresulted in a reduction in tariffs for these customers from 1 July 2019. In parallel,EnergyAustralia promoted new simple, lower cost energy plans to existing customers on marketoffers
• These changes resulted in a decrease in earnings in EnergyAustralia’s Retail segment which willlikely sustain into the future. Taking into account the potential impacts on retail earnings, animpairment of HK$6,381 million was recognised
28

* Including net fair value loss/(gain) on debt related derivative financial instruments, and other net exchange loss/(gain) on financing activities and distribution to perpetual capital securities holders# Including net fair value loss/(gain) on non-debt derivative financial instruments relating to transactions not qualifying as hedges and ineffectiveness of cash flow hedges
HK$MHong Kong
electricity and related
Mainland China India SEA & Taiwan Australia Other earnings &
unallocated itemsGroup total
2020 Annual results
Operating Earnings (as per Segment
Information in Annual Report)7,580 2,503 175 386 1,690 (757) 11,577
Reallocation of PSDC & HK Branch Line 270 (270) - - - - -
Reallocation of Other earnings 238 - - - - (238) -
Operating Earnings (as per Management
Reporting in this presentation pack)8,088 2,233 175 386 1,690 (995) 11,577
Add back
Non-controlling interests 744 7 163 - - - 914
Net finance costs/(income) * 1,125 246 440 - 88 (24) 1,875
Income tax expense 1,897 282 106 - 703 5 2,993
Fair value adjustments # (20) - - - (440) - (460)
ACOI 11,834 2,768 884 386 2,041 (1,014) 16,899
2019 Annual results
Operating Earnings (as per Segment
Information in Annual Report)7,249 2,488 263 335 1,566 (780) 11,121
Reallocation of PSDC & HK Branch Line 211 (211) - - - - -
Reallocation of Other earnings 199 - - - - (199) -
Operating Earnings (as per Management
Reporting in this presentation pack)7,659 2,277 263 335 1,566 (979) 11,121
Add back
Non-controlling interests 710 15 160 - - - 885
Net finance costs * 1,211 261 458 - 60 43 2,033
Income tax expense 1,821 277 150 - 534 5 2,787
Fair value adjustments # 6 - - - 171 (1) 176
ACOI 11,407 2,830 1,031 335 2,331 (932) 17,002
CLP Group – Reconciliation of Operating Earnings and ACOI
29

(1) Capital investments include fixed assets, right-of-use assets, investmentproperty, intangible assets, investments in and advances to joint venturesand associates, and acquisition of business/asset
(2) Capital expenditure on fixed assets and right-of-use assets are furtheranalysed into• SoC capex - capital expenditure related to the SoC business• Growth capex - capital expenditure for additional generation capacity• Maintenance capex - capital expenditure other than the above
(3) Capital investments on intangibles assets and investments in and advancesto joint ventures and associates
(4) Net of bank balance, cash and other liquid funds
Cash Flow
• Higher free cash flow mainly reflected favourable working capital
movements offset by higher maintenance capex in Australia
• Cash from divestment represented the recovery of development
cost of Vung Ang II upon sale of entire interest in 2020
Capital Investments
• HK$8.7 billion SoC capex related to enhancement of transmission
and distribution networks and generation facilities including
construction of CCGT units and investment in Offshore LNG Terminal
• Growth capex mainly included our investments in renewableprojects in Mainland China and India, as well as the capacityexpansion at Mount Piper and Hallett in Australia
• Maintenance capex largely represented enhancement works mainlyon Yallourn and Mt Piper in Australia
• Acquisition of business and other capex mainly related to theacquisitions of two solar projects in India and intangible additions inAustralia, including Enterprise Systems Transformation project andcustomer service-related systems
Net Debt/Total Capital
• Moderate decrease in the Group’s net debt to total capital iscontributed by lower net debt from higher cash inflow
HK$M 2020 2019
Cash Flow
EBITDAF 25,254 18,656
Less: Items affecting comparability 121 6,464
Recurring EBITDAF 25,375 25,120
Less: Movement in SoC items 398 1,057
Less: Movement in working capital & others (1,355) (2,675)
Funds from operations 24,418 23,502
Less: Tax paid (2,182) (2,322)
Less: Net finance costs paid (2,139) (2,176)
Less: Maintenance capex (1,999) (1,083)
Add: Dividends from joint ventures & an associate 2,320 2,106
Free Cash Flow 20,418 20,027
Cash from divestment 208 1,449
Capital Investments (1)
• SoC capex(2)
8,686 8,846
• Maintenance capex(2)
1,999 1,083
• Growth capex (2)
452 617
• Others(3)
358 1,099
• Acquisitions of businesses 196 216
Total 11,691 11,861
Dividend paid 7,782 7,782
End of year 2020 2019
Net Debt (4) (HK$M) 42,640 44,023
Net Debt/Total Capital (%) 25.1% 26.7%
CLP Group – Cash Flow and Financial Structure
30

(1) Dividend adjusted for one bonus share issued for every five existing shares in 1993 and 2001 (2) Special dividends mainly relate to major property development and one additional interim dividend due to change of accounting year in 1999
CLP’s Dividend Policy aims to provide reliable and consistent ordinary dividend with steady growth when supported byour earnings while ensuring that a solid financial position can be maintained to fund our business growth. In line withour established practice, our ordinary dividends are paid four times a year in each of the quarters.
CLP Group – Dividend(1) History
31
0.54 0.55 0.57 0.59 0.61 0.63 0.63
0.54 0.55 0.57 0.59 0.61 0.63 0.63
0.54 0.55 0.57 0.59 0.61 0.63 0.63
1.00 1.05 1.09
1.14 1.19 1.19 1.21
-
0.5
1.0
1.5
2.0
2.5
3.0
3.5CLP Dividend 1990 - 2020
Q1 Q2 Q3 Final/ Q4 Special^
2.622.70
2.802.91
3.02 3.08 3.10
Special (2)

31 Dec 2020 31 Dec 2019
HONG KONG HK$M HK$M
Total borrowings of CLPP, CAPCO & PSDC 43,449 41,378
Minus: Bank balances and liquid funds (6,598) (4,747)
Net Debt 36,851 36,631
OUTSIDE HONG KONG
Total borrowings of India and Mainland China subsidiaries (non-recourse to CLPH) 10,899 10,971
Minus: Bank balance and liquid funds (5,110) (3,579)
Net debt 5,789 7,392
CONSOLIDATED total borrowings 54,348 52,349
Minus: Consolidated bank balance and liquid funds (11,708) (8,326)
Consolidated Net debt 42,640 44,023
Total Debt/Total Capital 30.0% 30.3%
Net Debt/Total Capital 25.1% 26.7%
CLP Group – Financial Obligations at a Glance
32
Moderate decrease in the Group’s net debt to total capital is contributed by lower net debt from higher cash inflow.

A1
Stable
A1
Stable
A+
Stable
A+
Stable
Long-term Rating
Foreign Currency
Outlook
Local Currency
Outlook
Short-term Rating
Foreign Currency
Local Currency
S&P Moody’s S&P
CLP Holdings EnergyAustralia
A-1
A-1
P-1
P-1
A-1
A-1
-
-
P-1
P-1
A
Stable
A
Stable
A2
Stable
A2
Stable
Between May and August 2020, S&P and Moody’s affirmed the credit ratings of CLP Holdings, CLP Power Hong Kong and CAPCO with stable outlooks. In August 2020, S&P
affirmed the credit rating of EnergyAustralia with stable outlook.
BBB+
Stable
BBB+
Stable
CLP Group – Credit Ratings
33
S&P Moody’s
CLP Power
S&P Moody’s
CAPCO
AA-
Stable
AA-
Stable
A1
Stable
A1
Stable
A-1+
A-1+
P-1
P-1
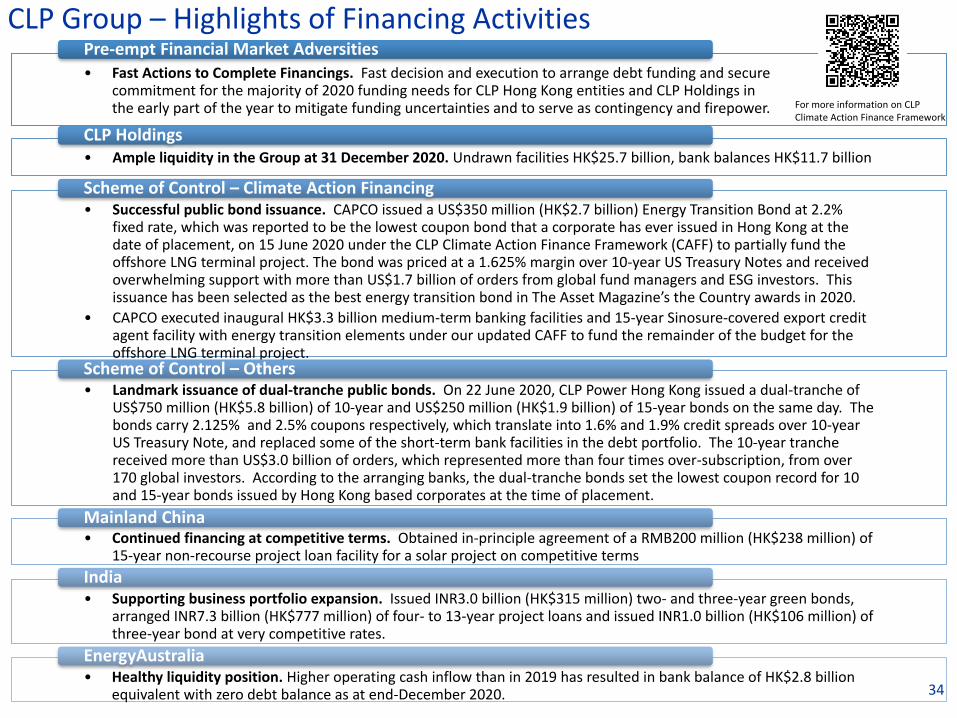
CLP Group – Highlights of Financing Activities
• Fast Actions to Complete Financings. Fast decision and execution to arrange debt funding and secure commitment for the majority of 2020 funding needs for CLP Hong Kong entities and CLP Holdings in the early part of the year to mitigate funding uncertainties and to serve as contingency and firepower.
Pre-empt Financial Market Adversities
• Ample liquidity in the Group at 31 December 2020. Undrawn facilities HK$25.7 billion, bank balances HK$11.7 billion
CLP Holdings
• Successful public bond issuance. CAPCO issued a US$350 million (HK$2.7 billion) Energy Transition Bond at 2.2% fixed rate, which was reported to be the lowest coupon bond that a corporate has ever issued in Hong Kong at the date of placement, on 15 June 2020 under the CLP Climate Action Finance Framework (CAFF) to partially fund the offshore LNG terminal project. The bond was priced at a 1.625% margin over 10-year US Treasury Notes and received overwhelming support with more than US$1.7 billion of orders from global fund managers and ESG investors. This issuance has been selected as the best energy transition bond in The Asset Magazine’s the Country awards in 2020.
• CAPCO executed inaugural HK$3.3 billion medium-term banking facilities and 15-year Sinosure-covered export credit agent facility with energy transition elements under our updated CAFF to fund the remainder of the budget for the offshore LNG terminal project.
Scheme of Control – Climate Action Financing
• Landmark issuance of dual-tranche public bonds. On 22 June 2020, CLP Power Hong Kong issued a dual-tranche of US$750 million (HK$5.8 billion) of 10-year and US$250 million (HK$1.9 billion) of 15-year bonds on the same day. The bonds carry 2.125% and 2.5% coupons respectively, which translate into 1.6% and 1.9% credit spreads over 10-year US Treasury Note, and replaced some of the short-term bank facilities in the debt portfolio. The 10-year tranche received more than US$3.0 billion of orders, which represented more than four times over-subscription, from over 170 global investors. According to the arranging banks, the dual-tranche bonds set the lowest coupon record for 10 and 15-year bonds issued by Hong Kong based corporates at the time of placement.
Scheme of Control – Others
• Continued financing at competitive terms. Obtained in-principle agreement of a RMB200 million (HK$238 million) of 15-year non-recourse project loan facility for a solar project on competitive terms
Mainland China
• Supporting business portfolio expansion. Issued INR3.0 billion (HK$315 million) two- and three-year green bonds, arranged INR7.3 billion (HK$777 million) of four- to 13-year project loans and issued INR1.0 billion (HK$106 million) of three-year bond at very competitive rates.
India
• Healthy liquidity position. Higher operating cash inflow than in 2019 has resulted in bank balance of HK$2.8 billion equivalent with zero debt balance as at end-December 2020.
EnergyAustralia
For more information on CLP Climate Action Finance Framework
34

1) The maturity of revolving loans is in accordance with the maturity dates of the respective facilities instead of the current loan drawdown tenors
2) For floating rate borrowings, if assuming 1% increase in interest rate and based on outstanding debt balance as at 31 December 2020, the additional interest payment is around HK$203 million per annum
3) CLP continues to obtain debt (re)financing at very cost effective interest rates. Some representative examples in 2020 are highlighted on page 34 (“CLP Group – Highlights of Financing Activities”)
CLP Group – Loan Balances by Type and Maturity
35
Floating rate (2) Fixed rate
54%46% 63%
37%
Proportion of debt on fixed and floating rate
Dec 2020
Dec 2019

Generation Transmission Distribution Retail
9,770 MW generation portfolio
> 16,200 km of transmission and high voltage distribution lines
235 primary and > 15,000 secondary substations
During 2020:
• Local electricity sales decreased 0.9% to 33,963GWh as compared with 2019
• No. of customer accounts increased by 36k to 2,672k ascompared with 2019
• Major infrastructure projects ongoing
• A new 550MW gas-fired generation unit at Black PointPower Station was commissioned
• Construction of the CCGT D2 Project has started in July2020. Engineering, Procurement, Construction of thePower Island by the selected Original EquipmentManufacturer is scheduled
• The fifth unit of gas turbine upgrade project at BlackPoint Power Station completed with 25MW generationcapacity added (125MW added in total)
• Over 200 km of new transmission and high voltagedistribution lines & 160 new substations added
• Our Customer Services Centre in Kwun Tong was renovated as Smart Energy@Kwun Tong. New products and solutions, like e-Service kiosk, Grab & Go vending machine and Smart Shopping Locker, were demonstrated to drive self-service online-to-offline adoption We generate, transmit and distribute electricity to
over 80% of Hong Kong’s population in Kowloon, the New Territories and on Lantau Island
33,963 GWh sold and
2.67 million customer accounts
Hong Kong – Growing Business Scale
36
27%
40%
28%
5%30%
38%
27%
5%
2020
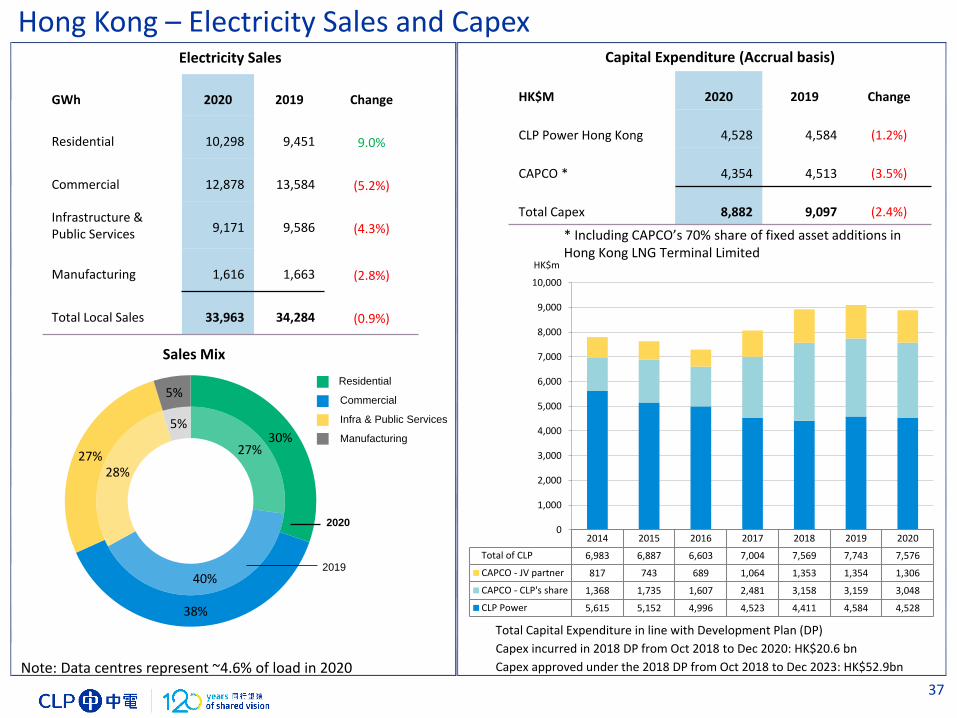
Total Capital Expenditure in line with Development Plan (DP)
Capex incurred in 2018 DP from Oct 2018 to Dec 2020: HK$20.6 bn
Capex approved under the 2018 DP from Oct 2018 to Dec 2023: HK$52.9bn
Electricity Sales
GWh 2020 2019 Change
Residential 10,298 9,451 9.0%
Commercial 12,878 13,584 (5.2%)
Infrastructure & Public Services 9,171 9,586 (4.3%)
Manufacturing 1,616 1,663 (2.8%)
Total Local Sales 33,963 34,284 (0.9%)
Capital Expenditure (Accrual basis)
HK$M 2020 2019 Change
CLP Power Hong Kong 4,528 4,584 (1.2%)
CAPCO * 4,354 4,513 (3.5%)
Total Capex 8,882 9,097 (2.4%)
Sales Mix
2019
Residential
Commercial
Infra & Public Services
Manufacturing
Hong Kong – Electricity Sales and Capex
37
2014 2015 2016 2017 2018 2019 2020
Total of CLP 6,983 6,887 6,603 7,004 7,569 7,743 7,576
CAPCO - JV partner 817 743 689 1,064 1,353 1,354 1,306
CAPCO - CLP's share 1,368 1,735 1,607 2,481 3,158 3,159 3,048
CLP Power 5,615 5,152 4,996 4,523 4,411 4,584 4,528
0
1,000
2,000
3,000
4,000
5,000
6,000
7,000
8,000
9,000
10,000
HK$m
Note: Data centres represent ~4.6% of load in 2020
* Including CAPCO’s 70% share of fixed asset additions in Hong Kong LNG Terminal Limited

-100%
-80%
-60%
-40%
-20%
0%
20%
40%
60%
80%
100%
Environmental ImprovementOver 90% emissions reduction with
80% increase in electricity sales since 1990
Hong Kong – Tariff, Reliability, Environmental and Carbon Intensity
38
Change
- Over 90% in Emissions
+ 80% in Electricity Demand
Nitrogen Oxide (NOx)
Sulphur Dioxide (SO2)
Respirable Suspended Particulates (RSP)
Electricity Sales
Carbon Emission IntensityCarbon emission intensity has reduced by 26% in 2020
0.50
0.37
0.0
0.2
0.4
0.6
2019 2020
kg C
O2e/
kWh
0.0
0.5
1.0
1.5
2.0
2.5
3.0
CLP Power Singapore London Sydney New York
HK$/kWh
Remarks: Comparison based on average monthly domestic consumption of 275kWh
Tariff and exchange rate in Jan 2021
Low Tariff
0.9 1.7
1518 19
0
10
20
30
Unplanned customer minutes lost per year
Sydney
(CBD)New YorkLondonSingapore
Remarks:(1) 2018-2020 average for CLP Power was 0.9 minutes excluding Super Typhoon Mangkhut impact (9.8 minutes including Super Typhoon Mangkhut)2017-2019 average for all other cities except for New York (2016-2018)
More Reliable Less Reliable
High Reliability
CLP Power
-26%

2012 2013 2014 2015 2016 2017 2018 2019 2020
Yacheng Gas WEP II Gas CNOOC Gas
Gas Volume
Hong Kong – Tariff, Energy Cost, Fuel Mix and Gas Volume
39
3,654 1,270
8,11511,032
6,787 6,714
237 356
18,793 19,372
0
5,000
10,000
15,000
20,000
25,000
2019 2020
Others
Nuclear
Gas
Coal
HK$M
+3%
Energy Cost
36%
29%
35%
15%
48%
36%
1%
Coal
Gas
Nuclear
Others (e.g. Oil)
2020
2019
Fuel Mix(based on MWh generated/purchased)
Tariffs
-20
0
20
40
60
80
100
120
140
93.7
121.8
HK¢/kWh
Average Net Tariff
Basic Tariff
Fuel Cost Adjustment 28.1*
Special Rebate
* According to the rate announced in the annual tariff review. During the year, the Fuel Cost Adjustment is automatically adjusted on a monthly basis to reflect changes in actual price of fuel used.

The average foreign exchange rates used to convert Mainland China Segment earnings to Hong Kong dollarsare 1.13436 for 2019 and 1.12370 for 2020. Note that in the ACOI variance analysis presented in the bodyof the presentation 2019 earnings are adjusted for changes in foreign exchange before year on yearvariance in underlying performance is illustrated.
Mainland China – Financials (HK$)
40
Mainland China
HK$M Operating/Total Earnings ACOI
2020 2019 2020 2019
Renewables 565 547 951 935
- Wind 306 270 457 405
- Hydro 88 104 194 230
- Solar 171 173 300 300
Nuclear 1,594 1,688 1,725 1,828
- Daya Bay 933 938 982 988
- Yangjiang 661 750 743 840
Thermal 203 264 220 285
- Shandong (7) (6) (3) (2)
- Guohua (1) 33 (1) 34
- Fangchenggang 211 237 224 253
Operating and development expenditure
(129) (222) (128) (218)
Operating earnings /ACOI 2,233 2,277 2,768 2,830
Total earnings 2,233 2,277

Mainland China
Mainland China – Financials (Local Currency)
41
RMB’M Operating/Total Earnings ACOI
2020 2019 2020 2019
Renewables 503 482 846 824
- Wind 272 237 407 357
- Hydro 79 92 172 203
- Solar 152 153 267 264
Nuclear 1,418 1,488 1,535 1,612
- Daya Bay 830 827 874 871
- Yangjiang 588 661 661 741
Thermal 181 233 196 250
- Shandong (6) (5) (3) (3)
- Guohua (1) 29 (1) 30
- Fangchenggang 188 209 200 223
Operating and development expenditure (178) (148) (177) (144)
Operating earnings /ACOI 1,924 2,055 2,400 2,542
Total earnings 1,924 2,055

264 203 285 220
1,688 1,594 1,828 1,725
547 565935 951
(222) (129) (218) (128)
2,277 2,233
2,830 2,768
-500
0
500
1,000
1,500
2,000
2,500
3,000
3,500
4,000
2019 2020 2019 2020
Operating Earnings ACOI
• Economic growth slowed down due to the outbreak of COVID-19 pandemic. The operating environment remains challenging from reforms in
macroeconomic policies in the energy sector
• Earnings from Fangchenggang remained positive, benefitting from higher demand and lower coal cost
• Earnings from Yangjiang were lower mainly due to higher costs and taxes which is partially offset by higher generation from the commissioning of
the sixth and final unit in July 2019
• Higher earnings from renewables due to CLP Laizhou II Wind and Laiwu III Wind commissioned in June 2019 and September 2020 respectively as
well as less grid curtailment for solar project in northwest
• Total receivables relating to the unpaid renewables national subsidy from our subsidiaries increased to HK$1,774 million
(Dec 2019: HK$1,268 million). While there are still delays in receiving subsidies we continue to receive payments and there is no history of default
• Business development opportunities
• Laiwu III Wind (50MW) in Shandong commenced commercial operations in September 2020
• Qian’an III Wind (100MW) in Jilin attained grid parity development quota for full site construction in 1Q2021
• FCG Incremental Distribution Network (through TUS-CLP joint venture) began electricity supply to customers in April 2020
• Participated in CSG Energy Innovation Equity Investment Fund, which focus on innovative energy development, new energy infrastructure and
smart energy in the Greater Bay Area, along with China Southern Power Grid
(1) Equity basis plus long-term capacity and energy purchase arrangementsOver 90% of earnings from non-carbon
Renewable Nuclear Thermal Others
HK$MMainland China – Renewables and Generation
42
0
2,000
4,000
6,000
8,000
10,000
2009 2010 2011 2012 2013 2014 2015 2016 2017 2018 2019 2020
MW CLP capacity(1) in Mainland China
Thermal Nuclear Renewable PSDC Under construction

JILIN
LIAONING
HEBEI
GANSU
SHAANXI
SICHUAN
GUIZHOU
JIANGSU
GUANGDONGGUANGXI
TIANJIN
SHANDONG
SHANGHAI
INNER MONGOLIA
Mainland China – Market Sales in 2020
43
Market sales are prevailing in various forms in different provinces in Mainland China.
Overall around 52% of our share of generation volumes were under market sales in 2020 (2019: 51%).
Directionally market sales in Mainland China will continue to increase.
Province Projects with Market Sales(Equity MW)
Guangxi FCG thermal (1,806MW)
Yunnan Xundian Wind (50MW) Xicun Solar (84MW) Dali Yang_er Hydro (50MW)
Inner Mongolia
Zhungeer thermal (257MW)
Sichuan Jiangbian Hydro (330MW)
Gansu Jinchang Solar (85MW)
Hebei Sanhe thermal (220MW)
Jilin Qian’an Wind (99MW) Changling II Wind (22MW) Datong Wind (24MW) Shuangliao Wind (48MW)
Tianjin Panshan thermal (207MW)
Shandong Shiheng thermal (370MW)
Liaoning Suizhong thermal (564MW) Mazongshan Wind (12MW) Qujiagou Wind (12MW)
Guangdong Yangjiang Nuclear (1,108MW)
YUNNAN>90-100% market sales
>50-90% market sales
>20-50% market sales
20% or less market sales
No market sales
Note: Daya Bay Nuclear not included in the calculation of market sales ratio

HK$ Local Currency
2020 2019 2020 2019
HK$M HK$M Rs M Rs M
Renewables 506 687 4,831 6,174
Thermal (Jhajjar) 496 507 4,736 4,556
Thermal (Paguthan) (144) (168) (1,375) (1,510)
Transmission 26 5 248 46
ACOI 884 1,031 8,440 9,266
Renewables 104 227 993 2,040
Thermal (Jhajjar) 121 51 1,155 458
Thermal (Paguthan) (55) (16) (525) (144)
Transmission 5 1 48 9
Operating/Total earnings 175 263 1,671 2,363
The average foreign exchange rates used to convert Indian Segment earnings to Hong Kong dollars are 0.11127for 2019 and 0.10473 for 2020. Note that in the ACOI variance analysis presented in the body of thepresentation 2019 earnings are adjusted for changes in foreign exchange before year on year variance inunderlying performance is illustrated.
India – Financials
44
India

35 66
339 352
1 5
5 26
227 104
687 506
263 175
1,031
884
0
200
400
600
800
1,000
1,200
2019 2020 2019 2020
Operating Earnings
Expanding our renewable generation portfolio
• Power purchase agreement, EPC and O&M contract for Sidhpur wind project in Gujarat was signed in 2020, constructionteam mobilised
• Total receivables relating to revenue from our renewable energy projects decreased to HK$771 million(Dec 2019: HK$805 million). While there are delays in receiving revenue we continue to receive payments and there isno history of default
• Our partnership with CDPQ has brought long-term strategic backing & additional resources to support continuing growth
• We are actively exploring further potential opportunities for acquisitions and investments in renewable energy andtransmission, as the Government continues to implement energy industry reforms
2020 renewables earnings including contribution from new solar projects acquired.
Operating Earnings are net of CDPQ share
Renewables
Transmission
Thermal
HK$M
India – Broadening the Portfolio
45
ACOI
Recent acquisitions of solar and power transmission assets
• CLP India increased the size of its solar energy portfolio by80MW, when two projects with capacity of 30MW & 50MWrespectively, were transferred to CLP India in March and April2020. The share transfer of the third project of 42MW couldnot be concluded.
• In 2019, CLP India agreed to buy three transmission projects.The first project of 240km in Madhya Pradesh State wastransferred to CLP India in November 2019 and has achieved100% availability since the acquisition. In May 2020 CLP Indiawas notified that certain regulatory conditions precedentassociated with the acquisition of the second transmissionasset had not been met and the planned transaction wasterminated. The third and final asset of 251km in Manipur,Nagaland and Assam States is fully commissioned andexpected to be taken over by CLP India in the first half of2021 post achievement of all conditions precedent includingGovernment approvals.

The average foreign exchange rates used to convert SEA & Taiwan Segment earnings to Hong Kong dollarsare 0.2531 and 0.2539 for 2019 and 0.2476 and 0.2637 for 2020 for Thai Baht and New Taiwan Dollarsrespectively. Note that in the ACOI variance analysis presented in the body of the presentation 2019earnings are adjusted for changes in foreign exchange before year on year variance in underlyingperformance is illustrated
SEA & Taiwan
HK$ Local Currency
2020 2019 2020 2019
HK$M HK$M M M
ACOI
Thermal 366 272 NT$1,388 NT$1,072
Renewables (60) 80 (THB243) THB317
Operating expenditure (14) (16) - -
Development expenditure 94 (1) - -
Total 386 335
Operating earnings
Thermal 366 272 NT$1,388 NT$1,072
Renewables (60) 80 (THB243) THB317
Operating expenditure (14) (16) - -
Development expenditure 94 (1) - -
Total 386 335
Southeast Asia & Taiwan – Financials
46

The average foreign exchange rates used to convert Australian Segment earnings to Hong Kong dollars are 5.4475for 2019 and 5.3799 for 2020. Note that in the ACOI variance analysis presented in the body of the presentation2019 earnings are adjusted for changes in foreign exchange before year on year variance in underlyingperformance is illustrated.
Australia – Financials
47
(1) Retail hedging portfolio transferred from Energy to Customer and centrally managed projects transferred fromEnterprise to relevant Customer or Energy segment in 2020, 2019 restated.(2) Fair value adjustments have been mainly driven by falling forward prices which favourably impact contracts tosell energy.
HK$ Local Currency
2020 2019 2020 2019
HK$M HK$M A$M A$M
EBITDAF (before items affecting comparability)
4,041 4,231 745 777
Depreciation & Amortisation (2,000) (1,900) (372) (349)
ACOI
Customer (Retail) (1) 264 504 49 93
Energy (Wholesale) (1) 3,440 3,625 633 665
Enterprise (Corporate) (1) (1,663) (1,798) (309) (330)
Total 2,041 2,331 373 428
Fair value adjustments (2) 440 (171) 82 (31)
Net finance costs (88) (60) (16) (11)
Income tax expense (703) (534) (129) (98)
Operating Earnings 1,690 1,566 310 288
Impairment of goodwill - (6,381) - (1,176)
Total earnings 1,690 (4,815) 310 (888)
Australia
2019 HK$ Local Currency (A$M)
Previous reporting
ReallocationCurrent
ReportingPrevious reporting
ReallocationCurrent
Reporting
Customer (Retail) 679 (175) 504 125 (32) 93
Energy (Wholesale) 3,621 4 3,625 665 - 665
Enterprise (Corporate) (1,969) 171 (1,798) (362) 32 (330)
ACOI (1) 2,331 - 2,331 428 - 428

Australia – Customer Operations
• Mass Market Customer accountshave fallen 31,400, with lossespredominantly in 1H2020 with28,800, with account lossesstabilising in 2H2020, down 2,600.
• Churn rates continue to decline,following Government-implementedretail electricity price caps from 1July 2019 and COVID-19.
48
(1) Weighted Average Mass Market is the average accounts of our mass market customer base during the period(2) Prior year adjustmentsNote: Individual items and totals are rounded to the nearest appropriate number. Some totals may not add down the page due to rounding of individual components
Electricity (TWh) Gas (PJ) Electricity (TWh) Gas (PJ)
Mass Market 9.7 32.2 9.9 32.5
Commercial & Industrial 7.9 9.8 8.5 12.5
Total Sales Volume 17.6 42.0 18.4 44.9
Sales Revenue (A$m) 3,933.9 947.3 4,187.6 1,004.9
Sales Volume & Revenue2020 2019
Electricity Gas Total Electricity Gas Total
Mass Market 1,594.1 846.3 2,440.4 1,620.0 848.2 2,468.2
Commercial & Industrial 8.7 0.2 9.0 12.3 0.3 12.6
Total Account Numbers 1,602.8 846.6 2,449.4 1,632.3 848.5 2,480.8
Weighted Average Mass Market (1) 1,596.9 844.5 2,441.4 1,643.1 858.3 2,501.5
Customer Account Numbers
(000s)
2020 2019 (2)

Australia – Customer Operations
49
55% of bills issued in 2020 were E-bills• Compared with 1% in 2015• Improving 8pts since 2019
19 Ombudsman complaints/10k accounts• 66% reduction since 2015• 26% reduction since 2019
Go Neutral, the largest certified carbon neutral programme for electricity customers, with over a quarter of a million customers
Supporting customers experiencing hardship – nearly 200,000 new payment extension
plans created for residential customers (1)
Acquired remaining 51% of energy specialist Echo Group
which provides solar and LED lighting solutions
25.7pts improvement in customer satisfactionsince 2015• 5.8pts improvement on 2019
Go Neutral expanded to gas customers in 2020, with over 40,000 customers opted in since September 2020
(1) Since March 2020.

Australia – Wholesale Market Conditions
50
• Sharp fall in wholesale prices in 2020 due to increasedsupply and lower spot-gas costs as international LNGdemand slumped.
• Covid-19 contributed to lower spot prices, with growth inrenewables contributing to market oversupply, likely tosuppress prices in the short to medium term.
• Investment in renewables has not been matched withrequired investment in firm dispatchable capacity.
• Our focus remains on investing in reliability of existingfleet and new flexible generation ahead of major coalretirements.
• Regulatory landscape continues to make investmentchallenging.
(1) Prices presented are the calendar year flat contract price
0
20
40
60
80
100
120
Jan-15 Jul-15 Dec-15 Jun-16 Dec-16 Jun-17 Dec-17 Jun-18 Dec-18 Jun-19 Dec-19 Jun-20 Dec-20
SWA
P P
rice
$/M
Wh
Year Ahead SWAP Prices (1)
NSW
VIC
40
50
60
70
80
90
100
110
Jan-18 Apr-18 Jul-18 Oct-18 Dec-18 Apr-19 Jul-19 Sep-19 Dec-19 Mar-20 Jun-20 Sep-20 Dec-20
SWA
P P
RIC
E $
/MW
H
VIC SWAP PRICES
CAL 2020 CAL 2021 CAL 2022 CAL 2023

TaiwanHong Kong
Australia
India
Mainland China
Thailand
• Station Name Gross MW / CLP Equity MW* including long-term capacity and energy purchase# Solar projects in AC output
19,691 Equity MW and 5,005MW Long Term Purchase (total 24,696MW)
(a) Equity basis plus long-term capacity and energy purchase arrangements. Includes battery discharge capacity(b) Including Gannawarra (25MW/50MWh) and Ballarat (30MW/30MWh)(c) Unit D1 of Black Point Power Station (550MW) achieved commercial operation(d) Laiwu III achieved commercial operation
CLP Group – Generation and Storage Portfolio(a) – 31 Dec 2020
AUSTRALIA total 5,389MW*
Operational
Yallourn 1,480 / 1,480 (c)
Mount Piper 1,400 / 1,400 (c)
Hallett 235 / 235 (g)
Newport 500 / 500 (g)
Jeeralang 440 / 440 (g)
Tallawarra 420 / 420 (g)
Wind Projects 693 / 560* (w)
Solar Projects # 362 / 294* (s)
Battery Projects(b) 55 / 55* (bs)
Wilga Park 22 / 4 (g)
INDIA Total 1,890 MW
Operational
Jhajjar 1,320 / 792 (c)
Paguthan 655 / 393 (g)
Wind Projects 924 / 555 (w)
Solar Project # 250 / 150 (s)
TAIWAN total 264 MW
Operational
Ho-Ping 1,320 / 264 (c)
THAILAND total 21 MW
Operational
Lopburi Solar # 63 / 21 (s)
HONG KONG total 8,143MW*
Operational
Castle Peak A&B 4,108 / 4,108* (c)
Black Point C&D1 (c) 3,175 / 3,175* (g)
Penny's Bay 300 /10 /
300*10*
(d)(ws)Energy-from-Waste
Under Construction
Black Point D2 550 / 550* (g)
MAINLAND CHINA total 8,990* MW
Operational
Daya Bay 1,968 / 1,577* (n)
Yangjiang 6,516 / 1,108 (n)
Pumped Storage 1,200 / 600* (p)
Fangchenggang I & II 2,580 / 1,806 (c)
SZPC 3,060 / 900 (c)
Guohua 7,470 / 1,248 (c)
Hydro Projects 509 / 489 (h)
Wind Projects(d) 1,453 / 935 (w)
Solar Projects # 328 / 328 (s)
51
Fuel Source: (c) coal-fired (g) gas-fired (w) wind (h) hydro (n) nuclear (d) diesel (s) solar (ws) energy-from-waste (p) pumped Storage (bs) - Battery Storage

2,517 Equity MW and 825 MW Long Term Purchase (total 3,342MW) - 14% of CLP total generation portfolio
• Station Name Gross MW / CLP Equity MW* including long-term capacity and energy purchase# Solar projects in AC output
CLP Group – Renewable Generation Portfolio – 31 Dec 2020
52
HONG KONG total 10 MWOperationalWest New Territories Landfill 10/10
MAINLAND CHINA total 1,752 MWOperationalWind 935 MWHydro 489 MWSolar 328 MWWeihai I & II 69 /31Nanao II & III 60 /15Shuangliao I & II 99 /48Datong 50 /24Laizhou I 41 /18Changling II 50 /22Guohua Wind 395 /194Qujiagou 50 /12Mazongshan 50 /12Qian'an I & II 99 /99Penglai I 48 /48Chongming I 48 /14Laiwu I, II & III 149 /149Xundian I 50 /50Sandu I 99 /99CLP Laizhou I & II 99 /99Jiangbian Hydro 330 /330Huaiji Hydro 129 /110Dali Yang_er Hydro 50 /50Jinchang Solar # 85 /85Xicun I & II Solar # 84 /84Sihong Solar # 93 /93Huai’an Solar # 13 /13Lingyuan Solar # 17 /17Meizhou Solar # 36 /36
AUSTRALIA total 854 MW*Operational
Wind 560 MWSolar 294 MWWaterloo 111 /56*Cathedral Rocks 64 /32Boco Rock 113 /113*Taralga 107 /107*Mortons Lane 20 /20*Gullen Range I 166 /166*Bodangora 113 /68*Gannawarra Solar # 50 /50*Ross River Solar # 116 /93*Manildra Solar # 46 /46*Coleambally Solar # 150 /105*
INDIA Total 705 MWOperationalWind 555 MWSolar 150 MWKhandke 50 /30Samana I & II 101 /60Saundatti 72 /43Theni I & II 100 /60Harapanahalli 40 /24Andhra Lake 106 /64Sipla 50 /30Bhakrani 102 /61Mahidad 50 /30Jath 60 /36Tejuva 101 /60Chandgarh 92 /55Veltoor Solar # 100 /60Gale Solar # 50 /30Tornado Solar # 20 /12CREPL Solar # 30 /18DSPL Solar # 50 /30
THAILAND total 21 MWOperationalLopburi Solar # 63 /21
Hong Kong
Australia
India
Mainland China
Thailand
Solar project (s)
Hydro projects (h)
Wind projects (w)
Energy-from-waste (ws)
HongKong

Capacity by
Energy Type
Total
MW
(a) + (b)
%
Operational MW
(a)
%
Under construction
MW
(b)
%
Coal 11,997 49% 11,997 49% - -
Gas 5,717 23% 5,167 21% 550 2%
Nuclear 2,685 11% 2,685 11% - -
Wind 2,049 8% 2,049 8% - -
Hydro 489 2% 489 2% - -
Solar 793 3% 793 3% - -
Others 965 4% 965 4% - -
Total 24,696 100% 24,146 98% 550 2%
24,696 MW Attributable to CLP Group
CLP Group – Generation and Storage Capacity(1) by Fuel Mix
53
(1) Equity basis plus long-term capacity and energy purchase arrangements. Includes battery discharge capacity
Note: Individual items and totals are rounded to the nearest appropriate number. Some totals may not add down the page due torounding of individual components
As at 31 Dec 2020

CLP Group – Energy Sent Out – 2020
54(1) Equity basis plus long-term capacity and energy purchase arrangements.
Includes battery discharge capacity
1.7 1.8
35.634.1
4.7 3.8
18.4 18.2
28.1 28.0
-5
0
5
10
15
20
25
30
35
40
2019 2020 2019 2020 2019 2020 2019 2020 2019 2020
Hong Kong Mainland China India Southeast Asia &Taiwan
Australia
TWh
Energy Sent Out(1)
Pumped Storage Nuclear Coal Gas Wind Solar Hydro Others
55%
14%
5%2%
2%
22%48%
20%
5%2%
2%
23%
CLP 2020 Annual Generation as Sent Out(1)
2019: 88.6 TWh2020: 85.9 TWh
2020
2019

Additional Resources
(1) To be published in March 2021
55

Information Classification: Confidential/Proprietary
CLP Holdings
Thank you