Clouds and the Earth’s Radiant Energy System (CERES) … · CERES ATBD Subsystem 3.0 - ERBE-like...
41
CERES ATBD Subsystem 3.0 - ERBE-like Averaging Release 2.2 June 2, 1997 Clouds and the Earth’s Radiant Energy System (CERES) Algorithm Theoretical Basis Document ERBE-like Averaging to Monthly TOA Fluxes (Subsystem 3.0) David F. Young 1 Takmeng Wong 2 Patrick Minnis 2 Maria V. Mitchum 2 David R. Doelling 1 Gary G. Gibson 1 Lee-hwa Chang 3 1 Analytical Services & Materials, Inc., One Enterprise Parkway, Suite 300, Hampton, Virginia 23666 2 Atmospheric Sciences Division, NASA Langley Research Center, Hampton, Virginia 23681-0001 3 Science Applications International Corporation (SAIC), Hampton, Virginia 23666
Transcript of Clouds and the Earth’s Radiant Energy System (CERES) … · CERES ATBD Subsystem 3.0 - ERBE-like...

CERES ATBD Subsystem 3.0 - ERBE-like Averaging Release 2.2
June 2, 1997
Clouds and the Earth’s Radiant Energy System (CERES)
Algorithm Theoretical Basis Document
ERBE-like Averaging to Monthly TOA Fluxes
(Subsystem 3.0)
David F. Young1
Takmeng Wong2
Patrick Minnis2
Maria V. Mitchum2
David R. Doelling1
Gary G. Gibson1
Lee-hwa Chang3
1Analytical Services & Materials, Inc., One Enterprise Parkway, Suite 300, Hampton, Virginia 236662Atmospheric Sciences Division, NASA Langley Research Center, Hampton, Virginia 23681-00013Science Applications International Corporation (SAIC), Hampton, Virginia 23666

CERES ATBD Subsystem 3.0 - ERBE-like Averaging Release 2.2
June 2, 1997 2
GEO:GeostationaryNarrowbandRadiances
GridTOA andSurfaceFluxes
9
MergeSatellites,
TimeInterpolate,
Compute Fluxes7
MWH:Micro-wave
Humidity
DetermineCloud
Properties,TOA and
Surface Fluxes4
SFC: HourlyGridded SingleSatellite TOAand Surface
Fluxes
SYN:SynopticRadiativeFluxes and
Clouds
Grid SingleSatelliteRadiativeFluxes and
Clouds6
ERBE-likeInversion to
InstantaneousTOA Fluxes
2
GAP:Altitude,
Temperature,Humidity,
Winds
ERBE-likeAveraging toMonthly TOA
Fluxes3
ES8:ERBEInstan-taneous
CRH: ClearReflectance,Temperature
History
IES
BDS:Bi-
DirectionalScans
INSTR:CERES
InstrumentData
Geolocateand Calibrate
EarthRadiances
1
INSTR
MODIS CID:VIRS CID:
CloudImagerData
SURFMAP:Surface
Propertiesand Maps
BDS
ES9:
ERBEMonthly
ES4:ES4G:ERBE
Monthly
RegridHumidity
andTemperature
Fields12
APD:Aerosol
Data
OPD:OzoneProfileData
ES9 ES4ES4GES8
MOA
ComputeMonthly and
Regional TOAand SRBAverages
10
SRBAVG
SRBAVG:Monthly
Regional TOAand
SRB Averages
ComputeSurface andAtmospheric
RadiativeFluxes
5
CRS: SingleSatellite
CERES Footprint,Radiative Fluxes,
and Clouds
FSW: HourlyGridded Single
SatelliteFluxes and
Clouds
SFC
MOA
ComputeRegional,Zonal and
GlobalAverages
8
SYN SYNAVG,ZAVG
MOA
CERES Top Level Data Flow Diagram
EDDBBDS
SSF: SingleSatellite CERESFootprint TOA
and SurfaceFluxes, Clouds
SSF
SSF
CRH
Grid GEONarrowbandRadiances
11
CRH
CID
FSW
MOA:Meteorological,
Ozone,Aerosol Data
GGEO GEO
AVG, ZAVGMonthly Regional,Zonal and GlobalRadiative Fluxes
and Clouds
SFC
GGEO:Gridded GEONarrowbandRadiances
GGEO
APD
GAP
OPD
MOA
MWH
CRS
FSW
SURFMAP
SURFMAP
SURFMAP
SSF
CRS
GGEO
MOA

CERES ATBD Subsystem 3.0 - ERBE-like Averaging Release 2.2
June 2, 1997 3
Abstract
This subsystem describes methods to temporally interpolateCERES measurements to compute ERBE-like averages of top-of-atmosphere (TOA) radiative parameters. CERES observations ofshortwave (SW) and longwave (LW) flux are time-averaged using adata interpolation method similar to that employed by the Earth Radia-tion Budget Experiment (ERBE). The averaging process producesdaily, monthly-hourly, and monthly means of TOA SW and LW flux onregional, zonal, and global spatial scales. Separate calculations areperformed for clear-sky and total-sky fluxes.
3.0. ERBE-like Averaging to Monthly TOA Fluxes
3.1. Introduction
The satellites that carry the CERES instrument do not provide continuous spatial and temporal cov-erage of the Earth’s entire surface. Historically, the sparse distribution of satellite measurements is themost critical factor in temporal averaging of radiation data from regional to global scales (Brooks et al.1986). Because a satellite does not view all portions of the Earth at all times, temporal modeling of thediurnal variability of the Earth’s radiation field is required to recover daily or monthly averaged radia-tive parameters. A clear understanding of the Earth’s radiative behavior demands realistic models ofdiurnal variations that depend on the surface type and cloud cover and accurately describe the solarzenith angle dependence of albedo and longwave exitance.
A major emphasis of radiation budget research is on the monitoring and analysis of long-term vari-ations in the Earth’s climate. This can only be accomplished using stable, long-term global data sets. Inorder to fulfill this research need, CERES will produce an ERBE-like product to provide a data set pro-cessed in a manner consistent with the earlier experiment (see Brooks et al. 1986).
3.2. Input
The chief input to the ERBE-like monthly time-space averaging (TSA) subsystem is the stream ofCERES SW and LW TOA flux observations. Included with each measurement is necessary informationsuch as satellite viewing geometry, the latitude and longitude of the observation, and the underlyinggeographic scene type. In addition, cloud amount is estimated for each pixel in the observed area. Seeappendix A for tables describing the input data products. Additional input data include TOA albedoangular distribution models (ADM’s) and solar declination data.
3.3. Output
The TSA process produces daily, monthly-hourly, and monthly means of TOA SW and LW flux onregional, zonal, and global spatial scales. Separate calculations are performed for clear-sky and total-skyfluxes. Daily SW clear-sky fluxes are provided only for days with clear-sky measurements; daily clear-sky LW over land regions is not provided. See Appendix B for tables describing the output dataproducts.
3.4. Summary of Processes
One month of data is sorted and averaged into the standard ERBE 2.5° latitude× 2.5° longitudegrid. All data within each grid box are sorted and averaged in 1-hour increments (hour boxes).
Total-sky TOA LW flux is estimated for all hours during the month by interpolating between thosehours containing observations. Linear interpolation is used over oceans, while a half-sine curve fit is

CERES ATBD Subsystem 3.0 - ERBE-like Averaging Release 2.2
June 2, 1997 4
applied over land and desert regions based on studies by Brooks and Minnis (1984). Monthly andmonthly-hourly means are then computed using the combination of observed and interpolated values.
Clear-sky TOA LW flux is calculated in the same manner as total-sky TOA LW in oceanic regions.However, over land regions, a different technique is used to compensate for the effects of under-sampling. Hours with clear-sky LW observations are averaged over the month for each local hour. Asingle half-sine curve is fitted to this monthly composited data, and the monthly-hourly means from thisfit are averaged to produce monthly means.
Monthly mean total-sky and clear-sky TOA SW fluxes are produced in a manner similar to total-skyTOA LW flux. For all days with at least one SW observation, a value of SW flux is interpolated for alldaylight hours using models of the albedo variation with solar zenith angle (Suttles et al. 1988).Monthly mean albedos are calculated by summing the modeled SW flux values and dividing that sumby the sum of solar incident flux from the same hours. Monthly mean SW flux is calculated by multiply-ing the monthly mean albedo by a more precise value of monthly mean solar incident flux that is pro-duced by integrating the solar incident flux over all days of the month.
Finally, the TOA LW and SW fluxes are averaged on zonal and global scales using the appropriatearea weighting functions for each latitude.
3.5. Technical Basis
The ultimate goal of radiation budget monitoring experiments such as ERBE (Barkstrom 1984;Barkstrom and Smith 1986) and CERES (Wielicki and Barkstrom 1991) is to accurately determine thecomponents of the Earth’s radiation budget on regional, zonal, and global spatial scales at various tem-poral resolutions. Regional and global analyses of the large sets of highly accurate satellite measure-ments of incoming and outgoing energy in the Earth’s climate system can be achieved only byadequately sampling the radiation fields and properly averaging the data in space and time. The CERESData Management System will produce a data product which is processed in a manner consistent withERBE to provide a stable, long-term data set for monitoring and analyzing Earth’s climate variations.The averaging processes which are used in the CERES ERBE-like processing are described below.
ERBE is the most accurate experiment to date for measuring the Earth’s radiation budget(Barkstrom et al. 1990), the diurnal variability of radiation (Harrison et al. 1988; Hartmann et al. 1991;Cheruy et al. 1991), cloud-radiative forcing (Ramanathan et al. 1989a; Ramanathan et al. 1989b;Harrison et al. 1990b), and volcanic climate radiative forcing (Minnis et al. 1993). For a discussion ofthe ERBE errors, see Harrison et al. (1990b) and Barkstrom et al. (1990). The largest sources of uncer-tainty in the pre-ERBE radiation budget missions arose from errors due to calibration and stability, sam-pling, and data analysis methods. The ERBE instruments reflect an improved understanding ofinstrument operation and incorporate reliable calibration sources for better measurement accuracy.
ERBE used multiple satellites to account for widespread semiregular diurnal variations in cloudi-ness that can cause substantial errors in regional radiation budgets derived with single Sun-synchronoussatellite measurements (Harrison et al. 1983). The multisatellite ERBE measurements, combined withmodels to estimate fluxes at unsampled hours, produced the best estimates to date of the diurnal vari-ability of TOA radiation (Harrison et al. 1988; Harrison et al. 1990a; Hartmann et al. 1991).
CERES instruments will also be flown on multiple satellites to provide the diurnal sampling neces-sary to obtain accurate monthly flux averages using the ERBE-like interpolation techniques. The tempo-ral coverage of the three CERES satellites (TRMM, EOS-AM, and EOS-PM) for 1 month ofobservations is shown in figure 3-1. The TRMM spacecraft is in a 35°-inclined, precessing orbit whichcovers all local times at the equator in slightly over 26 days. The EOS satellites are in Sun-synchronousorbits, sampling at the same local times each day. From figure 3-1, it is evident that a single satellitecannot provide sufficient temporal sampling to accurately estimate SW and LW fluxes at all local hours.

CERES ATBD Subsystem 3.0 - ERBE-like Averaging Release 2.2
June 2, 1997 5
For ERBE, a comprehensive set of LW and SW angular dependence models was developed (Suttleset al. 1988 and 1989) and used to convert radiances to fluxes. A method for separating and identifyingclear-sky and cloud-contaminated measurements (Wielicki and Green 1989) was constructed toimprove radiance interpretation for selecting the correct angular models and to better understand theeffects of clouds. Geostationary satellite data were used to develop a more accurate technique for aver-aging the data over the diurnal cycle (Brooks and Minnis 1984).
All of these improvements in the instruments, satellite sampling, and the data processing systemallowed ERBE to meet many of the goals of the scientific community. CERES will make furtherimprovements in ERB measurements, particularly in determining more accurate and com-prehensivecloud information. However, in the interest of compiling a long-term, consistent data set for climatestudies, an ERBE-like data product will be produced.
3.5.1. Temporal Interpolation and Spatial Averaging
The first step in the averaging process is to sort the data in space and time. CERES data enter thissubsystem as a chronologically-ordered stream of flux measurements. Spatially, these data are averagedand processed on an ERBE 2.5° × 2.5°¡ grid. Each region (grid box) is processed independently from allothers. Within each region, a month of CERES measurements is sorted and averaged into local timeintervals of one hour (referred to as hour boxes). There is a maximum of 744 hour boxes in a month(24 hours/day× 31 days).
The averaging of the LW flux is straightforward. All observations from a region that were measuredwithin an hour box are linearly combined. Since albedo is a function of solar zenith angle, each SWmeasurement is first corrected to the central time, latitude, and longitude of the regional hour box intowhich it is collected. The temporal correction is performed using 12 ADM’s. As shown in figure 3-2,there are separate ADM’s for the five ERBE clear-sky geographical scene types (ocean, land, snow,
Figure 3-1. Temporal coverage of CERES satellites.
242220181614121086420
90
-90
-60
-30
0
30
60
Local Time, hr.
EOS-AMEOS-PM
TRMM
15
1015
2025
30
Day
Latit
ude,
deg
.

CERES ATBD Subsystem 3.0 - ERBE-like Averaging Release 2.2
June 2, 1997 6
Figure 3-2. ERBE angular distribution models (ADM’s).

CERES ATBD Subsystem 3.0 - ERBE-like Averaging Release 2.2
June 2, 1997 7
desert, and coast). Over land and ocean surfaces, there are models for partly cloudy and mostly cloudyERBE scene classifications. Finally, a single model is used for overcast conditions over all surfaces.The ADM’s for partly and mostly cloudy coastal scenes are not shown. Within each hour box, a sepa-rate mean albedo is calculated for each cloud class, and a histogram of cloud class is also retained. Thegeographic scene type for each region is constant for a month.
3.5.2. Total-Sky TOA LW Flux
The ERBE TSA algorithm was designed to provide daily model fits to the TOA LW flux data aswell as monthly averages of these data. To accomplish this goal, an estimate of LW flux is made forevery hour box. This interpolation is performed in one of two ways, depending on the geographic scenetype of the region.
Over ocean regions, there is little diurnal variability in LW flux due to solar insulation. The greatestvariations in LW flux over the oceans occur due to changes in the amount and types of clouds. There-fore, no attempt is made to develop complex models for estimating the LW flux between the times ofobservations. Rather, it is assumed that changes in LW flux are due to changes in cloud conditions, andthat this change is linear. Therefore, simple linear interpolation is used to provide a value of LW flux foreach hour box not observed by CERES. At the beginning of the month, all hours preceding the firstobservation are filled with the value from the first observed time. The same procedure is applied at theend of the month using the last observed LW flux. This technique is also used for regions designated aseither snow-covered or coastal.
Over land and desert regions, the effects of solar heating are much more pronounced than overocean regions. During relatively cloud-free periods, there is generally a sinusoidal variation in LW fluxover the daylight hours. In order to account for this variation, these regions are treated in a differentmanner from oceans in the TSA algorithm. For any day when an observation was made during daylighthours and during the preceding and following nights, the LW flux for the remaining hours of the day ismodeled by fitting a half-sine curve to the observations. The modeling is performed by linear interpola-tion on days lacking the required observations or having any daylight observations of LW flux that areless than the nighttime values, or when the resultant half-sine curve has a negative amplitude.
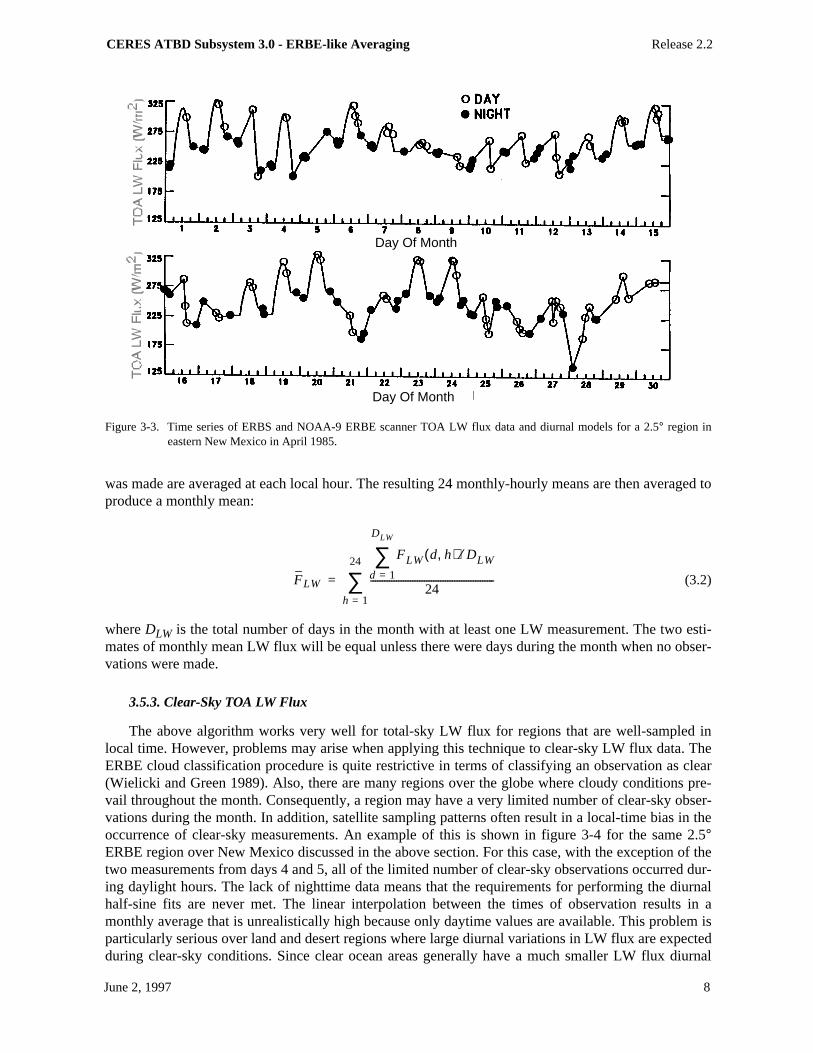
The results of this type of interpolation are demonstrated in figure 3-3 that shows a time series ofERBE scanner data from April 1985 over a 2.5° region in eastern New Mexico. In this figure, observa-tions are represented by circles, and the interpolated values are displayed as the solid line. The early partof the month was relatively clear, and half-sine fits were performed on days 1, 2, 4, 6, 7, and 8. How-ever, on days 10, 11, and 12, no half-sine fit was used since low values of LW were observed in the lateafternoon, which indicates that clouds must have been developing. In such cases, the half-sine fit is notrealistic, and linear interpolation is used.
Once all hour boxes for the month have been filled with a value of LW flux, it is a simple matter tocalculate daily, monthly-hourly, and monthly means. Two slightly different techniques are used to com-pute monthly means. In the first method (monthly-daily), a daily mean is computed by averaging the24-hour box values for each day. The monthly mean TOA LW flux, , is then computed by averag-ing all of the daily means:
(3.1)
where is the TOA LW flux for dayd and local hourh, andD is the total number of days inthe month. In the second method (monthly-hourly), hour box values for all days in which an observation
FLW
FLW
FLW d h,( ) 24⁄h 1=
24
∑D
-----------------------------------------------
d 1=
D
∑=
FLW d h,( )
CERES ATBD Subsystem 3.0 - ERBE-like Averaging Release 2.2
June 2, 1997 8
was made are averaged at each local hour. The resulting 24 monthly-hourly means are then averaged toproduce a monthly mean:
(3.2)
whereDLW is the total number of days in the month with at least one LW measurement. The two esti-mates of monthly mean LW flux will be equal unless there were days during the month when no obser-vations were made.
3.5.3. Clear-Sky TOA LW Flux
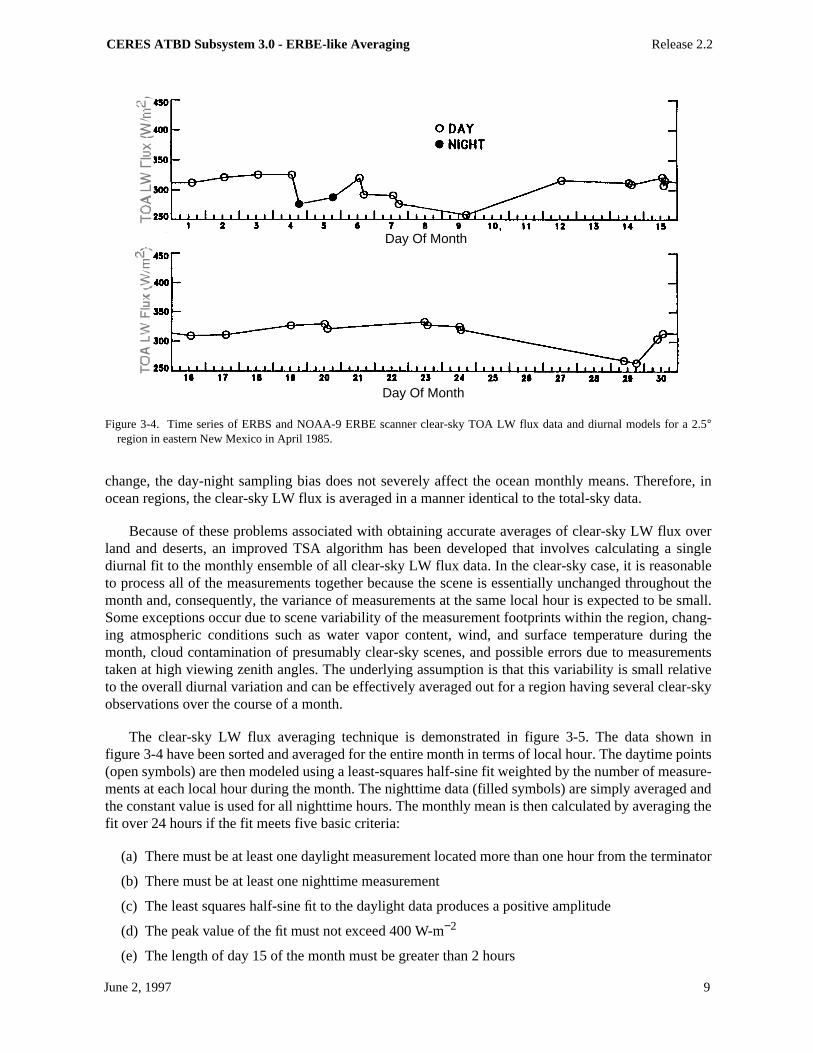
The above algorithm works very well for total-sky LW flux for regions that are well-sampled inlocal time. However, problems may arise when applying this technique to clear-sky LW flux data. TheERBE cloud classification procedure is quite restrictive in terms of classifying an observation as clear(Wielicki and Green 1989). Also, there are many regions over the globe where cloudy conditions pre-vail throughout the month. Consequently, a region may have a very limited number of clear-sky obser-vations during the month. In addition, satellite sampling patterns often result in a local-time bias in theoccurrence of clear-sky measurements. An example of this is shown in figure 3-4 for the same 2.5°ERBE region over New Mexico discussed in the above section. For this case, with the exception of thetwo measurements from days 4 and 5, all of the limited number of clear-sky observations occurred dur-ing daylight hours. The lack of nighttime data means that the requirements for performing the diurnalhalf-sine fits are never met. The linear interpolation between the times of observation results in amonthly average that is unrealistically high because only daytime values are available. This problem isparticularly serious over land and desert regions where large diurnal variations in LW flux are expectedduring clear-sky conditions. Since clear ocean areas generally have a much smaller LW flux diurnal
Figure 3-3. Time series of ERBS and NOAA-9 ERBE scanner TOA LW flux data and diurnal models for a 2.5° region ineastern New Mexico in April 1985.
Day Of Month
Day Of Month
FLW
FLW d h,( ) DLW⁄d 1=
DLW
∑24
-----------------------------------------------------
h 1=
24
∑=
CERES ATBD Subsystem 3.0 - ERBE-like Averaging Release 2.2
June 2, 1997 9
change, the day-night sampling bias does not severely affect the ocean monthly means. Therefore, inocean regions, the clear-sky LW flux is averaged in a manner identical to the total-sky data.
Because of these problems associated with obtaining accurate averages of clear-sky LW flux overland and deserts, an improved TSA algorithm has been developed that involves calculating a singlediurnal fit to the monthly ensemble of all clear-sky LW flux data. In the clear-sky case, it is reasonableto process all of the measurements together because the scene is essentially unchanged throughout themonth and, consequently, the variance of measurements at the same local hour is expected to be small.Some exceptions occur due to scene variability of the measurement footprints within the region, chang-ing atmospheric conditions such as water vapor content, wind, and surface temperature during themonth, cloud contamination of presumably clear-sky scenes, and possible errors due to measurementstaken at high viewing zenith angles. The underlying assumption is that this variability is small relativeto the overall diurnal variation and can be effectively averaged out for a region having several clear-skyobservations over the course of a month.
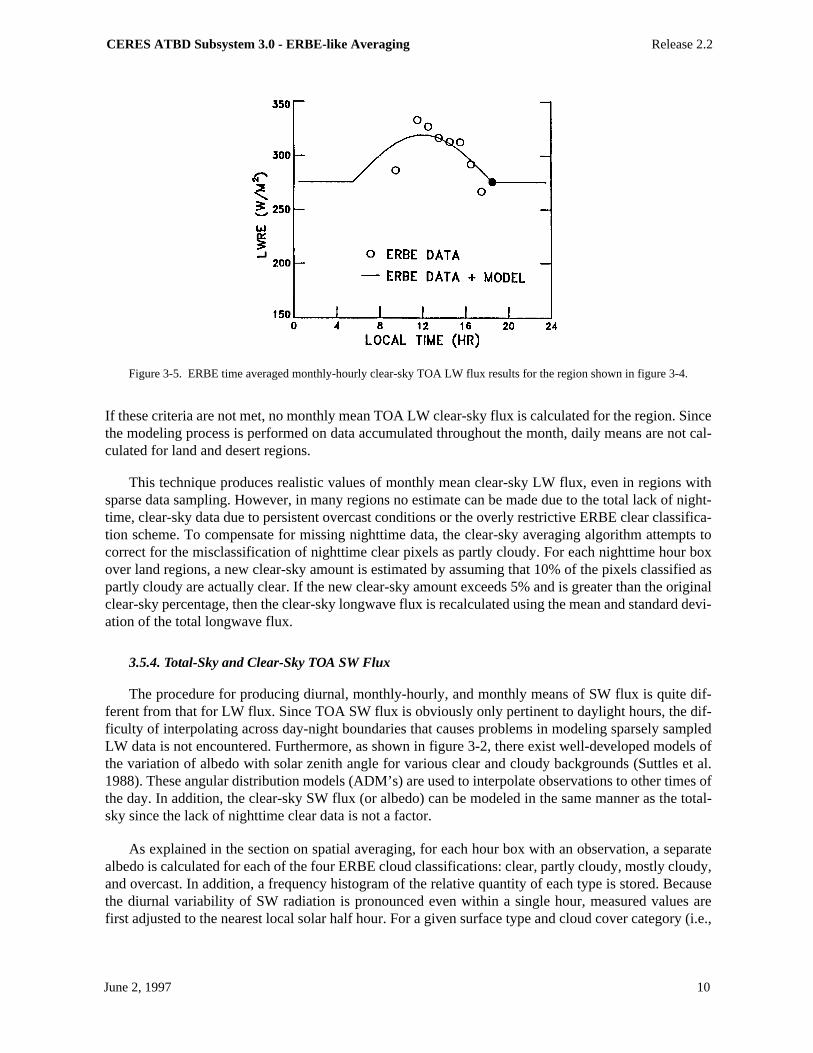
The clear-sky LW flux averaging technique is demonstrated in figure 3-5. The data shown infigure 3-4 have been sorted and averaged for the entire month in terms of local hour. The daytime points(open symbols) are then modeled using a least-squares half-sine fit weighted by the number of measure-ments at each local hour during the month. The nighttime data (filled symbols) are simply averaged andthe constant value is used for all nighttime hours. The monthly mean is then calculated by averaging thefit over 24 hours if the fit meets five basic criteria:
(a) There must be at least one daylight measurement located more than one hour from the terminator
(b) There must be at least one nighttime measurement
(c) The least squares half-sine fit to the daylight data produces a positive amplitude
(d) The peak value of the fit must not exceed 400 W-m−2
(e) The length of day 15 of the month must be greater than 2 hours
Figure 3-4. Time series of ERBS and NOAA-9 ERBE scanner clear-sky TOA LW flux data and diurnal models for a 2.5°region in eastern New Mexico in April 1985.
Day Of Month
Day Of Month
CERES ATBD Subsystem 3.0 - ERBE-like Averaging Release 2.2
June 2, 1997 10
If these criteria are not met, no monthly mean TOA LW clear-sky flux is calculated for the region. Sincethe modeling process is performed on data accumulated throughout the month, daily means are not cal-culated for land and desert regions.
This technique produces realistic values of monthly mean clear-sky LW flux, even in regions withsparse data sampling. However, in many regions no estimate can be made due to the total lack of night-time, clear-sky data due to persistent overcast conditions or the overly restrictive ERBE clear classifica-tion scheme. To compensate for missing nighttime data, the clear-sky averaging algorithm attempts tocorrect for the misclassification of nighttime clear pixels as partly cloudy. For each nighttime hour boxover land regions, a new clear-sky amount is estimated by assuming that 10% of the pixels classified aspartly cloudy are actually clear. If the new clear-sky amount exceeds 5% and is greater than the originalclear-sky percentage, then the clear-sky longwave flux is recalculated using the mean and standard devi-ation of the total longwave flux.
3.5.4. Total-Sky and Clear-Sky TOA SW Flux
The procedure for producing diurnal, monthly-hourly, and monthly means of SW flux is quite dif-ferent from that for LW flux. Since TOA SW flux is obviously only pertinent to daylight hours, the dif-ficulty of interpolating across day-night boundaries that causes problems in modeling sparsely sampledLW data is not encountered. Furthermore, as shown in figure 3-2, there exist well-developed models ofthe variation of albedo with solar zenith angle for various clear and cloudy backgrounds (Suttles et al.1988). These angular distribution models (ADM’s) are used to interpolate observations to other times ofthe day. In addition, the clear-sky SW flux (or albedo) can be modeled in the same manner as the total-sky since the lack of nighttime clear data is not a factor.
As explained in the section on spatial averaging, for each hour box with an observation, a separatealbedo is calculated for each of the four ERBE cloud classifications: clear, partly cloudy, mostly cloudy,and overcast. In addition, a frequency histogram of the relative quantity of each type is stored. Becausethe diurnal variability of SW radiation is pronounced even within a single hour, measured values arefirst adjusted to the nearest local solar half hour. For a given surface type and cloud cover category (i.e.,
Figure 3-5. ERBE time averaged monthly-hourly clear-sky TOA LW flux results for the region shown in figure 3-4.

CERES ATBD Subsystem 3.0 - ERBE-like Averaging Release 2.2
June 2, 1997 11
scene type for selecting an ADM), the normalized ADM function,δi(µo), at timet is defined as the ratioof the albedo at timet and the albedo at overhead sun:
(3.3)
whereµo is the cosine of the solar zenith angle and is the ADM albedo for scene typei (fromfig. 3-2). The albedo at any time (e.g., at the local solar half hour) can be expressed as the product ofthe observed albedo and the ratio of the normalized ADM functions from and the time of observation,tobs:
(3.4)
For days with only one SW flux measurement, each of the four cloud type albedos from the hour ofobservation is modeled to all daylight hours using equation (3.4) and the appropriate ADM’s. This mod-eling is illustrated in figure 3-6. The albedos for the four cloud types are then recombined by weightingeach cloud type albedo with the appropriate areal coverage fraction to obtain the mean albedo at eachhour for the entire region (solid line in fig. 3-6). This process assumes that the relative abundance of thecloud classifications remains constant throughout the day.
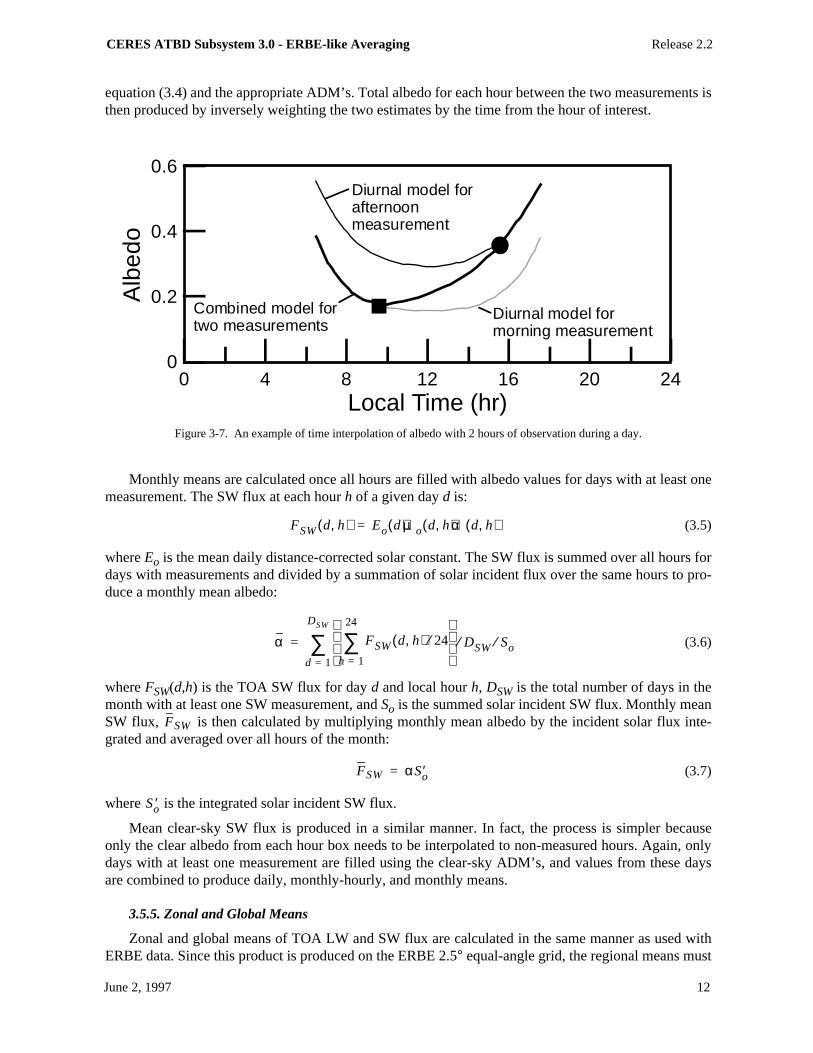
For days with more than one measurement, this technique is modified as illustrated in figure 3-7.This figure presents albedos for all hours for each of the two measurements individually, and thenshows how the two are combined to determine the best estimates of albedo. All daylight hours preced-ing the first measurement of the day and following the last measurement assume constant cloud classfrom the nearest measurement. These hours are modeled using equation (3.4) in the single measurementcase. For hours between two measurements, it is assumed that the cloud histograms are varying linearlyover that span. The four cloud type albedos are modeled from each surrounding measurement using
Figure 3-6. An example of time interpolation of albedo for days with only 1 hour of observation.
δi µo t( )( )αmodi
µo t( )( )
αmodiµo 1=( )
-----------------------------------=
αmodit′
t′
αi t′( ) αi µo tobs( )( )δi µo t′( )( )
δi µo tobs( )( )------------------------------=
CERES ATBD Subsystem 3.0 - ERBE-like Averaging Release 2.2
June 2, 1997 12
equation (3.4) and the appropriate ADM’s. Total albedo for each hour between the two measurements isthen produced by inversely weighting the two estimates by the time from the hour of interest.
Monthly means are calculated once all hours are filled with albedo values for days with at least onemeasurement. The SW flux at each hourh of a given dayd is:
(3.5)
whereEo is the mean daily distance-corrected solar constant. The SW flux is summed over all hours fordays with measurements and divided by a summation of solar incident flux over the same hours to pro-duce a monthly mean albedo:
(3.6)
whereFSW(d,h) is the TOA SW flux for dayd and local hourh, DSW is the total number of days in themonth with at least one SW measurement, andSo is the summed solar incident SW flux. Monthly meanSW flux, is then calculated by multiplying monthly mean albedo by the incident solar flux inte-grated and averaged over all hours of the month:
(3.7)
where is the integrated solar incident SW flux.
Mean clear-sky SW flux is produced in a similar manner. In fact, the process is simpler becauseonly the clear albedo from each hour box needs to be interpolated to non-measured hours. Again, onlydays with at least one measurement are filled using the clear-sky ADM’s, and values from these daysare combined to produce daily, monthly-hourly, and monthly means.
3.5.5. Zonal and Global Means
Zonal and global means of TOA LW and SW flux are calculated in the same manner as used withERBE data. Since this product is produced on the ERBE 2.5° equal-angle grid, the regional means must
Figure 3-7. An example of time interpolation of albedo with 2 hours of observation during a day.
Diurnal model formorning measurement
Diurnal model for afternoon measurement
Combined model fortwo measurements
0 4 8 12 16 20 240
0.2
0.4
0.6
Alb
edo
Local Time (hr)
FSW d h,( ) Eo d( )µo d h,( )α d h,( )=
α FSW d h,( )h 1=
24
∑ 24⁄
d 1=
DSW
∑ DSW So⁄⁄=
FSW
FSW αSo′=
So′
CERES ATBD Subsystem 3.0 - ERBE-like Averaging Release 2.2
June 2, 1997 13
be weighted by area when computing global means. The 2.5° regional data will also be nested into 5°and 10° grids as was done with ERBE.
3.6. Uncertainty Estimates
Although a complete, rigorous error analysis for all of the ERBE products is not yet available, sev-eral studies of the ERBE error sources have resulted in reliable estimates of the uncertainties in monthlymean TOA LW and SW radiation. Bias errors for monthly mean regional total-sky fluxes are less than1 W-m−2. The rms uncertainties in total-sky LW and SW fluxes are estimated to be 3 W-m−2 and5 W-m−2, respectively. In terms of SW albedo, the error is approximately±0.014. The rms errors inclear-sky LW and SW fluxes are estimated to be 2 W-m−2. The clear-sky LW fluxes, however, may beoverestimated by about 4 W-m−2. The clear-sky reflected flux is overestimated by approximately1 W-m−2. For an overview of the uncertainties in the ERBE monthly mean flux values, see Harrisonet al. (1990b).
3.7. Strategic Concerns
Estimates of surface fluxes can be produced using TOA-to-surface parameterization schemes andincluded as part of the archived output from the ERBE-like processing of subsystem 3. These surfacefluxes were originally planned for inclusion with the ERBE-like products. However, it has been decidedthat they will not be included in subsystem 3 for Release 2.1, in order for this subsystem to produce onlytruly ERBE-like results and also to eliminate the need for the ancillary meteorological data necessaryfor the parameterizations. Surface fluxes will be produced in subsystem 10.
The ERBE TSA currently extrapolates total-sky LW as a constant from the first observation back tothe beginning of the month and from the last observation forward to the end of the month. The simplesolution to the problems caused by this is to always average using only those days that contain at leastone measurement.
The 2.5° regional data may not be nested into 5° and 10° grids as was done with ERBE. These twoadditional product spatial resolutions were provided by ERBE as a convenience to the user for compari-sons with the ERBE non-scanner data. Eliminating these products would reduce the data volume, andthe nesting can easily be performed by research analysts using the basic 2.5° data.
A primary goal of the ERBE-like product is to provide radiation budget data that are directly com-parable with the ERBE data set. The possibility of a reprocessing of the ERBE data set is currentlyunder consideration. The main changes planned include a new set of bidirectional models, new direc-tional models, revised a priori LW clear-sky thresholds, and the elimination of monthly mean estimatesfor regions with insufficient sampling. Any changes to the ERBE processing that are included in thereprocessing will also be incorporated into the CERES ERBE-like product.
3.8. References
Barkstrom, B. R. 1984: The Earth Radiation Budget Experiment (ERBE).Am. Meteorol. Soc., vol. 65, pp. 1170–1185.
Barkstrom, B. R.; and Smith G. L. 1986: The Earth Radiation Budget Experiment—Science and Implementation.Rev.Geophys., vol. 24, pp. 379–390.
Barkstrom, Bruce R.; Harrison, Edwin F.; and Lee, Robert B., III 1990: Earth Radiation Budget Experiment—Preliminary Sea-sonal Results.EOS, vol. 71, p. 279, 299, 304 and 305.
Brooks, D. R.; and Minnis, P. 1984: Simulation of the Earth’s Monthly Average Regional Radiation Balance Derived FromSatellite Measurements.J. Climat. & Appl. Meteorol., vol. 23, pp. 392–403.
Brooks, D. R.; Harrison, E. F.; Minnis, P.; Suttles, J. T.; and Kandel, R. S. 1986: Development of Algorithms for Understand-ing the Temporal and Spatial Variability of the Earth’s Radiation Balance.Rev. Geophys., vol. 24, pp. 422–438.

CERES ATBD Subsystem 3.0 - ERBE-like Averaging Release 2.2
June 2, 1997 14
Cheruy, F.; Kandel, R. S.; and Duvel, J. P. 1991: Outgoing Longwave Radiation and Its Diurnal Variation From CombinedERBE and Meteosat Observations. I—Estimating OLR From Meteosat Data. II—Using Meteosat Data to Determine theLongwave Diurnal Cycle.J. Geophys. Res., vol. 96, p. 22, 611–622 and 630.
Harrison, Edwin F.; Brooks, David R.; Minnis, Patrick; Wielicki, Bruce A.; and Staylor, W. Frank 1988: First Estimates of theDiurnal Variation of Longwave Radiation From the Multiple-Satellite Earth Radiation Budget Experiment (ERBE).Bull.Am. Meteorol. Soc., vol. 69, pp. 1144–1151.
Harrison, Edwin F.; Minnis, Patrick; and Gibson, Gary G. 1983: Orbital and Cloud Cover Sampling Analyses for MultisatelliteEarth Radiation Budget Experiment.J. Spacecr. & Rockets, vol. 20, no. 5, pp. 491–495.
Harrison, E. F.; Minnis, P.; Barkstrom, B. R.; Wielicki, B. A.; Gibson, G. G.; Denn, F. M.; and Young, D. F. 1990a: SeasonalVariation of the Diurnal Cycles of Earth’s Radiation Budget Determined From ERBE. Am. Meteorol. Soc., pp. 87–91.
Harrison, E. F.; Minnis, P.; Barkstrom, B. R.; Ramanathan, V.; and Cess, R. D. 1990b: Seasonal Variation of Cloud RadiativeForcing Derived From the Earth Radiation Budget Experiment. J. Geophys. Res., vol. 95, pp. 18687–18703.
Hartmann, Dennis L.; Kowalewsky, Karen J.; and Michelsen, Marc L. 1991: Diurnal Variations of Outgoing Longwave Radia-tion and Albedo From ERBE Scanner Data. J. Climat., vol. 4, pp. 598–617.
Minnis, P.; Harrison, E. F.; Stowe, L. L.; Gibson, G. G.; Denn, F. M.; Doelling, D. R.; and Smith, W. L. 1993: Radiative Cli-mate Forcing by the Mount Pinatubo Eruption.Science, vol. 259, no. 5100, pp. 1411–1414.
Ramanathan, V.; Barkstrom, Bruce R.; and Harrison, Edwin F. 1989a: Climate and the Earth’s Radiation Budget.Phys. Today,vol. 42, pp. 22–32.
Ramanathan, V.; Cess, R. D.; Harrison, E. F.; Minnis, P.; and Barkstrom, B. R. 1989b: Cloud-Radiative Forcing and Climate—Results From the Earth Radiation Budget Experiment.Science, vol. 243, pp. 57–63.
Suttles, J. T.; Green, R. N.; Smith, G. L.; Wielicki, B. A.; Walker, I. J.; Taylor, V. R.; and Stowe, L. L. 1989:Angular Radia-tion Models for Earth-Atmosphere System. II—Longwave Radiation. NASA RP-1184.
Suttles, J. T.; Green, R. N.; Minnis, P.; Smith, G. L.; Staylor, W. F.; Wielicki, B. A.; Walker, I. J.; Young, D. F.; Taylor, V. R.;and Stowe, L. L. 1988:Angular Radiation Models for Earth-Atmosphere System. Volume I: Shortwave Radiation. NASARP-1184.
Wielicki, Bruce A.; and Barkstrom, Bruce R. 1991: Clouds and the Earth’s Radiant Energy System (CERES)—An EarthObserving System Experiment.Am. Meteorol. Soc., pp. 11–16.
Wielicki, Bruce A.; and Green, Richard N. 1989: Cloud Identification for ERBE Radiative Flux Retrieval.J. Appl. Meteorol.,vol. 28, pp. 1133–1146.

CERES ATBD Subsystem 3.0 - ERBE-like Averaging Release 2.2
June 2, 1997 A - 15
Appendix A
Input Data Products
ERBE-like Averaging to Monthly TOA Fluxes (Subsystem 3.0)
This appendix describes the data products which are used by the algorithms in this subsystem.Table A-1 below summarizes these products, listing the CERES and EOSDIS product codes or abbrevi-ations, a short product name, the product type, the production frequency, and volume estimates for eachindividual product as well as a complete data month of production. The product types are defined asfollows:
Archival products: Assumed to be permanently stored by EOSDISInternal products: Temporary storage by EOSDIS (days to years)Ancillary products: Non-CERES data needed to interpret measurements
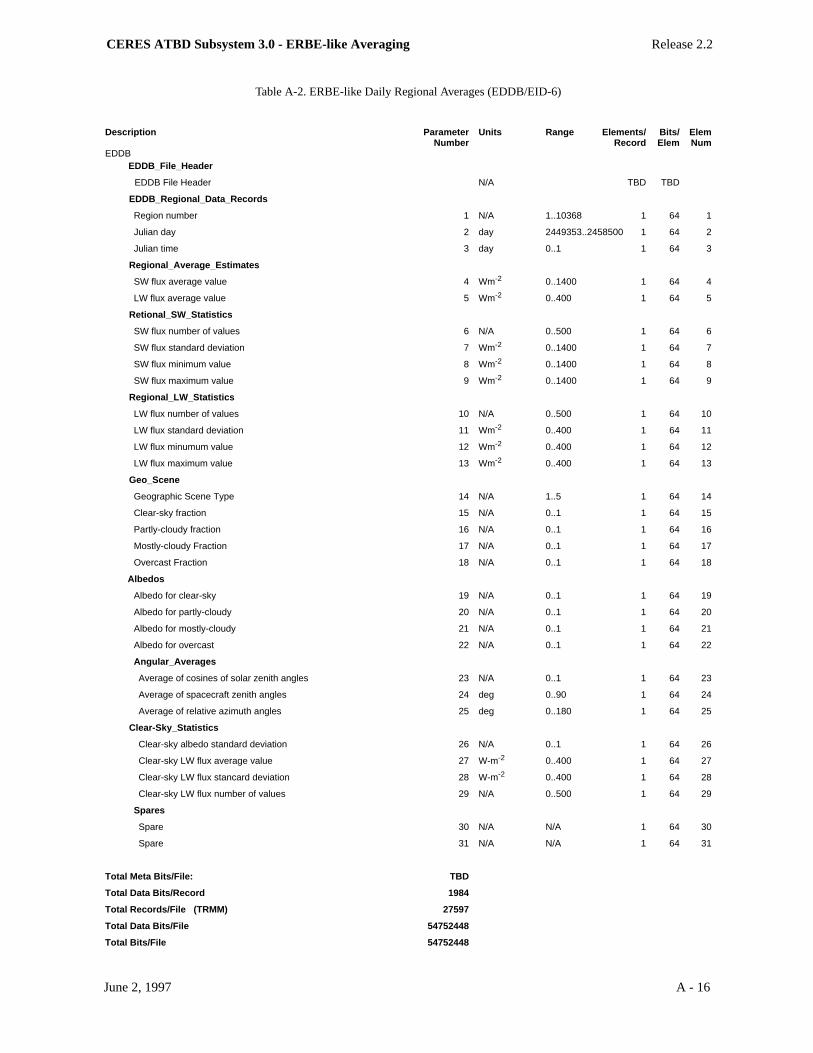
The following pages describe each product. An introductory page provides an overall description ofthe product and specifies the temporal and spatial coverage. The table which follows the introductorypage briefly describes every parameter which is contained in the product. Each product may be thoughtof as metadata followed by data records. The metadata (or header data) is not well-defined yet and isincluded mainly as a placeholder. The description of parameters which are present in each data recordincludes parameter number (a unique number for each distinct parameter), units, dynamic range, thenumber of elements per record, an estimate of the number of bits required to represent each parameter,and an element number (a unique number for each instance of every parameter). A summary at the bot-tom of each table shows the current estimated sizes of metadata, each data record, and the total dataproduct. A more detailed description of each data product will be contained in a user’s guide to be pub-lished before the first CERES launch.
ERBE-like Daily Data Base (EDDB/EID-6)
The EID-6 product is generated daily by the ERBE-like Inversion Subsystem (2.0). It containsregional averages at several parameters on the ERBE 2.5-degree equal-angle grid. The following tableshows each parameter passed from the ERBE-like Inversion Subsystem (2.0) on the EID-6 to theERBE-like Monthly Time and Space Averaging Subsystem (3.0).
Level: 2 Portion of Globe CoveredType: Internal File: RegionalFrequency:1/Day Record: Individual Region
Time Interval Covered Portion of Atmosphere CoveredFile: Day File: TOARecord: N/A
Table A-1. Input Products Summary
Product code Monthly
CERES EOSDIS Name Type Frequency Size, MB size, MB
EDDB/EID-6 None ERBE-like daily database Internal 1/day 6.5 202
CERES ATBD Subsystem 3.0 - ERBE-like Averaging Release 2.2
June 2, 1997 A - 16
Table A-2. ERBE-like Daily Regional Averages (EDDB/EID-6)
Description Parameter Units Range Elements/ Bits/ ElemNumber Record Elem Num
EDDBEDDB_File_Header
EDDB File Header N/A TBD TBD
EDDB_Regional_Data_Records
Region number 1 N/A 1..10368 1 64 1
Julian day 2 day 2449353..2458500 1 64 2
Julian time 3 day 0..1 1 64 3
Regional_Average_Estimates
SW flux average value 4 Wm-2 0..1400 1 64 4
LW flux average value 5 Wm-2 0..400 1 64 5
Retional_SW_Statistics
SW flux number of values 6 N/A 0..500 1 64 6
SW flux standard deviation 7 Wm-2 0..1400 1 64 7
SW flux minimum value 8 Wm-2 0..1400 1 64 8
SW flux maximum value 9 Wm-2 0..1400 1 64 9
Regional_LW_Statistics
LW flux number of values 10 N/A 0..500 1 64 10
LW flux standard deviation 11 Wm-2 0..400 1 64 11
LW flux minumum value 12 Wm-2 0..400 1 64 12
LW flux maximum value 13 Wm-2 0..400 1 64 13
Geo_Scene
Geographic Scene Type 14 N/A 1..5 1 64 14
Clear-sky fraction 15 N/A 0..1 1 64 15
Partly-cloudy fraction 16 N/A 0..1 1 64 16
Mostly-cloudy Fraction 17 N/A 0..1 1 64 17
Overcast Fraction 18 N/A 0..1 1 64 18
Albedos
Albedo for clear-sky 19 N/A 0..1 1 64 19
Albedo for partly-cloudy 20 N/A 0..1 1 64 20
Albedo for mostly-cloudy 21 N/A 0..1 1 64 21
Albedo for overcast 22 N/A 0..1 1 64 22
Angular_Averages
Average of cosines of solar zenith angles 23 N/A 0..1 1 64 23
Average of spacecraft zenith angles 24 deg 0..90 1 64 24
Average of relative azimuth angles 25 deg 0..180 1 64 25
Clear-Sky_Statistics
Clear-sky albedo standard deviation 26 N/A 0..1 1 64 26
Clear-sky LW flux average value 27 W-m-2 0..400 1 64 27
Clear-sky LW flux stancard deviation 28 W-m-2 0..400 1 64 28
Clear-sky LW flux number of values 29 N/A 0..500 1 64 29
Spares
Spare 30 N/A N/A 1 64 30
Spare 31 N/A N/A 1 64 31
Total Meta Bits/File: TBD
Total Data Bits/Record 1984
Total Records/File (TRMM) 27597
Total Data Bits/File 54752448
Total Bits/File 54752448
CERES ATBD Subsystem 3.0 - ERBE-like Averaging Release 2.2
June 2, 1997 B - 17
Appendix B
Output Data Products
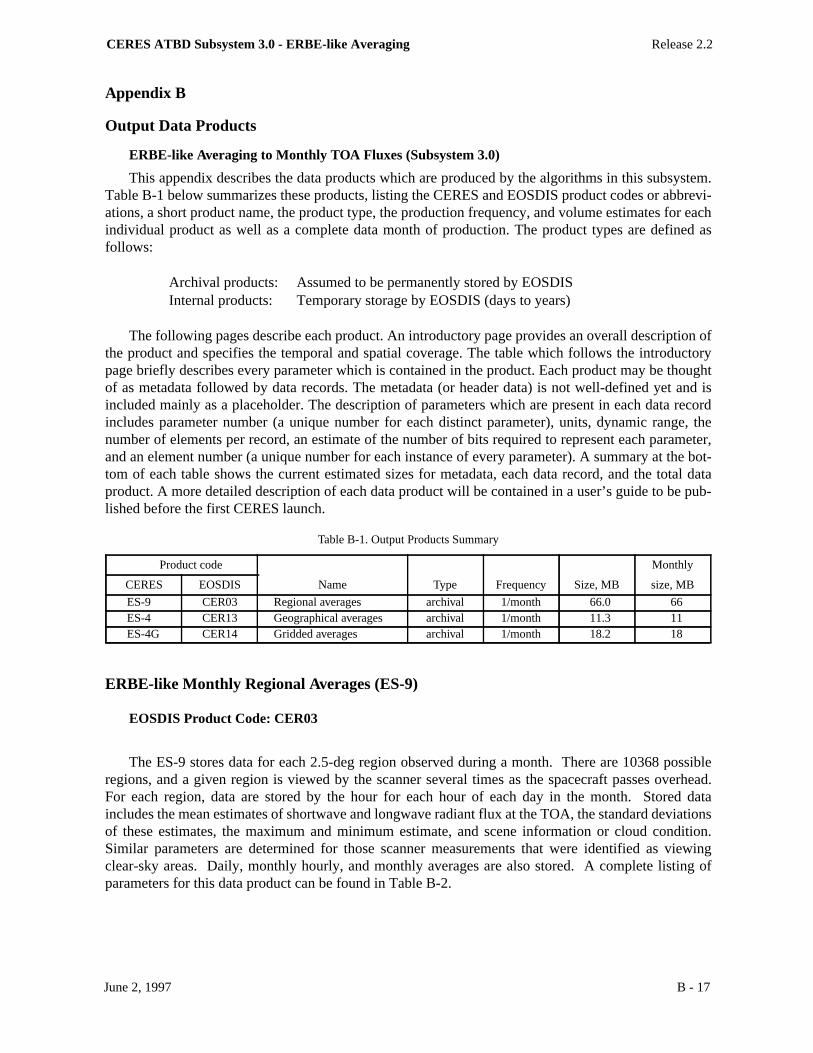
ERBE-like Averaging to Monthly TOA Fluxes (Subsystem 3.0)
This appendix describes the data products which are produced by the algorithms in this subsystem.Table B-1 below summarizes these products, listing the CERES and EOSDIS product codes or abbrevi-ations, a short product name, the product type, the production frequency, and volume estimates for eachindividual product as well as a complete data month of production. The product types are defined asfollows:
Archival products: Assumed to be permanently stored by EOSDISInternal products: Temporary storage by EOSDIS (days to years)
The following pages describe each product. An introductory page provides an overall description ofthe product and specifies the temporal and spatial coverage. The table which follows the introductorypage briefly describes every parameter which is contained in the product. Each product may be thoughtof as metadata followed by data records. The metadata (or header data) is not well-defined yet and isincluded mainly as a placeholder. The description of parameters which are present in each data recordincludes parameter number (a unique number for each distinct parameter), units, dynamic range, thenumber of elements per record, an estimate of the number of bits required to represent each parameter,and an element number (a unique number for each instance of every parameter). A summary at the bot-tom of each table shows the current estimated sizes for metadata, each data record, and the total dataproduct. A more detailed description of each data product will be contained in a user’s guide to be pub-lished before the first CERES launch.
ERBE-like Monthly Regional Averages (ES-9)
EOSDIS Product Code: CER03
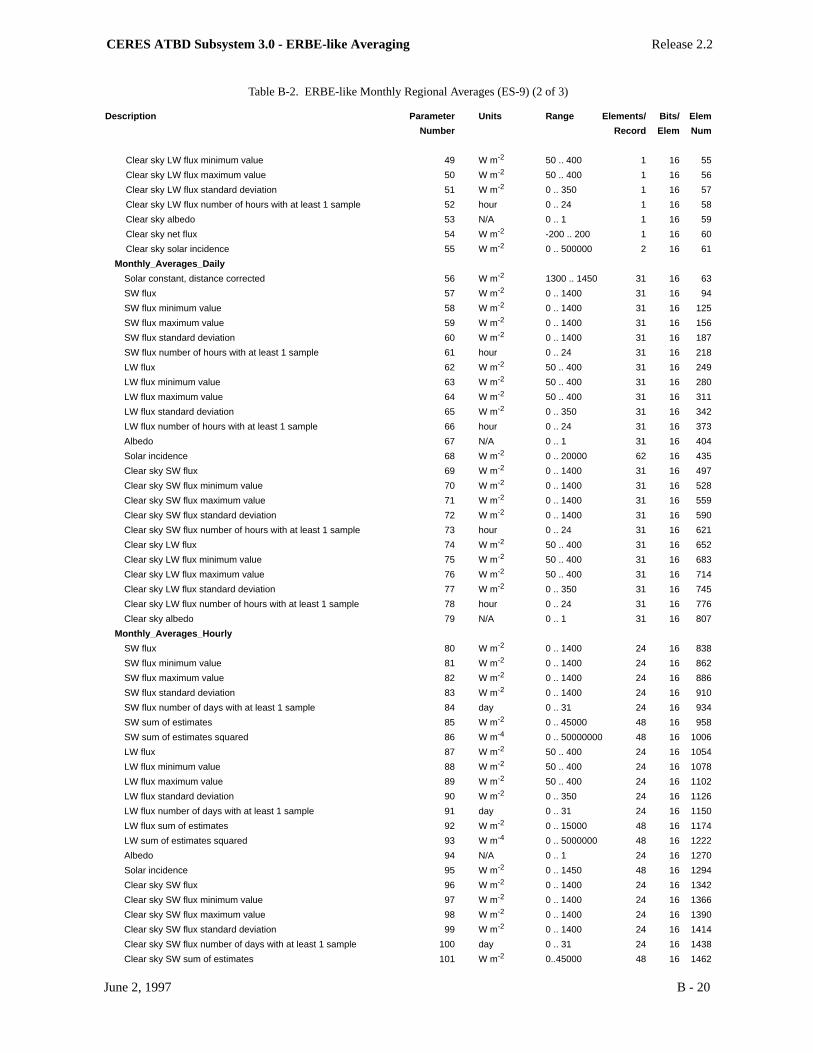
The ES-9 stores data for each 2.5-deg region observed during a month. There are 10368 possibleregions, and a given region is viewed by the scanner several times as the spacecraft passes overhead.For each region, data are stored by the hour for each hour of each day in the month. Stored dataincludes the mean estimates of shortwave and longwave radiant flux at the TOA, the standard deviationsof these estimates, the maximum and minimum estimate, and scene information or cloud condition.Similar parameters are determined for those scanner measurements that were identified as viewingclear-sky areas. Daily, monthly hourly, and monthly averages are also stored. A complete listing ofparameters for this data product can be found in Table B-2.
Table B-1. Output Products Summary
Product code Monthly
CERES EOSDIS Name Type Frequency Size, MB size, MB
ES-9 CER03 Regional averages archival 1/month 66.0 66ES-4 CER13 Geographical averages archival 1/month 11.3 11ES-4G CER14 Gridded averages archival 1/month 18.2 18

CERES ATBD Subsystem 3.0 - ERBE-like Averaging Release 2.2
June 2, 1997 B - 18
Level: 3 Portion of Globe CoveredType: Archival File: GlobalFrequency:1/Month Record: Regional
Time Interval Covered Portion of Atmosphere CoveredFile: 1 Month File: TOARecord: Hour Box Data

CERES ATBD Subsystem 3.0 - ERBE-like Averaging Release 2.2
June 2, 1997 B - 19
Table B-2. ERBE-like Monthly Regional Averages (ES-9) (1 of 3)
Description Parameter Units Range Elements/ Bits/ ElemNumber Record Elem Num
ES-9ES-9_File_Header
File header N/A TBD TBD
ES-9_Record_Level_Data_Scale_Factors
Scale factors N/A 93 16
ES-9_Data_Records
Region number 1 N/A 1..10368 1 16 1
Geographic scene type 2 N/A 1 .. 5 1 16 2
Sene fraction histogram 3 N/A N/A 4 16 3
Monthly_Averages_Day
SW flux 4 W m-2 0 .. 1400 1 16 7
SW flux minimum value 5 W m-2 0 .. 1400 1 16 8
SW flux maximum value 6 W m-2 0 .. 1400 1 16 9
SW flux standard deviation 7 W m-2 0 .. 1400 1 16 10
SW flux number of days with at least one sample 8 day 0 .. 31 1 16 11
LW flux 9 W m-2 50 .. 400 1 16 12
LW flux minimum value 10 W m-2 50 .. 400 1 16 13
LW flux maximum value 11 W m-2 50 .. 400 1 16 14
LW flux standard deviation 12 W m-2 0 .. 350 1 16 15
LW flux number of days with at least 1 sample 13 day 0 .. 31 1 16 16
Albedo 14 N/A 0 .. 1 1 16 17
Net flux 15 W m-2 -200 .. 200 1 16 18
Monthly total integrated solar incidence 16 N/A 0 .. 500000 2 16 19
Clear sky SW flux 17 W m-2 0 .. 1400 1 16 21
Clear sky SW flux minimum value 18 W m-2 0 .. 1400 1 16 22
Clear sky SW flux maximum value 19 W m-2 0 .. 1400 1 16 23
Clear sky SW flux standard deviation 20 W m-2 0 .. 1400 1 16 24
Clear sky SW flux number of days with at least 1 sample 21 day 0 .. 31 1 16 25
Clear sky LW flux average flux 22 W m-2 50 .. 400 1 16 26
Clear sky LW flux minimum value 23 W m-2 50 .. 400 1 16 27
Clear sky LW flux maximum value 24 W m-2 50 .. 400 1 16 28
Clear sky LW flux standard deviation 25 W m-2 0 .. 350 1 16 29
Clear sky LW flux number of days with at least 1 sample 26 day 0 .. 31 1 16 30
Clear sky albedo 27 N/A 0 .. 1 1 16 31
Clear sky net radiant flux 28 W m-2 -200 .. 200 1 16 32
Clear sky solar incidence 29 N/A 0 .. 500000 2 16 33
Monthly_Averages_Hour
SW flux 30 W m-2 0 .. 1400 1 16 35
SW flux minimum value 31 W m-2 0 .. 1400 1 16 36
SW flux maximum value 32 W m-2 0 .. 1400 1 16 37
SW flux standard deviation 33 W m-2 0 .. 1400 1 16 38
SW flux number of hours with at least 1 sample 34 hour 0 .. 24 1 16 39
LW flux 35 W m-2 50 .. 400 1 16 40
LW flux minimum value 36 W m-2 50 .. 400 1 16 41
LW flux maximum value 37 W m-2 50 .. 400 1 16 42
LW flux standard deviation 38 W m-2 0 .. 350 1 16 43
LW flux number of hours with at least 1 sample 39 hour 0 .. 24 1 16 44
Albedo 40 N/A 0 .. 1 1 16 45
Net flux 41 W m-2 -200 .. 200 1 16 46
Solar incidence 42 N/A 0 .. 500000 2 16 47
Clear sky SW flux 43 W m-2 0 .. 1400 1 16 49
Clear sky SW flux minimum value 44 W m-2 0 .. 1400 1 16 50
Clear sky SW flux maximum value 45 W m-2 0 .. 1400 1 16 51
Clear sky SW flux standard deviation 46 W m-2 0 .. 1400 1 16 52
Clear sky SW flux number of hours with at least 1 sample 47 hour 0 .. 24 1 16 53
Clear sky LW flux 48 W m-2 50 .. 400 1 16 54
CERES ATBD Subsystem 3.0 - ERBE-like Averaging Release 2.2
June 2, 1997 B - 20
Table B-2. ERBE-like Monthly Regional Averages (ES-9) (2 of 3)
Description Parameter Units Range Elements/ Bits/ Elem
Number Record Elem Num
Clear sky LW flux minimum value 49 W m-2 50 .. 400 1 16 55
Clear sky LW flux maximum value 50 W m-2 50 .. 400 1 16 56
Clear sky LW flux standard deviation 51 W m-2 0 .. 350 1 16 57
Clear sky LW flux number of hours with at least 1 sample 52 hour 0 .. 24 1 16 58
Clear sky albedo 53 N/A 0 .. 1 1 16 59
Clear sky net flux 54 W m-2 -200 .. 200 1 16 60
Clear sky solar incidence 55 W m-2 0 .. 500000 2 16 61
Monthly_Averages_Daily
Solar constant, distance corrected 56 W m-2 1300 .. 1450 31 16 63
SW flux 57 W m-2 0 .. 1400 31 16 94
SW flux minimum value 58 W m-2 0 .. 1400 31 16 125
SW flux maximum value 59 W m-2 0 .. 1400 31 16 156
SW flux standard deviation 60 W m-2 0 .. 1400 31 16 187
SW flux number of hours with at least 1 sample 61 hour 0 .. 24 31 16 218
LW flux 62 W m-2 50 .. 400 31 16 249
LW flux minimum value 63 W m-2 50 .. 400 31 16 280
LW flux maximum value 64 W m-2 50 .. 400 31 16 311
LW flux standard deviation 65 W m-2 0 .. 350 31 16 342
LW flux number of hours with at least 1 sample 66 hour 0 .. 24 31 16 373
Albedo 67 N/A 0 .. 1 31 16 404
Solar incidence 68 W m-2 0 .. 20000 62 16 435
Clear sky SW flux 69 W m-2 0 .. 1400 31 16 497
Clear sky SW flux minimum value 70 W m-2 0 .. 1400 31 16 528
Clear sky SW flux maximum value 71 W m-2 0 .. 1400 31 16 559
Clear sky SW flux standard deviation 72 W m-2 0 .. 1400 31 16 590
Clear sky SW flux number of hours with at least 1 sample 73 hour 0 .. 24 31 16 621
Clear sky LW flux 74 W m-2 50 .. 400 31 16 652
Clear sky LW flux minimum value 75 W m-2 50 .. 400 31 16 683
Clear sky LW flux maximum value 76 W m-2 50 .. 400 31 16 714
Clear sky LW flux standard deviation 77 W m-2 0 .. 350 31 16 745
Clear sky LW flux number of hours with at least 1 sample 78 hour 0 .. 24 31 16 776
Clear sky albedo 79 N/A 0 .. 1 31 16 807
Monthly_Averages_Hourly
SW flux 80 W m-2 0 .. 1400 24 16 838
SW flux minimum value 81 W m-2 0 .. 1400 24 16 862
SW flux maximum value 82 W m-2 0 .. 1400 24 16 886
SW flux standard deviation 83 W m-2 0 .. 1400 24 16 910
SW flux number of days with at least 1 sample 84 day 0 .. 31 24 16 934
SW sum of estimates 85 W m-2 0 .. 45000 48 16 958
SW sum of estimates squared 86 W m-4 0 .. 50000000 48 16 1006
LW flux 87 W m-2 50 .. 400 24 16 1054
LW flux minimum value 88 W m-2 50 .. 400 24 16 1078
LW flux maximum value 89 W m-2 50 .. 400 24 16 1102
LW flux standard deviation 90 W m-2 0 .. 350 24 16 1126
LW flux number of days with at least 1 sample 91 day 0 .. 31 24 16 1150
LW flux sum of estimates 92 W m-2 0 .. 15000 48 16 1174
LW sum of estimates squared 93 W m-4 0 .. 5000000 48 16 1222
Albedo 94 N/A 0 .. 1 24 16 1270
Solar incidence 95 W m-2 0 .. 1450 48 16 1294
Clear sky SW flux 96 W m-2 0 .. 1400 24 16 1342
Clear sky SW flux minimum value 97 W m-2 0 .. 1400 24 16 1366
Clear sky SW flux maximum value 98 W m-2 0 .. 1400 24 16 1390
Clear sky SW flux standard deviation 99 W m-2 0 .. 1400 24 16 1414
Clear sky SW flux number of days with at least 1 sample 100 day 0 .. 31 24 16 1438
Clear sky SW sum of estimates 101 W m-2 0..45000 48 16 1462

CERES ATBD Subsystem 3.0 - ERBE-like Averaging Release 2.2
June 2, 1997 B - 21
Table B-2. ERBE-like Monthly Regional Averages (ES-9) (3 of 3)
Description Parameter Units Range Elements/ Bits/ Elem
Number Record Elem Num
Clear sky SW sum of estimates squared 102 W m-4 0 .. 50000000 48 16 1510
Clear sky LW flux 103 W m-2 50 .. 400 24 16 1558
Clear sky LW flux minimum value 104 W m-2 50 .. 400 24 16 1582
Clear sky LW flux maximum value 105 W m-2 50 .. 400 24 16 1606
Clear sky LW flux standard deviation 106 W m-2 0 .. 350 24 16 1630
Clear sky LW flux number of days with at least 1 sample 107 day 0 .. 31 24 16 1654
Clear sky LW sum of estimates 108 W m-2 0 .. 15000 48 16 1678
Clear sky LW sum of estimates squared 109 W m-4 0 .. 5000000 48 16 1726
Clear sky albedo 110 W m-2 0 .. 1 24 16 1774
Clear sky solar incidence 111 W m-2 0 .. 1450 48 16 1798
Number_of_Monthly_Hour_boxes
Number of hour boxes 112 Hour boxes 1 .. 744 1 16 1846
Monthly_Hourly_Daily
Hour box number 113 N/A 1 .. 744 744 16 1847
Whole part of Julian date 114 day 2449353..2458500 1488 16 2591
Fractional part of Julian day 115 day 0 .. 1 744 16 4079
Scene fraction 116 N/A 0 .. 1 2976 16 4823
Albedo vector 117 N/A 0 .. 1 2976 16 7799
Cosine of the solar zenith angle 118 N/A 0 .. 1 744 16 10775
Satellite zenith angle 119 deg 0 .. 90 744 16 11519
Azimuth angle 120 deg 0 .. 360 744 16 12263
Solar incidence 121 W m-2 0 .. 1450 744 16 13007
SW flux 122 W m-2 0 .. 1400 744 16 13751
SW flux minimum value 123 W m-2 0 .. 1400 744 16 14495
SW flux maximum value 124 W m-2 0 .. 1400 744 16 15239
SW flux standard deviation 125 W m-2 0 .. 1400 744 16 15983
SW flux number 126 N/A TBD 744 16 16727
LW flux 127 W m-2 50 .. 400 744 16 17471
LW flux minimum value 128 W m-2 50 .. 400 744 16 18215
LW flux maximum value 129 W m-2 50 .. 400 744 16 18959
LW flux standard deviation 130 W m-2 0 .. 350 744 16 19703
LW flux number 131 N/A TBD 744 16 20447
SW flux maximum difference 132 W m-2 TBD 744 16 21191
LW flux maximum difference 133 W m-2 TBD 744 16 21935
Clear sky albedo 134 N/A 0 .. 1 744 16 22679
Clear sky LW flux 135 W m-2 50 .. 400 744 16 23423
Clear sky LW flux standard deviation 136 W m-2 0 .. 350 744 16 24167
Clear sky LW flux number 137 N/A TBD 744 16 24911
Total Meta Bits/File: TBD
Total Data Bits/Record: 410464
Total Records/File: 10368
Total Data Bits/File: 4255690752
Total Bits/File : 4255692240
(Note: Sizing estimates shown in this table assume that all 2.5-deg regions and all hour boxes contain data. The sizing estimate for the ES-9 in Table
B-1 is for TRMM.)

CERES ATBD Subsystem 3.0 - ERBE-like Averaging Release 2.2
June 2, 1997 B - 22
ERBE-like Monthly Geographical Averages (ES-4)
EOSDIS Product Code: CER13
The ES-4 data is a regional, zonal, and global averages product. The instantaneous scanner esti-mates at the TOA are arranged temporally by hours, days, and the month. They are averaged spatiallyby regions, latitude zones, and the globe. The ES-4 product contains a header record, a record of fileaddress map, a record of data scale factors, and seven sets of data records. Each data record set corre-sponds to a regional, nested regional, zonal, or global average. There are 10368 2.5-degree regions forthe ERBE-like data. Therefore, there is a maximum of 10368 records in the 2.5-degree regional recordset. The second set of records is the 2.5-degree nested to 5.0 degree regional data, which constitutes2592 records. The third set of records is the 5.0 degree nested to 10.0 degree regional data, which con-stitutes 648 records. The fourth, fifth, and sixth sets of records are the 2.5 degree, 5.0 degree, and 10.0degree zonally averaged data which constitute 72, 36, and 18 records, respectively. The last set is theglobal data, which constitutes 3 records. A complete listing of parameters for this data product can befound in Table B-3.
Level: 3 Portion of Globe CoveredType: Archival File: Regional, zonal, globalFrequency:1/Month Record: Regional, zonal, global
Time Interval Covered Portion of Atmosphere CoveredFile: Month File: TOARecord: Month

CERES ATBD Subsystem 3.0 - ERBE-like Averaging Release 2.2
June 2, 1997 B - 23
Table B-3. ERBE-like Monthly Geographical Averages (ES-4) (1 of 2)
Description Parameter Units Range Elements/ Bits/ ElemNumber Record Elem Num
ES-4
ES-4_Header :
File header N/A N/A TBD TBD
ES-4_Record_Mapping_Matrix (1 record)
10 X 2 mapping matrix for spatial boundaries N/A N/A 20 32
ES-4_Record_Data_Scaling (1 record)
Scale factors for 32-bits Data N/A N/A 90 32
Scale factors for 16-bits Data N/A N/A 345 16
Scale factors for 8-bits Data N/A N/A 240 8
ES-4_2.5-deg Regional Data Record (10368 records)
32-bit_Data
File ID 1 N/A N/A 1 32 1
Solar Incidence for Monthly Averages by Day 2 W h m-2 0 .. 500000 1 32 2
Monthly net radiant flux by day 3 W m-2 -200 .. 200 1 32 3
Clear sky net radiant flux, monthly by day 4 W m-2 -200 .. 200 1 32 4
Clear sky solar incidence, monthly by day 5 W m-2 0 .. 500000 1 32 5
Monthly net radiant flux by hour 6 W m-2 -200 .. 200 1 32 6
Solar incidence, monthly by hour 7 W h m-2 0 .. 500000 1 32 7
Clear sky net radiant flux, monthly by hour 8 W m-2 -200 .. 200 1 32 8
Clear sky solar incidence, monthly by hour 9 W h m-2 0 .. 500000 1 32 9
Daily solar incidence 10 W h m-2 0 .. 500000 31 32 10
Hourly solar incidence 11 W h m-2 0 .. 500000 24 32 41
Clear sky solar incidence 12 W h m-2 0 .. 500000 24 32 65
32-bit Spares 13 N/A N/A 2 32 89
16-bit_Data
Region number 14 N/A 1 .. 144 1 16 91
Year and month (YYMM) of data processed 15 N/A N/A 1 16 92
Spacecraft code (TBD) 16 N/A TBD 1 16 93
Longwave flux 17 W m-2 50 .. 400 1 16 94
Shortwave flux 18 W m-2 0 .. 1400 1 16 95
Monthly mean albedo 19 N/A 0 .. 1 1 16 96
Clear sky longwave flux 20 W m-2 50 .. 400 1 16 97
Clear sky shortwave flux 21 W m-2 0 .. 1400 1 16 98
Monthly mean clear sky albedo 22 N/A 0 .. 1 1 16 99
Longwave flux by the hour 23 W m-2 50 .. 400 1 16 100
Shortwave flux by the hour 24 W m-2 0 .. 1400 1 16 101
Monthly average albedo by the hour 25 N/A 0 .. 1 1 16 102
Clear sky longwave flux by the hour 26 W m-2 50 .. 400 1 16 103
Clear sky shortwave flux by the hour 27 W m-2 0 .. 1400 1 16 104
Clear sky Monthly averaged albedo by the hour 28 N/A 0 .. 1 1 16 105
Longwave flux, daily 29 W m-2 50 .. 400 31 16 106
Short wave flux, daily 30 W m-2 0 .. 1200 31 16 137
Monthly mean albedo, daily 31 N/A 0 .. 1 31 16 168
Clear sky longwave flux, daily 32 W m-2 50 .. 400 31 16 199
Clear sky shortwave flux, daily 33 W m-2 0 .. 1400 31 16 230
Monthly mean clear sky albedo, daily 34 N/A 0 .. 1 31 16 261
Longwave flux, hourly 35 W m-2 50 .. 400 24 16 285
Shortwave flux, hourly 36 W m-2 0 .. 1400 24 16 309
Monthly average albedo, hourly 37 N/A 0 .. 1 24 16 333
Clear sky longwave flux, hourly 38 W m-2 50 .. 400 24 16 357
Clear sky shortwave flux, hourly 39 W m-2 0 .. 1400 24 16 381
Clear sky Monthly averaged albedo, hourly 40 N/A 0 .. 1 24 16 405
8-bit_Data
Number of observations for LW, daily 41 hour 0 .. 24 31 8 436
Number of observations SW, daily 42 hour 0 .. 24 31 8 467

CERES ATBD Subsystem 3.0 - ERBE-like Averaging Release 2.2
June 2, 1997 B - 24
Table B-3. ERBE-like Monthly Geographical Averages (ES-4) (2 of 2)
Description Parameter Units Range Elements/ Bits/ ElemNumber Record Elem Num
Number of observations for clear sky LW, daily 43 hour 0 .. 24 31 8 498
Number of observations for clear sky SW, daily 44 hour 0 .. 24 31 8 529
Number of observations for LW, hourly 45 day 0 .. 31 24 8 560
Number of observations for SW, hourly 46 day 0 .. 31 24 8 584
Number of observations for clear sky LW, hourly 47 day 0 .. 31 24 8 608
Number of observations for clear sky SW, hourly 48 day 0 .. 31 24 8 632
Spares 49 N/A N/A 20 8 656
ES-4_5.0-deg Nested Regional Data Record (2592 records)
32-bit_Data
Same parameters as in 2.5-deg Regional Data Record 1 N/A N/A 90 32 1
16-bit_Data
Same parameters as in 2.5-deg Regional Data Record 14 N/A N/A 345 16 91
8-bit_Data
Same parameters as in 2.5-deg Regional Data Record 41 N/A N/A 240 8 436
ES-4_10.0-deg Nested Regional Data Record (648 records)
32-bit_Data
Same parameters as in 2.5-deg Regional Data Record 1 N/A N/A 90 32 1
16-bit_Data
Same parameters as in 2.5-deg Regional Data Record 14 N/A N/A 345 16 91
8-bit_Data
Same parameters as in 2.5-deg Regional Data Record 41 N/A N/A 240 8 436
ES-4_2.5-deg Zonal Data Record (72 records)
32-bit_Data
Same parameters as in 2.5-deg Regional Data Record 1 N/A N/A 90 32 1
16-bit_Data
Same parameters as in 2.5-deg Regional Data Record 14 N/A N/A 345 16 91
8-bit_Data
Same parameters as in 2.5-deg Regional Data Record 41 N/A N/A 240 8 436
ES-4_5.0-deg Zonal Data Record (36 records)
32-bit_Data
Same parameters as in 2.5-deg Regional Data Record 1 N/A N/A 90 32 1
16-bit_Data
Same parameters as in 2.5-deg Regional Data Record 14 N/A N/A 345 16 91
8-bit_Data
Same parameters as in 2.5-deg Regional Data Record 41 N/A N/A 240 8 436
ES-4_10.0-deg Zonal Data Record (18 records)
32-bit_Data
Same parameters as in 2.5-deg Regional Data Record 1 N/A N/A 90 32 1
16-bit_Data
Same parameters as in 2.5-deg Regional Data Record 14 N/A N/A 345 16 91
8-bit_Data
Same parameters as in 2.5-deg Regional Data Record 41 N/A N/A 240 8 436
ES-4_Global Zonal Data Record (3 records)
32-bit_Data
Same parameters as in 2.5-deg Regional Data Record 1 N/A N/A 90 32 1
16-bit_Data
Same parameters as in 2.5-deg Regional Data Record 14 N/A N/A 345 16 91
8-bit_Data
Same parameters as in 2.5-deg Regional Data Record 41 N/A N/A 240 8 436
Total Meta Bits/File: TBDTotal Data Bits/Record: 10320Total Records/File: 13739Total Data Bits/File: 141786480Total Bits/File : 141786480
(Note: Sizing estimates shown in this table assume that all 2.5-deg regions and all hour boxes contain data. The sizing estimate for the ES-4 in Table
B-1 is for TRMM.)
CERES ATBD Subsystem 3.0 - ERBE-like Averaging Release 2.2
June 2, 1997 B - 25
ERBE-like Monthly Gridded Averages (ES-4G)
EOSDIS Product Code: CER14
The ES-4G data product stores the same time and space averages as the ES-4 science data product,with the difference being the arrangement of the data. While the ES-4 is arranged by region, the ES-4Gfiles present a gridded data product with all regions for a given data parameter grouped together. Theregional presentation of the data is in the same order as that described for the ES-4 product. The 2.5degree regional parameters are presented as 10368-element vectors, the 2.5 nested to 5.0 degree data ispresented as 2592-element vectors, and the 5.0 nested to 10.0 degree data is presented as 648-elementvectors. The 2.5, 5.0, and 10.0 degree zonal data is presented as 72, 36, and 18-element vectors respec-tively. The global data are presented as 3-element vectors.
The ES-4G data product is written on four output files. The first three files contains 2.5-degregional data, 32-bit, 16-bit, and 8-bit data. The fourth file contains nested regional data, all zonal data,and global data. A complete listing of parameters for this data product can be found in Table B-4.
Level: 3 Portion of Globe CoveredType: Archival File: Global, Zonal, RegionalFrequency:1/Month Record: Global, Zonal, Regional
Time Interval Covered Portion of Atmosphere CoveredFile: Month File: TOARecord: Month

CERES ATBD Subsystem 3.0 - ERBE-like Averaging Release 2.2
June 2, 1997 B - 26
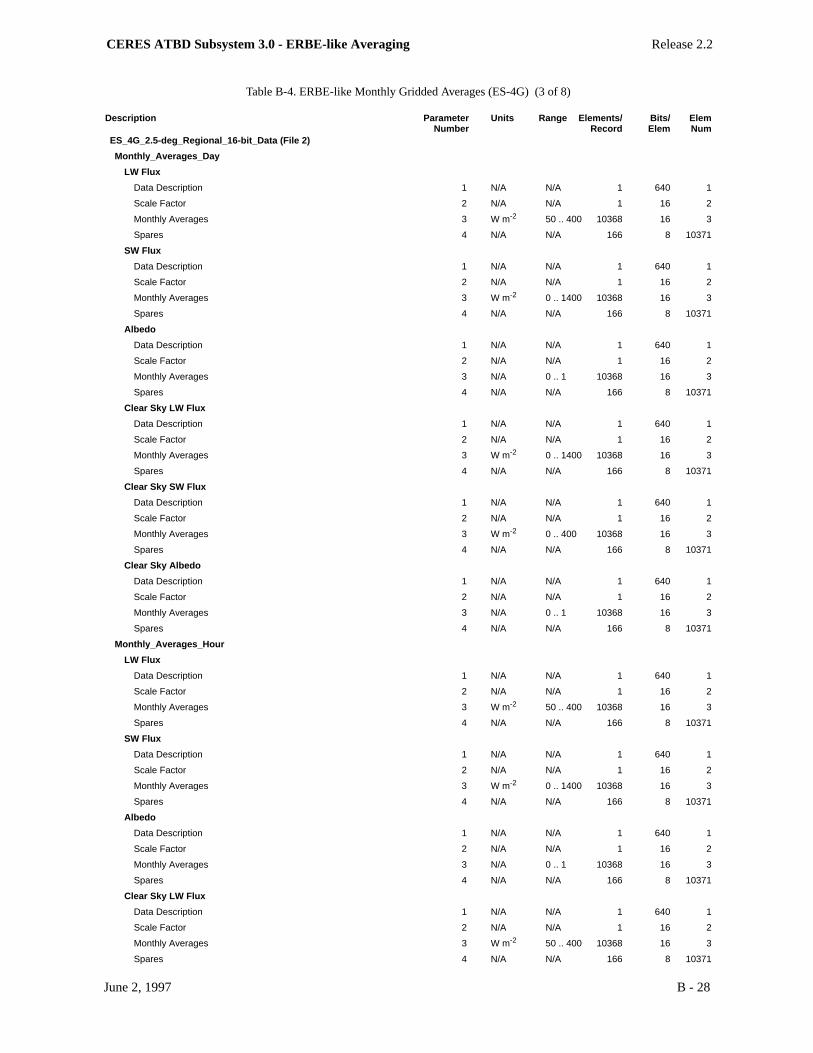
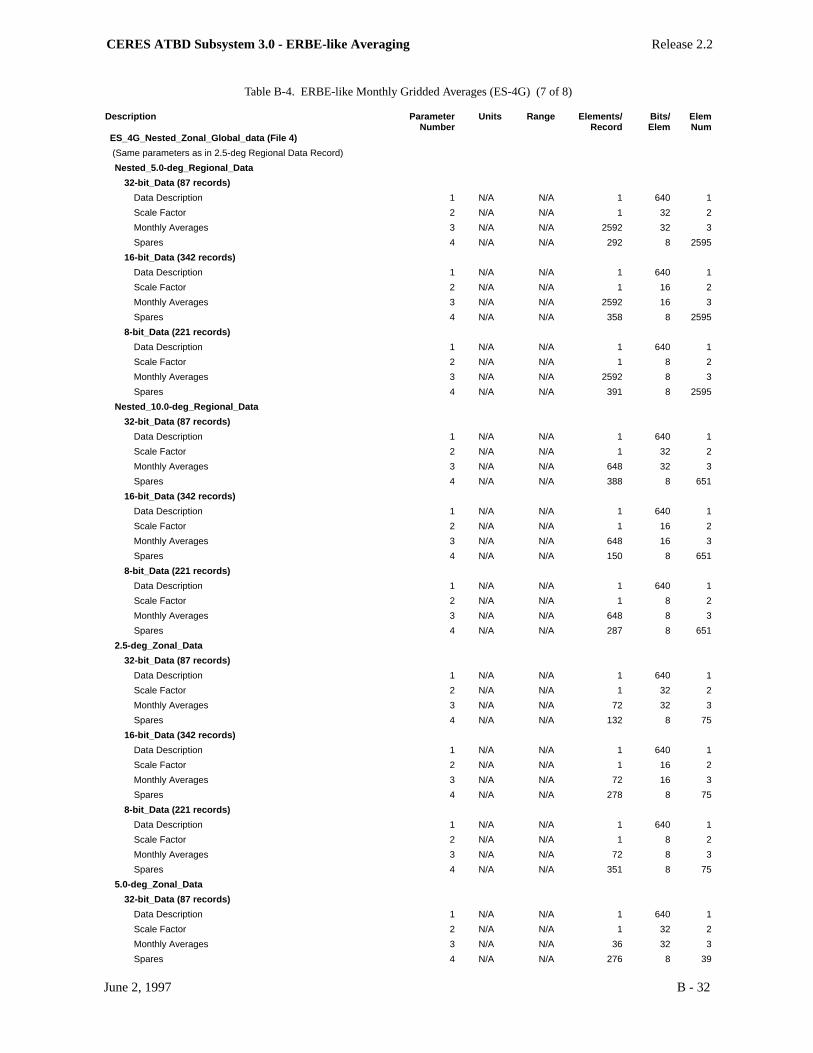
Table B-4. ERBE-like Monthly Gridded Averages (ES-4G) (1 of 8)
Description Parameter Units Range Elements/ Bits/ Elem
Number Record Elem Num
ES_4G_2.5-deg_Regional_32-bit_Data (File 1)
Monthly_Averages_Day
Solar Incidence
Data Description 1 N/A N/A 1 640 1
Scale Factor 2 N/A N/A 1 32 2
Monthly Averages 3 W h m-2 0 .. 500000 10368 32 3
Spares 4 N/A N/A 420 8 10371
Net Flux
Data Description 1 N/A N/A 1 640 1
Scale Factor 2 N/A N/A 1 32 2
Monthly Averages 3 W m-2 -200 .. 200 10368 32 3
Spares 4 N/A N/A 420 8 10371
Clear Sky Net Flux
Data Description 1 N/A N/A 1 640 1
Scale Factor 2 N/A N/A 1 32 2
Monthly Average 3 W m-2 -200 .. 200 10368 32 3
Spares 4 N/A N/A 420 8 10371
Clear Sky Solar Incidence
Data Description 1 N/A N/A 1 640 1
Scale Factor 2 N/A N/A 1 32 2
Monthly Averages 3 W h m-2 0 .. 500000 10368 32 3
Spares 4 N/A N/A 420 8 10371
Monthly_Averages_Hour
Net Flux
Data Description 1 N/A N/A 1 640 1
Scale Factor 2 N/A N/A 1 32 2
Monthly Averages 3 W m-2 -200 .. 200 10368 32 3
Spares 4 N/A N/A 420 8 10371
Solar Incidence
Data Description 1 N/A N/A 1 640 1
Scale Factor 2 N/A N/A 1 32 2
Monthly Averages 3 W h m-2 0 .. 500000 10368 32 3
Spares 4 N/A N/A 420 8 10371
Clear Sky Net Flux
Data Description 1 N/A N/A 1 640 1
Scale Factor 2 N/A N/A 1 32 2
Monthly Averages 3 W m-2 -200 .. 200 10368 32 3
Spares 4 N/A N/A 420 8 10371
Clear Sky Solar Incidence
Data Description 1 N/A N/A 1 640 1
Scale Factor 2 N/A N/A 1 32 2
Monthly Averages 3 W h m-2 0 .. 500000 10368 32 3
Spares 4 N/A N/A 420 8 10371
Monthly_Averages_Daily
Solar Incidence (31 records)
Data Description 1 N/A N/A 1 640 1
Scale Factor 2 N/A N/A 1 32 2
Monthly Averages 3 W h m-2 0 .. 500000 10368 32 3
Spares 4 N/A N/A 420 8 10371
Monthly_Averages_Hourly
Solar Incidence (24 records)
Data Description 1 N/A N/A 1 640 1
Scale Factor 2 N/A N/A 1 32 2
Monthly Averages 3 W h m-2 0 .. 500000 10368 32 3
Spares 4 N/A N/A 420 8 10371

CERES ATBD Subsystem 3.0 - ERBE-like Averaging Release 2.2
June 2, 1997 B - 27
Table B-4. ERBE-like Monthly Gridded Averages (ES-4G) (2 of 8)
Description Parameter Units Range Elements/ Bits/ ElemNumber Record Elem Num
Clear Sky Solar Incidence (24 records)
Data Description 1 N/A N/A 1 640 1
Scale Factor 2 N/A N/A 1 32 2
Monthly Averages 3 W h m-2 0 .. 500000 10368 32 3
Spares 4 N/A N/A 420 8 10371
Total Meta Bits/File: TBD
Total Data Bits/Record: 335872
Total Records/File 1: 87
Total Data Bits/File 1: 29220864
Total Bits/File 1 : 29220864
CERES ATBD Subsystem 3.0 - ERBE-like Averaging Release 2.2
June 2, 1997 B - 28
Table B-4. ERBE-like Monthly Gridded Averages (ES-4G) (3 of 8)
Description Parameter Units Range Elements/ Bits/ ElemNumber Record Elem Num
ES_4G_2.5-deg_Regional_16-bit_Data (File 2)
Monthly_Averages_Day
LW Flux
Data Description 1 N/A N/A 1 640 1
Scale Factor 2 N/A N/A 1 16 2
Monthly Averages 3 W m-2 50 .. 400 10368 16 3
Spares 4 N/A N/A 166 8 10371
SW Flux
Data Description 1 N/A N/A 1 640 1
Scale Factor 2 N/A N/A 1 16 2
Monthly Averages 3 W m-2 0 .. 1400 10368 16 3
Spares 4 N/A N/A 166 8 10371
Albedo
Data Description 1 N/A N/A 1 640 1
Scale Factor 2 N/A N/A 1 16 2
Monthly Averages 3 N/A 0 .. 1 10368 16 3
Spares 4 N/A N/A 166 8 10371
Clear Sky LW Flux
Data Description 1 N/A N/A 1 640 1
Scale Factor 2 N/A N/A 1 16 2
Monthly Averages 3 W m-2 0 .. 1400 10368 16 3
Spares 4 N/A N/A 166 8 10371
Clear Sky SW Flux
Data Description 1 N/A N/A 1 640 1
Scale Factor 2 N/A N/A 1 16 2
Monthly Averages 3 W m-2 0 .. 400 10368 16 3
Spares 4 N/A N/A 166 8 10371
Clear Sky Albedo
Data Description 1 N/A N/A 1 640 1
Scale Factor 2 N/A N/A 1 16 2
Monthly Averages 3 N/A 0 .. 1 10368 16 3
Spares 4 N/A N/A 166 8 10371
Monthly_Averages_Hour
LW Flux
Data Description 1 N/A N/A 1 640 1
Scale Factor 2 N/A N/A 1 16 2
Monthly Averages 3 W m-2 50 .. 400 10368 16 3
Spares 4 N/A N/A 166 8 10371
SW Flux
Data Description 1 N/A N/A 1 640 1
Scale Factor 2 N/A N/A 1 16 2
Monthly Averages 3 W m-2 0 .. 1400 10368 16 3
Spares 4 N/A N/A 166 8 10371
Albedo
Data Description 1 N/A N/A 1 640 1
Scale Factor 2 N/A N/A 1 16 2
Monthly Averages 3 N/A 0 .. 1 10368 16 3
Spares 4 N/A N/A 166 8 10371
Clear Sky LW Flux
Data Description 1 N/A N/A 1 640 1
Scale Factor 2 N/A N/A 1 16 2
Monthly Averages 3 W m-2 50 .. 400 10368 16 3
Spares 4 N/A N/A 166 8 10371

CERES ATBD Subsystem 3.0 - ERBE-like Averaging Release 2.2
June 2, 1997 B - 29
Table B-4. ERBE-like Monthly Gridded Averages (ES-4G) (4 of 8)
Description Parameter Units Range Elements/ Bits/ ElemNumber Record Elem Num
Clear Sky SW Flux
Data Description 1 N/A N/A 1 640 1
Scale Factor 2 N/A N/A 1 16 2
Monthly Averages 3 W m-2 0 .. 1400 10368 16 3
Spares 4 N/A N/A 166 8 10371
Clear Sky Albedo
Data Description 1 N/A N/A 1 640 1
Scale Factor 2 N/A N/A 1 16 2
Monthly Averages 3 N/A 0 .. 1 10368 16 3
Spares 4 N/A N/A 166 8 10371
Monthly_Averages_Daily
LW Flux (31 records)
Data Description 1 N/A N/A 1 640 1
Scale Factor 2 N/A N/A 1 16 2
Monthly Averages 3 W m-2 50 .. 400 10368 16 3
Spares 4 N/A N/A 166 8 10371
SW Flux (31 records)
Data Description 1 N/A N/A 1 640 1
Scale Factor 2 N/A N/A 1 16 2
Monthly Averages 3 W m-2 50 .. 1400 10368 16 3
Spares 4 N/A N/A 166 8 10371
Albedo (31 records)
Data Description 1 N/A N/A 1 640 1
Scale Factor 2 N/A N/A 1 16 2
Monthly Averages 3 N/A 0 .. 1 10368 16 3
Spares 4 N/A N/A 166 8 10371
Clear Sky LW Flux (31 records)
Data Description 1 N/A N/A 1 640 1
Scale Factor 2 N/A N/A 1 16 2
Monthly Averages 3 W m-2 50 .. 400 10368 16 3
Spares 4 N/A N/A 166 8 10371
Clear Sky SW Flux (31 records)
Data Description 1 N/A N/A 1 640 1
Scale Factor 2 N/A N/A 1 16 2
Monthly Averages 3 W m-2 0 .. 1400 10368 16 3
Spares 4 N/A N/A 166 8 10371
Clear Sky Albedo (31 records)
Data Description 1 N/A N/A 1 640 1
Scale Factor 2 N/A N/A 1 16 2
Monthly Averages 3 N/A 0 .. 1 10368 16 3
Spares 4 N/A N/A 166 8 10371
Monthly_Averages_Hourly
LW Flux (24 records)
Data Description 1 N/A N/A 1 640 1
Scale Factor 2 N/A N/A 1 16 2
Monthly Averages 3 W m-2 50 .. 400 10368 16 3
Spares 4 N/A N/A 166 8 10371
SW Flux (24 records)
Data Description 1 N/A N/A 1 640 1
Scale Factor 2 N/A N/A 1 16 2
Monthly Averages 3 W m-2 0 .. 1400 10368 16 3
Spares 4 N/A N/A 166 8 10371

CERES ATBD Subsystem 3.0 - ERBE-like Averaging Release 2.2
June 2, 1997 B - 30
Table B-4. ERBE-like Monthly Gridded Averages (ES-4G) (5 of 8)
Description Parameter Units Range Elements/ Bits/ ElemNumber Record Elem Num
Albedo (24 records)
Data Description 1 N/A N/A 1 640 1
Scale Factor 2 N/A N/A 1 16 2
Monthly Averages 3 N/A 0 .. 1 10368 16 3
Spares 4 N/A N/A 166 8 10371
Clear Sky LW Flux (24 records)
Data Description 1 N/A N/A 1 640 1
Scale Factor 2 N/A N/A 1 16 2
Monthly Averages 3 W m-2 50 .. 400 10368 16 3
Spares 4 N/A N/A 166 8 10371
Clear Sky SW Flux (24 records)
Data Description 1 N/A N/A 1 640 1
Scale Factor 2 N/A N/A 1 16 2
Monthly Averages 3 W m-2 0 .. 1400 10368 16 3
Spares 4 N/A N/A 166 8 10371
Clear Sky Albedo (24 records)
Data Description 1 N/A N/A 1 640 1
Scale Factor 2 N/A N/A 1 16 2
Monthly Averages 3 N/A 0 .. 1 10368 16 3
Spares 4 N/A N/A 166 8 10371
Total Meta Bits/File: TBD
Total Data Bits/Record: 167936
Total Records/File 2: 342
Total Data Bits/File 2: 57434112
Total Bits/File 2: 57434112

CERES ATBD Subsystem 3.0 - ERBE-like Averaging Release 2.2
June 2, 1997 B - 31
Table B-4. ERBE-like Monthly Gridded Averages (ES-4G) (6 of 8)
Description Parameter Units Range Elements/ Bits/ ElemNumber Record Elem Num
ES_4G_2.5-deg_Regional_8-bit_Data (File 3)
Number of Observations_Daily
LW Flux (31 records)
Data Description 1 N/A N/A 1 640 1
Scale Factor 2 N/A N/A 1 8 2
Number of Observations 3 hour 0..24 10368 8 3
Spares 4 N/A N/A 295 8 10371
SW Flux (31 records)
Data Description 1 N/A N/A 1 640 1
Scale Factor 2 N/A N/A 1 8 2
Number of Observations 3 hour 0..24 10368 8 3
Spares 4 N/A N/A 295 8 10371
Clear Sky LW Flux (31 records)
Data Description 1 N/A N/A 1 640 1
Scale Factor 2 N/A N/A 1 8 2
Number of Observations 3 hour 0..24 10368 8 3
Spares 4 N/A N/A 295 8 10371
Clear Sky SW Flux (31 records)
Data Description 1 N/A N/A 1 640 1
Scale Factor 2 N/A N/A 1 8 2
Number of Observations 3 hour 0..24 10368 8 3
Spares 4 N/A N/A 295 8 10371
Number of Observations_Hourly
LW Flux (24 records)
Data Description 1 N/A N/A 1 640 1
Scale Factor 2 N/A N/A 1 8 2
Number of Observations 3 day 0..31 10368 8 3
Spares 4 N/A N/A 295 8 10371
SW Flux (24 records)
Data Description 1 N/A N/A 1 640 1
Scale Factor 2 N/A N/A 1 8 2
Number of Observations 3 day 0..31 10368 8 3
Spares 4 N/A N/A 295 8 10371
Clear Sky LW Flux (24 records)
Data Description 1 N/A N/A 1 640 1
Scale Factor 2 N/A N/A 1 8 2
Number of Observations 3 day 0..31 10368 8 3
Spares 4 N/A N/A 295 8 10371
Clear Sky SW Flux (24 records)
Data Description 1 N/A N/A 1 640 1
Scale Factor 2 N/A N/A 1 8 2
Number of Observations 3 day 0..31 10368 8 3
Spares 4 N/A N/A 295 8 10371
Geotype
Geotype_Instances
Data Description 1 N/A N/A 1 640 1
Scale Factor 2 N/A N/A 1 8 2
Geotype of Region 3 N/A 0 .. 5 10368 8 3
Spares 4 N/A N/A 295 8 10371
Total Meta Bits/File: TBD
Total Data Bits/Record: 86016
Total Records/File 3: 221
Total Data Bits/File 3: 19009536
Total Bits/File 3: 19009536
CERES ATBD Subsystem 3.0 - ERBE-like Averaging Release 2.2
June 2, 1997 B - 32
Table B-4. ERBE-like Monthly Gridded Averages (ES-4G) (7 of 8)
Description Parameter Units Range Elements/ Bits/ ElemNumber Record Elem Num
ES_4G_Nested_Zonal_Global_data (File 4)
(Same parameters as in 2.5-deg Regional Data Record)
Nested_5.0-deg_Regional_Data
32-bit_Data (87 records)
Data Description 1 N/A N/A 1 640 1
Scale Factor 2 N/A N/A 1 32 2
Monthly Averages 3 N/A N/A 2592 32 3
Spares 4 N/A N/A 292 8 2595
16-bit_Data (342 records)
Data Description 1 N/A N/A 1 640 1
Scale Factor 2 N/A N/A 1 16 2
Monthly Averages 3 N/A N/A 2592 16 3
Spares 4 N/A N/A 358 8 2595
8-bit_Data (221 records)
Data Description 1 N/A N/A 1 640 1
Scale Factor 2 N/A N/A 1 8 2
Monthly Averages 3 N/A N/A 2592 8 3
Spares 4 N/A N/A 391 8 2595
Nested_10.0-deg_Regional_Data
32-bit_Data (87 records)
Data Description 1 N/A N/A 1 640 1
Scale Factor 2 N/A N/A 1 32 2
Monthly Averages 3 N/A N/A 648 32 3
Spares 4 N/A N/A 388 8 651
16-bit_Data (342 records)
Data Description 1 N/A N/A 1 640 1
Scale Factor 2 N/A N/A 1 16 2
Monthly Averages 3 N/A N/A 648 16 3
Spares 4 N/A N/A 150 8 651
8-bit_Data (221 records)
Data Description 1 N/A N/A 1 640 1
Scale Factor 2 N/A N/A 1 8 2
Monthly Averages 3 N/A N/A 648 8 3
Spares 4 N/A N/A 287 8 651
2.5-deg_Zonal_Data
32-bit_Data (87 records)
Data Description 1 N/A N/A 1 640 1
Scale Factor 2 N/A N/A 1 32 2
Monthly Averages 3 N/A N/A 72 32 3
Spares 4 N/A N/A 132 8 75
16-bit_Data (342 records)
Data Description 1 N/A N/A 1 640 1
Scale Factor 2 N/A N/A 1 16 2
Monthly Averages 3 N/A N/A 72 16 3
Spares 4 N/A N/A 278 8 75
8-bit_Data (221 records)
Data Description 1 N/A N/A 1 640 1
Scale Factor 2 N/A N/A 1 8 2
Monthly Averages 3 N/A N/A 72 8 3
Spares 4 N/A N/A 351 8 75
5.0-deg_Zonal_Data
32-bit_Data (87 records)
Data Description 1 N/A N/A 1 640 1
Scale Factor 2 N/A N/A 1 32 2
Monthly Averages 3 N/A N/A 36 32 3
Spares 4 N/A N/A 276 8 39

CERES ATBD Subsystem 3.0 - ERBE-like Averaging Release 2.2
June 2, 1997 B - 33
Table B-4. ERBE-like Monthly Gridded Averages (ES-4G) (8 of 8)
Description Parameter Units Range Elements/ Bits/ ElemNumber Record Elem Num
16-bit_Data (342 records)
Data Description 1 N/A N/A 1 640 1
Scale Factor 2 N/A N/A 1 16 2
Monthly Averages 3 N/A N/A 36 16 3
Spares 4 N/A N/A 350 8 39
8-bit_Data (221 records)
Data Description 1 N/A N/A 1 640 1
Scale Factor 2 N/A N/A 1 8 2
Monthly Averages 3 N/A N/A 36 8 3
Spares 4 N/A N/A 387 8 39
10.0-deg_Zonal_Data
32-bit_Data (87 records)
Data Description 1 N/A N/A 1 640 1
Scale Factor 2 N/A N/A 1 32 2
Monthly Averages 3 N/A N/A 18 32 3
Spares 4 N/A N/A 348 8 21
16-bit_Data (342 records)
Data Description 1 N/A N/A 1 640 1
Scale Factor 2 N/A N/A 1 16 2
Monthly Averages 3 N/A N/A 18 16 3
Spares 4 N/A N/A 386 8 21
8-bit_Data (221 records)
Data Description 1 N/A N/A 1 640 1
Scale Factor 2 N/A N/A 1 8 2
Monthly Averages 3 N/A N/A 18 8 3
Spares 4 N/A N/A 405 8 21
Global_Data
32-bit_Data (87 records)
Data Description 1 N/A N/A 1 640 1
Scale Factor 2 N/A N/A 1 32 2
Monthly Averages 3 N/A N/A 3 32 3
Spares 4 N/A N/A 408 8 6
16-bit_Data (342 records)
Data Description 1 N/A N/A 1 640 1
Scale Factor 2 N/A N/A 1 16 2
Monthly Averages 3 N/A N/A 3 16 3
Spares 4 N/A N/A 416 8 6
8-bit_Data (221 records)
Data Description 1 N/A N/A 1 640 1
Scale Factor 2 N/A N/A 1 8 2
Monthly Averages 3 N/A N/A 3 8 3
Spares 4 N/A N/A 420 8 6
Total Meta Bits/File: TBD
Maximum Data Bits/Record: 86016
Total Records/File 4: 3900
Total Data Bits/File 4: 47124480
Total Bits/File 4: 47124480
Total Bits on ES-4G 152788992

CERES ATBD Subsystem 3.0 - ERBE-like Averaging Release 2.2
June 2, 1997 C - 34
Appendix C
Nomenclature
Acronyms
ADEOS Advanced Earth Observing System
ADM Angular Distribution Model
AIRS Atmospheric Infrared Sounder (EOS-AM)
AMSU Advanced Microwave Sounding Unit (EOS-PM)
APD Aerosol Profile Data
APID Application Identifier
ARESE ARM Enhanced Shortwave Experiment
ARM Atmospheric Radiation Measurement
ASOS Automated Surface Observing Sites
ASTER Advanced Spaceborne Thermal Emission and Reflection Radiometer
ASTEX Atlantic Stratocumulus Transition Experiment
ASTR Atmospheric Structures
ATBD Algorithm Theoretical Basis Document
AVG Monthly Regional, Average Radiative Fluxes and Clouds (CERES Archival DataProduct)
AVHRR Advanced Very High Resolution Radiometer
BDS Bidirectional Scan (CERES Archival Data Product)
BRIE Best Regional Integral Estimate
BSRN Baseline Surface Radiation Network
BTD Brightness Temperature Difference(s)
CCD Charge Coupled Device
CCSDS Consultative Committee for Space Data Systems
CEPEX Central Equatorial Pacific Experiment
CERES Clouds and the Earth’s Radiant Energy System
CID Cloud Imager Data
CLAVR Clouds from AVHRR
CLS Constrained Least Squares
COPRS Cloud Optical Property Retrieval System
CPR Cloud Profiling Radar
CRH Clear Reflectance, Temperature History (CERES Archival Data Product)
CRS Single Satellite CERES Footprint, Radiative Fluxes and Clouds (CERES ArchivalData Product)
DAAC Distributed Active Archive Center
DAC Digital-Analog Converter
DAO Data Assimilation Office

CERES ATBD Subsystem 3.0 - ERBE-like Averaging Release 2.2
June 2, 1997 C - 35
DB Database
DFD Data Flow Diagram
DLF Downward Longwave Flux
DMSP Defense Meteorological Satellite Program
EADM ERBE-like Albedo Directional Model (CERES Input Data Product)
ECA Earth Central Angle
ECLIPS Experimental Cloud Lidar Pilot Study
ECMWF European Centre for Medium-Range Weather Forecasts
EDDB ERBE-like Daily Data Base (CERES Internal Data Product)
EID6 ERBE-like Internal Data Product 6 (CERES Internal Data Product)
EID9 ERBE-like Internal Data Product 9 (CERES Internal Data Product)
EOS Earth Observing System
EOSDIS Earth Observing System Data Information System
EOS-AM EOS Morning Crossing Mission
EOS-PM EOS Afternoon Crossing Mission
ENSO El Niño/Southern Oscillation
ENVISAT Environmental Satellite
EPHANC Ephemeris and Ancillary (CERES Input Data Product)
ERB Earth Radiation Budget
ERBE Earth Radiation Budget Experiment
ERBS Earth Radiation Budget Satellite
ESA European Space Agency
ES4 ERBE-like S4 Data Product (CERES Archival Data Product)
ES4G ERBE-like S4G Data Product (CERES Archival Data Product)
ES8 ERBE-like S8 Data Product (CERES Archival Data Product)
ES9 ERBE-like S9 Data Product (CERES Archival Data Product)
FLOP Floating Point Operation
FIRE First ISCCP Regional Experiment
FIRE II IFO First ISCCP Regional Experiment II Intensive Field Observations
FOV Field of View
FSW Hourly Gridded Single Satellite Fluxes and Clouds (CERES Archival Data Product)
FTM Functional Test Model
GAC Global Area Coverage (AVHRR data mode)
GAP Gridded Atmospheric Product (CERES Input Data Product)
GCIP GEWEX Continental-Phase International Project
GCM General Circulation Model
GEBA Global Energy Balance Archive
GEO ISSCP Radiances (CERES Input Data Product)
GEWEX Global Energy and Water Cycle Experiment

CERES ATBD Subsystem 3.0 - ERBE-like Averaging Release 2.2
June 2, 1997 C - 36
GLAS Geoscience Laser Altimetry System
GMS Geostationary Meteorological Satellite
GOES Geostationary Operational Environmental Satellite
HBTM Hybrid Bispectral Threshold Method
HIRS High-Resolution Infrared Radiation Sounder
HIS High-Resolution Interferometer Sounder
ICM Internal Calibration Module
ICRCCM Intercomparison of Radiation Codes in Climate Models
ID Identification
IEEE Institute of Electrical and Electronics Engineers
IES Instrument Earth Scans (CERES Internal Data Product)
IFO Intensive Field Observation
INSAT Indian Satellite
IOP Intensive Observing Period
IR Infrared
IRIS Infrared Interferometer Spectrometer
ISCCP International Satellite Cloud Climatology Project
ISS Integrated Sounding System
IWP Ice Water Path
LAC Local Area Coverage (AVHRR data mode)
LaRC Langley Research Center
LBC Laser Beam Ceilometer
LBTM Layer Bispectral Threshold Method
Lidar Light Detection and Ranging
LITE Lidar In-Space Technology Experiment
Lowtran 7 Low-Resolution Transmittance (Radiative Transfer Code)
LW Longwave
LWP Liquid Water Path
MAM Mirror Attenuator Mosaic
MC Mostly Cloudy
MCR Microwave Cloud Radiometer
METEOSAT Meteorological Operational Satellite (European)
METSAT Meteorological Satellite
MFLOP Million FLOP
MIMR Multifrequency Imaging Microwave Radiometer
MISR Multiangle Imaging Spectroradiometer
MLE Maximum Likelihood Estimate
MOA Meteorology Ozone and Aerosol
MODIS Moderate-Resolution Imaging Spectroradiometer

CERES ATBD Subsystem 3.0 - ERBE-like Averaging Release 2.2
June 2, 1997 C - 37
MSMR Multispectral, multiresolution
MTSA Monthly Time and Space Averaging
MWH Microwave Humidity
MWP Microwave Water Path
NASA National Aeronautics and Space Administration
NCAR National Center for Atmospheric Research
NCEP National Centers for Environmental Prediction
NESDIS National Environmental Satellite, Data, and Information Service
NIR Near Infrared
NMC National Meteorological Center
NOAA National Oceanic and Atmospheric Administration
NWP Numerical Weather Prediction
OLR Outgoing Longwave Radiation
OPD Ozone Profile Data (CERES Input Data Product)
OV Overcast
PC Partly Cloudy
POLDER Polarization of Directionality of Earth’s Reflectances
PRT Platinum Resistance Thermometer
PSF Point Spread Function
PW Precipitable Water
RAPS Rotating Azimuth Plane Scan
RPM Radiance Pairs Method
RTM Radiometer Test Model
SAB Sorting by Angular Bins
SAGE Stratospheric Aerosol and Gas Experiment
SARB Surface and Atmospheric Radiation Budget Working Group
SDCD Solar Distance Correction and Declination
SFC Hourly Gridded Single Satellite TOA and Surface Fluxes (CERES ArchivalData Product)
SHEBA Surface Heat Budget in the Arctic
SPECTRE Spectral Radiance Experiment
SRB Surface Radiation Budget
SRBAVG Surface Radiation Budget Average (CERES Archival Data Product)
SSF Single Satellite CERES Footprint TOA and Surface Fluxes, Clouds
SSMI Special Sensor Microwave Imager
SST Sea Surface Temperature
SURFMAP Surface Properties and Maps (CERES Input Product)
SW Shortwave
SWICS Shortwave Internal Calibration Source

CERES ATBD Subsystem 3.0 - ERBE-like Averaging Release 2.2
June 2, 1997 C - 38
SYN Synoptic Radiative Fluxes and Clouds (CERES Archival Data Product)
SZA Solar Zenith Angle
THIR Temperature/Humidity Infrared Radiometer (Nimbus)
TIROS Television Infrared Observation Satellite
TISA Time Interpolation and Spatial Averaging Working Group
TMI TRMM Microwave Imager
TOA Top of the Atmosphere
TOGA Tropical Ocean Global Atmosphere
TOMS Total Ozone Mapping Spectrometer
TOVS TIROS Operational Vertical Sounder
TRMM Tropical Rainfall Measuring Mission
TSA Time-Space Averaging
UAV Unmanned Aerospace Vehicle
UT Universal Time
UTC Universal Time Code
VAS VISSR Atmospheric Sounder (GOES)
VIRS Visible Infrared Scanner
VISSR Visible and Infrared Spin Scan Radiometer
WCRP World Climate Research Program
WG Working Group
Win Window
WN Window
WMO World Meteorological Organization
ZAVG Monthly Zonal and Global Average Radiative Fluxes and Clouds (CERES ArchivalData Product)
Symbols
A atmospheric absorptance
Bλ(T) Planck function
C cloud fractional area coverage
CF2Cl2 dichlorofluorocarbon
CFCl3 trichlorofluorocarbon
CH4 methane
CO2 carbon dioxide
D total number of days in the month
De cloud particle equivalent diameter (for ice clouds)
Eo solar constant or solar irradiance
F flux
f fraction

CERES ATBD Subsystem 3.0 - ERBE-like Averaging Release 2.2
June 2, 1997 C - 39
Ga atmospheric greenhouse effect
g cloud asymmetry parameter
H2O water vapor
I radiance
i scene type
mi imaginary refractive index
angular momentum vector
N2O nitrous oxide
O3 ozone
P point spread function
p pressure
Qa absorption efficiency
Qe extinction efficiency
Qs scattering efficiency
R anisotropic reflectance factor
rE radius of the Earth
re effective cloud droplet radius (for water clouds)
rh column-averaged relative humidity
So summed solar incident SW flux
integrated solar incident SW flux
T temperature
TB blackbody temperature
t time or transmittance
Wliq liquid water path
w precipitable water
satellite position attox, y, z satellite position vector components
satellite velocity vector components
z altitude
ztop altitude at top of atmosphere
α albedo or cone angle
β cross-scan angle
γ Earth central angle
γat along-track angle
γct cross-track angle
δ along-scan angle
ε emittance
Θ colatitude of satellite
θ viewing zenith angle
N
So′
xo
x y z, ,

CERES ATBD Subsystem 3.0 - ERBE-like Averaging Release 2.2
June 2, 1997 C - 40
θo solar zenith angle
λ wavelength
µ viewing zenith angle cosine
µo solar zenith angle cosine
ν wave number
ρ bidirectional reflectance
τ optical depth
τaer (p) spectral optical depth profiles of aerosols
spectral optical depth profiles of water vapor
spectral optical depth profiles of ozone
Φ longitude of satellite
φ azimuth angle
single-scattering albedo
Subscripts:
c cloud
cb cloud base
ce cloud effective
cld cloud
cs clear sky
ct cloud top
ice ice water
lc lower cloud
liq liquid water
s surface
uc upper cloud
λ spectral wavelength
Units
AU astronomical unit
cm centimeter
cm-sec−1 centimeter per second
count count
day day, Julian date
deg degree
deg-sec−1 degree per second
DU Dobson unit
erg-sec−1 erg per second
fraction fraction (range of 0–1)
g gram
τH2Oλ p( )
τO3p( )
ωo

CERES ATBD Subsystem 3.0 - ERBE-like Averaging Release 2.2
June 2, 1997 C - 41
g-cm−2 gram per square centimeter
g-g−1 gram per gram
g-m−2 gram per square meter
h hour
hPa hectopascal
K Kelvin
kg kilogram
kg-m−2 kilogram per square meter
km kilometer
km-sec−1 kilometer per second
m meter
mm millimeter
µm micrometer, micron
N/A not applicable, none, unitless, dimensionless
ohm-cm−1 ohm per centimeter
percent percent (range of 0–100)
rad radian
rad-sec−1 radian per second
sec second
sr−1 per steradian
W watt
W-m−2 watt per square meter
W-m−2sr−1 watt per square meter per steradian
W-m−2sr−1µm−1 watt per square meter per steradian per micrometer