
CloudHarmony - CenturyLink Cloud · Compute instances from Amazon Elastic Compute Cloud (EC2),...
90
© 2014 CloudHarmony Inc. 1 CenturyLink Hyperscale Testing Final Engagement Report 15 April 2014 Version 1.11 © 2014 CloudHarmony Inc. trans parency for the cloud Cloud Harmony Harmony
Transcript of CloudHarmony - CenturyLink Cloud · Compute instances from Amazon Elastic Compute Cloud (EC2),...
© 2014 CloudHarmony Inc.
!!!!!!!!!!!!!!!!
1
CenturyLink Hyperscale Testing Final Engagement Report
15 April 2014
Version 1.11
!© 2014 CloudHarmony Inc.
trans parency for the cloud
CloudHarmonyHarmony
© 2014 CloudHarmony Inc.
Introduction 4 About this Report 5
Test Methodology 6 Compute Instance Selection 7
CenturyLink Cloud 7
Amazon EC2 7
Rackspace Cloud 8
Compute Instance Comparison Matrix 8
Storage Volumes 9
Local vs. External Storage Volumes Pros and Cons 9
Benchmark Selections 10
Summary Metrics 19
Performance Comparisons 20 CPU Performance 21
CPU Model 22
SPECint Rate/Base 2006 (estimate) 23
SPECfp Rate/Base 2006 (estimate) 24
CPU Performance Summary Metric 25
CPU Performance Comments 26
Disk Performance 27
Disk Read Performance 28
Disk Write Performance 43
Disk Read/Write Performance 59
Disk Performance Summary Metrics 75
Disk Performance Comments 79
Memory Performance 80
Memory Performance - 2 Core Instance Type 81
Memory Performance - 4 Core Instance Type 82
Memory Performance - 8 Core Instance Type 83
Memory Performance - 16 Core Instance Type 84
Memory Performance Summary Metric 85
Memory Performance Comments 86
Server Performance Summary Metric 87
2
© 2014 CloudHarmony Inc.
Server Performance Comments 88
Conclusion 89
3

© 2014 CloudHarmony Inc.
!
!
!
!
!
!
Introduction
4
© 2014 CloudHarmony Inc.
About this Report This report summarizes testing of CenturyLink Cloud Hyperscale compute instances in April
2014. Compute instances from Amazon Elastic Compute Cloud (EC2), Rackspace Cloud, as
well as non-Hyperscale CenturyLink Cloud instances were included in testing for comparison
purposes. CenturyLink engaged CloudHarmony to conduct this testing and provide
independent performance analysis and comparisons of these services. This report
summarizes the results of this testing.
5
© 2014 CloudHarmony Inc.
!!!!!!!!!!!!!!!!Test Methodology
6
© 2014 CloudHarmony Inc.
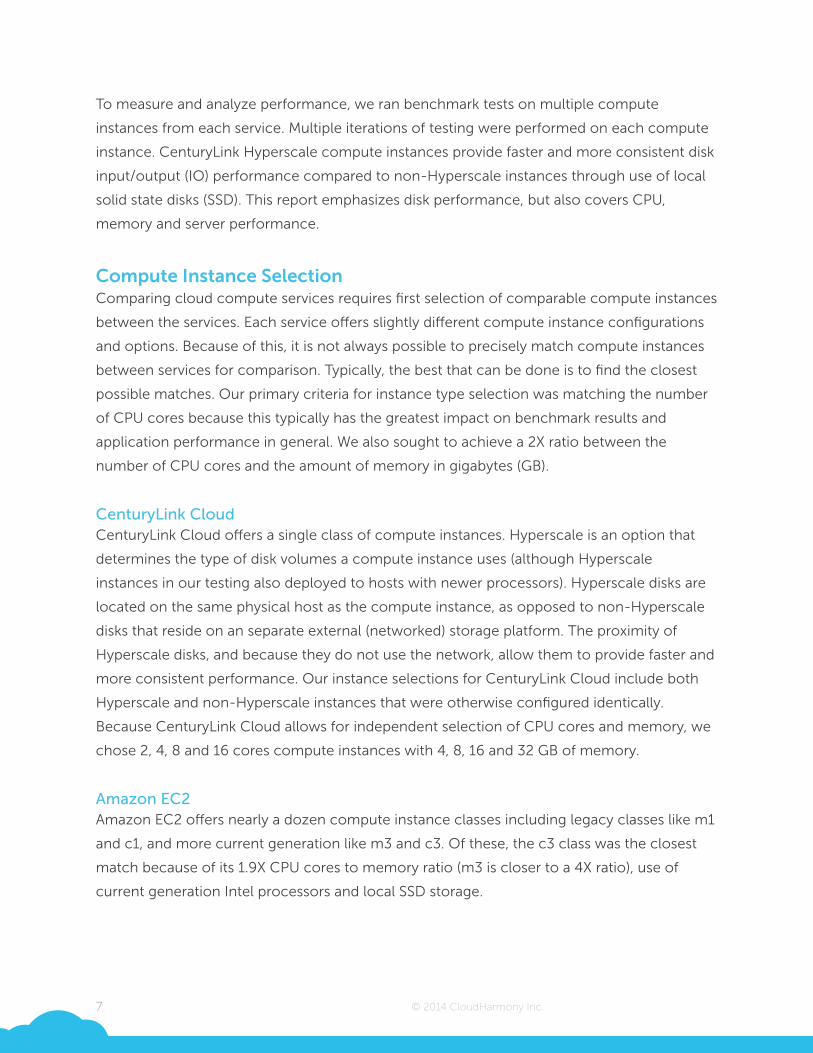
To measure and analyze performance, we ran benchmark tests on multiple compute
instances from each service. Multiple iterations of testing were performed on each compute
instance. CenturyLink Hyperscale compute instances provide faster and more consistent disk
input/output (IO) performance compared to non-Hyperscale instances through use of local
solid state disks (SSD). This report emphasizes disk performance, but also covers CPU,
memory and server performance.
!Compute Instance Selection Comparing cloud compute services requires first selection of comparable compute instances
between the services. Each service offers slightly different compute instance configurations
and options. Because of this, it is not always possible to precisely match compute instances
between services for comparison. Typically, the best that can be done is to find the closest
possible matches. Our primary criteria for instance type selection was matching the number
of CPU cores because this typically has the greatest impact on benchmark results and
application performance in general. We also sought to achieve a 2X ratio between the
number of CPU cores and the amount of memory in gigabytes (GB).
!CenturyLink Cloud CenturyLink Cloud offers a single class of compute instances. Hyperscale is an option that
determines the type of disk volumes a compute instance uses (although Hyperscale
instances in our testing also deployed to hosts with newer processors). Hyperscale disks are
located on the same physical host as the compute instance, as opposed to non-Hyperscale
disks that reside on an separate external (networked) storage platform. The proximity of
Hyperscale disks, and because they do not use the network, allow them to provide faster and
more consistent performance. Our instance selections for CenturyLink Cloud include both
Hyperscale and non-Hyperscale instances that were otherwise configured identically.
Because CenturyLink Cloud allows for independent selection of CPU cores and memory, we
chose 2, 4, 8 and 16 cores compute instances with 4, 8, 16 and 32 GB of memory.
!Amazon EC2 Amazon EC2 offers nearly a dozen compute instance classes including legacy classes like m1
and c1, and more current generation like m3 and c3. Of these, the c3 class was the closest
match because of its 1.9X CPU cores to memory ratio (m3 is closer to a 4X ratio), use of
current generation Intel processors and local SSD storage.
!
7
© 2014 CloudHarmony Inc.
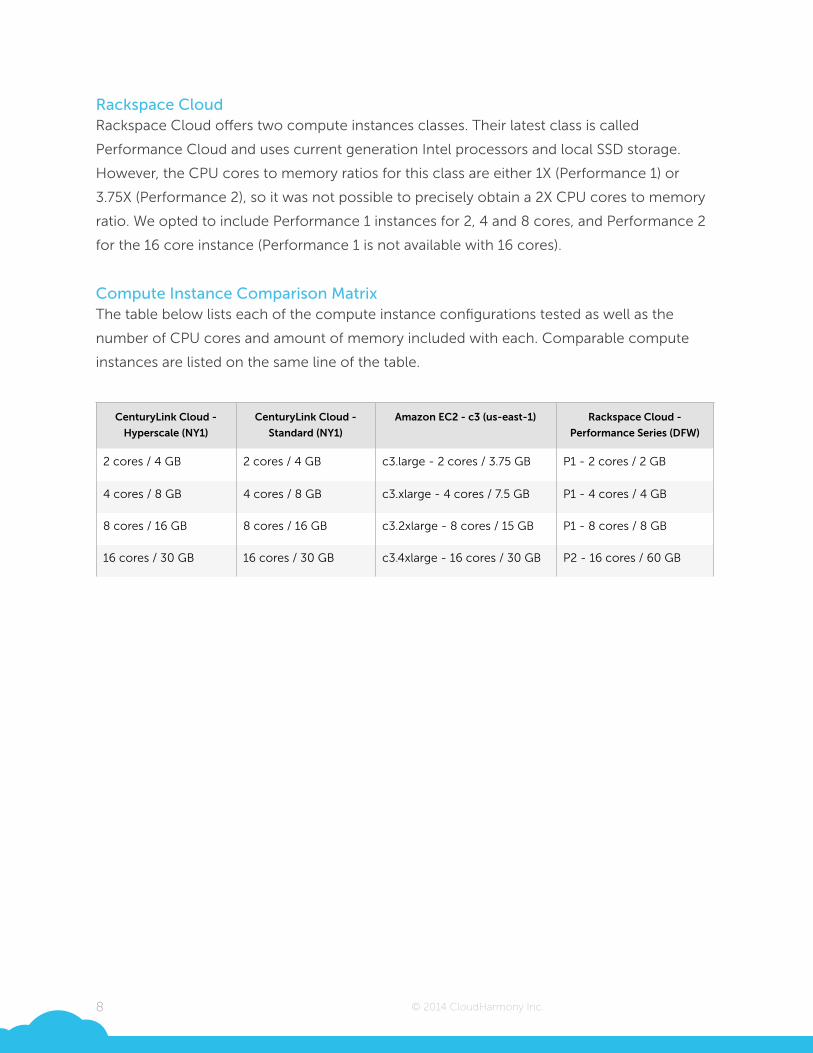
Rackspace Cloud Rackspace Cloud offers two compute instances classes. Their latest class is called
Performance Cloud and uses current generation Intel processors and local SSD storage.
However, the CPU cores to memory ratios for this class are either 1X (Performance 1) or
3.75X (Performance 2), so it was not possible to precisely obtain a 2X CPU cores to memory
ratio. We opted to include Performance 1 instances for 2, 4 and 8 cores, and Performance 2
for the 16 core instance (Performance 1 is not available with 16 cores).
!Compute Instance Comparison Matrix The table below lists each of the compute instance configurations tested as well as the
number of CPU cores and amount of memory included with each. Comparable compute
instances are listed on the same line of the table.
!
!!
CenturyLink Cloud -
Hyperscale (NY1)
CenturyLink Cloud -
Standard (NY1)
Amazon EC2 - c3 (us-east-1) Rackspace Cloud -
Performance Series (DFW)
2 cores / 4 GB 2 cores / 4 GB c3.large - 2 cores / 3.75 GB P1 - 2 cores / 2 GB
4 cores / 8 GB 4 cores / 8 GB c3.xlarge - 4 cores / 7.5 GB P1 - 4 cores / 4 GB
8 cores / 16 GB 8 cores / 16 GB c3.2xlarge - 8 cores / 15 GB P1 - 8 cores / 8 GB
16 cores / 30 GB 16 cores / 30 GB c3.4xlarge - 16 cores / 30 GB P2 - 16 cores / 60 GB
8
© 2014 CloudHarmony Inc.
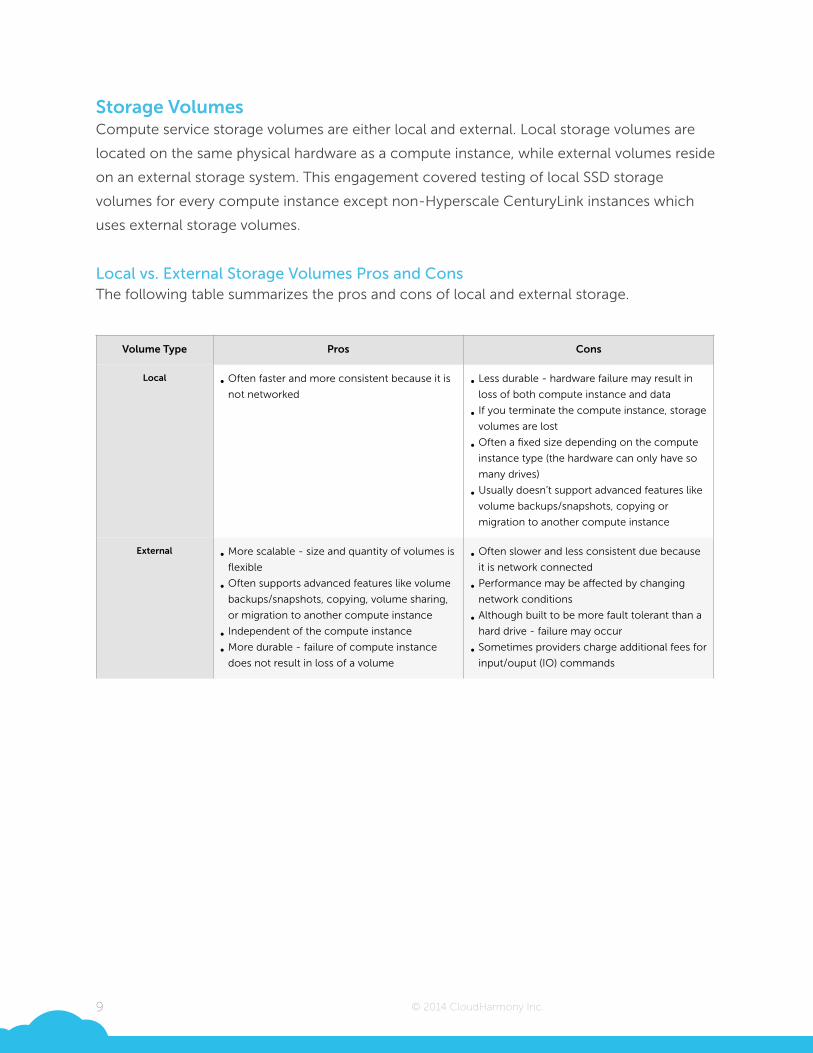
Storage Volumes Compute service storage volumes are either local and external. Local storage volumes are
located on the same physical hardware as a compute instance, while external volumes reside
on an external storage system. This engagement covered testing of local SSD storage
volumes for every compute instance except non-Hyperscale CenturyLink instances which
uses external storage volumes.
!Local vs. External Storage Volumes Pros and Cons The following table summarizes the pros and cons of local and external storage.
!
!
Volume Type Pros Cons
Local • Often faster and more consistent because it is
not networked• Less durable - hardware failure may result in
loss of both compute instance and data
• If you terminate the compute instance, storage
volumes are lost
• Often a fixed size depending on the compute
instance type (the hardware can only have so
many drives)
• Usually doesn’t support advanced features like
volume backups/snapshots, copying or
migration to another compute instance
External • More scalable - size and quantity of volumes is
flexible
• Often supports advanced features like volume
backups/snapshots, copying, volume sharing,
or migration to another compute instance
• Independent of the compute instance
• More durable - failure of compute instance
does not result in loss of a volume
• Often slower and less consistent due because
it is network connected
• Performance may be affected by changing
network conditions
• Although built to be more fault tolerant than a
hard drive - failure may occur
• Sometimes providers charge additional fees for
input/ouput (IO) commands
9
© 2014 CloudHarmony Inc.
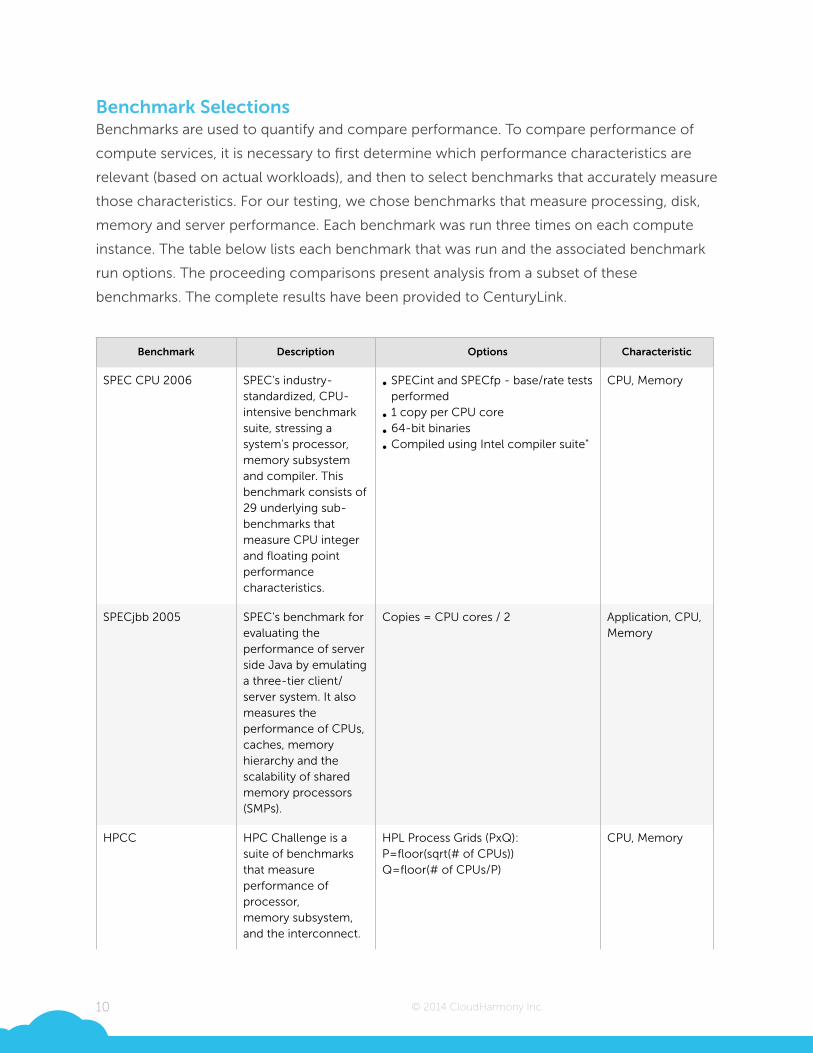
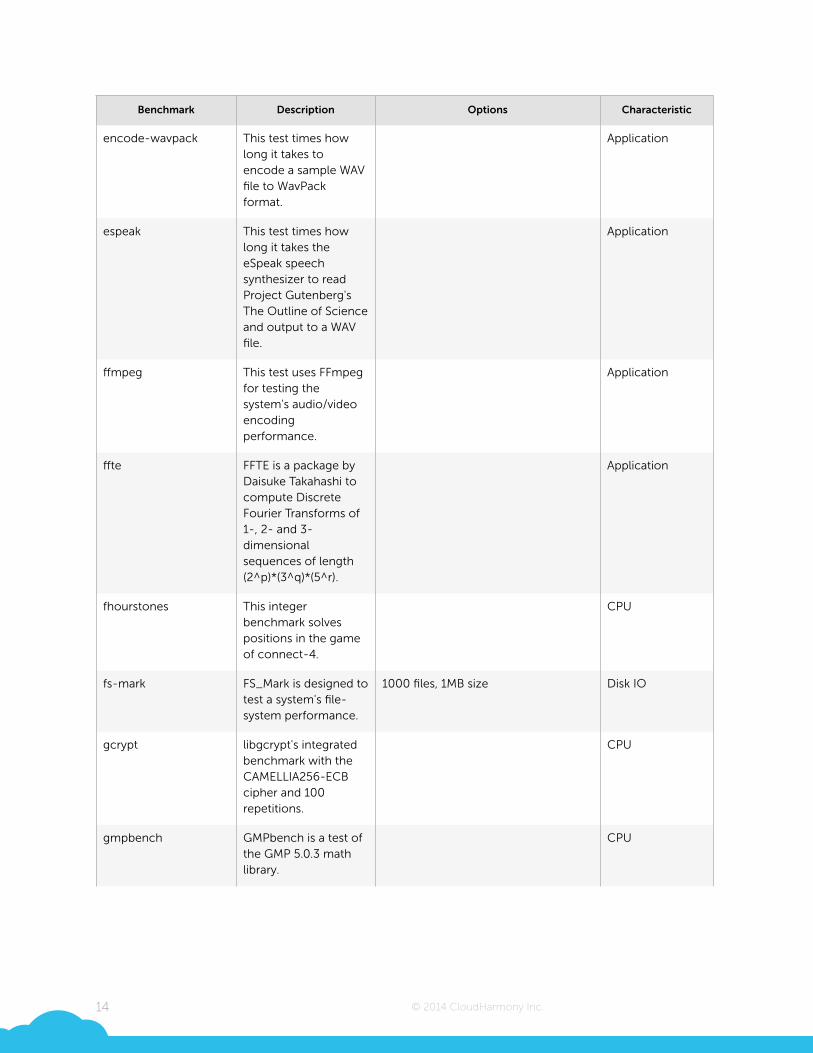
Benchmark Selections Benchmarks are used to quantify and compare performance. To compare performance of
compute services, it is necessary to first determine which performance characteristics are
relevant (based on actual workloads), and then to select benchmarks that accurately measure
those characteristics. For our testing, we chose benchmarks that measure processing, disk,
memory and server performance. Each benchmark was run three times on each compute
instance. The table below lists each benchmark that was run and the associated benchmark
run options. The proceeding comparisons present analysis from a subset of these
benchmarks. The complete results have been provided to CenturyLink.
!Benchmark Description Options Characteristic
SPEC CPU 2006 SPEC's industry-standardized, CPU-intensive benchmark suite, stressing a system's processor, memory subsystem and compiler. This benchmark consists of 29 underlying sub-benchmarks that measure CPU integer and floating point performance characteristics.
• SPECint and SPECfp - base/rate tests performed
• 1 copy per CPU core
• 64-bit binaries
• Compiled using Intel compiler suite"
CPU, Memory
SPECjbb 2005 SPEC's benchmark for evaluating the performance of server side Java by emulating a three-tier client/server system. It also measures the performance of CPUs, caches, memory hierarchy and the scalability of shared memory processors (SMPs).
Copies = CPU cores / 2 Application, CPU, Memory
HPCC HPC Challenge is a suite of benchmarks that measure performance of processor, memory subsystem, and the interconnect.
HPL Process Grids (PxQ): P=floor(sqrt(# of CPUs)) Q=floor(# of CPUs/P)
CPU, Memory
10
© 2014 CloudHarmony Inc.
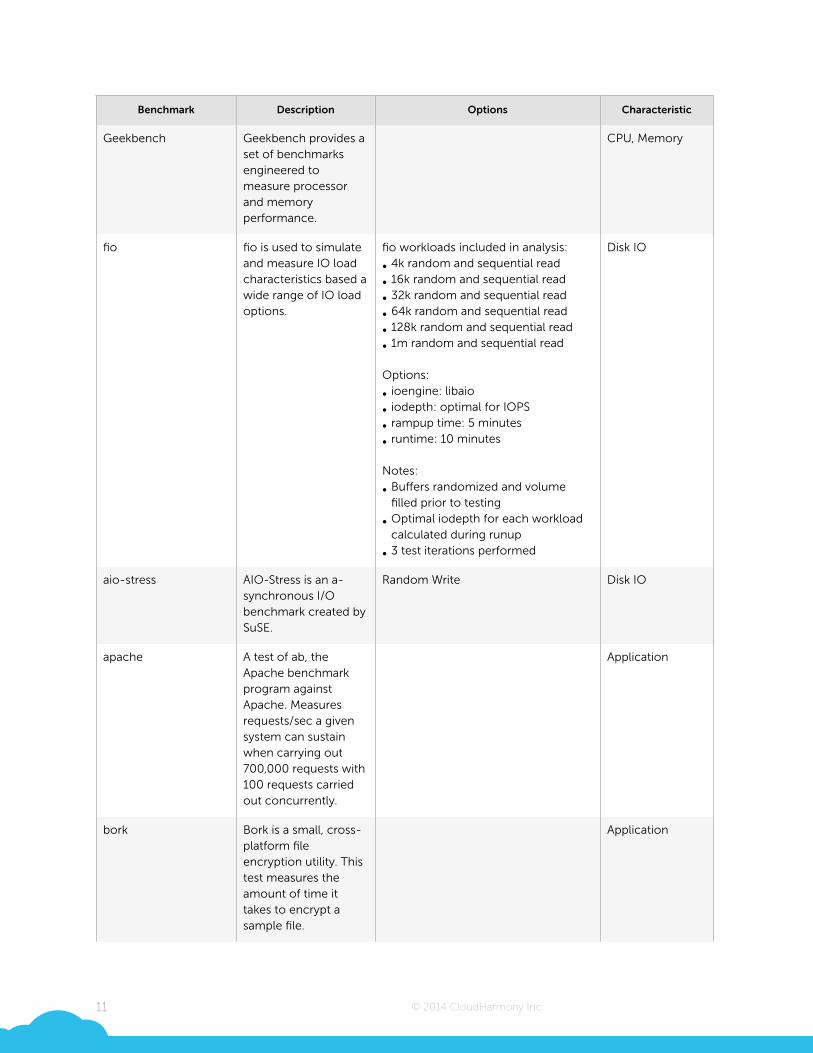
Geekbench Geekbench provides a set of benchmarks engineered to measure processor and memory performance.
CPU, Memory
fio fio is used to simulate and measure IO load characteristics based a wide range of IO load options.
fio workloads included in analysis:
• 4k random and sequential read
• 16k random and sequential read
• 32k random and sequential read
• 64k random and sequential read
• 128k random and sequential read
• 1m random and sequential read !Options:
• ioengine: libaio
• iodepth: optimal for IOPS
• rampup time: 5 minutes
• runtime: 10 minutes !Notes:
• Buffers randomized and volume filled prior to testing
• Optimal iodepth for each workload calculated during runup
• 3 test iterations performed
Disk IO
aio-stress AIO-Stress is an a-synchronous I/O benchmark created by SuSE.
Random Write Disk IO
apache A test of ab, the Apache benchmark program against Apache. Measures requests/sec a given system can sustain when carrying out 700,000 requests with 100 requests carried out concurrently.
Application
bork Bork is a small, cross-platform file encryption utility. This test measures the amount of time it takes to encrypt a sample file.
Application
Benchmark Description Options Characteristic
11
© 2014 CloudHarmony Inc.
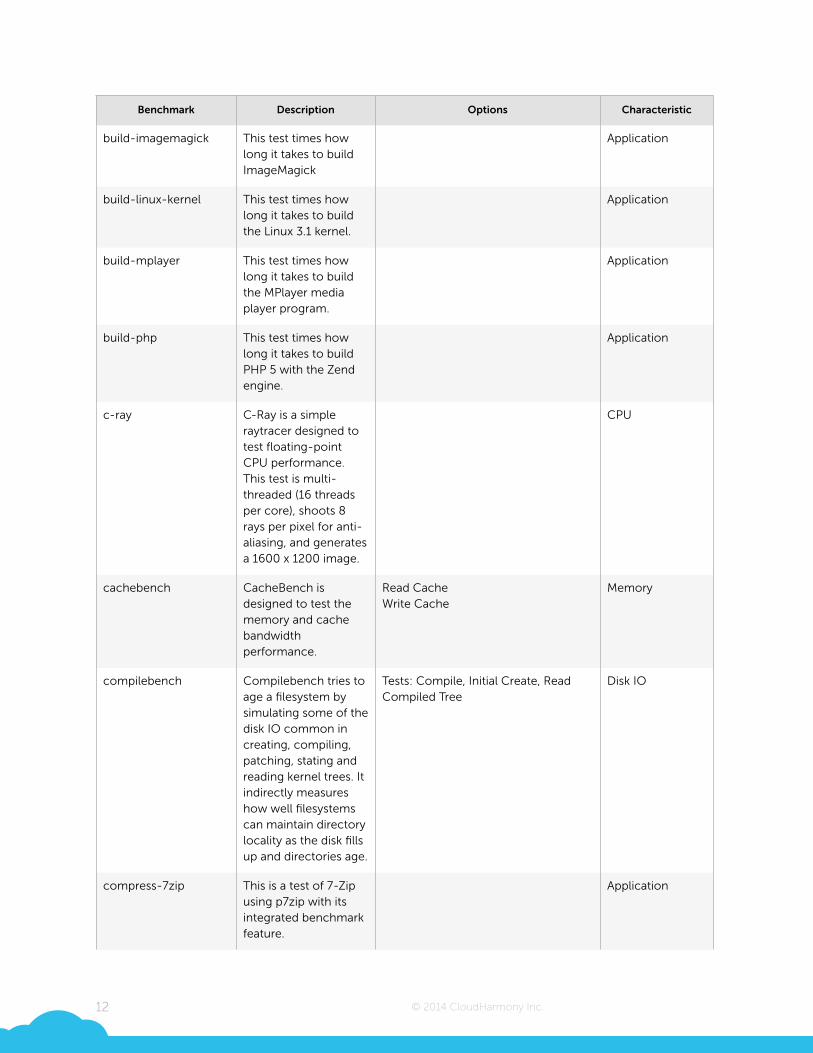
build-imagemagick This test times how long it takes to build ImageMagick
Application
build-linux-kernel This test times how long it takes to build the Linux 3.1 kernel.
Application
build-mplayer This test times how long it takes to build the MPlayer media player program.
Application
build-php This test times how long it takes to build PHP 5 with the Zend engine.
Application
c-ray C-Ray is a simple raytracer designed to test floating-point CPU performance. This test is multi-threaded (16 threads per core), shoots 8 rays per pixel for anti-aliasing, and generates a 1600 x 1200 image.
CPU
cachebench CacheBench is designed to test the memory and cache bandwidth performance.
Read Cache Write Cache
Memory
compilebench Compilebench tries to age a filesystem by simulating some of the disk IO common in creating, compiling, patching, stating and reading kernel trees. It indirectly measures how well filesystems can maintain directory locality as the disk fills up and directories age.
Tests: Compile, Initial Create, Read Compiled Tree
Disk IO
compress-7zip This is a test of 7-Zip using p7zip with its integrated benchmark feature.
Application
Benchmark Description Options Characteristic
12
© 2014 CloudHarmony Inc.
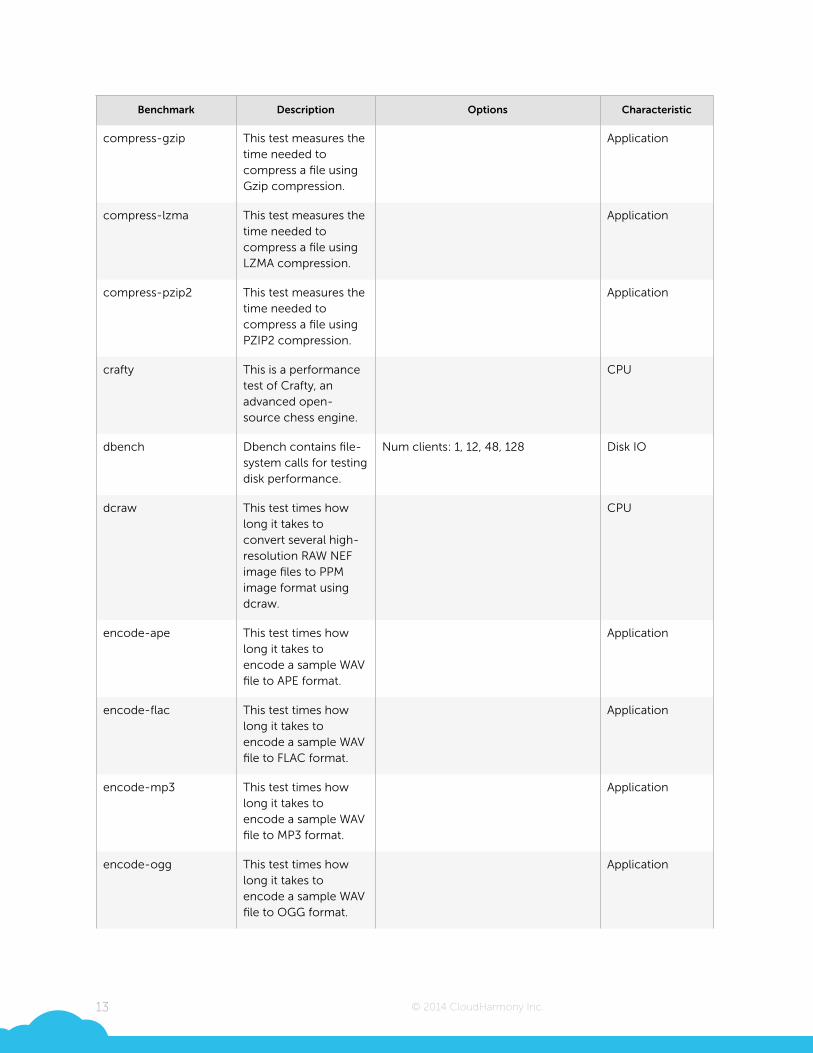
compress-gzip This test measures the time needed to compress a file using Gzip compression.
Application
compress-lzma This test measures the time needed to compress a file using LZMA compression.
Application
compress-pzip2 This test measures the time needed to compress a file using PZIP2 compression.
Application
crafty This is a performance test of Crafty, an advanced open-source chess engine.
CPU
dbench Dbench contains file-system calls for testing disk performance.
Num clients: 1, 12, 48, 128 Disk IO
dcraw This test times how long it takes to convert several high-resolution RAW NEF image files to PPM image format using dcraw.
CPU
encode-ape This test times how long it takes to encode a sample WAV file to APE format.
Application
encode-flac This test times how long it takes to encode a sample WAV file to FLAC format.
Application
encode-mp3 This test times how long it takes to encode a sample WAV file to MP3 format.
Application
encode-ogg This test times how long it takes to encode a sample WAV file to OGG format.
Application
Benchmark Description Options Characteristic
13
© 2014 CloudHarmony Inc.
encode-wavpack This test times how long it takes to encode a sample WAV file to WavPack format.
Application
espeak This test times how long it takes the eSpeak speech synthesizer to read Project Gutenberg's The Outline of Science and output to a WAV file.
Application
ffmpeg This test uses FFmpeg for testing the system's audio/video encoding performance.
Application
ffte FFTE is a package by Daisuke Takahashi to compute Discrete Fourier Transforms of 1-, 2- and 3- dimensional sequences of length (2^p)*(3^q)*(5^r).
Application
fhourstones This integer benchmark solves positions in the game of connect-4.
CPU
fs-mark FS_Mark is designed to test a system's file-system performance.
1000 files, 1MB size Disk IO
gcrypt libgcrypt's integrated benchmark with the CAMELLIA256-ECB cipher and 100 repetitions.
CPU
gmpbench GMPbench is a test of the GMP 5.0.3 math library.
CPU
Benchmark Description Options Characteristic
14
© 2014 CloudHarmony Inc.
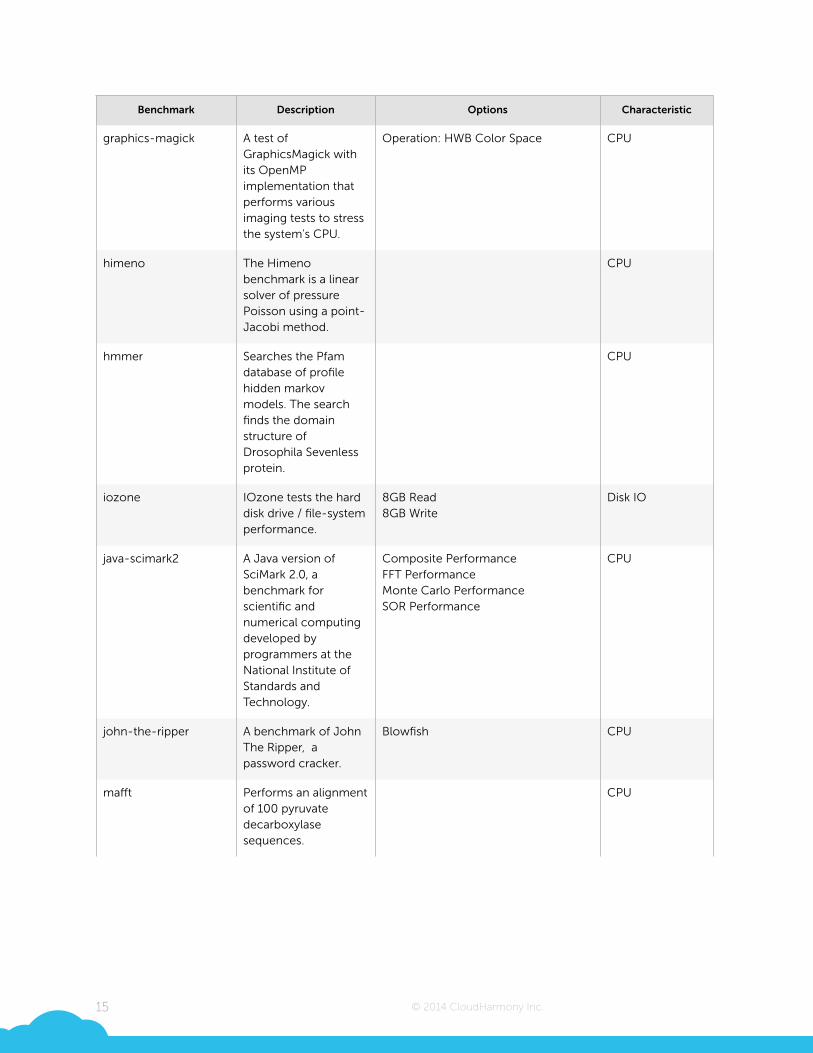
graphics-magick A test of GraphicsMagick with its OpenMP implementation that performs various imaging tests to stress the system's CPU.
Operation: HWB Color Space CPU
himeno The Himeno benchmark is a linear solver of pressure Poisson using a point-Jacobi method.
CPU
hmmer Searches the Pfam database of profile hidden markov models. The search finds the domain structure of Drosophila Sevenless protein.
CPU
iozone IOzone tests the hard disk drive / file-system performance.
8GB Read 8GB Write
Disk IO
java-scimark2 A Java version of SciMark 2.0, a benchmark for scientific and numerical computing developed by programmers at the National Institute of Standards and Technology.
Composite Performance FFT Performance Monte Carlo Performance SOR Performance
CPU
john-the-ripper A benchmark of John The Ripper, a password cracker.
Blowfish CPU
mafft Performs an alignment of 100 pyruvate decarboxylase sequences.
CPU
Benchmark Description Options Characteristic
15
© 2014 CloudHarmony Inc.
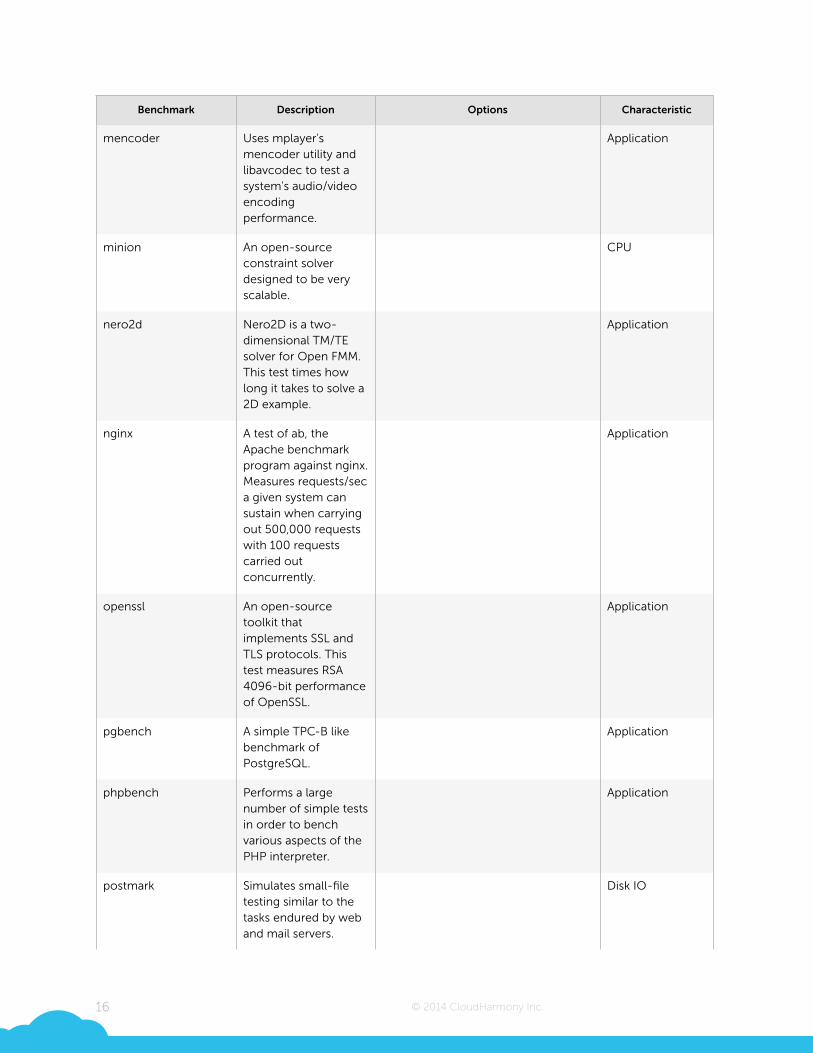
mencoder Uses mplayer's mencoder utility and libavcodec to test a system's audio/video encoding performance.
Application
minion An open-source constraint solver designed to be very scalable.
CPU
nero2d Nero2D is a two-dimensional TM/TE solver for Open FMM. This test times how long it takes to solve a 2D example.
Application
nginx A test of ab, the Apache benchmark program against nginx. Measures requests/sec a given system can sustain when carrying out 500,000 requests with 100 requests carried out concurrently.
Application
openssl An open-source toolkit that implements SSL and TLS protocols. This test measures RSA 4096-bit performance of OpenSSL.
Application
pgbench A simple TPC-B like benchmark of PostgreSQL.
Application
phpbench Performs a large number of simple tests in order to bench various aspects of the PHP interpreter.
Application
postmark Simulates small-file testing similar to the tasks endured by web and mail servers.
Disk IO
Benchmark Description Options Characteristic
16
© 2014 CloudHarmony Inc.
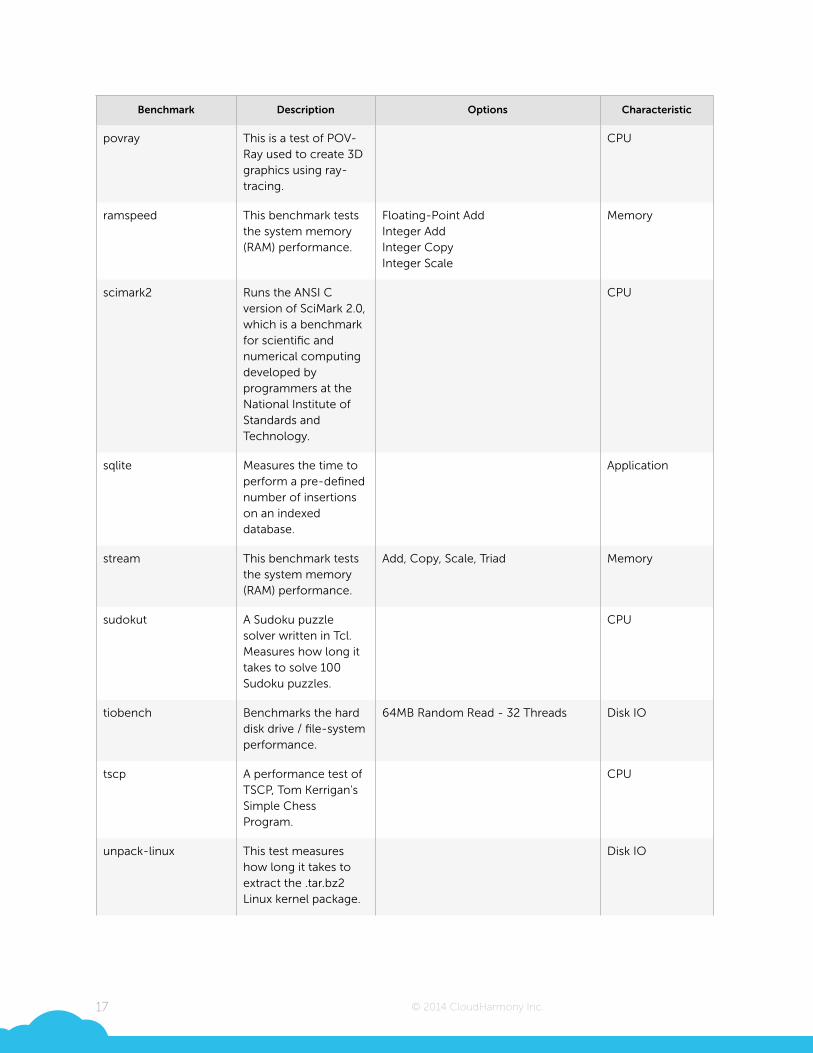
povray This is a test of POV-Ray used to create 3D graphics using ray-tracing.
CPU
ramspeed This benchmark tests the system memory (RAM) performance.
Floating-Point Add Integer Add Integer Copy Integer Scale
Memory
scimark2 Runs the ANSI C version of SciMark 2.0, which is a benchmark for scientific and numerical computing developed by programmers at the National Institute of Standards and Technology.
CPU
sqlite Measures the time to perform a pre-defined number of insertions on an indexed database.
Application
stream This benchmark tests the system memory (RAM) performance.
Add, Copy, Scale, Triad Memory
sudokut A Sudoku puzzle solver written in Tcl. Measures how long it takes to solve 100 Sudoku puzzles.
CPU
tiobench Benchmarks the hard disk drive / file-system performance.
64MB Random Read - 32 Threads Disk IO
tscp A performance test of TSCP, Tom Kerrigan's Simple Chess Program.
CPU
unpack-linux This test measures how long it takes to extract the .tar.bz2 Linux kernel package.
Disk IO
Benchmark Description Options Characteristic
17
© 2014 CloudHarmony Inc.
!
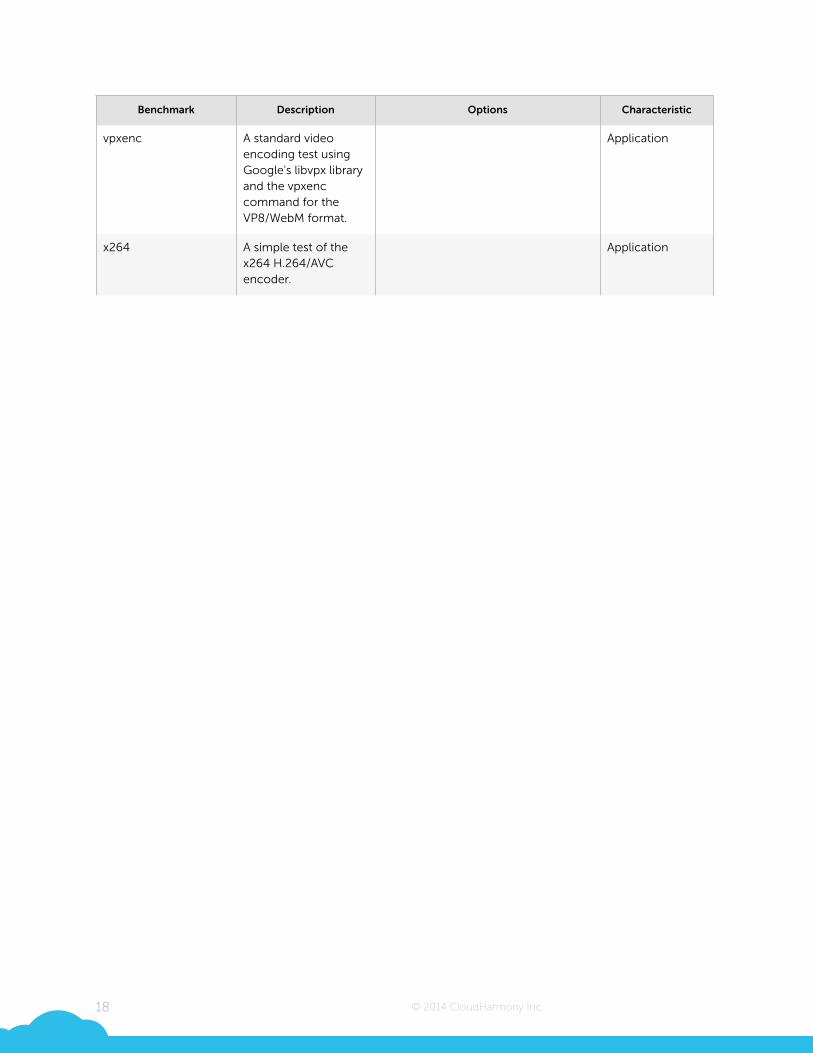
vpxenc A standard video encoding test using Google's libvpx library and the vpxenc command for the VP8/WebM format.
Application
x264 A simple test of the x264 H.264/AVC encoder.
Application
Benchmark Description Options Characteristic
18
© 2014 CloudHarmony Inc.
Summary Metrics To simplify complex performance comparisons we use a method of combining multiple
related benchmark metrics to a single comparable value called a summary metric. Because
each benchmark metric is based on a different numeric scale, before combining we first
convert them a common scale using a reference system as a normalizing constant. By
dividing benchmark metrics of a compute instance by the same metrics of the reference
system we create ratios that represent performance relative to the reference system. We then
combine ratios from multiple benchmarks using a geometric mean to produce more
generalized performance metrics and use those as the basis for comparisons. In order to
simplify the numeric values, we multiple ratios by 100 so that a summary metric equal to 100
signifies performance that is nearly comparable to the reference system, less than 100 worse,
and greater than 100 better
!The reference system we used is a bare metal (non-virtualized) Dell M610 PowerEdge server.
This server had two Intel X5650 2.66 GHz CPUs (12 cores total), 48 GB DDR3-10166 memory,
and a Seagate SAS 2.0 10k RPM drive dedicated for testing.
!The proceeding analysis provides comparisons using both benchmark metrics and summary
metrics.
19
© 2014 CloudHarmony Inc.
!!!!!!!!!!!!!!!!Performance Comparisons
20
© 2014 CloudHarmony Inc.
This section summarizes and compares performance of the compute instances tested during
this engagement. This analysis is presented using a subset of the benchmarks listed in the
preceding section. The analysis is presented in 4 different generalize performance categories:
CPU, Disk, Memory and Server performance. Each of these categories is analyzed and
compared using both actual benchmarks and summary metrics.
!CPU Performance CPU performance is a commonly compared performance characteristic. To some extent, all
workloads are affected by it. Workloads with intensive math, scientific, or geographic
computations are more likely to be affected than those that primarily read and write files to
disk or transfer data over the network.
!Processing performance is usually bound by the number of CPU cores, clock speed, and type
of hardware your compute instance runs on. A new CPU model will usually perform better
than the model it proceeds, even with the same number of cores and clock speed.
!Our comparisons and analysis of CPU performance are based on the SPEC CPU 2006
benchmark suite. SPEC CPU 2006 consists of 29 underlying CPU benchmarks and produces
two metrics, SPECint and SPECfp summarizing both the integer (12) and floating point (17)
CPU performance. A higher value for these metrics represents better performance. Each are
presented separately for every instance type in the analysis below.
!!
21
© 2014 CloudHarmony Inc.
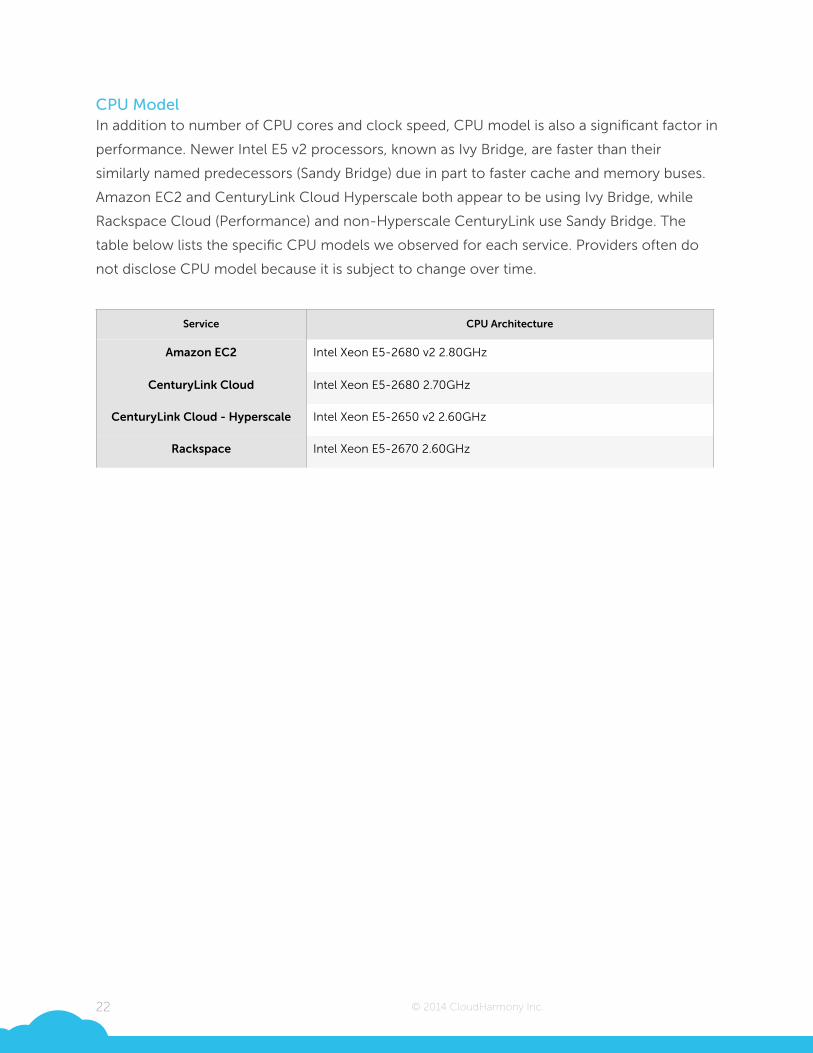
CPU Model In addition to number of CPU cores and clock speed, CPU model is also a significant factor in
performance. Newer Intel E5 v2 processors, known as Ivy Bridge, are faster than their
similarly named predecessors (Sandy Bridge) due in part to faster cache and memory buses.
Amazon EC2 and CenturyLink Cloud Hyperscale both appear to be using Ivy Bridge, while
Rackspace Cloud (Performance) and non-Hyperscale CenturyLink use Sandy Bridge. The
table below lists the specific CPU models we observed for each service. Providers often do
not disclose CPU model because it is subject to change over time.
!
!
Service CPU Architecture
Amazon EC2 Intel Xeon E5-2680 v2 2.80GHz
CenturyLink Cloud Intel Xeon E5-2680 2.70GHz
CenturyLink Cloud - Hyperscale Intel Xeon E5-2650 v2 2.60GHz
Rackspace Intel Xeon E5-2670 2.60GHz
22
© 2014 CloudHarmony Inc.
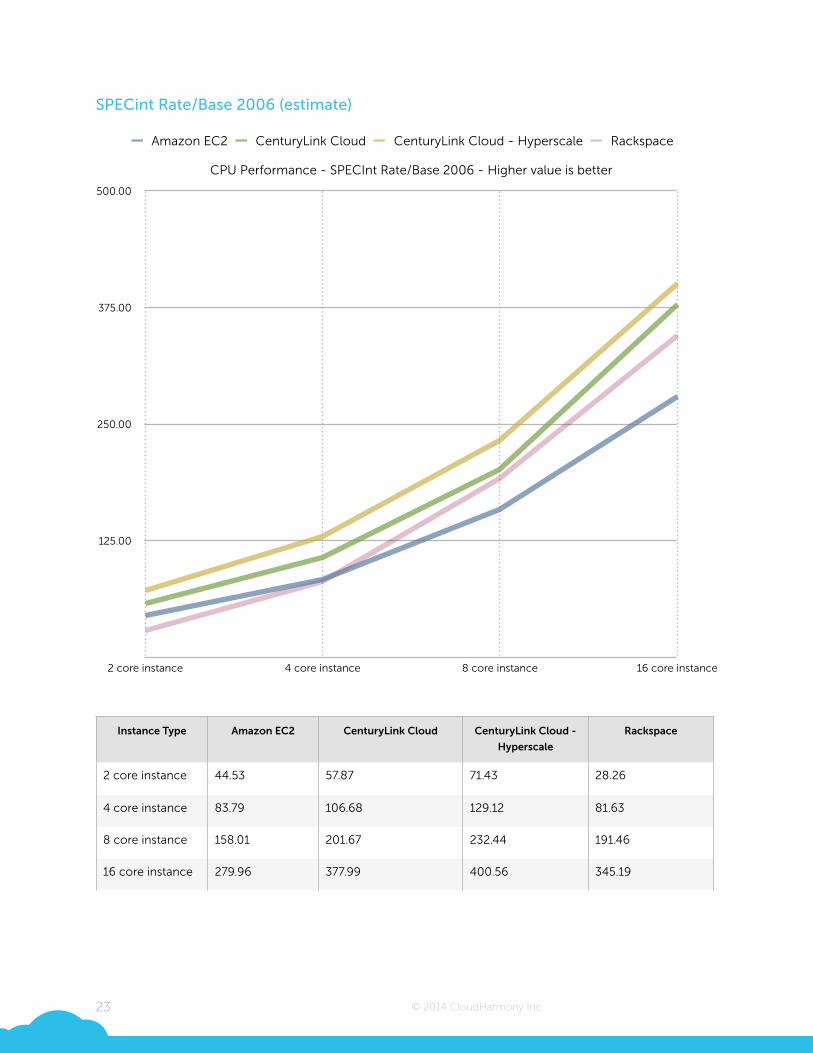
SPECint Rate/Base 2006 (estimate)
!Instance Type Amazon EC2 CenturyLink Cloud CenturyLink Cloud -
Hyperscale
Rackspace
2 core instance 44.53 57.87 71.43 28.26
4 core instance 83.79 106.68 129.12 81.63
8 core instance 158.01 201.67 232.44 191.46
16 core instance 279.96 377.99 400.56 345.19
23
CPU Performance - SPECInt Rate/Base 2006 - Higher value is better
125.00
250.00
375.00
500.00
2 core instance 4 core instance 8 core instance 16 core instance
Amazon EC2 CenturyLink Cloud CenturyLink Cloud - Hyperscale Rackspace
© 2014 CloudHarmony Inc.
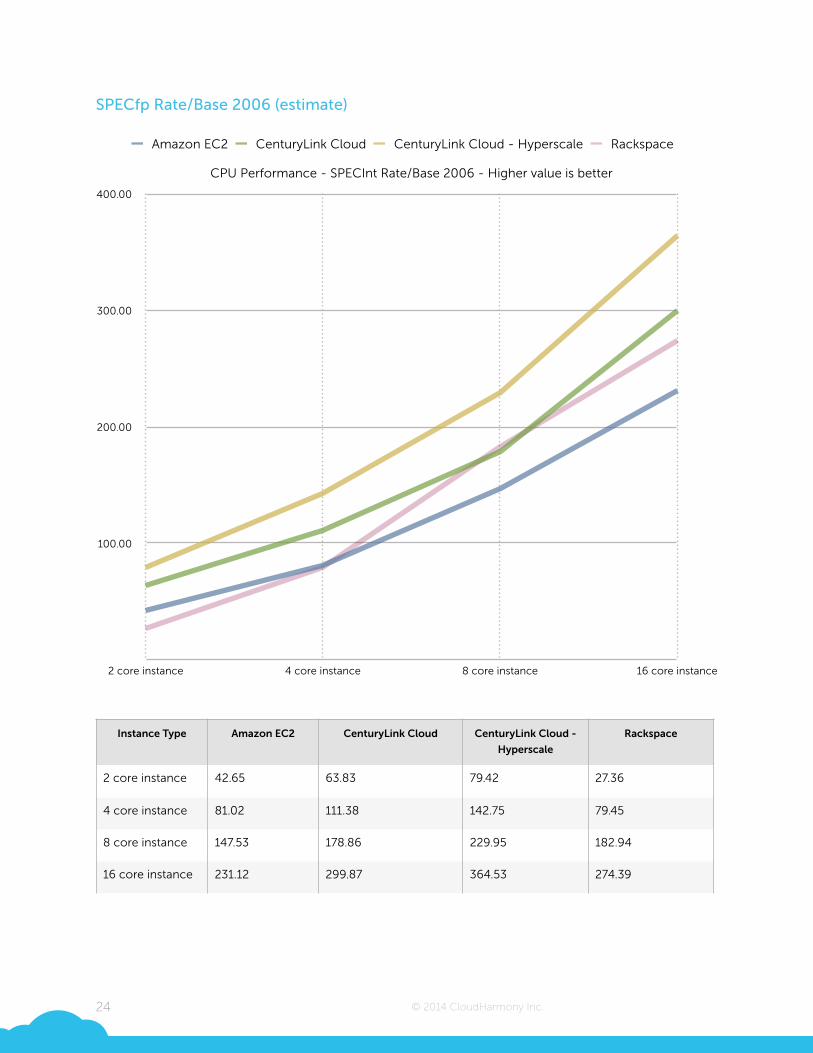
SPECfp Rate/Base 2006 (estimate)
!Instance Type Amazon EC2 CenturyLink Cloud CenturyLink Cloud -
Hyperscale
Rackspace
2 core instance 42.65 63.83 79.42 27.36
4 core instance 81.02 111.38 142.75 79.45
8 core instance 147.53 178.86 229.95 182.94
16 core instance 231.12 299.87 364.53 274.39
24
CPU Performance - SPECInt Rate/Base 2006 - Higher value is better
100.00
200.00
300.00
400.00
2 core instance 4 core instance 8 core instance 16 core instance
Amazon EC2 CenturyLink Cloud CenturyLink Cloud - Hyperscale Rackspace
© 2014 CloudHarmony Inc.
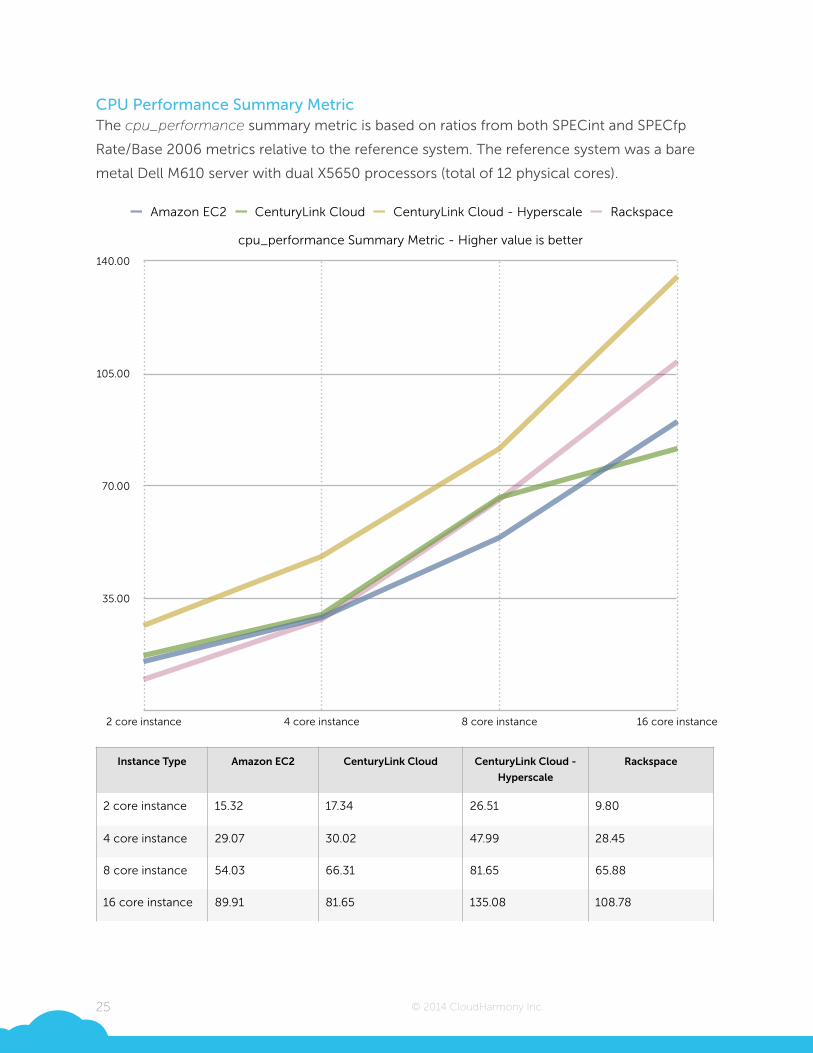
CPU Performance Summary Metric The cpu_performance summary metric is based on ratios from both SPECint and SPECfp
Rate/Base 2006 metrics relative to the reference system. The reference system was a bare
metal Dell M610 server with dual X5650 processors (total of 12 physical cores).
Instance Type Amazon EC2 CenturyLink Cloud CenturyLink Cloud -
Hyperscale
Rackspace
2 core instance 15.32 17.34 26.51 9.80
4 core instance 29.07 30.02 47.99 28.45
8 core instance 54.03 66.31 81.65 65.88
16 core instance 89.91 81.65 135.08 108.78
25
cpu_performance Summary Metric - Higher value is better
35.00
70.00
105.00
140.00
2 core instance 4 core instance 8 core instance 16 core instance
Amazon EC2 CenturyLink Cloud CenturyLink Cloud - Hyperscale Rackspace
© 2014 CloudHarmony Inc.
CPU Performance Comments Lower results for the Rackspace 2 and 4 core instances were due to slightly different
benchmark configurations that were necessary to work around memory limitations on those
instances. The 8 and 16 cores Rackspace instances, however, are based on the same
benchmark configuration as other services and the resulting metrics are more in line with
comparable instances.
!CenturyLink Cloud Hyperscale performed well in this phase of testing. Use of newer Ivy
Bridge processors allowed it to outperform services based on older CPU models. The
difference between Amazon EC2 and CenturyLink Cloud Hyperscale instances, despite both
using Ivy Bridge, could be due to differences in virtualization or use/non-use of CPU hyper
threading (hardware managed threading of CPU cores).
!!
26
© 2014 CloudHarmony Inc.
Disk Performance Disk performance determines how quickly applications can read and write to disk volumes in
order to interact with persistent data and files. Disk usage patterns vary by workload. A web
server, for example, will likely perform many more read than write operations; while a
database server will likely have a mix of read and write. A workload might also access data in
small pieces located in different places on disk, or fewer large pieces in close proximity
wherein block size and sequential or random access patterns come into play.
!We used the industry standard fio benchmark to measure disk performance. In total, we ran
three test iterations, each consisting of 36 workloads in addition to run-up testing on each
compute instance. Total test duration was about 40 hours per compute instance. Testing was
optimized for faster IO using the asynchronous Linux libaio engine and an optimized queue
depth setting. Asynchronous IO allows applications to submit operations without waiting for
a response. It is usually faster than synchronous IO because applications can submit non-
blocking requests to an IO queue, and the system will work off that queue in the fastest way
possible.
!When using fio with asynchronous IO, one configurable parameter is queue depth. Queue
depth defines the maximum number of requests to submit before waiting for some of them
to be fulfilled. To maximize IO, it is best to set use a queue depth that submits enough
requests so that the system is never idle, but not so many that queue management overhead
consumes so many resources that is may actually reduce IO performance.
!To optimize queue depth for our tests, we first used a pre-test phase to determine the best
setting to use for each of the 36 workloads. To do this, we ran sets of three abbreviated tests
using incrementing queue depths (1, 2, 4, 8, etc.) until IO did not increase by at least 3
percent over the preceding set of tests. These queue depths settings were then used for the
actual testing.
!The analysis below presents IO bandwidth in megabytes per second (MB/s) for each of 36 fio
workloads that were tested. A higher value represents faster disk performance. IO
consistency is also presented separately. It is based on the standard deviation of IOPS
(represented as a relative percentage) for each workload. In the consistency analysis, a higher
value represents less consistent performance. Inconsistent IO is often undesirable for
production applications like database servers.
!
27
© 2014 CloudHarmony Inc.
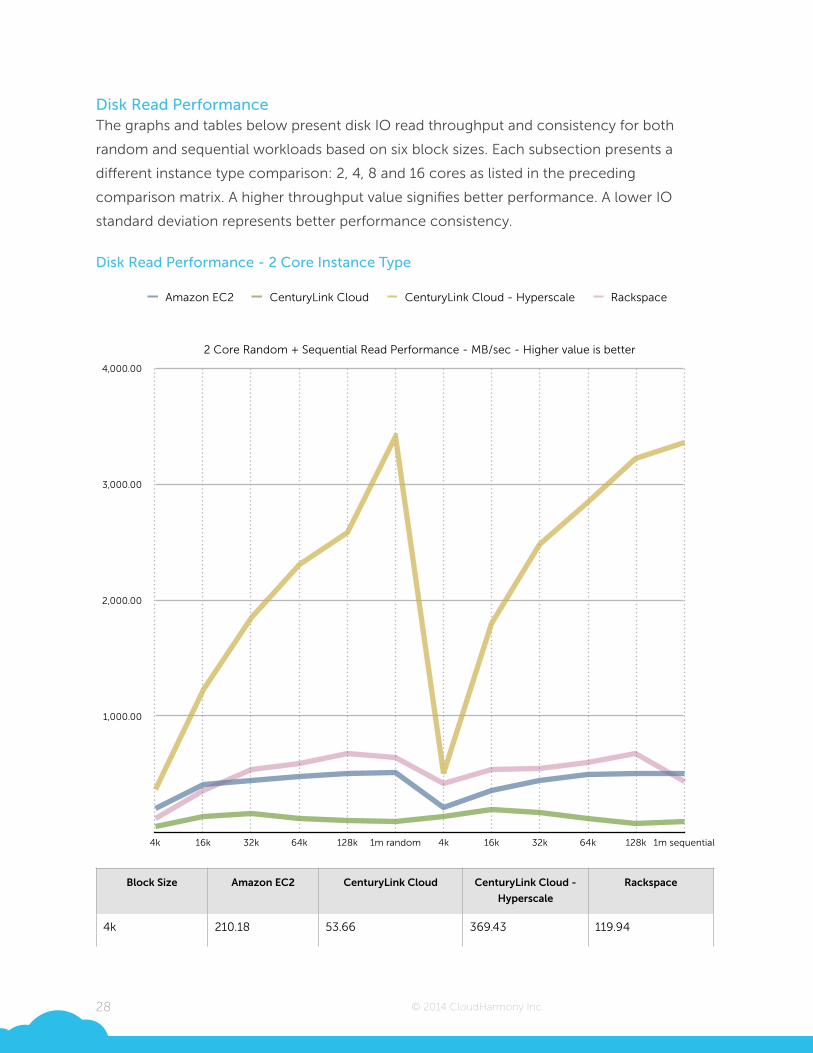
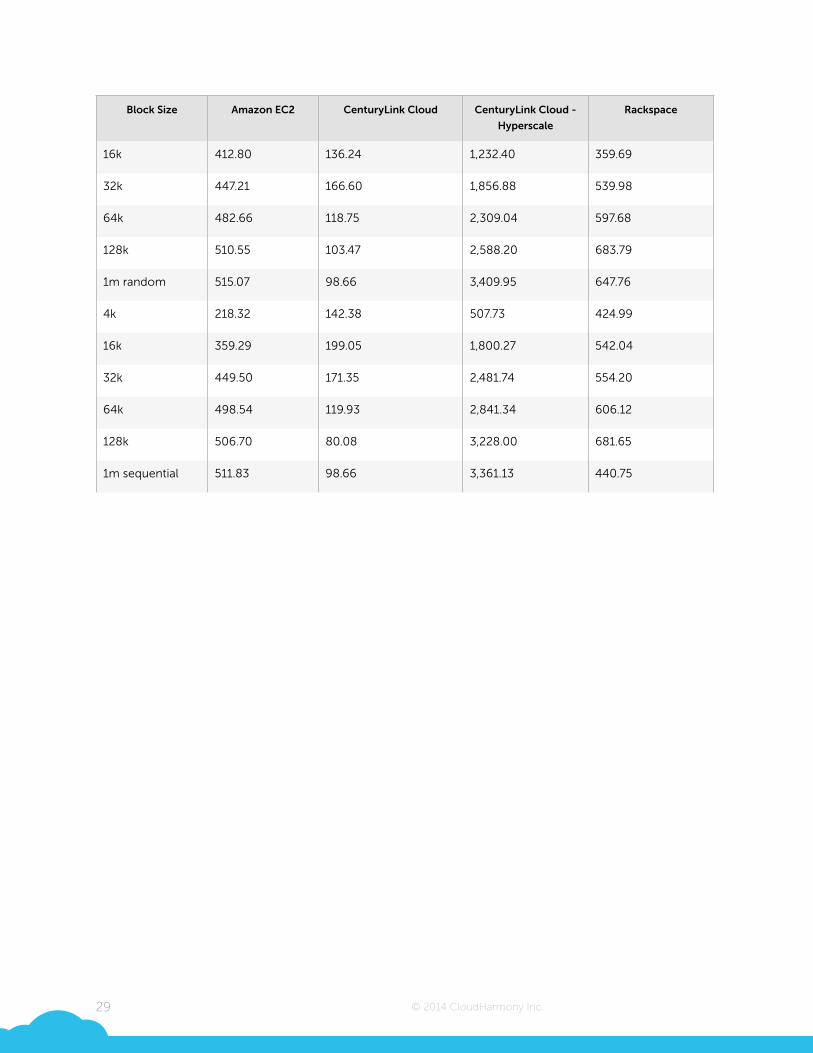
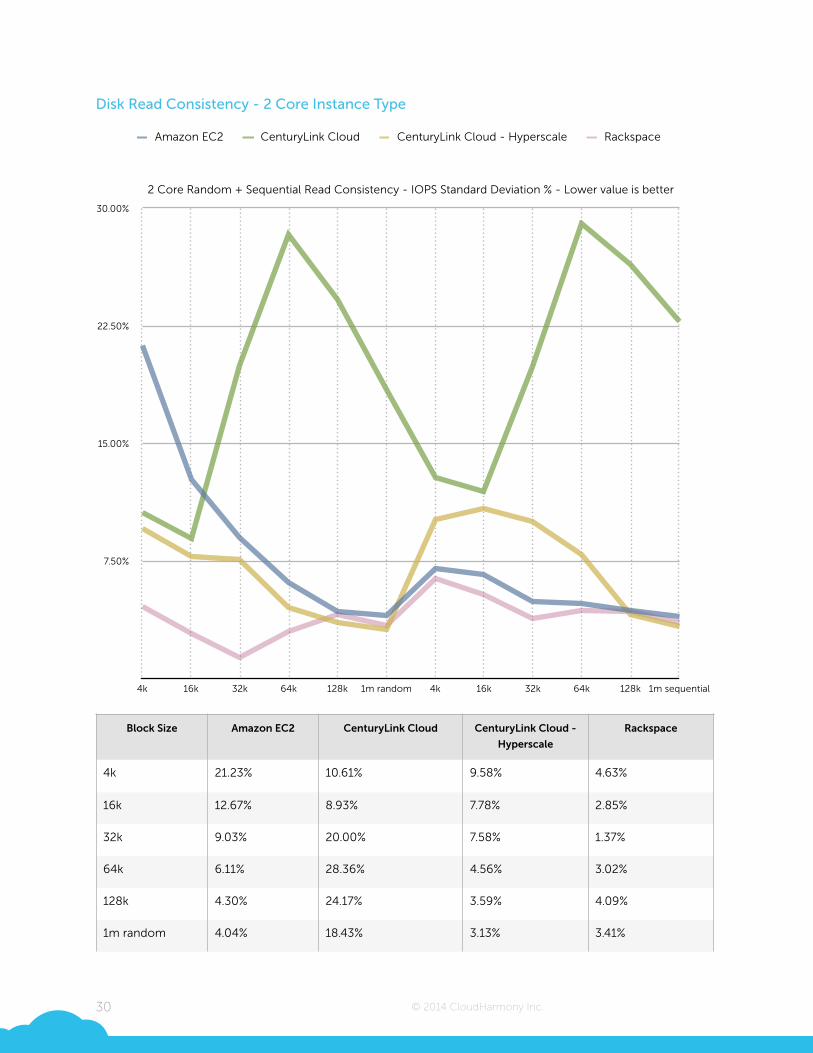
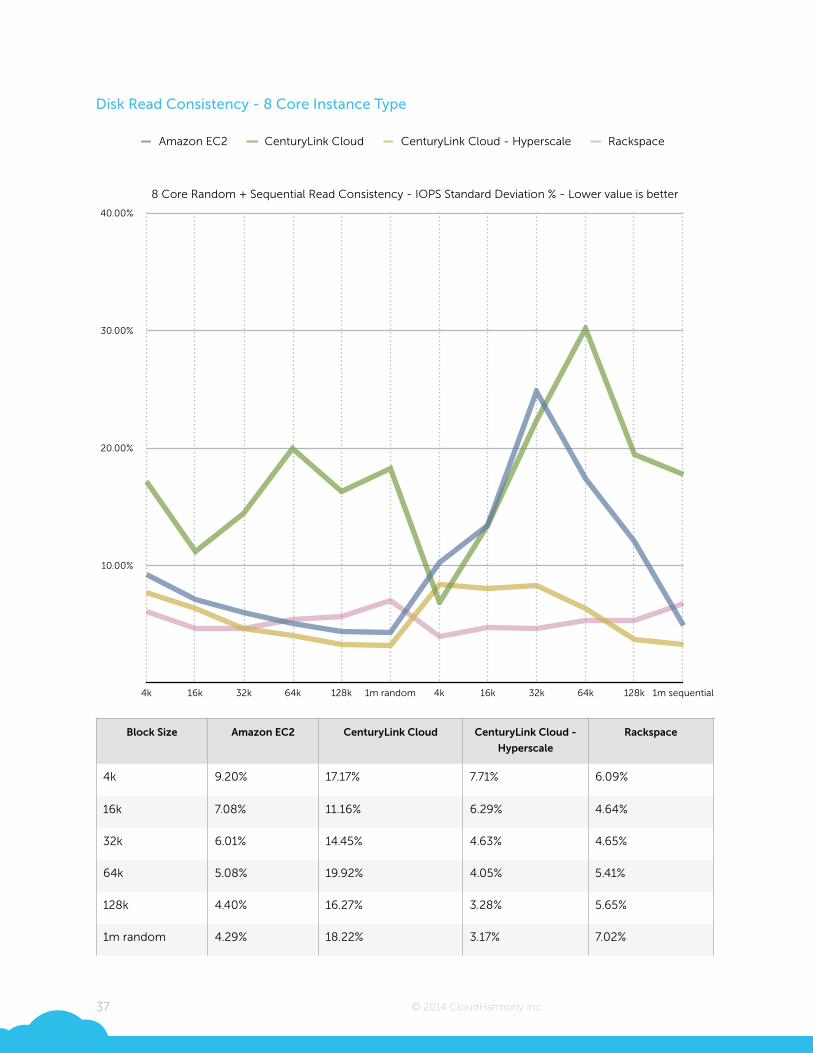
Disk Read Performance The graphs and tables below present disk IO read throughput and consistency for both
random and sequential workloads based on six block sizes. Each subsection presents a
different instance type comparison: 2, 4, 8 and 16 cores as listed in the preceding
comparison matrix. A higher throughput value signifies better performance. A lower IO
standard deviation represents better performance consistency. !Disk Read Performance - 2 Core Instance Type
Block Size Amazon EC2 CenturyLink Cloud CenturyLink Cloud -
Hyperscale
Rackspace
4k 210.18 53.66 369.43 119.94
28
2 Core Random + Sequential Read Performance - MB/sec - Higher value is better
1,000.00
2,000.00
3,000.00
4,000.00
4k 16k 32k 64k 128k 1m random 4k 16k 32k 64k 128k 1m sequential
Amazon EC2 CenturyLink Cloud CenturyLink Cloud - Hyperscale Rackspace
© 2014 CloudHarmony Inc.
!!
16k 412.80 136.24 1,232.40 359.69
32k 447.21 166.60 1,856.88 539.98
64k 482.66 118.75 2,309.04 597.68
128k 510.55 103.47 2,588.20 683.79
1m random 515.07 98.66 3,409.95 647.76
4k 218.32 142.38 507.73 424.99
16k 359.29 199.05 1,800.27 542.04
32k 449.50 171.35 2,481.74 554.20
64k 498.54 119.93 2,841.34 606.12
128k 506.70 80.08 3,228.00 681.65
1m sequential 511.83 98.66 3,361.13 440.75
Block Size Amazon EC2 CenturyLink Cloud CenturyLink Cloud -
Hyperscale
Rackspace
29
© 2014 CloudHarmony Inc.
Disk Read Consistency - 2 Core Instance Type
Block Size Amazon EC2 CenturyLink Cloud CenturyLink Cloud -
Hyperscale
Rackspace
4k 21.23% 10.61% 9.58% 4.63%
16k 12.67% 8.93% 7.78% 2.85%
32k 9.03% 20.00% 7.58% 1.37%
64k 6.11% 28.36% 4.56% 3.02%
128k 4.30% 24.17% 3.59% 4.09%
1m random 4.04% 18.43% 3.13% 3.41%
30
2 Core Random + Sequential Read Consistency - IOPS Standard Deviation % - Lower value is better
7.50%
15.00%
22.50%
30.00%
4k 16k 32k 64k 128k 1m random 4k 16k 32k 64k 128k 1m sequential
Amazon EC2 CenturyLink Cloud CenturyLink Cloud - Hyperscale Rackspace

© 2014 CloudHarmony Inc.
4k 7.05% 12.86% 10.18% 6.36%
16k 6.66% 11.91% 10.86% 5.37%
32k 4.91% 19.89% 10.04% 3.85%
64k 4.82% 29.05% 7.91% 4.36%
128k 4.37% 26.42% 4.10% 4.29%
1m sequential 3.94% 22.76% 3.33% 3.60%
Block Size Amazon EC2 CenturyLink Cloud CenturyLink Cloud -
Hyperscale
Rackspace
31
© 2014 CloudHarmony Inc.
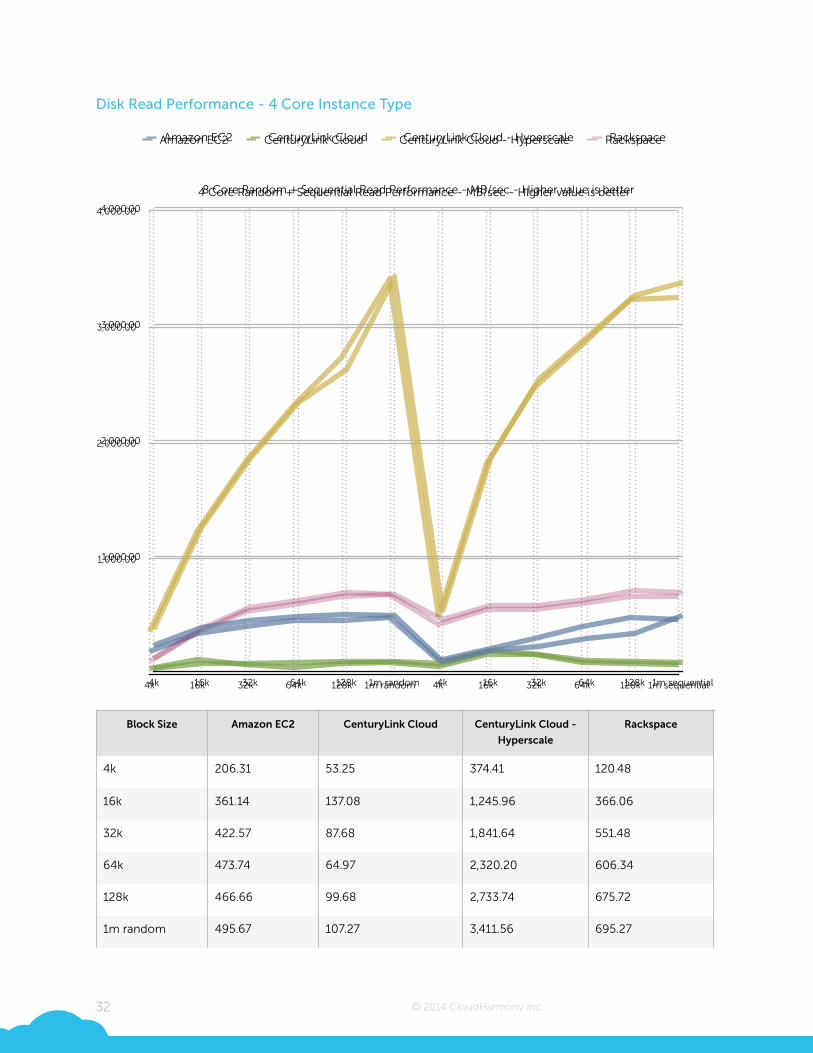
Disk Read Performance - 4 Core Instance Type
Block Size Amazon EC2 CenturyLink Cloud CenturyLink Cloud -
Hyperscale
Rackspace
4k 206.31 53.25 374.41 120.48
16k 361.14 137.08 1,245.96 366.06
32k 422.57 87.68 1,841.64 551.48
64k 473.74 64.97 2,320.20 606.34
128k 466.66 99.68 2,733.74 675.72
1m random 495.67 107.27 3,411.56 695.27
32
4 Core Random + Sequential Read Performance - MB/sec - Higher value is better
1,000.00
2,000.00
3,000.00
4,000.00
4k 16k 32k 64k 128k 1m random 4k 16k 32k 64k 128k 1m sequential
Amazon EC2 CenturyLink Cloud CenturyLink Cloud - Hyperscale Rackspace
8 Core Random + Sequential Read Performance - MB/sec - Higher value is better
1,000.00
2,000.00
3,000.00
4,000.00
4k 16k 32k 64k 128k 1m random 4k 16k 32k 64k 128k 1m sequential
Amazon EC2 CenturyLink Cloud CenturyLink Cloud - Hyperscale Rackspace

© 2014 CloudHarmony Inc.
4k 127.44 70.81 509.61 437.49
16k 224.49 179.06 1,821.13 561.92
32k 314.86 181.08 2,482.90 565.83
64k 421.42 112.88 2,851.79 618.91
128k 497.07 100.97 3,236.13 681.30
1m sequential 480.08 93.89 3,250.75 679.23
Block Size Amazon EC2 CenturyLink Cloud CenturyLink Cloud -
Hyperscale
Rackspace
33
© 2014 CloudHarmony Inc.
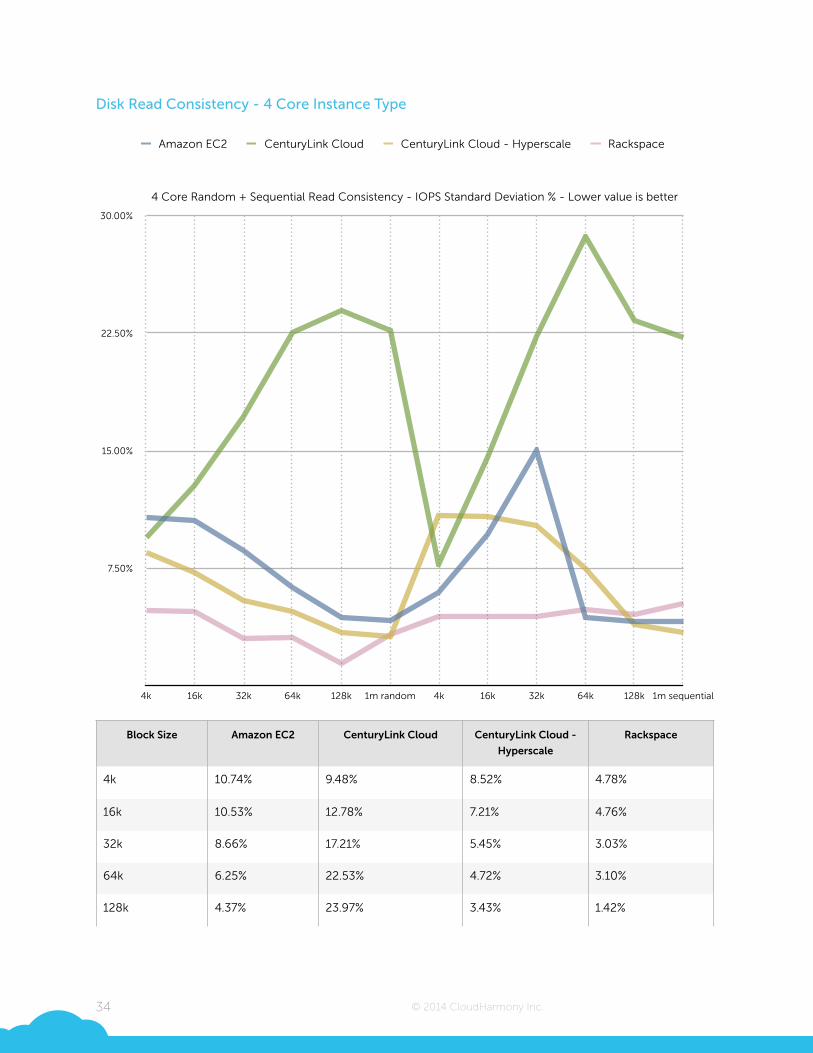
Disk Read Consistency - 4 Core Instance Type
Block Size Amazon EC2 CenturyLink Cloud CenturyLink Cloud -
Hyperscale
Rackspace
4k 10.74% 9.48% 8.52% 4.78%
16k 10.53% 12.78% 7.21% 4.76%
32k 8.66% 17.21% 5.45% 3.03%
64k 6.25% 22.53% 4.72% 3.10%
128k 4.37% 23.97% 3.43% 1.42%
34
4 Core Random + Sequential Read Consistency - IOPS Standard Deviation % - Lower value is better
7.50%
15.00%
22.50%
30.00%
4k 16k 32k 64k 128k 1m random 4k 16k 32k 64k 128k 1m sequential
Amazon EC2 CenturyLink Cloud CenturyLink Cloud - Hyperscale Rackspace

© 2014 CloudHarmony Inc.
1m random 4.18% 22.68% 3.15% 3.27%
4k 5.97% 7.76% 10.86% 4.43%
16k 9.66% 14.55% 10.78% 4.44%
32k 15.03% 22.31% 10.22% 4.44%
64k 4.35% 28.64% 7.49% 4.84%
128k 4.09% 23.30% 3.93% 4.52%
1m sequential 4.09% 22.23% 3.39% 5.27%
Block Size Amazon EC2 CenturyLink Cloud CenturyLink Cloud -
Hyperscale
Rackspace
35
© 2014 CloudHarmony Inc.
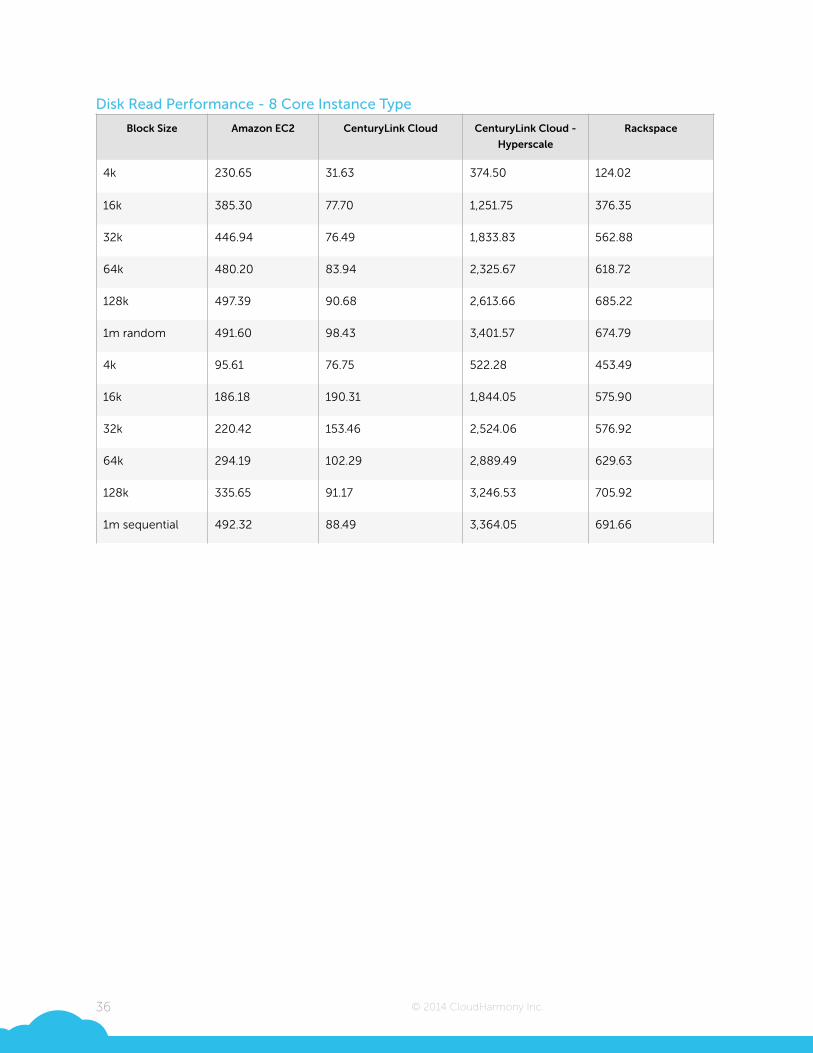
Disk Read Performance - 8 Core Instance Type
Block Size Amazon EC2 CenturyLink Cloud CenturyLink Cloud -
Hyperscale
Rackspace
4k 230.65 31.63 374.50 124.02
16k 385.30 77.70 1,251.75 376.35
32k 446.94 76.49 1,833.83 562.88
64k 480.20 83.94 2,325.67 618.72
128k 497.39 90.68 2,613.66 685.22
1m random 491.60 98.43 3,401.57 674.79
4k 95.61 76.75 522.28 453.49
16k 186.18 190.31 1,844.05 575.90
32k 220.42 153.46 2,524.06 576.92
64k 294.19 102.29 2,889.49 629.63
128k 335.65 91.17 3,246.53 705.92
1m sequential 492.32 88.49 3,364.05 691.66
36
© 2014 CloudHarmony Inc.
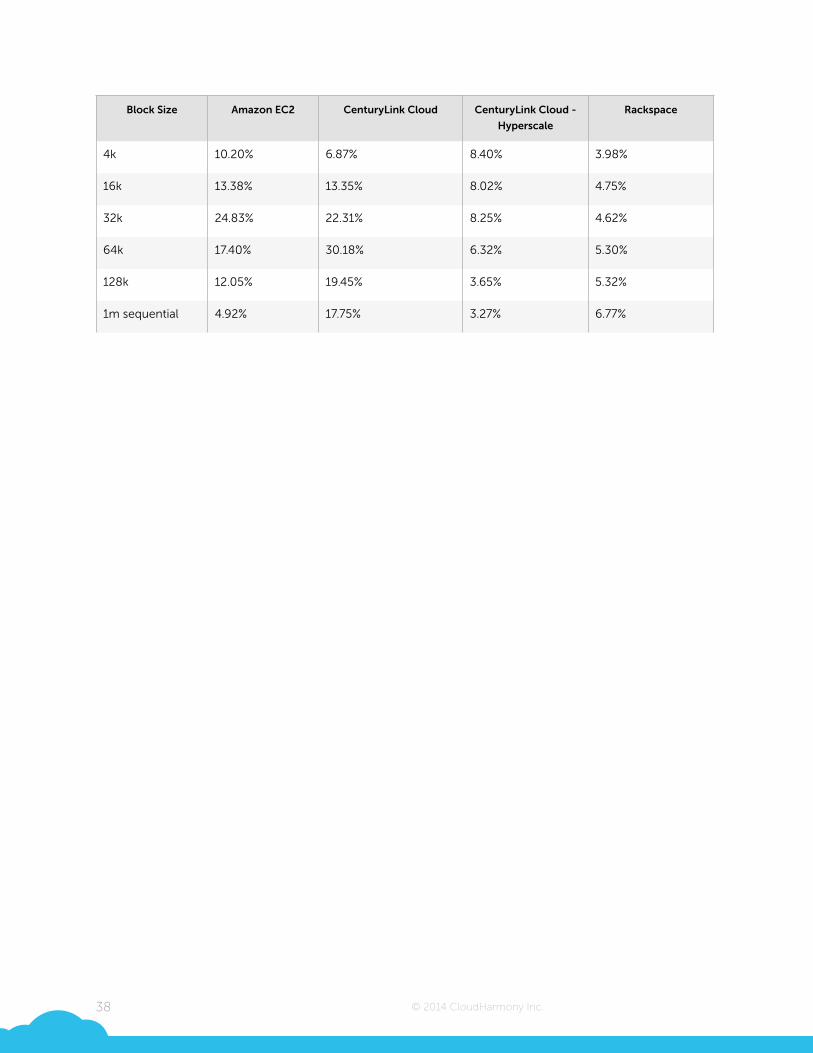
Disk Read Consistency - 8 Core Instance Type
Block Size Amazon EC2 CenturyLink Cloud CenturyLink Cloud -
Hyperscale
Rackspace
4k 9.20% 17.17% 7.71% 6.09%
16k 7.08% 11.16% 6.29% 4.64%
32k 6.01% 14.45% 4.63% 4.65%
64k 5.08% 19.92% 4.05% 5.41%
128k 4.40% 16.27% 3.28% 5.65%
1m random 4.29% 18.22% 3.17% 7.02%
37
8 Core Random + Sequential Read Consistency - IOPS Standard Deviation % - Lower value is better
10.00%
20.00%
30.00%
40.00%
4k 16k 32k 64k 128k 1m random 4k 16k 32k 64k 128k 1m sequential
Amazon EC2 CenturyLink Cloud CenturyLink Cloud - Hyperscale Rackspace
© 2014 CloudHarmony Inc.
4k 10.20% 6.87% 8.40% 3.98%
16k 13.38% 13.35% 8.02% 4.75%
32k 24.83% 22.31% 8.25% 4.62%
64k 17.40% 30.18% 6.32% 5.30%
128k 12.05% 19.45% 3.65% 5.32%
1m sequential 4.92% 17.75% 3.27% 6.77%
Block Size Amazon EC2 CenturyLink Cloud CenturyLink Cloud -
Hyperscale
Rackspace
38
© 2014 CloudHarmony Inc.
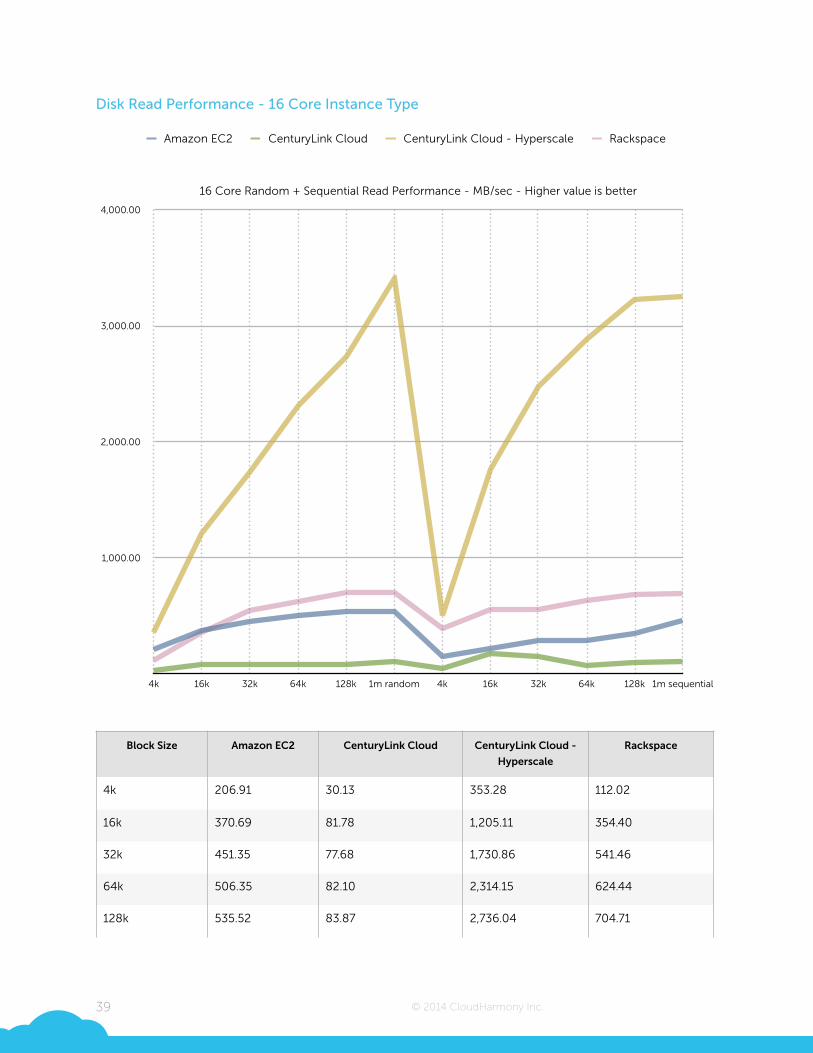
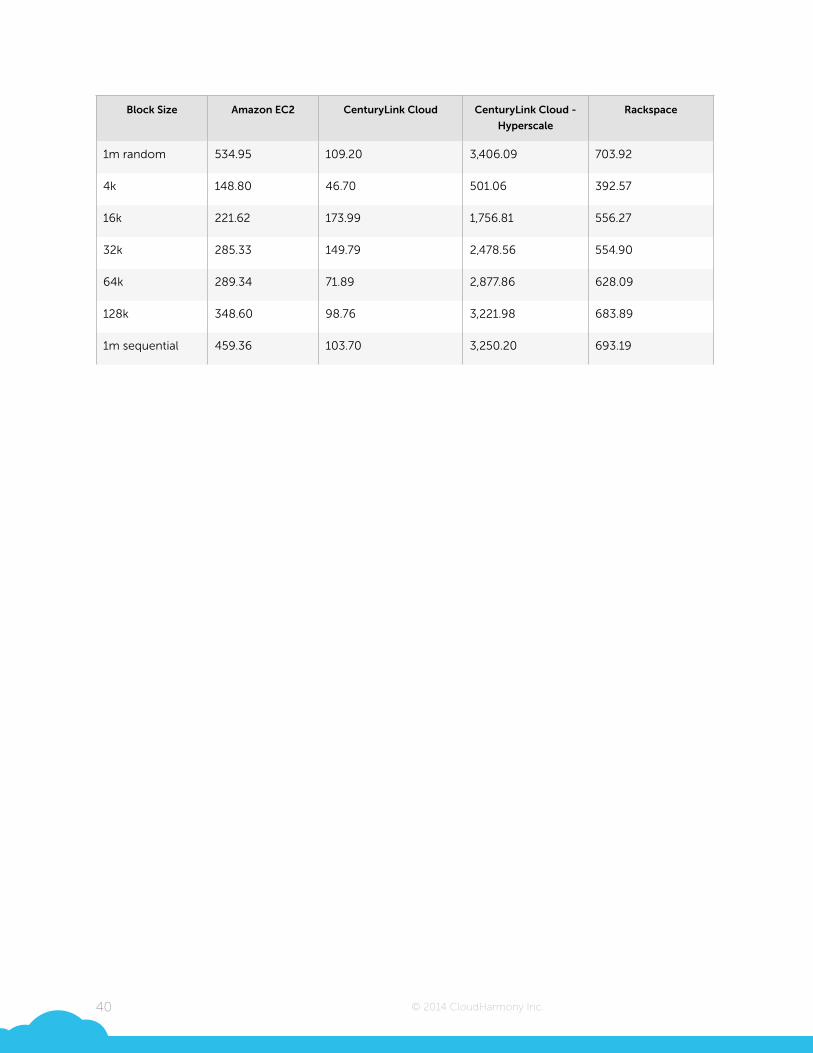
Disk Read Performance - 16 Core Instance Type
!Block Size Amazon EC2 CenturyLink Cloud CenturyLink Cloud -
Hyperscale
Rackspace
4k 206.91 30.13 353.28 112.02
16k 370.69 81.78 1,205.11 354.40
32k 451.35 77.68 1,730.86 541.46
64k 506.35 82.10 2,314.15 624.44
128k 535.52 83.87 2,736.04 704.71
39
16 Core Random + Sequential Read Performance - MB/sec - Higher value is better
1,000.00
2,000.00
3,000.00
4,000.00
4k 16k 32k 64k 128k 1m random 4k 16k 32k 64k 128k 1m sequential
Amazon EC2 CenturyLink Cloud CenturyLink Cloud - Hyperscale Rackspace
© 2014 CloudHarmony Inc.
1m random 534.95 109.20 3,406.09 703.92
4k 148.80 46.70 501.06 392.57
16k 221.62 173.99 1,756.81 556.27
32k 285.33 149.79 2,478.56 554.90
64k 289.34 71.89 2,877.86 628.09
128k 348.60 98.76 3,221.98 683.89
1m sequential 459.36 103.70 3,250.20 693.19
Block Size Amazon EC2 CenturyLink Cloud CenturyLink Cloud -
Hyperscale
Rackspace
40
© 2014 CloudHarmony Inc.
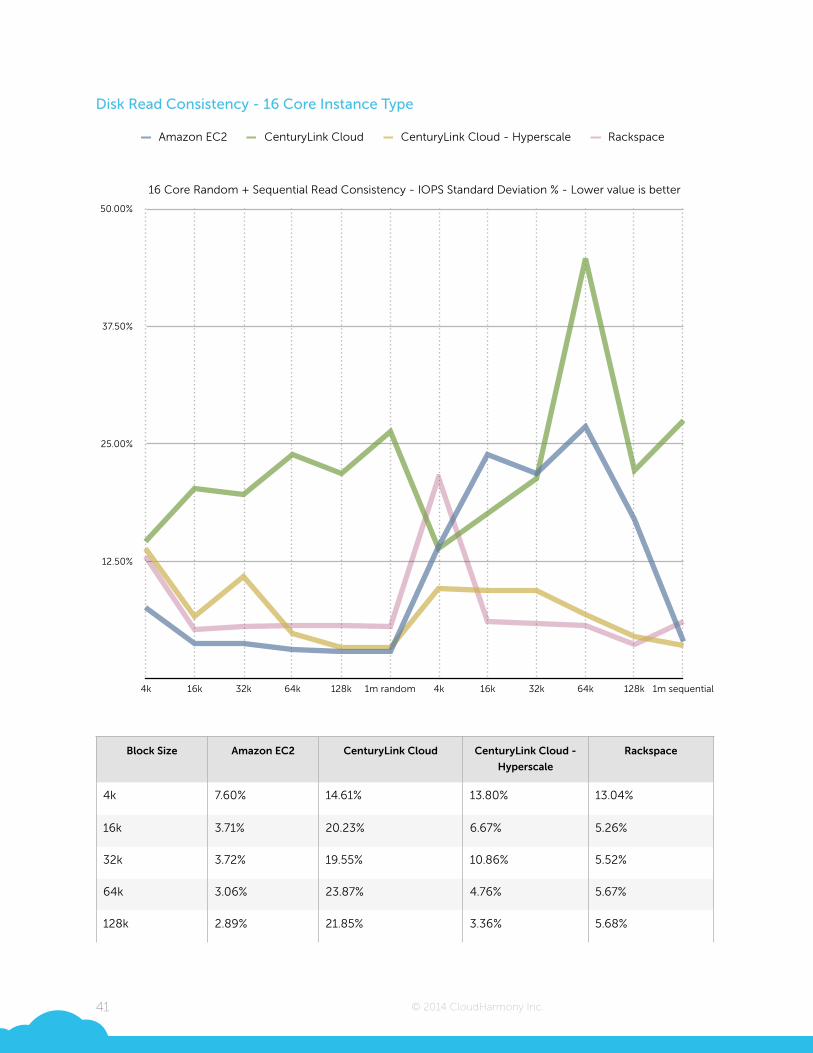
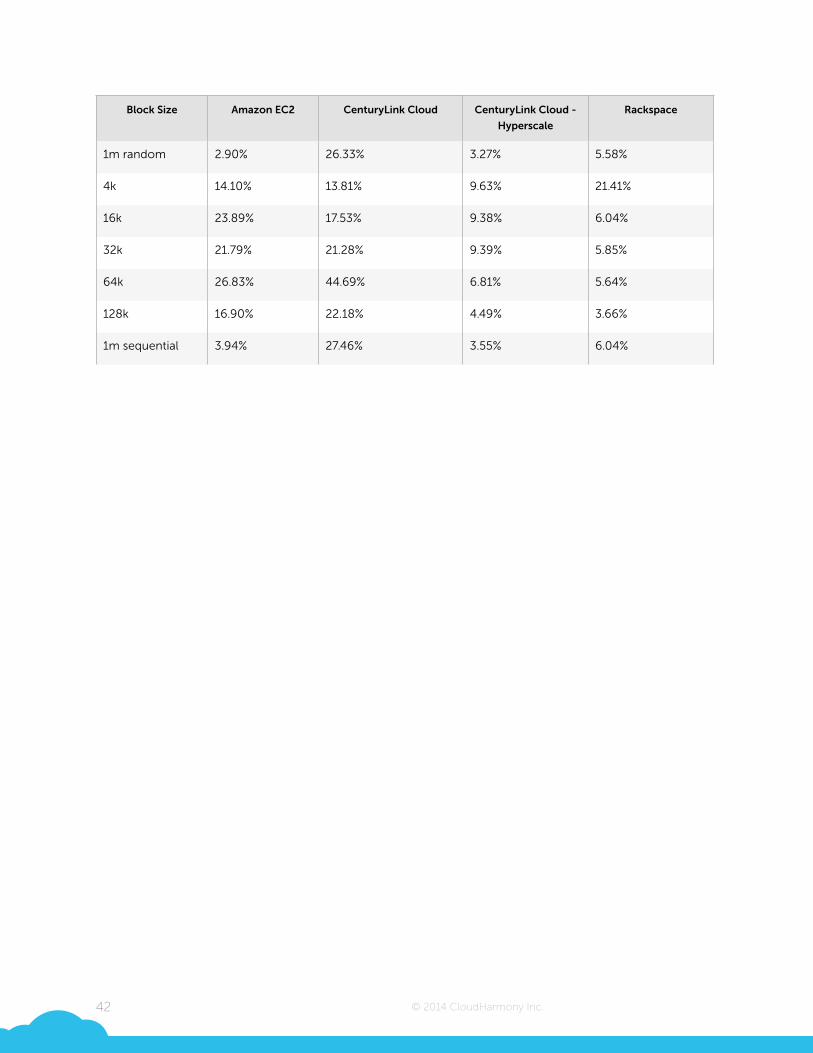
Disk Read Consistency - 16 Core Instance Type
!Block Size Amazon EC2 CenturyLink Cloud CenturyLink Cloud -
Hyperscale
Rackspace
4k 7.60% 14.61% 13.80% 13.04%
16k 3.71% 20.23% 6.67% 5.26%
32k 3.72% 19.55% 10.86% 5.52%
64k 3.06% 23.87% 4.76% 5.67%
128k 2.89% 21.85% 3.36% 5.68%
41
16 Core Random + Sequential Read Consistency - IOPS Standard Deviation % - Lower value is better
12.50%
25.00%
37.50%
50.00%
4k 16k 32k 64k 128k 1m random 4k 16k 32k 64k 128k 1m sequential
Amazon EC2 CenturyLink Cloud CenturyLink Cloud - Hyperscale Rackspace
© 2014 CloudHarmony Inc.
!
1m random 2.90% 26.33% 3.27% 5.58%
4k 14.10% 13.81% 9.63% 21.41%
16k 23.89% 17.53% 9.38% 6.04%
32k 21.79% 21.28% 9.39% 5.85%
64k 26.83% 44.69% 6.81% 5.64%
128k 16.90% 22.18% 4.49% 3.66%
1m sequential 3.94% 27.46% 3.55% 6.04%
Block Size Amazon EC2 CenturyLink Cloud CenturyLink Cloud -
Hyperscale
Rackspace
42
© 2014 CloudHarmony Inc.
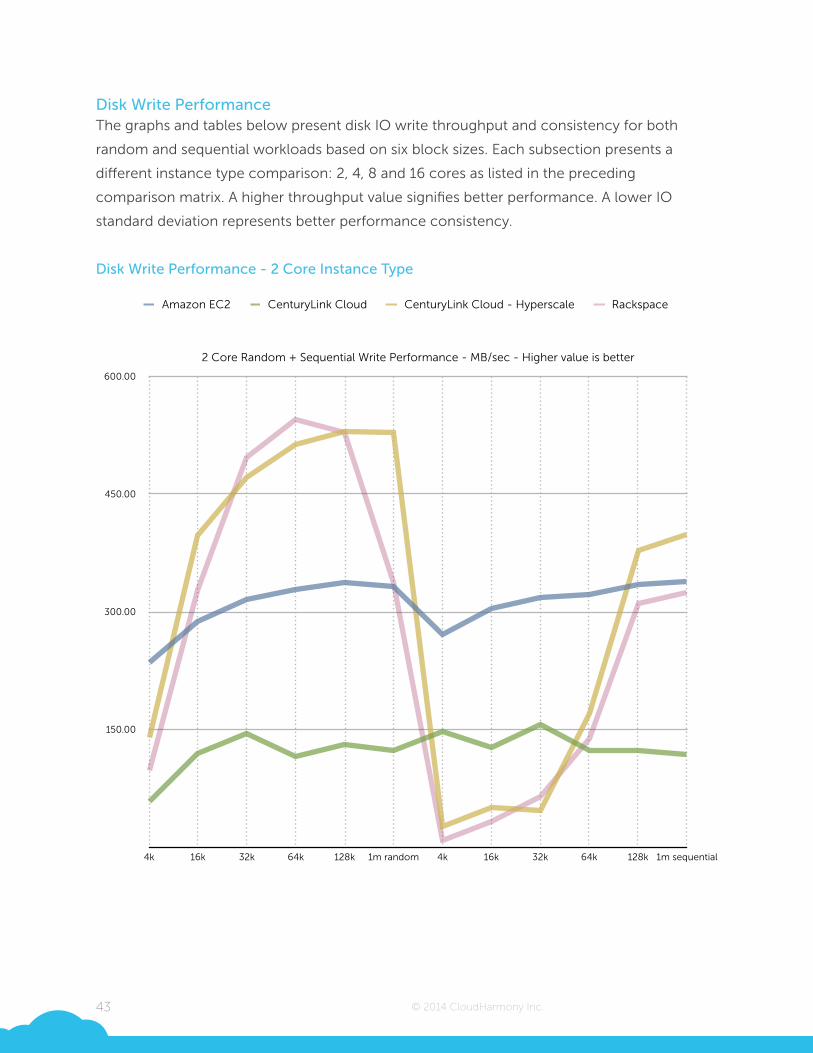
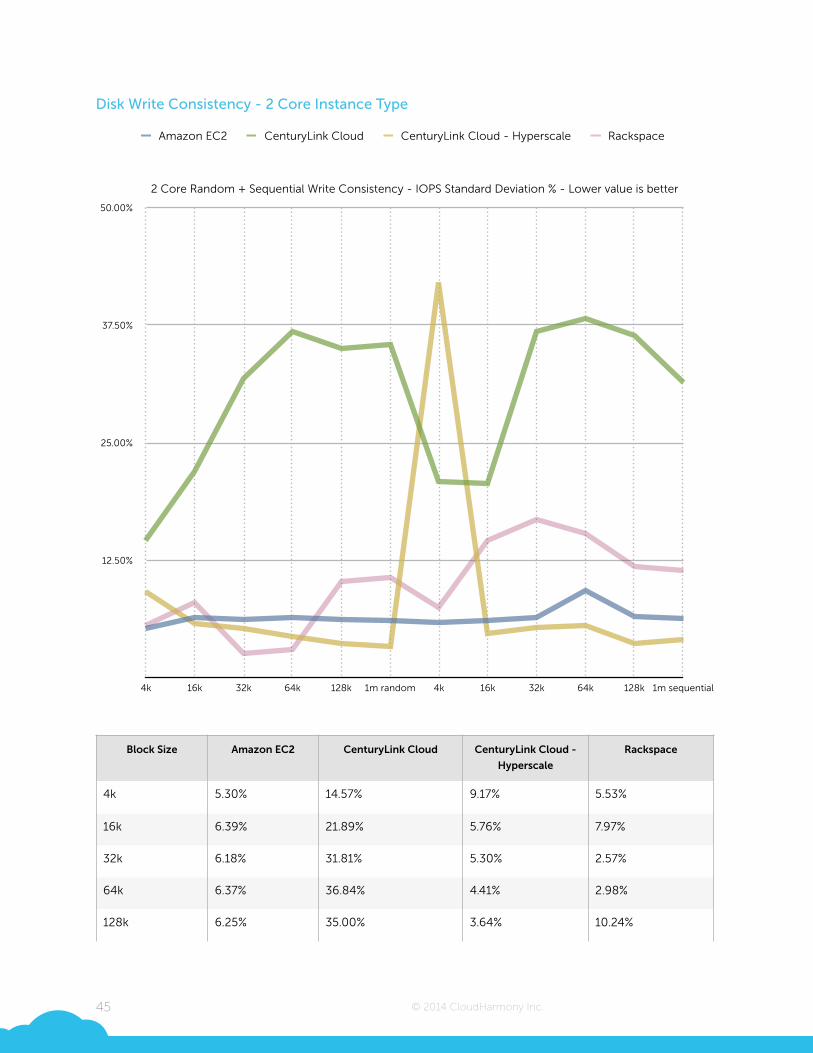
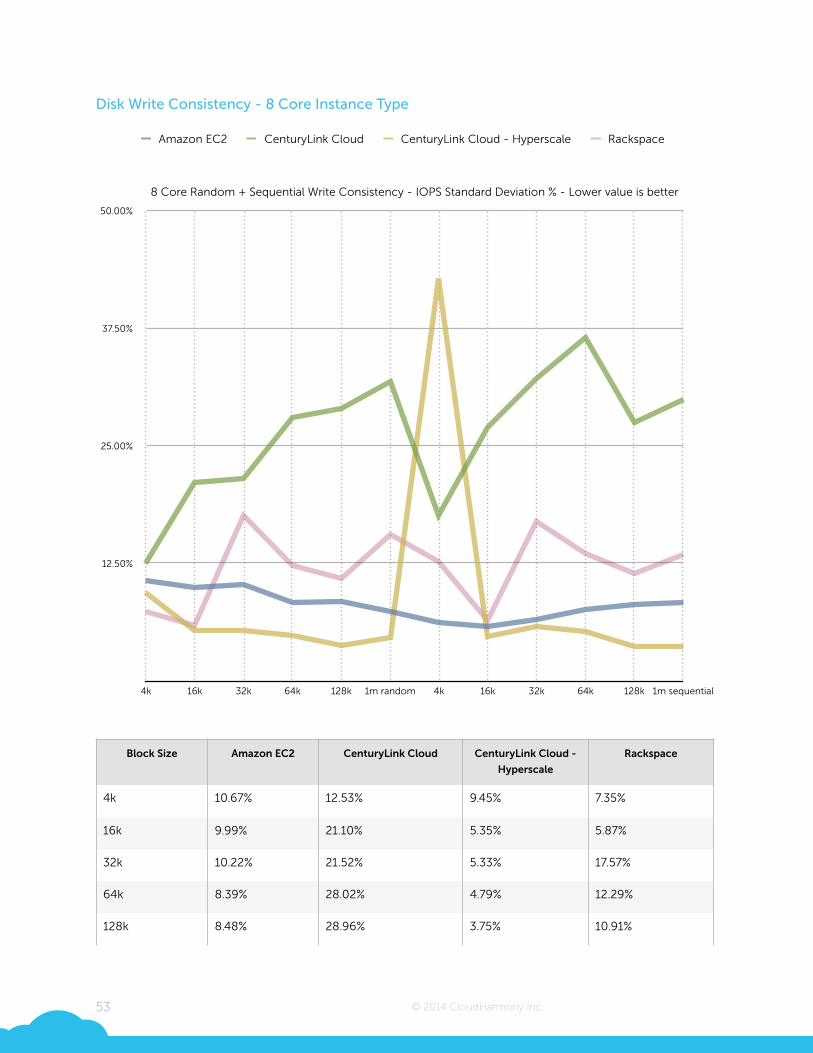
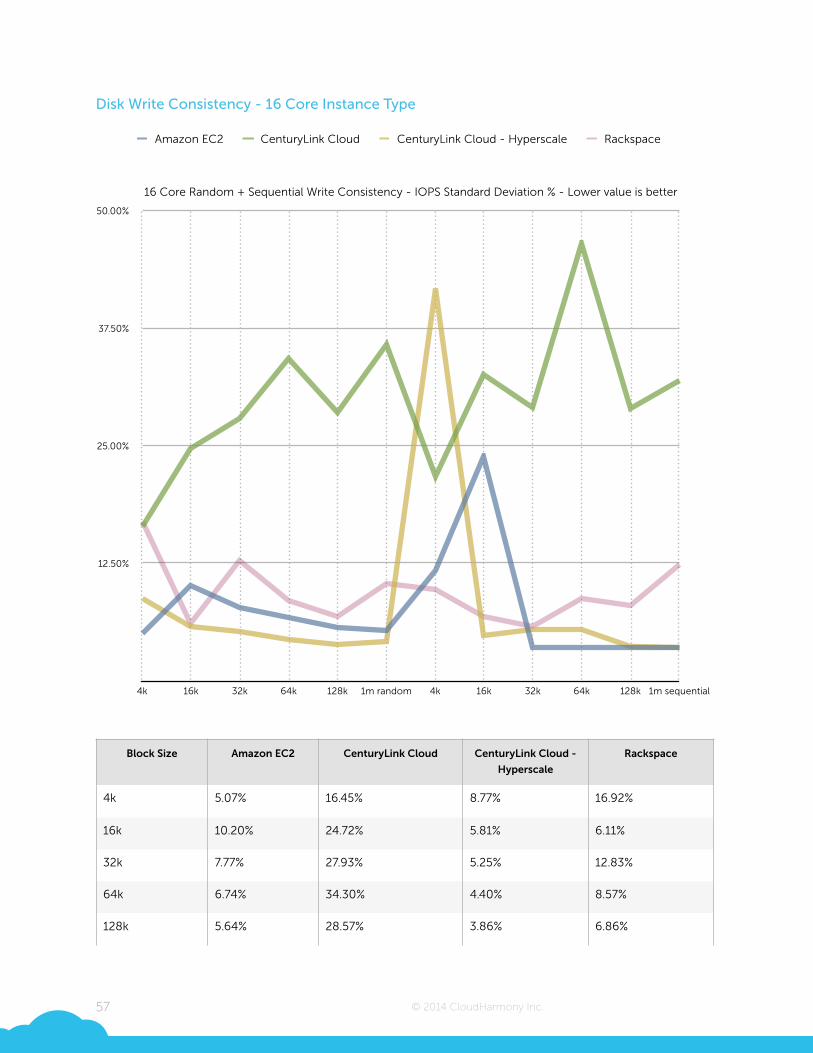
Disk Write Performance The graphs and tables below present disk IO write throughput and consistency for both
random and sequential workloads based on six block sizes. Each subsection presents a
different instance type comparison: 2, 4, 8 and 16 cores as listed in the preceding
comparison matrix. A higher throughput value signifies better performance. A lower IO
standard deviation represents better performance consistency.
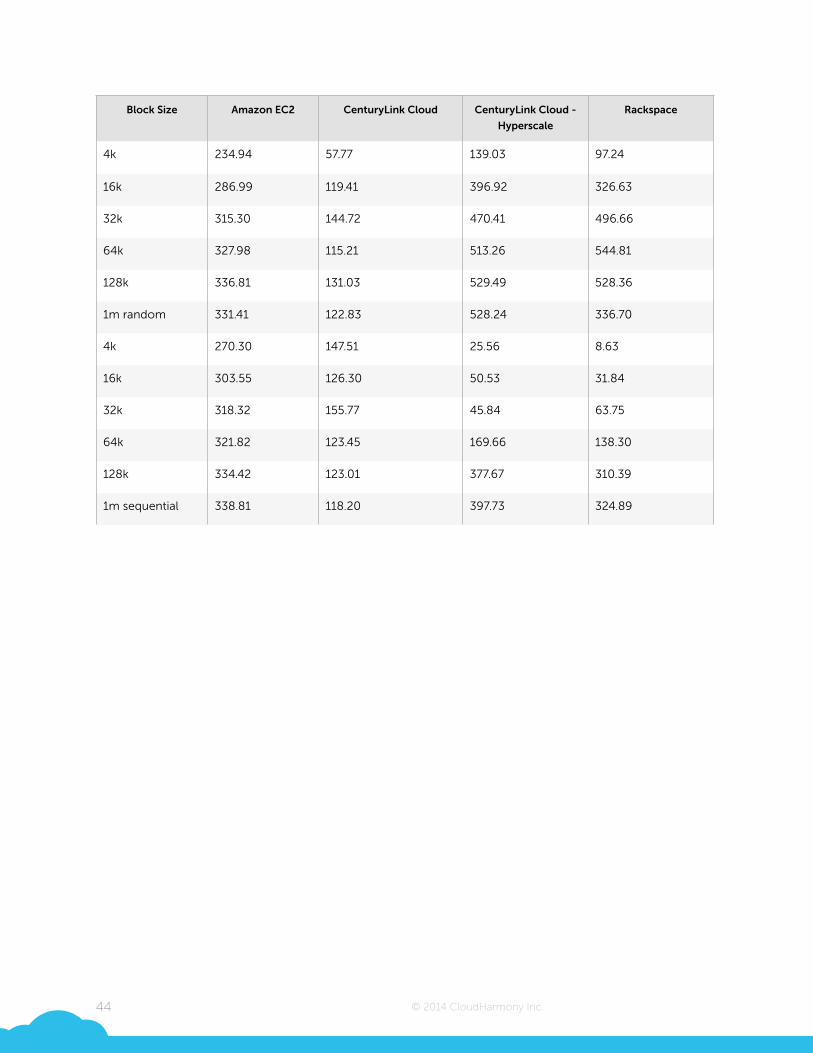
!Disk Write Performance - 2 Core Instance Type
!
43
2 Core Random + Sequential Write Performance - MB/sec - Higher value is better
150.00
300.00
450.00
600.00
4k 16k 32k 64k 128k 1m random 4k 16k 32k 64k 128k 1m sequential
Amazon EC2 CenturyLink Cloud CenturyLink Cloud - Hyperscale Rackspace
© 2014 CloudHarmony Inc.
!!
Block Size Amazon EC2 CenturyLink Cloud CenturyLink Cloud -
Hyperscale
Rackspace
4k 234.94 57.77 139.03 97.24
16k 286.99 119.41 396.92 326.63
32k 315.30 144.72 470.41 496.66
64k 327.98 115.21 513.26 544.81
128k 336.81 131.03 529.49 528.36
1m random 331.41 122.83 528.24 336.70
4k 270.30 147.51 25.56 8.63
16k 303.55 126.30 50.53 31.84
32k 318.32 155.77 45.84 63.75
64k 321.82 123.45 169.66 138.30
128k 334.42 123.01 377.67 310.39
1m sequential 338.81 118.20 397.73 324.89
44
© 2014 CloudHarmony Inc.
Disk Write Consistency - 2 Core Instance Type
!Block Size Amazon EC2 CenturyLink Cloud CenturyLink Cloud -
Hyperscale
Rackspace
4k 5.30% 14.57% 9.17% 5.53%
16k 6.39% 21.89% 5.76% 7.97%
32k 6.18% 31.81% 5.30% 2.57%
64k 6.37% 36.84% 4.41% 2.98%
128k 6.25% 35.00% 3.64% 10.24%
45
2 Core Random + Sequential Write Consistency - IOPS Standard Deviation % - Lower value is better
12.50%
25.00%
37.50%
50.00%
4k 16k 32k 64k 128k 1m random 4k 16k 32k 64k 128k 1m sequential
Amazon EC2 CenturyLink Cloud CenturyLink Cloud - Hyperscale Rackspace

© 2014 CloudHarmony Inc.
1m random 6.15% 35.40% 3.31% 10.72%
4k 5.88% 20.88% 42.01% 7.52%
16k 6.05% 20.66% 4.76% 14.63%
32k 6.47% 36.78% 5.37% 16.81%
64k 9.24% 38.16% 5.60% 15.39%
128k 6.50% 36.42% 3.62% 11.81%
1m sequential 6.36% 31.36% 4.13% 11.43%
Block Size Amazon EC2 CenturyLink Cloud CenturyLink Cloud -
Hyperscale
Rackspace
46
© 2014 CloudHarmony Inc.
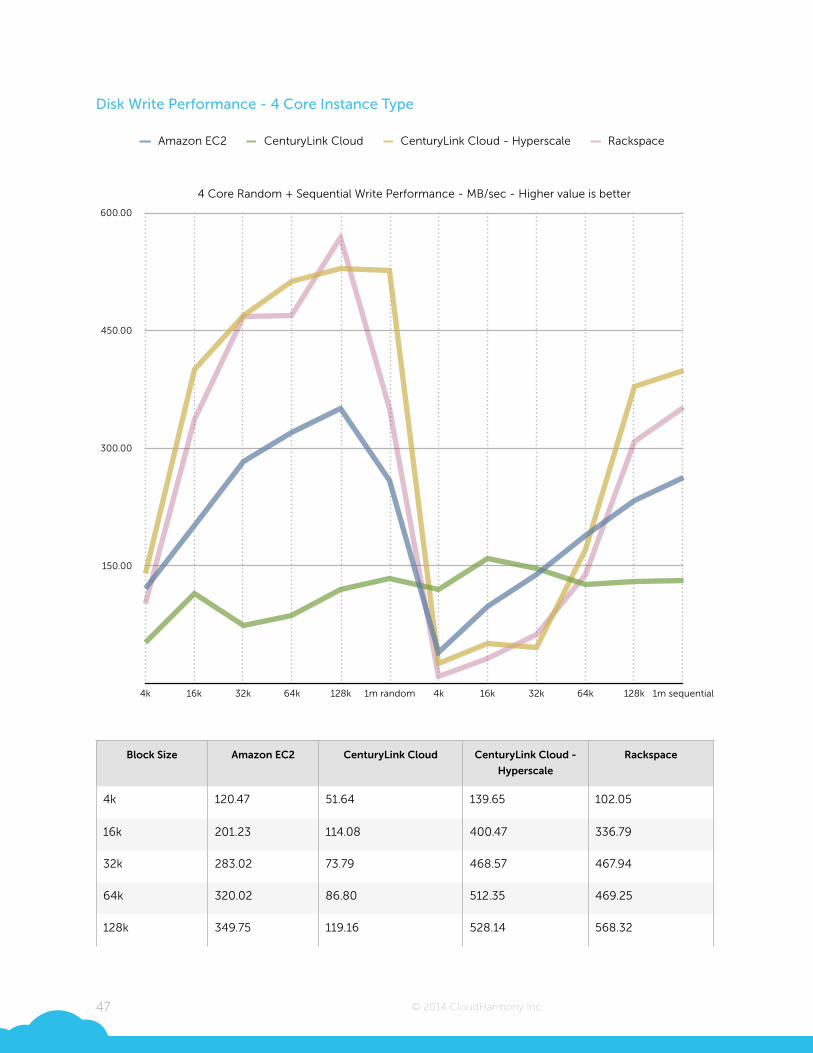
Disk Write Performance - 4 Core Instance Type
!Block Size Amazon EC2 CenturyLink Cloud CenturyLink Cloud -
Hyperscale
Rackspace
4k 120.47 51.64 139.65 102.05
16k 201.23 114.08 400.47 336.79
32k 283.02 73.79 468.57 467.94
64k 320.02 86.80 512.35 469.25
128k 349.75 119.16 528.14 568.32
47
4 Core Random + Sequential Write Performance - MB/sec - Higher value is better
150.00
300.00
450.00
600.00
4k 16k 32k 64k 128k 1m random 4k 16k 32k 64k 128k 1m sequential
Amazon EC2 CenturyLink Cloud CenturyLink Cloud - Hyperscale Rackspace

© 2014 CloudHarmony Inc.
1m random 258.91 134.21 526.78 350.89
4k 39.19 120.11 25.60 8.78
16k 97.35 158.68 50.82 31.32
32k 139.23 145.73 46.17 62.08
64k 188.97 125.56 170.10 139.27
128k 232.41 129.95 378.85 307.77
1m sequential 261.84 131.45 398.52 351.47
Block Size Amazon EC2 CenturyLink Cloud CenturyLink Cloud -
Hyperscale
Rackspace
48
© 2014 CloudHarmony Inc.
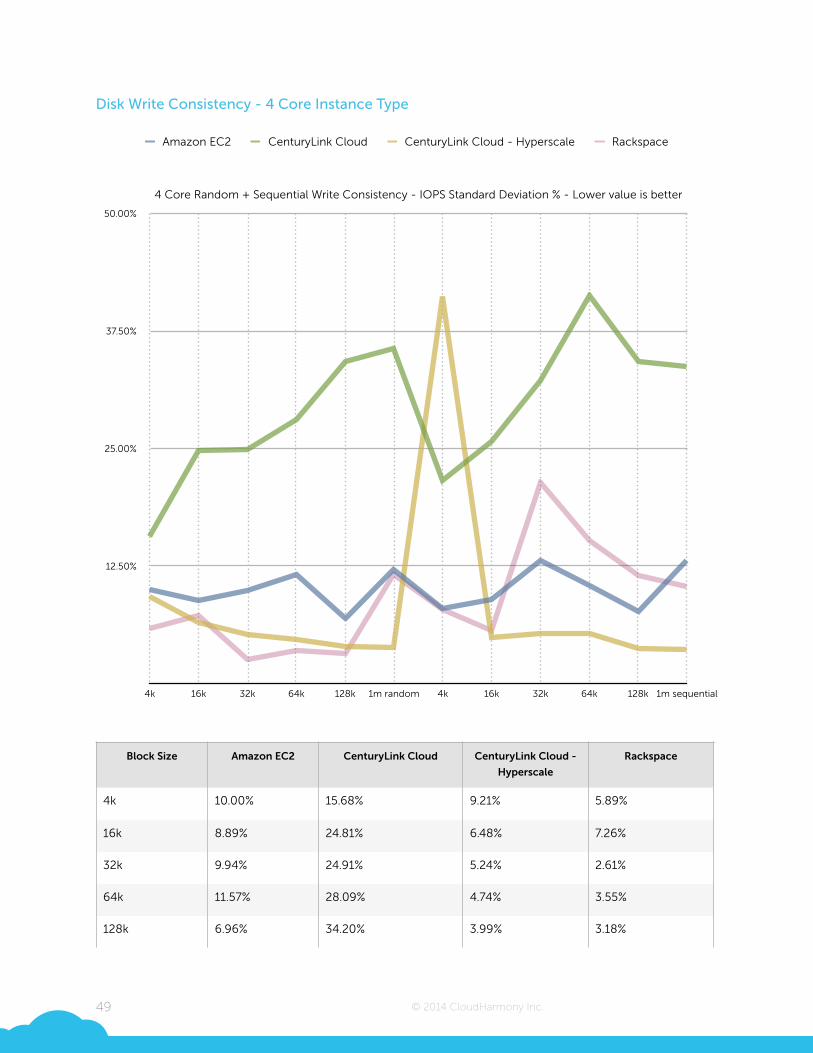
Disk Write Consistency - 4 Core Instance Type
!Block Size Amazon EC2 CenturyLink Cloud CenturyLink Cloud -
Hyperscale
Rackspace
4k 10.00% 15.68% 9.21% 5.89%
16k 8.89% 24.81% 6.48% 7.26%
32k 9.94% 24.91% 5.24% 2.61%
64k 11.57% 28.09% 4.74% 3.55%
128k 6.96% 34.20% 3.99% 3.18%
49
4 Core Random + Sequential Write Consistency - IOPS Standard Deviation % - Lower value is better
12.50%
25.00%
37.50%
50.00%
4k 16k 32k 64k 128k 1m random 4k 16k 32k 64k 128k 1m sequential
Amazon EC2 CenturyLink Cloud CenturyLink Cloud - Hyperscale Rackspace

© 2014 CloudHarmony Inc.
1m random 12.17% 35.63% 3.85% 11.65%
4k 7.94% 21.56% 41.17% 7.92%
16k 8.98% 25.77% 4.95% 5.65%
32k 13.11% 32.22% 5.34% 21.36%
64k 10.47% 41.23% 5.37% 15.24%
128k 7.64% 34.21% 3.75% 11.46%
1m sequential 13.07% 33.72% 3.60% 10.35%
Block Size Amazon EC2 CenturyLink Cloud CenturyLink Cloud -
Hyperscale
Rackspace
50
© 2014 CloudHarmony Inc.
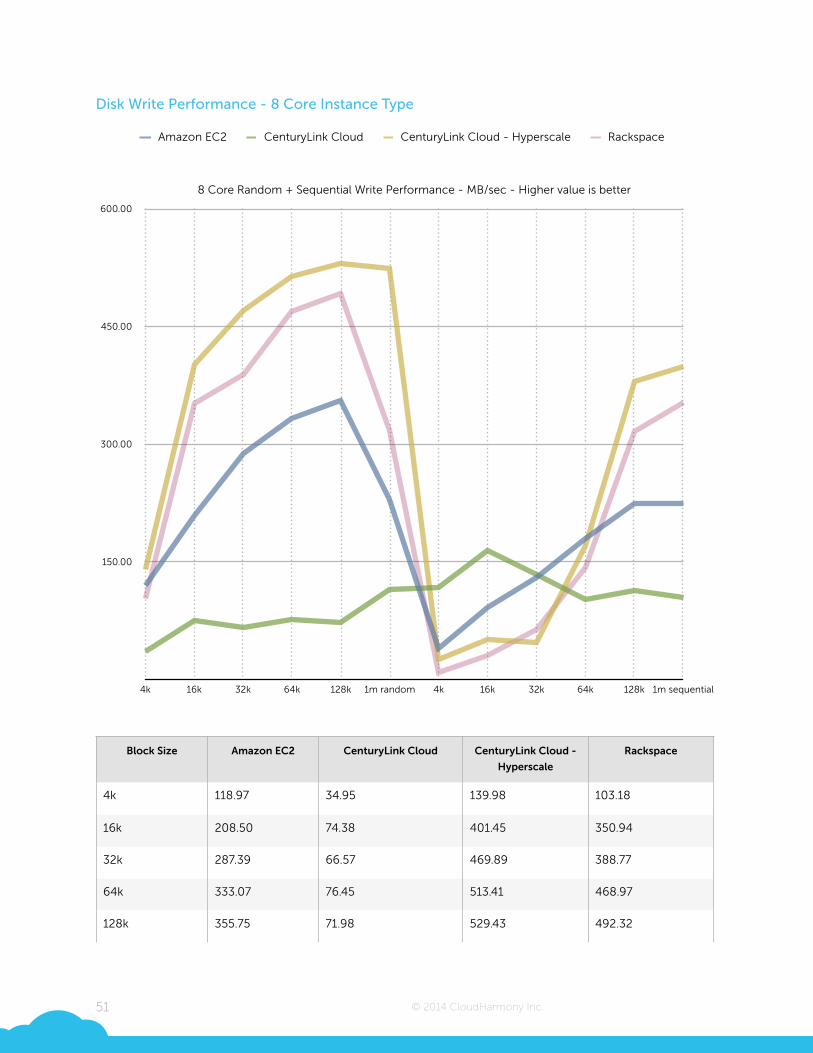
Disk Write Performance - 8 Core Instance Type
!Block Size Amazon EC2 CenturyLink Cloud CenturyLink Cloud -
Hyperscale
Rackspace
4k 118.97 34.95 139.98 103.18
16k 208.50 74.38 401.45 350.94
32k 287.39 66.57 469.89 388.77
64k 333.07 76.45 513.41 468.97
128k 355.75 71.98 529.43 492.32
51
8 Core Random + Sequential Write Performance - MB/sec - Higher value is better
150.00
300.00
450.00
600.00
4k 16k 32k 64k 128k 1m random 4k 16k 32k 64k 128k 1m sequential
Amazon EC2 CenturyLink Cloud CenturyLink Cloud - Hyperscale Rackspace
© 2014 CloudHarmony Inc.
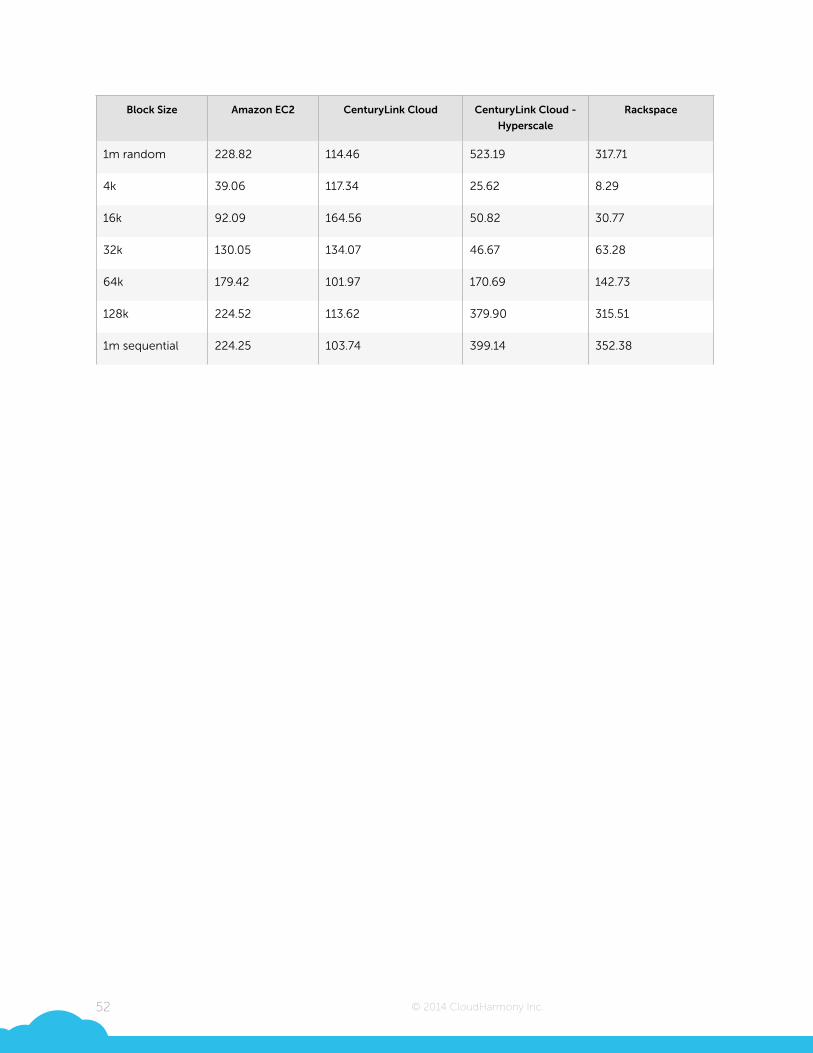
1m random 228.82 114.46 523.19 317.71
4k 39.06 117.34 25.62 8.29
16k 92.09 164.56 50.82 30.77
32k 130.05 134.07 46.67 63.28
64k 179.42 101.97 170.69 142.73
128k 224.52 113.62 379.90 315.51
1m sequential 224.25 103.74 399.14 352.38
Block Size Amazon EC2 CenturyLink Cloud CenturyLink Cloud -
Hyperscale
Rackspace
52
© 2014 CloudHarmony Inc.
Disk Write Consistency - 8 Core Instance Type
!Block Size Amazon EC2 CenturyLink Cloud CenturyLink Cloud -
Hyperscale
Rackspace
4k 10.67% 12.53% 9.45% 7.35%
16k 9.99% 21.10% 5.35% 5.87%
32k 10.22% 21.52% 5.33% 17.57%
64k 8.39% 28.02% 4.79% 12.29%
128k 8.48% 28.96% 3.75% 10.91%
53
8 Core Random + Sequential Write Consistency - IOPS Standard Deviation % - Lower value is better
12.50%
25.00%
37.50%
50.00%
4k 16k 32k 64k 128k 1m random 4k 16k 32k 64k 128k 1m sequential
Amazon EC2 CenturyLink Cloud CenturyLink Cloud - Hyperscale Rackspace
© 2014 CloudHarmony Inc.
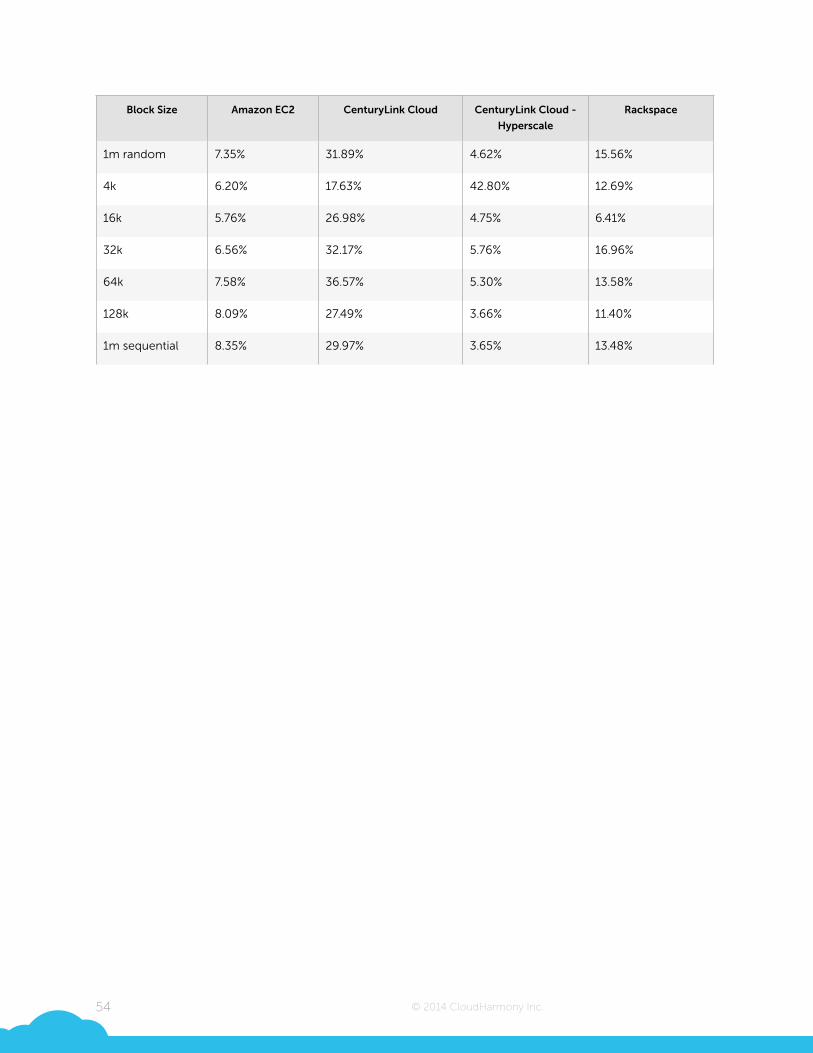
1m random 7.35% 31.89% 4.62% 15.56%
4k 6.20% 17.63% 42.80% 12.69%
16k 5.76% 26.98% 4.75% 6.41%
32k 6.56% 32.17% 5.76% 16.96%
64k 7.58% 36.57% 5.30% 13.58%
128k 8.09% 27.49% 3.66% 11.40%
1m sequential 8.35% 29.97% 3.65% 13.48%
Block Size Amazon EC2 CenturyLink Cloud CenturyLink Cloud -
Hyperscale
Rackspace
54
© 2014 CloudHarmony Inc.
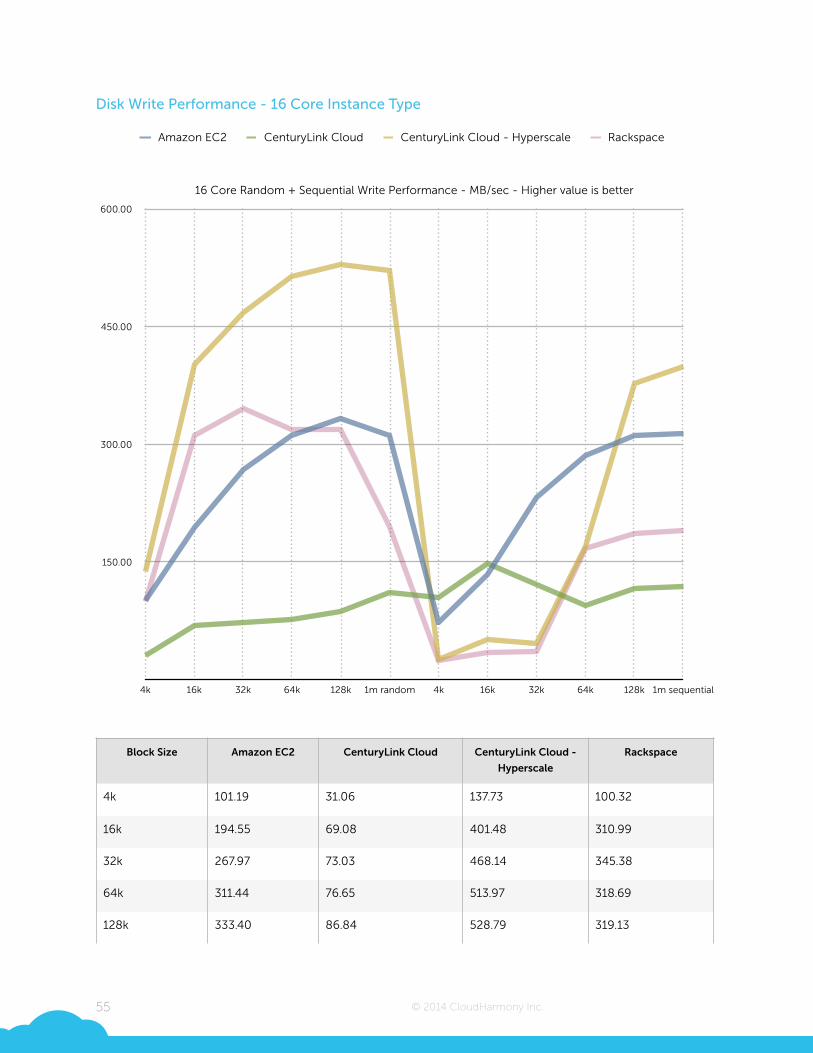
Disk Write Performance - 16 Core Instance Type
!Block Size Amazon EC2 CenturyLink Cloud CenturyLink Cloud -
Hyperscale
Rackspace
4k 101.19 31.06 137.73 100.32
16k 194.55 69.08 401.48 310.99
32k 267.97 73.03 468.14 345.38
64k 311.44 76.65 513.97 318.69
128k 333.40 86.84 528.79 319.13
55
16 Core Random + Sequential Write Performance - MB/sec - Higher value is better
150.00
300.00
450.00
600.00
4k 16k 32k 64k 128k 1m random 4k 16k 32k 64k 128k 1m sequential
Amazon EC2 CenturyLink Cloud CenturyLink Cloud - Hyperscale Rackspace

© 2014 CloudHarmony Inc.
1m random 310.85 110.64 521.58 195.35
4k 73.53 105.22 25.83 23.98
16k 133.76 148.42 50.82 35.40
32k 231.91 120.83 46.50 35.93
64k 286.10 94.15 170.24 166.70
128k 311.16 116.83 377.82 186.30
1m sequential 314.05 118.70 398.76 190.36
Block Size Amazon EC2 CenturyLink Cloud CenturyLink Cloud -
Hyperscale
Rackspace
56
© 2014 CloudHarmony Inc.
Disk Write Consistency - 16 Core Instance Type
!Block Size Amazon EC2 CenturyLink Cloud CenturyLink Cloud -
Hyperscale
Rackspace
4k 5.07% 16.45% 8.77% 16.92%
16k 10.20% 24.72% 5.81% 6.11%
32k 7.77% 27.93% 5.25% 12.83%
64k 6.74% 34.30% 4.40% 8.57%
128k 5.64% 28.57% 3.86% 6.86%
57
16 Core Random + Sequential Write Consistency - IOPS Standard Deviation % - Lower value is better
12.50%
25.00%
37.50%
50.00%
4k 16k 32k 64k 128k 1m random 4k 16k 32k 64k 128k 1m sequential
Amazon EC2 CenturyLink Cloud CenturyLink Cloud - Hyperscale Rackspace

© 2014 CloudHarmony Inc.
!
1m random 5.36% 35.77% 4.18% 10.32%
4k 11.72% 21.69% 41.69% 9.68%
16k 23.83% 32.59% 4.79% 6.88%
32k 3.55% 29.13% 5.43% 5.79%
64k 3.53% 46.51% 5.51% 8.81%
128k 3.60% 28.96% 3.67% 7.97%
1m sequential 3.54% 32.00% 3.56% 12.34%
Block Size Amazon EC2 CenturyLink Cloud CenturyLink Cloud -
Hyperscale
Rackspace
58
© 2014 CloudHarmony Inc.
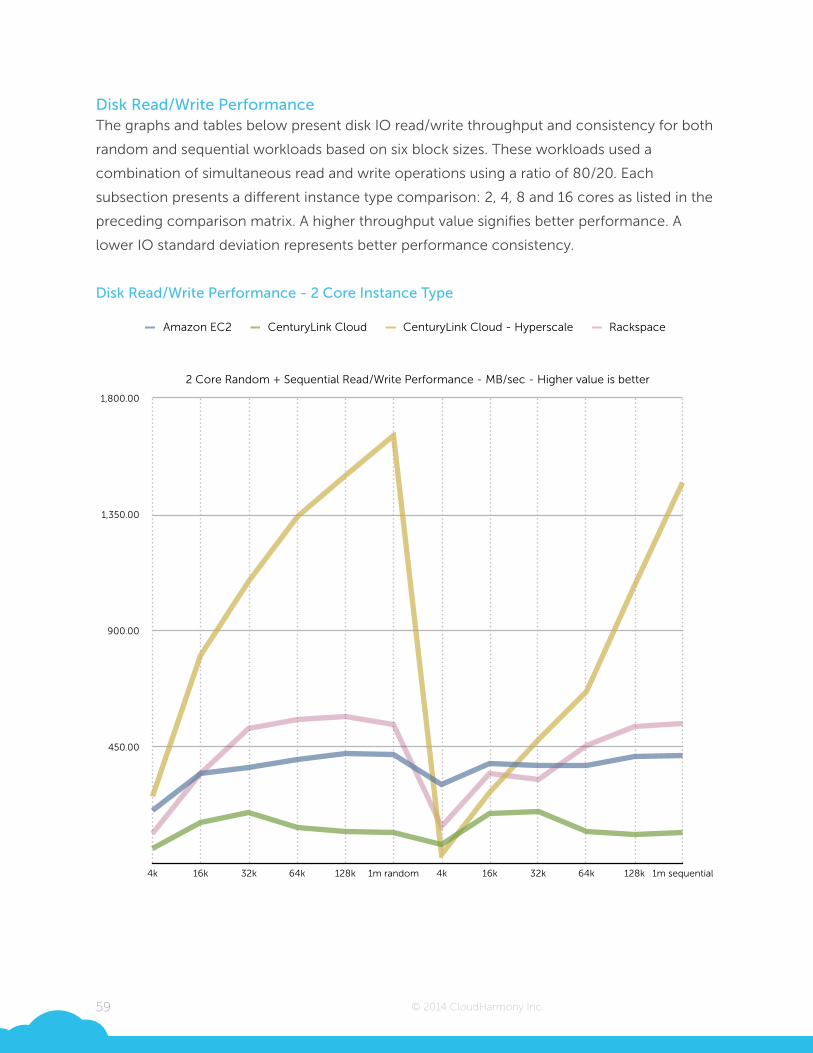
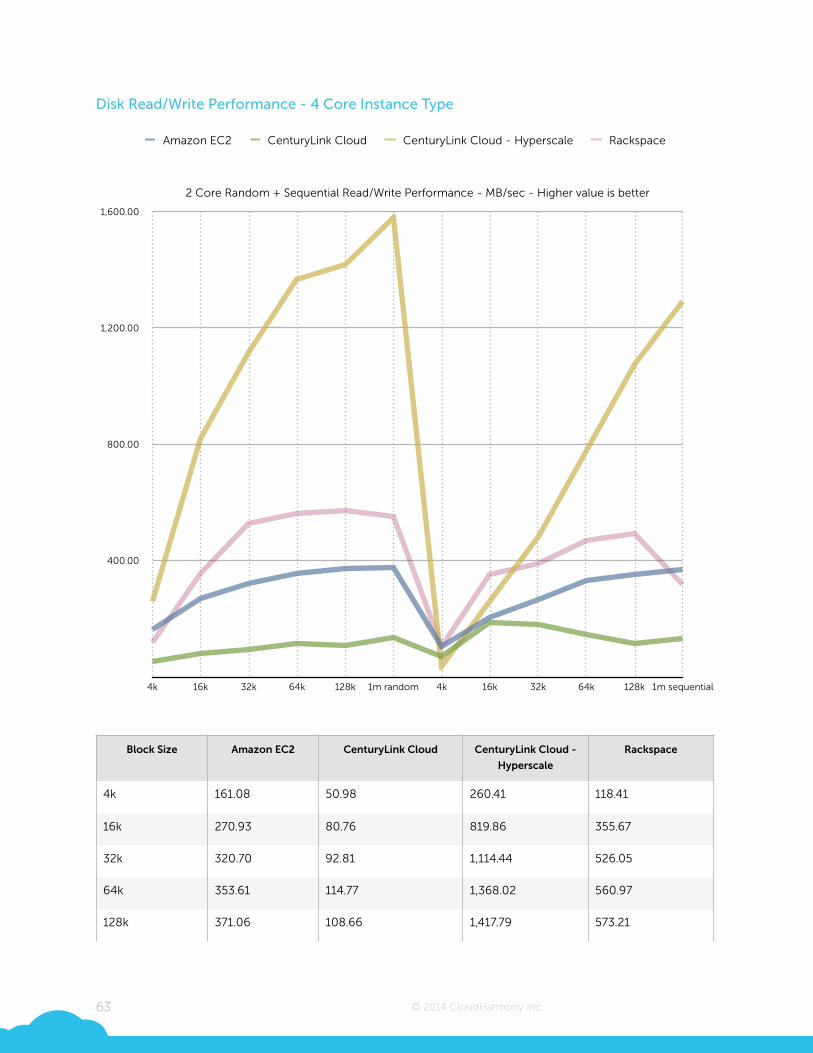
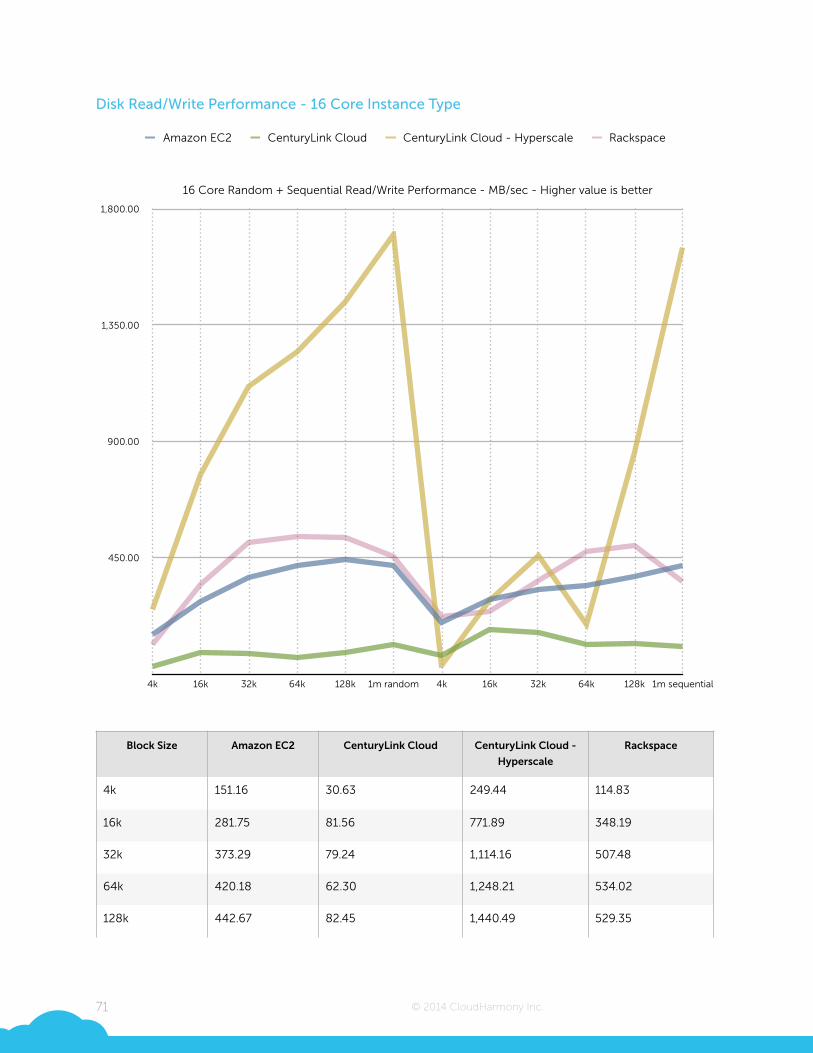
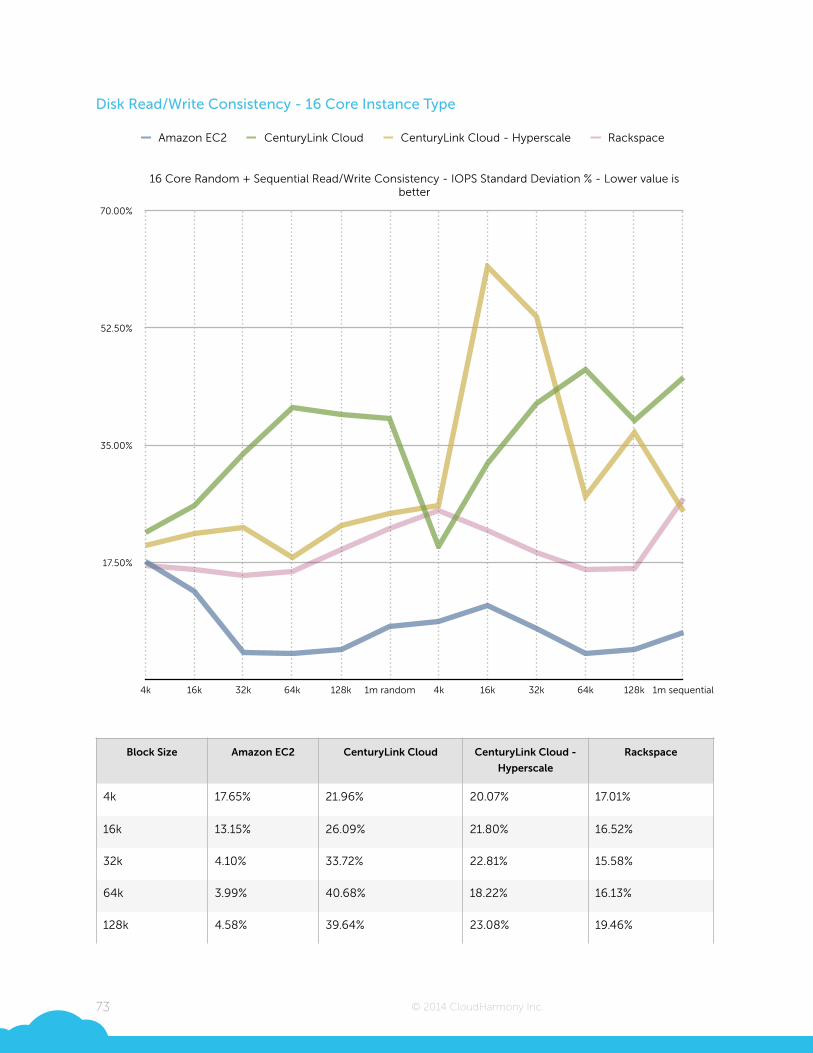
Disk Read/Write Performance The graphs and tables below present disk IO read/write throughput and consistency for both
random and sequential workloads based on six block sizes. These workloads used a
combination of simultaneous read and write operations using a ratio of 80/20. Each
subsection presents a different instance type comparison: 2, 4, 8 and 16 cores as listed in the
preceding comparison matrix. A higher throughput value signifies better performance. A
lower IO standard deviation represents better performance consistency.
!Disk Read/Write Performance - 2 Core Instance Type
!
59
2 Core Random + Sequential Read/Write Performance - MB/sec - Higher value is better
450.00
900.00
1,350.00
1,800.00
4k 16k 32k 64k 128k 1m random 4k 16k 32k 64k 128k 1m sequential
Amazon EC2 CenturyLink Cloud CenturyLink Cloud - Hyperscale Rackspace
© 2014 CloudHarmony Inc.
!!
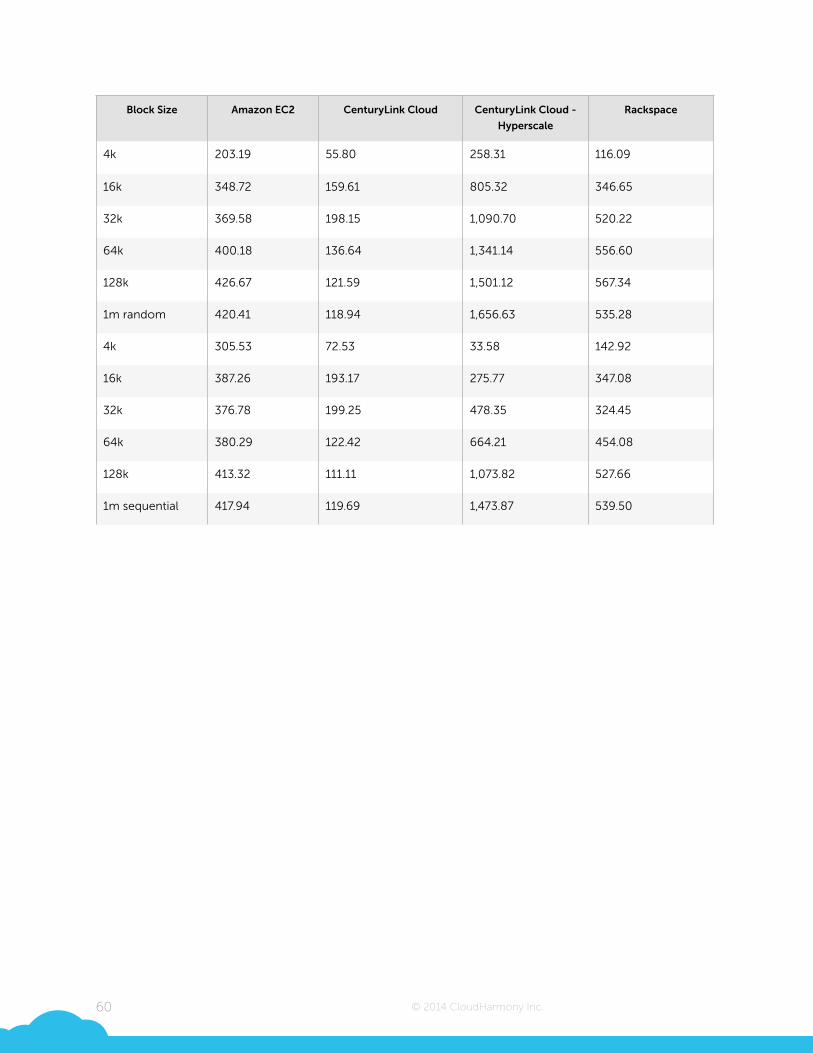
Block Size Amazon EC2 CenturyLink Cloud CenturyLink Cloud -
Hyperscale
Rackspace
4k 203.19 55.80 258.31 116.09
16k 348.72 159.61 805.32 346.65
32k 369.58 198.15 1,090.70 520.22
64k 400.18 136.64 1,341.14 556.60
128k 426.67 121.59 1,501.12 567.34
1m random 420.41 118.94 1,656.63 535.28
4k 305.53 72.53 33.58 142.92
16k 387.26 193.17 275.77 347.08
32k 376.78 199.25 478.35 324.45
64k 380.29 122.42 664.21 454.08
128k 413.32 111.11 1,073.82 527.66
1m sequential 417.94 119.69 1,473.87 539.50
60
© 2014 CloudHarmony Inc.
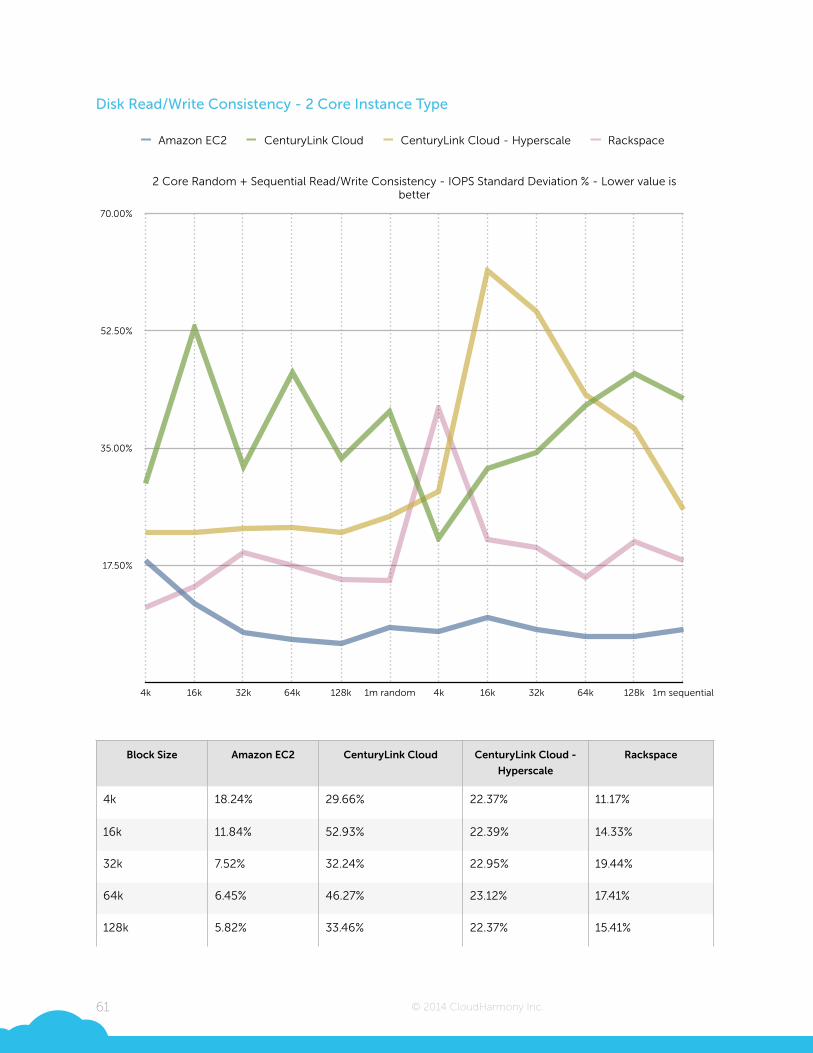
Disk Read/Write Consistency - 2 Core Instance Type
!Block Size Amazon EC2 CenturyLink Cloud CenturyLink Cloud -
Hyperscale
Rackspace
4k 18.24% 29.66% 22.37% 11.17%
16k 11.84% 52.93% 22.39% 14.33%
32k 7.52% 32.24% 22.95% 19.44%
64k 6.45% 46.27% 23.12% 17.41%
128k 5.82% 33.46% 22.37% 15.41%
61
2 Core Random + Sequential Read/Write Consistency - IOPS Standard Deviation % - Lower value is better
17.50%
35.00%
52.50%
70.00%
4k 16k 32k 64k 128k 1m random 4k 16k 32k 64k 128k 1m sequential
Amazon EC2 CenturyLink Cloud CenturyLink Cloud - Hyperscale Rackspace

© 2014 CloudHarmony Inc.
1m random 8.24% 40.42% 24.73% 15.28%
4k 7.68% 21.49% 28.49% 40.95%
16k 9.76% 31.95% 61.54% 21.42%
32k 7.89% 34.31% 55.32% 20.23%
64k 6.81% 41.37% 43.00% 15.75%
128k 6.89% 46.07% 37.95% 21.04%
1m sequential 7.86% 42.44% 25.80% 18.20%
Block Size Amazon EC2 CenturyLink Cloud CenturyLink Cloud -
Hyperscale
Rackspace
62
© 2014 CloudHarmony Inc.
Disk Read/Write Performance - 4 Core Instance Type
!Block Size Amazon EC2 CenturyLink Cloud CenturyLink Cloud -
Hyperscale
Rackspace
4k 161.08 50.98 260.41 118.41
16k 270.93 80.76 819.86 355.67
32k 320.70 92.81 1,114.44 526.05
64k 353.61 114.77 1,368.02 560.97
128k 371.06 108.66 1,417.79 573.21
63
2 Core Random + Sequential Read/Write Performance - MB/sec - Higher value is better
400.00
800.00
1,200.00
1,600.00
4k 16k 32k 64k 128k 1m random 4k 16k 32k 64k 128k 1m sequential
Amazon EC2 CenturyLink Cloud CenturyLink Cloud - Hyperscale Rackspace

© 2014 CloudHarmony Inc.
1m random 377.25 133.89 1,580.24 550.53
4k 104.50 70.02 33.74 103.18
16k 204.21 187.02 258.33 350.94
32k 267.45 179.45 481.01 388.77
64k 331.78 144.29 779.47 468.97
128k 350.26 114.32 1,073.99 492.32
1m sequential 367.82 132.45 1,292.20 317.71
Block Size Amazon EC2 CenturyLink Cloud CenturyLink Cloud -
Hyperscale
Rackspace
64
© 2014 CloudHarmony Inc.
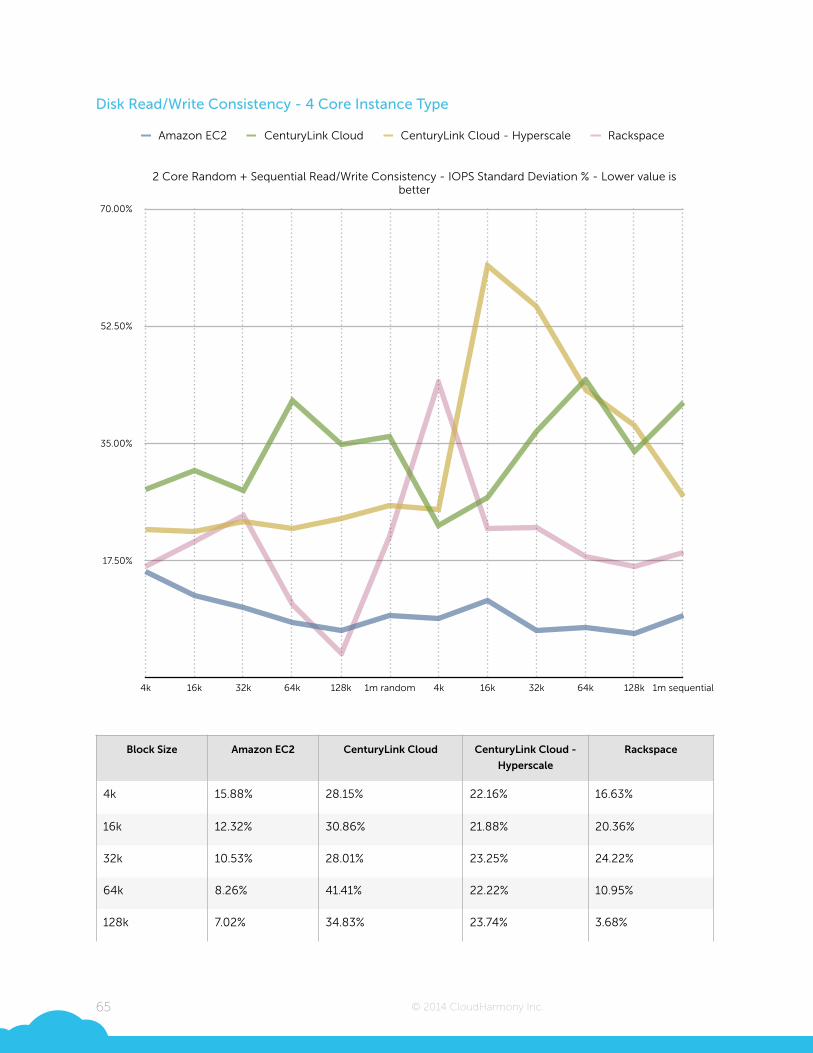
Disk Read/Write Consistency - 4 Core Instance Type
!Block Size Amazon EC2 CenturyLink Cloud CenturyLink Cloud -
Hyperscale
Rackspace
4k 15.88% 28.15% 22.16% 16.63%
16k 12.32% 30.86% 21.88% 20.36%
32k 10.53% 28.01% 23.25% 24.22%
64k 8.26% 41.41% 22.22% 10.95%
128k 7.02% 34.83% 23.74% 3.68%
65
2 Core Random + Sequential Read/Write Consistency - IOPS Standard Deviation % - Lower value is better
17.50%
35.00%
52.50%
70.00%
4k 16k 32k 64k 128k 1m random 4k 16k 32k 64k 128k 1m sequential
Amazon EC2 CenturyLink Cloud CenturyLink Cloud - Hyperscale Rackspace

© 2014 CloudHarmony Inc.
1m random 9.33% 36.03% 25.69% 21.01%
4k 8.85% 22.65% 25.11% 44.01%
16k 11.52% 26.82% 61.45% 22.34%
32k 6.99% 36.75% 55.43% 22.43%
64k 7.57% 44.43% 43.00% 18.05%
128k 6.58% 33.81% 37.58% 16.58%
1m sequential 9.23% 41.11% 27.06% 18.66%
Block Size Amazon EC2 CenturyLink Cloud CenturyLink Cloud -
Hyperscale
Rackspace
66
© 2014 CloudHarmony Inc.
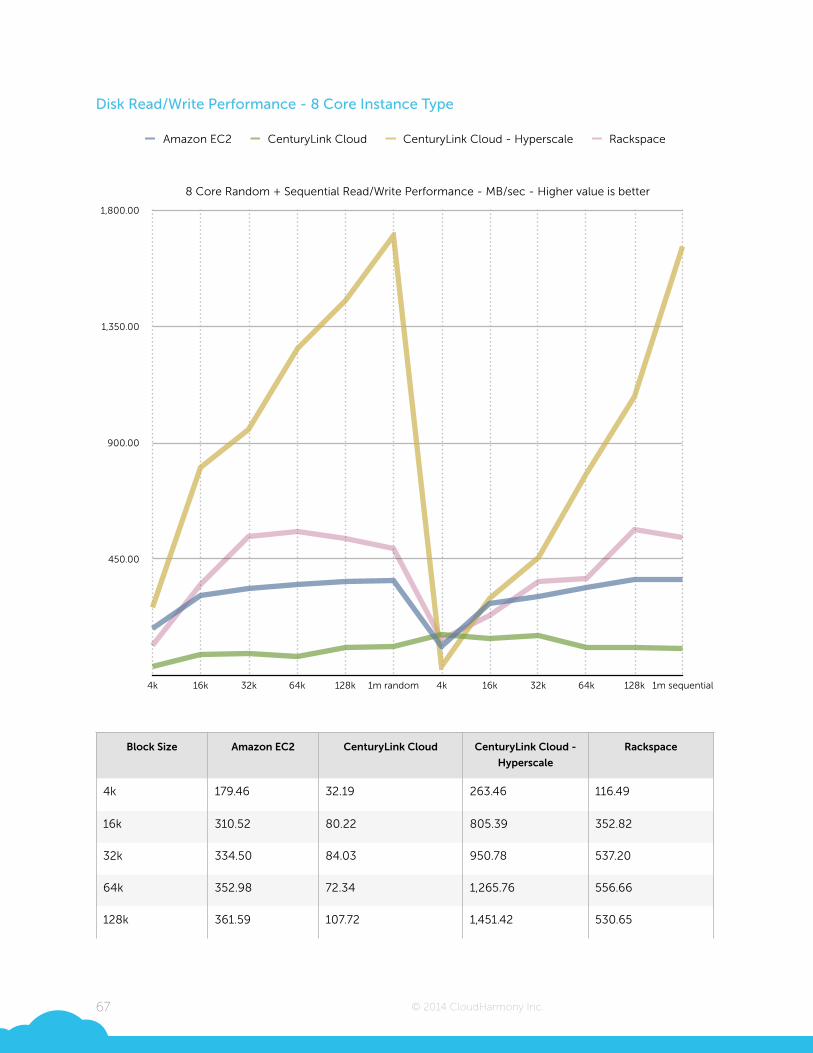
Disk Read/Write Performance - 8 Core Instance Type
!Block Size Amazon EC2 CenturyLink Cloud CenturyLink Cloud -
Hyperscale
Rackspace
4k 179.46 32.19 263.46 116.49
16k 310.52 80.22 805.39 352.82
32k 334.50 84.03 950.78 537.20
64k 352.98 72.34 1,265.76 556.66
128k 361.59 107.72 1,451.42 530.65
67
8 Core Random + Sequential Read/Write Performance - MB/sec - Higher value is better
450.00
900.00
1,350.00
1,800.00
4k 16k 32k 64k 128k 1m random 4k 16k 32k 64k 128k 1m sequential
Amazon EC2 CenturyLink Cloud CenturyLink Cloud - Hyperscale Rackspace

© 2014 CloudHarmony Inc.
1m random 368.06 111.92 1,702.41 491.79
4k 112.61 157.09 33.57 140.20
16k 278.58 142.31 295.38 231.73
32k 306.80 154.86 456.53 362.27
64k 340.93 109.05 782.55 373.62
128k 369.53 108.34 1,077.69 562.62
1m sequential 370.95 104.56 1,660.91 533.42
Block Size Amazon EC2 CenturyLink Cloud CenturyLink Cloud -
Hyperscale
Rackspace
68
© 2014 CloudHarmony Inc.
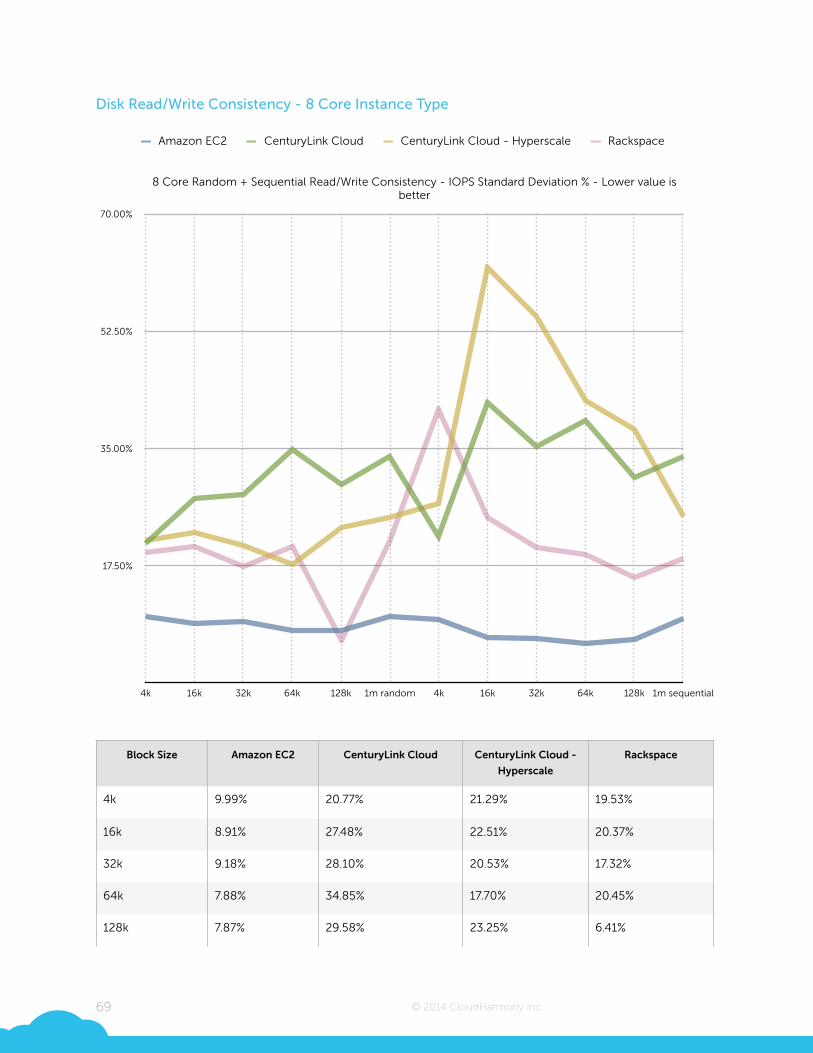
Disk Read/Write Consistency - 8 Core Instance Type
!Block Size Amazon EC2 CenturyLink Cloud CenturyLink Cloud -
Hyperscale
Rackspace
4k 9.99% 20.77% 21.29% 19.53%
16k 8.91% 27.48% 22.51% 20.37%
32k 9.18% 28.10% 20.53% 17.32%
64k 7.88% 34.85% 17.70% 20.45%
128k 7.87% 29.58% 23.25% 6.41%
69
8 Core Random + Sequential Read/Write Consistency - IOPS Standard Deviation % - Lower value is better
17.50%
35.00%
52.50%
70.00%
4k 16k 32k 64k 128k 1m random 4k 16k 32k 64k 128k 1m sequential
Amazon EC2 CenturyLink Cloud CenturyLink Cloud - Hyperscale Rackspace

© 2014 CloudHarmony Inc.
1m random 9.88% 33.82% 24.74% 21.09%
4k 9.53% 21.94% 26.75% 40.89%
16k 6.74% 41.88% 62.06% 24.76%
32k 6.70% 35.25% 54.63% 20.23%
64k 5.95% 39.12% 42.12% 19.15%
128k 6.49% 30.67% 37.89% 15.71%
1m sequential 9.58% 33.84% 24.86% 18.65%
Block Size Amazon EC2 CenturyLink Cloud CenturyLink Cloud -
Hyperscale
Rackspace
70
© 2014 CloudHarmony Inc.
Disk Read/Write Performance - 16 Core Instance Type
!Block Size Amazon EC2 CenturyLink Cloud CenturyLink Cloud -
Hyperscale
Rackspace
4k 151.16 30.63 249.44 114.83
16k 281.75 81.56 771.89 348.19
32k 373.29 79.24 1,114.16 507.48
64k 420.18 62.30 1,248.21 534.02
128k 442.67 82.45 1,440.49 529.35
71
16 Core Random + Sequential Read/Write Performance - MB/sec - Higher value is better
450.00
900.00
1,350.00
1,800.00
4k 16k 32k 64k 128k 1m random 4k 16k 32k 64k 128k 1m sequential
Amazon EC2 CenturyLink Cloud CenturyLink Cloud - Hyperscale Rackspace

© 2014 CloudHarmony Inc.
1m random 420.10 112.46 1,701.49 452.98
4k 198.44 73.12 32.73 222.08
16k 287.78 171.68 285.00 241.86
32k 326.52 160.21 457.95 361.58
64k 343.63 115.43 193.22 475.46
128k 378.63 118.20 858.20 497.41
1m sequential 420.73 105.51 1,650.22 358.74
Block Size Amazon EC2 CenturyLink Cloud CenturyLink Cloud -
Hyperscale
Rackspace
72
© 2014 CloudHarmony Inc.
Disk Read/Write Consistency - 16 Core Instance Type
!Block Size Amazon EC2 CenturyLink Cloud CenturyLink Cloud -
Hyperscale
Rackspace
4k 17.65% 21.96% 20.07% 17.01%
16k 13.15% 26.09% 21.80% 16.52%
32k 4.10% 33.72% 22.81% 15.58%
64k 3.99% 40.68% 18.22% 16.13%
128k 4.58% 39.64% 23.08% 19.46%
73
16 Core Random + Sequential Read/Write Consistency - IOPS Standard Deviation % - Lower value is better
17.50%
35.00%
52.50%
70.00%
4k 16k 32k 64k 128k 1m random 4k 16k 32k 64k 128k 1m sequential
Amazon EC2 CenturyLink Cloud CenturyLink Cloud - Hyperscale Rackspace

© 2014 CloudHarmony Inc.
!
1m random 7.97% 39.07% 24.83% 22.62%
4k 8.73% 19.93% 25.97% 25.29%
16k 11.08% 32.32% 61.67% 22.32%
32k 7.70% 41.23% 54.27% 19.09%
64k 4.02% 46.39% 27.33% 16.49%
128k 4.49% 38.65% 36.86% 16.59%
1m sequential 7.15% 45.13% 25.08% 27.01%
Block Size Amazon EC2 CenturyLink Cloud CenturyLink Cloud -
Hyperscale
Rackspace
74
© 2014 CloudHarmony Inc.
Disk Performance Summary Metrics We created 3 summary metrics to represent disk performance. Each of these is derived from
the preceding benchmark results convert to ratios relative to the reference system. A total of
36 IO test workloads are included in these metrics including both random and sequential
access; read, write and read/write (80/20) workloads; and 4k, 16k, 32k, 64k, 128k and 1m
block sizes. The reference system was a bare metal Dell M610 server with a Seagate SAS 2.0
6Gb/s 10K hard drive (model ST9146803SS) dedicated for testing.
!!
75
© 2014 CloudHarmony Inc.
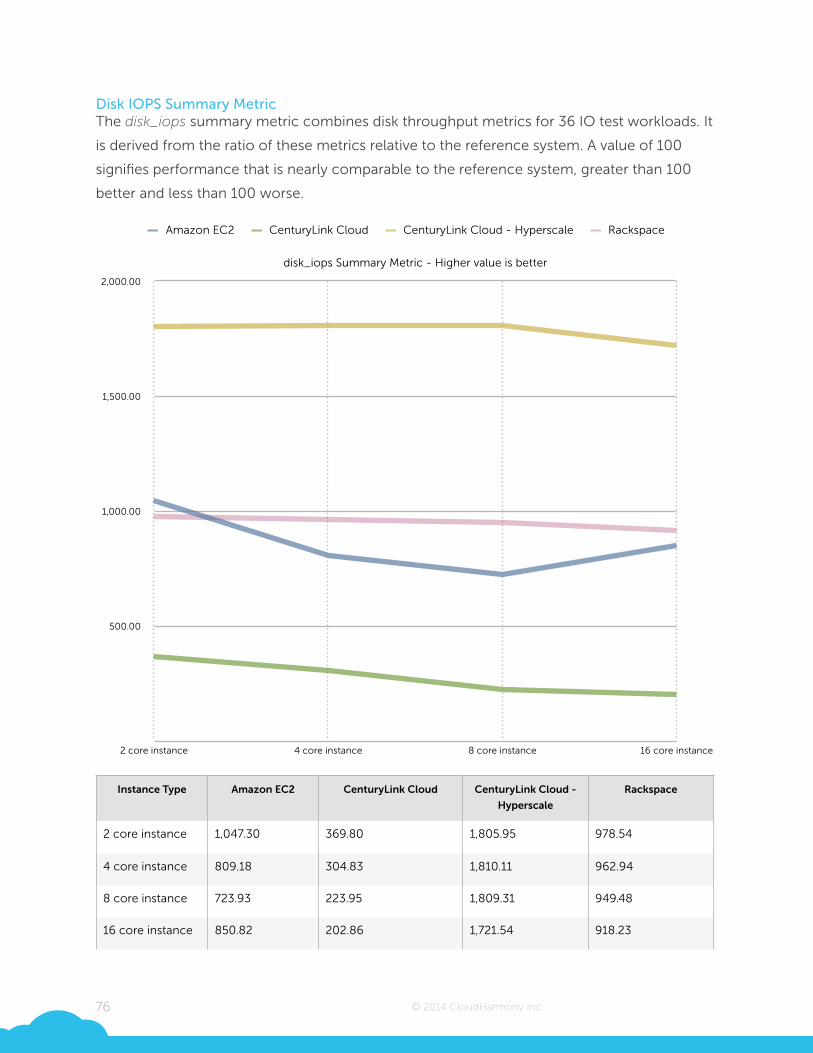
Disk IOPS Summary Metric The disk_iops summary metric combines disk throughput metrics for 36 IO test workloads. It
is derived from the ratio of these metrics relative to the reference system. A value of 100
signifies performance that is nearly comparable to the reference system, greater than 100
better and less than 100 worse.
Instance Type Amazon EC2 CenturyLink Cloud CenturyLink Cloud -
Hyperscale
Rackspace
2 core instance 1,047.30 369.80 1,805.95 978.54
4 core instance 809.18 304.83 1,810.11 962.94
8 core instance 723.93 223.95 1,809.31 949.48
16 core instance 850.82 202.86 1,721.54 918.23
76
disk_iops Summary Metric - Higher value is better
500.00
1,000.00
1,500.00
2,000.00
2 core instance 4 core instance 8 core instance 16 core instance
Amazon EC2 CenturyLink Cloud CenturyLink Cloud - Hyperscale Rackspace
© 2014 CloudHarmony Inc.
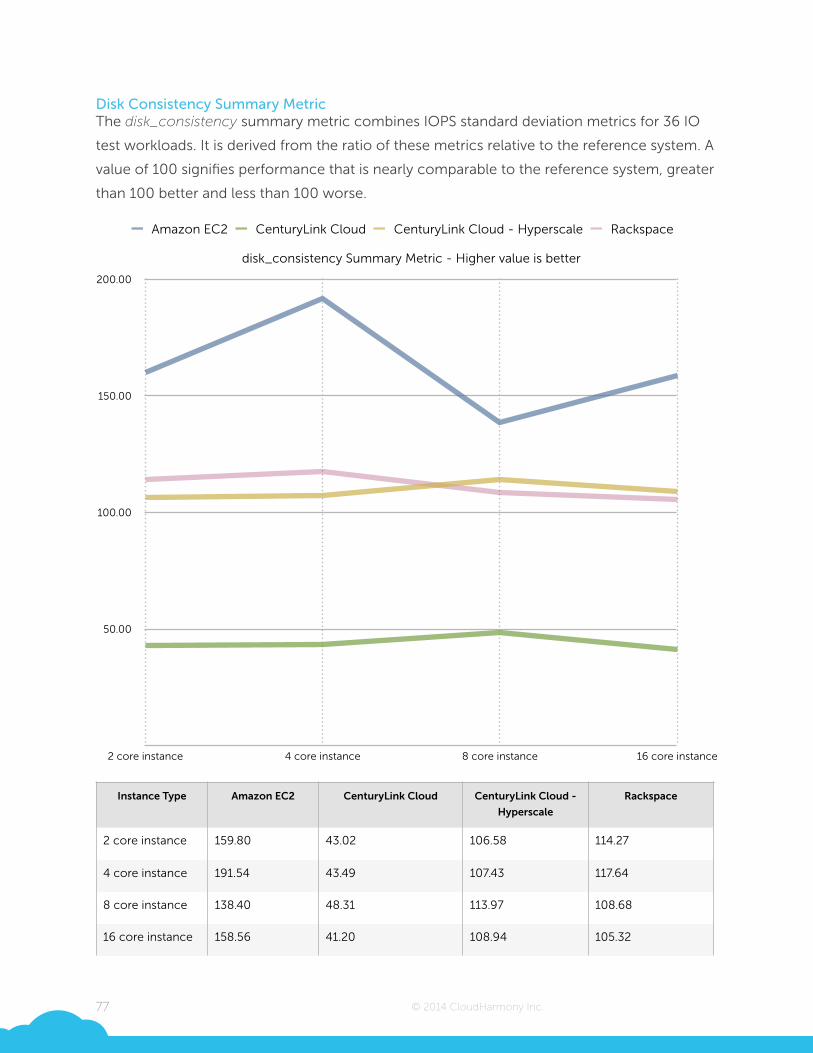
Disk Consistency Summary Metric The disk_consistency summary metric combines IOPS standard deviation metrics for 36 IO
test workloads. It is derived from the ratio of these metrics relative to the reference system. A
value of 100 signifies performance that is nearly comparable to the reference system, greater
than 100 better and less than 100 worse.
Instance Type Amazon EC2 CenturyLink Cloud CenturyLink Cloud -
Hyperscale
Rackspace
2 core instance 159.80 43.02 106.58 114.27
4 core instance 191.54 43.49 107.43 117.64
8 core instance 138.40 48.31 113.97 108.68
16 core instance 158.56 41.20 108.94 105.32
77
disk_consistency Summary Metric - Higher value is better
50.00
100.00
150.00
200.00
2 core instance 4 core instance 8 core instance 16 core instance
Amazon EC2 CenturyLink Cloud CenturyLink Cloud - Hyperscale Rackspace
© 2014 CloudHarmony Inc.
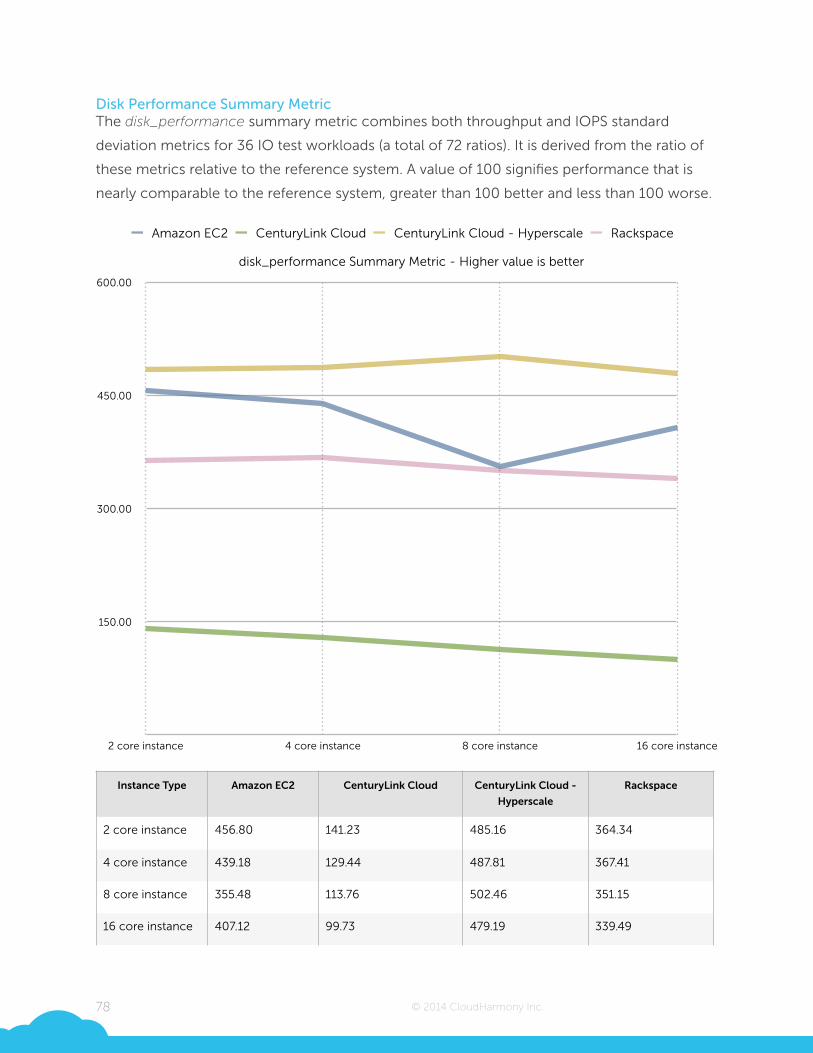
Disk Performance Summary Metric The disk_performance summary metric combines both throughput and IOPS standard
deviation metrics for 36 IO test workloads (a total of 72 ratios). It is derived from the ratio of
these metrics relative to the reference system. A value of 100 signifies performance that is
nearly comparable to the reference system, greater than 100 better and less than 100 worse.
Instance Type Amazon EC2 CenturyLink Cloud CenturyLink Cloud -
Hyperscale
Rackspace
2 core instance 456.80 141.23 485.16 364.34
4 core instance 439.18 129.44 487.81 367.41
8 core instance 355.48 113.76 502.46 351.15
16 core instance 407.12 99.73 479.19 339.49
78
disk_performance Summary Metric - Higher value is better
150.00
300.00
450.00
600.00
2 core instance 4 core instance 8 core instance 16 core instance
Amazon EC2 CenturyLink Cloud CenturyLink Cloud - Hyperscale Rackspace
© 2014 CloudHarmony Inc.
Disk Performance Comments In these test results each compute service demonstrated strengths and weaknesses. Amazon
EC2 was the most consistent, but not the fastest. This might be attributed to possible non-
use of a Raid controller which can increase IO latencies. Additionally, EC2 disk throughput
could likely be improved through operating system managed Raid on the 2 SSD local drives
assigned to each c3 instance. CenturyLink Cloud Hyperscale provided significantly faster read
throughput compared to the other services due in no small part to its use of Raid using many
physical disks. Write throughput was also a top performer but more similar to the other
services. IO consistency was consistently lower than Amazon EC2 likely due to Raid
overhead. Non-Hyperscale CenturyLink performance performed slower and less predictably
than any of the other services. This may be attributed to it being a external, networked
storage platform as opposed to local SSD. Rackspace Cloud performance was mixed with
read throughput falling slightly above Amazon EC2 while consistency lagged behind.
79
© 2014 CloudHarmony Inc.
Memory Performance Memory holds data that can be very quickly accessed and updated. Every running application
uses and lives in memory, so memory performance affects the performance of all workloads
to some extent. It is faster to access data stored in memory than data stored on disk, so
memory is often used to optimize disk operations. For example, database servers sometimes
use memory to cache queries, or to buffer writes. Newer CPU models often have better
memory performance due to faster chipsets and buses.
!We used the STREAM benchmark to measure memory performance. STREAM is a simple
synthetic benchmark program that measures sustainable memory bandwidth. The STREAM
benchmark consists of four tests:
• Copy - measures transfer rates in the absence of arithmetic
• Scale - adds a simple arithmetic operation
• Add - adds a third operand to allow multiple load/store ports on vector machines to be
tested
• Triad - allows chained/overlapped/fused multiply/add operations
!The proceeding results represent sustainable bandwidth for each of these tests in gigabytes
per second (GB/s). A higher value represents better performance.
!
80
© 2014 CloudHarmony Inc.
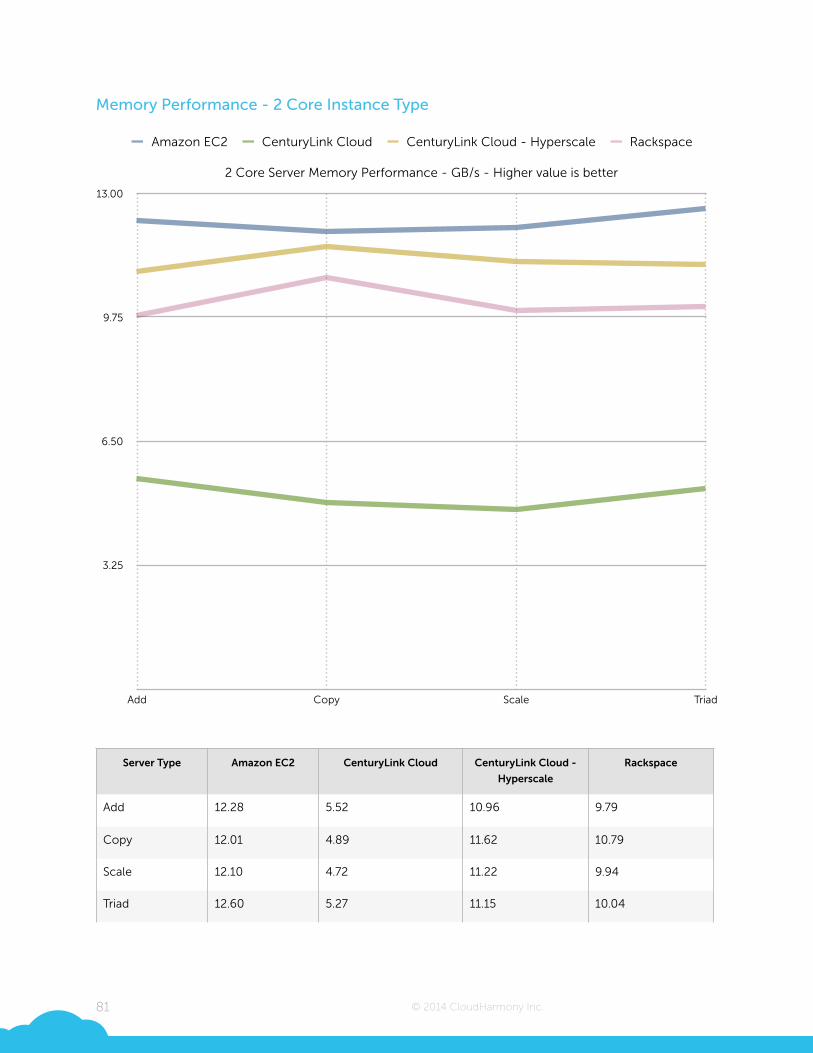
Memory Performance - 2 Core Instance Type
!Server Type Amazon EC2 CenturyLink Cloud CenturyLink Cloud -
Hyperscale
Rackspace
Add 12.28 5.52 10.96 9.79
Copy 12.01 4.89 11.62 10.79
Scale 12.10 4.72 11.22 9.94
Triad 12.60 5.27 11.15 10.04
81
2 Core Server Memory Performance - GB/s - Higher value is better
3.25
6.50
9.75
13.00
Add Copy Scale Triad
Amazon EC2 CenturyLink Cloud CenturyLink Cloud - Hyperscale Rackspace

© 2014 CloudHarmony Inc.
Memory Performance - 4 Core Instance Type
!
!
Server Type Amazon EC2 CenturyLink Cloud CenturyLink Cloud -
Hyperscale
Rackspace
Add 12.95 12.77 12.27 10.11
Copy 14.07 14.18 12.39 9.76
Scale 12.82 13.13 12.22 9.75
Triad 13.16 12.88 12.40 10.09
82
4 Core Server Memory Performance - GB/s - Higher value is better
3.75
7.50
11.25
15.00
Add Copy Scale Triad
Amazon EC2 CenturyLink Cloud CenturyLink Cloud - Hyperscale Rackspace
© 2014 CloudHarmony Inc.
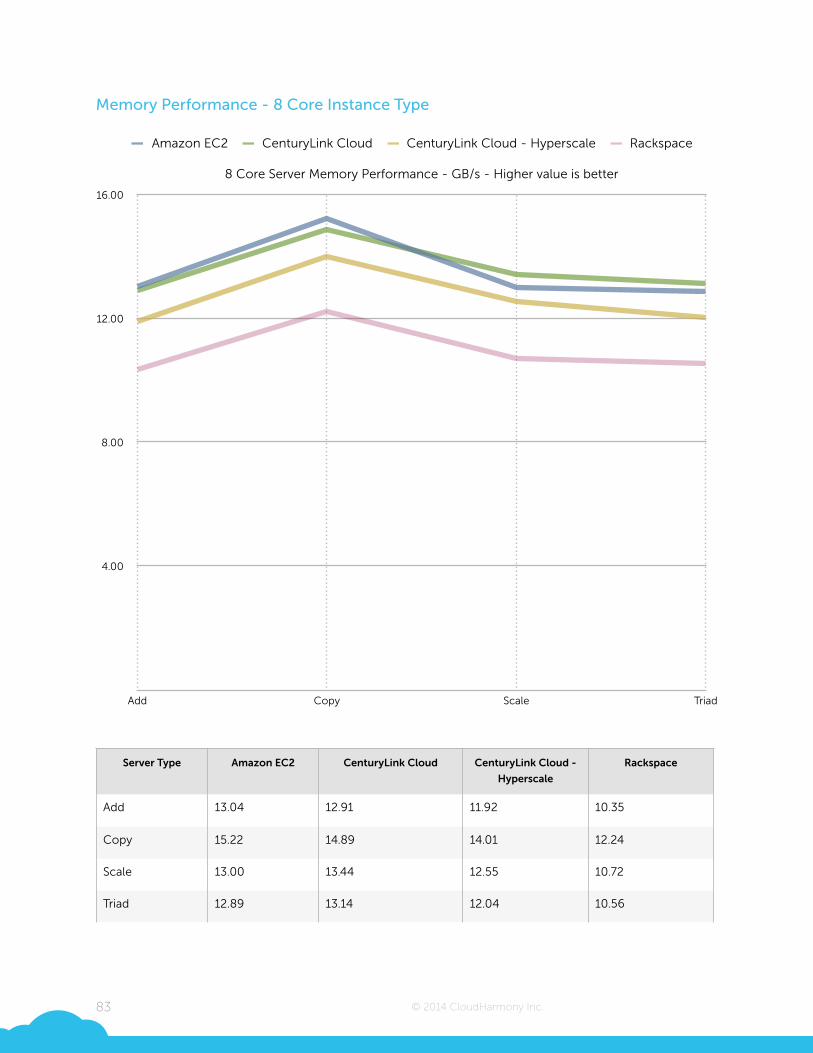
Memory Performance - 8 Core Instance Type
!
!
Server Type Amazon EC2 CenturyLink Cloud CenturyLink Cloud -
Hyperscale
Rackspace
Add 13.04 12.91 11.92 10.35
Copy 15.22 14.89 14.01 12.24
Scale 13.00 13.44 12.55 10.72
Triad 12.89 13.14 12.04 10.56
83
8 Core Server Memory Performance - GB/s - Higher value is better
4.00
8.00
12.00
16.00
Add Copy Scale Triad
Amazon EC2 CenturyLink Cloud CenturyLink Cloud - Hyperscale Rackspace
© 2014 CloudHarmony Inc.
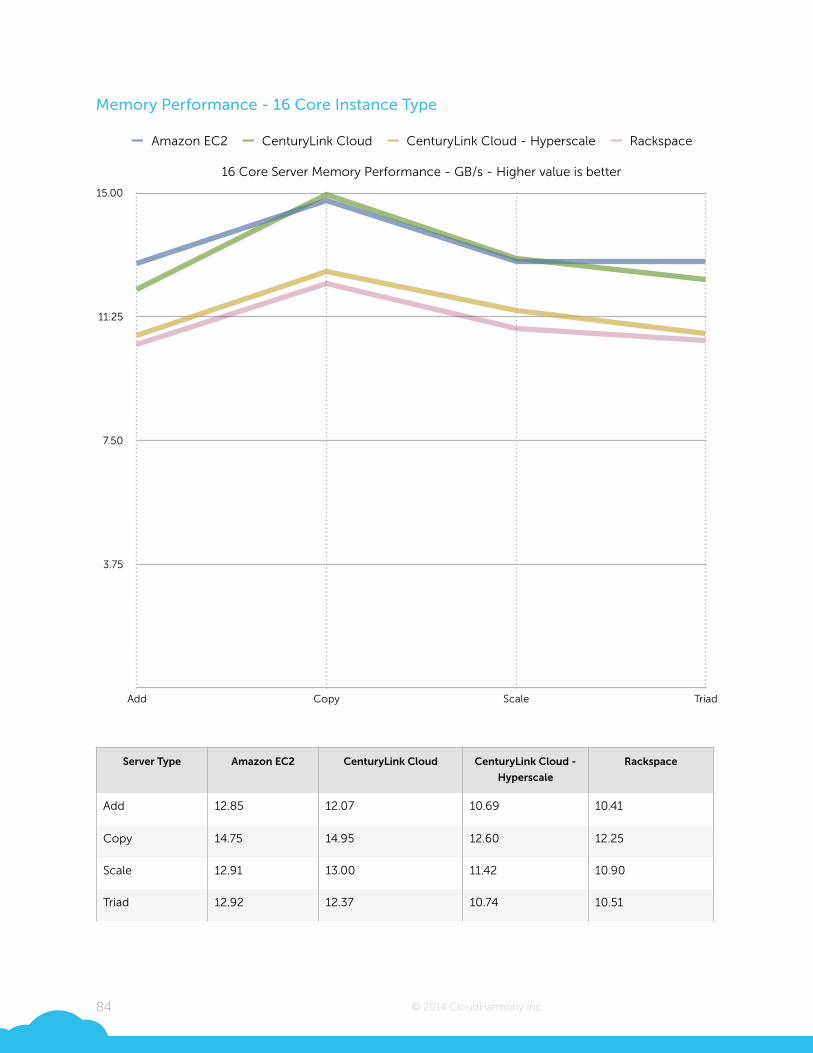
Memory Performance - 16 Core Instance Type
!Server Type Amazon EC2 CenturyLink Cloud CenturyLink Cloud -
Hyperscale
Rackspace
Add 12.85 12.07 10.69 10.41
Copy 14.75 14.95 12.60 12.25
Scale 12.91 13.00 11.42 10.90
Triad 12.92 12.37 10.74 10.51
84
16 Core Server Memory Performance - GB/s - Higher value is better
3.75
7.50
11.25
15.00
Add Copy Scale Triad
Amazon EC2 CenturyLink Cloud CenturyLink Cloud - Hyperscale Rackspace
© 2014 CloudHarmony Inc.
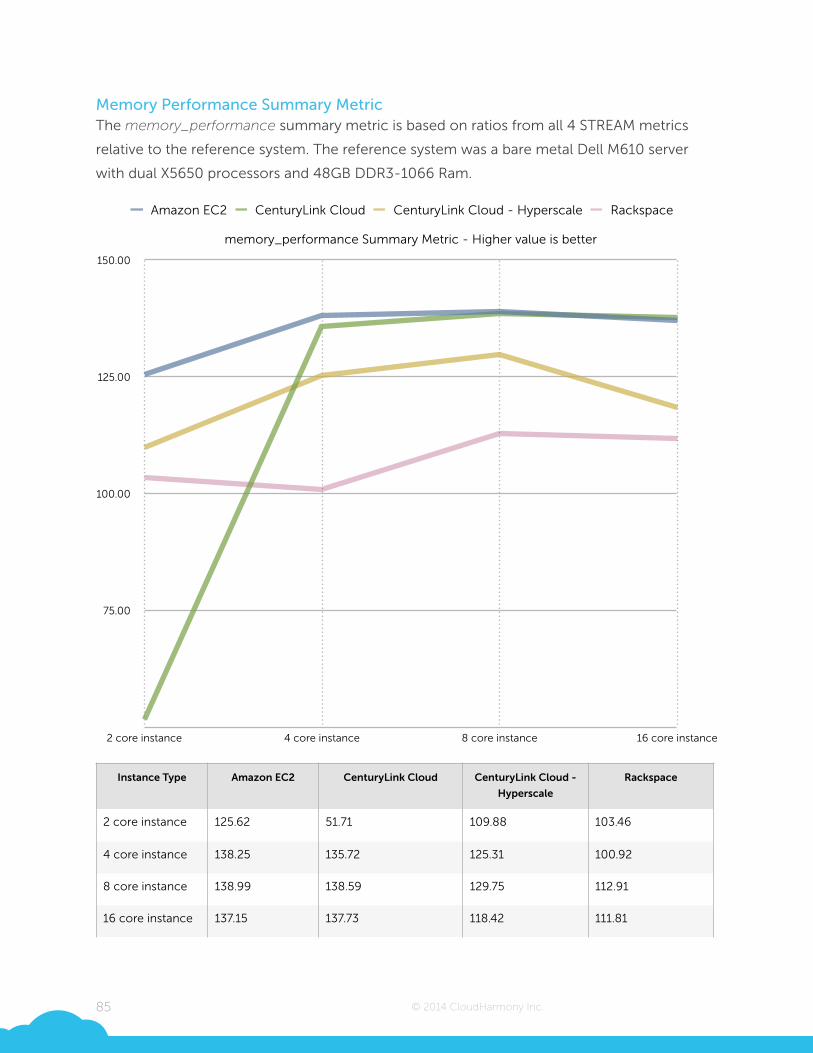
Memory Performance Summary Metric The memory_performance summary metric is based on ratios from all 4 STREAM metrics
relative to the reference system. The reference system was a bare metal Dell M610 server
with dual X5650 processors and 48GB DDR3-1066 Ram.
Instance Type Amazon EC2 CenturyLink Cloud CenturyLink Cloud -
Hyperscale
Rackspace
2 core instance 125.62 51.71 109.88 103.46
4 core instance 138.25 135.72 125.31 100.92
8 core instance 138.99 138.59 129.75 112.91
16 core instance 137.15 137.73 118.42 111.81
85
memory_performance Summary Metric - Higher value is better
75.00
100.00
125.00
150.00
2 core instance 4 core instance 8 core instance 16 core instance
Amazon EC2 CenturyLink Cloud CenturyLink Cloud - Hyperscale Rackspace

© 2014 CloudHarmony Inc.
Memory Performance Comments All 4 services performed well in this testing. Performance for all was consistently above that
of the summary metric reference system. Amazon EC2’s use of newer and faster 2.8 GHz Ivy
Bridge processors gave it a slight edge over other services, while Rackspace Cloud’s use of
prior generation Sandy Bridge 2.6 GHz processors caused it to lag slightly behind.
CenturyLink Cloud Hyperscale based on newer 2.6 GHz Ivy Bridge processors fell in the
middle.
86
© 2014 CloudHarmony Inc.
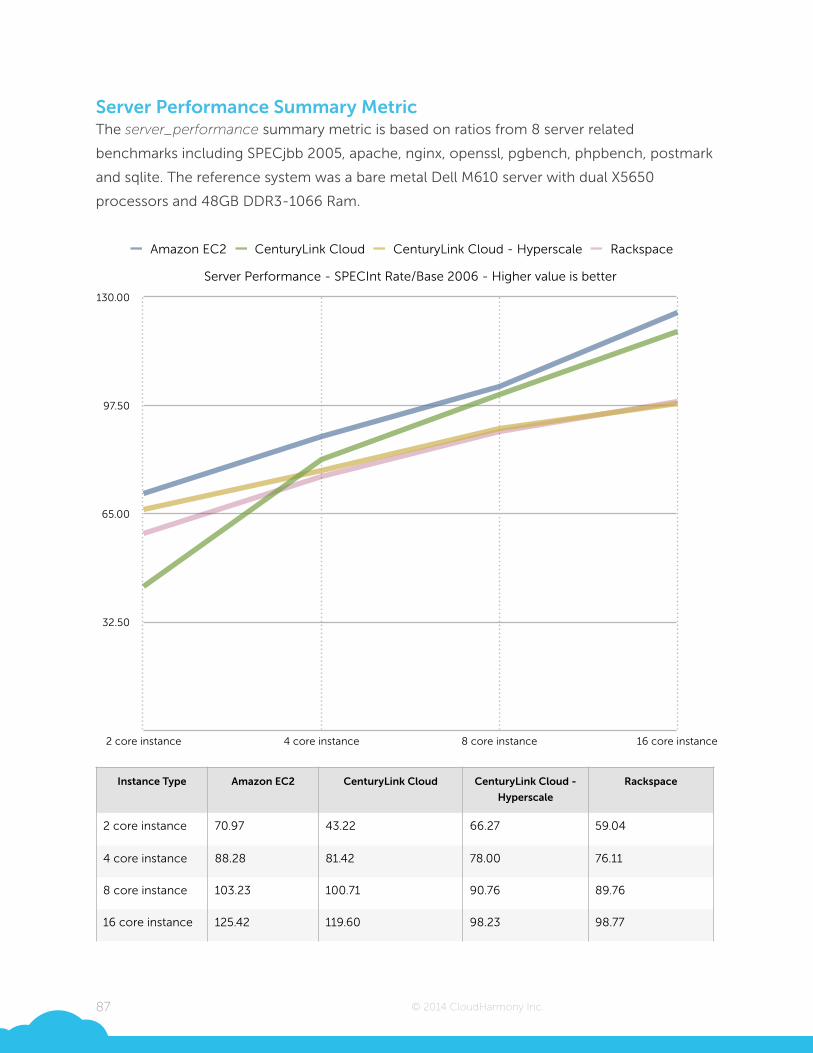
Server Performance Summary Metric The server_performance summary metric is based on ratios from 8 server related
benchmarks including SPECjbb 2005, apache, nginx, openssl, pgbench, phpbench, postmark
and sqlite. The reference system was a bare metal Dell M610 server with dual X5650
processors and 48GB DDR3-1066 Ram.
Instance Type Amazon EC2 CenturyLink Cloud CenturyLink Cloud -
Hyperscale
Rackspace
2 core instance 70.97 43.22 66.27 59.04
4 core instance 88.28 81.42 78.00 76.11
8 core instance 103.23 100.71 90.76 89.76
16 core instance 125.42 119.60 98.23 98.77
87
Server Performance - SPECInt Rate/Base 2006 - Higher value is better
32.50
65.00
97.50
130.00
2 core instance 4 core instance 8 core instance 16 core instance
Amazon EC2 CenturyLink Cloud CenturyLink Cloud - Hyperscale Rackspace

© 2014 CloudHarmony Inc.
Server Performance Comments Because the server performance benchmarks were primarily bound to CPU clock speed and
memory throughput, the results generally paralleled those of the memory_performance
summary metric.
88
© 2014 CloudHarmony Inc.
!!
!
!
!
Conclusion
89
© 2014 CloudHarmony Inc.
Use of local SSD storage from Amazon EC2, CenturyLink Cloud (Hyperscale) or Rackspace
provides the fastest and generally most consistent IO performance available with those
services. However, before choosing this option, one should consider some trade offs
including provisioning limits (fixed or capped volume sizes), tight coupling to compute
instances, fewer features, and often lower durability. Choosing local SSD storage may still be
ideal for read only workloads like a web server, or multi-node, fault tolerant applications.
Write heavy, single node and mission critical applications like a relational database may not
be the best fit for local storage.
!Because the infrastructure behind each service is different, performance is likewise varied.
The testing conducted during this engagement and analysis presented in this report identifies
some of these variances. For example, CenturyLink Hyperscale provided the fastest disk read
performance by a notable margin, while Amazon EC2 performed the most consistently in
most phases of storage testing. Differences in CPU and memory performance were more
subtle and often predictable based on the underlying hardware used by each service.
!When choosing a cloud service, there are other factors to consider besides performance.
Some of these include price, service ecosystem (other cloud services offered by the same
provider), regional presence, support options, advanced features, and provisioning limits to
name a few. It is important for users evaluating cloud services to include all relevant factors
in the decision making process.
90