CLOSING THE GENDER WAGE GAP - Ministry of … · CLOSING THE . GENDER WAGE GAP: A Background Paper....
56
October 2015 CLOSING THE GENDER WAGE GAP: A Background Paper Ministry of Labour
Transcript of CLOSING THE GENDER WAGE GAP - Ministry of … · CLOSING THE . GENDER WAGE GAP: A Background Paper....

October 2015
CLOSING THE GENDER WAGE GAPA Background Paper
Ministry of Labour
Contents 3 Introduction
4 Context 4 Provincial Mandate 5 Canadarsquos International Obligations 5 Imperative
9 Key Concepts 9 The Gender Wage Gap and Earnings Ratios 9 Measures of Earnings Wages Income and Work 10 Measures of Central Tendency 10 Decomposing the Gender Wage Gap 11 Significant Ontario Legislation 12 Intersectional Discrimination
13 Ontario Data 13 Snapshot23 Trends30 Decomposition
33 Key Factors Associated with the Gender Wage Gap 33 Discrimination35 Occupational Segregation38 Caregiving Activities 41 Workplace Culture46 Education
48 Case Study The Nordic Countries
51 Conclusion
52 Bibliography
IntroductionWomen in Ontario have made significant progress in areas such as labour force participation and education Yet they continue to earn less than men Women are overrepresented 1 in lower-paying occupations and industries make up a disproportionate number of employees in minimum wage and part-time positions and remain underrepresented in many higher paying jobs and sectors that have traditionally been male-dominated
Closing Ontariorsquos gender wage gap has been made a priority by the Premier The responsibility for a Gender Wage Gap Strategy (the Strategy) has been given to the Minister of Labour with support from Minister Responsible for Womenrsquos Issues It is increasingly recognized that the gender wage gap ndash the difference between the earnings of men and women ndash represents lost economic opportunities
This paper provides an overview of some key information to inform those who seek more detail when participating in the discussions to create recommendations for the Strategy The paper will begin by going over the context and imperative for the Strategy This will be followed by a section on key concepts that will allow for a better understanding of the ideas and data presented throughout the paper Next Ontario data are presented followed by a discussion of factors commonly associated with the gender wage gap As a model for innovative practices the Nordic countries (where gender wage gaps are among the smallest in the developed world) will be reviewed
The information in this paper is not exhaustive It is based on research and data readily available at the time of writing Research into a variety of areas related to the gender wage gap is ongoing
1 Overrepresented is a term used to describe when a category includes a disproportionately large number of (a particular category or type of person) It is mainly used in reference to statistical studies
3Closing the Gender Wage Gap A Background Paper
ContextProvincial Mandate
In the Minister of Labourrsquos 2014 Mandate Letter the Premier charged the Minister with leading the development of a wage strategy stating
ldquoWomen make up an integral part of our economy and society but on average still do not earn as much as men You will work with the Minister Responsible for Womenrsquos Issues and other ministers to develop a wage gap strategy that will close the gap between men and women in the context of the 21st century economyrdquo 2
The Mandate Letter of the Minister Responsible for Womenrsquos Issues directed her to support the Minister of Labour in the development of a wage gap strategy
The Strategy will take into account the recommendations of a Gender Wage Gap Strategy Steering Committee Two External Advisors -Linda Davis and Dr Parbudyal Singh- have been appointed to the committee by the Minister of Labour The Pay Equity Commissioner -Emanuela Heyninck- and the MOL Executive Lead -Nancy Austin- are ex officio members of the committee
The committee will examine how the gender wage gap affects women at work in their family and in their community understand how the gender wage gap specifically affects women in the workforce across the economic spectrum assess ways in which government business labour other organizations and individual leaders can work together to address the conditions and the systemic barriers that contribute to the wage gap and understand other factors that intersect with gender to compound the wage gap and determine how those factors should be addressed
The committee will seek input from the public through consultations using a variety of methods and will report back to government on the recommendations for a proposed Strategy in 2016 3
2 Ontario Government Mandate Letter Labour (2014) 3 Ontario Government News Release (2015) Ontario Takes Another Step to Close the
Gender Wage Gap
4 Ministry of Labour
Canadarsquos International Obligations
Canada is party to several key United Nations conventions related to women work and compensation In 1951 the United Nations International Labour Organization (ILO) adopted Convention No 100 the Convention Concerning Equal Remuneration for Men and Women for Work of Equal Value Canada has ratified ILOs Convention No 100 4
The Convention on the Elimination of All Forms of Discrimination Against Women (CEDAW) was ratified by Canada on December 10 1981 It provides the basis for realizing gender equality through ensuring womenrsquos equal access to and equal opportunities in political and public life as well as education health and employment Parties agree to take all appropriate measures including legislation and temporary special measures so that women can enjoy all their human rights and fundamental freedoms 5 Thus far Canada has submitted 7 reports the last one in May 2007 with a supplemental report submitted in February 2010
Emerging from the 1995 Beijing Declaration and Platform for Action the Canadian federal government committed to conducting gender based analysis on all future legislation policies and programs Canadarsquos National Review on the 20th Anniversary of the Beijing Platform for Action was submitted in June 2014 6
In another international forum the G20 Leaders Summit in November 2014 Canada was a signatory to lsquo25 by 25rsquo communique where they agreed to the goal of reducing the gap in participation rates between women and men by 25 by 2025 taking into account national circumstances Further action on this item is unknown at this time 7
Imperative
Achieving greater pay equality between men and women would benefit Ontariorsquos economy and society at large The gender wage gap is both an issue of fairness and an economic imperative Failure to address this gap could undermine the competitiveness of Ontario businesses and the provincersquos potential for economic growth
4 Pay Equity Office (2015) A Guide to Interpreting Ontariorsquos Pay Equity Act5 UN Women Convention on the Elimination of All Forms of Discrimination against Women6 UN Women Beijing and its Follow-up7 Caroline Bracht (2014) The 2014 G20 Brisbane Summit Commitments G20 Information Centre
5Closing the Gender Wage Gap A Background Paper
International comparisons show that Canada may be falling behind in terms of the overall gender gap For example the 2014 Global Gender Gap Report by the World Economic Forum (WEF) ranked Canada 19th out of 142 countries This is an improvement over the 2013 ranking of 20th but behind the 2006 ranking of 14th In 2014 Canada lagged behind Germany (12th) New Zealand (14th) and all the Nordic countries which take the top five spots The United States Australia and the United Kingdom are ranked lower than Canada but remain in the top 30 8
Canada has made little improvement in recent years according to the WEF improving 4 from 2006 to 2014 The United States has improved by 6 in that time 9 Canada is falling behind in the WEF category economic participation and opportunity Canada was ranked 9th in in 2013 10 but slipped to 17th in 2014 The Conference Board of Canada notes that Canada has earned a C grade for its progress on the gender wage gap and ranks 11th out of 17 peer countries 11
Closing the gender wage gap will benefit the economy It is viewed by some as a productivity gap when women are under-employed andor not trained to their full potential which causes productivity losses to the entire economy In the past decade Ontario and Canadarsquos productivity has stopped growing There has been a widening productivity gap when Ontario and Canada are compared to the United States 12 In 2005 The Royal Bank estimated that if women in Canada had identical labour market opportunities available to them as men then personal incomes would be $168 billion higher each year Of this $168 billion about $126 billion would come from equating the labour market experiences of women born in Canada to men born in Canada 13
Businesses will also benefit from closing the gender wage gap Women today are highly educated and highly skilled They exceed men in university enrollment and are prime candidates to fill future skill shortages caused by aging demographics The number of women in the workforce has been driving the overall labor force participation rate since the 1970s 14 As the single largest population segment
8 The World Economic Forum (2014) The Global Gender Gap Report 20149 Ibid 10 The World Economic Forum (2013) The Global Gender Gap Report 201311 The Conference Board of Canada (2013) Gender Income Gap12 Ontario Ministry of Finance (2014) Ontariorsquos Long-Term Report on the Economy13 RBC Financial Group (2005) The Diversity Advantage a Case for Canadarsquos 21st Century
Economy 14 Ontario Ministry of Finance
6 Ministry of Labour
still under-represented in paid work women yield the highest potential to make a difference for the national labour force Raising womenrsquos participation in paid work by just 1 would add approximately 115000 workers to the labour force 15
Furthermore women in the 25-44 age group represent the next generation for high-level decision-making and management positions By removing barriers for women businesses broaden the talent pool by tapping into the larger share of the labour market
Some research also shows that equal opportunity employers attract talented staff with better morale and motivation which results in increased productivity The Task Force on Competitiveness Productivity and Economic Progress found that ldquothe average person in the North American peer median produced $12590 more goods and services in a year than a counterpart in Ontariordquo 16 That productivity gap is for the same number of hours worked
In addition some studies have also found a positive relationship between organizationsrsquo financial performance and the number of women on their boards For example one study showed that companies with sustained high representation of women board directors defined as those with three or more women board directors in at least four of five years outperformed those with sustained low representation by 84 on return on sales by 60 on return on invested capital and by 46 on return on equity 17
Reducing the gender wage gap would help to increase the economic security of women Women are overrepresented in precarious andor low-paid employment 18 and constituted the majority (583) of minimum wage earners in Ontario in 2012 19 In 2011 76 of male employees worked for minimum wage as compared to 105 of female employees In addition the share of men aged 25-54 earning minimum wage grew more slowly from 2003-2011 (by 09) while the share of women earning minimum wage in that age group rose more sharply (by 32) 20
15 TD Economics (2010) Career Interrupted the Economic Impact of Motherhood16 Task Force on Competitiveness Productivity and Economic Progress (2014) Finding its
own way Ontario needs to take a new tack Thirteenth Annual Report The Institute for Competitiveness and Prosperity pp 14
17 Catalyst (2011) The Bottom Line Corporate Performance and Womenrsquos Representation on Boards (2004ndash2008)
18 Law Commission of Ontario (2012) Vulnerable Workers and Precarious Work Report19 Minimum Wage Advisory Panel (2014) Reports and Recommendations to the Minister of Labour20 Sheila Block (2013) Who Makes Minimum Wage in Ontario Wellesley Institute
7Closing the Gender Wage Gap A Background Paper
Families that depend on female earners such as female lone-parent families 21 are more vulnerable to poverty and will benefit from closing the gender wage gap According to the 2011 National Household Survey 134 of all census families (nearly 500000) are female lone-parent families 22 In addition in 2008 18 of women in dual-income families were their families primary breadwinners (when measured in hourly earnings) bringing in more than 55 of the household income 23 Reducing the wage gap would improve womenrsquos earnings during their lifetimes and lower the likelihood of poverty during their working years and in retirement It may also help to lower the number of women on social assistance
21 Lone-parent families are in which either a male or female lone parent is the economic family reference person according to the 2011 National Household Survey
22 Statistics Canada (2013) 2011 National Household Survey23 Catalyst (2015) Womens Earnings and Income
8 Ministry of Labour
Key ConceptsThe Gender Wage Gap and Earnings Ratios
The gender wage gap is the difference between wages earned by men and women It is often presented as a percentage but may also be expressed in a dollar value For the gender wage gap the smaller the percentage the better the situation is for women compared to men In many cases the gender wage gap is a generic term that could refer to any pay disparity It will be used generically throughout the paper and different disparities will be shown as appropriate
Earnings ratios are also commonly used in literature related to the gender wage gap The female-to-male earnings ratio represents womens earnings as a percentage of those of men This is often used as another way to represent the wage gap It may be presented as a percentage or as a numerical value (eg 077) It is important to note that where earnings ratios are discussed the larger the ratio the better the situation is for women
Measures of Earnings Wages Income and Work
As the concept of the gender wage gap encompasses indicators of economic well-being social norms and many other dimensions it is measured in different ways by different researchers advocacy groups businesses governments etc The measures used are also dependent on the available data As a result a range of gender wage gaps can be produced Debates over whether the gap is closing or if progress has been uneven can be a result of different measures or methods of measuring gender wage gaps
One way to demonstrate the gender wage gap is to compare the annual earnings of all earners The category all earners includes full-time full-year workers seasonal workers and part-time workers It is reasoned by some that lsquoall earnersrsquo presents a complete picture of the gender wage gap 24
To see whether women who work full-time earn as much as their male counterparts full-year full-time data are useful This is a common measure that allows for a comparison of an individualrsquos ability to support themselves and their families
24 Equal Pay Coalition (2015) Gender pay gap FAQs
9Closing the Gender Wage Gap A Background Paper
Hourly wages are often considered to closely illustrate the price of labour Hourly rates enable pay comparisons for various jobs regardless of whether workers are employed full or part-time 25
The gender wage gap may also be expressed by income which includes employment income income from government income from employer and personal pension sources income from investment sources and other regular cash income After-tax income refers to total income from all sources minus federal provincial and territorial income taxes paid It is important to consider as it may provide insights into how people are impacted by tax structures Employment income as a subset of income refers to income from wages salaries and self-employment 26
Measures of Central Tendency
When looking at gender wage gap data two measures of central tendency 27 are primarily used The first is the average which is the sum of the values divided by the number of values The average is useful when the data being examined does not contain extreme values The average is also useful as it is a commonly used and understood measure
However in the case of wages and earnings the average can be skewed by a small number of people who earn extremely high or low salaries The median can be useful as it better accounts for extremes The median is the numerical value separating the higher half of a data sample from the lower half The median of a finite list of numbers can be found by arranging from lowest value to highest value and picking the middle one If there is an even number of values the median is typically defined to be the average of the two middle values
Decomposing the Gender Wage Gap
Beyond these descriptive statistics decomposition analysis can help to produce estimates of the gender wage gap that account for different aspects of the gap such as educational attainment or years of work experience and the aspects impact on the gap 28 The Blinder-Oaxaca decomposition is a commonly used
25 Julie Cool (2010) The Wage Gap Between Men and Women Library of Parliament26 Statistics Canada 2011 National Household Survey 27 Measures of central tendency tell us where the middle of a group of data lies28 Workplace Gender Equality Agency (2013) Gender Pay Gap Taskforce Report
Recommendations on calculating interpreting and communicating the gender pay gap
10 Ministry of Labour
method It divides the wage gap into a part that is lsquoexplainedrsquo by differences in characteristics and a part that cannot be accounted for This lsquounexplainedrsquo part of the gender wage gap has been used as a measure of discrimination but it also considers the effects of differences that are unobserved or not measurable 29 It is important to note that simply because part of the gap is lsquoexplainedrsquo does not mean it can be ignored The lsquoexplainedrsquo part can still inform the whole complex picture of the gender wage gap
Significant Ontario Legislation
Equal pay for equal work aims to eliminate direct discrimination by an employer on the basis of gender The Female Employees Fair Remuneration Act of 1951 aimed to provide the right to equal pay for equal work to women in Ontario Today the equal pay provisions in Ontariorsquos Employment Standards Act (ESA) 2000 require that men and women receive equal pay when they do the same or substantially the same job in the same establishment 30
Discrimination is prohibited by Ontarios Human Rights Code enacted in 1962 It prohibits actions that discriminate against people based on a protected ground in a protected social area These protected grounds include gender identity gender expression sex (including pregnancy and breastfeeding) disability race and age among others Protected social areas include contracts and employment 31 The Code covers many areas that relate to intersectional discrimination
Pay equity is commonly referred to as lsquoequal pay for work of equal valuersquo Ontariorsquos Pay Equity Act (PEA) passed in 1987 requires employers to identify and correct gender discrimination that may be present in their pay practices and to adjust the wages of employees in female job classes so that they are at least equal to the wages of employees in male job classes found to be comparable in value based on skill effort responsibility and working conditions Pay equity recognizes that historically women and men have tended to do different kinds of work and that work traditionally performed by women has been undervalued and hence underpaid The purpose of the PEA is to redress systemic gender discrimination in compensation for work performed by employees in female job classes 32
29 Ben Jann (2008) The Blinder-Oaxaca decomposition for linear regression models The Stata Journal Vol 8 No 4 pp 453-479
30 Ministry of Labour (2015) Your Guide to the Employment Standards Act 200031 Ontario Human Rights Commission The Ontario Human Rights Code32 Pay Equity Office (2015) A Guide to Interpreting Ontariorsquos Pay Equity Act
11Closing the Gender Wage Gap A Background Paper
Intersectional Discrimination
Intersectional discrimination recognizes that peoplersquos lives have many interrelated facets or identities and that marginalization and exclusion may exist because of how these identities intersect Regardless of the method of calculation the gender wage gap increases for women who experience intersectional discrimination When compared to men without a disability the gender wage gap is 20 for women without a disability and 25 for women with a disability 33 Aspects of inequalities based on race sex disability status etc interact in complex ways and must be considered in discussions research and any solutions to closing wage gaps 34
33 Pay Equity Commission (2014) Gender Wage Gaps and Earnings Ratios in Ontario34 Joan Acker (2006) Inequality Regimes Gender Class and Race in Organizations
12 Ministry of Labour
Ontario DataThe following sub-sections show Ontario-specific data and statistics and are meant to provide perspective and background for the subsequent discussion on key factors associated with the gender wage gap These sections may also be useful in terms of presenting a baseline It is important to remember that the information presented in lsquosnapshotrsquo and lsquotrendsrsquo is simply descriptive reflecting what was readily available at the time of writing
Snapshot
In order to produce a profile of Ontariorsquos labour force and understand the populations that may be impacted by the gender wage gap this section of the paper will rely primarily on data from Statistics Canadarsquos 2011 National Household Survey (NHS) Statistics Canadarsquos Labour Force Survey also provides valuable insights that will be referenced in the section on trends and throughout the remainder of the paper
Population Overview
According to the 2011 NHS women account for over half of Ontariorsquos population (513) Womenrsquos median age is slightly older (413) than the median age of men (394) 839 of the female population and 822 of the male population is aged 15 and over This is important as lsquo15 and overrsquo is the age range used for many labour force and income indicators
In the key concepts sub-section intersectional discrimination was discussed and noted as an important aspect related to the gender wage gap As such where possible we will note intersections available in the NHS Approximately 26 of Ontarians identify as a visible minority (to be referred to as racialized in this paper 35) as do 26 of Ontario women (nearly 17 million women) The majority identify as South Asian Chinese or Black The majority of racialized individuals are immigrants from Asia or non-immigrants (figure 1) There are approximately 11 million female newcomers in Ontario (referred to as immigrants in the NHS 36)
35 Defined by the 2011 NHS as persons other than Aboriginal peoples who are non-Caucasian in race or non-white in colour
36 Defined by the 2011 NHS as a person who is or has ever been a landed immigrantpermanent resident Some are Canadian citizens while others are not Some have resided in Canada for a number of years and a small number are born in Canada
13Closing the Gender Wage Gap A Background Paper
Figure 1 Population in private households by immigration status and selected places of birth
0
Non-im
migran
ts
Immigr
ants
Immigr
ants-
Europ
e
Immigr
ants-
Africa
Immigr
ants-
Asia
Immigr
ants-
Ocean
ia
Non-p
erman
ent
100000200000300000400000500000600000700000800000900000
518800
498735
237105188335
1478514050 1478514050
806180
1890
51725459251705
732995
Males Females
14 Ministry of Labour
Data Table 1 Population in private households by immigration status and selected places of birth
Group Males Females
Non-immigrants 518800 498735
Immigrants - Americas 188335 237105
Immigrants - Europe 14050 14785
Immigrants - Africa 1290 1420
Immigrants - Asia 732995 806180
Immigrants - Oceania and Other 1705 1890
Non-permanent residents 45925 51725
Individuals with an Aboriginal 37 identity make up a small portion of the Ontario population (figure 2) Women are 519 of the total Aboriginal population with just over 150000 individuals It is crucial to note that while Aboriginal data are available during the 2011 NHS over 20 reserves and settlements were incompletely counted due to natural events (specifically forest fires) and the fact that permission to administer the survey was not granted
Figure 2 Aboriginal and non-Aboriginal identity by sex
499 477
11 12
Males - NonAboriginal IdentityFemales - Non-Aboriginal IdentityMales - Aboriginal IdentityFemales - Aboriginal Identity
15Closing the Gender Wage Gap A Background Paper
Data Table 2 Aboriginal and non-Aboriginal identity by sex
Group Males Females
Aboriginal Identity 145020 156410
Non-Aboriginal Identity 6036425 6313940
Education
Women in Ontario have high levels of educational achievement Over 29 million women have a postsecondary certificate diploma or degree The lowest concentration of females by far is found in lsquoapprenticeship or trades certificate or diplomarsquo Women comprise 325 of all those in this category ndash potentially suggesting barriers for women in this area Women and men have similar rates of lsquono certificate diploma or degreersquo at 184 and 189 respectively They also have similar rates of lsquouniversity certificate diploma or degree at bachelor level or aboversquo at 238 and 230 respectively
37 Aboriginal peoples of Canada are defined in the Constitution Act 1982 section 35 (2) as including the Indian Inuit and Meacutetis peoples of Canada
Aboriginal women and men have a higher rate of lsquono certificate degree or diplomarsquo than the broader population at 289 and 338 respectively Aboriginal females account for 65 of all Aboriginal peoples with a bachelorrsquos degree and tend to achieve higher levels of education than Aboriginal men
When we examine major field of study the highest number of females are in lsquobusiness management and public administrationrsquo (over 700000 women) Over 600000 are in lsquohealth and related fieldsrsquo which account for 809 of all those in that field lsquoArchitecture engineering and related technologiesrsquo is a large field of study with over 11 million individuals however women account for only 92 It may be useful to consider how this may impact earnings and return on investment in education throughout an individualrsquos career
10473670 total population aged 15 years and over by labour force status
3542030 in the labour force
5064715 male
5408950 female
1522690 not in the labour force
3249165 employed
292865 unemployed
3322955 in the labour force
2085990 not in the labour force
3047840 employed
275120 unemployed
16 Ministry of Labour
Labour Force Status
When we look at the population by labour force status 484 the labour force (both employed and unemployed) are female Males have a higher labour force participation rate (699) than females (614) and a higher employment rate (642 to 563) Males and females have the same unemployment rate (83) 38
bull Nearly 17 million racializedpeople are in the labourforce 489 of whom arefemale (over 800000)
bull There are nearly 80000Aboriginal females in thelabour force which is 503of all Aboriginal peoples inthe labour force
38 These labour indicators are for the lsquobroader populationrsquo which includes non-visible minorities racialized individuals and Aboriginal individuals
Racialized males have a high participation rate of 708 The participation rate for racialized females is the same as that of the broader population (614) The unemployment rate for racialized females is high at 11 4 which is 17 more than the unemployment rate of racialized males Racialized females also have a lower employment rate (544) than that of the broader population and racialized males (639)
The participation rate for Aboriginal males is 651 and is 591 for Aboriginal females The employment rate is 551 for Aboriginal males and 517 for Aboriginal females The unemployment rate is high for Aboriginal males (153) but also for Aboriginal females when compared to the broader population (125 compared to 83)
Figure 3 Females aged 15 and over in the labour force
729
250
21
Aboriginal FemalesRacialize FemalesNon-AboriginalNon-RacializeFemales
17Closing the Gender Wage Gap A Background Paper
Data Table 3 Females aged 15 and over in the labour force
Group Females
Aboriginal Identity 119805 (21)
Racialized 1352355 (250)
Non-Aboriginal Non-Racialized 3936790 (729)
Class of Worker 39 and Work Activity 40
Of the 33 million women in the labour force 895 are employees compared to 847 of men Females account for 357 of all self-employed individuals (over 250000 women) Although the rate of self-employment is lower among Aboriginal peoples women account for 415 of all Aboriginal peoples who are self-employed (nearly 4000 women) ndash 903 of Aboriginal females are employees
With regard to full-time and part-time work in the broader population 267 of all females who worked worked part-time (over 800000 women) compared to 142 of all males Though women are overrepresented in part-time work the majority of women who worked worked full-time (nearly 23 million women) (figure 4) These trends are similar among people with Aboriginal identities
Figure 4 Labour force population aged 15 and over by full-time or part-time weeks worked
bull In the broader population males work 09 weeks more on average than females
bull The majority (both male and female) of people (who worked) worked 49-52 weeks
bull Aboriginal females worked 07 weeks more on average than Aboriginal males on average
bull Aboriginal females worked 18 weeks less on average than the broader male population
18 Ministry of Labour
0500000
1000001500000200000025000003000000
2879620
833610
2288835
476030
Males Females
Worked full-time in 2010 Worked part-time in 2010
39 Class of worker refers to whether an employed person is an employee or is self-employed Self-employed includes those with an incorporated and unincorporated businesses and unpaid family workers
40 Work activity refers to the number of weeks in which a person worked for pay or in self-employment at all jobs held even if only for a few hours and whether these weeks were mostly full-time (30 hours or more per week) or mostly part-time (less than 30 hours per week)
Data Table 4 Labour force population aged 15 and over by full-time or part-time weeks worked
Group Males Female
Worked full-time in 2010 2879620 2288835
Worked part-time in 2010 476030 833610
Occupation and Industry
Of the 33 million Ontarian women in the labour force the highest number of women are found in lsquosales and service occupationsrsquo (nearly 900000) lsquobusiness finance and administration occupationsrsquo (nearly 800000) and lsquooccupations in education law and social community and government servicesrsquo (over 500000) Women account for 801 of all people found in lsquohealth occupationsrsquo
Men account for 935 of all people in lsquotrades transport and equipment operators and related occupationsrsquo That is also the category with the highest number of males (over 800000) followed by lsquosales and service occupationsrsquo (nearly 700000) and lsquomanagement occupationsrsquo (nearly 500000) Similar trends for women are seen for racialized individuals and Aboriginal individuals
Table 1 Occupations with the highest average employment income
Male Female
Health occupations ($93377) Management occupations ($63309)
Management occupations ($90521) Natural and applied science and related occupations ($57121)
Occupations in education law and social community and goverment services ($72062)
Health occupations ($49795)
Women in lsquohealth occupationsrsquo (801 women) experience the widest gender wage gap at 467 or $43582 The lowest gender wage gap by employment income and occupation is found in lsquonatural and applied sciences and related occupationsrsquo at 155 Only 223 of all people in that occupation are female Women in lsquonatural resources agriculture and related production occupationsrsquo experience a 426 wage gap and females account for 227 of that category Some of these gaps may be related to vertical segregation discussed below showing that women are clustered at the low paying end of these occupation categories
19Closing the Gender Wage Gap A Background Paper
Occupations are determined by the kind of work and the description of the main activities in a personrsquos job Industry refers to the general nature of the business carried out in the establishment where the person works For example one can be an accountant (occupation) in utilities (industry) Industry categories may be important as they relate to government investments and job creation or loss
Table 2 Industries with the highest number of females and males (broader population)
Male Female
Manufacturing (493305) Health care and social assistance (571965)
Construction (369300 Retail trade (406720)
Retail trade (344480) Educational services (336925)
Females make up 826 of the industry lsquohealth care and social assistancersquo while males make up 884 of the lsquoconstructionrsquo industry
Similar to the broader population both the highest number (over 100000) and highest concentration (797) of racialized women are in lsquohealth care and social assistancersquo (797 of all people in lsquoheath care and social assistancersquo are female) This holds true for Aboriginal women as well However the second highest number of Aboriginal women are in lsquopublic administrationrsquo (nearly 9000)
When we focus on the STEM fields (short for science technology engineering engineering technology mathematics and computer science) there are approximately 25 times more males than females in the labour force However employment rates in STEM are higher than the broader labour force rates for both men (75) and women (709)
Examining whether individuals work in the public or private sector also creates an important picture 41 The public sector has higher rates of unionization which is associated with lower gender wage gaps Females make up approximately 64 of all public sector workers and they consistently across age groups earn higher wages than their private sector counterparts The same holds true for men until they are over 40 At that time private sector wages become higher than public
In the public sector the female to male earnings ratio is 82 (an 18 gender wage gap) for those with a university education while it is 73 (a 27 gender
41 Information in this and the following three paragraphs from Kate McInturff and Paul Tulloch (2014) The Difference that Public Sector Wages Make The Canadian Centre for Policy Alternatives
20 Ministry of Labour
wage gap) in the private sector The wider gap in the private sector suggests an area of focus where interventions may be impactful
Males in private sector management occupations have the highest earnings while females in private sector sales and service occupations have the lowest Of all females by occupation females in public sector management occupations have the highest earnings
Examining available intersections non-Aboriginal non-racialized males aged 40-54 in the private sector have the highest earnings Non-Aboriginal non-racialized females in the public sector have the highest earnings of all females across all age groups while racialized females aged 15-24 in the private sector have the lowest earnings of all females For Aboriginal peoples females have their highest earnings in the public sector aged 40-54
Income
For the broader population we see gender wage gaps of 313 for median income and 309 for average income The gap is smaller when after-tax income is used as the measure (272 for average after-tax income)
The gender wage gap using average income is 251 between racialized females and racialized males Looking at average after-tax incomes males in the broader population make nearly 16 times more than racialized females a gender wage gap of 368
Aboriginal females compared to Aboriginal males experience income gaps from 155 to 189 However using average income to compare to the broader male population Aboriginal females experience a gender wage gap of 44 The large gaps experienced by racialized and Aboriginal women suggest a potential area of impact even though Aboriginal women constitute a small portion of the population of Ontario
For the broader population the median gender wage gap with employment income is 184 and the average is 238 Again although these gaps are smaller between racialized men and women (15-19) they are wider when compared to the broader male population (342 using average employment income)
bull Employment income accounts for approximately 776 of total male income and 709 of total female income
21Closing the Gender Wage Gap A Background Paper
Using employment income for Aboriginal women and men results in a median gender wage gap of 16 and an average gender wage gap of 181 However as expected the gap widens to 36 between Aboriginal females and the broader population of males
The gender wage gap persists for male and female lone-parent families as well ndash it ranges from 178-251 depending on the measure It is interesting to note that couple families with children have the highest income of all census families by both median and average measures higher than couple families without children
When we look at gender wage gaps by income and education the largest gap by percentage is found between females and males who have an apprenticeship or trades certificate or diploma (396) The smallest gender wage gap by percentage is found between females and males who have a high school diploma or equivalent (268) This could potentially be because of an increased likelihood of lower-paying or minimum wage jobs with a lower level of education It is not surprising that both women and men with a university certificate diploma or degree above a bachelor level earn the most income However at that education level a 350 gender wage gap is present
Examining employment income and age (figure 5) the largest gender wage gap by percentage is experienced by those 65 and over (378) The largest gender wage gap by dollar amount is experienced by those 45-54 ($22768) which is also the range of years where both men and women have their highest incomes
Figure 5 Average employment income by age
0
1000020000
300004000050000
6000070000
80000
Males - Average Employment IncomeFemales - Average Employment Income
15-24 25-34 35-44 45-54 55-64 64 and over
22 Ministry of Labour
Data Table 5 Average employment income by age
Group Males - Average Employment Income
Females - Average Employment Income
15-24 $ 13204 $ 10850
25-34 $ 43683 $ 33938
35-44 $ 65031 $ 44576
45-54 $ 70266 $ 47498
55-64 $ 59867 $ 40209
65 and over $ 27985 $ 17399
Using most measures males consistently have a higher after-tax income and employment income than females whether in the broader population racialized or Aboriginal However using the measures of average and median income females in the broader population have a marginally higher income than Aboriginal males
This profile of Ontario serves to provide a variety of descriptive data specific to Ontario Moreover it shows that the gender wage gap varies but persists and widens for racialized women and Aboriginal women
Trends
This section will focus on gender wage gap and labour trends in Ontario It will mainly use data from Statistics Canadarsquos Labour Force Survey but will also incorporate other research and surveys as appropriate Trends complement the data presented in the previous section and deepen the discussion on Ontariorsquos progress on gender wage equality
Based on average annual earnings for all earners Ontariorsquos gender wage gap has narrowed from 556 in 1976 to 444 in 1986 and 315 in 2011 the last year data is available with this measure 42 By this measure in 10 years (1976-1986) the gender wage gap narrowed 112 but in the subsequent 24 years (1987-2011) it only closed a further 113 (figure 6) It seems progress is slowing
42 Statistics Canada Labour Force Survey CANSIM Table 282-0070
23Closing the Gender Wage Gap A Background Paper
Figure 6 Ontarios gender wage gap
0102030405060708090
1976
1978
1980
1982
1984
1986
1988
1990
1992
1994
1996
1998
2000
2002
2004
2006
2008
2010
2012
2014
Measured by Average Annual EarningsMeasured by Average Hourly Wages
10
24 Ministry of Labour
The overall gender wage gap trends measured by annual employment income for immigrant women have been in line with wage gap trends measured by average annual earnings for all women in the labour force The gender wage gap experienced by immigrant women fell from 438 in 1986 to 292 in 2012 43
Based on hourly wages for both full-time and part-time employees the gender wage gap appears smaller The average hourly wage gap increased from 180 in 1997 to 202 in 2001 then narrowed to 159 in 2006 and rose again to 165 in 2007 before falling to 120 in 2011 In subsequent years the hourly wage gap reached 129 in 2012 and fell to 119 in 2014 (figure 6) 44 The gender wage gap based on average hourly wages for full-time employees aged 25-54 were 10 in 2013
A notable trend reflected in average annual earnings and hourly wage measures is that younger women have stronger earning power Women aged 15-24 years experienced a gender wage gap that narrowed from 8 in 1997 to 5 in 2014
43 Statistics Canada (2012) Longitudinal Immigration Database44 Statistics Canada Labour Force Survey CANSIM Table 282-0070
with average hourly wages as a measure and narrowed from 33 in 1976 to 19 in 2011 when average annual earnings are used 45
Interestingly female part-time workers had higher average hourly wages than their male counterparts from 1997 to 2014 (a -15 gender wage gap in 1997 and a -76 male-female gap in 2014 ndash indicating the hourly wages of part-time males are catching up to those of part-time females) When we look at average hourly wages among full-time employees the gender wage gap has persisted though narrowed from 160 in 1997 to 96 in 2014 46
Womenrsquos share of full-time employment has been increasing slowly from 38 in 1987 to 44 in 2014 This is notable because higher wages are generally found in full-time employment During that same time womenrsquos share of part-time employment decreased moderately from 71 in 1987 to 66 in 2014 47 The reasons reported for part-time work vary in Ontario (figure 7)
Female dominated occupations since 1987 (50 concentration or more of women)
bull health occupations
bull business finance and administrative
bull social science education government service and religion
bull sales and service
bull art culture recreation and sport
Female dominated industies since 1987 (50 concentration or more of women)
bull health care and social assistance
bull educational services
bull accommodation and food services
bull finance insurance real estate and leasing
25Closing the Gender Wage Gap A Background Paper
45 Statistics Canada Labour Force Survey and Survey of Labour and Income Dynamics CANSIM Tables 282-0070 and 202-0407 Note The Survey of Labour and Income Dynamics collected data from respondents who are 16 years old and over while the Labour Force Survey contacts respondents who are 15 years old and over
46 Statistics Canada Labour Force Survey CANSIM Table 282-007047 Statistics Canada Labour Force Survey CANSIM Table 282-0002
Figure 7 Reasons for part-time work by gender Ontario 2014 48
Business conditions did not look for full-time work in last month
Business conditions looked for full-time work in last month
Caring for children
Could not find full-time work did not look for full-time work in last month
Could not find full-time work looked for full-time work in last month
Going to school
Other personal or family responsibilities
Other voluntary
Own illness
Personal preference
17
17
7
9
11
1
3
3
4
4
25
34
3
1
1
1
3
4
26
25
Reasons reported by males
Reasons reported by females
0 10 20 30 0
26 Ministry of Labour
48 Statistics Canada Labour Force Survey CANSIM Table 282-0014
Data Table 6 Reasons for part-tme work by gender Ontario 2014
Group Reasons reported by males
Reasons reported by females
Business conditions did not look for full-time work in last month
17 17
Business conditions looked for full-time work in last month
9 7
Caring for children 1 11
Could not find full-time work did not look for full-time work in last month
3 3
Could not find full-time work looked for full-time work in last month
4 4
Going to school 34 25
Other personal or family responsibilities 1 3
Other voluntary 1 1
Own illness 4 3
Personal preference 25 26
The gender wage gap measured by average hourly wages is generally more pronounced for permanent employees than temporary employees 49 Since 1997 the gender wage gap for temporary employees has risen from 64 though not steadily while the gender wage gap for permanent employees has decreased from 187 (figure 8) 50 In 2014 253 million men and 255 million women were permanent employees Since 1997 the number of people in temporary employment has grown steadily to approximately 360000 males and 375000 females in 2014 51
49 A permanent job is one that is expected to last as long as the employee wants it given that business conditions permit That is there is no pre-determined termination date A temporary job has a predetermined end date or will end as soon as a specified project is completed A temporary job includes seasonal jobs temporary term or contract jobs including work done through a temporary help agency casual jobs and other temporary work
50 Statistics Canada Labour Force Survey CANSIM Table 282-007451 Statistics Canada Labour Force Survey CANSIM Table 282-0080
27Closing the Gender Wage Gap A Background Paper
Figure 8 Ontarios gender wage gap by job permanence average hourly wages
05
1997
1998
1999
2000
2001
2002
2003
2004
2005
2006
2007
2008
2009
2010
2011
2012
2013
2014
10152025
187
125
9664
Permanent employees Temporary employees
28 Ministry of Labour
Data Table 7 Ontarios gender wage gap by job permanence average hourly wages 1997-2005
Group 1997 1998 1999 2000 2001 2002 2003 2004 2005
Permanent employees
187 191 195 199 204 189 189 184 173
Temporary employees
64 50 102 92 115 105 90 84 59
Data Table 8 Ontarios gender wage gap by job permanence average hourly wages 2006-2014
Group 2006 2007 2008 2009 2010 2011 2012 2013 2014
Permanent employees
163 171 169 154 148 128 134 130 125
Temporary employees
75 86 98 32 80 55 57 54 96
Using average hourly wages the gender wage gap for both unionized and non-unionized workers has narrowed from 1997-2014 though the gap remains higher for those with no union coverage (figure 9) 52
52 Statistics Canada Labour Force Survey CANSIM Table 282-0074
Figure 9 Ontarios gender wage gap by union status average hourly wages
05
1997
1998
1999
2000
2001
2002
2003
2004
2005
2006
2007
2008
2009
2010
2011
2012
2013
2014
10152025 206 164
46
98
Non-unionized employees Unionized employees
29Closing the Gender Wage Gap A Background Paper
Data Table 9 Ontarios gender wage gap by union status average hourly wages 1997-2005
Group 1997 1998 1999 2000 2001 2002 2003 2004 2005
Unionized employees
98 104 105 100 116 93 111 98 82
Non-unionized employees
206 209 224 233 231 226 211 214 203
Data Table 10 Ontarios gender wage gap by union status average hourly wages 2006-2014
Group 2006 2007 2008 2009 2010 2011 2012 2013 2014
Unionized employees
78 77 65 66 59 52 49 47 46
Non-unionized employees
194 206 208 185 183 161 169 163 164
Based on average annual earnings from 1987 to 2011 the gender wage gap for full-time full-year workers has narrowed for all education levels except for those with a university degree Women with a university degree experienced an increase in the gap by 2 over the period resulting in the largest wage gap at 309 among all education categories in 2011 53
53 Statistics Canada Survey of Labour and Income Dynamics CANSIM Table 202-0104
Consistently since 1976 married women have experienced a much higher gender wage gap (measured by average annual earnings) than those who were never married However the gender wage gap for married women fell significantly from 466 in 1976 to 294 in 2011 while the gap for women who were never married decreased from 12 in 1976 to 83 in 2011 54
Turning to labour force participation rates for women aged 25-54 increased from 57 in 1976 to 81 in 2014 Conversely participations rates for the male cohort of the same age fell marginally from 96 in 1976 to 90 in 2014 leaving a gap between participation rates of 9 in 2014 The only group of men that saw a trend towards higher participation rates in recent years were those aged 55 and older Female labour force participation rates increased with higher levels of education and were almost at par with male participation rates for those with education above a bachelorrsquos degree 55
Decomposition
Statisticians decompose the gender wage gap to understand what factors may explain why it persists and either widens or narrows Decomposition leads to an lsquoexplainedrsquo portion of the gap and an lsquounexplainedrsquo portion that may represent gender differences that are not measureable or systemic discrimination
A study of Canadian data by Baker and Drolet in 2010 determined that although the gender wage gap was narrowing characteristics in the surveys and studies they used in their analysis explained less and less of the wage gap over time There were differences in the rate of return that men and women received based on characteristics such as job tenure occupation and industry Women with similar qualifications appeared to earn less than men 56
Similar results were found by Vincent in 2013 Vincent used Canadian data and found that differences in the productive characteristics of women and men explained an increasingly smaller portion of the wage gap The largest portion of the gap could not be explained for example by differences in education and professional choices although those variables accounted for a significant portion of the explained Canadian gender wage gap 57
54 Statistics Canada Survey of Labour and Income Dynamics CANSIM Table 202-010455 Statistics Canada Labour Force Survey CANSIM Tables 282-0002 and 282-000456 Michael Baker and Marie Drolet (2010) A New View of the MaleFemale Pay Gap
Canadian Public Policy XXXVI no 457 Carole Vincent (2013) Why do Women Earn Less Than Men A Synthesis of Findings from
Canadian Microdata CRDCN Synthesis Series
30 Ministry of Labour
A new study by Schirle and Vickers decomposed the gender wage gap of private sector workers aged 20-59 58 They used LFS public-use micro data files and 2014 average hourly wages for private sector workers aged 20-59 Those who were self-employed were excluded because their hours and wages are determined differently
Overall this report found that men earned $2568 per hour while women earned $2088 per hour The female-male hourly wage ratio was 0814 Compared to the ratio for all of Canada (0786) Ontario is doing well The Ontario wages were related to characteristics of age education job experience (tenure) location (Toronto) industry occupation and usual hours of work Other characteristics used as variables included marital status the size of an individualrsquos family and the age of their youngest child
Schirle and Vickers found an hourly gender wage gap of $480 According to their analysis observed gender differences in characteristics can explain $214 (44) of the gender wage gap This leaves 55 unexplained The two variables that make up the entire explained portion of the gap are industry (23) and occupation (21)
Other variables in their report play a minor role and offset each other Education actually negatively affects the gender wage gap by 2 meaning that if men and women received the same dividend with regards to wages for their education women would earn more than men Tenure (women have slightly less experience) and work schedules (women are less likely to work full time hours) explain 2 of the gap a small portion
Interestingly gender differences in family status do not play a large role in the explained portion of the gender wage gap The authors expect that the effects of family status on wages are captured in work schedules industry and occupation as well as in the unexplained portion of the gap lsquoFamily statusrsquo may be difficult to capture in one variable
This report relates the unexplained gender wage gap to other characteristics as well A large portion of the unexplained gap relates to age and tenure capturing work experiences over a personrsquos lifetime and training and promotion opportunities on the job The authors point out that trade-offs made between higher wages and more flexible full-time work schedules may cause the gender difference in wage premiums for full-time work They also discuss how unsatisfactory it is to explain part of the gender wage gap because of historical discriminatory gender practices
58 Tammy Schirle and Elizabeth Vickers (2015) The 2014 Gender Wage Gap in Ontario The Laurier Centre for Economic Research and Policy Analysis
31Closing the Gender Wage Gap A Background Paper
and social norms that prevented and still prevent women from entering certain occupations or industries Discussing occupation and industry without a deeper context may lead to an oversimplification of factors that may contribute to the gender wage gap
32 Ministry of Labour
Key Factors Associated with the Gender Wage Gap Much of the relevant literature cites several common factors that are associated with the gender wage gap It is important to recognize that these factors overlap and interconnect It is also important to note that there may be many factors beyond those considered in this paper Unconscious bias underscores all of the discussions below as social norms have created long held assumptions about the experiences and choices of women at work in the home and in daily life
Discrimination
Research and anecdotal information point to the continued existence of systemic gender discrimination and biased societal attitudes towards women whether conscious or unconscious In terms of the gender wage gap discrimination is often reflected in the undervaluation of womenrsquos work and especially in the experiences of racialized and Aboriginal women and women with a disability This is reflected in the Ontario snapshot above
Some data were not available for the snapshot but had been collected previously In 2006 immigrant women earned an average of $660 per hour less than non-immigrant men which is an earnings ratio of 73 Women with disabilities experienced a wage gap of $565 compared to men without disabilities which is an earnings ratio of 75 Men with disabilities earned more on an hourly basis than women without disabilities in 2006 59 These data point to continued intersectional discrimination
Gender discrimination appears to be a highly relevant factor in a study by The Education Policy Research Initiatives of the University Ottawa The study tracked the earnings of the universityrsquos graduates over a period of 12 years after graduation A gender wage gap was especially pronounced in the Engineering and Computer Sciences faculty group In the first year after graduation men were found to be earning around $15000 more than women on average 60
59 Pay Equity Commission60 Ross Finnie et al (2014) How Much do University Graduates Earn Education Policy
Research Initiative
33Closing the Gender Wage Gap A Background Paper
One recent survey found thatrdquo women workers are more likely to report discrimination as a barrier in their experience of being offered opportunities for advancement than menrdquo 61 Moreover reports of discrimination as a barrier to getting work keeping work and in being offered opportunities for advancement were more likely to come from racialized workers 62
As noted previously Ontario has three main pieces of legislation that were enacted at various times to address workplace gender discrimination - the Employment Standards Act the Ontario Human Rights Code and the Pay Equity Act Some of the literature questions whether legislation alone can be effective to reach the more specific goal of closing the gender wage gap
Baker and Fortinrsquos 2004 report found that for Ontariorsquos private sector in the period studied there was no substantial change in the male-female wage gap because the reduction in the gender wage gap in female-dominated jobs (mainly due to a fall in male wages) was largely offset by the increase in the gender wage gap in the male-dominated jobs (mainly due to increased male wages) They observed that there was a small decrease in female employment in larger firms where compliance with the PEA is more likely and a small increase in female employment in smaller firms where compliance is less likely 63
McDonald and Thornton using a synthetic control method to compare the effects of the PEA to a synthetic province which did not enact the legislation - found no evidence that the PEA substantially affected the gender wage gap in the province 64 They indicated this was due in part to the fact that employers are able to manipulate the interpretation of the law in order to avoid substantial increases in wages
Queacutebec has similar pay equity legislation to Ontario In both jurisdictions the requirement for pay equity in workplaces does not depend upon a complaint being launched Both pieces of legislation apply to the public sector the broader public sector and the private sector making these two pieces of legislation comparatively strong 65 Queacutebec however has addressed issues of non-compliance by requiring employers to conduct pay equity audits every five years in order to assess if compensation adjustments are needed and to report on their efforts 66
61 Poverty and Employment Precarity in Southern Ontario research group (2015) Precarity Penalty pp 67
62 Ibid63 Michael Baker and Nicole Fortin (2004) Comparable worth in a decentralized labour market
the case of Ontario Canadian Journal of Economics Vol 37 Issue 4 pp 850-87864 Judith A McDonald and Robert J Thornton (2014) Coercive Cooperation Ontariorsquos Pay Equity
Act of 1988 and the Gender Pay Gap Contemporary Economic Policy doi 101111coep1209465 McDonald and Thornton 66 Mary Cornish and Jennifer Quito (2013) Where to go for Pay Equity Canadian Remedies for
Gender Pay Discrimination
34 Ministry of Labour
It is important to note that in both provinces employees in female dominated job classes continue to derive economic benefits from the legislation as evidenced by the compensation adjustments that are found to be owed upon investigation of contravention For example in 2013-2014 1780 Ontario workers received adjustments from their employers totalling nearly $36 million 67
Occupational Segregation
Occupational segregation can refer to horizontal segregation (across occupations) and vertical segregation (within the hierarchy of occupations) The term occupational segregation may also be used broadly to refer to industrial segregation It is based on social or cultural norms and beliefs that under-value womenrsquos work It leads to the clustering of women in certain occupations and in lower-paying positions As discussed in the section on decomposing the gender wage gap Schirle and Vickers found that in 2014 gender differences in occupation accounted for 21 of the total hourly gender wage gap
Occupational segregation is an important factor of the gender wage gap for a variety of reasons Governments may use development policies which target a specific sector industry and type of occupation If these focus on male-dominated sectors they may contribute to widening the economic gap between men and women For example Alberta has focused on the development of the extractive sector It also has the largest gender wage gap of the provinces 68
The importance of gender differences in occupation as it relates to the gender wage gap may be enhanced by adding occupation-specific skills to the analysis For example one study reported on findings where differences in skills (as laid out in the Dictionary of Occupational Titles - DOT) lsquoexplainedrsquo a significant portion of the gender wage gap for workers without a high school education The lsquoexplanationrsquo involved men choosing work conditions that may involve for example exposure to contaminants and hazardous equipment higher levels of noise and greater variations in temperature However the analysis does not address whether women face barriers to entry in male-dominated jobs if it is discrimination or if these choices are personal preference ndash it may be a combination of many factors 69
67 Pay Equity Office (2015) Annual Report 2013-2014 68 Kate McInturff and David Mcdonald (2015) Time to Grow Up Family Policies for the Way
We Live Now Canadian Centre for Policy Alternatives69 Miana Plesca Luiza Antoine and Jiayuan (Jennifer) Teng (2015) The Male-Female Wage Gap in
Ontario Differences by Jobs Education and Income Not yet published
35Closing the Gender Wage Gap A Background Paper
Research by Goldin also underscores the importance of occupation Goldin used the occupations of business law and pharmacy to relay the impact hours of work has on the gender wage gap Individuals who work long hours in business and law receive a disproportionate increase in earnings because hours of work in these occupations are worth more when given at particular moments and when the hours are more continuous However occupations such as pharmacy have shown a low gender wage gap in part as they allow for flexibility 70 This research will be discussed further in the section on business practices
Precarious employment has become a widely discussed concept Its characteristics include uncertainty lack of control low income and limited access to regulatory protections It is shaped by employment status type of employment social context and social location 71 Research by Vosko and Clark states that precarious employment is gendered in Canada (the majority of people in employment with precarious characteristics are women)
However one Ontario study found that men and women are nearly equally likely to be in the precarious cluster of occupations and that women are marginally more likely to be in a secure occupation This suggests that secure jobs once dominated by men have been reduced as a result of
bull ldquothe decline of manufacturingbull the falling rate of unionizationbull technological changes that reduced the demand for unskilled manual
labour andbull the growth of the service sectorrdquo 72
A recent study highlights that non-racialized non-Aboriginal women ldquoare the only socio-economic group to record a significant increase in secure employment and a decrease in precarious employment Racialized men and women reported significant increases in precarious employmentrdquo 73 Employment has also become less secure for youth 74
70 Claudia Goldin (2014) A Grand Gender Convergence Its Last Chapter American Economic Review 104 (4) pp 1091-1119
71 Leah F Vosko and Lisa F Clark (2009) Canada Gendered Precariousness and Social Reproduction Gender and the Contours of Precarious Employment Routledge p 26-42
72 Poverty and Employment Precarity in Southern Ontario research group (2013) Itrsquos More than Poverty pp 30
73 Poverty and Employment Precarity in Southern Ontario research group (2015) pp 2274 Ibid pp16
36 Ministry of Labour
Olfert and Moebis used an index of dissimilarity the D-index to examine occupational segregation in Canada regressed on variables such as rurality education and the presence of children They found occupational segregation to be higher in rural areas They also found that the presence of children increased occupational segregation 75 This highlights Schirle and Vickersrsquo assertion that occupation as a measurable variable may capture aspects of family status
The proxy section of Ontariorsquos PEA attempts to address horizontal occupational segregation by providing a means for achieving pay equity in certain female dominated sectors where male comparators cannot be found Whereas job-to-job and proportional value methods of comparison assess whether jobs are being equally valued within a specific organization the proxy comparison method allows organizations in the broader public sector that have mostly female job classes to obtain and apply pay equity information from another public sector organization Only organizations that are part of the public sector as defined in the PEA and had employees on July 1 1993 are eligible to use the proxy method 76
The use and outcomes of proxy for the broader public sector demonstrate that while job rates have increased moderately in some areas generally the effects have been moderate and uneven In a 2011 survey by the Pay Equity Office 35 of proxy organizations had managed to close their wage gaps entirely For other organizations who responded to that survey it may take up to twenty years to reach pay equity target jobs rates set in 1994 77
Vertical segregation as a concept has strong ties to both discrimination and business practices ndashespecially hiring and promotion Women have not only been found in greater numbers in certain occupations but also at the low paying end of many occupations For example in the snapshot when we looked at employment income for broad occupation categories in health occupations males earned approximately $43500 more than women on average 78 This indicates a level of segregation within that occupation category More specifically segregation within an organization or the concept of the glass ceiling is useful to consider For example according to Catalyst womenrsquos share of board seats at Canadian stock index companies in 2014 was 208 79
75 M Rose Olfert and Dianne M Moebis (2006) The Spatial Economy of Gender-Based Occupational Segregation The Review of Regional Studies Vol 36 No 1 pp 44-62
76 Pay Equity Office (2015) A Guide to Interpreting Ontariorsquos Pay Equity Act 77 Pay Equity Office (2011) Assessing Proxy Use and Outcomes in the Broader Public
Sector 2009-2010 78 Statistics Canada 2011 National Household Survey 79 Catalyst (2015) 2014 Catalyst Census Women Board Directors
37Closing the Gender Wage Gap A Background Paper
A psychological study which focused on the idea of the glass ceiling and also the glass cliff found that people who are employed in an occupation that is strongly associated with the opposite gender are penalized more harshly for making mistakes than those in professions historically associated with their gender identity For example a male nurse or a female police officer may more easily lose status within their workplace 80
For Ontario the 2015 Public Sector Salary Disclosure (PSSD - commonly known as the Sunshine List) which identifies public servants who made more than $100000 in 2014 reported 21 women among the top 100 best-paid public servants An analysis by Plesca Antonie and Teng of 2014 PSSD list (reporting on 2013) found that on average women on the PSSD list make as much as men do when adjusted for inflation There is a small gender wage gap without the adjustment Significantly if the PSSD list was adjusted for inflation many of the individuals who would not have made the list are female Moreover there is an identified gender wage gap in the hospital sector and an increasing gender wage gap in the university and college sectors 81
More broadly the 2011 NHS found that 384 of all people in management occupations were women However employment income by occupation revealed a gender wage gap of 301 in management occupations - an over $27000 difference between the employment income of men and women In addition income brackets demonstrate that the percentage of women in a bracket decreases the higher the income - 626 of all those who make $5000 to $9999 are women compared to 286 of those who make $100000 or more This may indicate that women are in lower or middle management positions experiencing vertical segregation
Caregiving Activities
Women still perform a higher percentage of caregiving activities 82 Typically caregiving involves taking care of children elderly or ill relatives or other dependents Economic and career decisions are made to accommodate these activities Caregiving activities can affect their career path and seniority which in turn can impact wages health benefits and pensions derived from long-term or uninterrupted employment
80 Victoria L Brescoll Erica Dawson and Eric Luis Uhlmann (2010) Hard Won and Easily Lost The Fragile Status of Leaders in Gender-Stereotype-Incongruent Occupations Psychological Science 21(11) pp 1640-2
81 Plesca Antoine and Teng82 Statistics Canada 2006 Census
38 Ministry of Labour
In 2014 in Ontario 682 of couple families with at least one child under 16 years of age were a dual-earning family up from 418 in 1976rdquo 83 However there is evidence to suggest that a number of women are absent from the labour market because of the cost or lack of availability of childcare One-third of Canadian women aged 25 to 44 who were absent from the labour force in 2005 cited lsquofamily responsibilitiesrsquo as a key contributing factor in their absence 84 Furthermore in 2014 11 of Ontario females reported working part-time because of caring for children and a further 3 cited other personal or family responsibilities When multiple-year leaves are taken or when hours are reduced it can cause women to disconnect from the labour market and ultimately make re-entry more difficult 85
Looking at Ontario private sector workers aged 20-59 the age distribution of male and female workers differs This may reflect the tendency for women to leave paid employment between the ages of 25 and 39 for child bearing or caring related reasons Furthermore women in paid employment are less likely to have a child who is under three than men suggesting that some women leave the workforce when their children are young 86
Looking through a cross-country comparative lens one study by Mandel and Semyonov showed that gender wage gaps are less pronounced in countries with strong family policies This may include for example extended paid parental leave with flexible rules a high level of job security for those on leave or ldquouse it or lose itrdquo paternal leave However through controls they found an underlying effect that strong family policies may intensify occupational inequality The authors conclude that smaller gender wage gaps are more likely a result of egalitarian wage structures than strong family policies 87 These findings are not specific to Ontario but do provide an interesting perspective to consider
Queacutebec is an interesting case study for child care provisions Queacutebec introduced the Queacutebec Parental Insurance Plan (QPIP) in 2006 It pays benefits to all eligible workers - salaried andor self-employed - taking maternity leave paternity leave parental leave or adoption leave It is an income replacement plan that replaced maternity parental or adoption benefits previously provided to Queacutebec parents
83 Sharanjit Uppal (2015) Employment patterns of families with children Insights on Canadian Society June Statistics Canada Catalogue no 75-006-X
84 TD Economics85 Statistics Canada Labour Force Survey CANSIM Table 282-001486 Schirle and Vickers87 Hadas Mandel and Moshe Semyonov (2005) Family Policies Wage Structures and Gender Gaps
Sources of Earnings Inequality in 20 Countries American Sociological Review Vol 70 pp 949-967
39Closing the Gender Wage Gap A Background Paper
under the federal employment insurance plan QPIP is billed as an effective means for workers to better reconcile work and family responsibilities and support new parents 88 More paternal involvement in child care may be one way to help parents balance work and family
Before the introduction of QPIP 28 of fathers reportedly took or intended to take parental leave in 2005 In 2012 that percentage had grown to 80 In contrast the proportion of fathers outside of Queacutebec who claimed or intended to claim parental leave fell from 11 in 2011 to 9 in 2012 89 A 2008 Statistics Canada paper found that fathers outside Quebec were 34 times more likely to claim parental leave if their spouse did not This suggests that fathers are more likely to take parental leave when a family is at risk of not receiving any benefits 90
The Queacutebec childcare program was assessed by McInturff and Macdonald in early 2015 They noted that the program is providing an estimated annual net gain of over $200 million in taxes and other revenues to the Queacutebec government They also report that lone-mothers of young children in Queacutebec have seen their employment rates increase from 38 in 1996 (the year prior to the introduction of the program) to 68 in 2014 Female lone-parent households have experienced declining poverty rates (52 in 1996 to 31 in 2011) This moved approximately 104000 lone-mothers and their children out of poverty 91
Despite these successes changes in childcare rates came into force on April 22 2015 The current $730 per day rate for families with incomes under $50000 remains unchanged For families with incomes of $50000 or more the rate rises to $800 per day For incomes of $75000 or more the daily rate will gradually increase to reach $2000 per day on incomes of roughly $155000 The basic rate of $730 will be payable directly to the subsidized childcare provider and the additional contribution according to family income will be payable on the income tax return 92
The caregiving discussion often focuses on children - young children in particular However the ldquosandwich generationrdquo is a group of caregivers in their middle age who still have children in their home but are also taking care of their aging parents In 2002 Statistics Canada identified 589000 individuals aged 45 to 64 who combined child care eldercare and paid work Approximately 26 of this group
88 Gouvernement du Queacutebec (2009)89 Cindy Graham (2014) Fathers in Canada 2014 The Vanier Institute of Family90 Katherine Marshall (2008) Fatherrsquos use of Paid Parental Leave Statistics Canada 91 McInturff and Mcdonald 92 Gouvernement du Queacutebec (2015)
40 Ministry of Labour
cared for more than one senior Women (32) were more likely than men (25) to find themselves ldquosandwichedrdquo between caregiving activities The idea of ldquoserial caregivingrdquo ndash which relates to the continuum of care offered by women (raising children then caring for aging parents and then for their aging partner) is also an important topic related to caregiving activities 93
Caregiving whether for children the aged or other individuals relies heavily on volunteer efforts and unpaid care The Conference Board of Canada estimated the cost to Canadian business of lost productivity as a result of caregivers missing full days of work missing hours of work or even quitting or losing their jobs was over $128 billion in 2007 94
Workplace Culture
ldquoOrganizational perceptions and practices in the workplace are another element that tends to contribute to differences in the way men and women experience working liferdquo 95 Workplace cultures are heavily influenced by the organizationrsquos leaders Some research shows that organizations with diverse leadership are more successful financially They may also challenge workplace norms that impact womenrsquos full participation in the workplace 96 Workplace practices have a critical impact on the gender wage gap Pay secrecy inflexible work arrangements and human resource practices have significant impact This section identifies research findings identifying key considerations for workplace change
Hiring and Promotion Practices
Human resource practices related to hiring and promotion may impact an individualrsquos career path and the gender wage gap A 2015 study by Koch DrsquoMello and Sackett found that men were preferred for male-dominated jobs but there was no significant preference for either gender in female-dominated or neutral jobs Moreover men exhibited more of this bias The study further found that when decision makers in an organization are motivated to be careful in their decision they avoid stereotyping more often Motivations may include the expectation that
93 Linda Duxbury and Christopher Higgins (2012) Causes Consequences and Moderating Factors of Strain of Caregiving Among Employed Caregivers
94 Hermus et al (2012) Home and Community Care in Canada An Economic Footprint The Conference Board of Canada
95 Vincent pp1796 Vanessa Anastasopoulos David AH Brown and Debra L Brown (2002) Women on Boards
Not Just the Right Thing But the Bright Thing The Conference Board of Canada
41Closing the Gender Wage Gap A Background Paper
the decision maker will have to justify their hiring choice to others that their choice will be evaluated or that the decision maker is aware of the organizations equity values 97
A study conducted by Fang and Huang on individuals who work as Wall Street analysts found essentially no gender inequality in the odds of being promoted Furthermore they found that many characteristics of the analysts studied ndash such as gender experience number of stocks and education ndash explain only a small fraction of what determines promotion outcomes Many of the factors contributing to being a leading analyst are unexplained
However the same study found that while there may not be gender inequality in the odds of success investors value male and female Wall Street analysts differently which may increase their odds of success Connections ndash social capital and networks ndash are valued in men and associated with positive career outcomes For women measureable achievements and competence are the most significant factors 98 In this study men appear to be valued prospectively while women require a track record of success
The results of the 2011 Wage Gap Pilot Program undertaken by the Pay Equity Office show a pattern of men and women progressing in their compensation at different rates In the case of hourly pay for an additional year of service males earn $054 more per hour while females only earn $042 more 99 This could be related to gender differences in compensation as it relates to promotion the glass ceiling concept or potentially negotiation (which will be discussed in an upcoming section)
A 2012 paper by Hunt used US data to compare differences between genders across science and engineering relative to other fields in order to understand the high exit rate from STEM Hunt found that 60 of the gap between male and female exit rates could be explained by the engineering exit rate of women dissatisfied with pay and promotion opportunities and that family-related constraints and dissatisfaction with working conditions were only secondary factors 100
97 Amanda J Koch Susan D DrsquoMello and Paul R Sackett (2015) A Meta-Analysis of Gender Stereotypes and Bias in Experimental Simulations of Employment Decision Making Journal of Applied Psychology Vol 100 No 1 pp 128-161
98 Lily Fang and Sterling Huang (2011) Gender and Connections among Wall Street Analysts 99 Pay Equity Office (2015) Results of the Wage Gap Pilot Program 100 Jennifer Hunt (2012) Why do Women Leave Science and Engineering Discussion
Paper No 6885 The Institute for the Study of Labor (IZA)
42 Ministry of Labour
Negotiation
Literature on the gender wage gap often cites womenrsquos lower salary expectations and lack of negotiation skills as contributing factors to the gender wage gap A 2013 report by the Bostonrsquos Womenrsquos Workforce Council 101 highlighted negotiating as one of the obstacles women face
A US study by Bowles and Babcock found that women incur more social costs than men do when they engage in salary negotiations ndash they are viewed as demanding An effective tactic for women in this study was the use of relational accounts in which women explained why their request was legitimate in a manner that was consistent with concern for relationships Essentially women needed to demonstrate care for the people they work with Interestingly this tactic did not result in improved outcomes for men 102
Work Arrangements
Work arrangements encompass hours of work and flexibility In 2014 male and female private sector workers aged 20-59 worked full-time hours (388 and 341 hours respectively) Furthermore 23 of men and 14 of women worked 43 hours or more per week 103
A series of reports from Catalyst 104 which focused on Canadian law firms and flexibility found that 28 of female lawyers and 21 of male lawyers in the study reported participating in a flexible work arrangement The majority of lawyers expressed an interest in using a flexible work arrangement Furthermore 86 of those who had already used such an arrangement stated they would like to use another However 50 of lawyers said they felt their firms were doing poorly or very poorly in their provision of flexible work arrangements Many also found it difficult to manage the demands of work and personalfamily life Catalyst highlighted that when an associate leaves a firm the average cost is $315000 (investment costs ndash cost of recruitment upfront training costs and annual recurring training costs ndash and separation costs)
101 The Womenrsquos Workforce Council was formed in April 2013 with the aim to close the gender wage gap and remove the visible and invisible barriers to womenrsquos advancement in todayrsquos working world
102 Hannah Riley Bowles and Linda Babcock (2013) How can Women Escape the Compensation Negotiation Dilemma Relational Accounts are one Answer Psychology of Women Quarterly Vol 37 No 1 pp 80-96
103 Schirle and Vickers104 Catalyst (2006) Beyond a Reasonable Doubt Lawyers State Their Case on Job Flexibility
Catalyst (2005) Beyond a Reasonable Doubt Creating Opportunities for Better Balance Catalyst (2005) Beyond a Reasonable Doubt Building the Business Case for Flexibility
43Closing the Gender Wage Gap A Background Paper
In 2014 57 of all employees aged 15 and over working overtime were male (43 were female) However when that is examined further females appear more likely to work unpaid overtime (52 of all those working unpaid overtime were female) Furthermore the make-up of those working paid overtime is 72 male and 28 female Interestingly across paid and unpaid overtime males worked on average 16 more overtime hours per week 105 These descriptive statistics indicate that men work more than women in paid employment
The research by Goldin previously cited found that in many occupations time spent at work is disproportionately rewarded and it warrants discussion here Goldin states that the gender gap in pay would be considerably reduced and might vanish altogether if firms did not have an incentive to over-compensate individuals who labored long hours and worked particular hours (often uninterrupted hours ndash meaning a less flexible schedule)
Movement toward more flexible time has increased in various sectors such as technology and science but is less apparent in the corporate financial and legal occupationsndash where a flexible schedule likely comes at a cost to earnings When clients perceive there is a greater degree of substitutability among workers the occupation is likely to move towards more proportionate pay This may occur organically often due to economies of scale prompted by employee pressure or because firms want to reduce labor costs Though not all positions can be changed it is useful to consider what sectors or occupations could offer more flexibility to the benefit of many workers Although Goldinrsquos study is from the US it may be illustrative for Ontario 106
Pay Transparency
Pay transparency refers to varying levels of transparency around wages either within an organization to the public or to government For example in some organizations each position has a known pay range An increasing number of organizations are reviewing their compensation and making the results public Transparency may relate to more than pay Other aspects of transparency may include equity or human resource practices
Recently McMaster University in Hamilton publicized a two year study that found that women faculty members earned on average $3515 less than their male counterparts in 2012 and 2013 The study held constant seniority tenure faculty
105 Statistics Canada Labour Force Survey CANSIM table 282-0082106 Goldin
44 Ministry of Labour
and age Pay adjustments will be made on July 1 2015 This is an example of an organization seeing the value of making pay transparent to researchers and the results of a compensation review available to the public McMaster indicated the reaction has been positive The move points toward a gradual change of culture 107
While there is no proven link between pay secrecy and pay inequality some evidence suggests that pay transparency in unionized environments reduces the gender wage gap 108 Pay transparency is more common in public unionized employment Countries with greater collective bargaining coverage tend to have lower gender wage gaps 109 The Ontario government complies with the Public Sector Salary Disclosure Act 1996 (publishes the Sunshine List as discussed above) In addition pay ranges are available in collective agreements As presented in the section on trends unionized women do experience lower gender wage gaps in Ontario
A number of jurisdictions use different levels of pay transparency as they work towards gender equality For example Austria has an online wage calculator providing information on wages in the different sectors of industry and occupations The Canadian government has a similar calculator that allows the public to search wages by occupation and region 110 In addition the Laurier Centre for Economic Research and Policy Analysis is currently hosting a Wage Gap Calculator that is Ontario-specific 111 The Austrian wage and salary calculator is part of the National Action Plan (NAP) for Gender Equality in the Labour Market Furthermore under the NAP employers will be required by law to compile reports on the average earnings of women and men 112
Think Act Report 2011 is a voluntary program in the United Kingdom aimed at promoting greater transparency on gender employment issues in the workplace This initiative provides a simple step-by-step framework to assist employers on issues such as recruitment retention promotion and pay 113 Although around 200 organizations signed up to this initiative only five have made their information public
107 The Canadian Press (2015) McMaster University to Increase Female Facultys Pay after Review MacLeanrsquos
108 Institute for Womenrsquos Policy Research (2011) Pay Secrecy and Wage Discrimination 109 Francine D Blau and Lawrence M Kahn (2003) Understanding International Differences
in the Gender Pay Gap Journal of Labor Economics 21 (1) pp 106-144110 Government of Canada (2014) Explore Careers ndash Wage Report111 Tammy Schirle (2015) Wage Gap Calculator The Laurier Centre for Economic Research
and Policy Analysis 112 European Commission (2010) How to close the gender pay gap Strategies and Good
Practices of States and Social Partners in Europe Institute for the equality of women and men113 Government Equalities Office (2012) Think Act Report One Year On
45Closing the Gender Wage Gap A Background Paper
In Australia under the Workplace Gender Equality Act 2012 all private sector employers ndash including subsidiaries with 100+ employees in Australia ndash must report annually online to the Workforce Gender Equality Agency (WGEA) These reports are public The reporting requires data on salaries by gender and lsquoworkforce categoriesrsquo 114 It does not require any dis-aggregation of pay data by job or occupational groupings Employers are also required to identify any organizational gender pay equity objectives whether any gender pay gap analysis has been undertaken and any actions taken as a result of the pay gap analysis
However Australia has experienced opposition to the regulatory burden the act placed on the business community The act has also been criticised for insufficient compliance mechanisms For example the power to conduct random compliance checks in the act was limited to seeking further information from employers In addition the current governmentrsquos minimum standard for reporting is seen as weak and only applies to very large employers 115
Education
Women in Ontario have high levels of educational achievement representing at least half of all individuals at any given level of education (except lsquoapprenticeship or trades certificates or diplomasrsquo) Some research has found that high education levels are associated with a smaller gender wage gap 116 One recent Ontario study along with some other literature shows that level of education may currently play a minor role in the gender wage gap if men and women received the same wage premium for education we would expect women to be earning more than men on average 117
A recent Ontario study found the gender wage gap to be highest for those who did not complete high school followed by those who completed high-school and college while the university graduated experienced the lowest gender gap However the authors observed an increase in the gender wage gap at the highest part of the earnings distribution for individuals with university education ndash which suggests women are experiencing the glass ceiling 118 The gender wage gap persists across education levels
114 It includes employment status (employment on a part-time full-time permanent casual or contract basis) and managersnon-managers
115 Sara Charlesworth and Fiona Macdonald (2015) Australiarsquos gender pay equity legislation how new how different what prospects Cambridge Journal of Economics 39 (2) pp 421-440
116 Solomon W Polachek and Jun Xiang (2014) The Gender Pay Gap Across Countries A Human Capital Approach The Institute for the Study of Labor (IZA)
117 Schirle and Vickers118 Plesca Antonie and Teng
46 Ministry of Labour
Beyond education levels gender differences in major fields of study may play a role in the gender wage gap Females are clustered in lsquohealth and related fieldsrsquo as well as lsquobusiness management and public administrationrsquo lsquoeducation social and behavioural sciencesrsquo and lsquolawrsquo They are underrepresented in lsquoarchitecture engineering and related technologiesrsquo lsquomathematics computer and information sciencesrsquo and lsquoagriculture natural resources and conservationrsquo Over the next decade professional and technical services and health care services are expected to grow Individuals will need skills in maths and sciences in order to be qualified for these positions 119 Education and training relate to productivity and may help women especially those who experience intersectional discriminaton fully integrate into the labour market
As we have seen these factors interconnect and are difficult to segregate into categories in any meaningful way It is useful to consider the issues presented above as a whole when attempting to understand what causes the gender wage gap This section does not represent an exhaustive discussion of factors associated with the gender wage gap For example some research indicates that low labour force participation over a lifetime economic competition the top marginal income tax rate and a high national fertility rate are associated with a larger gender wage gap 120 Another study found that the gender pay gap tends to be higher in countries with a larger overall wage inequality because female workers are more likely to be located at the bottom of the wage distributions 121
Research will continue into areas such as intersectional discrimination youth leadership governance political representation violence against women access to collective bargaining tax policy measurement and evaluation and the erosion of qualification for foreign-trained professionals Examining remote rural and urban regions in Ontario is also important
119 Task Force on Competitiveness Productivity and Economic Progress120 Polachek and Xiang121 Blau and Kahn
47Closing the Gender Wage Gap A Background Paper
Case Study The Nordic CountriesThe Nordic countries are a geographical and cultural region in Northern Europe and the North Atlantic The region consists of five countries - Denmark Finland Iceland Norway and Sweden With their small economies well-developed welfare states and organized labour markets they have given rise to the concept of ldquothe Nordic modelrdquo Most of the attention paid to the Nordic countries is positive However this model has been criticized for having over-inflated public sectors and excessive tax levels as well as rigid labour markets The Nordic countries have demonstrated generally good results in terms of growth employment equality competitiveness and quality of life 122 making them an example for Ontario to study
The Nordic countries represent the top five countries in the 2014 Global Gender Gap Report by the World Economic Forum This Report uses a number of indicators thus for the purposes of focusing on the gender wage gap we will examine data from the Organization for Economic Co-operation and Development (OECD)
As data is not available for Iceland past 2011 we will use 2011 data to make some general comparisons Using full-time employees the OECD calculates the gender wage gap by the unadjusted difference between male and female median wages divided by the male median wage For Norway the gender wage gap was 78 for Denmark 88 for Iceland 141 for Sweden 159 and for Finland 186 Both Sweden and Finland are above the OECD average of 153 New Zealand had the smallest gap at 42 and Korea the largest at 366 Canadarsquos gap was relatively high at 192 123
As a province Ontario is obviously not broken out in the OECD measure of Canada so no direct comparison can be made However for illustrative purposes we can use similar (though not equivalent) data By dividing the difference between full-time full-year male and female annual earnings for 2011 by full-time full-year male median earnings for 2011 we find a gender wage gap of 234 124
The Nordic countries are often characterized by their family friendly policies that have been shown to be successful in boosting female employment Denmark is described as having one of the most liberal work-family policies in the OECD Arulampalam Booth and Bryan used indicators from the OECD work-family
122 Soslashren Kaj Andersen Jon Erik Doslashlvik and Christian Lyhne Ibsen (2014) The Nordic labour market models in open markets ndash challenges and perspectives Fafo
123 Organization for Economic Co-operation and Development (2015) Stat Extracts124 Statistics Canada Survey of Labour and Income Dynamics CANSIM table 202-0101
48 Ministry of Labour
reconciliation index to assess formal childcare policies They found that family friendly policies have a negative effect on the gender wage gap at the top of the wage distribution scale and a positive effect on the gender wage gap at the bottom end of the wage distribution scale This held true for Denmark Women in lower-paying jobs may feel more attached to a firm with family friendly policies and thus more likely to return to work Generally women at the top of the pay scale may experience a larger gender wage gap and a glass ceiling effect because of more time out of the workforce 125
Rates of unionization are particularly high in the Nordic countries and unionization generally means a smaller gender wage gap Finland has a unionization rate of 74 Sweden 70 Denmark follows with 67 and then Norway with a unionization rate of 52 Rates of unionization are so high in part because unemployment and other social benefits are normally paid out through the union although recent changes in the Swedish system of unemployment benefits have impacted union membership However high union density in the Nordic countries also reflects an approach that views union membership as a natural part of employment 126 which differs from Ontariorsquos norms
The unionization rate for Nordic women is higher than that of men Anderson notes that the high rate of unionization is related to the high employment rates among women and the fact that women often work in the public sector which is well organized Conversely the sectors in which unionization among men is high ndash such as manufacturing ndash are declining in shares of overall employment leading to falling unionization rates Sweden is an exception where female union density declined steadily in the period 1995ndash2008 falling nine percentage points Yet the decline is even more dramatic for Swedish men 15 percentage points 127
Sweden has a legislative model which seeks to correct discriminatory pay practices It may contribute to a lower gender wage gap The model requires local social partners to jointly develop and implement pay equity plans that are tailored to the needs of each company The legislation also requires employers to carry out a yearly pay survey to analyze pay policies and practices even when no wage gaps were identified in the previous year Under this legislative model the ultimate responsibility for eliminating gender wage gaps fall to employers and unions 128
125 Wiji Arulampalam Alison L Booth and Mark L Bryan (2007) Is There a Glass Ceiling Over Europe Exploring the Gender Pay Gap Across the Wage Distribution Industrial and Labor Relations Review Vol 60 No 2 pp 163- 186
126 L Fulton (2013) Worker representation in Europe ETUI127 Andersen et al 128 Marie-Therese Chicha (2006) A comparative analysis of promoting pay equity models and
impacts International Labour Office Geneva
49Closing the Gender Wage Gap A Background Paper
The Swedish Equal Opportunities Ombudsman has conducted surveys to assess the impact of the legislation but frequently encounters difficulties in obtaining consistent and reliable data In a 2004-2005 survey of 50 organizations 24 required pay adjustments indicating non-compliance making a strong case for the necessity of support and follow-up by specialized bodies 129
It is interesting to examine similarities and differences between Ontario and the Nordic countries and consider if there are any lessons to be learned
129 Chicha
50 Ministry of Labour
ConclusionClosing the gender wage gap between men and women would benefit Ontariorsquos economy and society as a whole The gender wage gap is an issue of fairness It could also undermine the competitiveness of Ontario businesses and the provincersquos potential for economic growth The issue of how to make progress toward closing the gender wage gap and better the situation for women at work is complex It will require collaboration between government business labour other organizations and individual leaders Broadly actions that impact women at work actions that impact families and actions that change social norms and behaviours must be considered
51Closing the Gender Wage Gap A Background Paper
BibliographyAcker Joan (2006) Inequality Regimes Gender Class and Race in Organizations
Anastasopoulos Vanessa David AH Brown and Debra L Brown (2002) Women on Boards Not Just the Right Thing But the Bright Thing The Conference Board of Canada
Andersen Soslashren Kaj Jon Erik Doslashlvik and Christian Lyhne Ibsen (2014) The Nordic labour market models in open markets ndash challenges and perspectives Fafo
Arulampalam Wiji Alison L Booth and Mark L Bryan (2007) Is There a Glass Ceiling Over Europe Exploring the Gender Pay Gap Across the Wage Distribution Industrial and Labor Relations Review Vol 60 No 2 pp 163- 186
Baker Michael and Marie Drolet (2010) A New View of the MaleFemale Pay Gap Canadian Public Policy XXXVI no 4
Baker Michael and Nicole Fortin (2004) Comparable worth in a decentralized labour market the case of Ontario Canadian Journal of Economics Vol 37 Issue 4 pp 850-878
Blau Francine D and Lawrence M Kahn (2003) Understanding International Differences in the Gender Pay Gap Journal of Labor Economics 21 (1) pp 106-144
Block Sheila (2013) Who Makes Minimum Wage in Ontario Wellesley Institute
Bracht Caroline (2014) The 2014 G20 Brisbane Summit Commitments G20 Information Centre
Brescoll Victoria L Erica Dawson and Eric Luis Uhlmann (2010) Hard Won and Easily Lost The Fragile Status of Leaders in Gender-Stereotype-Incongruent Occupations Psychological Science 21(11) pp 1640-2
The Canadian Press (2015) McMaster University to Increase Female Facultys Pay after Review MacLeanrsquos
Catalyst (2015) 2014 Catalyst Census Women Board Directors
Catalyst (2005) Beyond a Reasonable Doubt Building the Business Case for Flexibility
Catalyst (2005) Beyond a Reasonable Doubt Creating Opportunities for Better Balance
52 Ministry of Labour
Catalyst (2006) Beyond a Reasonable Doubt Lawyers State Their Case on Job Flexibility
Catalyst (2011) The Bottom Line Corporate Performance and Womenrsquos Representation on Boards (2004ndash2008)
Catalyst (2015) Womens Earnings and Income
Charlesworth Sara and Fiona Macdonald (2015) Australiarsquos gender pay equity legislation how new how different what prospects Cambridge Journal of Economics 39 (2) pp 421-440
Chicha Marie-Therese (2006) A comparative analysis of promoting pay equity models and impacts International Labour Office Geneva
Conference Board of Canada (2013) Gender Income Gap
Cornish Mary and Jennifer Quito (2013) Where to go for Pay Equity Canadian Remedies for Gender Pay Discrimination
Cool Julie (2010) The Wage Gap Between Men and Women Library of Parliament
Duxbury Linda and Christopher Higgins (2012) Causes Consequences and Moderating Factors of Strain of Caregiving Among Employed Caregivers
Equal Pay Coalition (2015) Gender pay gap FAQs
European Commission (2010) How to close the gender pay gap Strategies and Good Practices of States and Social Partners in Europe Institute for the equality of women and men
Fang Lily and Sterling Huang (2011) Gender and Connections among Wall Street Analysts INSEAD
Finnie Ross et al (2014) How Much do University Graduates Earn Education Policy Research Initiative
Fulton L (2013) Worker representation in Europe ETUI
Graham Cindy (2014) Fathers in Canada 2014 The Vanier Institute of Family
Goldin Claudia (2014) A Grand Gender Convergence Its Last Chapter American Economic Review 104 (4) pp 1091-1119
Gouvernement du Queacutebec (2015)
Gouvernement du Queacutebec (2009)
53Closing the Gender Wage Gap A Background Paper
Government Equalities Office (2012) Think Act Report One Year On
Government of Canada (2014) Explore Careers ndash Wage Report
Hermus et al (2012) Home and Community Care in Canada An Economic Footprint The Conference Board of Canada
Hunt Jennifer (2012) Why do Women Leave Science and Engineering Discussion Paper No 6885 The Institute for the Study of Labor (IZA)
Institute for Womenrsquos Policy Research (2011) Pay Secrecy and Wage Discrimination
Jann Ben (2008) The Blinder-Oaxaca decomposition for linear regression models The Stata Journal Vol 8 No 4 pp 453-479
Koch Amanda J Susan D DrsquoMello and Paul R Sackett (2015) A Meta-Analysis of Gender Stereotypes and Bias in Experimental Simulations of Employment Decision Making Journal of Applied Psychology Vol 100 No 1 pp 128-161
Law Commission of Ontario (2012) Vulnerable Workers and Precarious Work Report
Mandel Hadas and Moshe Semyonov (2005) Family Policies Wage Structures and Gender Gaps Sources of Earnings Inequality in 20 Countries American Sociological Review Vol 70 pp 949-967
Marshall Katherine (2008) Fatherrsquos use of Paid Parental Leave Statistics Canada
McDonald Judith A and Robert J Thornton (2014) Coercive Cooperation Ontariorsquos Pay Equity Act of 1988 and the Gender Pay Gap Contemporary Economic Policy doi 101111 coep12094
McInturff Kate and David Mcdonald (2015) Time to Grow Up Family Policies for the Way We Live Now Canadian Centre for Policy Alternatives
McInturff Kate and Paul Tulloch (2014) The Difference that Public Sector Wages Make The Canadian Centre for Policy Alternatives
Minimum Wage Advisory Panel (2014) Reports and Recommendations to the Minister of Labour
Ministry of Labour (2015) Your Guide to the Employment Standards Act 2000
Olfert Rose M and Dianne M Moebis (2006) The Spatial Economy of Gender-Based Occupational Segregation The Review of Regional Studies Vol 36 No 1 pp 44-62
54 Ministry of Labour
Ontario Government Mandate Letter Labour (2014)
Ontario Government News Release (2015) Ontario Takes Another Step to Close the Gender Wage Gap
Ontario Human Rights Commission The Ontario Human Rights Code
Ontario Ministry of Finance (2014) Ontariorsquos Long-Term Report on the Economy
Organization for Economic Co-operation and Development (2015) Stat Extracts
Pay Equity Commission (2014) Gender Wage Gaps and Earnings Ratios in Ontario
Pay Equity Office (2011) Assessing Proxy Use and Outcomes in the Broader Public Sector 2009-2010
Pay Equity Office (2015) A Guide to Interpreting Ontariorsquos Pay Equity Act
Pay Equity Office (2015) Annual Report 2013-2014
Pay Equity Office (2015) Results of the Wage Gap Pilot Program
Plesca Miana Luiza Antoine and Jiayuan (Jennifer) Teng (2015) The Male-Female Wage Gap in Ontario Differences by Jobs Education and Income Not yet published
Polachek Solomon W and Jun Xiang (2014) The Gender Pay Gap Across Countries A Human Capital Approach The Institute for the Study of Labor (IZA)
Poverty and Employment Precarity in Southern Ontario research group (2013) Itrsquos More than Poverty
Poverty and Employment Precarity in Southern Ontario research group (2015) Precarity Penalty
RBC Financial Group (2005) The Diversity Advantage a Case for Canadarsquos 21st Century Economy
Riley Bowles Hannah and Linda Babcock (2013) How can Women Escape the Compensation Negotiation Dilemma Relational Accounts are one Answer Psychology of Women Quarterly Vol 37 No 1 pp 80-96
Schirle Tammy (2015) Wage Gap Calculator The Laurier Centre for Economic Research and Policy Analysis
Schirle Tammy and Elizabeth Vickers (2015) The 2014 Gender Wage Gap in Ontario The Laurier Centre for Economic Research and Policy Analysis
55Closing the Gender Wage Gap A Background Paper
Statistics Canada (2013) 2011 National Household Survey
Statistics Canada (2012) Longitudinal Immigration Database
Statistics Canada (2011) 2006 Census
Statistics Canada (multiple years) Labour Force Survey
Statistics Canada (multiple years) Survey of Labour Income and Dynamics
Task Force on Competitiveness Productivity and Economic Progress (2014) Finding its own way Ontario needs to take a new tack Thirteenth Annual Report The Institute for Competitiveness and Prosperity
TD Economics (2010) Career Interrupted the Economic Impact of Motherhood
UN Women Convention on the Elimination of All Forms of Discrimination against Women
UN Women Beijing and its Follow-up
Uppal Sharanjit (2015) Employment patterns of families with children Insights on Canadian Society June Statistics Canada Catalogue no 75-006-X
Vincent Carole (2013) Why do Women Earn Less Than Men A Synthesis of Findings from Canadian Microdata CRDCN Synthesis Series
Vosko Leah F and Lisa F Clark (2009) Canada Gendered Precariousness and Social Reproduction Gender and the Contours of Precarious Employment Routledge p 26-42
Workplace Gender Equality Agency (2013) Gender Pay Gap Taskforce Report Recommendations on calculating interpreting and communicating the gender pay gap
The World Economic Forum (2013) The Global Gender Gap Report 2013
World Economic Forum (2014) The Global Gender Gap Report 2014
56 Ministry of Labour
- Closing the Gender Wage Gap A Background Paper
-
- Contents
- Introduction
- Context
-
- Provincial Mandate
- Canadarsquos International Obligations
- Imperative
-
- Key Concepts
-
- The Gender Wage Gap and Earnings Ratios
- Measures of Earnings Wages Income and Work
- Measures of Central Tendency
- Decomposing the Gender Wage Gap
- Significant Ontario Legislation
- Intersectional Discrimination
-
- Ontario Data
-
- Snapshot
-
- Population Overview
- Education
- Labour Force Status
- Class of Worker and Work Activity
- Occupation and Industry
- Income
-
- Trends
- Decomposition
-
- Key Factors Associated with the Gender Wage Gap
-
- Discrimination
- Occupational Segregation
- Caregiving Activities
- Workplace Culture
-
- Hiring and Promotion Practices
- Negotiation
- Work Arrangements
- Pay Transparency
-
- Education
-
- Case Study The Nordic Countries
- Conclusion
- Bibliography
-
- page4pdf
-
- Closing the Gender Wage Gap A Background Paper
-
- Contents
- Introduction
- Context
-
- Provincial Mandate
- Canadarsquos International Obligations
- Imperative
-
- Key Concepts
-
- The Gender Wage Gap and Earnings Ratios
- Measures of Earnings Wages Income and Work
- Measures of Central Tendency
- Decomposing the Gender Wage Gap
- Significant Ontario Legislation
- Intersectional Discrimination
-
- Ontario Data
-
- Snapshot
-
- Population Overview
- Education
- Labour Force Status
- Class of Worker and Work Activity
- Occupation and Industry
- Income
-
- Trends
- Decomposition
-
- Key Factors Associated with the Gender Wage Gap
-
- Discrimination
- Occupational Segregation
- Caregiving Activities
- Workplace Culture
-
- Hiring and Promotion Practices
- Negotiation
- Work Arrangements
- Pay Transparency
-
- Education
-
- Case Study The Nordic Countries
- Conclusion
- Bibliography
-
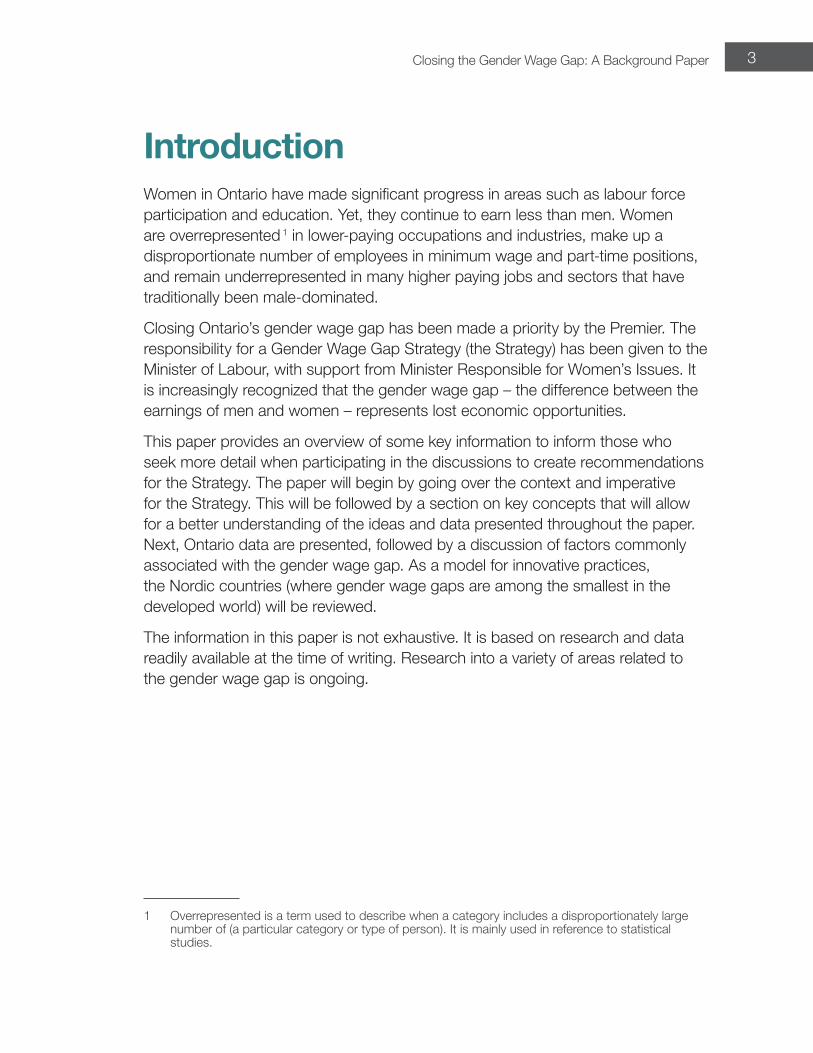
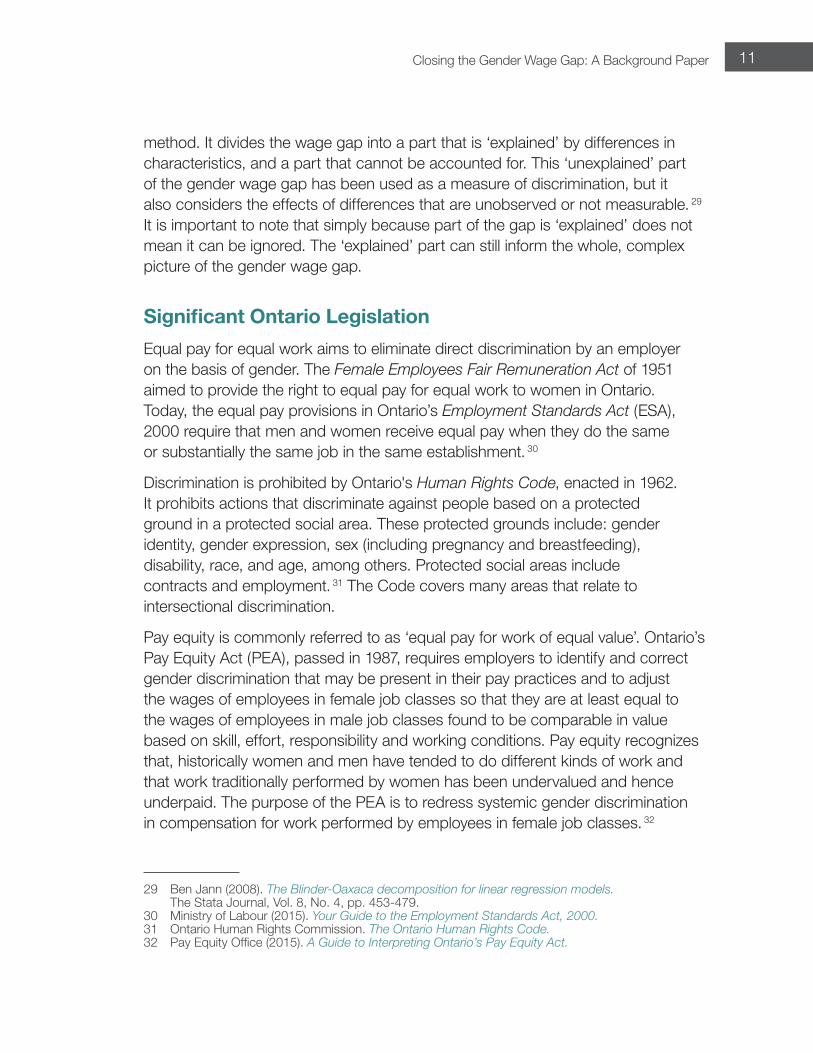
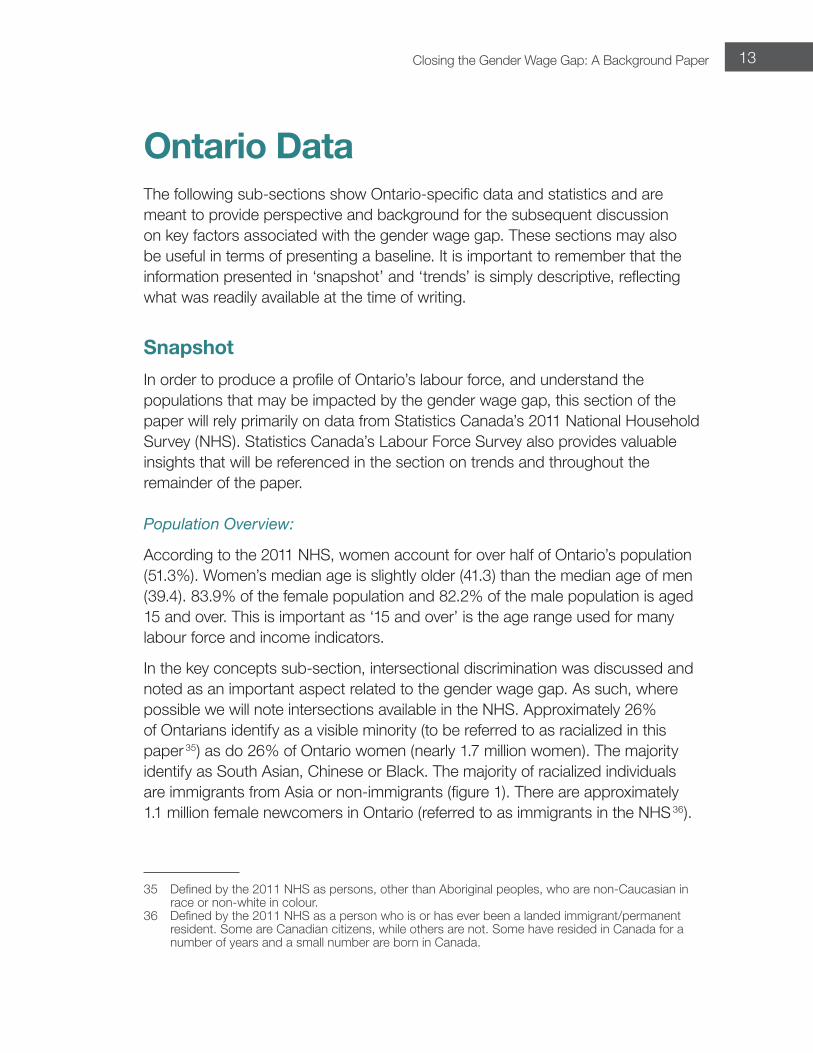
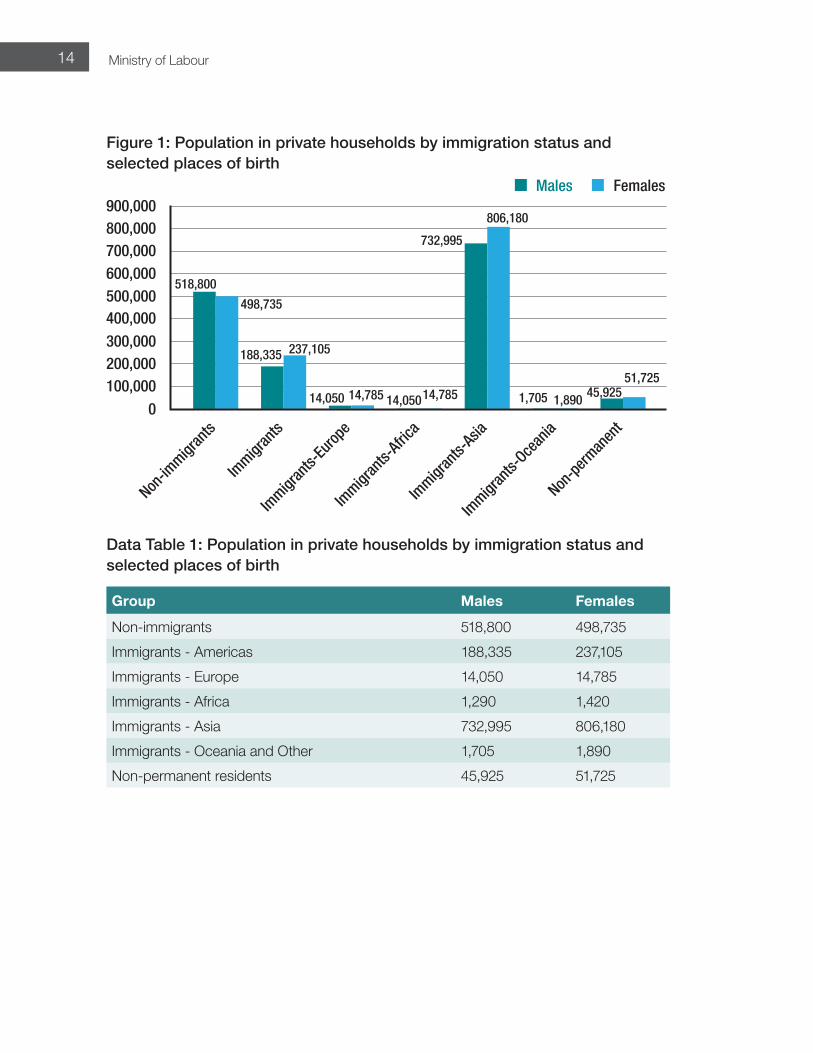
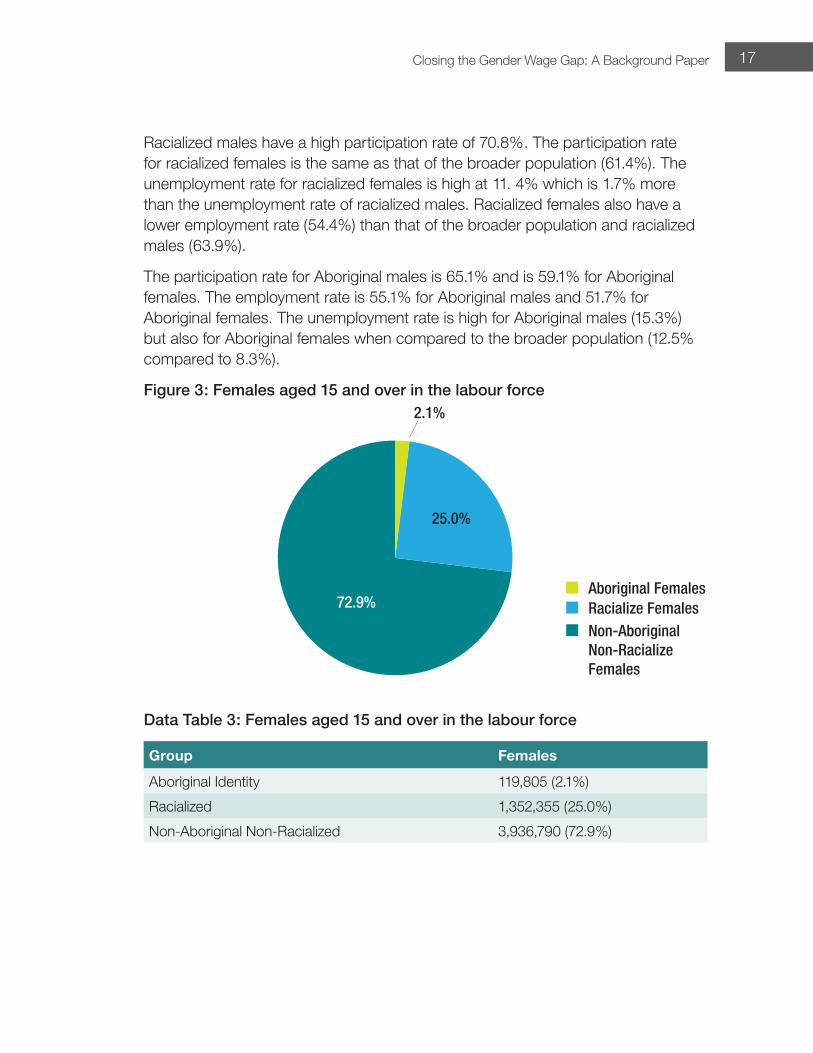
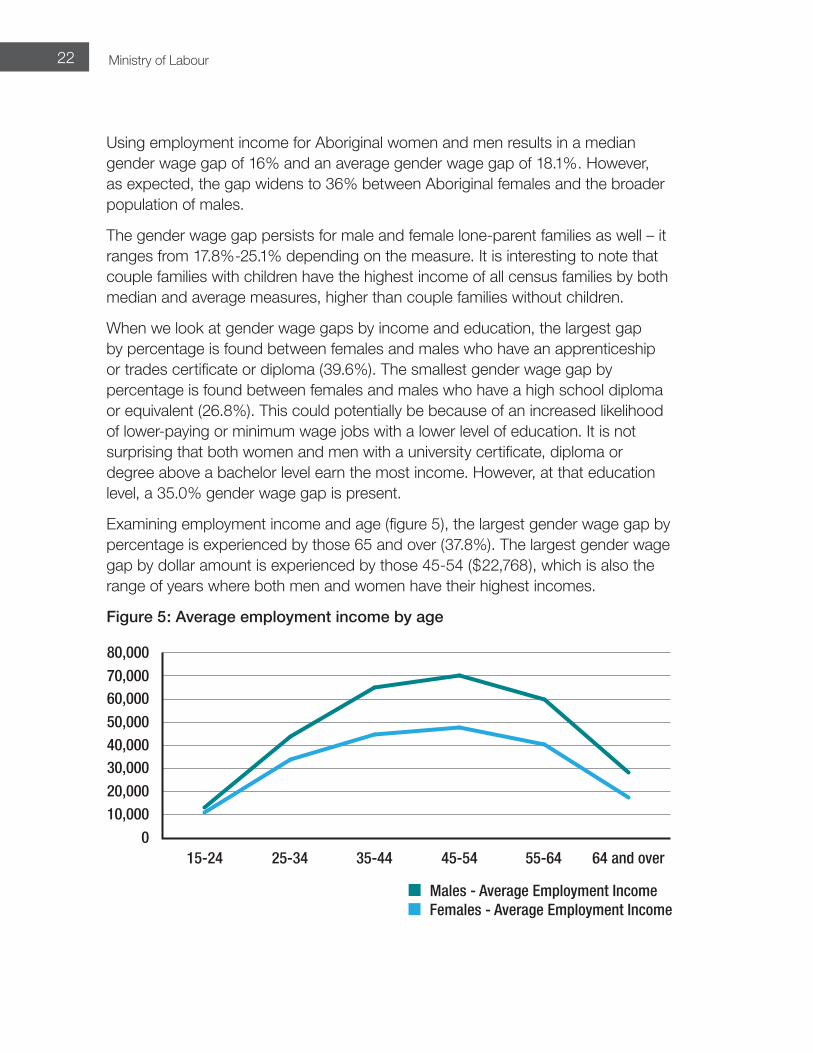
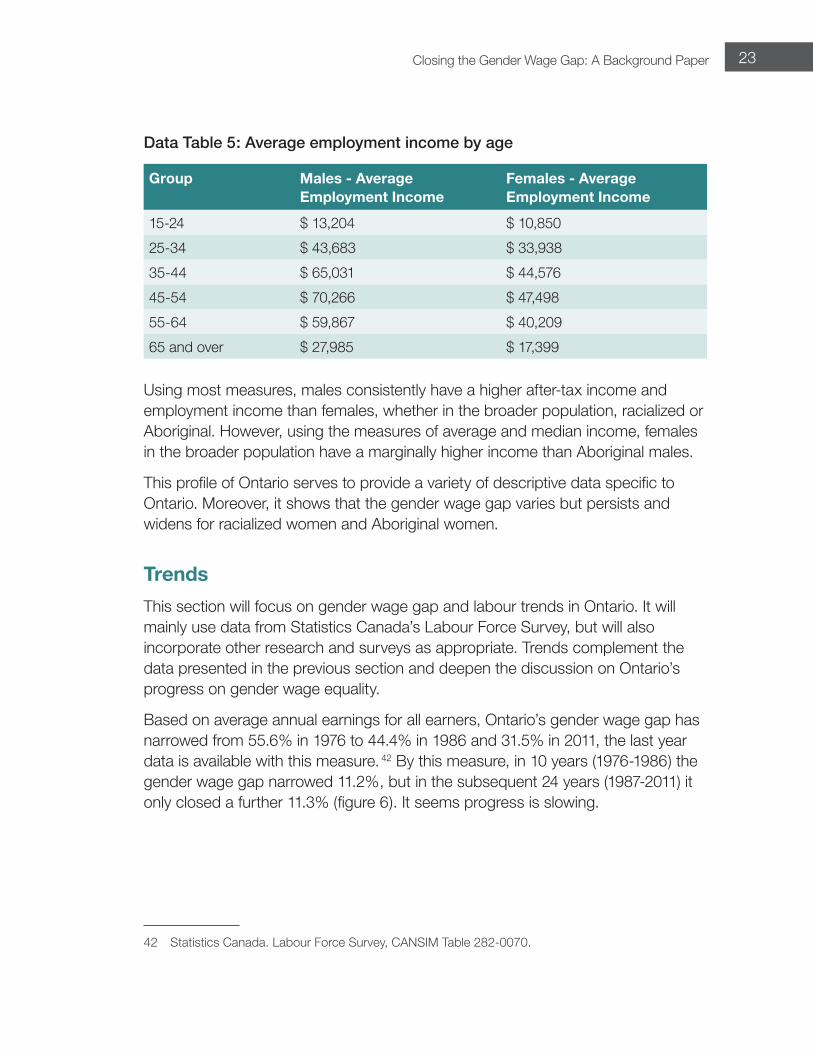
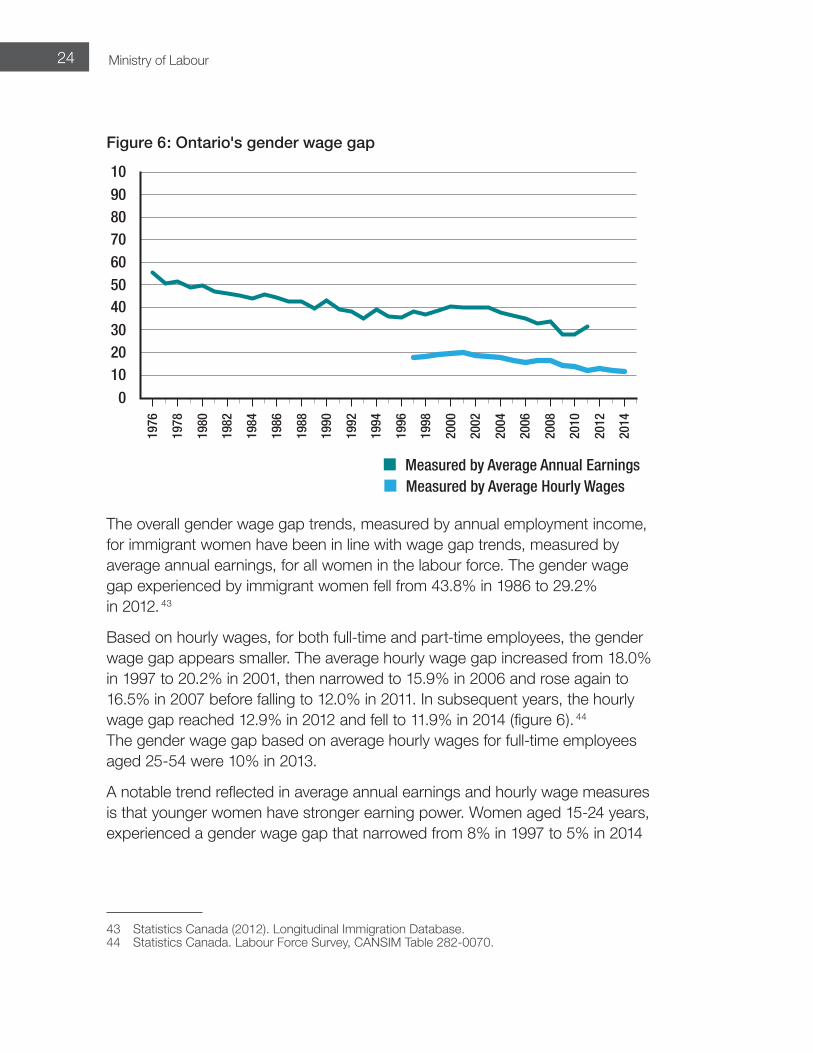
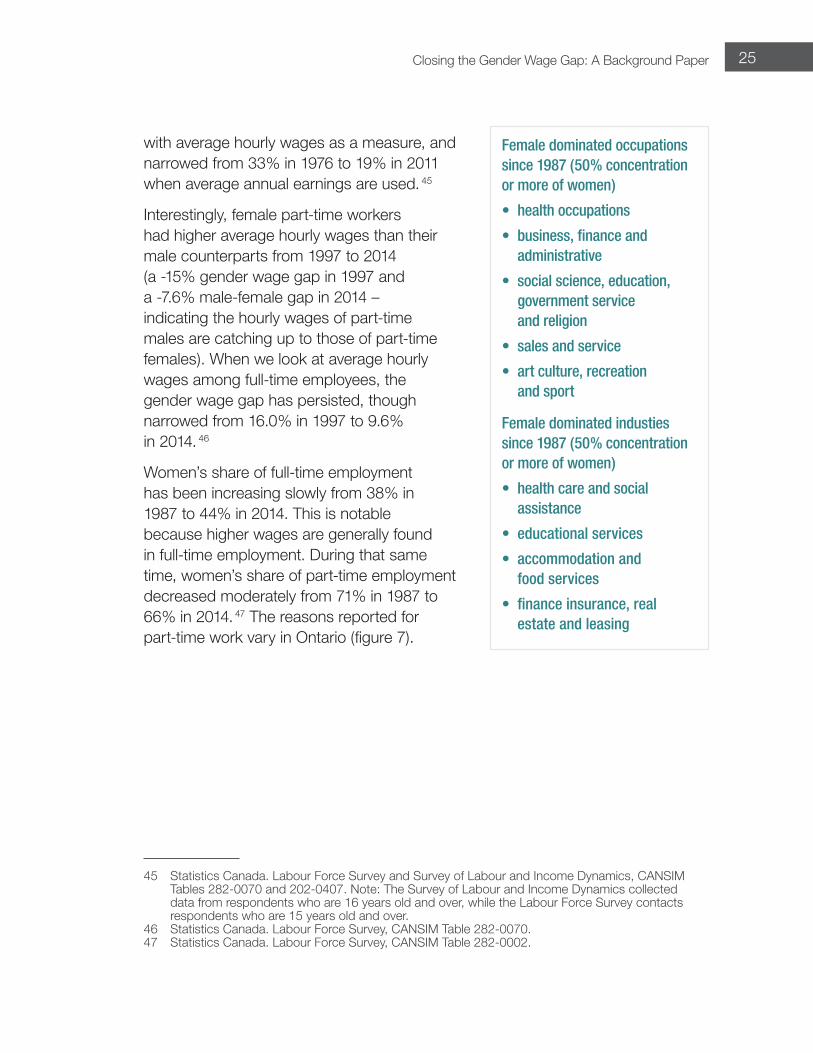
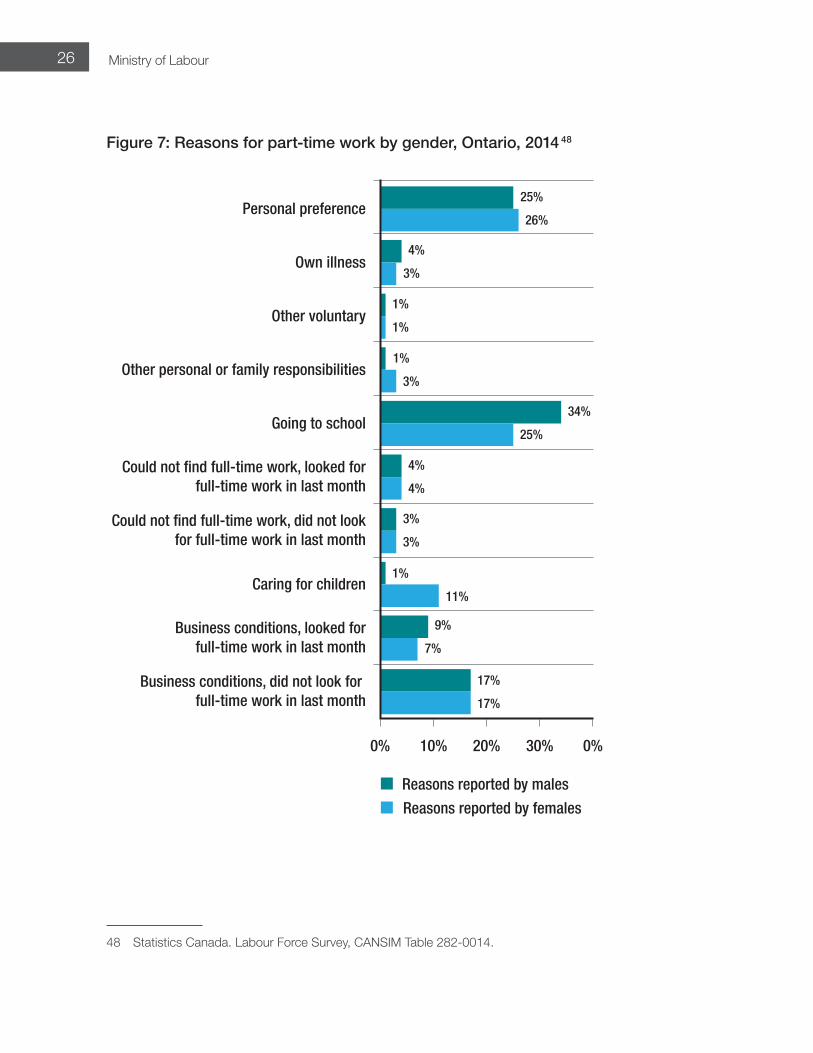
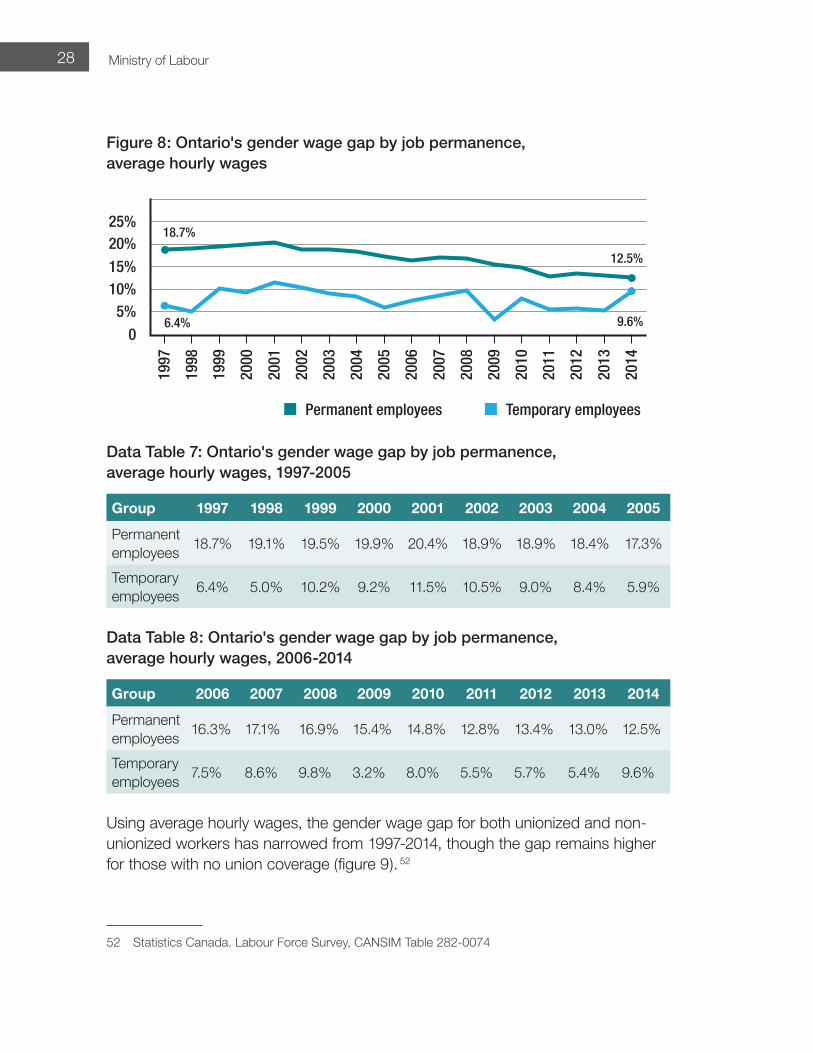