Closing the Achievement Gap in Math
27
-
Upload
savethepeace -
Category
Documents
-
view
221 -
download
0
Transcript of Closing the Achievement Gap in Math

8/3/2019 Closing the Achievement Gap in Math
http://slidepdf.com/reader/full/closing-the-achievement-gap-in-math 1/27

8/3/2019 Closing the Achievement Gap in Math
http://slidepdf.com/reader/full/closing-the-achievement-gap-in-math 2/27

8/3/2019 Closing the Achievement Gap in Math
http://slidepdf.com/reader/full/closing-the-achievement-gap-in-math 3/27

8/3/2019 Closing the Achievement Gap in Math
http://slidepdf.com/reader/full/closing-the-achievement-gap-in-math 4/27
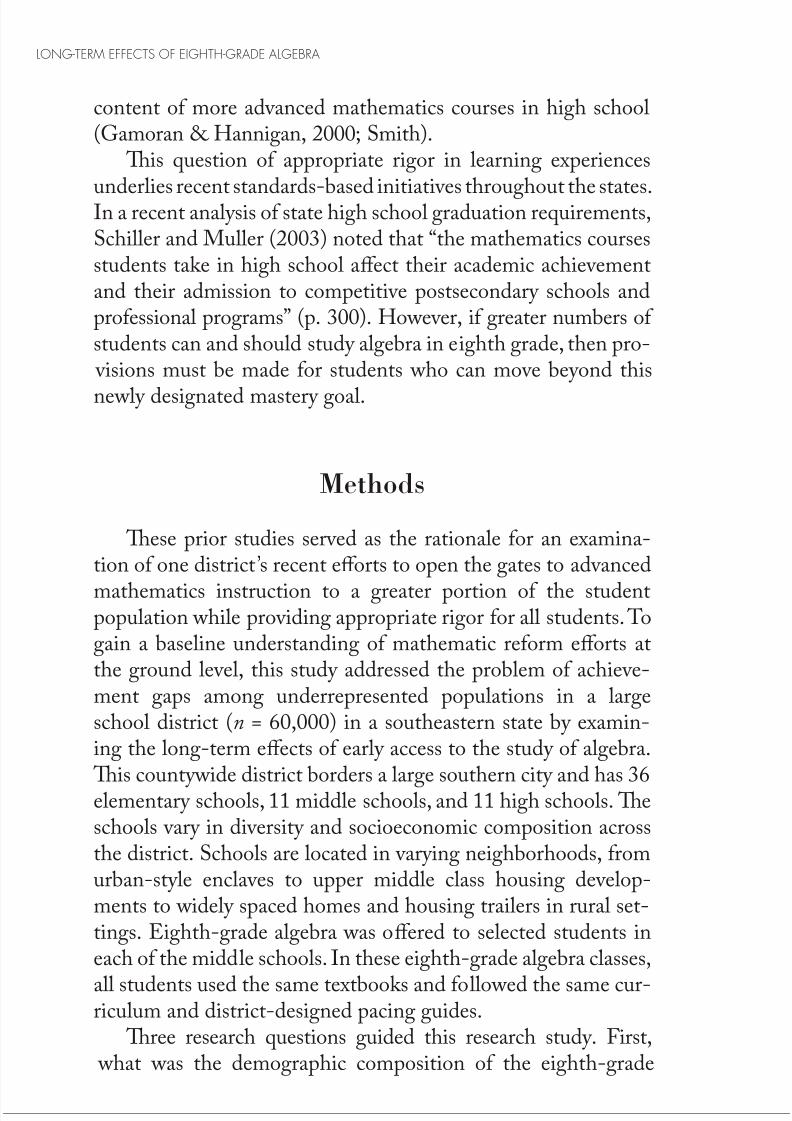
grade students. “Eff ectiveness” in that study referred to the suc-cess of students on the National Assessment of EducationalProgress (NAEP) measures of achievement in mathematics. In
fact, subsequently, the NCES (2001) reported that the NAEPdata indicated a clear relationship between eighth-grade stu-dents’ scores and their current mathematics course. Smith (1996)had also concluded that “early access to algebra has a sustainedpositive eff ect on students, leading to more exposure to advancedmathematics curriculum and, in turn, higher mathematics per-formance by the end of high school” (p. 148).
e study of algebra in eighth grade by all students could
potentially address the issue of mathematics literacy in theUnited States and result in greater numbers of students enrolledin advanced mathematics and science courses. An examina-tion of the Trends in International Mathematics and ScienceStudy (TIMSS; NCES, 1999) and the ird InternationalMathematics and Science Study–Repeat (TIMSS-R) attackedtraditional mathematics curricula in the United States and con-
cluded that “
e 8th-grade mathematics curriculum in the U.S.seems comparable to the average 7th-grade curriculum for otherparticipating countries, putting U.S. students a full year behindtheir global counterparts at age thirteen” (Greene, Herman, & Haury, 2000, p. 2). In that same year, the National Council of
Teachers of Mathematics (2000) issued new standards influ-enced by concerns about the performance of U.S. students in theinternational arena.
Assouline and Lupkowski-Shoplik (2005) warned thatthe original standards-based curriculum proposed by NCTMin 1989 was detrimental to mathematically talented studentsbecause teachers were discouraged from planning diff erentiatedand challenging curriculum. ey concluded that the revised ver-sion of the national mathematics standards (NCTM, 2000) doesin fact introduce rigor and challenge for all students throughout
the middle school years. However, they emphasized that teach-ers must be prepared to diff erentiate curriculum for mathemati-ll l d d i i h h d
Spielhag

8/3/2019 Closing the Achievement Gap in Math
http://slidepdf.com/reader/full/closing-the-achievement-gap-in-math 5/27
LONG-TERM EFFECTS OF EIGHTH-GRADE ALGEBRA
Cogan, Schmidt, and Wiley (2001) focused policymakerson strengthening mathematics literacy initiatives, particularly inthe nation’s middle schools, as a means of providing the basis
for more rigorous work in high school. Schmidt (2003) furtherdecried the U.S. pattern of little or no gain from 8th to 12th gradeas the result of a “middle school curriculum lacking coherence,
with little rigor or extreme variability in learning opportunitiesas a consequence of tracking policies” (p. 278). ese policiesfrequently result in a “dumbing down” of curriculum for many students in a typical middle school, especially among under-represented populations. VanTassel-Baska (2000) recommended
that curricular policy initiatives should take into account theneeds of high-ability learners but should also encourage under-represented groups to access rigorous courses. erefore, algebrastudy by greater numbers of eighth-grade students may improveoverall mathematics literacy among the larger population.
The Promise of Algebra
Eighth-grade algebra provides both rigor and opportunity, while potentially enhancing mathematics literacy across the stu-dent population. If education policymakers consider early accessto algebra as a means of increasing mathematics literacy, they must also provide equitable access to that literacy. erefore,research must continue to inform policymakers of the benefitsof early access to algebra, the availability of eighth-grade alge-
bra to all students, and the implications of algebra study amongdiverse populations.
Several studies have chronicled the correlation between stu-dents’ prior achievement, the timing of mathematics course-tak-ing, and performance on state standardized tests. NAEP (NCES,2001) data show that students who study algebra in the eighth oreven seventh grade do as well as or better on state standardized
tests than their peers who have not studied algebra. Students who were studying pre-algebra performed better in 2000 thand ki h l b i i h h d h (270

8/3/2019 Closing the Achievement Gap in Math
http://slidepdf.com/reader/full/closing-the-achievement-gap-in-math 6/27
ter than those taking pre-algebra (301 versus 270). Prior perfor-mance may have provided entry into algebra or even pre-algebrain eighth grade and may explain subsequent performance on
state standardized tests.Recent curricular reforms proposed by the NCTM (2000)address the potential efficacy of algebra for all students. However,the NCTM does not advocate the study of algebra in eighthgrade by all students. e NCTM does emphasize the develop-ment and study of algebraic concepts starting in prekindergartenand continuing throughout elementary and secondary school. eincorporation of algebraic skills in the primary and intermediate
grades may create a base for the study of algebra in eighth grade. e study of algebra enhances cognitive skills while serving asa gatekeeper to more advanced academic courses and enhancedopportunities after high school. Gamoran and Hannigan (2000)found that “whether cognitive diff erences among students leadto variation in learning rates, or not, taking algebra is still a goodidea for everyone” (p. 250). Moreover, Smith (1996) maintained
that “the question of whether schools should provide advancedcoursework to only a select few students remains at the cen-ter of this policy debate” (p. 149). Hallinan (2000) reported thather findings from a longitudinal study of high school studentssuggest that most students, with few exceptions, generally attainhigher achievement in a higher level group.
Because algebra is the gatekeeper course to advanced study in both mathematics and science (Smith, 1996), off ering algebra
in eighth grade to all students can begin to address the decline of achievement in high schools in the U.S. e sequential nature of mathematics precludes students from studying calculus in highschool unless they study algebra in eighth grade (Assouline & Lupkowski-Shoplik, 2005). Students who wait until 9th gradeto begin the study of algebra must double-up on mathematicscourses if they want to take calculus in 12th grade. Having stud-
ied calculus in high school, students are then better prepared fortaking mathematics courses in college. Regardless of their long-l d i h ll b fi f h f h
Spielhag
8/3/2019 Closing the Achievement Gap in Math
http://slidepdf.com/reader/full/closing-the-achievement-gap-in-math 7/27

8/3/2019 Closing the Achievement Gap in Math
http://slidepdf.com/reader/full/closing-the-achievement-gap-in-math 8/27
algebra class? Second, to what extent were the selection criteriafor this course implemented in an equitable manner across allpopulations in the district? Finally, to what extent were there
long-term advantages experienced by students who had studiedalgebra in eighth grade? is study involved a longitudinal follow-up to prior research
(Spielhagen, 2006) that revealed an overlap of entrance creden-tials and inequity in the outcomes among students in this district.Simply put, the data revealed that some students with the statedentrance credentials were not selected for eighth-grade algebra. is group of students, subsequently labeled the overlap group
became the subject of more detailed analysis and the impetus forexamination of the longitudinal implications of having studiedalgebra in eighth grade.
Data analysis in this study involved a sample of students(n = 2,634) who were in the 2004 high school graduation classand who had been divided into two groups: those who had beenselected for algebra in eighth grade and those who, by default of
not being selected, studied algebra in ninth grade. However, thereis an inherent selection bias that likely aff ected the mathematicsperformance of the eighth-grade algebra students. Students withhigher math ability or higher prior math achievement were morelikely to gain entrance into algebra in eighth grade. erefore,
when possible, analyses were conducted comparing subsets of students who had similar prior math ability and achievement.Examining the groups that overlapped in terms of their entrance
credentials provided the basis for a critical examination of theeducational paths taken by students after their eighth-grademathematics experience and of the long-term eff ects of early algebra instruction.
Examination of the data proceeded logically from descriptiveto comparative analyses. First, descriptive statistics examined thecharacteristics of the two pools within the dataset. en, logistic
regression examined the interplay of the background variables todetermine the degree to which they interacted to predict mem-b hi i i h I di id l h l l i l
Spielhag

8/3/2019 Closing the Achievement Gap in Math
http://slidepdf.com/reader/full/closing-the-achievement-gap-in-math 9/27
LONG-TERM EFFECTS OF EIGHTH-GRADE ALGEBRA
graphics and the opportunity for algebra in eighth grade. Finally,the long-term eff ects of having studied algebra in eighth grade
were explored using both descriptive statistics and ANOVAs
through three outcome variables: mathematics course-takingafter 8th grade; outcome tests of achievement, including math-ematics SAT scores in 11th grade; and college attendance aftergraduation from high school.
Results
Who Studied Algebra in Eighth Grade?
Longstanding district policy involved a complex nominationsystem that involved three universally employed criteria, work-ing in tangent with each other: (1) prior performance, as indi-cated by grades earned in seventh-grade mathematics classes, (2)scores on the Stanford 9 Mathematics Test administered at the
end of seventh grade, and (3) teacher nomination. In some of the middle schools, teacher nominations were supported by stu-dents’ scores on a locally designed algebra prognosis test, but this
was not a universal criterion across the district. Moreover, theopportunity to be selected for eighth-grade algebra was usually reserved for students already enrolled in honors mathematicsclasses. While students in nonhonors classes could be selected
for algebra in eighth grade, the large majority of those in eighth-grade algebra came from the honors classes.In the sample of students in this study, 45.6% (1,200) studied
algebra in eighth grade, and 54.4% (1,434) studied it in ninthgrade (the default option de facto not being selected for eighth-grade algebra.). More girls than boys took eighth-grade algebra,both in the total population and in each ethnic group. Moreover,descriptive statistics further revealed that selection for eighth-
grade algebra was disproportionate by ethnicity according topercentages of the two groups on the total population. Black

8/3/2019 Closing the Achievement Gap in Math
http://slidepdf.com/reader/full/closing-the-achievement-gap-in-math 10/27
grade algebra and 30% of the total ninth-grade algebra popula-tion. Similarly disparate percentages were noted for females inthis dataset. Table 1 displays algebra experience by gender andethnicity.
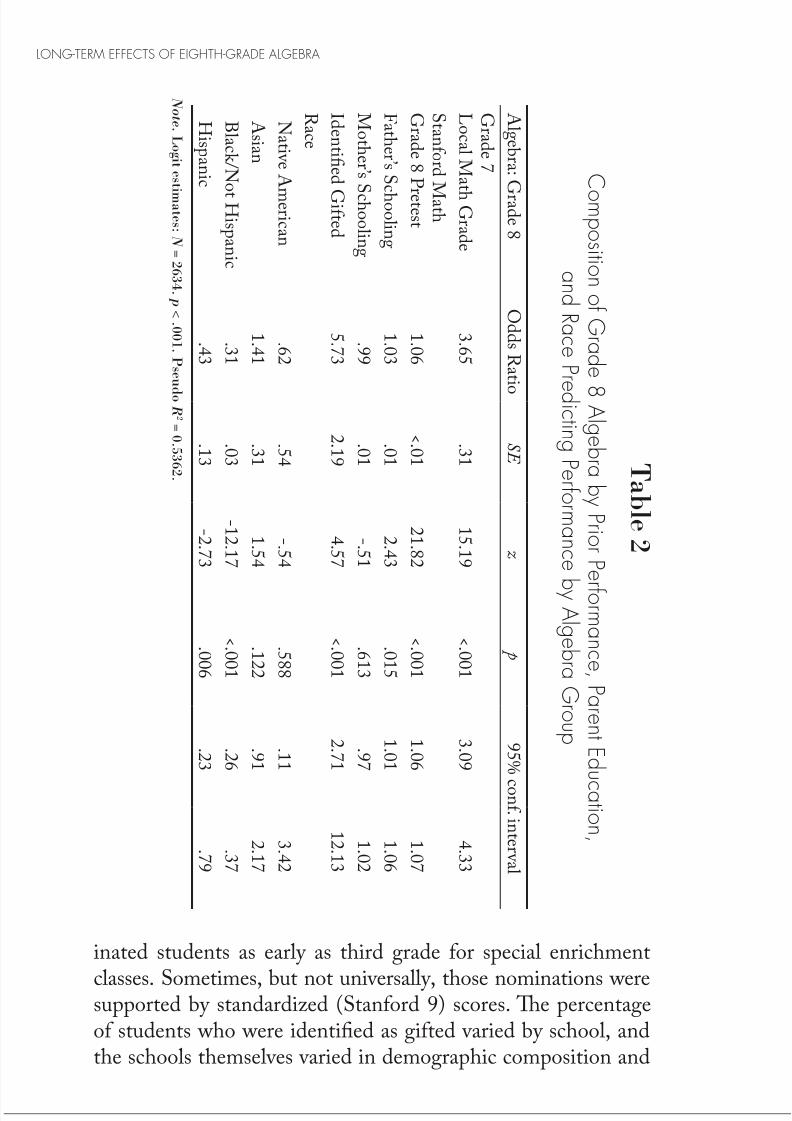
Logistic regression examined how background variables pre-dicted placement into each of the two treatment groups. Table 2
contains the results of this logistic regression.
e other variables were derived from designations related to the school experiencesof the students: Stanford test scores used for selection as a pre-test, local grades in seventh-grade math, and identification asgifted.
Not surprisingly, after controlling for the other variables inthe model, having been identified as gifted was the strongest
variable in predicting selection for eighth-grade algebra, but that
variable also had the largest confidence interval, perhaps an indi-cation of the inconsistency in the implementation of the identi-
Table 1
Total Population:Algebra Experience by Gender and Ethnicity
Grade 8 Students Algebra in Grade 8 Grade 8 Math
Total Population N = 2,634
Totaln = 1,200
Malen = 592
Femalen = 608
Totaln = 1,434
Malen = 738
Femalen = 696
NativeAmerican
n = 3(<1%)
n = 1(<1 %)
n = 1(<1 %)
n = 0(0 %)
n = 2(<1%)
n = 0(0%)
n = 2(<1%)
Asian/PacificIslandn
= 64(3%)n
= 39(3%)n
= 20( 3.3%)n
= 19(2.6%)n
= 25(1.7%)n
= 19(2.6%)n
= 6(.86%)
Black, notHispanic
n = 458(20%)
n = 125(10%)
n = 53(8.9%)
n = 72(11.8 %)
n = 333(23.2%)
n = 145(19.6%)
n = 188(27%)
Hispanicn = 32(1%)
n = 11(1.5 %)
n = 9(1.5 %)
n = 2(<1%)
n = 21(1.5%)
n = 14(1.9%)
n = 7(1%)
Caucasian/Other
n = 2,077(75%)
n = 1,024(85.3%0
n = 509(85.9%)
n = 515(84.7%)
n = 1,053(73.4%)
n = 560(76%)
n = 493(71%)
Note. Percentages derive from data in the columns.
Spielhag
8/3/2019 Closing the Achievement Gap in Math
http://slidepdf.com/reader/full/closing-the-achievement-gap-in-math 11/27
LONG-TERM EFFECTS OF EIGHTH-GRADE ALGEBRA
inated students as early as third grade for special enrichment
classes. Sometimes, but not universally, those nominations weresupported by standardized (Stanford 9) scores. e percentage
T a b l e2
C
om p o s i t i on of Gr a d e
8 A l g e b r a b yP r i or P er f or m an c e ,P ar ent E d
u c at i on ,
an d R a c eP r e d i ct i n gP er f or m an c e
b yA l g e b r a Gr o u p
A l g e b r a :
G r a d e 8
O d d s R a t i o
S E
z
p
9 5 %
c o n f . i n t e r v a l
G r a d e 7
L o c a l M a t h G r a d e
3 . 6 5
. 3 1
1 5 . 1 9
< . 0 0 1
3 . 0 9
4 . 3 3
S t a n f o r d
M a t h
G r a d e 8 P r e t e s t
1 . 0 6
< . 0 1
2 1 . 8 2
< . 0 0 1
1 . 0 6
1 . 0 7
F a t h e r ’ s S
c h o o l i n g
1 . 0 3
. 0 1
2 .4 3
. 0 1 5
1 . 0 1
1 . 0 6
M o t h e r ’ s
S c h o o l i n g
. 9 9
. 0 1
- . 5 1
. 6 1 3
. 9 7
1 . 0 2
I d e n t i fi e d G i f t e d
5 . 7 3
2 . 1 9
4 . 5 7
< . 0 0 1
2 . 7 1
1 2 . 1 3
R a c e
N a t i v e A
m e r i c a n
. 6 2
. 5 4
- . 5 4
. 5 8 8
. 1 1
3 .4 2
A s i a n
1 .4 1
. 3 1
1 . 5 4
. 1 2 2
. 9 1
2 . 1 7
B l a c k / N
o t H i s p a n i c
. 3 1
. 0 3
- 1 2 . 1 7
< . 0 0 1
. 2 6
. 3 7
H i s p a n i c
.4 3
. 1 3
- 2 . 7 3
. 0 0 6
. 2 3
. 7 9
N o t e .L o gi t e s t i m a t e s : N=2 6 3 4 . p < . 0 0 1 .P s e u
d o R
2 = 0 . 5 3 6 2 .

8/3/2019 Closing the Achievement Gap in Math
http://slidepdf.com/reader/full/closing-the-achievement-gap-in-math 12/27
socioeconomic status. Similarly, after controlling for the other variables in the model, a one-point increase in seventh-grademath grades (on a traditional 4-point scale, with A = 4, B = 3,C
= 2,D
= 1) was associated with being more than three timesmore likely to take algebra in eighth grade. Moreover, each addi-tional percentage point on the Stanford Grade 8 pretest wasassociated with a 6% increase in the likelihood of taking eighth-grade algebra.
In this logistic regression, after controlling for the other variables in the model, ethnicity was statistically significant, pre-dicting the involvement of Black, non-Hispanic students in the
eighth-grade algebra classes.Moreover, additional examination of data deriving from free
and reduced lunch percentages (see Table 3) revealed a negativerelationship between the socioeconomic status of each school’spopulation and the number of students studying algebra in eighthgrade. In other words, the higher the percentage of students withfree and reduced lunch, the lower the number of students in
eighth-grade algebra.
e lower the percentage of students withfree and reduced lunch, the higher the number of students iden-tified as gifted, a label that was not universally defined across thedistrict and one that was a general label, not specific in nature.However, selection for the algebra classes implied mathematicaltalent. is finding accentuated the possibility of achievementgaps related to the algebra program in this district despite eff ortson the part of the district to administer its policy equitably.
Table 3 also shows that in some of the middle schools, very small numbers of students in the eighth grade studied geometry. ese numbers, although they are very small, suggest that thereis no defined pattern of course delivery across the district. ehighest number of students taking geometry in eighth grade (n =22) was in the school that was ranked seventh in socioeconomicstatus, according to free and reduced lunch percentages. e next
two highest numbers (n
= 17 andn
= 16 students) were in theschools with the highest SES in the district.F h i i l i i ANOVA i d h
Spielhag

8/3/2019 Closing the Achievement Gap in Math
http://slidepdf.com/reader/full/closing-the-achievement-gap-in-math 13/27
8/3/2019 Closing the Achievement Gap in Math
http://slidepdf.com/reader/full/closing-the-achievement-gap-in-math 14/27
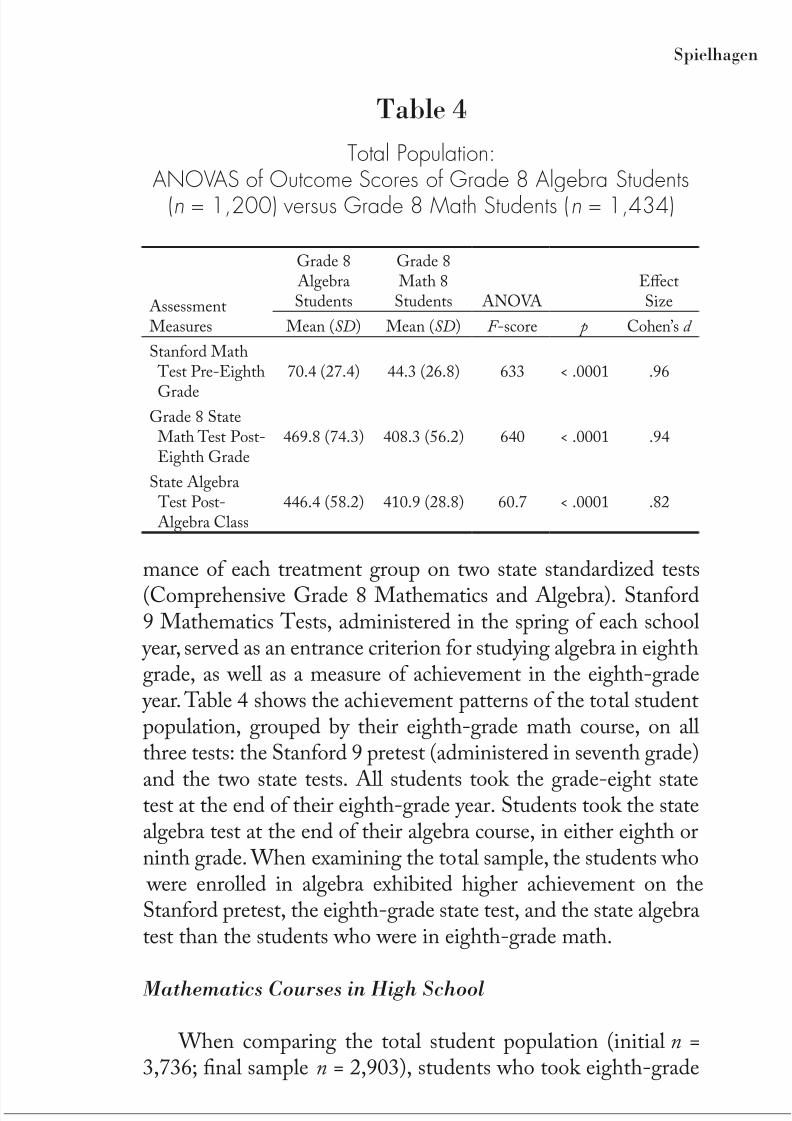
mance of each treatment group on two state standardized tests
(Comprehensive Grade 8 Mathematics and Algebra). Stanford9 Mathematics Tests, administered in the spring of each school
year, served as an entrance criterion for studying algebra in eighthgrade, as well as a measure of achievement in the eighth-grade
year. Table 4 shows the achievement patterns of the total studentpopulation, grouped by their eighth-grade math course, on allthree tests: the Stanford 9 pretest (administered in seventh grade)
and the two state tests. All students took the grade-eight statetest at the end of their eighth-grade year. Students took the statealgebra test at the end of their algebra course, in either eighth orninth grade. When examining the total sample, the students who
were enrolled in algebra exhibited higher achievement on theStanford pretest, the eighth-grade state test, and the state algebratest than the students who were in eighth-grade math.
Mathematics Courses in High School
Table 4
Total Population:ANOVAS of Outcome Scores of Grade 8 Algebra Students
(n = 1,200) versus Grade 8 Math Students (n = 1,434)
AssessmentMeasures
Grade 8AlgebraStudents
Grade 8Math 8
Students ANOVAEff ectSize
Mean (SD) Mean (SD) F -score p Cohen’s d
Stanford Math Test Pre-Eighth
Grade
70.4 (27.4) 44.3 (26.8) 633 < .0001 .96
Grade 8 StateMath Test Post-Eighth Grade
469.8 (74.3) 408.3 (56.2) 640 < .0001 .94
State Algebra Test Post-Algebra Class
446.4 (58.2) 410.9 (28.8) 60.7 < .0001 .82
Spielhag
8/3/2019 Closing the Achievement Gap in Math
http://slidepdf.com/reader/full/closing-the-achievement-gap-in-math 15/27
LONG-TERM EFFECTS OF EIGHTH-GRADE ALGEBRA
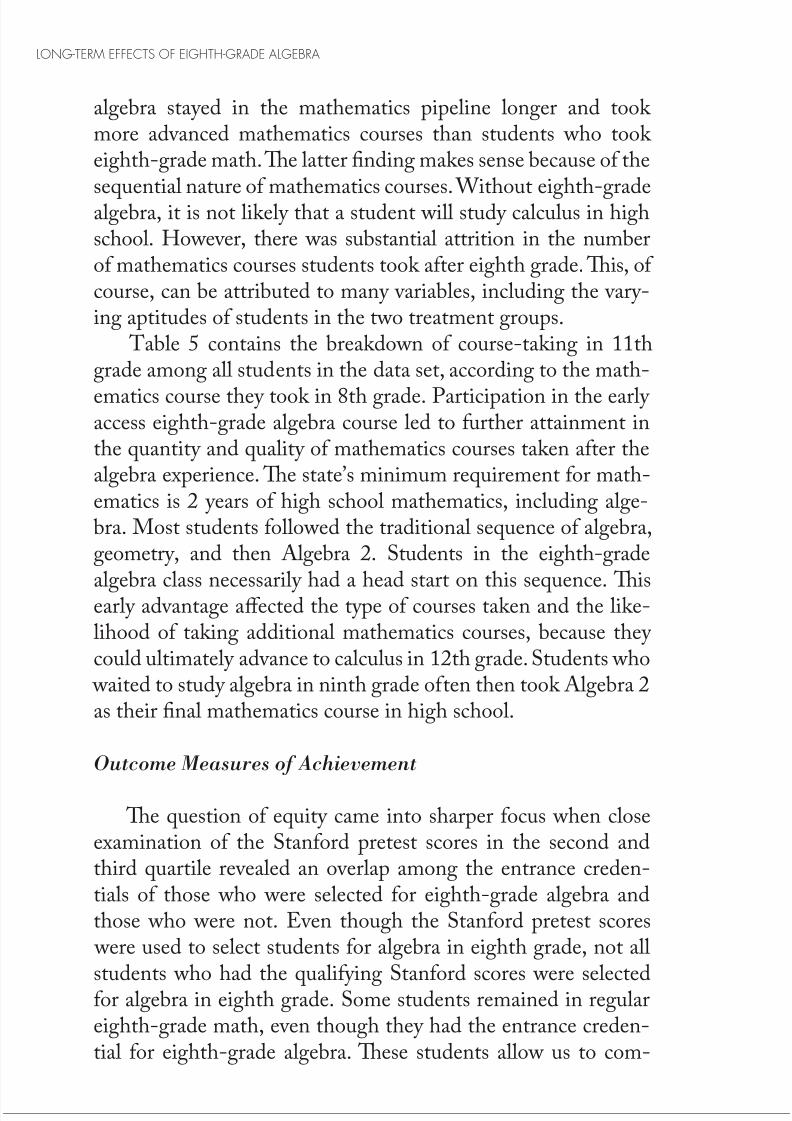
algebra stayed in the mathematics pipeline longer and took more advanced mathematics courses than students who took eighth-grade math. e latter finding makes sense because of the
sequential nature of mathematics courses. Without eighth-gradealgebra, it is not likely that a student will study calculus in highschool. However, there was substantial attrition in the numberof mathematics courses students took after eighth grade. is, of course, can be attributed to many variables, including the vary-ing aptitudes of students in the two treatment groups.
Table 5 contains the breakdown of course-taking in 11thgrade among all students in the data set, according to the math-
ematics course they took in 8th grade. Participation in the early access eighth-grade algebra course led to further attainment inthe quantity and quality of mathematics courses taken after thealgebra experience. e state’s minimum requirement for math-ematics is 2 years of high school mathematics, including alge-bra. Most students followed the traditional sequence of algebra,geometry, and then Algebra 2. Students in the eighth-grade
algebra class necessarily had a head start on this sequence.
isearly advantage aff ected the type of courses taken and the like-lihood of taking additional mathematics courses, because they could ultimately advance to calculus in 12th grade. Students who
waited to study algebra in ninth grade often then took Algebra 2as their final mathematics course in high school.
Outcome Measures of Achievement
e question of equity came into sharper focus when closeexamination of the Stanford pretest scores in the second andthird quartile revealed an overlap among the entrance creden-tials of those who were selected for eighth-grade algebra andthose who were not. Even though the Stanford pretest scores
were used to select students for algebra in eighth grade, not all
students who had the qualifying Stanford scores were selectedfor algebra in eighth grade. Some students remained in regulari h h d h h h h h d h d

8/3/2019 Closing the Achievement Gap in Math
http://slidepdf.com/reader/full/closing-the-achievement-gap-in-math 16/27
pare the math outcomes of two groups of students with similarinitial math performance on the same measure of achievement.
is representative sample was drawn from the second and thirdquartiles of the Stanford pretest scores. It contained approxi-
Table 5
Total Population:Group Membership and Attainment in Grade 11
Grade 8 AlgebraOriginal n = 1,460
Grade 8 Math 8Original n = 2,276
Grade 11 Math Course n % n %
Consumer Math 0 0 4 0.2%
Foundations of Algebra 1 0.1% 36 2%
Applied Algebra/Foundationsof Geometry 2 0.1% 82 4%
Applied Geometry 6 0.4% 189 11%
Algebra 1 0.1% 49 3%
Algebra Modified 0 0 3 0.2%
Geometry 9 0.7% 222 13%
Algebra 2 179 15% 1,035 62%
Enriched Algebra 2 17 1% 14 1%
Algebra 2/Trigonometry 2 0.1% 15 1%
Trigonometry/Advanced Algebra 125 10% 2 1%
Trigonometry/MathematicsAnalysis 506 41% 12 0.7%
Mathematics Analysis 313 26% 4 0.2%
High School Calculus 0 0 1 0.1%
AP Calculus AB 0 0 1 0.1%
Probability/Statistics 5 0.4% 0 0
SAT Mathematics Preparation 4 0.3% 6 0.3%
AP Statistics 4 0.3% 0 0
Integrated Pre-Calculus 3 48 4% 3 0.17%
Mathematics Models 2 0.1% 1 0.1%
Total 1,224 83.8% 1,679 73.8%
Note. This data was gathered 4 years after initial analysis. Total population in this dataset
varies from that of the original set.
Spielhag
8/3/2019 Closing the Achievement Gap in Math
http://slidepdf.com/reader/full/closing-the-achievement-gap-in-math 17/27
LONG-TERM EFFECTS OF EIGHTH-GRADE ALGEBRA
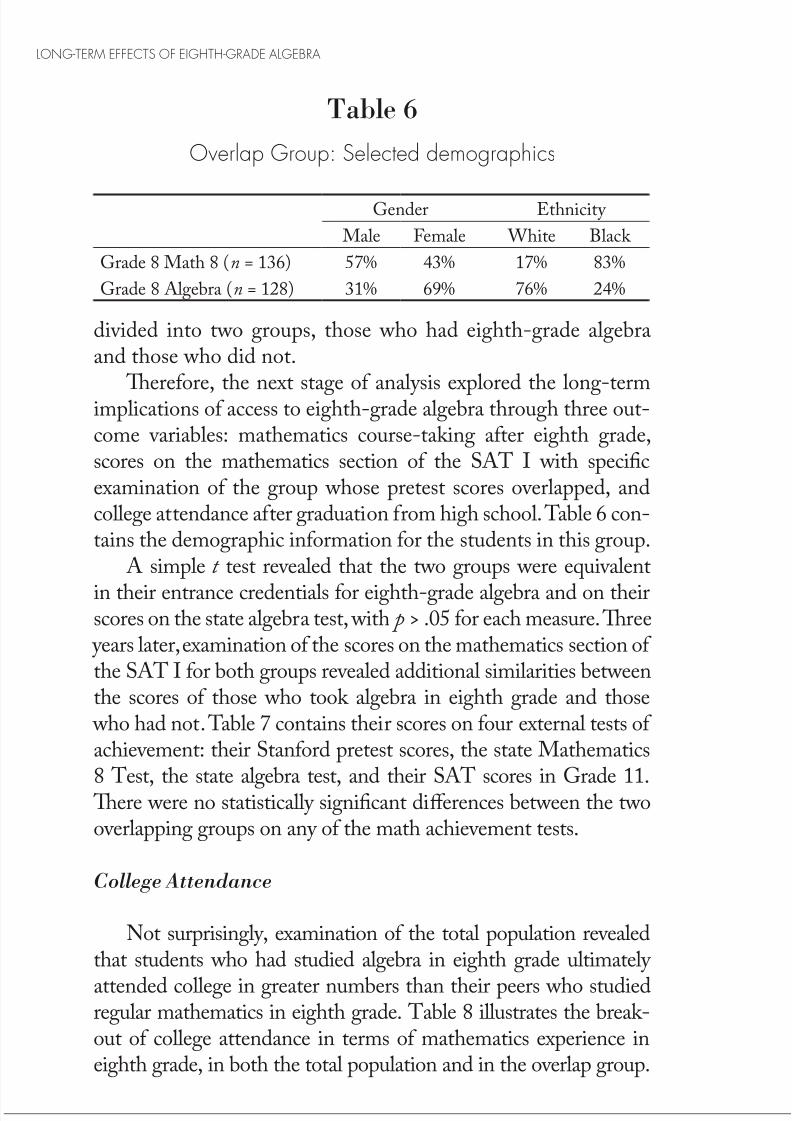
divided into two groups, those who had eighth-grade algebraand those who did not.
erefore, the next stage of analysis explored the long-termimplications of access to eighth-grade algebra through three out-
come variables: mathematics course-taking after eighth grade,scores on the mathematics section of the SAT I with specificexamination of the group whose pretest scores overlapped, andcollege attendance after graduation from high school. Table 6 con-tains the demographic information for the students in this group.
A simple t test revealed that the two groups were equivalent
in their entrance credentials for eighth-grade algebra and on theirscores on the state algebra test, with p > .05 for each measure. ree
years later, examination of the scores on the mathematics section of the SAT I for both groups revealed additional similarities betweenthe scores of those who took algebra in eighth grade and those
who had not. Table 7 contains their scores on four external tests of achievement: their Stanford pretest scores, the state Mathematics
8 Test, the state algebra test, and their SAT scores in Grade 11. ere were no statistically significant diff erences between the twooverlapping groups on any of the math achievement tests.
College Attendance
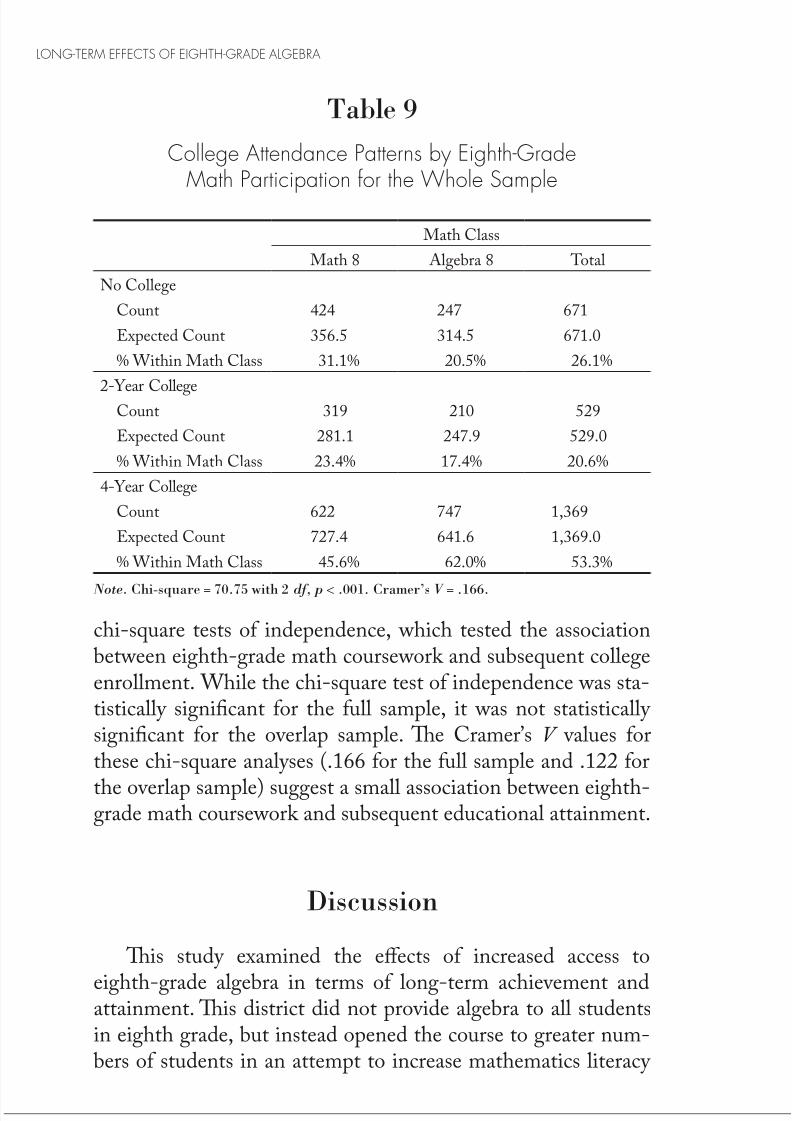
Not surprisingly, examination of the total population revealedthat students who had studied algebra in eighth grade ultimately
attended college in greater numbers than their peers who studiedregular mathematics in eighth grade. Table 8 illustrates the break-
Table 6
Overlap Group: Selected demographics
Gender Ethnicity
Male Female White Black
Grade 8 Math 8 (n = 136) 57% 43% 17% 83%
Grade 8 Algebra (n = 128) 31% 69% 76% 24%

8/3/2019 Closing the Achievement Gap in Math
http://slidepdf.com/reader/full/closing-the-achievement-gap-in-math 18/27
8/3/2019 Closing the Achievement Gap in Math
http://slidepdf.com/reader/full/closing-the-achievement-gap-in-math 19/27

8/3/2019 Closing the Achievement Gap in Math
http://slidepdf.com/reader/full/closing-the-achievement-gap-in-math 20/27
across diverse student populations, while maintaining a modifiedselection policy. In this study, restricting access to eighth-gradealgebra made no significant diff erence in the outcome perfor-mance of the students on the state algebra tests, whereas study-ing algebra in eighth grade yielded tangible benefits in termsof additional mathematics courses taken and subsequent college
attendance. is study had two important limitations. e first limitation
derives from the origin of the data sample, which was drawnfrom only one district. ese results cannot be generalizedbeyond this school district of 60,000 students. In addition, thedata was drawn over a period of 4 years. As a result, follow-updata analysis involved diff erent total populations, resulting from
the ways in which data was collected in the 11 high schools and11 middle schools in the district. However, because the practicef li iti t i hth d l b h b i
Table 10
College Attendance Patterns by Eighth-Grade MathParticipation for the Overlapping Groups
Math Class
Math 8 Algebra 8 Total
No College
Count 70 52 122
Expected Count 62.8 59.2 122.0
% Within Math Class 51.5% 40.6% 46.2%
2-Year CollegeCount 20 18 38
Expected Count 19.6 18.4 38.0
% Within Math Class 14.7% 14.1% 14.4%
4-Year College
Count 46 58 104
Expected Count 53.6 50.4 104.0
% Within Math Class 33.8% 45.3% 39.4%
Note. Chi-square = 3.91 with 2 df, p = .14. Cramer’s V = .122.
Spielhag

8/3/2019 Closing the Achievement Gap in Math
http://slidepdf.com/reader/full/closing-the-achievement-gap-in-math 21/27
LONG-TERM EFFECTS OF EIGHTH-GRADE ALGEBRA
other similar environments to explore whether the same results will ensue.
e second limitation involved the lack of information
regarding the content of the algebra courses. No additional infor-mation was available at the time of this study about the actualcontent and the type of study prescribed in the algebra coursesother than the fact that the curriculum was uniform throughoutthe schools. e district officials self-reported that all classes usethe same textbooks and that the curriculum addressed NCTMstandards. e district also had detailed pacing guides, suggest-ing that each algebra teacher taught the same topics in the same
sequence. When schools districts address the needs of diverse popula-
tions, they must strive to maintain equitable delivery of servicesto all students regardless of their socioeconomic background.However, despite this district’s intention of addressing potentialinequity in curriculum delivery, logistic regression revealed sig-nificantly lower odds of being selected for eighth-grade algebra
for Black students. In addition, the distribution of students ineighth-grade algebra courses in the various schools in the dis-trict suggests a disparity of access to algebra in eighth gradeaccording to the socioeconomic composition of each school. is
was evidenced by the inverse proportion of students in eighth-grade algebra and students needing free and reduced lunch. isfinding underscores the need for districts to be vigilant aboutadministering more inclusive policies equitably across the total
population.Across the total population, the students who studied alge-
bra in eighth grade ultimately took more mathematics coursesin high school than those who waited until ninth grade to study algebra. is is an important finding that bears some examina-tion and discussion. On the one hand, it is likely that students
who took more mathematics courses simply had greater ability in
math, greater natural interest in the subject, and greater satisfac-tion from taking math courses. On the other hand, a compellingi i b h l W ld h d i

8/3/2019 Closing the Achievement Gap in Math
http://slidepdf.com/reader/full/closing-the-achievement-gap-in-math 22/27
more mathematics courses if they had the opportunity to study eighth-grade algebra? Due to limits in data access related to stu-dent identification, subsequent math course-taking specifically
among the overlap group was not analyzed. However, becausethey had the same entrance credentials, having studied eighth-grade algebra might have opened the door to the possibility of taking more math courses in high school. e types and numberof math courses taken in high school also relate to the sequentialnature of the mathematics curriculum and state requirementsfor mathematics courses. Eighth-grade algebra provides an early start for taking more advanced courses.
Taking more mathematics courses in high school can contrib-ute to the overall mathematics literacy of the students involved.In a study of six schools in New York state, Spade, Columba, andVanfossen (1997) found that “Course taking is the most powerfulfactor aff ecting students’ achievement that is under the school’scontrol” (p. 125). Schools can address inequities related to socialclass by examining course off erings and the procedures used to
place students in classes. Gabelko and Sosniak (2002) found thatengagement in serious academic pursuits took precedence overdemographic identifiers like race, class, and ethnicity.
Another indicator of attainment is college attendance. Inthe entire sample, as well as in the overlap group, students inthe eighth-grade algebra group attended college at a greater ratethan students in the comparison group. Does greater access toeighth-grade algebra increase college attendance among a larger
base of students? ese results support that conclusion; how-ever, this study was descriptive and nonexperimental. erefore,it is impossible to draw causal inferences from the results of thisstudy. A variety of other factors (i.e., motivation, parental pres-sure, and the like) might impact both enrollment in eighth-gradealgebra and subsequent college attendance.
Finally, this study challenges traditional mathematics curric-
ular patterns that have reserved eighth-grade algebra for selectedstudents, because the selection processes may not be implementedi bl M i i f h
Spielhag

8/3/2019 Closing the Achievement Gap in Math
http://slidepdf.com/reader/full/closing-the-achievement-gap-in-math 23/27
LONG-TERM EFFECTS OF EIGHTH-GRADE ALGEBRA
be flawed and can adversely aff ect the opportunities aff orded tosome students. e results further suggest that greater numbersof students can successfully complete eighth-grade algebra and
accrue the benefits of that content.
ese results support the rec-ommendations of other earlier studies (Gamoran & Hannigan,2000; Ma, 2000; Smith, 1996) that report increased achievementpatterns overall related to eighth-grade algebra.
Implications
Although this study supports greater access to the study of algebra in eighth grade, it does not support that study as theend-goal for all students in eighth grade. ere will always bestudents on the lower end of the distribution who need morebasic mathematics instruction in eighth grade. However, thisstudy suggests that greater numbers of students may be capableof studying more rigorous mathematics topics in eighth grade.
Students who complete Algebra I in eighth grade may reap long-term benefits, as evidenced by the higher percentages of studentsattending college. At the same time, a logical implication of thebenefits of eighth-grade algebra for greater numbers of studentsis the question of appropriate diff erentiation for mathematically talented students. Assouline and Lupkowski-Shoplik (2005)cautioned against establishing curricula that improve instruction
for all students but create ceiling eff
ects for mathematically tal-ented students. e inherent flaw in a standards-based curricu-lum that prescribes minimum mastery is that even when the barfor that minimum has been raised, there will be some students
who can and will achieve mastery faster than others.Recent eff orts to increase the rigor of mathematics curricu-
lum for all students have made progress toward both improvingmathematics literacy and increasing the equity of course off er-
ings across all student populations. is justifiable change incurriculum delivery for all students should not preclude oppor-

8/3/2019 Closing the Achievement Gap in Math
http://slidepdf.com/reader/full/closing-the-achievement-gap-in-math 24/27
research should explore the implications of how off ering alge-bra to greater numbers of students in eighth grade aff ects theoptions for those students who exhibit mathematical talent.
School leaders are often reluctant to provide accelerationfor individual students because of the stigma attached to previ-ous tracking policies that were rigid and exclusive (Colangelo,Assouline, & Gross, 2004). Appropriately challenging mathe-matics instruction should be provided for all students when they need it and not be restricted to longstanding traditional curricu-lum designs. Moreover, increasing the rigor of mathematics cur-riculum in the intermediate and middle school grades can lead
to greater readiness for the study of algebra among more diversestudent populations.
Conclusion
Standards-driven curriculum reform has challenged edu-
cators to provide rigorous experiences for the total population. is study suggests that eighth-grade algebra may be beneficialfor greater numbers of students because it leads to increasedmathematics literacy, as evidenced by the type and number of mathematics courses studied in high school. Eighth-grade alge-bra also led to greater college attendance, both in the percentageof students attending college and the type of college attended.
is study suggests that increasing access to eighth-grade alge-bra may increase the incidence of advanced mathematics study among students not formerly involved in those courses.
References
Assouline, S., & Lupkowski-Shoplik, A. (2005). Developing math tal-ent: A guide for educating gifted and advanced learners in math. Waco,TX: Prufrock Press
Spielhag

8/3/2019 Closing the Achievement Gap in Math
http://slidepdf.com/reader/full/closing-the-achievement-gap-in-math 25/27

8/3/2019 Closing the Achievement Gap in Math
http://slidepdf.com/reader/full/closing-the-achievement-gap-in-math 26/27
National Council of Teachers of Mathematics. (2000). Principles and standards for school mathematics. Reston, VA: National Council of Teachers of Mathematics.
Schiller, K. S., & Muller, C. (2003). Raising the bar and equity? Eff ects
of state high school graduation requirements and accountabil-ity policies on students’ mathematics course taking. Educational
Evaluation and Policy Analysis, 25 , 299–315.Schmidt, W. (2003) Too little, too late: American high schools in an
international context. In D. Ravitch (Ed.), Brookings papers on edu-cation policy (pp. 253–278). Baltimore: Brookings Institute Press.
Smith, J. (1996). Does an extra year make any diff erence? e impact of early access to algebra on long-term gains in mathematics achieve-
ment. Educational Evaluation and Policy Analysis, 18 , 141–153.Spade, J., Columba, L., & Vanfossen, B. (1997, April). Tracking in
mathematics and science: Courses and course selection proce-dures. Sociology of Education, 70 , 108–127.
Spielhagen, F. (2006). Closing the achievement gap in math:Considering eighth-grade algebra for all students. AmericanSecondary Education, 34 (3), 29–42.
VanTassel-Baska, J. (2000) Curriculum policy development for sec-
ondary gifted programs: A prescription for reform coherence. NASSP Bulletin, 84 (615), 14–29.
Spielhag

8/3/2019 Closing the Achievement Gap in Math
http://slidepdf.com/reader/full/closing-the-achievement-gap-in-math 27/27