Clinical Standards Work: ImplicationsonFinanceImplications on Finance · 2015-11-12 · Clinical...
19
11/12/2015 1 Clinical Standards Work: Implications on Finance Implications on Finance HFMA Region 9 November 15, 2015 2:55‐3:45pm Charles G. Macias M.D., M.P.H, Texas Children’s Chief Clinical Systems Integration Officer • Describe the role of variation in health care delivery and how it impacts quality of care • Describe the process of developing clinical standards across a health care Learning Objectives system. • Discuss opportunities for engagement of clinicians in linking clinical standards work with patient outcomes and financial outcomes • Describe how an EDW and care process implementation can encourage a culture of quality and safety, providing physicians with the necessary tools to integrate financial relevance into the practice of delivering high‐quality healthcare. 2
Transcript of Clinical Standards Work: ImplicationsonFinanceImplications on Finance · 2015-11-12 · Clinical...
11/12/2015
1
Clinical Standards Work: Implications on FinanceImplications on FinanceHFMA Region 9November 15, 2015 2:55‐3:45pm
Charles G. Macias M.D., M.P.H,Texas Children’s Chief Clinical Systems Integration Officery g
• Describe the role of variation in health care delivery and how it impacts quality of care• Describe the process of developing clinical standards across a health care
Learning Objectives
system.• Discuss opportunities for engagement of clinicians in linking clinical standards work with patient outcomes and financial outcomes• Describe how an EDW and care process implementation can encourage a culture of quality and safety, providing physicians with the necessary tools to integrate financial relevance into the practice of delivering high‐quality healthcare.
2

11/12/2015
2
Johnny Jones
8 year old boy with a history of lung transplant
• Emergency department: his triage evaluation demonstrated heart rate and other findings consistent with early signs of shock
• Delivery of critical resuscitation fluids was slow and undertreated
• Antibiotics arrived hours after they were ordered
• Lung inpatient unit: a “Rapid Response Team” was called 3 ½ hours after the evaluation of concerning signs and symptoms
• Pediatric Intensive Care Unit• Blood pressure was not obtainable
P t til t• Put on a ventilator
• Aggressive drug therapies
• Procedural interventions to artificially oxygenate his blood
Johnny died 18 hours after he first arrived
Root cause analysis
• Diagnostic and therapeutic errors identified in the ED and theidentified in the ED and the inpatient ward by multiple provider types
• A gap in meaningful communication between providers created confusion in management plans
• Neither management guidelines th EMR idi li i lnor the EMR were providing clinical
standards or clinical decision support for practitioners
Systems were not well integrated

11/12/2015
3
A similar story in New York State…
• The Rory Staunton ActThe Rory Staunton Act• Hospitals shall have in place evidence‐based protocols for the early recognition and treatment of patients with severe sepsis/septic shock…
• Analytics: all severe sepsis/septic shock patients to be entered in the NYS database for annual risk adjusted mortality rates
• Targeting systems of care
P bli H lth L St t f N Y kPublic Health Law, State of New York,
Sections 405.2 and 405.4 of Title 10
Quality care delivery?
• The degree to which health services for individuals and populations increase the likelihood of desired health outcomes and are consistent with current professional knowledge
KN Lohr, N Engl J Med, 1990
11/12/2015
4
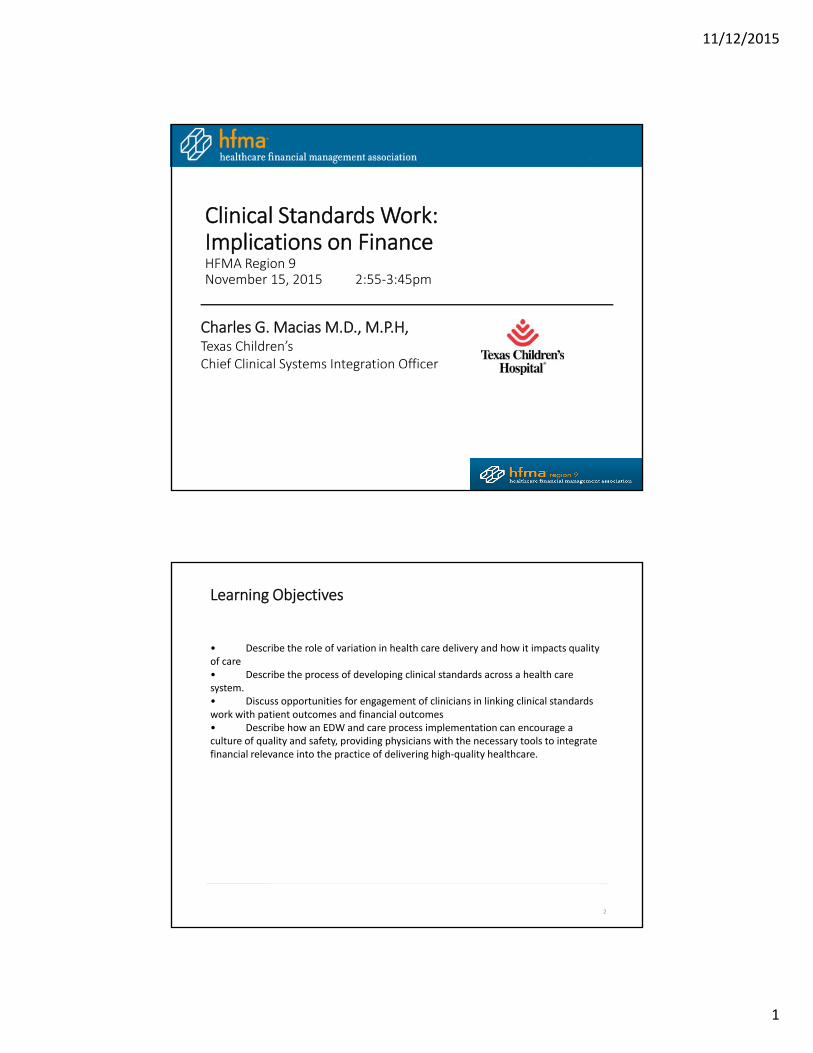
The Healthcare Value Equation
Quality
•In an environment where cost is marginally increasing, healthcare must markedly
improve quality.
Value=
Quality
Cost
7
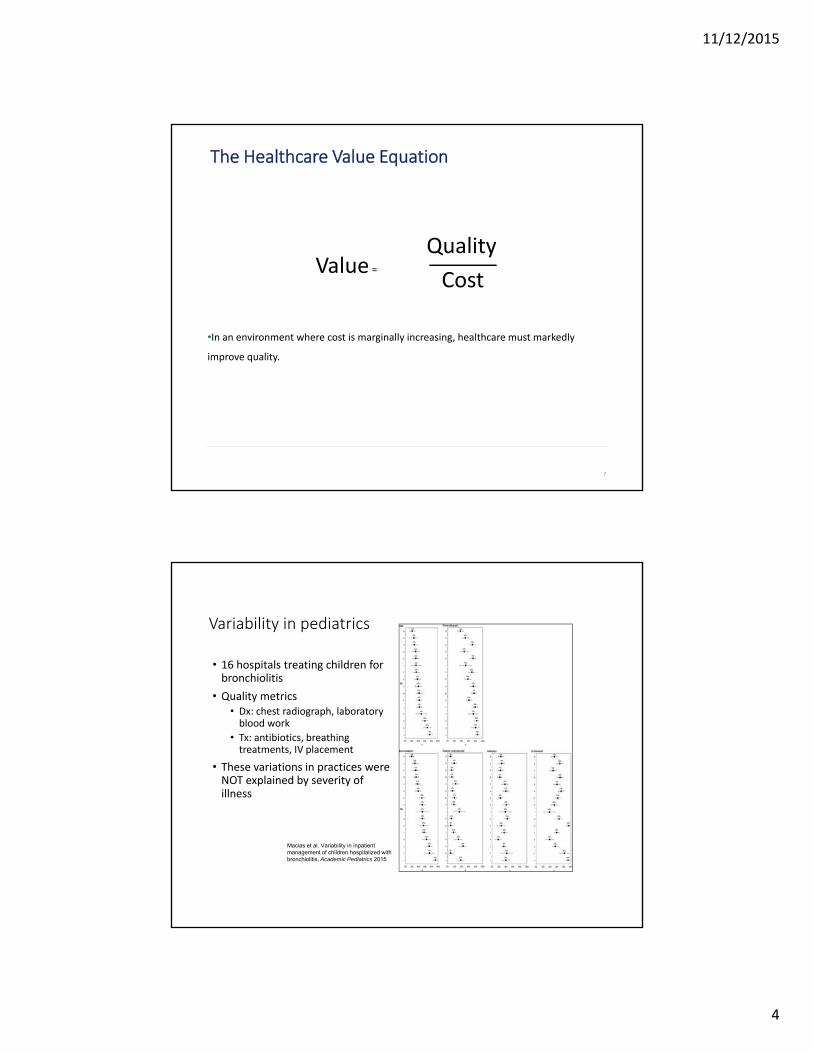
Variability in pediatrics
• 16 hospitals treating children for bronchiolitis
• Quality metrics• Dx: chest radiograph, laboratory blood work
• Tx: antibiotics, breathing treatments, IV placement
• These variations in practices were NOT explained by severity of illness
8
Macias et al. Variability in inpatient management of children hospitalized with bronchiolitis, Academic Pediatrics 2015

11/12/2015
5
Explaining variation: translating the evidence
IOM 2013
Describing variation in care in three pediatric diseases:
Correlation between quality and cost
gastroenteritis, asthma, simple febrile seizure
• Pediatric Health Information System database (for data from 21 member hospitals)
• Two quality-of-care metrics measured for each disease process
• Wide variations in practice
• Increased costs were NOT associated with lower
Kharbanda AB, Hall M, Shah SS, Freedman SB, Mistry RD, Macias CG, Bonsu B, Dayan PS, Alessandrini EA, Neuman MI. Variation in resource utilization across a national sample of pediatric emergency departments. J Pediatr. 2013
Increased costs were NOT associated with lower admission rates or 3-day ED revisit rates

11/12/2015
6
The US Healthcare system is inefficient
Overuse for tests and therapies beyond established evidence
Procedural/surgical intervention vs appropriate watchful wait
36%
$765Bof healthcare expenditures is waste (2009)• Unnecessary services• Inefficiently delivered services• Excess administrative costs
P i th t t hi h
$210
Billion
Discretionary use of services or devices
Unnecessary choice of higher cost services
• Prices that are too high• Missed prevention opportunities• FraudIOM, The Healthcare Imperative 2010; Berwick JAMA 2012
Reforming health care
Institute of Medicine Best Care at Lower Cost 2013

11/12/2015
7
Clinical standards/practice guidelines
• Systematically developed statements or recommendations to assist the practitioner about appropriate health care for specific clinical circumstances.
Institute of Medicine (1992). Guidelines for clinical practice: from development to use
• Evidence based guidelines help control complexity• Summarize available evidence and translate to guidance for care• Address treatment uncertainties and reduces variation in care delivery where evidence lacks
• Help maximize use of health care resources: system efficiency• Improved patient outcomes: diagnostic accuracy and therapeutic effectiveness
• Enhance shared decision‐making between patients and physicians• Provide a framework for analytics
• Pareto principle• Pareto principle• 80/20 rule
• 20% of the problems cause 80% of the trouble
Adapted from Penney and Foy. Best Practice and Research, 2007
Evidence Based Outcomes Center (TCH): systematic development of clinical standards
Id tif i lit• Identifying quality gaps through big data
• High prevalence
• Resource intensive care
• High morbidity or mortality
• Marked variations in carecare
• EDW, analytics and the key process analysis

11/12/2015
8
EBOC process
1.Identify the quality problem/gaps: mortality, resource consumption, variability, prevalence
2 Search for existing guidelines and assess their applicability2.Search for existing guidelines and assess their applicability
3.Assemble a group of stakeholders (bottom up, never top down)
4.Identify the Patient Intervention Comparison Outcomes (PICO) questions
5.Search the evidence
6.Evaluate the evidence using an evidence rating AND recommendation rating tool
7.Vet with stakeholders7.Vet with stakeholders
8.Once approved, build into Epic with consider for clinical decision support
Evidence Based Outcome Center
Acute Chest Syndrome *updatedAcute Gastroenteritis Acute Heart FailureAcute Hematogenous OsteomyelitisAcute Ischemic Stroke
Days *updatedFever Without Localizing Signs (FWLS) 2-36
Months *updatedHyperbilirubinemiaIntraosseous Line Placement
Acute Otitis MediaApparent Life-Threatening Event (ALTE)Appendicitis *updatedArterial ThrombosisAsthma *updatedAttention Deficit Hyperactivity DisorderAutism Assessment and DiagnosisBronchiolitis *updatedCancer Center Procedural ManagementCardiac ThrombosisCentral Line-Associated Bloodstream InfectionsClosed Head InjuryCommunity-Acquired Pneumonia *updatedCystic Fibrosis – Nutrition/GI >12 y/o *updatedC-Spine Assessment
IV Lock TherapyKawasaki DiseaseMigraine Treatment-Emergency CenterNeonatal ThrombosisNutrition/Feeding in the Post-Cardiac NeonateObstetric Hemorrhage due to Uterine AtonyPerioperative Management of Anterior Mediastinal MassesPICC SecurementProcedural Sedation *updatedRapid Sequence IntubationRespiratory Management of Preterm Infants Septic ArthritisSeptic ShockSkin and Soft Tissue Infection p
Deep Vein ThrombosisDiabetes Perioperative ManagementDiabetic Ketoacidosis Fever and Neutropenia in Children with Cancer Fever Without Localizing Signs (FWLS) 0-60
Status EpilepticusSuspected Child Physical AbuseTracheostomy ManagementUrinary Tract Infection

11/12/2015
9
Clinical Systems Integration domains
“The means to facilitate the coordination of
patient care across conditions, providers,
settings, and time in order to achieve care
that is safe, timely, effective, efficient,
equitable, and patient focused.” ‐The
American Medical Association
Analytic System
Science and Clinical Standards
Implementation
Cross cutting elements: clinical care, operations, and finance
Clinical System Integration Executive L d hi C il
Clinical Systems Integration Governance Structure
EMR and all clinical technologies
Clinical Implementation
Team
Clinical Technology
Council
Quality Improvement and permanent care process teams
Content and Analytics Team
EBP and the Enterprise Data Warehouse are
part of this structure
Leadership Council
Develops clinical standards
(guidelines) and oversees clinical data/ predictive
analytics
Prioritizes and Assess technology initiatives that integrate with EMR or proposed as
independent solutions
Oversees development and implementation of clinical programs/
analytics and knowledge assets
11/12/2015
10
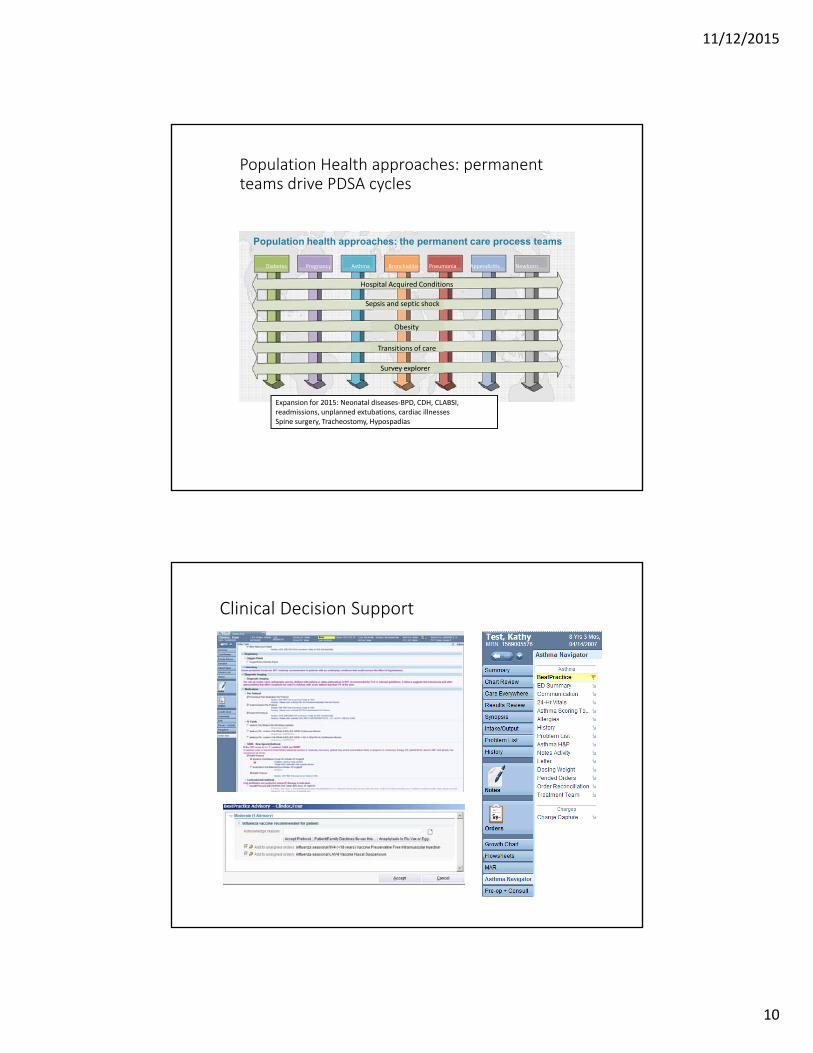
Population Health approaches: permanent teams drive PDSA cycles
Population health approaches: the permanent care process teamsp pp p p
Diabetes Pregnancy Asthma Bronchiolitis Pneumonia Appendicitis Newborn
Hospital Acquired Conditions
Sepsis and septic shock
Obesity
Transitions of care
Survey explorerSurvey explorer
Expansion for 2015: Neonatal diseases‐BPD, CDH, CLABSI, readmissions, unplanned extubations, cardiac illnessesSpine surgery, Tracheostomy, Hypospadias
Clinical Decision Support
20
11/12/2015
11
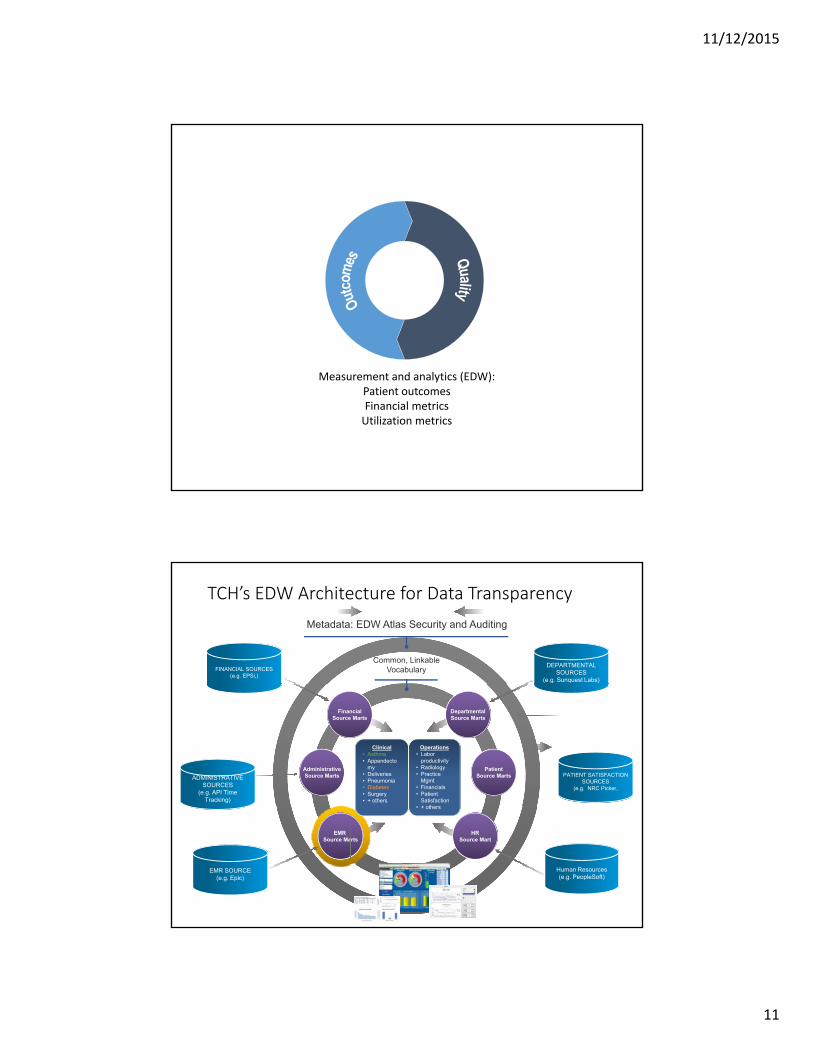
Measurement and analytics (EDW): Patient outcomesFinancial metricsUtilization metrics
Metadata: EDW Atlas Security and Auditing
Common, Linkable VocabularyFINANCIAL SOURCES
(e.g. EPSi,)
DEPARTMENTAL SOURCES
(e.g. Sunquest Labs)
TCH’s EDW Architecture for Data Transparency
FinancialSource Marts
AdministrativeSource Marts
DepartmentalSource Marts
PatientSource MartsADMINISTRATIVE
SOURCES(e.g. API Time
Tracking)
PATIENT SATISFACTIONSOURCES
(e.g. NRC Picker,
Operations• Labor
productivity• Radiology• Practice
Mgmt• Financials• Patient
Satisfaction+ others
Clinical• Asthma• Appendecto
my• Deliveries• Pneumonia• Diabetes• Surgery• + others
EMR Source Marts
HRSource Mart
EMR SOURCE (e.g. Epic)
Human Resources(e.g. PeopleSoft)
• + others

11/12/2015
12
Registry Financial Score Card from the EDW
23
Data Drives Waste Reduction: Approaches
Mean
1 box = 100
1.96 std
Excellent Outcomes Poor Outcomes
# of Cases
1 box = 100 cases in a year
Excellent Outcomes
# of Cases
Poor Outcomes
Option 1: Focus on Outliers – the prescriptive approach
St t Id tif t ith th t ti l f hi h t f b d
24
Strategy Identify extreme cases with the potential for high costs from bad outcomes and eliminate the unfavorable tail of the curve (“executive dashboard” approach)
Result If the outlier trim point is set at 1.96 standard deviations, only 2.5% of cases fall under the adverse outcome tail, so the impact is minimal

11/12/2015
13
Alternative Approaches to Waste Reduction
Mean
1 box = 100
Excellent Outcomes Poor Outcomes
# of Cases
1 box = 100 cases in a year
Excellent Outcomes
# of Cases
Poor Outcomes
Option 2: Focus On Inliers – improving quality outcomes across the majority
25
Strategy Identify best practices through research and analytics and develop guidelines and protocols to reduce inlier variation
Result Shifting the cases that lie above the mean toward the excellent end of the spectrum produces a much more significant impact
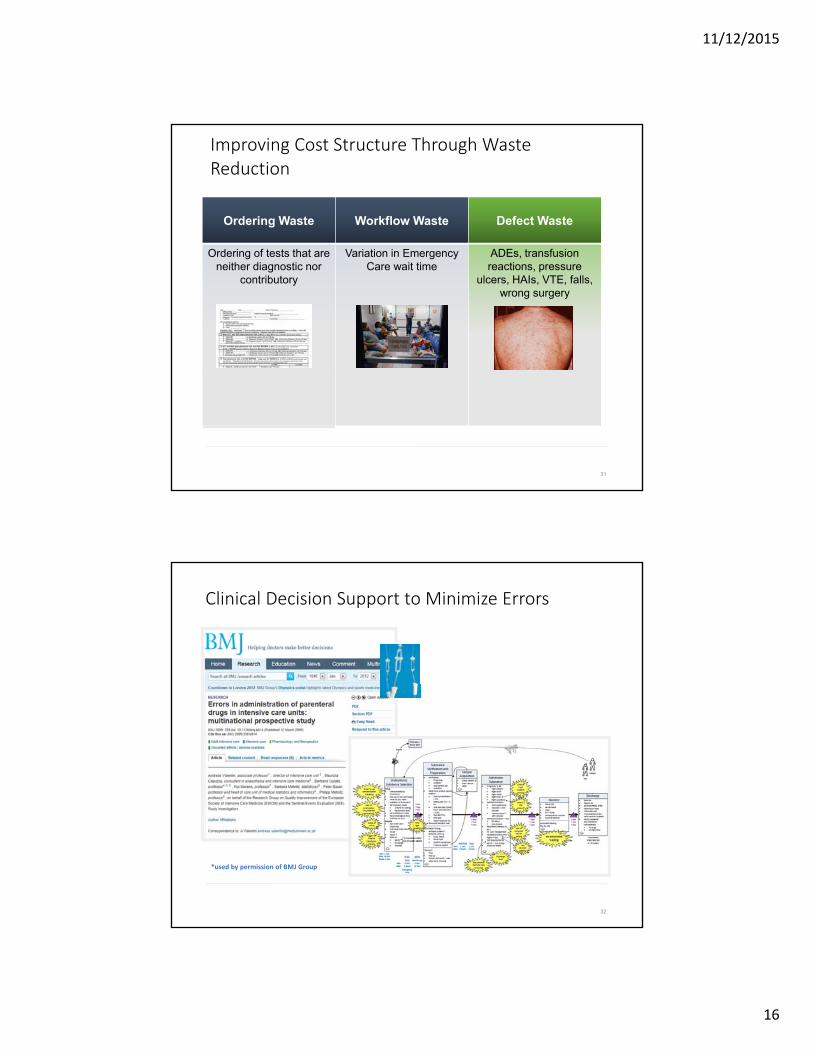
Improving Cost Structure Through Waste Reduction
Ordering WasteOrdering Waste Workflow Waste Defect WasteOrdering Waste
Ordering of tests that are neither diagnostic nor
contributory
Ordering of tests that are neither diagnostic nor
contributory
Variation in Emergency Care wait time
ADEs, transfusion reactions, pressure
ulcers, HAIs, VTE, falls, wrong surgery
Ordering of tests that are neither diagnostic nor
contributory
26

11/12/2015
14
Use Cases and Business Drivers
CXR utilization inCXR utilization in patients with known asthma, steroids in
bronchiolitis
Evidence equivocal
Evidence Supports
Quicker steroid delivery for status asthmaticus, goal
directed therapy for septic shock
27
Evidence againstHypertonic saline and bronchodilators in select patients with bronchiolitis
60%
70%
80%Asthma: Care Process Team Cohort, Percentage of Chest X-rays Ordered*
(Oct. 2010 - Apr. 2013)
51%
35%
0%
10%
20%
30%
40%
50%
60%
Per
cent
age
Feedback of rates to hospitalists and Emergency Center clinicians Order set
revisions
28
Oct
. 10
No
v. 1
0
Dec
. 10
Jan
. 11
Feb
. 11
Mar
. 11
Ap
r. 1
1
May
. 11
Jun
. 11
Jul.
11
Au
g. 1
1
Sep
. 11
Oct
. 11
No
v. 1
1
Dec
. 11
Jan
. 12
Feb
. 12
Mar
. 12
Ap
r. 1
2
May
. 12
Jun
. 12
Jul.
12
Au
g. 1
2
Sep
. 12
Oct
. 12
No
v. 1
2
Dec
. 12
Jan
. 13
Feb
. 13
Mar
. 13
Ap
r. 1
3
Month year * Inpatient, Emergency Center (EC) and observation patients (Care Process Team cohort), P-Chart based upon EDW data extraction of 5/14/2013 (M& W).

11/12/2015
15
Improving Cost Structure Through Waste Reduction
Ordering WasteOrdering Waste Workflow Waste Defect WasteWorkflow Waste
Ordering of tests that are neither diagnostic nor
contributory
Ordering of tests that are neither diagnostic nor
contributory
Variation in Emergency Care wait time
ADEs, transfusion reactions, pressure
ulcers, HAIs, VTE, falls, wrong surgery
Variation in Emergency Care wait time
29
• Identify opportunities for evidence infusion
Integrated into our shared savings model
30
11/12/2015
16
Improving Cost Structure Through Waste Reduction
Ordering WasteOrdering Waste Workflow Waste Defect WasteDefect Waste
Ordering of tests that are neither diagnostic nor
contributory
Ordering of tests that are neither diagnostic nor
contributory
Variation in Emergency Care wait time
ADEs, transfusion reactions, pressure
ulcers, HAIs, VTE, falls, wrong surgery
ADEs, transfusion reactions, pressure
ulcers, HAIs, VTE, falls, wrong surgery
31
Clinical Decision Support to Minimize Errors
*used by permission of BMJ Group
32

11/12/2015
17
Financial Impact‐inpatient
33
$2,000
$2,500
$3,000
$3,500
$4,000
$4,500
$5,000 Asthma: Margin
‐$4,000
‐$3,500
‐$3,000
‐$2,500
‐$2,000
‐$1,500
‐$1,000
‐$500
$0
$500
$1,000
$1,500
2011 Q1 2011 Q2 2011 Q3 2011 Q4 2012 Q1 2012 Q2 2012 Q3 2012 Q4 2013 Q1 2013 Q2 2013 Q3 2013 Q4 2014 Q1 2014 Q2
EBG inCare Process
34
‐$5,000
‐$4,500
$4,000 EBG in EMR
Process Team

11/12/2015
18
38 registries aligned g gwith clinical standards
Clinical operational and financial data in V3
ROI For Diabetes CPT An analysis of one improvement aim
Aim: Decrease length of stay for children with diabetic k t id i b d l t
CPT Cost = continuing human resource costs = time in meetings + % of employees designated to CPT
Did not include CPT start-up costs or hardware/software costs
∆ Net revenue = change in revenue for DKA admits + increased revenue from increased capacity compared to 2013
ketoacidosis by development of a Diabetic Care Unit
Unit opened in Summer 2014
Preliminary analysis suggests break‐even point achieved

11/12/2015
19
Lessons learned
• Wide variations in practice can be minimized with systematically developed clinical standards
• Quantitative assessments can help identify gaps in quality
• Systematic use of tools will help standardize approaches to the integrity of clinical standards
• Governance, and a clinical systems integration strategy are critical to effective uptake
• Evaluation of outcomes through analytics allows guided implementation and transparency of outcomesimplementation and transparency of outcomes
• Financial metrics may be linked to demonstrate and hardwire cultural attention to value and clinical standards work
Improving outcomes for populations…
Stiefel M, Nolan K. A Guide to Measuring the Triple Aim: Population Health, Experience of Care, and Per Capita Cost. IHI Innovation Series white paper. Cambridge, Massachusetts: Institute for Healthcare Improvement; 2012