CLINICAL PHARMACOLOGY – PART ONE - HIV Archivehivarchive.com/hiv11/uploads/Clinical Pharmacology -...
11
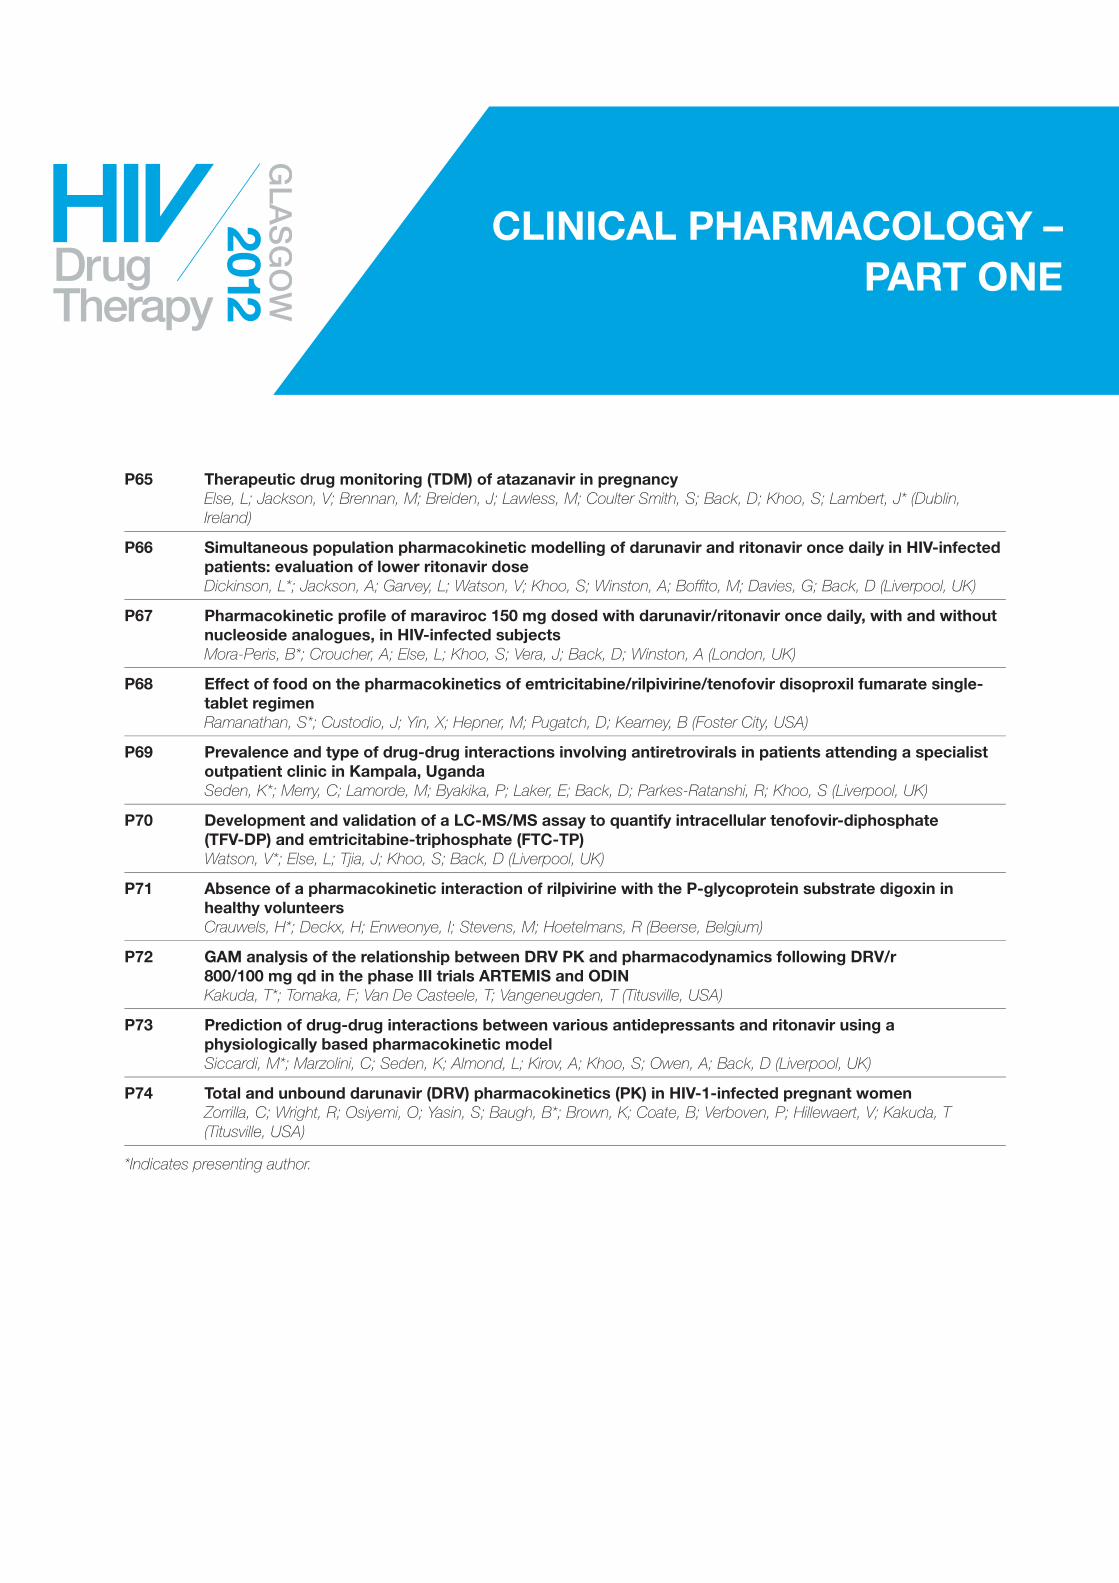
P65 Therapeutic drug monitoring (TDM) of atazanavir in pregnancy Else, L; Jackson, V; Brennan, M; Breiden, J; Lawless, M; Coulter Smith, S; Back, D; Khoo, S; Lambert, J* (Dublin, Ireland) P66 Simultaneous population pharmacokinetic modelling of darunavir and ritonavir once daily in HIV-infected patients: evaluation of lower ritonavir dose Dickinson, L*; Jackson, A; Garvey, L; Watson, V; Khoo, S; Winston, A; Boffito, M; Davies, G; Back, D (Liverpool, UK) P67 Pharmacokinetic profile of maraviroc 150 mg dosed with darunavir/ritonavir once daily, with and without nucleoside analogues, in HIV-infected subjects Mora-Peris, B*; Croucher, A; Else, L; Khoo, S; Vera, J; Back, D; Winston, A (London, UK) P68 Effect of food on the pharmacokinetics of emtricitabine/rilpivirine/tenofovir disoproxil fumarate single- tablet regimen Ramanathan, S*; Custodio, J; Yin, X; Hepner, M; Pugatch, D; Kearney, B (Foster City, USA) P69 Prevalence and type of drug-drug interactions involving antiretrovirals in patients attending a specialist outpatient clinic in Kampala, Uganda Seden, K*; Merry, C; Lamorde, M; Byakika, P; Laker, E; Back, D; Parkes-Ratanshi, R; Khoo, S (Liverpool, UK) P70 Development and validation of a LC-MS/MS assay to quantify intracellular tenofovir-diphosphate (TFV-DP) and emtricitabine-triphosphate (FTC-TP) Watson, V*; Else, L; Tjia, J; Khoo, S; Back, D (Liverpool, UK) P71 Absence of a pharmacokinetic interaction of rilpivirine with the P-glycoprotein substrate digoxin in healthy volunteers Crauwels, H*; Deckx, H; Enweonye, I; Stevens, M; Hoetelmans, R (Beerse, Belgium) P72 GAM analysis of the relationship between DRV PK and pharmacodynamics following DRV/r 800/100 mg qd in the phase III trials ARTEMIS and ODIN Kakuda, T*; Tomaka, F; Van De Casteele, T; Vangeneugden, T (Titusville, USA) P73 Prediction of drug-drug interactions between various antidepressants and ritonavir using a physiologically based pharmacokinetic model Siccardi, M*; Marzolini, C; Seden, K; Almond, L; Kirov, A; Khoo, S; Owen, A; Back, D (Liverpool, UK) P74 Total and unbound darunavir (DRV) pharmacokinetics (PK) in HIV-1-infected pregnant women Zorrilla, C; Wright, R; Osiyemi, O; Yasin, S; Baugh, B*; Brown, K; Coate, B; Verboven, P; Hillewaert, V; Kakuda, T (Titusville, USA) CLINICAL PHARMACOLOGY – PART ONE *Indicates presenting author.
Transcript of CLINICAL PHARMACOLOGY – PART ONE - HIV Archivehivarchive.com/hiv11/uploads/Clinical Pharmacology -...
P65 Therapeutic drug monitoring (TDM) of atazanavir in pregnancyElse, L; Jackson, V; Brennan, M; Breiden, J; Lawless, M; Coulter Smith, S; Back, D; Khoo, S; Lambert, J* (Dublin, Ireland)
P66 Simultaneous population pharmacokinetic modelling of darunavir and ritonavir once daily in HIV-infected patients: evaluation of lower ritonavir doseDickinson, L*; Jackson, A; Garvey, L; Watson, V; Khoo, S; Winston, A; Boffito, M; Davies, G; Back, D (Liverpool, UK)
P67 Pharmacokinetic profile of maraviroc 150 mg dosed with darunavir/ritonavir once daily, with and without nucleoside analogues, in HIV-infected subjectsMora-Peris, B*; Croucher, A; Else, L; Khoo, S; Vera, J; Back, D; Winston, A (London, UK)
P68 Effect of food on the pharmacokinetics of emtricitabine/rilpivirine/tenofovir disoproxil fumarate single-tablet regimenRamanathan, S*; Custodio, J; Yin, X; Hepner, M; Pugatch, D; Kearney, B (Foster City, USA)
P69 Prevalence and type of drug-drug interactions involving antiretrovirals in patients attending a specialist outpatient clinic in Kampala, UgandaSeden, K*; Merry, C; Lamorde, M; Byakika, P; Laker, E; Back, D; Parkes-Ratanshi, R; Khoo, S (Liverpool, UK)
P70 Development and validation of a LC-MS/MS assay to quantify intracellular tenofovir-diphosphate (TFV-DP) and emtricitabine-triphosphate (FTC-TP)Watson, V*; Else, L; Tjia, J; Khoo, S; Back, D (Liverpool, UK)
P71 Absence of a pharmacokinetic interaction of rilpivirine with the P-glycoprotein substrate digoxin in healthy volunteersCrauwels, H*; Deckx, H; Enweonye, I; Stevens, M; Hoetelmans, R (Beerse, Belgium)
P72 GAM analysis of the relationship between DRV PK and pharmacodynamics following DRV/r 800/100 mg qd in the phase III trials ARTEMIS and ODINKakuda, T*; Tomaka, F; Van De Casteele, T; Vangeneugden, T (Titusville, USA)
P73 Prediction of drug-drug interactions between various antidepressants and ritonavir using a physiologically based pharmacokinetic modelSiccardi, M*; Marzolini, C; Seden, K; Almond, L; Kirov, A; Khoo, S; Owen, A; Back, D (Liverpool, UK)
P74 Total and unbound darunavir (DRV) pharmacokinetics (PK) in HIV-1-infected pregnant womenZorrilla, C; Wright, R; Osiyemi, O; Yasin, S; Baugh, B*; Brown, K; Coate, B; Verboven, P; Hillewaert, V; Kakuda, T (Titusville, USA)
CLINICAL PHARMACOLOGY – PART ONE
*Indicates presenting author.
• There were 43 livebirths (including 2 sets of twins), one miscarriage and one stillbirth in the cohort.
• At the time nearest to delivery 36 patients had undetectable pVL, 6 patients had detectable pVL [65, 101, 108, 162, 291, 633 copies/mL] and 2 were unavailable.
• 33 (76%) patients remained on ART at PP for their own health.
aValues given as geometric mean (95% CI), bValues given as n (%), cValues given as median (range). Ctrough, total trough concentration. Adherence issues were suspected in three patients (ATV concentrations <assay LLQ): excluded from statistical analysis.
Table 2. ATV PK and virologic/immunological responses in 44 HIV-infected pregnant women receiving ATV/r (300/100 mg od).
Therapeutic drug monitoring (TDM) of atazanavir/ritonavir (ATV/r) in pregnancy. Laura J Else1, Valerie Jackson2, Marian Brennan2, Jackie Breiden3, David J Back1, Saye H Khoo1, Sam Coulter-Smith2, & John S Lambert2,3,5. 1Department of Pharmacology and Therapeutics, University of Liverpool, Liverpool, UK; 2The Rotunda Hospital, Dublin, Ireland; 3Department of Infectious Diseases, Mater Misericordiae University Hospital, Dublin, Ireland; 4University College Hospital Galway, Galway, Ireland; 5University College Dublin, Dublin, Ireland.
BACKGROUND • Pregnant women experience physiological changes during
pregnancy resulting in clinically significant alterations in antiretroviral pharmacokinetics (PK). Therefore, achieving and maintaining optimal plasma concentrations of antiretroviral drugs is essential for maternal health and minimising the risk of mother-to-child transmission (MTCT) of HIV.
• PK data on ATV/r exposure during pregnancy are inconsistent: some studies report significantly lower ATV concentrations antepartum compared with postpartum in patients receiving standard ATV/r dosing (300/100 mg od)1-
2; whereas others have reported no differences3-5.
OBJECTIVES • To determine ATV plasma concentrations in HIV infected
pregnant women receiving standard dosing of ATV/r (300/100 mg od) undergoing routine TDM during pregnancy and postpartum, and compare with historical data from a cohort of non-pregnant adults.
METHODS Subjects
• In this open labelled study, pregnant HIV-positive women received ATV/r as part of their routine pre-natal care.
• HIV-infected pregnant women attending the Infectious Diseases Clinic of the Mater Misericordiae University Hospital, Dublin were recruited between January 2007 and July 2011.
Study design
• Blood samples were collected at steady-state [post-dose (14-20 h)] in the first (T1), second (T2) and third trimesters (T3) of pregnancy. Women who remained on ATV/r after delivery had drug concentrations determined at postpartum (PP). Demographic and clinical parameters were collected.
• ATV trough concentrations (Ctrough) were monitored in real-time, and doses adjusted based on the ATV pre-determined MEC (150 ng/mL)6.
• Total plasma ATV concentrations were determined at the Liverpool Pharmacology Research Laboratories using a validated HPLC-MS/MS methodology. [LLQ = 11 ng/mL ]7.
Data analysis • All demographic and clinical characteristics were given as
the median (range). ATV trough concentrations were expressed in terms of the geometric mean with 95% confidence intervals (95% CI).
• ATV plasma concentrations observed antepartum and postpartum were related to the drug’s recommended MEC of 150 ng/mL. In addition, ATV plasma concentrations were compared with the estimated 50th and 10th percentiles from a cohort of HIV-infected non-pregnant adults receiving the standard dose of ATV/r (n=18)8.
• Differences in PK data antepartum (AP) vs. PP were assessed using a One-Way ANOVA (with Bonferroni correction to test for multiple comparisons). Additionally, patients with matched T3 and PP samples were compared using a paired t-test [Statsdirect (Version 2.6.8© 2008, Biomedical Software, Statsdirect Ltd, Cheshire, UK)]. Non-normally distributed data was log transformed. P values were two-sided at the 0.05 significance level.
RESULTS Study population
• A total of 44 women (37 black African) were enrolled in the study. Patient baseline characteristics are summarised in Table 1. All women received ATV/r at standard dose of 1 tablet once daily (300/100 mg od). The NRTI backbone was primarily Truvada.
• 20/44 women initiated ATV/r treatment during pregnancy. Median (range) gestation at initiation in these patients was 23.5 weeks (7-35). Median (range) gestation at delivery was 38.5 weeks (31.8-41.4), there were no HIV-infected infants.
ATV/r pharmacokinetics
• ATV PK data (geometric mean; 95% CI) and time of TDM sampling (h; post-dose) from 44 patients are summarized in Table 2.
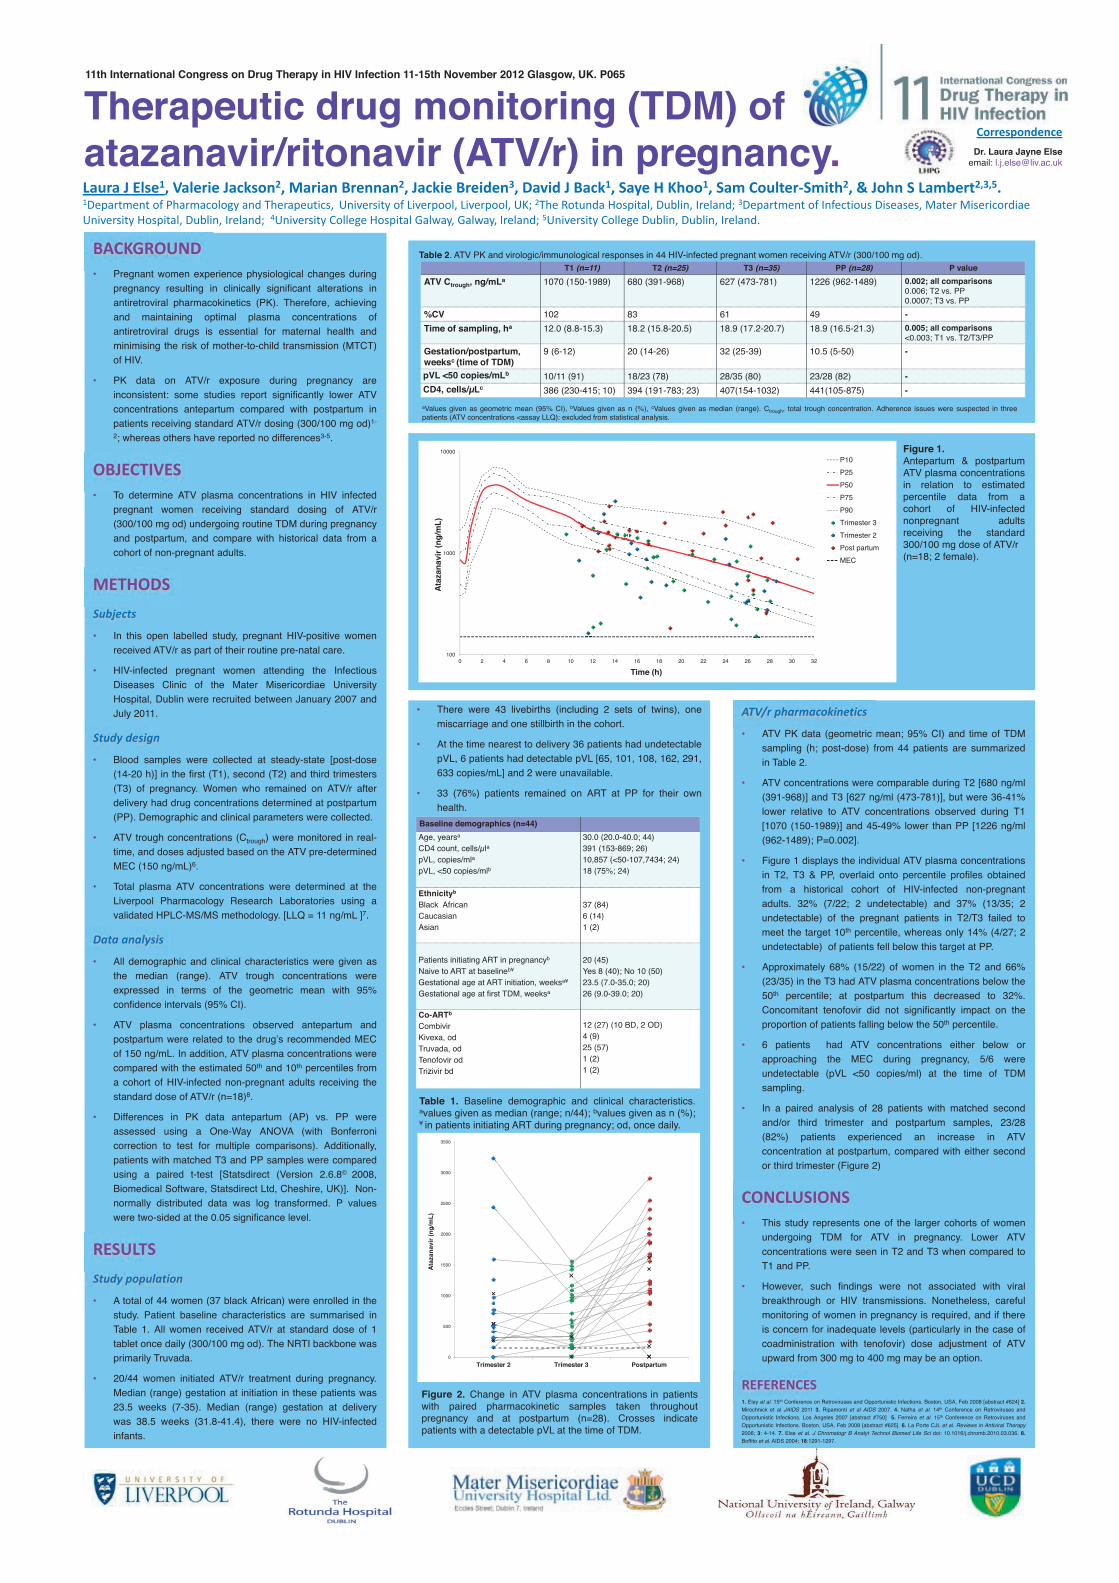
• ATV concentrations were comparable during T2 [680 ng/ml (391-968)] and T3 [627 ng/ml (473-781)], but were 36-41% lower relative to ATV concentrations observed during T1 [1070 (150-1989)] and 45-49% lower than PP [1226 ng/ml (962-1489); P=0.002].
• Figure 1 displays the individual ATV plasma concentrations in T2, T3 & PP, overlaid onto percentile profiles obtained from a historical cohort of HIV-infected non-pregnant adults. 32% (7/22; 2 undetectable) and 37% (13/35; 2 undetectable) of the pregnant patients in T2/T3 failed to meet the target 10th percentile, whereas only 14% (4/27; 2 undetectable) of patients fell below this target at PP.
• Approximately 68% (15/22) of women in the T2 and 66% (23/35) in the T3 had ATV plasma concentrations below the 50th percentile; at postpartum this decreased to 32%. Concomitant tenofovir did not significantly impact on the proportion of patients falling below the 50th percentile.
• 6 patients had ATV concentrations either below or approaching the MEC during pregnancy, 5/6 were undetectable (pVL <50 copies/ml) at the time of TDM sampling.
• In a paired analysis of 28 patients with matched second and/or third trimester and postpartum samples, 23/28 (82%) patients experienced an increase in ATV concentration at postpartum, compared with either second or third trimester (Figure 2)
CONCLUSIONS • This study represents one of the larger cohorts of women
undergoing TDM for ATV in pregnancy. Lower ATV concentrations were seen in T2 and T3 when compared to T1 and PP.
• However, such findings were not associated with viral breakthrough or HIV transmissions. Nonetheless, careful monitoring of women in pregnancy is required, and if there is concern for inadequate levels (particularly in the case of coadministration with tenofovir) dose adjustment of ATV upward from 300 mg to 400 mg may be an option.
REFERENCES 1. Eley et al. 15th Conference on Retroviruses and Opportunistic Infections. Boston, USA, Feb 2008 [abstract #624] 2. Mirochnick et al JAIDS 2011 3. Ripamonti et al AIDS 2007. 4. Natha et al. 14th Conference on Retroviruses and Opportunistic Infections. Los Angeles 2007 [abstract #750] 5. Ferreira et al. 15th Conference on Retroviruses and Opportunistic Infections. Boston, USA, Feb 2008 [abstract #625]. 6. La Porte CJL et al. Reviews in Antiviral Therapy 2006; 3: 4-14. 7. Else et al. J Chromatogr B Analyt Technol Biomed Life Sci doi: 10.1016/j.chromb.2010.03.036. 8. Boffito et al. AIDS 2004; 18:1291-1297.
Correspondence Dr. Laura Jayne Else
email: [email protected]
11th International Congress on Drug Therapy in HIV Infection 11-15th November 2012 Glasgow, UK. P065
Baseline demographics (n=44) Age, yearsa CD4 count, cells/µla pVL, copies/mla
pVL, <50 copies/mlb
30.0 (20.0-40.0; 44) 391 (153-869; 26) 10,857 (<50-107,7434; 24) 18 (75%; 24)
Ethnicityb
Black African Caucasian Asian
37 (84) 6 (14) 1 (2)
Patients initiating ART in pregnancyb
Naive to ART at baselineb¥ Gestational age at ART initiation, weeksa¥ Gestational age at first TDM, weeksa
20 (45) Yes 8 (40); No 10 (50) 23.5 (7.0-35.0; 20) 26 (9.0-39.0; 20)
Co-ARTb
Combivir Kivexa, od Truvada, od Tenofovir od Trizivir bd
12 (27) (10 BD, 2 OD) 4 (9) 25 (57) 1 (2) 1 (2)
Table 1. Baseline demographic and clinical characteristics. avalues given as median (range; n/44); bvalues given as n (%); ¥ in patients initiating ART during pregnancy; od, once daily.
T1 (n=11) T2 (n=25) T3 (n=35) PP (n=28) P value ATV Ctrough, ng/mLa 1070 (150-1989) 680 (391-968) 627 (473-781) 1226 (962-1489) 0.002; all comparisons
0.006; T2 vs. PP 0.0007; T3 vs. PP
%CV 102 83 61 49 - Time of sampling, ha 12.0 (8.8-15.3) 18.2 (15.8-20.5) 18.9 (17.2-20.7) 18.9 (16.5-21.3) 0.005; all comparisons
<0.003; T1 vs. T2/T3/PP Gestation/postpartum, weeksc (time of TDM)
9 (6-12) 20 (14-26) 32 (25-39) 10.5 (5-50) -
pVL <50 copies/mLb 10/11 (91) 18/23 (78) 28/35 (80) 23/28 (82) - CD4, cells/µLc 386 (230-415; 10) 394 (191-783; 23) 407(154-1032) 441(105-875) -
Figure 2. Change in ATV plasma concentrations in patients with paired pharmacokinetic samples taken throughout pregnancy and at postpartum (n=28). Crosses indicate patients with a detectable pVL at the time of TDM.
100
1000
10000
0 2 4 6 8 10 12 14 16 18 20 22 24 26 28 30 32
Ataz
anav
ir (n
g/m
L)
Time (h)
P10P25P50P75P90Trimester 3Trimester 2Post partumMEC
Figure 1. Antepartum & postpartum ATV plasma concentrations in relation to estimated percentile data from a cohort of HIV-infected nonpregnant adults receiving the standard 300/100 mg dose of ATV/r (n=18; 2 female).
0
500
1000
1500
2000
2500
3000
3500
Trimester 2 Trimester 3 Postpartum
Ataz
anav
ir (n
g/m
L)

Simulation & VPC: 91% and 92% of observed DRV and RTV concentrations, respectively were within the 90% prediction interval (P5-P95), suggesting an adequate model (Figure 2).
Of 1000 simulated DRV trough concentrations (concentrations 24h post-dose), 10% and 0% were below the recommended minimum effective concentration (MEC) for treatment-experienced (<0.55mg/L) and naïve patients (<0.055mg/L), respectively.
The 90% prediction interval of 1000 simulations of DRV/RTV 800/50 mg once daily is shown (Figure 2). Of the 1000 DRV trough concentrations 15% and 0% were below the MEC for treatment-experienced and naïve patients, respectively.
DRV area under the curve under over the dosing interval (AUC0-24) was 23% lower with 50 mg RTV compared to 100 mg (52 vs. 64 mg.h/L); which is consistent with previous data6.
CONCLUSIONS A population model simultaneously describing the
PK of once daily DRV/RTV in HIV patients has been developed and validated.
The model allowed simulation of DRV/RTV 800/50 mg once daily. Concentrations were lower but remained within the therapeutic range for treatment-naïve patients.
A lower RTV dose may prove beneficial to some patients by improving tolerability, particularly in those with RTV-related adverse events.
REFERENCES 1. Janssen-Cilag Ltd. Prezista® film-coated tablets Summary of Product Characteristics 2012 2. Janssen Pharmaceuticals, Inc. Prezista® (darunavir) film-coated tablets US Prescribing Information 2012 3. Jackson A. et al. Antivir Ther 2012; 17: 19-24 4. Garvey L. et al. Antivir Ther 2010; 15: 213-18 5. Jackson A. et al. J Acquir Immune Defic Syndr 2011; 58: 450-7 6. Hill A. et al. J Acquir Immune Defic Syndr 2011; 58: e137-8
Correspondence to: Laura Dickinson University of Liverpool Pharmacology Research Laboratories Block H, 1st Floor, 70 Pembroke Place Liverpool, L69 3GF, UK [email protected]
INTRODUCTION Antiretroviral therapy including once daily ritonavir-
boosted darunavir (DRV/RTV 800/100 mg) is a preferred regimen for treatment-naïve HIV-infected patients1-2.
Population pharmacokinetic (PK) modelling allows evaluation of factors that may influence concentrations of DRV/RTV.
Furthermore, by modelling the interaction between DRV and RTV alternative dosing strategies can be assessed (e.g. DRV/RTV 800/50 mg once daily).
OBJECTIVES Develop and validate a simultaneous population PK
model for once daily DRV/RTV. Investigate the influence of patient demographics on
DRV and RTV PK and evaluate a lower RTV dose (DRV/RTV 800/50 mg once daily).
METHODS Patients: Data were pooled from 3 PK studies3-5. A
total of 51 HIV patients (7 female) were included with a median (range) age, weight and baseline CD4 cell count of: 39 yr (21-63), 74 kg (57-105) and 500 cells/mm3 (227-1129), respectively; 49/51 were virologically suppressed at time of PK sampling.
All patients were stable on DRV/RTV 800/100 mg (n=32) or 900/100 mg once daily (n=19) and 1 PK profile per patient was included.
PK model: Non-linear mixed effects modelling was applied to DRV and RTV concentration-time data simultaneously (Monolix v. 4.1.2). Influence of age, weight, sex, and study were investigated on DRV and RTV PK parameters.
Model fit was assessed by statistical and graphical methods. A decrease in the minimal objective function value (OFV) of at least 3.84 points was required to accept a model with one extra parameter, as well as showing good graphical diagnostics.
Simulation & visual predictive check (VPC): A 90% prediction interval (P5-P95) was constructed from 1000 simulated patients using the final model estimates and observed data were superimposed. At least 90% of data points within the prediction interval was indicative of an adequate model.
DRV/RTV 800/50 mg once daily was simulated and compared to the standard regimen.
RESULTS PK model: A 2 and 1-compartment model with first
order absorption and lag-time best described DRV and RTV PK, respectively.
Inhibition of DRV apparent oral clearance (CL/F) by RTV followed a maximum effect model. A RTV concentration of 0.32 mg/L was associated with 50% maximum inhibition of DRV CL/F (maximum inhibitory effect fixed to 1).
Inclusion of age and study on DRV CL/F and weight on RTV CL/F and volume of distribution (V/F) using allometric scaling improved the fit.
The estimated CL/F of DRV in the absence of RTV was 16 L/h for study 1 and 2 and 26 L/h for study 3. PK parameters are summarised and diagnostic plots for DRV shown (Table 1; Figure 1).
Correspondence to:Laura DickinsonCorrespondence to:Laura Dickinson
Block H, 1Liverpool, L69 3GF, [email protected]
Simultaneous Population Pharmacokinetic Modelling of Darunavir and Ritonavir Once Daily in HIV-Infected Patients: Evaluation of Lower Ritonavir Dose
Laura Dickinson1, Akil Jackson2, Lucy Garvey3,4, Victoria Watson1, Saye Khoo1, Alan Winston3,4, Marta Boffito2, Geraint Davies1, David Back1
1 Department of Molecular & Clinical Pharmacology, University of Liverpool, Liverpool, UK 2 St Stephen’s Centre, Chelsea & Westminster Foundation Trust, London, UK 3 Imperial College, London, UK 4 Department of HIV & GU Medicine, Imperial College Healthcare NHS Trust, St Mary’s Hospital, London, UK
11th International Congress on Drug Therapy in HIV Infection, Glasgow, UK, 11-15 November 2012
Figure 1. DRV goodness-of-fit plots for the final model. (A) Population predictions vs. observed, (B) individual predictions vs. observed, (C) time vs. weighted residuals (WRES).
0
5
10
15
0 5 10 15
Obs
erve
d D
RV (m
g/L)
Population predicted DRV (mg/L)
-4-202468
0 4 8 12 16 20 24
WR
ES
Time (h)
(A)
(C)
Unity r2 = 0.563
Table 1. DRV and RTV parameter estimates and relative standard errors (RSE) obtained from the final model.
Parameter Estimate
(RSE%) IIV (%)
(RSE%) Darunavir CL/F (L/h)
16 (6)a
26 (8)b 27 (12)
Vc/F (L) 121 (7) 32 (19) Q/F (L/h) 25 (4) Vp/F (L) 398 (15) ka (h-1) 1.01 (0.1) Lag-time (h) 0.55 (12) 69 (13) Covariates θAGE CL/F -0.58 (31) Residual error Proportional (%) 26 (4) Ritonavir CL/F (L/h) 23 (4) 30 (10) V/F (L) 200 (5) 31 (13) ka (h-1) 1.45 (2) Lag-time (h) 2.16 (8) 56 (10) Covariates θWEIGHT CL/F 0.75 (fixed) θWEIGHT V/F 1 (fixed) Residual error Proportional (%) 28 (4) Inhibition parameters IMAX 1 (fixed) IC50 (mg/L) 0.32 (7)
IIV: interindividual variability; a study 1 and 2; b study 3
P066
RSE = (SEestimate/estimate) * 100
Figure 2. 90% prediction intervals for (A) DRV and (B) RTV dosed 800/100 mg or 900/100 mg once daily and (C) DRV following DRV/RTV 800/50 mg once daily.
0.01
0.1
1
10
100
0 4 8 12 16 20 24Time (h)
DRV
(mg/
L)
P5 P50 P95 MEC naïve; 0.055mg/L MEC experienced; 0.550mg/L
0.001
0.01
0.1
1
10
0 4 8 12 16 20 24Time (h)
0.01
0.1
1
10
100
0 4 8 12 16 20 24Time (h)
MEC: recommended minimum effective concentration
RTV
(mg/
L)
DRV
(mg/
L)
(A)
(B)
(C)
Observed DRV (n=506) Observed RTV (n=505)
0
5
10
15
0 5 10 15
Obs
erve
d D
RV (m
g/L)
Individual predicted DRV (mg/L)
(B)
Unity r2 = 0.846
The pharmacokinetic profile and safety of maraviroc 150 mg dosed with darunavir/ritonavir800/100 mg all once daily, with and without nucleoside analogues, in HIV-infected subjects.
Borja Mora-Peris1, Adam Croucher2, Laura J Else3, Jaime H Vera1,2, Saye Khoo3, George Scullard2, David Back3 and Alan Winston1,2.1. Department of Medicine, Faculty of Medicine, Imperial College London, St Mary’s Hospital Campus, Norfolk Place, London W2 1PG, UK.2. Department of HIV and Genitourinary Medicine, Imperial College Healthcare NHS Trust, St Mary’s Hospital, Praed Street, London W2 1NY, UK. 3. Department of Molecular & Clinical Pharmacology, University of Liverpool, Liverpool, UK
Background• Antiretroviral therapy is life-long and strategies such as nucleoside-sparing regimens are urgentlyneeded to overcome the ensuing toxicities1. However, often the pharmacokinetic profiles of suchregimens are not well described.
• An attractive, potential nucleoside-sparing cART regimen is maraviroc, darunavir, ritonavir all dosedonce daily.
Results• Of nineteen subjects screened, 13 were enrolled and eleven individuals completed both studyperiods (Figure 1). Patient baseline characteristics are described in table 1.
•Study medications were well tolerated and no safety or laboratory concerns were observed.
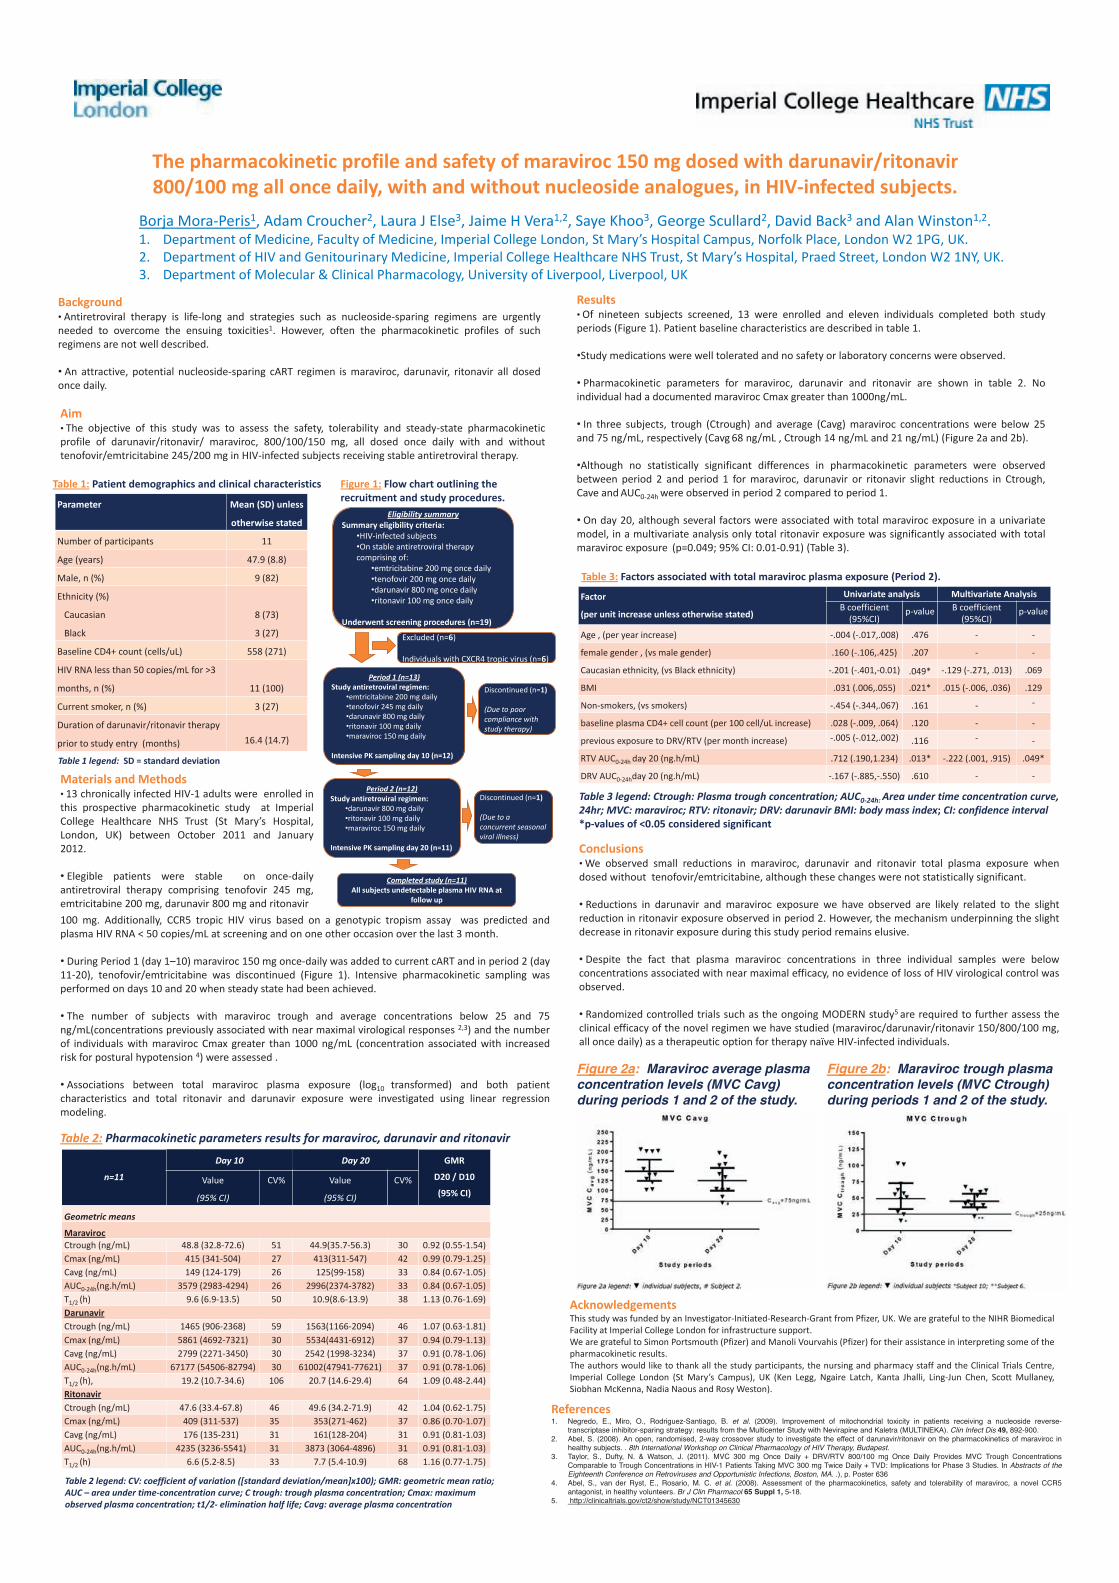
• Pharmacokinetic parameters for maraviroc, darunavir and ritonavir are shown in table 2. Noindividual had a documented maraviroc Cmax greater than 1000ng/mL.
• In three subjects, trough (Ctrough) and average (Cavg) maraviroc concentrations were below 25and 75 ng/mL, respectively (Cavg 68 ng/mL , Ctrough 14 ng/mL and 21 ng/mL) (Figure 2a and 2b).
•Although no statistically significant differences in pharmacokinetic parameters were observedbetween period 2 and period 1 for maraviroc, darunavir or ritonavir slight reductions in Ctrough,Cave and AUC0-24h were observed in period 2 compared to period 1.
• On day 20, although several factors were associated with total maraviroc exposure in a univariatemodel, in a multivariate analysis only total ritonavir exposure was significantly associated with totalmaraviroc exposure (p=0.049; 95% CI: 0.01-0.91) (Table 3).
Figure 1: Flow chart outlining the recruitment and study procedures.
References1. Negredo, E., Miro, O., Rodriguez-Santiago, B. et al. (2009). Improvement of mitochondrial toxicity in patients receiving a nucleoside reverse-
transcriptase inhibitor-sparing strategy: results from the Multicenter Study with Nevirapine and Kaletra (MULTINEKA). Clin Infect Dis 49, 892-900.2. Abel, S. (2008). An open, randomised, 2-way crossover study to investigate the effect of darunavir/ritonavir on the pharmacokinetics of maraviroc in
healthy subjects. . 8th International Workshop on Clinical Pharmacology of HIV Therapy, Budapest.3. Taylor, S., Dufty, N. & Watson, J. (2011). MVC 300 mg Once Daily + DRV/RTV 800/100 mg Once Daily Provides MVC Trough Concentrations
Comparable to Trough Concentrations in HIV-1 Patients Taking MVC 300 mg Twice Daily + TVD: Implications for Phase 3 Studies. In Abstracts of theEighteenth Conference on Retroviruses and Opportunistic Infections, Boston, MA. .), p. Poster 636
4. Abel, S., van der Ryst, E., Rosario, M. C. et al. (2008). Assessment of the pharmacokinetics, safety and tolerability of maraviroc, a novel CCR5antagonist, in healthy volunteers. Br J Clin Pharmacol 65 Suppl 1, 5-18.
5. http://clinicaltrials.gov/ct2/show/study/NCT01345630
Figure 2a: Maraviroc average plasma concentration levels (MVC Cavg) during periods 1 and 2 of the study.
Conclusions• We observed small reductions in maraviroc, darunavir and ritonavir total plasma exposure whendosed without tenofovir/emtricitabine, although these changes were not statistically significant.
• Reductions in darunavir and maraviroc exposure we have observed are likely related to the slightreduction in ritonavir exposure observed in period 2. However, the mechanism underpinning the slightdecrease in ritonavir exposure during this study period remains elusive.
• Despite the fact that plasma maraviroc concentrations in three individual samples were belowconcentrations associated with near maximal efficacy, no evidence of loss of HIV virological control wasobserved.
• Randomized controlled trials such as the ongoing MODERN study5 are required to further assess theclinical efficacy of the novel regimen we have studied (maraviroc/darunavir/ritonavir 150/800/100 mg,all once daily) as a therapeutic option for therapy naïve HIV-infected individuals.
Table 2: Pharmacokinetic parameters results for maraviroc, darunavir and ritonavir
AcknowledgementsThis study was funded by an Investigator-Initiated-Research-Grant from Pfizer, UK. We are grateful to the NIHR BiomedicalFacility at Imperial College London for infrastructure support.We are grateful to Simon Portsmouth (Pfizer) and Manoli Vourvahis (Pfizer) for their assistance in interpreting some of thepharmacokinetic results.The authors would like to thank all the study participants, the nursing and pharmacy staff and the Clinical Trials Centre,Imperial College London (St Mary’s Campus), UK (Ken Legg, Ngaire Latch, Kanta Jhalli, Ling-Jun Chen, Scott Mullaney,Siobhan McKenna, Nadia Naous and Rosy Weston).
Materials and Methods• 13 chronically infected HIV-1 adults were enrolled inthis prospective pharmacokinetic study at ImperialCollege Healthcare NHS Trust (St Mary’s Hospital,London, UK) between October 2011 and January2012.
• Elegible patients were stable on once-dailyantiretroviral therapy comprising tenofovir 245 mg,emtricitabine 200 mg, darunavir 800 mg and ritonavir
Figure 2b: Maraviroc trough plasma concentration levels (MVC Ctrough) during periods 1 and 2 of the study.
n=11
Day 10 Day 20 GMR
D20 / D10
(95% CI)Value
(95% CI)
CV% Value
(95% CI)
CV%
Geometric means
MaravirocCtrough (ng/mL) 48.8 (32.8-72.6) 51 44.9(35.7-56.3) 30 0.92 (0.55-1.54)Cmax (ng/mL) 415 (341-504) 27 413(311-547) 42 0.99 (0.79-1.25)Cavg (ng/mL) 149 (124-179) 26 125(99-158) 33 0.84 (0.67-1.05)AUC0-24h(ng.h/mL) 3579 (2983-4294) 26 2996(2374-3782) 33 0.84 (0.67-1.05)T1/2 (h) 9.6 (6.9-13.5) 50 10.9(8.6-13.9) 38 1.13 (0.76-1.69)DarunavirCtrough (ng/mL) 1465 (906-2368) 59 1563(1166-2094) 46 1.07 (0.63-1.81)Cmax (ng/mL) 5861 (4692-7321) 30 5534(4431-6912) 37 0.94 (0.79-1.13)Cavg (ng/mL) 2799 (2271-3450) 30 2542 (1998-3234) 37 0.91 (0.78-1.06)AUC0-24h(ng.h/mL) 67177 (54506-82794) 30 61002(47941-77621) 37 0.91 (0.78-1.06)T1/2 (h), 19.2 (10.7-34.6) 106 20.7 (14.6-29.4) 64 1.09 (0.48-2.44)RitonavirCtrough (ng/mL) 47.6 (33.4-67.8) 46 49.6 (34.2-71.9) 42 1.04 (0.62-1.75)Cmax (ng/mL) 409 (311-537) 35 353(271-462) 37 0.86 (0.70-1.07)Cavg (ng/mL) 176 (135-231) 31 161(128-204) 31 0.91 (0.81-1.03)AUC0-24h(ng.h/mL) 4235 (3236-5541) 31 3873 (3064-4896) 31 0.91 (0.81-1.03)T1/2 (h) 6.6 (5.2-8.5) 33 7.7 (5.4-10.9) 68 1.16 (0.77-1.75)
Parameter Mean (SD) unless
otherwise stated
Number of participants 11
Age (years) 47.9 (8.8)
Male, n (%) 9 (82)
Ethnicity (%)
Caucasian
Black
8 (73)
3 (27)
Baseline CD4+ count (cells/uL) 558 (271)
HIV RNA less than 50 copies/mL for >3
months, n (%) 11 (100)
Current smoker, n (%) 3 (27)
Duration of darunavir/ritonavir therapy
prior to study entry (months) 16.4 (14.7)
Table 1: Patient demographics and clinical characteristics
Table 1 legend: SD = standard deviation
Table 2 legend: CV: coefficient of variation ([standard deviation/mean]x100); GMR: geometric mean ratio; AUC – area under time-concentration curve; C trough: trough plasma concentration; Cmax: maximum observed plasma concentration; t1/2- elimination half life; Cavg: average plasma concentration
Factor
(per unit increase unless otherwise stated)
Univariate analysis Multivariate AnalysisB coefficient
(95%CI)p-value B coefficient
(95%CI)p-value
Age , (per year increase) -.004 (-.017,.008) .476 - -
female gender , (vs male gender) .160 (-.106,.425) .207 - -
Caucasian ethnicity, (vs Black ethnicity) -.201 (-.401,-0.01) .049* -.129 (-.271, .013) .069
BMI .031 (.006,.055) .021* .015 (-.006, .036) .129
Non-smokers, (vs smokers) -.454 (-.344,.067) .161 - -
baseline plasma CD4+ cell count (per 100 cell/uL increase) .028 (-.009, .064) .120 - -
previous exposure to DRV/RTV (per month increase) -.005 (-.012,.002) .116 - -
RTV AUC0-24h day 20 (ng.h/mL) .712 (.190,1.234) .013* -.222 (.001, .915) .049*
DRV AUC0-24hday 20 (ng.h/mL) -.167 (-.885,-.550) .610 - -
Table 3: Factors associated with total maraviroc plasma exposure (Period 2).
Table 3 legend: Ctrough: Plasma trough concentration; AUC0-24h: Area under time concentration curve, 24hr; MVC: maraviroc; RTV: ritonavir; DRV: darunavir BMI: body mass index; CI: confidence interval*p-values of <0.05 considered significant
Eligibility summarySummary eligibility criteria:
•HIV-infected subjects•On stable antiretroviral therapy comprising of:
•emtricitabine 200 mg once daily•tenofovir 200 mg once daily•darunavir 800 mg once daily•ritonavir 100 mg once daily
Underwent screening procedures (n=19)
Period 1 (n=13)Study antiretroviral regimen:
•emtricitabine 200 mg daily•tenofovir 245 mg daily•darunavir 800 mg daily•ritonavir 100 mg daily•maraviroc 150 mg daily
Intensive PK sampling day 10 (n=12)
Period 2 (n=12)Study antiretroviral regimen:
•darunavir 800 mg daily•ritonavir 100 mg daily•maraviroc 150 mg daily
Intensive PK sampling day 20 (n=11)
Completed study (n=11)All subjects undetectable plasma HIV RNA at
follow up
Excluded (n=6)
Individuals with CXCR4 tropic virus (n=6)
Discontinued (n=1)
(Due to poor compliance with study therapy)
Discontinued (n=1)
(Due to a concurrent seasonal viral illness)
100 mg. Additionally, CCR5 tropic HIV virus based on a genotypic tropism assay was predicted andplasma HIV RNA < 50 copies/mL at screening and on one other occasion over the last 3 month.
• During Period 1 (day 1–10) maraviroc 150 mg once-daily was added to current cART and in period 2 (day11-20), tenofovir/emtricitabine was discontinued (Figure 1). Intensive pharmacokinetic sampling wasperformed on days 10 and 20 when steady state had been achieved.
• The number of subjects with maraviroc trough and average concentrations below 25 and 75ng/mL(concentrations previously associated with near maximal virological responses 2,3) and the numberof individuals with maraviroc Cmax greater than 1000 ng/mL (concentration associated with increasedrisk for postural hypotension 4) were assessed .
• Associations between total maraviroc plasma exposure (log10 transformed) and both patientcharacteristics and total ritonavir and darunavir exposure were investigated using linear regressionmodeling.
Aim• The objective of this study was to assess the safety, tolerability and steady-state pharmacokineticprofile of darunavir/ritonavir/ maraviroc, 800/100/150 mg, all dosed once daily with and withouttenofovir/emtricitabine 245/200 mg in HIV-infected subjects receiving stable antiretroviral therapy.

S Ramanathan, J Custodio, X Yin, M Hepner, D Pugatch, SK Chuck and BP Kearney
Gilead Sciences, Inc., Foster City, CA, USA
11th International Congress onDrug Therapy in HIV Infection11-15 November, 2012Glasgow, UK
Background
Objectives
Methods
ResultsEmtricitabine (FTC), rilpivirine (RPV), and tenofovir disoproxil fumarate • (TDF) are coformulated into the approved FTC/RPV/TDF (EVIPLERA®/COMPLERA®) single-tablet regimen (STR) for the treatment of HIV-1 infection in treatment-naive adults
Durable antiviral ef cacy and a favorable safety/tolerability pro le, –as compared with EFV/FTC/TDF STR (ATRIPLA®)1,2,3
FTC/RPV/TDF STR demonstrates bioequivalence to individual –components
RPV single agent exposure is ~43% lower when given under fasting • conditions versus standard meal (533 kcal, 21g fat) or high-fat meal (928 kcal, 56g fat)4
Dosing recommendation for RPV single agent is administration with –a meal5
FTC is unaffected by food, while TDF administration with food results in • modestly higher tenofovir (TFV) exposure versus fasting conditions6,7
FTC and TDF may be taken without regard to food, however, –Summary of Product Characteristics (SmPC) recommends TDF be taken with food
This study is the rst evaluation of the effect of food on the • FTC/RPV/TDF STR
In addition to standard meal, a light meal is also evaluated, as a –simple “real-world” option
Primary Objective• To evaluate effect of food on the PK of RPV, FTC and TFV when –administered as the FTC/RPV/TFV STR
Secondary Objective• To evaluate the safety and tolerability of administration of the –FTC/RPV/TDF STR
Study treatments• ● Single dose of the FTC/RPV/TDF STR with a standard meal (540 kcal, 21g fat)● Single dose of the FTC/RPV/TDF STR under fasting conditions● Single dose of the FTC/RPV/TDF STR with a light meal (390 kcal, 12g fat)Study treatments were administered in the morning with 240 ml of water • following a 10-hour fastPK sampling performed over 192 hours; RPV, FTC and TFV plasma levels • determined using validated LC/MS/MS assaysPK parameters estimated using non-compartmental methods and • WinNonlin® software v6.2 (Pharsight Corporation, Mountain View, CA, USA)ANOVA model appropriate for crossover design and 90% con dence • interval (CI) for geometric mean ratios (GMR) between treatments were implemented for the following analytes and PK parameters:
RPV, FTC, and TFV: AUC – inf, AUClast, CmaxLack of effect boundary set to 80%-125% –
Relative to fasting conditions, RPV exposures were 9% and 16% higher • following light meal or standard meal, respectivelyLight meal versus standard meal comparison: RPV exposures narrowly • outside the lack of effect boundary
Effect of food on RPV is considerably smaller with FTC/RPV/TDF STR • versus RPV single agent
Relative to fasting, RPV exposures (AUC – last) were increased by 13% and 19%, with a light meal and standard meal, respectively; while RPV single agent exposures were 75% higher fed versus fasting4
Relative to fed conditions, RPV exposures (AUC – last) were decreased by 12% and 16%, with a light meal and standard meal, respectively; while RPV single agent exposures were 43% lower fasting versus fed4
Relative to fasting conditions, TFV exposures were modestly higher • following light meal or standard meal, consistent with established food effect of TFV7
Relative to standard meal, TFV AUC was within lack of effect boundary • following administration with a light meal, while Cmax was slightly lower
Pharmacokinetic Study Design: Six Sequence, Randomized • Crossover (n=24)
Standard meal: 540 kcal, 21g fat –Light meal: 390 kcal, 12g fat –
Safety
Figure 2. RPV Concentration–Time Curve
Table 2. RPV Pharmacokinetic Parameters
Figure 1. Study Design
Table 1. Baseline Demographics
Figure 4. TFV Concentration–Time Curve
Table 6. TFV Pharmacokinetics Parameters
Table 7. Food Effect on TFV AUC and Cmax
Effect of Food on the Pharmacokinetics of Emtricitabine/Rilpivirine/Tenofovir Disoproxil Fumarate
Single-Tablet Regimen
All study treatments were generally well tolerated• No discontinuations due to adverse events (AEs) •
One discontinuation due to protocol violation –No Grade 1 or 2 AEs related to study drug• No Grade 3, 4 or serious AEs• No Grade 2, 3 or 4 laboratory abnormalities•
Gilead Sciences, Inc.333 Lakeside Drive
Foster City, CA 94404Tel: (650) 574-3000
Fax: (650) 578-9264
© 2012 Gilead Sciences, Inc. All rights reserved.
PosterNumber
P068
Baseline Demographics Analysis Set
Subjects 24 enrolled, 23 completed
Sex 12 males, 12 females
Age (mean [range]) 35 (24–45) yrs
Weight (mean [range]) 76.5 (58.3–100.9) kg
Race 22 White, 2 Black
Ethnicity 24 Hispanic/Latino
0 6 12 18 240
50
100
150
48 96 144192
Fasted ConditionsLight Meal (390 kcal, 12g fat)Standard Meal (540 kcal, 21g fat)
Mean (SD)Time (h)
RPV
Conc
entra
tion
(ng/
mL)
RPV PK Parameter(Mean [%CV])
Standard Meal(n=24)
Fasting(n=24)
Light Meal(n=23)
AUCinf (ng*h/mL) 3030 (34) 2770 (40) 2880 (41) AUClast (ng*h/mL) 2770 (35) 2460 (39) 2670 (41) Cmax (ng/mL) 99.5 (38) 83.2 (42) 104 (35) Tmax (h)* 4.75 (3.50, 5.00) 3.75 (3.25, 5.00) 3.50 (3.00, 5.00)
TFV PK Parameter(Mean [%CV])
Standard Meal(n=24)
Fasting(n=24)
Light Meal(n=23)
AUCinf (ng*h/mL) 3610 (21) 2640 (27) 3390 (22)AUClast (ng*h/mL) 3420 (22) 2450 (29) 3200 (23)Cmax (ng/mL) 484 (30) 366 (30) 418 (32)Tmax (h) 1.50 (1.50, 2.25) 1.00 (0.75, 1.25) 1.50 (1.00, 2.00)
RPV PK ParameterGMR (%) 90% CI Standard Meal/
FastingGMR (%) 90% CI
Light Meal/FastingGMR (%) 90% CI
Light Meal/Standard Meal
AUCinf 116 (98.6, 137) 109 (92.2, 129) 93.8 (79.2, 111)AUClast 119 (101, 142) 113 (95.4, 135) 94.9 (79.9, 113)Cmax 126 (105, 153) 134 (111, 163) 106 (87.6, 129)
TFV PK ParameterGMR (%) 90% CI Standard Meal/
FastingGMR (%) 90% CI
Light Meal/FastingGMR (%) 90% CI
Light Meal/Standard Meal
AUCinf 138 (129, 147) 128 (120, 137) 93.0 (87.2, 99.2)AUClast 141 (132, 151) 131 (122, 140) 92.8 (86.7, 99.4)Cmax 132 (118, 147) 112 (100, 125) 84.8 (75.8, 94.9)
* Tmax presented as Median (Q1, Q3)* Tmax presented as Median (Q1, Q3)
It is recommended that the FTC/RPV/TDF STR be •administered with food
RPV and TFV exposures were modestly higher for fed –versus fasting conditions; similar exposures were achieved with a light meal versus standard mealFTC exposures were unaffected by food –
Effect of food on RPV is considerably smaller for the •FTC/RPV/TDF STR versus RPV single agent
Conclusions
ReferencesCohen CJ, et al. Lancet 2011;378:229-371. Molina JM, et al. Lancet 2011;378:238-462. Desmidt M, et al. EACS 2009; Cologne, Germany. #PE7.1/43. Crauwel HM, et al. IWCPHT 2008; P324. EDURANT Prescribing Information 5. EMTRIVA Prescribing Information 6. VIREAD Prescribing Information7.
Fasted ConditionsLight Meal (390 kcal, 12g fat)Standard Meal (540 kcal, 21g fat)
0 6 12 18 240
100
200
300
400
500
600
48 72 96
Mean (SD)Time (h)
TFV
Conc
entr
atio
n (n
g/m
L)
FTC PK was equivalent across treatments con rming lack of food effect • consistent with established PK pro le of FTC6
FTC PK ParameterGMR (%) 90% CI Standard Meal/
FastingGMR (%) 90% CI
Light Meal/FastingGMR (%) 90% CI
Light Meal/Standard Meal
AUCinf 95.3 (92.8, 97.9) 96.1 (93.5, 98.8) 101 (98.2, 104)AUClast 95.1 (92.7, 97.6) 95.9 (93.4, 98.5) 101 (98.2, 104)Cmax 93.1 (87.4, 99.1) 95.5 (89.6, 102) 103 (96.2, 109)
0 6 12 18 240
500
1000
1500
2000
2500
96 144 192
Fasted ConditionsLight Meal (390 kcal, 12g fat)Standard Meal (540 kcal, 21g fat)
Mean (SD)Time (h)
FTC
Con
cent
ratio
n (n
g/m
L)
Figure 3. FTC Concentration–Time Curve
Table 3. Food Effect on RPV AUC and Cmax
Table 5. Food Effect on FTC AUC and Cmax
Followup
Fasting
StandardMeal
Fasting
LightMeal
LightMeal
LightMeal
StandardMeal
Fasting
StandardMeal
Fasting
LightMeal
StandardMeal
Day 1 Day 19 Day 37
StandardMealFasting Light
Meal
LightMeal
StandardMeal Fasting
Day 51
Washout Washout
SEQ 1
SEQ 2
SEQ 3
SEQ 4
SEQ 6
SEQ 5
Followup
Fasting
StandardMeal
Fasting
LightMeal
LightMeal
LightMeal
StandardMeal
Fasting
StandardMeal
Fasting
LightMeal
StandardMeal
Day 1 Day 19 Day 37
StandardMealFasting Light
Meal
LightMeal
StandardMeal Fasting
Day 51
Washout Washout
SEQ 1
SEQ 2
SEQ 3
SEQ 4
SEQ 6
SEQ 5
Table 4. FTC Pharmacokinetic Parameters
FTC PK Parameter (Mean [%CV])
Standard Meal (n=24)
Fasting(n=24)
Light Meal (n=23)
AUCinf (ng*h/mL) 10,300 (18) 11,000 (23) 10,600 (19)AUClast (ng*h/mL) 10,100 (18) 10,800 (22) 10,400 (19)Cmax (ng/mL) 2020 (27) 2140 (21) 2090 (22)Tmax (h) 2.00 (1.50, 2.50) 2.00 (1.50, 2.00) 2.00 (1.50, 2.50)
* Tmax presented as Median (Q1, Q3)
Scan this QR code to link to this poster and to download a PDF copy. You will be prompted to enter the following passcode: P068

Eleventh International Congress on Drug Therapy in HIV Infection 11-15 November 2012 Glasgow, UK Poster 069
INTRODUCTION Successful scale up of HIV services in countries such as Uganda may have contributed to an overall increase in functional health facilities, a rise in patient engagement and retention in care. As more patients are reached with antiretroviral (ARV) therapy and treatment for other conditions, evaluating medication safety is becoming increasingly important in these settings.1 Current ARV therapy is complex due to life long treatment comprising multi-drug regimens with significant propensity for drug-drug interactions (DDIs). DDIs may result in raising or lowering the concentration of co-prescribed drugs or ARVs. Elevated drug concentrations may be associated with drug toxicity and lower concentrations may be associated with therapeutic failure. Studies from Europe and the USA suggest that DDIs involving ARVs are common, occurring at rates of 14-58%,2-6 concluding that clinically significant drug interactions in HIV care are common and unavoidable, although often manageable. However, physician recognition of ARV DDIs has been reported to be low in a UK study.2 Few data concerning ARV DDI prevalence are available in low resource settings. A study of 1040 consecutive Kenyan patients found that 33.5% were at risk of clinically significant drug interactions.7
AIMS This audit aimed to determine the prevalence and type of DDIs involving ARVs, and the patients most at risk in an African outpatient setting. The data will be used to target interventions such as electronic prescribing alerts and DDI screening METHODS A random sample of patients taking current ARVs and accessing care at the Infectious Diseases Institute, Makerere University, Kampala was selected from the clinic database. The most recent prescription for each patient was retrospectively screened for DDIs using www.hiv-druginteractions.org. Clinical significance of DDIs was assessed by two of us using a previously developed technique evaluating: likelihood of interaction, therapeutic index of affected drug and severity of potential adverse effect.2,7
Multivariate linear regression was used to determine whether the following independent variables increased patient risk for DDIs involving ARVs: age, gender, CD4 count, current TB treatment, patient weight, WHO clinical stage, number of co-medications and ARV regimen. RESULTS Prevalence and Type of Drug interactions Patient characteristics are described in Tables 1&2. Of 1226 evaluated patients, 232 (18.9%) had one or more clinically significant DDI, with 320 clinically significant interactions identified in total. The observed interactions resulted from the mechanisms shown in Figure 1. Figure 1. Mechanisms of drug interaction in patients taking antiretrovirals Almost all patients were taking one or more co-medication alongside their ARV regimen, with a mean of 1.9 co-medications per patient. Co-medication use and prevalence of DDIs with each class of co-medication is shown in Figure 2. Contra-indicated drug combinations were observed in 4 patients, all involving nevirapine and ketoconazole.
References: (1) Seden et al. J Antimicrob Chemother. 2012 Aug 22. [Epub ahead of print](2) Evans-Jones JG et al. Clin Infect Dis 2010; 50: 1419-21. (3) de Maat MM et al. J Clin Pharm Ther 2004; 29: 121-30. (4) Shah S et al. CROI Los Angeles, CA, 2007. Abstract 573, (5) Marzolini C et al. Antivir Ther 2010; 15: 413-23. (6) Seden K et al. Int J STD AIDS 2012 In Press. (7) Kigen G et al. PLoS One 2011; 6: e16800.
Prevalence and type of drug-drug interactions involving antiretrovirals in patients attending a specialist HIV outpatient clinic in Kampala, Uganda Seden K1, Merry C2,3, Hewson R1, Lamorde M2,3, Byakika-Kibwika P2,3, Laker E2, Parkes-Ratanshi R2, Back D1, Khoo S1 Department of Molecular and Clinical Pharmacology, Institute of Translational Medicine, University of Liverpool, Liverpool, UK1; Infectious Diseases Institute, Makerere University College of Health Sciences, Kampala, Uganda2; Department of Pharmacology and Therapeutics, Trinity College Dublin3
In univariate analysis, lower patient weight, increasing number of co-medications, a PI-containing ARV regimen, higher WHO clinical stage and current TB therapy were associated with increased risk for DDIs (Table 3). As 2 or more co-medications and WHO stage 3-4 were specifically found to increase risk for DDIs in univariate analysis, these factors were included in the multivariate model along with weight, TB and 2nd line (PI) regimen. In multivariate analysis, the patient factors which independently increased risk for DDIs were 2 or more co-medications, a PI-containing ARV regimen (second line regimen) and WHO clinical stage 3-4 (Table 3). Table 3. Univariate and multivariate analysis of patient factors contributing to risk for DDIs SUMMARY • Clinically significant DDIs involving ARVs affected 18.9% of patients • The majority of DDIs observed were due to pharmacokinetic mechanisms (68%), altering the metabolism and therefore exposure to one or more drugs • The co-medications most commonly associated with ARV DDIs in this cohort were antibiotics, antifungals and anthelmintics • Factors associated with risk for DDIs in this African cohort of HIV positive patients are: PI based ARV regimen, WHO clinical stage 3-4 and 2 or more co-medications. The strongest association was observed with ≥2 co-medications • As more ARVs become available in this setting, new mechanisms of interaction may become apparent, eg. use of vitamins, iron and antacids is prevalent. Antacids may decrease absorption of atazanavir, while antacids, vitamins, iron and magnesium may decrease absorption of raltegravir. CONCLUSIONS Potential DDIs involving ARVs occur at similar rates in resource limited settings and developed countries. Drug combinations which most frequently cause DDIs however, differ between settings for example CNS and cardiovascular drugs in the UK2,6 and anti-infectives in Kenya7 and Uganda. There are some differences in risk factors, for example age confers a higher risk of DDIs in European studies,5 whereas no significant association was found in this cohort. Higher number of co-medications and PI based regimens are predictors for DDI risk in this cohort and European settings. 2,6 An understanding of the DDIs which occur frequently in ARV programs, and the patients most at risk, can allow targeting of interventions to reduce harm from interactions and increase awareness among healthcare workers. Development of tools which are relevant to particular settings are essential for recognition of DDIs. Initiatives such as incorporation of WHO essential medicines into the Liverpool DDI database and the AIDS Treatment Information Centre in Uganda are important in achieving this.
Patient Factors Univariate analysis Multivariate analysis
OR (95% CI) P value OR (95% CI) P value
Age (years) 1 (0.98-1.01) 0.99
Weight (kg) 0.987 (0.974-1.0)
0.047* ns ns
Gender 1.059 (0.789-1.421)
0.702
Number of Co-meds
2.974 (2.471-3.580)
<0.0001*
≥2 co-meds 8.619 (5.663-13.117)
<0.0001* 8.546 (5.603-13.033)
<0.0001
2nd line (PI containing ) regimen
2.212 (1.531-3.195)
<0.0001* 2.162 (1.451-3.220)
<0.0001
WHO Stage 1.353 (1.138-1.609)
0.001*
WHO stage 3-4 1.526 (1.087-2.142)
0.014* 1.435 (1.002-2.054)
0.049
Current TB 4.339 (1.507-12.494)
0.007* ns ns
CD4 count 1 (0.99-1.0) 0.237
All Patients n=1226
≥1 DDI 232 (18.9%)
no. co-meds 2330 (1.9)
Effect of Age Mean: 40.7 (range 18-83yrs)
≥40 649 (52.9%) 120 (18.5%) 1182 (Mean 1.82)
<40 577 (47.1%) 112 (19.4%) 1148 (Mean 1.98)
n=
≥1 DDI no. co-meds
Effect of Gender
Male Female n= 453 (36.9%) 773 (63.1%) ≥1 DDI 89 (19.6%) 143 (18.5%) no. Co-meds 821 (Mean 1.81) 1509 (Mean 1.95)
≥500 <500 Effect of CD4 Abs n= 413 (33.7%) 806 (65.7%) Mean: 440 (range 6-2603) ≥1 DDI 75 (18.2%) 154 (19.1%)
no. Co-meds 758 (Mean 1.83) 1542 (Mean 1.91) Effect of Current TB treatment
Yes No n= 15 (1.2%) 1211 (98.8%) ≥1 DDI 7 (46.7%) 225 (18.6%) no. Co-meds 71 (Mean 4.73) 2259 (Mean 1.87)
≥55kg <55kg Effect of Weight n= 863 (70.4%) 335 (27.3%) Mean: 61.8kg (35-120) Male: 62.5kg (37-110) Female: 61.4kg (35-120)
≥1 DDI 159 (18.4%) 68 (20.3%)
no. Co-meds 1613 (Mean 1.87) 676 (Mean 2.01) Effect of WHO stage
1-2 3-4 n= 347 (28.3%) 879 (71.7%) ≥1 DDI 51 (14.7%) 181 (20.6%) no. Co-meds 624 (Mean 1.79) 1706 (Mean 1.94)
≥2 <2 Effect of Number of Co-medications
n= 674 (54.9%) 552 (45.0%)
≥1 DDI 205 (30.4%) 27 (4.9%)
Regimen Number of patients
Patients with ≥1DDI
Number of DDIs
1st line
ZDV-3TC-NVP 534 92 132 ZDV-3TC-EFV 341 64 87 TDF-3TC-EFV 108 17 22 TDF-3TC-NVP 66 8 10 TDF-ZDV-3TC 14 2 2 TDF-FTC-NVP 1 0 0 TOTAL 1064 (86.8%) 183 (17.2%) 253
2nd line
TDF-3TC-LPV/r 68 12 14 ZDV-ddI-LPV/r 26 10 10 ZDV-3TC-LPV/r 26 6 9 RAL-LPV/r 9 1 1 LPV/r 9 1 1 3TC-EFV-LPV/r 5 4 4 LPV/r-EFV 3 3 8 ZDV-3TC-TDF-LPV/r
3 2 5
ZDV-3TC-ddI-LPV/r
2 2 3
ddI-LPV/r-EFV 2 2 2 ABC-EFV-LPV/r 2 2 2 TDF-FTC-LPV/r 2 0 0 D4T-3TC-LPV/r 1 0 0 3TC-ddI-LPV/r 1 1 1 3TC-NVP-LPV/r 1 1 1 ABC-LPV/r-NVP 1 1 3 ddI-LPV/r-ABC 1 1 1 TOTAL 161 (13.1%) 49 (30.4%) 65
68%
8%
24%
Mechanism of Interactions Pharmacokinetic modulation of metabolic pathways Competition for renal elimination pathways Overlapping toxicity
All Patientsn=1226
≥1 DDI 232 (18.9%)
no. co-meds 2330 (1.9)
Effect of AgeMean: 40.7 (range 18-83yrs)
≥40649 (52.9%)120 (18.5%)1182 (Mean 1.82)
<40577 (47.1%)112 (19.4%)1148 (Mean 1.98)
n=
≥1 DDIno. co-meds
Effect of GenderMale Female
n= 453 (36.9%) 773 (63.1%)≥1 DDI 89 (19.6%) 143 (18.5%)no. Co-meds 821 (Mean 1.81) 1509 (Mean 1.95)
≥500 <500Effect of CD4 Abs n= 413 (33.7%) 806 (65.7%)Mean: 440 (range 6-2603) ≥1 DDI 75 (18.2%) 154 (19.1%)
no. Co-meds 758 (Mean 1.83) 1542 (Mean 1.91)
Effect of Current TB treatment
Yes Non= 15 (1.2%) 1211 (98.8%)≥1 DDI 7 (46.7%) 225 (18.6%)no. Co-meds 71 (Mean 4.73) 2259 (Mean 1.87)
≥55kg <55kgEffect of Weight n= 863 (70.4%) 335 (27.3%)Mean: 61.8kg (35-120) Male: 62.5kg (37-110)Female: 61.4kg (35-120)
≥1 DDI 159 (18.4%) 68 (20.3%)
no. Co-meds 1613 (Mean 1.87) 676 (Mean 2.01)
Effect of WHO stage1-2 3-4
n= 347 (28.3%) 879 (71.7%)≥1 DDI 51 (14.7%) 181 (20.6%)no. Co-meds 624 (Mean 1.79) 1706 (Mean 1.94)
≥2 <2Effect of Number of Co-medications
n= 674 (54.9%) 552 (45.0%)
≥1 DDI 205 (30.4%) 27 (4.9%)
Regimen Number of patients
Patients with ≥1DDI
Number of DDIs
1st lineZDV-3TC-NVP 534 92 132ZDV-3TC-EFV 341 64 87TDF-3TC-EFV 108 17 22TDF-3TC-NVP 66 8 10TDF-ZDV-3TC 14 2 2TDF-FTC-NVP 1 0 0TOTAL 1064 (86.8%) 183 (17.2%) 253
2nd lineTDF-3TC-LPV/r 68 12 14ZDV-ddI-LPV/r 26 10 10ZDV-3TC-LPV/r 26 6 9RAL-LPV/r 9 1 1LPV/r 9 1 13TC-EFV-LPV/r 5 4 4LPV/r-EFV 3 3 8ZDV-3TC-TDF-LPV/r
3 2 5
ZDV-3TC-ddI-LPV/r
2 2 3
ddI-LPV/r-EFV 2 2 2ABC-EFV-LPV/r 2 2 2TDF-FTC-LPV/r 2 0 0D4T-3TC-LPV/r 1 0 03TC-ddI-LPV/r 1 1 13TC-NVP-LPV/r 1 1 1ABC-LPV/r-NVP 1 1 3ddI-LPV/r-ABC 1 1 1TOTAL 161 (13.1%) 49 (30.4%) 65
Risk Factor Analysis Table 1 shows the ARV regimens taken by the evaluated patients. A higher proportion of patients taking second line regimens had one or more DDI (30.4 vs 17.2%). All second line regimens contained a ritonavir boosted protease inhibitor (Lopinavir/ritonavir).Table 2 shows the prevalence of drug interactions and co-medication by patient characteristic Table 1. ARV Regimens taken by HIV positive outpatients and prevalence of DDIs Table 2. Prevalence of drug interactions and co-medication use for different patient characteristics
0 50 100 150 200 250 300
Antibiotics
Anthelmintics
Antifungals
PCP prophylaxis
NSAIDS
Antimalarials
Antihistamines
TB
Neuropathic pain
Sedative/anxiolytic
Steroids
Motility agents
Analgesics …
Antacids
Vitamins/supple…
Number of patients taking ≥1 co-medication Number of patients with ≥1 DDI with co-medication Number of patients with contra-indicated combination
Figure 2. Co-medication usage and prevalence of DDIs between ARVs and different classes of co-medication NB. 1141 (93.1%) patients take PCP prophylaxis; x axis capped at 300 patients
Correspondence to: Kay Seden [email protected]

Development and validation of a LC-MS/MS assay to quantify intracellular tenofovir-diphosphate (TFV-DP) and emtricitabine-triphosphate (FTC-TP).
Victoria Watson 1,2, Laura Else 1,2 , John Tjia 1,2, David Back 1,2, Saye Khoo 1,2. 1 Bioanalytical Facility , Royal Liverpool University Hospital, Liverpool, UK.; 2 Department of Molecular & Clinical Pharmacology, Institute of Translational Medicine, University of Liverpool, Liverpool, UK.
BACKGROUND • In 2010, there were a reported 6,600 (4,510 men and
2,150 women) newly diagnosed cases of HIV in the UK, contributing to a cumulative UK total of 91,500 cases. The estimated new diagnosis rate was 0.11 per 1,000 population (0.15 per 1,000 men and 0.07 per 1,000 women). [Ref.HPA]
• Combination antiretroviral therapy has been associated with dramatic reductions of morbidity and mortality in HIV-infected patients.
• The key to successful HIV treatment is strict adherence to a prescribed regimen. Pharmacokinetic studies are needed to define forgiveness for missed or late dosing.
• As antiretrovirals mainly act within cells (figure 1), knowledge of both plasma and intracellular (IC) pharmacokinetics should aid understanding of virological response and toxicity. This is particularly important for tenofovir (TFV) and emtricitabine (FTC) which are converted to active phosphate anabolites within the cell.
Emtricitabine (FTC)
• Analogue of cytidine
• NNRTI
• FTC-TP is the active metabolite • Intracellular half life ~39 hours
Tenofovir Disoproxil Fumerate (TDF)
• Administered as TDF prodrug
• Requires hydrolization to tenofovir (TFV)
• Analogue of adenosine. NtRTI
• TFV-DP is the active metabolite
• Intracellular half life ~150 hours
OBJECTIVES
• The objective was to develop and validate a LC-MS/MS method for the detection and quantification of the HIV antiretroviral drug anabolites emtricitabine triphosphate and tenofovir diphosphate in a peripheral blood mononuclear cell (PBMC) matrix
• Develop an isolation/extraction method of the metabolites from PBMC’s
• The assay had to be specific, sensitive and robust
• Application of the validated assay to clinical pharmacokinetic trials
METHODS Isolation and Preparation of PBMC’s
Correspondence Victoria Watson NIHR Doctoral Research Fellow Bioanalytical Facility Royal Liverpool University Hospital 4th floor UCD, Prescot Street, Liverpool, L69 3GA website: www.hiv-druginteractions.org
Eleventh International Congress on Drug Therapy in HIV Infection. 11-15 November 2012 Glasgow, UK. Poster 070
BIOANALYTICAL METHOD DEVELOPMENT
Calibrators/QC • Drug-free cell lysate was spiked with working
concentration FTC-TP and TFV-DP solutions (range FTC –TP = 0.38-103.47 ng/ml, TFV-DP= 0.35-10.91 ng/ml)
• Quality controls were prepared over the range of the calibration curves (low, medium and high concentration levels)
Sample pre-treatment • 1 ml of LC-MS-grade ACN was added to the
calibrators/QC and clinical samples. Samples were then microfuged at 13,000 g for 6 minutes.
• Supernatant was then transferred into glass tubes and internal standard, 2-chloroadenosine 5′-triphosphate (Cl-ATP) [20 μl; 4 μg/ml] was added, samples evaporated to dryness (20°C).
• Samples were then resuspended in 150 μl of 5 mM ammonium formate, 25 µL transferred into auto sampler vials and centrifuged at 2000 rpm for 5 mins.
• Samples injected (20 μL; no waste) onto the HPLC column.
Chromatographic and Mass Spec System
Mass Spec System Parameters
Figure to show the internal process of the Thermo mass spec system and analysis parameters
Figure 1. Mode of action of current HIV therapies. (reproduced with kind permission from Merck.)
Mass Spec System Parameters Continued
• Scan Width = 0.010 • Scan time = 0.025
• Data Type = Centroid
• Collision gas = 1.5 m Torr
• Chrom Filter = 3.0 s
Mass Spec System Chromatographs
METHOD VALIDATION
• Precision expressed as the coefficient of variation
[%CV; (standard deviation/mean)x100
• Accuracy expressed as the bias % [ 100+(mean concentration – target concentration) / mean concentration) X 100]
• Standard Curve : 1/Concentration linear equation
RESULTS
• Validated assay was applied to clinical trial samples successfully.
• TFV-DP; LLOQ = 0.35 ng/ mL (<20%), ULOQ = 10.91 • FTC-TP; LLOQ = 0.38 ng/ mL (<20%), ULOQ = 103.17
ng/mL • When back calculated with accurate individual patient
cell counts, both TFV-DP and FTC-TP LLOQ was ~30fmol/10^6 cells
• R2 values > 0.99 (Linear 1/x). Signal to noise was
greater than 5-fold. Carryover was <0.1%
CONCLUSION • A direct, highly sensitive intracellular anabolite assay
has been developed and validated which elutes analytes and internal standard rapidly (12 mins) and has been successfully applied to patient samples from a pivotal trial (EudraCT 2009-018055-16), the results of which are crucial in our understanding of antiretroviral drug adherence and missed dose forgiveness.
ACKNOWLEDGEMENT
This work is produced by Victoria Watson under the terms of a biomedical research training fellowship issued by the NIHR. The views expressed in this publication are those of the author(s) and not necessarily those of the NHS, The National Institute for Health Research or the Department of Health.
FTC FTC-MP FTC-DP FTCFTC-FTC-TPTP
Phosphorylated
Deoxycytidine kinase
Deoxycytidine monophosphate
kinase
TDF TFV TFV-MP TFVTFV-TFV-TFV-TFV DPDP
5’-nucleoside diphosphate
kinase
Phosphorylated Hydrolization
Cellular esterase
Adenosine monophosphate
kinase
5’-nucleoside diphosphate
kinase
The lysate was centrifuged and the pellet discarded to give a intracellular
matrix
Cells were counted and a lysate was prepared by addition of 70% MeOH to give a final cell density of 4 x 10⁶ cells
per ml.
The cells were handled on ice and washed in Hanks balanced salt solution
three times
PBMC’s were separated from whole blood by buoyancy gradient
centrifugation with the use of Ficoll.
Plasma
PBMC
Ficoll
RBCs
The triple-quadrupole mass spectrometer (TSQ Quantum Access)
was operated in positive ionization mode, and detection and quantification
was performed using single reaction monitoring (SRM)
Drug metabolites; tenofovir diphosphate (TFV-DP), emtricitabine triphosphate (FTC-TP) and IS were eluted within a 12 minute run time
Optimised step-wise gradient; mobile phase A [10mM ammonium acetate in ACN/H2O (30:70, v/v) pH 6.0] and B
[1mM ammonium acetate in ACN/H2O (30:70, v/v) pH 10.5]. Flow rate of 250
l/ min
Samples held at 5oC. Injection volume = 20 µL. Compounds were separated
on a Biobasic AX column (40oC)
Analyte Precursor ion (m/z)
Product ion (m/z)
Collision Energy (V) Tube Lens
TFV-DP 447.98 270.0 350.0
28 19 101
FTC-TP 487.91 130.0 229.9
32 15 144
2-CI ATP 541.92 169.9 31 140
Column
H-ESI Probe Q1 Collision Cell
Q3
Data Analysis
Spray Voltage 5000 Vap Temp 400
Sheath gas pressure 30 AUX gas pressure 5
Capillary Temp 325
RT: 0.00 - 12.00
0 2 4 6 8 10 12 Time (min)
0
20
40
60
80
100 0
20
40
60
80
100 0
20
40
60
80
100
Rel
ative
Abu
ndan
ce
0
20
40
60
80
100 NL: 5.07E5 TIC MS
NL: 6.03E5 TIC F: + c ESI SRM ms2 541.922 [169.965-169.975] MS
NL: 2.42E6 TIC F: + c ESI SRM ms2 447.981 [270.043-270.053, 350.005-350.015] MS
NL: 3.75E5 TIC F: + c ESI SRM ms2 487.917 [130.011-130.021, 229.928-229.938] MS
Total Ion Count
2 CI-ATP (Internal Standard)
TDF-DP
FTC-TP
LLQC LQC MQC HQC
FTC-TP ng/mL 1.39 5.44 26.64 52.01
%CV (Precision) 10.6 6.3 5.4 8.3
% Bias (Accuracy) 103 99 100 99
LQC MQC HQC
TDF_DP 1.17 5.39 10.41
%CV (Precision) 11 6.3 8.2
% Bias (Accuracy) 98 98 101
Absence of a pharmacokinetic interaction of rilpivirine with the P-glycoprotein substrate digoxin in healthy volunteers Herta M Crauwels, Henri Deckx, Marita Stevens, Richard M Hoetelmans
Janssen Infectious Diseases BVBA, Beerse, Belgium
P071
Presented at the 11th International Congress on Drug Therapy in HIV Infection (HIV11) Glasgow, UK, 11–15 November 2012 This poster is available on request: [email protected]
Introduction•Rilpivirine(RPV,TMC278;Figure 1)isanNNRTIwithin-vitroactivityagainstwild-typeHIV-1virusandNNRTI-resistantmutants.1
•RPV,withitslongeliminationhalf-life,combinestheconvenienceofonce-dailydosingwithgoodantiviralactivityandafavourabletolerability/safetyprofile– RPV25mgq.d.demonstratedhighvirologicresponseratesandnoninferiorityversusefavirenz(EFV)600mgq.d.through96weeks,intwolarge,multicentre,international,double-blind,PhaseIIItrialsinantiretroviral(ARV)-naïve,HIV-1-infectedadults2−4
– RPVhassignificanttolerabilityadvantagesoverEFV(PhaseIIIWeeks48and96analyses).2−4
•RPVisapprovedasasingle-agenttablet(EDURANT®)incombinationwithotherARVs5andasasingle-tabletregimen(emtricitabine/RPV/tenofovirdisoproxilfumarate,EVIPLERA®inEurope),6foruseintreatment-naïve,HIV-1-infectedpatientsinseveralcountriesworldwide,includingtheUSA,Europe,AustraliaandCanada.
•Digoxin(LANOXIN®)isacardiac(digitalis)glycoside,indicatedforthetreatmentofmild-to-moderateheartfailureandchronicatrialfibrillation7
– Digoxinismainlyeliminatedrenallyasunchangeddrug– Digoxinisamodelsubstratefortheassessmentofthein-vivoeffectofdrugsontheactivityofthepermeabilityglycoprotein(P-gp).
•In vitro,inhumancolonicadenocarcinoma(Caco-2)cells,RPVwasshowntoinhibitP-gpwithanapparenthalfmaximuminhibitoryconcentration(IC50)valueof9.2μM(3.4μg/mL)– RPVplasmaconcentrationsinhealthyvolunteers(meanmaximumplasmaconcentration[Cmax]=0.247μg/mL)andHIV-1-infectedpatients(meanCmax=0.134μg/mL)werelowcomparedwiththeIC50ofP-gpinhibitionin vitrobyRPV(i.e.,3.4μg/mL)– Animpactin vivo,potentiallyatthelevelofthegut,couldnotbeexcluded.Theoretically,theintestinalluminalRPVconcentrationaftera25mgoraldosecouldbeupto100μg/mL– RPVisnotaP-gpsubstrate.
•InviewofthepotentialconcomitantuseofRPVandP-gpsubstrates,thecurrenttrialevaluatedthepharmacokineticsofRPV(atthecommerciallyavailable25mgdose)andthemodelP-gpsubstratedigoxin,whenco-administered.
Objectives•Investigatetheeffectofsteady-stateRPVonthesingle-dosepharmacokineticsofdigoxin.
•Determinetheshort-termsafetyandtolerabilityofco-administrationofsteady-stateRPVandasingledoseofdigoxininhealthyvolunteers.
Methods
Study design and treatment•PhaseI,open-label,randomised,crossovertrialin22healthyvolunteers(NCT01519128).
•Duringtwoconsecutivesessions,eachvolunteerreceivedbothtreatmentsinarandomorderaccordingtoaclassicaltwo-sequence,two-periodWilliamsdesign(Figure 2)– TreatmentA:singledoseofdigoxin0.5mgonDay1– TreatmentB:RPV25mgq.d.onDays1to16,withasingledoseofdigoxin0.5mginthemorningonDay11.
•Allstudydrugswerealwaystakenwithameal.
•Thetrialprotocolwasreviewedandapprovedbytheappropriateinstitutionalethicscommitteeandhealthauthority,andthetrialwasconductedinaccordancewiththeDeclarationofHelsinki.Writteninformedconsentwasobtainedfromallvolunteers.
Herta Crauwels
Janssen Infectious Diseases BVBA
Beerse, Belgium
•RPVanddigoxincanbeco-administeredwithoutdoseadjustmentsofeitherdrug– RPVdoesnotaffecttheplasmaandurinepharmacokineticsofdigoxin– Co-administrationofRPVanddigoxinwasgenerallysafeandwelltolerated.
•TheseresultsindicatethatRPVattherecommendeddoseof25mgq.d.doesnotinfluenceP-gpactivityin vivo.
Conclusions
References1. AzijnH,etal.AntimicrobAgentsChemother2010;54:718–27.2. MolinaJMetal.Lancet2011;378:238−46.3. CohenCJ,etal.Lancet2011;378:229−37.4. CohenCJ,etal.6thIAS2011.PosterTULBPE032.5. EDURANT®(rilpivirine)tabletsprescribinginformation,2011.6. EVIPLERA®(emtricitabine/rilpivirine/tenofovirdisoproxilfumaratefixed-dosecombination)
tabletsprescribinginformation,2011.7. LANOXIN®(digoxin)tablets,fororaluseprescribinginformation,2012.
Acknowledgements and disclosures• Wewouldliketoexpressgratitudeto
– Thestudyvolunteers– TheInvestigator:SDeleu,MD,ClinicalPharmacologyUnit,Merksem,Belgium– JanssenRPVteammembers,inparticularDAnderson,BHadacek,PWilliamsandEWongfortheirinputintothisposter
– IVanwelkenhuysen(JanssenPharmaceuticalResearchandDevelopment,Beerse,Belgium)forbioanalyticalsupport.
• EditorialsupportwasprovidedbyIWoolveridgeofGardiner-CaldwellCommunications,Macclesfield,UK;thissupportwasfundedbyJanssen.
• HMC,HD,MSandRMHarefull-timeemployeesofJanssen.
Characteristic All volunteers
(N=22)
Sex, n (%)MaleFemale
11 (50)11 (50)
Median (range) age, years 46 (32–55)
Median (range) weight, kg 75 (56–99)
Median (range) body mass index, kg/m2 26 (21–30)
Race, n (%)Caucasian 22 (100)
Table 1. Baseline demographics.
Figure 1. Chemical structure and three-dimensional model of RPV.*
*Reproduced from Antimicrob Agents Chemother 2010;54:718−27 doi:10.1128/AAC.00986-09, with permission from the American Society for Microbiology
Figure 2. Study design.
Group 1(N=11)
Group 2(N=11)
Session 1 Session 2
RPV 25 mg q.d. (16 days) + single-dose digoxin Day 11
Single-dosedigoxin 0.5 mg
≥14 days
Pharmacokinetics* Pharmacokinetics†
Pharmacokinetics*Pharmacokinetics†
RPV 25 mg q.d. (16 days) + single-dose digoxin Day 11
Single-dosedigoxin 0.5 mg
≥14 days
†144-hour digoxin pharmacokinetics (plasma/urine); 24-hour RPV pharmacokinetics (plasma)*144-hour digoxin pharmacokinetics (plasma/urine)
Study evaluations•Venousbloodsamplesandurinewerecollectedfrompredoseupto144hoursafterdosing,forthedeterminationofdigoxinplasmaandurineconcentrations,onDay1ofTreatmentAandDay11ofTreatmentB.
•Venousbloodsampleswerecollectedfrompredoseupto24hoursafterdosing,forthedeterminationofRPVplasmaconcentrations,onDay11ofTreatmentB.
•PlasmaconcentrationsofdigoxinandRPVweredeterminedusingvalidatedliquidchromatography-massspectrometry/massspectrometry(LC-MS/MS)methods,withalowerlimitofquantificationof0.1ng/mLfordigoxinand1.0ng/mLforRPV.
•Aqualifiedresearchmethod(LC-MS/MS)wasusedforthedeterminationofdigoxinconcentrationsinurine,withalowerlimitofquantificationof500ng/mL.
•Safetyandtolerabilitywereassessedatregularintervalsthroughoutthetrial.Pharmacokinetic (PK) and statistical analyses•PlasmaPKparametersofRPVwerecalculatedusingnon-compartmentalPKanalysis,forcomparisonwithhistoricalcontrols– Plasmaconcentrationat0hours(C0h),Cmax,timetoCmax(tmax),areaundertheconcentration-timecurvefromtimeofadministrationto24hoursafterdosing(AUC24h).
•PKparametersofdigoxinwerecalculatedusingnon-compartmentalPKanalysis– Plasma:Cmax,tmax,AUC4h=AUCfromtimeofadministrationupto4hourspostdosing(whichcoversmostoftheabsorptionphaseofdigoxin);AUClast=AUCfromtimeofadministrationuptothelasttimepointwithameasurableconcentrationpostdosing– Urine:thetotalamountofdigoxinexcretedintotheurine(Aetotal),percentageoftheadministereddigoxindoseexcretedintotheurine(Durine,total),glomerularfiltrationratecalculatedbasedonserumcystatinClevels(GFRcystC),digoxinrenalclearance(CLR,digoxin),glomerularrenalclearanceofdigoxin,calculatedasfractionofunbounddigoxinxGFRcystC(CLGFR,digoxin),non-glomerular(active)renalclearanceofdigoxin,calculatedasCLR,digoxin–CLGFR,digoxin(CLnon-GFR,digoxin).
•PrimarydigoxinPKparameterswereCmaxandAUClast,andCLR,digoxinwasasecondaryPKparameter,allanalysedonthelogarithmicscale.
•Theleastsquare(LS)meansoftheprimaryPKparametersofdigoxinwereestimatedwithalinearmixedeffectsmodel,controllingfortreatment,sequenceandphaseasfixedeffectsandsubjectasarandomeffect.A90%confidenceinterval(CI)wasconstructedaroundthedifferencebetweentheLSmeansoftestandreference.BoththedifferencebetweentheLSmeansandthe90%CIswasretransformedtotheoriginalscale– Alldata,pairedandunpaired,wereincludedinthestatisticalanalysis.
•Safetydataweresummarisedusingdescriptivestatisticsandfrequencytabulations.
Figure 3. Mean (standard deviation [SD]) plasma concentration-time curve (first 24 hours only) of digoxin alone and in combination with steady-state RPV 25 mg q.d.
Time (hours)
2.5
2.0
1.5
1.0
0.5
0
Plas
ma
conc
entr
atio
n of
dig
oxin
(ng/
mL)
0 4 8 12 16 20 24
Single dose of digoxin 0.5 mg (N=21)RPV 25 mg q.d. + single dose of digoxin 0.5 mg (N=22)
PK parameter Digoxin 0.5 mg
alone (reference)Digoxin 0.5 mg
+ RPV 25 mg q.d. (test)
N 21 22
tmax, hours* 1.50 (0.68–3.00) 1.74 (0.65–3.02)
Cmax, ng/mL 1.93 ± 0.637 2.05 ± 0.678
AUC4h, ng•h/mL 4.44 ± 1.21 4.46 ± 1.31
AUClast, ng•h/mL 26.6 ± 7.38 26.0 ± 7.86
t1/2term, hours 38.8 ± 6.30 38.3 ± 8.17
LS means ratio† (90% CI)
Cmax 1.06 (0.97−1.17)
AUClast 0.98 (0.93−1.04)
*Median (range); †Ratios presented as test/reference, based on log-transformed PK parameters
Table 2. Mean (SD) PK parameters for digoxin in plasma when administered alone or in combination with steady-state RPV, including summary of statistical analysis.
PK parameter Digoxin 0.5 mg
alone (reference)Digoxin 0.5 mg
+ RPV 25 mg q.d. (test)
N 21* 22
Aetotal, mg 0.238 ± 0.0475 0.278 ± 0.0610
Durine,total, % 47.7 ± 9.51 55.7 ± 12.2
GFRcystC,† L/h 6.65 ± 1.01 6.89 ± 0.973
CLR,digoxin, L/h 9.46 ± 2.54 11.2 ± 2.66
CLGFR,digoxin, L/h 1.78 ± 0.483 1.84 ± 0.450
CLnon-GFR,digoxin, L/h 7.73 ± 2.49 9.38 ± 2.61
LS means ratioठ(90% CI)
CLR,digoxin 1.16 (1.07−1.25)¶
*N=18 for Aetotal, Durine,total, CLR,digoxin and CLnon-GFR,digoxin; †GFR can be determined based on serum creatinine, however, because RPV has some effect on creatinine clearance, serum cystatin C was used instead to calculate GFR; ‡N=22 for test and 18 for reference; §Ratio presented as test/reference, based on log-transformed PK parameters; ¶Upper limit of CI was 1.247227 rounded to 1.25
Table 3. Mean (SD) PK parameters for digoxin in urine when administered alone or in combination with steady-state RPV, including summary of statistical analysis.
Figure 4. Mean (SD) plasma concentration-time curve of steady-state RPV 25 mg q.d. in combination with a single dose of digoxin.
Time (hours)
300
250
200
150
100
50
0
Plas
ma
conc
entr
atio
n of
RPV
(ng/
mL)
0 4 8 12 16 20 24
RPV 25 mg q.d. + single dose of digoxin 0.5 mg (N=22)
Results
Study population•22volunteerswererandomisedandreceivedstudydrug.
•21volunteerscompletedthestudy– OnevolunteerprematurelydiscontinuedthestudyonDay20ofhisfirsttreatmentsession(TreatmentB:RPVplusdigoxin)duetoafamily-relatedissue.
Digoxin pharmacokinetics in plasma•ThepharmacokineticsofdigoxininplasmaintheabsenceandpresenceofRPVarepresentedinFigure 3andTable 2.
•Thedigoxinplasmapharmacokineticsweresimilarafterintakeofdigoxinaloneorco-administeredwithRPV– The90%CIsoftheLSmeansratiosforthemaindigoxinPKparameters,CmaxandAUClast,werecontainedwithinthe80−125%boundariesofnoeffect– Thet1/2termofdigoxinwassimilarintheabsenceorpresenceofsteady-stateRPV.
Digoxin pharmacokinetics in urine•ThepharmacokineticsofdigoxininurineintheabsenceandinthepresenceofRPVarepresentedinTable 3.
•Thedigoxinurinepharmacokineticsweresimilarafterintakeofdigoxinaloneorco-administeredwithRPV– AetotalandDurine,totalweregenerallycomparableafterintakeofdigoxininthepresenceofRPVversusdigoxintakenalone– The90%CIsoftheLSmeansratioforCLR,digoxinwerecontainedwithinthe80−125%boundariesofnoeffect– Renaleliminationofdigoxinviapassivefiltration(CLGFR,digoxin)andviaactivesecretion(CLnon-GFR,digoxin)wereinthesamerangeafterthecombinedintakeofdigoxinandRPVcomparedwithdigoxinintakealone.
RPV pharmacokinetics•ThepharmacokineticsofRPVinthepresenceofasingledoseofdigoxinarepresentedinFigure 4.
•RPVPKparametersinthistrialwereinlinewithpreviouslyobserveddata– Mean(SD)C0h,CmaxandAUC24hwere111(41.8)ng/mL,210(53.5)ng/mLand3177(899)ng•h/mL,respectively.
Safety and tolerability•Co-administrationofRPVanddigoxinwasgenerallysafeandwelltolerated.
•Therewerenoseriousadverseevents(AEs)orAEsleadingtodiscontinuationofthestudymedication.
•Nograde3or4AEsorlaboratoryabnormalitieswerereported.
•Themostfrequently(in>1volunteer)reportedtreatment-emergentAEswereheadache,backpain,abdominalpainandtoothabscess.NoneofthemostfrequentlyreportedAEswereconsideredrelatedtothestudymedicationbytheinvestigator.
•NoQTcvalue>500ms,noQTcchangeof>60msfrombaselineandnoAEsrelatedtoelectrocardiogramparameterswerereported.
•NoAEsrelatedtovitalsignsparameterswerereported.
•Therewerenoskineventsofinterest.•TheobservedAEswereinlinewithresultsfrompreviousRPVPhaseIstudies,andtherewerenomajordifferencesbetweenthetreatmentphasesinthisstudy.
31151F DDI Digoxin Poster v1f.indd 1 07/11/2012 11:27
Presented at the 11th International Congress on Drug Therapy in HIV Infection (HIV11), Glasgow, UK, 11–15 November 2012
Background
• Ritonavir-boosted darunavir (DRV/r), in combination with other antiretrovirals (ARVs), is indicated in Europe for the treatment of HIV-1 infection
– as once-daily dosing in ARV-naïve adults, and in ARV-experienced adults without DRV resistance-associated mutations (RAMs) with viral load <100,000 copies/mL and CD4 cell count >100 cells/mm3
– as twice-daily dosing in ARV-experienced adults with DRV RAMs and in paediatric patients aged 3 to <18 years and ≥15kg.1,2
• Two randomised, controlled, Phase III trials investigating the efficacy and safety of DRV/r 800/100mg qd, demonstrated high, sustained virological and immunological response rates in ARV-naïve adults (ARTEMIS) and in ARV-experienced adults without DRV RAMs (ODIN).3,4
• To date, preplanned pharmacokinetic (PK) and PK/pharmacodynamic (PD) analyses from ARTEMIS and ODIN have suggested no relevant relationship between DRV pharmacokinetics (area under the plasma concentration-time curve over 24 hours [AUC24h] or trough plasma concentrations [C0h]) and efficacy or safety.5,6
• Given the risks during long-term ARV therapy of suboptimal dosing, caused by poor adherence, drug interactions, comorbidities and/or treatment interruptions, we present an extended univariate PK/PD analysis for efficacy of DRV/r in ARTEMIS and ODIN at Week 48. The analysis employed a generalised additive model (GAM); GAMs can be used to summarise the trend of a response variable as a function of one or more predictors.7
Methods
Patients and study designs• ARTEMIS (AntiRetroviral Therapy with TMC114 ExaMined In naïve Subjects; TMC114-C211)
was a randomised, controlled 192-week, open-label study. HIV-1-infected, treatment-naïve adults received DRV/r 800/100mg qd (n=343) or lopinavir/ritonavir 800/200mg total daily dose (n=346), in addition to a fixed daily dose of tenofovir disoproxil fumarate/emtricitabine over 192 weeks.3
• ODIN (Once-daily Darunavir In treatment-experieNced patients; TMC114-C229) was a 48-week, open-label study comparing DRV/r 800/100mg qd (n=294) versus DRV/r 600/100mg bid (n=296) in addition to an investigator-selected optimised background regimen of ≥2 NRTIs in adult patients with no DRV RAMs (at screening).4
• The study protocols were reviewed and approved by appropriate institutional ethics committees and health authorities, and the studies were conducted in accordance with the Declaration of Helsinki. Written informed consent was obtained from all patients in both studies.
PK evaluations• In both trials, sparse blood sampling at Weeks 4, 8, 24 and 48 was performed in all patients
to determine plasma concentrations of DRV and ritonavir. Two samples were drawn at Weeks 4 and 24: the first immediately before DRV/r administration and the second ≥1 hour later.
• DRV and ritonavir plasma concentrations were determined by a previously validated liquid chromatography-mass spectrometry/mass spectrometry method with a lower limit of quantification of 5ng/mL for both compounds.
• Population PK models developed for DRV were based on data from HIV-1-infected patients and healthy volunteers.8 The population PK models used were two-compartmental with first-order absorption.9
• DRV AUC24h and C0h were determined using Bayesian estimation.
• In both trials, the relationship between DRV AUC24h and C0h and virological efficacy (change in log10 viral load from baseline and virological response [proportion of patients with HIV-1 RNA <50 copies/mL]) at Week 48 were assessed using analysis of covariance (ANCOVA).
Extended PK/PD analyses• The PK/PD analyses for both trials were extended using a univariate GAM approach, further
exploring the relationship between DRV C0h and virological response at the time of the Week 48 analysis.
• A spline with two degrees of freedom was selected, based on the Akaike information criterion value.
• Observed virological response per decile was used to provide a comparison of virological response versus the median DRV C0h for each respective decile.
• A linear logistic regression model was also applied to model virological response as a function of DRV C0h for both trials.
• The effect of potential reductions of up to 50% in DRV C0h on the predicted virological response for the total population were explored using the GAM and linear logistic regression models.
Results
ARTEMISPatient characteristics• The ARTEMIS trial population was diverse and representative of the general treatment-naive,
HIV-1-infected population in developed countries, with 30% women and 58% non-Caucasians. At baseline, median CD4 count was 225 cells/mm3, mean viral load was 4.85 log10 copies/mL and 34% of patients had HIV-1 RNA ≥100,000 copies/mL.3
• PK/PD data were available for 335 of the 343 patients treated with DRV/r (n=304 for the GAM and linear logistic regression extended analyses).
Week 48 PK/PD and observed virological response• No relevant relationship was observed between DRV/r AUC24h or C0h and the observed
virological response at Week 48 (Figure 1).5
• In addition, no apparent relationships were observed between DRV AUC24h or C0h quartile ranges and the observed change in log10 viral load from baseline at Week 48.5
Extended PK/PD analysis for Week 48• The mean virological response in the total population predicted by the GAM analysis was 92.8%.
• The GAM analysis suggested little relationship between DRV C0h and virological response, and there was no indication that lower values within the observed DRV C0h range result in lower estimated virological response (Figure 2).
• Similar results were seen for the linear logistic regression model. No clear relationship was established between DRV C0h and virological response (p=0.788), (Figure 3).
• Using either the GAM or the linear logistic regression model, a reduction in DRV C0h by up to 50% resulted in a similar predicted mean virological response in the total population to that obtained with no reduction in DRV C0h (GAM: 93.9%; logistic regression: 92.3%; Figure 4).
ODINPatient characteristics• The ODIN trial population was 36% female and 36% Caucasian, 26% Black, 18% Hispanic
and 15% Asian. At baseline, the median CD4 cell count was 228 cells/mm3 and mean HIV-1 RNA was 4.16 log10 copies/mL.4
• PK/PD data were available for 280/294 patients who received DRV/r 800/100mg qd (n=252 for the GAM and linear logistic regression extended analyses).
Week 48 PK/PD and observed virological response• For AUC24h, higher exposure was paradoxically associated with a slightly lower virological
response (Figure 5). No consistent relationship was observed between DRV C0h and the observed virological response at Week 48, although the response was lower for the highest C0h quartile compared with the other quartiles (Figure 5).
• Similarly, the decrease in log10 viral load from baseline at Week 48 tended to be smaller in patients with higher AUC24h values. No relevant relationship between DRV C0h and the change in log10 viral load from baseline at Week 48 was, however, observed.
Extended PK/PD analysis for Week 48• The mean virological response in the total population predicted by the GAM analysis was 80.6%.
• No clear relationship was evident between DRV C0h and observed virological response for DRV C0h values up to 3000ng/mL. However, virological response was lower in the two highest deciles of the observed DRV C0h range (Figure 6).
• A counter-intuitive inverse relationship was, therefore, seen between DRV C0h and the GAM-predicted virological response. In this respect, it should be noted that the variability of the estimate is greater in the highest two deciles.
• Using the linear logistic regression model, a similar predicted response curve was observed, with a counter-intuitive inverse relationship between DRV C0h and virological response (Figure 7; p=0.004).
• Based on the GAM, potential reductions in DRV C0h of up to 50% were not associated with lower responses (Figure 8).
• Almost identical mean predicted virological response rates were obtained with the application of the linear logistic regression model (Figure 8).
References1. PREZISTA® (darunavir). EPARs for authorised medicinal products for human use. July
2012. http://www.emea.europa.eu/humandocs/Humans/EPAR/prezista/prezista.htm.2. PREZISTA® (darunavir). Full Prescribing Information. Janssen Therapeutics. May 2012.
http://www.prezista.com/healthcare/full-prescribing-information.3. Ortiz R, et al. AIDS 2008;22:1389–97.4. Cahn P, et al. AIDS 2011;25:929–39.
5. Sekar V, et al. 15th CROI 2008. Abstract 769.6. Sekar V, et al. J Int AIDS Soc 2010;13(Suppl 4):P185.7. Hastie T, Tibshirani R. Generalized additive models 1990. Chapman and Hall, London.8. Vis P, et al. 15th Annual Meeting of the Population Approach Group Europe 2006.
Abstract 964.9. Exprimo. Data on file.
Acknowledgements and disclosures• The authors would like to thank:
– The patients and their families for their participation and support during the studies– ARTEMIS and ODIN Janssen study teams, the study centre staff and principal investigators– Chrispin Kambili and Geodele De Smedt from Janssen for their contributions to the poster.
• Medical writing support was provided by Farhan Hassan of Gardiner-Caldwell Communications, Macclesfield, UK; this support was funded by Janssen.
• The authors have the following conflicts of interest to declare: TK, FT, TVdC and TV are full-time employees of Janssen.
Conclusions • Based on Week 48 data from ARTEMIS and ODIN for patients receiving DRV/r
800/100mg qd, a reduction in DRV C0h of up to 50% was not associated with reduced virological response, as predicted by both the GAM and linear logistic regression models.
• Results from this extended Week 48 PK/PD analysis support findings from previous studies suggesting no clinically relevant relationship between DRV PK and efficacy, in the exposure range studied.
• Findings from this analysis provide further confirmation that a once-daily dose of DRV/r 800/100mg is suitable for ARV-naive adults and for ARV-experienced adults who have no DRV RAMs. This dose also provides sufficient coverage in situations where DRV exposures could be decreased, such as in the case of drug−drug interactions, suboptimal adherence and comorbidities.
• DRV/r doses below 800/100mg qd should not be administered.
Generalised additive model analysis of the relationship between darunavir pharmacokinetics and pharmacodynamics following once-daily darunavir/ritonavir 800/100mg treatment in the Phase III trials, ARTEMIS and ODINThomas N Kakuda,1 Frank Tomaka,1 Tom Van De Casteele,2 Tony Vangeneugden2
1Janssen Research & Development, LLC, Titusville, NJ, USA; 2Janssen Infectious Diseases BVBA, Beerse, Belgium
Address correspondence and/or reprint requests to: Thomas N Kakuda, PharmD, Janssen R&D, LLC, 1125 Trenton-Harbourton Road, K20605, Titusville, NJ 08560, USA. E-mail: [email protected]
P072
84.6 87.5 83.6
66.1
100
80
60
Viro
logi
cal r
espo
nse
(obs
erve
d) a
t Wee
k 48
(%)
40
20
0Q1 Q2 Q3 Q4
C0h quartiles
87.9 87.180.6
66.1
100
80
60
Viro
logi
cal r
espo
nse
(obs
erve
d) a
t Wee
k 48
(%)
40
20
0Q1 Q2 Q3 Q4
AUC quartiles
Figure 5. ODIN Week 48: confirmed virological response (HIV-1 RNA <50 copies/mL) by quartile range of DRV AUC24h and C0h.
91.196.1
90.4 93.3100
80
60Vi
rolo
gica
l res
pons
e(o
bser
ved)
at W
eek
48 (%
)
40
20
0Q1 Q2 Q3 Q4
C0h quartiles
93.7 94.689.7 93.2100
80
60
Viro
logi
cal r
espo
nse
(obs
erve
d) a
t Wee
k 48
(%)
40
20
0Q1 Q2 Q3 Q4
AUC quartiles
Figure 1. ARTEMIS Week 48: confirmed virological response (HIV-1 RNA <50 copies/mL) by quartile range of DRV AUC24h and C0h.
100
80
60
Viro
logi
cal r
espo
nse
(obs
erve
d) a
t Wee
k 48
(%)
40
20
01000 2000 3000 4000
C0h (ng/mL)
Estimated response
♦ Observed response per C0h decileConfidence interval
Figure 2. ARTEMIS Week 48: observed and GAM-predicted virological response in relation to DRV C0h.
100
80
60
Viro
logi
cal r
espo
nse
(obs
erve
d) a
t Wee
k 48
(%)
40
20
01000 2000 3000 4000
C0h (ng/mL)
Estimated response
♦ Observed response per C0h decileConfidence interval
Figure 6. ODIN Week 48: observed and GAM-predicted virological response in relation to DRV C0h.
100
80
60
Viro
logi
cal r
espo
nse
(obs
erve
d) a
t Wee
k 48
(%)
40
20
01000 2000 3000 4000
C0h (ng/mL)
Estimated response
♦ Observed response per C0h decileConfidence interval
Figure 3. ARTEMIS Week 48: observed and predicted virological response (using a linear logistic regression model) in relation to DRV C0h.
100
80
60
Viro
logi
cal r
espo
nse
(obs
erve
d) a
t Wee
k 48
(%)
40
20
01000 2000 3000 4000
C0h (ng/mL)
Estimated response
♦ Observed response per C0h decileConfidence interval
Figure 7. ODIN Week 48: observed and predicted virological response (using a linear logistic regression model) in relation to DRV C0h.
100
■ Predicted response using the GAM ■ Predicted response using a linear logistic regression model
80
60
92.8 92.8 92.9 92.7 93.0 92.6 93.2 92.5 93.5 92.4 93.9 92.3
Mea
n vi
rolo
gica
l res
pons
eat
Wee
k 48
(%)
40
20
00 10 20
Reduction in DRV C0h (%)30 40 50
Figure 4. ARTEMIS Week 48: predicted mean virological response with assumed reductions of DRV C0h of up to 50% using the GAM and linear logistic regression model.
100
■ Predicted response using the GAM ■ Predicted response using a linear logistic regression model
80
60
80.6 80.6 81.9 81.9 83.2 83.2 84.4 84.3 85.5 85.5 86.6 86.5
Mea
n vi
rolo
gica
l res
pons
eat
Wee
k 48
(%)
40
20
00 10 20
Reduction in DRV C0h (%)30 40 50
Figure 8. ODIN Week 48: predicted mean virological response with assumed reductions of DRV C0h of up to 50% using the GAM and linear logistic regression model.
28235F HIV11 Artemis Poster v1c.indd 1 06/11/2012 16:17
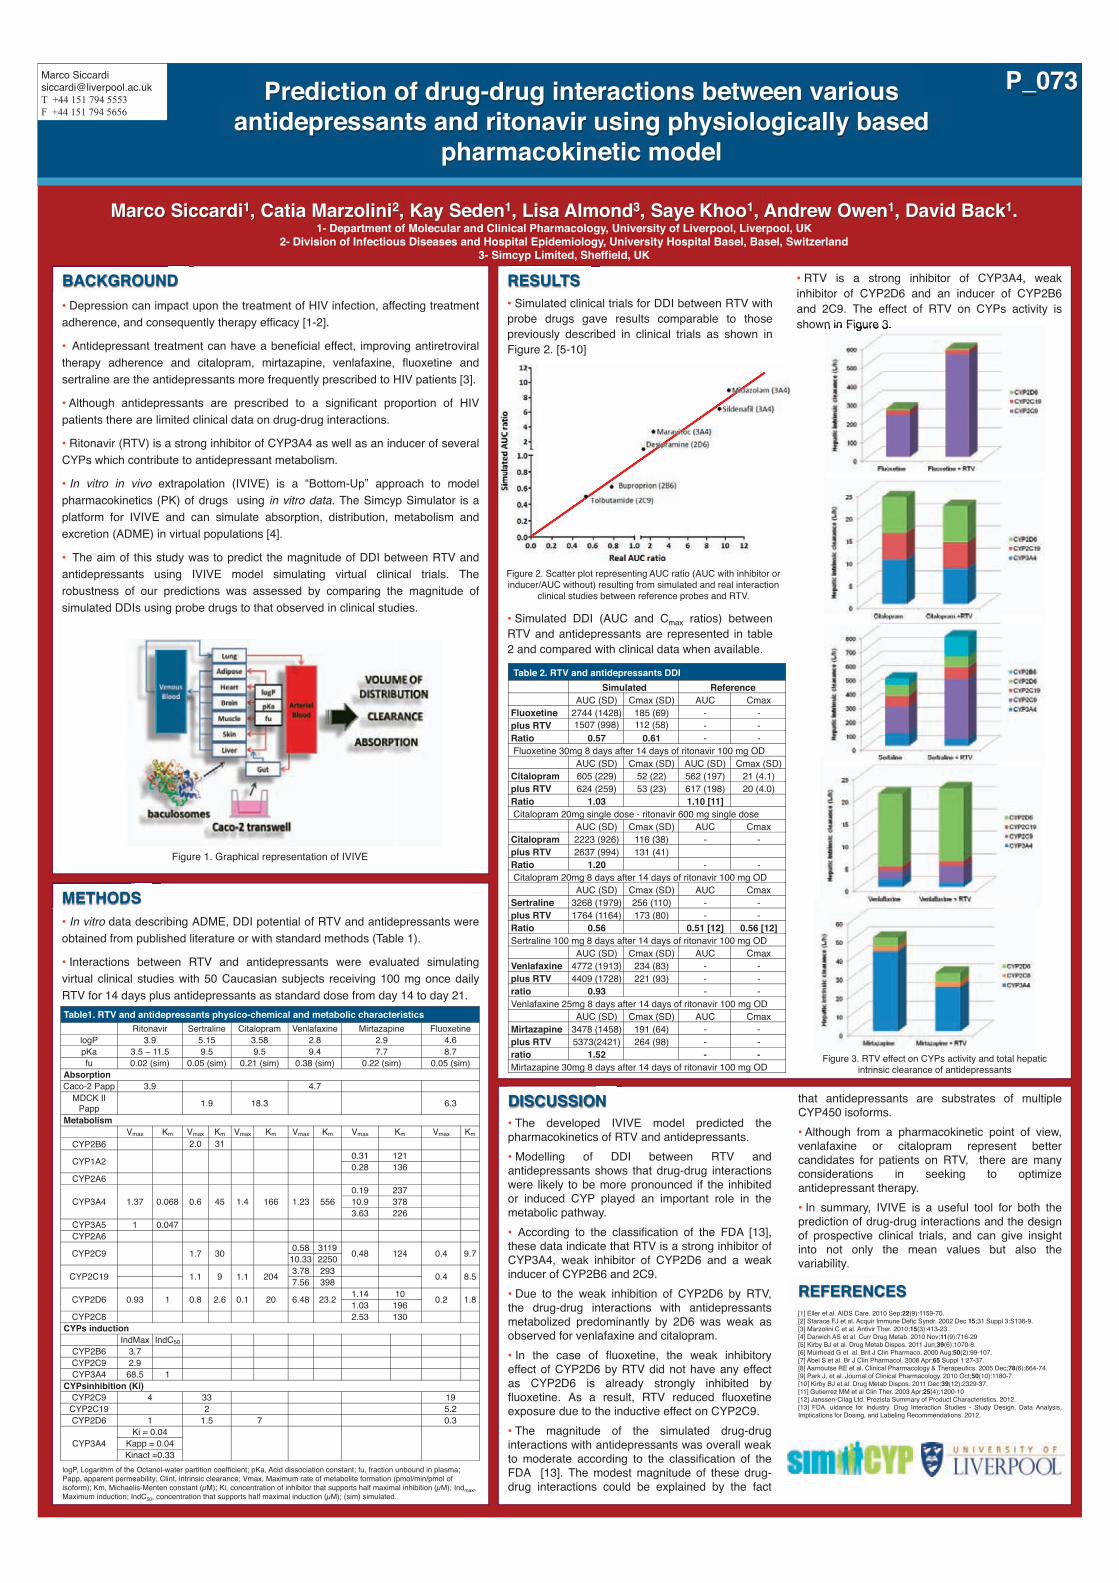
RESULTS
• Simulated clinical trials for DDI between RTV with probe drugs gave results comparable to those previously described in clinical trials as shown in Figure 2. [5-10]
• Simulated DDI (AUC and Cmax ratios) between RTV and antidepressants are represented in table 2 and compared with clinical data when available.
• RTV is a strong inhibitor of CYP3A4, weak inhibitor of CYP2D6 and an inducer of CYP2B6 and 2C9. The effect of RTV on CYPs activity is shown in Figure 3.
BACKGROUND
• Depression can impact upon the treatment of HIV infection, affecting treatment adherence, and consequently therapy efficacy [1-2].
• Antidepressant treatment can have a beneficial effect, improving antiretroviral therapy adherence and citalopram, mirtazapine, venlafaxine, fluoxetine and sertraline are the antidepressants more frequently prescribed to HIV patients [3].
• Although antidepressants are prescribed to a significant proportion of HIV patients there are limited clinical data on drug-drug interactions.
• Ritonavir (RTV) is a strong inhibitor of CYP3A4 as well as an inducer of several CYPs which contribute to antidepressant metabolism.
• In vitro in vivo extrapolation (IVIVE) is a “Bottom-Up” approach to model pharmacokinetics (PK) of drugs using in vitro data. The Simcyp Simulator is a platform for IVIVE and can simulate absorption, distribution, metabolism and excretion (ADME) in virtual populations [4].
• The aim of this study was to predict the magnitude of DDI between RTV and antidepressants using IVIVE model simulating virtual clinical trials. The robustness of our predictions was assessed by comparing the magnitude of simulated DDIs using probe drugs to that observed in clinical studies.
Marco Siccardi1, Catia Marzolini2, Kay Seden1, Lisa Almond3, Saye Khoo1, Andrew Owen1, David Back1. 1- Department of Molecular and Clinical Pharmacology, University of Liverpool, Liverpool, UK
2- Division of Infectious Diseases and Hospital Epidemiology, University Hospital Basel, Basel, Switzerland 3- Simcyp Limited, Sheffield, UK
Prediction of drug-drug interactions between various antidepressants and ritonavir using physiologically based
pharmacokinetic model
DISCUSSION
• The developed IVIVE model predicted the pharmacokinetics of RTV and antidepressants.
• Modelling of DDI between RTV and antidepressants shows that drug-drug interactions were likely to be more pronounced if the inhibited or induced CYP played an important role in the metabolic pathway.
• According to the classification of the FDA [13], these data indicate that RTV is a strong inhibitor of CYP3A4, weak inhibitor of CYP2D6 and a weak inducer of CYP2B6 and 2C9.
• Due to the weak inhibition of CYP2D6 by RTV, the drug-drug interactions with antidepressants metabolized predominantly by 2D6 was weak as observed for venlafaxine and citalopram.
• In the case of fluoxetine, the weak inhibitory effect of CYP2D6 by RTV did not have any effect as CYP2D6 is already strongly inhibited by fluoxetine. As a result, RTV reduced fluoxetine exposure due to the inductive effect on CYP2C9.
• The magnitude of the simulated drug-drug interactions with antidepressants was overall weak to moderate according to the classification of the FDA [13]. The modest magnitude of these drug-drug interactions could be explained by the fact
that antidepressants are substrates of multiple CYP450 isoforms.
• Although from a pharmacokinetic point of view, venlafaxine or citalopram represent better candidates for patients on RTV, there are many considerations in seeking to optimize antidepressant therapy.
• In summary, IVIVE is a useful tool for both the prediction of drug-drug interactions and the design of prospective clinical trials, and can give insight into not only the mean values but also the variability.
REFERENCES [1] Eller et al. AIDS Care. 2010 Sep;22(9):1159-70. [2] Starace FJ et al. Acquir Immune Defic Syndr. 2002 Dec 15;31 Suppl 3:S136-9. [3] Marzolini C et al. Antivir Ther. 2010;15(3):413-23. [4] Darwich AS et al. Curr Drug Metab. 2010 Nov;11(9):716-29 [5] Kirby BJ et al. Drug Metab Dispos. 2011 Jun;39(6):1070-8. [6] Muirhead G et al. Brit J Clin Pharmaco. 2000 Aug;50(2):99-107. [7] Abel S et al. Br J Clin Pharmacol. 2008 Apr;65 Suppl 1:27-37. [8] Aarnoutse RE et al. Clinical Pharmacology & Therapeutics. 2005 Dec;78(6):664-74. [9] Park J, et al. Journal of Clinical Pharmacology. 2010 Oct;50(10):1180-7. [10] Kirby BJ et al. Drug Metab Dispos. 2011 Dec;39(12):2329-37. [11] Gutierrez MM et al Clin Ther. 2003 Apr;25(4):1200-10 [12] Janssen-Cilag Ltd. Prezista Summary of Product Characteristics. 2012. [13] FDA. uidance for Industry. Drug Interaction Studies - Study Design, Data Analysis, Implications for Dosing, and Labeling Recommendations. 2012.
METHODS
• In vitro data describing ADME, DDI potential of RTV and antidepressants were obtained from published literature or with standard methods (Table 1).
• Interactions between RTV and antidepressants were evaluated simulating virtual clinical studies with 50 Caucasian subjects receiving 100 mg once daily RTV for 14 days plus antidepressants as standard dose from day 14 to day 21.
logP, Logarithm of the Octanol-water partition coefficient; pKa, Acid dissociation constant; fu, fraction unbound in plasma; Papp, apparent permeability; Clint, intrinsic clearance; Vmax, Maximum rate of metabolite formation (pmol/min/pmol of isoform); Km, Michaelis-Menten constant (µM); Ki, concentration of inhibitor that supports half maximal inhibition (µM); Indmax, Maximum induction; IndC50, concentration that supports half maximal induction (µM); (sim) simulated.
Marco Siccardi [email protected] T +44 151 794 5553 F +44 151 794 5656
P_073
Figure 1. Graphical representation of IVIVE
Table1. RTV and antidepressants physico-chemical and metabolic characteristics Ritonavir Sertraline Citalopram Venlafaxine Mirtazapine Fluoxetine
logP 3.9 5.15 3.58 2.8 2.9 4.6 pKa 3.5 – 11.5 9.5 9.5 9.4 7.7 8.7 fu 0.02 (sim) 0.05 (sim) 0.21 (sim) 0.38 (sim) 0.22 (sim) 0.05 (sim)
Absorption Caco-2 Papp 3.9 4.7
MDCK II Papp 1.9 18.3 6.3
Metabolism Vmax Km Vmax Km Vmax Km Vmax Km Vmax Km Vmax Km
CYP2B6 2.0 31
CYP1A2 0.31 121 0.28 136
CYP2A6
CYP3A4 1.37 0.068 0.6 45 1.4 166 1.23 556 0.19 237 10.9 378 3.63 226
CYP3A5 1 0.047 CYP2A6
CYP2C9 1.7 30 0.58 3119 0.48 124 0.4 9.7 10.33 2250
CYP2C19 1.1 9 1.1 204 3.78 293 0.4 8.5 7.56 398
CYP2D6 0.93 1 0.8 2.6 0.1 20 6.48 23.2 1.14 10 0.2 1.8 1.03 196 CYP2C8 2.53 130
CYPs induction IndMax IndC50
CYP2B6 3.7 CYP2C9 2.9 CYP3A4 68.5 1
CYPsinhibition (Ki) CYP2C9 4 33 19
CYP2C19 2 5.2 CYP2D6 1 1.5 7 0.3
CYP3A4 Ki = 0.04
Kapp = 0.04 Kinact =0.33
Figure 2. Scatter plot representing AUC ratio (AUC with inhibitor or inducer/AUC without) resulting from simulated and real interaction
clinical studies between reference probes and RTV.
Table 2. RTV and antidepressants DDI Simulated Reference AUC (SD) Cmax (SD) AUC Cmax Fluoxetine 2744 (1428) 185 (69) - - plus RTV 1507 (998) 112 (58) - - Ratio 0.57 0.61 - - Fluoxetine 30mg 8 days after 14 days of ritonavir 100 mg OD AUC (SD) Cmax (SD) AUC (SD) Cmax (SD) Citalopram 605 (229) 52 (22) 562 (197) 21 (4.1) plus RTV 624 (259) 53 (23) 617 (198) 20 (4.0) Ratio 1.03 1.10 [11] Citalopram 20mg single dose - ritonavir 600 mg single dose AUC (SD) Cmax (SD) AUC Cmax Citalopram 2223 (926) 116 (38) - - plus RTV 2637 (994) 131 (41) Ratio 1.20 - - Citalopram 20mg 8 days after 14 days of ritonavir 100 mg OD AUC (SD) Cmax (SD) AUC Cmax Sertraline 3268 (1979) 256 (110) - - plus RTV 1764 (1164) 173 (80) - - Ratio 0.56 0.51 [12] 0.56 [12] Sertraline 100 mg 8 days after 14 days of ritonavir 100 mg OD AUC (SD) Cmax (SD) AUC Cmax Venlafaxine 4772 (1913) 234 (83) - - plus RTV 4409 (1728) 221 (93) - - ratio 0.93 - - Venlafaxine 25mg 8 days after 14 days of ritonavir 100 mg OD AUC (SD) Cmax (SD) AUC Cmax Mirtazapine 3478 (1458) 191 (64) - - plus RTV 5373(2421) 264 (98) - - ratio 1.52 - - Mirtazapine 30mg 8 days after 14 days of ritonavir 100 mg OD
shown in Figure 3.
Figure 3. RTV effect on CYPs activity and total hepatic intrinsic clearance of antidepressants

Total and Unbound Darunavir (DRV) Pharmacokinetics (PK) in HIV-1–Infected Pregnant Women
Carmen Zorrilla,1 Rodney Wright,2 Olayemi O. Osiyemi,3 Salih Yasin,4 Bryan Baugh,5 Kimberley Brown,5 Bruce Coate,6 Peter Verboven,7 Vera Hillewaert,7 Thomas N. Kakuda6
1Univers i ty of Puer to R ico School o f Medic ine, San Juan, Puer to R ico ; 2Montef iore Medica l Center /A lber t E inste in Col lege of Medic ine, Bronx, NY; 3Tr ip le O Research Inst i tute PA, West Pa lm Beach, FL ; 4Univers i ty of Miami School o f Medic ine, Miami , FL ; 5Janssen Serv ices, LLC, Ti tusv i l le, NJ ; 6Janssen Research & Deve lopment , Ti tusv i l le, NJ ; 7Janssen Research & Deve lopment , Beerse, Be lg ium
Presented at the E leventh Internat ional Congress on Drug Therapy in HIV In fect ion (HIV11) , G lasgow, UK, November 11-15, 2012. I f you have any addi t ional quest ions or would l ike a copy of th is poster, ca l l +1-800-JANSSEN (+1-800-526-7736) or go to www. janssenmedinfo.com.
INTRODUCTION• Mother-to-child transmission of HIV-1 in the United States has been
substantially reduced with the advent of highly active antiretroviral (ARV) therapy1; therefore ARV therapy during pregnancy is recommended by evidence-based guidelines2
– Data on darunavir/ritonavir (DRV/rtv) during pregnancy are limited to a series of case reports,3-10 only some of which examined pharmacokinetic (PK) parameters3,5-9,11,12
• Physiologic changes during pregnancy—such as blood volume expansion, increased glomerular filtration rate and alterations in hepatic metabolism—may result in altered PK13
– Based on available data, it seems that the PK of nucleoside reverse transcriptase inhibitor and non–nucleoside reverse transcriptase inhibitor (NNRTI) drugs are similar in pregnant and non-pregnant women14-17
– Conversely it seems that HIV protease inhibitor (PI) PK parameters are changed during pregnancy, leading to lower exposure in pregnant women3,5,8,18-25
– Studying DRV/rtv, etravirine (ETR) and rilpivirine (RPV) in pregnant subjects with HIV may provide important insights into population-specific PK and bioavailability that could potentially affect treatment strategies and dosing recommendations with regard to these ARVs
• This Phase III, nonrandomized study investigated the PK profile, antiviral activity and safety of DRV/rtv, ETR and RPV during the second and third trimesters of gestation in HIV-1–infected women receiving DRV/rtv (600/100mg twice-daily [bid] or 800/100mg once daily [qd]), ETR (200mg bid), and/or RPV (25mg qd). Moreover, this study included postpartum follow-up of the women taking ARVs
– PK data of total DRV and total rtv administered bid, along with antiviral activity and safety data, are shown; the other arms are ongoing and subject to future presentations
– We also present PK data of pharmacologically active (unbound) DRV, as DRV is highly protein bound
METHODSStudy design and treatment• Phase IIIb, multicenter, single-arm, open-label trial (Figure 1)
• Subjects received DRV/rtv (600/100mg bid or 800/100mg qd), ETR (200mg bid) and/or RPV (25mg qd) plus an optimized background regimen
– The data presented here are derived from subjects who received DRV/rtv 600/100mg bid. Data from the other treatment arms are still being collected and will be reported at a later time
Figure 1
Study objectives (for the DRV/rtv arm only)• Primary objective
– To assess the effect of pregnancy on the PK of DRV/rtv during the second and third trimesters of gestation, as well as postpartum
• Secondary objectives
– To document antiviral activity during gestation and postpartum
– To describe the safety and tolerability of DRV/rtv-based, ARV regimens during gestation and postpartum
– To compare DRV/rtv concentrations between serum and cord blood at the time of delivery
– To assess outcomes for infants of women treated with DRV/rtv during pregnancy
DRV/rtv study arm evaluations• 12-hour PK samplings were performed at 3 study visits: second
trimester, third trimester and 6–12 weeks postpartum
– 8 blood draws were taken during each visit: one predose and one for each of 7 post-dose sampling time points (hours 1, 2, 3, 4, 6, 9, 12)
– DRV (total and unbound) and rtv (total) plasma concentrations were measured
Total DRV and rtv plasma concentrations were determined using a previously validated HPLC-MS/MS assay (lower limit of quantification 5.00ng/mL, for both DRV and rtv)26
Unbound DRV was determined by fortifying plasma samples with 14C-DRV and separating unbound DRV using ultrafiltration. Total and unbound 14C-DRV was measured using liquid scintillation counting
• Safety assessments including albumin and a1-acid glycoprotein (AAG) were completed at each visit
– Among the standard clinical laboratory tests performed, human serum albumin and AAG were monitored because the concentration of these proteins usually decreases during pregnancy due to hemodilution
Statistical analysis• Total and unbound PK parameters were derived using noncompartmental
analysis (WinNonlin Professional™ 4.1, Pharsight, Mountain View, CA, USA)
• Safety and antiviral activity were investigated at each visit and summarized using descriptive statistics (SAS 9.2, SAS Institute Inc., Cary, NC, USA)
RESULTSSubject population and baseline characteristics• 16 women were enrolled in the trial and received DRV/rtv 600/100mg
bid (Table 1)
Table 1. Baseline demographics and disease characteristics
Subject disposition• Any subject who underwent PK sampling at any point in the study was
analyzed, including those who did not complete all visits
– 14 subjects had at least one PK sample taken and were included in the PK analysis. For some subjects plasma concentrations and PK parameters were excluded from analysis, and for some subjects no PK samples were taken at one or two of the visits
Full pharmacokinetic profiles of total darunavir were available for 10 subjects in the second trimester of pregnancy, for 11 subjects in the third trimester of pregnancy and for 11 subjects at the postpartum visit. For unbound darunavir, AUC values could be reported for 6, 7 and 11 subjects for the second trimester, third trimester and postpartum, respectively
Full pharmacokinetic profiles of ritonavir were available for 11 subjects in all three periods
• 5 subjects discontinued (Table 2)
– The 2 subjects who discontinued due to virologic failure had suboptimal adherence (documented by principal investigator)
Table 2. Study discontinuations
Pharmacokinetics of total and unbound DRV• Total and unbound DRV plasma concentrations were higher during the
postpartum period, compared with the second and third trimesters of pregnancy (Figure 2, Table 3, Figure 3, and Table 4)
• Matched maternal and cord plasma concentrations were available from 10 subjects. Excluding one outlier due to possible switch of the samples, the mean (standard deviation [SD]) total darunavir concentrations were higher in maternal plasma versus cord plasma (2324ng/mL [1056] versus 383ng/mL [322]) when assessed in nine women and their infants. The median cord/maternal plasma ratio was 14.5% (range 1.4%–36.2%)
• Pharmacokinetic parameters (minimum plasma concentration [Cmin], predose plasma concentration [C0h], maximum plasma concentration [Cmax], and area under the concentration–time curve over 12 hours [AUC12h]) for total and unbound DRV are provided in Table 3 and Table 4, respectively
Figure 2. Mean plasma (SD) concentration-time curves of total DRV after administration of DRV/rtv 600/100mg bid, during the second and third trimesters and postpartum
Table 3. Mean (± SD)a PK parameters and statistical results of total DRV after administration of DRV/rtv 600/100mg bid, during the second and third trimesters and postpartum
Figure 3. Mean (SD) plasma concentration-time curves of unbound DRV after administration of DRV/rtv 600/100mg bid, during the second and third trimesters and postpartum
Table 4. Mean (± SD)a PK parameters and statistical results of unbound DRV after administration of DRV/rtv 600/100mg bid, during the second and third trimesters and postpartum
Pharmacokinetics of total rtv• Total rtv plasma concentrations were higher during the postpartum
period, compared with the second and third trimesters of pregnancy (Figure 4)
• Pharmacokinetic parameters (Cmin, C0h, Cmax, AUC12h) for total rtv are provided in Table 5
Figure 4. Mean (SD) plasma concentration-time curves of total rtv after administration of DRV/rtv 600/100mg bid, during the second and third trimesters and postpartum
Table 5. Mean (± SD)a PK parameters and statistical results of total rtv after administration of DRV/rtv 600/100mg bid, during the second and third trimesters and postpartum
Albumin and AAG concentrations• Albumin and AAG concentrations were 22% to 29% lower during pregnancy
versus postpartum (Figure 5)
Figure 5. Mean (SE) albumin (A) and AAG (B)
Antiviral activity• Antiviral response was generally maintained (Figure 6A) and the
percentage CD4+ count slightly increased (Figure 6B) over time
– CD4+ count has been reported to be significantly decreased in HIV-1–negative pregnant women compared with the 12-week post delivery period.27 For this reason, percentage of CD4+ count was plotted in lieu of absolute CD4+ count (Figure 6B)
• All 12 infants were HIV-negative by standard PCR testing, performed within 16 weeks postpartum
– One infant was born to a subject who discontinued before completing the study
Figure 6. Virologic response (A) and CD4 + count (B) at various time points throughout the study
Safety• The most common adverse events (AEs) occurring with an incidence ≥25%
during the treatment phase were infections and infestations (43.8%), gastrointestinal disorders (25.0%) and premature labor (25.0%)
– 4 of 12 infants were born prematurely, at Weeks 30.3, 35.9, 36.4, and 36.6
• No AEs possibly related to study medication occurring in at least 2 subjects were observed
• One serious AE was reported (increased transaminase, 6.3%)
DISCUSSION• Lower exposures of DRV/rtv 600/100mg bid were observed during
pregnancy compared with postpartum. These data are consistent with data observed from other HIV PIs when used during pregnancy3,5,8,18-25
– Total darunavir Cmax during the second and third trimesters was 28% and 19% lower, respectively, compared with postpartum, whereas total DRV Cmin increased by 43% during the second trimester and by 86% during the third trimester versus postpartum. AUC12h was 24% and 17% lower in the second and third trimesters, respectively, compared with postpartum
– The free fraction of DRV was slightly higher during pregnancy compared with postpartum. As a result, the difference in unbound Cmax and AUC12h at postpartum compared with that during pregnancy was less pronounced than for total DRV
The decreased drug exposure of DRV during pregnancy might be partially compensated for by an increased proportion of free drug, as albumin and AAG concentrations are decreased during pregnancy
– Total Cmax for rtv was 34% and 37% lower, total Cmin was 8% and 22% higher, and AUC12h was 28% and 33% lower, respectively, during the second and third trimesters, compared with postpartum
– The amount of darunavir/ritonavir transferred from maternal to cord plasma was low, with median cord/maternal ratios of 14.5% and 10.8%, respectively, consistent with other reports demonstrating low transplacental passage of PIs3,7
– Postpartum DRV and rtv PK results are within one standard deviation of historical data, such as non-pregnant women enrolled in the GRACE (Gender, Race And Clinical Experience) trial 28
– Importantly, the unbound concentrations of DRV remained relatively unchanged during the second/third trimesters and postpartum
• The antiviral activity in HIV+ pregnant women was consistent with that of non-pregnant HIV-infected individuals
• DRV/rtv treatment was generally well-tolerated with few discontinuations due to AEs (12%)
– The observed AE profile partially overlaps with previously described AEs in non-pregnant adults.29 It is unclear how many AEs may actually have been associated with pregnancy independent of DRV/rtv treatment
CONCLUSIONS• DRV PK parameters after administration of DRV/rtv 600/100mg
twice daily as part of an ARV regimen during pregnancy and postpartum were lower relative to postpartum, based on total plasma concentrations
• Unbound concentrations of DRV remained relatively unchanged during pregnancy relative to postpartum suggesting no a priori dose adjustment is needed in DRV/rtv (when dosed twice daily) in pregnant women
• Plasma concentrations of DRV when co-administered with low-dose rtv seem adequate to suppress HIV and prevent mother- to-child transmission
• This regimen was effective and generally well-tolerated in HIV+ pregnant women
• These data suggest that DRV/rtv 600/100mg twice daily as part of an ARV regimen could be part of a treatment option for pregnant women in need of highly active ARV therapy
• This trial is ongoing to collect PK data on DRV/rtv 800/100mg qd, ETR 200mg bid and RPV 25mg qd
REFERENCES1. Tudor Car L, et al. Cochrane Database Syst Rev. 2011;(6):CD008741. 2. Panel on Treatment of HIV-Infected Pregnant Women and Prevention of Perinatal Transmission Recommendations for Use of Antiretroviral Drugs in Pregnant HIV-1-Infected Women for Maternal Health and Interventions to Reduce Perinatal HIV Transmission in the United States. Sep. 14, 2011; pp 1-207. http://aidsinfo.nih.gov/contentfiles/PerinatalGL.pdf. Accessed January 2012. 3. Ivanovic J, et al. AIDS. 2010;24(7):1083–1084. 4. Jaworsky D, et al. Antivir Ther. 2010;15(4):677–680. 5. Pinnetti C, et al. Antivir Ther. 2010;15(1):127–129. 6. Furco A, et al. AIDS. 2009;23(3):434–435. 7. Ripamonti D, et al. Int J STD AIDS. 2009;20(3):215–216. 8. Pacanowski J, et al. AIDS. 2009;23(14):1923–1924. 9. Caparelli E, et al. 3rd Int Workshop HIV Pediatr; July 15–16, 2011; Rome, Italy. Poster P72. 10. Sued O, et al. Int J STD AIDS. 2008;19(12):866–867. 11. Courbon E, et al. Presented at the 19th Conference on Retroviruses and Opportunistic Infections; March 5-8, 2012; Seattle, Washington. Poster 1011. 12. Colbers A, et al. Presented at the 19th Conference on Retroviruses and Opportunistic Infections; March 5-8, 2012; Seattle, Washington. Poster 1013. 13. Anderson GD. Clin Pharmacokinet. 2005;44:989–1008. 14. O’Sullivan MJ, et al. Am J Obstet Gynecol. 1993;168:1510–1516. 15. Moodley J, et al. J Infect Dis. 1998;178:1327–1333. 16. Wade NA, et al. J Infect Dis. 2004;190:2167–2174. 17. Mirochnick M, et al. Pediatr Infect Dis J. 2001;20:803–805. 18. Kosel BW, et al. AIDS. 2003;17:1195–1199. 19. Nellen JF, et al. Clin Infect Dis. 2004;39:736–740. 20. Acosta EP, et al. Antimicrob Agents Chemother. 2004;48:430–436. 21. Stek AM, et al. AIDS. 2006;20:1931–1939. 22. Villani P, et al. Br J Clin Pharmacol. 2006:62:309–315. 23. Else LJ, et al. Antimicrob Agents Chemother. 2012;56(2):816–824. 24. Conradie F, et al. HIV Med. 2011;12(9):570–579. 25. Mirochnick M, et al. J Acquir Immune Defic Syndr. 2011;56(5):412–419. 26. Schöller-Gyüre M, et al. Antivir Ther. 2007;12(5):789–796. 27. Towers CV, et al. J Matern Fetal Neonatal Med. 2010;23(10):1091. 28. Kakuda TN, et al. AIDS Res Treat. 2012; 2012: 186987. 29. Madruga JV, et al. Lancet. 2007;370(9581):49–58.
ACKNOWLEDGMENTSThe authors thank the subjects, study sites and principal investigators for their participation in the trial. The authors also acknowledge internal study support staff, as well as Francesca Balordi, PhD, Medicus International New York, for her editorial assistance. Funding for the study and for editorial support was provided by Janssen Services LLC. These data have been presented previously: Zorilla C, et al. 19th CROI 2012. Poster 1012.
Screening phase (4 weeks) Treatment phase (≤24 weeks)
• HIV-1–infected pregnant women (18–26 weeks of gestation)• Age ≥18 years • Receiving DRV/rtv, ETR and/or RPV for at least 2 weeks prior to entry in the study • Normal OB exam and level II ultrasound • No currently active AIDS-defining illness, with the exceptions of – Stable cutaneous Kaposi’s sarcoma – Wasting syndrome due to HIV infection• No prior use of investigational agents within 90 days• No active alcohol or recreational drug use
DRV/rtv 600/100 mg bid + background regimenN≤16 a
a N≤64 when all treatment groups are included Plasma concentrations of DRV, rtv, ETR, or RPV determined on second trimester, third trimester and postpartum DRV/rtv, darunavir/ritonavir; ETR, etravirine; RPV, rilpivirine; OB, obstetrician; bid, twice daily; qd, once daily
100
35
34
33
32
31
30
29
28
27
26
25
24
23
91%
36%
<50 <400
80
60
40
20
0
Resp
onse
rat
e (%
)
Med
ian
% C
D4+
coun
t
Baseline
n/N 4/11 10/11 8/11 10/11 9/10 10/10 8/10 10/10 8/10 8/10
Response category (copies/mL)
2ndtrimester
3rdtrimester
Postpartum(2-5 weeks)
Postpartum(6-12 weeks)
Postpartum(6-12 weeks)
(N=10)
Postpartum(2-5 weeks)
(N=8)
3rdtrimester(N=11)
2ndtrimester(N=14)
Baseline(N=14)
Screening(N=14)
91%
73%
100%
90%
100%
80% 80%80%
A B
P074
SD, standard deviation; DRV, darunavir; rtv, ritonavir; bid, twice daily
1600
1400
1200
1000
800
600
400
200
00 2 4 6 8 10 12Pl
asm
a co
ncen
trat
ion
of u
nbou
nd d
arun
avir
(ng/
mL)
Time (hours)
2nd trimester (n=10)3rd trimester (n=9)
Postpartum (6-12 weeks) (n=11)
a Increased transaminases (ALT, 286 U/L; AST, 161 U/L) and premature delivery; b Positive drug test. AE, adverse event
Total number of discontinuations, n (%) 5 (31)
During treatment 4 (25)
During follow-up 1 (6)
Reasons for discontinuations, n (%)
AE/HIV-relateda 2a (12)
Virologic failure 2 (12)
Ineligible to continue trialb 1 (6)
1800
1600
1400
1200
1000
600
800
400
200
00 2 4 6 8 10 12
Plas
ma
conc
entr
atio
n of
tot
al r
iton
avir
(ng/
mL)
Time (hours)
2nd trimester (n=12)3rd trimester (n=11)
Postpartum (6-12 weeks) (n=11)
SD, standard deviation; DRV, darunavir; rtv, ritonavir; bid, twice daily
Carmen Zorrilla, MD University of Puerto Rico School of Medicine Obstetrics and Gynecology Department Maternal-Infant Studies Center (CEMI) PO Box 365067 San Juan, Puerto Rico 00936-5067 [email protected]
a N=16 unless otherwise noted. DRV/rtv, darunavir/ritonavir; bid, twice daily; BMI, body mass index; ARV, antiretroviral; PI, protease inhibitor; NNRTI, non-nucleoside reverse transcriptase inhibitor
Characteristic Subjectsa
Subjects enrolled and treated with DRV/rtv 600/100mg bid, N 16
Age at screening, median (range), years 24 (18–35)
Age ≤30 years, n (%) 13 (81)
30 years < age ≤45 years, n (%) 3 (19)
Race, n (%)
Black or African American 10 (63)
Hispanic 4 (25)
White 2 (13)BMI, median (range), kg/m² 29 (20–59)
First pregnancy, n (%)
No 14 (88)
Yes 2 (13)
Time since conception, median (range), weeks 22 (20–26)
Time since diagnosis, median (range), years 3 (0–17)
Clinical stage of HIV infection, n (%)
Category A 15 (94)
Category B 1 (6)
CD4+ count, median (range), cells/mm³ [n=15] 421 (104–793)
CD4+ count 100 to <200 cells/mm³, n (%) 1 (7)
CD4+ count 200 to 350 cells/mm³, n (%) 2 (13)
CD4+ count ≥350 cells/mm³, n (%) 12 (80)
Viral load, median (range), copies/mL [n=15] 83 (49–45,200)
Viral load <50 copies/mL, n (%) 5 (33)
Viral load 50 to <400 copies/mL, n (%) 8 (53)
Viral load 400 to 1000 copies/mL, n (%) 1 (7)
Viral load ≥1000 copies/mL, n (%) 1 (7)
Previous ARV experience, n (%)
PIs: 0 1 (6)
PIs: 1 10 (63)
PIs: ≥2 5 (31)
NNRTIs: 0 13 (81)
NNRTIs: 1 3 (19)
Hepatitis B surface antigen negative and hepatitis C antibody negative, n (%) [N=15] 15 (100)
a Median (range) for tmax; b n=10 for AUC12h. PK, pharmacokinetic; DRV, darunavir; rtv, ritonavir; bid, twice daily; SD, standard deviation; C0h, predose plasma concentration; Cmin, minimum plasma concentration; Cmax, maximum plasma concentration; tmax, time to reach the maximum plasma concentration; AUC12h, area under the plasma concentration–time curve over 12 hours; LS, least squares; CI, confidence interval
PK of total DRVPostpartum[reference]
Second trimester Third trimester
n 11 11b 11
C0h , ng/mL 3497 ± 2922 2403 ± 1161 3028 ± 1236
Cmin, ng/mL 2711 ± 2268 1980 ± 840 2498 ± 1193
Cmax, ng/mL 6499 ± 2411 4601 ± 1125 5111 ± 1517
tmax, h 3.00 (1.00–6.00) 3.00 (0.93–5.83) 3.00 (2.00–11.88)
AUC12h, ng.h/mL 55,300 ± 27,020 38,950 ± 10,010 43,700 ± 16,400
Statistical analysis comparing the PK of total DRV
ParameterLS mean ratio (90% CI) LS mean ratio (90% CI)
Second trimester vs postpartum Third trimester vs postpartum
Cmin, ng/mL 1.43 (0.39–5.22) 1.86 (0.49–7.04)
Cmax, ng/mL 0.72 (0.61–0.86) 0.81 (0.69–0.96)
AUC12h, ng.h/mL 0.76 (0.63–0.90) 0.83 (0.72–0.97)
a Median (range) for tmax; b n=12 for C0h, Cmin, Cmax and tmax; c n=10 for Cmin. See footnote to Table 3 for expanded abbreviations
PK of total rtvPostpartum[reference]
Second trimester Third trimester
n 11 11b 11c
C0h, ng/mL 418.8 ± 419.4 241.0 ± 120.4 210.2 ± 63.64
Cmin, ng/mL 232.5 ± 246.1 149.7 ± 69.92 137.1 ± 39.47
Cmax, ng/mL 1016 ± 881.8 569.8 ± 245.6 515.3 ± 206.4
tmax, h 6.00 (2.02–12.08) 4.14 (0.93–6.08) 4.05 (1.00–9.10)
AUC12h, ng.h/mL 6746 ± 6032 3929 ± 1203 3532 ± 1130
Statistical analysis comparing the PK of total rtv
ParameterLS mean ratio (90% CI) LS mean ratio (90% CI)
Second trimester vs postpartum Third trimester vs postpartum
Cmin, ng/mL 1.08 (0.31–3.81) 1.22 (0.41–3.59)
Cmax, ng/mL 0.66 (0.41–1.08) 0.63 (0.40–0.98)
AUC12h, ng.h/mL 0.72 (0.44–1.17) 0.67 (0.43–1.04)
a Median (range) for tmax; bn=10 for C0h and Cmin; c n=10 for C0h, n=9 for Cmin, n=7 for Cmax and tmax; d n=11 for C0h, n=8 for Cmin, Cmax and tmax. See footnote to Table 3 for expanded abbreviations
PK of unbound DRVPostpartum[reference]
Second trimester Third trimester
n 11b 6c 7d
C0h , ng/mL 592.4 ± 446.9 526.3 ± 281.8 504.2 ± 270.1
Cmin , ng/mL 420.6 ± 293.1 413.1 ± 243.9 414.8 ± 243.8
Cmax , ng/mL 1173 ± 481.0 933.7 ± 371.8 923.4 ± 286.3
tmax , h 2.03 (1.00–4.00) 2.92 (0.93–8.83) 3.00 (1.00–11.88)
AUC12h , ng.h/mL 9178 ± 3956 7425 ± 2999 7294 ± 2408
Statistical analysis comparing the PK of unbound DRV
ParameterLS mean ratio (90% CI) LS mean ratio (90% CI)
Second trimester vs postpartum Third trimester vs postpartum
Cmin , ng/mL 1.10 (0.59–2.06) 1.14 (0.59–2.20)
Cmax , ng/mL 0.78 (0.52–1.18) 0.82 (0.57–1.16)
AUC12h , ng.h/mL 0.92 (0.66–1.30) 0.93 (0.69–1.24)
39
38
37
36
3534
33
32
31
30
29
28
27
Plas
ma
conc
entr
atio
n of
alb
umin
(g/L
)
Baseline 2ndtrimester
3rdtrimester
Deliveryday
Postpartum(2-5 weeks)
Postpartum(6-12 weeks)
900
800
700
600
500
Plas
ma
conc
entr
atio
n of
AAG
(mg/
L)
Baseline 2ndtrimester
3rdtrimester
Postpartum(6-12 weeks)
A B
SE, standard error; AAG, a1-acid glycoprotein
9000
8000
7000
6000
5000
4000
3000
2000
1000
00 2 4 6 8 10 12
Plas
ma
conc
entr
atio
n of
tot
al d
arun
avir
(ng/
mL)
Time (hours)
2nd trimester (n=11)3rd trimester (n=11)
Postpartum (6-12 weeks) (n=11)
SD, standard deviation; DRV, darunavir; rtv, ritonavir; bid, twice daily