Clinical Guidelines for Type 2 Diabetes - Foot In Diabetes UK · Clinical Guidelines for Type 2...
54
FINAL DRAFT The prevention and management of foot problems 103 Clinical Guidelines for Type 2 Diabetes Prevention and management of foot problems Revised version
Transcript of Clinical Guidelines for Type 2 Diabetes - Foot In Diabetes UK · Clinical Guidelines for Type 2...

FINAL DRAFT
The prevention and management of foot problems 103
Clinical Guidelines for
Type 2 Diabetes
Prevention and management of foot problems
Revised version

FINAL DRAFT
104 Clinical Guidelines for Type 2 Diabetes
13. Appendices (This file contains Appendices 1–10. Appendices 11–25 and the full guideline are available as separate files)

FINAL DRAFT
The prevention and management of foot problems 105
Appendix 1: Monitoring
Author(s) Study Type of intervention Setting and
location
Numbers randomised
Inclusion criteria/
Exclusion criteria
Mean age±SD (years)
Male/female ratio
Ethnicity
Follow-up period
Main outcome measures
Pham H. et al 2000
Prospective T1: Neuropathy symptom score (based on presence/ absence of symptoms) T2: Neuropathy disability score (based on physical examination) T3: Vibration perception threshold, using biothesiometer vibrating at 100Hz, applied voltage 0-50V. Mean of 3 readings on each foot, on pulp of toe T4: Semmes-Weinstein monofilaments, 8 used applying pressure from 1-100g to evaluate cutaneous perception threshold on plantar aspect of hallux. T5: maximal plantar foot pressure, mean of 3 mid-gait footsteps
3 diabetic foot centres, Texas, USA
None randomised N=248
Inclusion: diabetes, Type 1 or Type 2, diagnosis Exclusion: none stated
58±12 (20-83) M126: F125 Type 1 49: Type 2 199 Caucasian 119: Black 36: Hispanic 93
30 months mean (range 6-40)
development of foot ulceration independent predictors of foot ulceration
Results
Foot ulcers developed in 95 (19%) feet or 73 (29%) of patients. 22 (9%) developed ulcers in both feet. No difference in age between those who developed ulcers and those who did not, but ulcer developers more likely to be men (with ulcers M49, F 24, without ulcers M75, F100, p<0.0001) and had diabetes for longer (with ulcers, 16±12 years, without ulcers 13±10, p=0.019). Multivariate logistic regression: risk of ulceration associated with high T1, T2, T3 and T4 (all p<0.0001). Sensitivity Specificity Positive predictive value T2 high score (≥5) 92 43 28 T3, high voltage (≥ 25V) 86 56 32 T4: high (≥5.07) 91 34 25 T5: high pressure (≥6kg/cm2) 59 69 31 T1: high and/or T2 94 38 26 T1: high and/or T3 99 22 23 T3: high and/or T4 58 78 38 Clinical examination (neuropathic disability score) has highest sensitivity for predicting risk of foot ulceration. The combination of high neuropathic score and high Semmes Weinstein monofilament cutaneous perception. Foot pressure measurements have high specificity and could be used as a postscreening test.

FINAL DRAFT
106 Clinical Guidelines for Type 2 Diabetes
Appendix 1 (contd): Monitoring
Author(s) Study Type of intervention Setting and
location
Numbers randomised
Inclusion criteria/ Exclusion criteria
Mean age±SD (years) Male/female ratio
Ethnicity
Follow-up period
Main outcome measures
Pacaud D et al , 1999
Observational Questionnaire, demographic, general health, diabetes associated health Bilateral foot examination and vibration perception threshold to assess neuropathy (using age based norms of manufacturer) Semmes-Weinstein monofilaments test for neuropathy
University hospital outpatient diabetes clinic, Montreal, Canada
None randomised N=160
Inclusion: Inclusion: Type 1 or Type 2 attending follow-up visit to endocrinologist in diabetes clinic Exclusion: none stated
56.7±1.2 M77, F83 T1 46: T2 113, 1 unknown Type 1: 46 Type 2: 113
None Sensitivity and specificity of monofilament technique, using vibration perception threshold as the gold standard
Results
Moderate to severe neuropathy was present in 56.4% of group, using the vibration perception thresholds (Type 1 63.4%, Type 2 38.7% p<0.05). Monofilament technique had 97% sensitivity and 89% specificity, against the vibration perception threshold as the gold standard. Presence of symptoms was a poor indicator or neuropathy. 44% of subjects without symptoms had neuropathy. 40% had never had feet examined, and 60.3% of these had neuropathy compared with 53.3% of those who had had their feet examined (p>0.05). Monofilament testing is a good screening tool for presence of neuropathy. Clinical decisions to examine feet based on duration of diabetes and presence of symptoms was inappropriate.

FINAL DRAFT
The prevention and management of foot problems 107
Appendix 1 (contd): Monitoring
Author(s) Study Type of intervention Setting and
location
Numbers randomised
Inclusion criteria/ Exclusion criteria
Mean age±SD (years) Male/female ratio
Ethnicity
Follow-up period
Main outcome measures
Paisley AN et al, 2002
Observational Nerve function using Neuropathy Disability Score Vibration perception threshold on tip of hallux, both feet, mean of 3 readings Neuropen comprises monofilament 10g for cutaneous pressure assessment and a sterile Neurotip for assessing pain sensation.
Diabetes Centre or high risk diabetic foot clinic, Manchester, UK
None randomised N=124
Inclusion: Type 1 or Type 2 Exclusion: non-diabetic neuropathy.
55.4±13.7 M84, F40 T1 34, T2 80
None Sensitivity and specificity of Neuropen to assess peripheral nerve function using neuropathy Disability Score and vibration perception thresholds as gold standards.
Results
Sensitivity and specificity of the Neuropen to identify patients with moderate to severe neuropathy compared with abnormal cut-off values. Specificity of the Neuropen was improved when a combination of both abnormal monofilament and abnormal Neurotip were used rather than the individual tests Neuropathy Disability Score (>6/10): Monofilaments sensitivity 87.8% specificity 57.3% Neurotip 91.8% 41.3% Neuropen (either monofilaments or Neurotip abnormal) 98% 30.7% Neuropen (both monofilaments and Neurotip abnormal) 81.6% 68% Vibration perception threshold (>25V): Monofilaments 90.7% 63.8% Neurotip 87% 39% Neuropen (either monofilaments or Neurotip abnormal) 96.3% 31.9% Neuropen (both monofilaments and Neurotip abnormal) 81.5% 71% The Neuropen could be used to identify patients with moderate to severe neuropathy, who are therefore at risk of foot ulceration.

FINAL DRAFT
108 Clinical Guidelines for Type 2 Diabetes
Appendix 1 (contd): Monitoring
Author(s)
Study Type of intervention Setting and
location
Numbers randomised
Inclusion criteria/ Exclusion criteria
Mean age±SD (years) Male/female ratio
Ethnicity
Follow-up period
Main outcome measures
Mayfield JA et al, 2000
Case control Case: had non-traumatic amputation of lower extremity, between Jan 85 and Dec 92. Control: no lower-limb amputation by Dec 92
Primary care, Arizona, USA
None randomised Cases: 61 Controls: 183 3 controls to each case
Inclusion: diabetes (Type 2), lived in specific reservation districts, Pima or Tohono O’odham Indian, aged 25-85, taking part in another longitudinal diabetes study
Cases: 56.2±11.0 Controls: 47.7±11.4 Cases: M53%, F 47% Controls: M37%, F63% Cases were all Type 2, not stated if controls were.
36 months, retrospective
Pivotal event leading to amputation Health care use in 36 months before amputation Foot examination, type of examination Health conditions and diabetes complications
Results
Significant differences between cases and controls for age, sex, duration of diabetes, prior foot ulcer, foot deformity. After adjusting for differences in demographics, foot risk conditions, and disease severity, preventive foot examinations in Pima Indians gave a non-significant reduced risk of lower-extremity amputation, OR=0.55, 95% CI 0.17, 1.7, p=0.31. Non-adherence with foot care recommendations or medication produced a non-significant increased risk of amputation, OR=1.9, 95% CI 0.88, 4.3, p=0.1. Foot examinations do not decrease the risk of amputation in Pima Indians with Type 2 diabetes
FINAL DRAFT
The prevention and management of foot problems 109
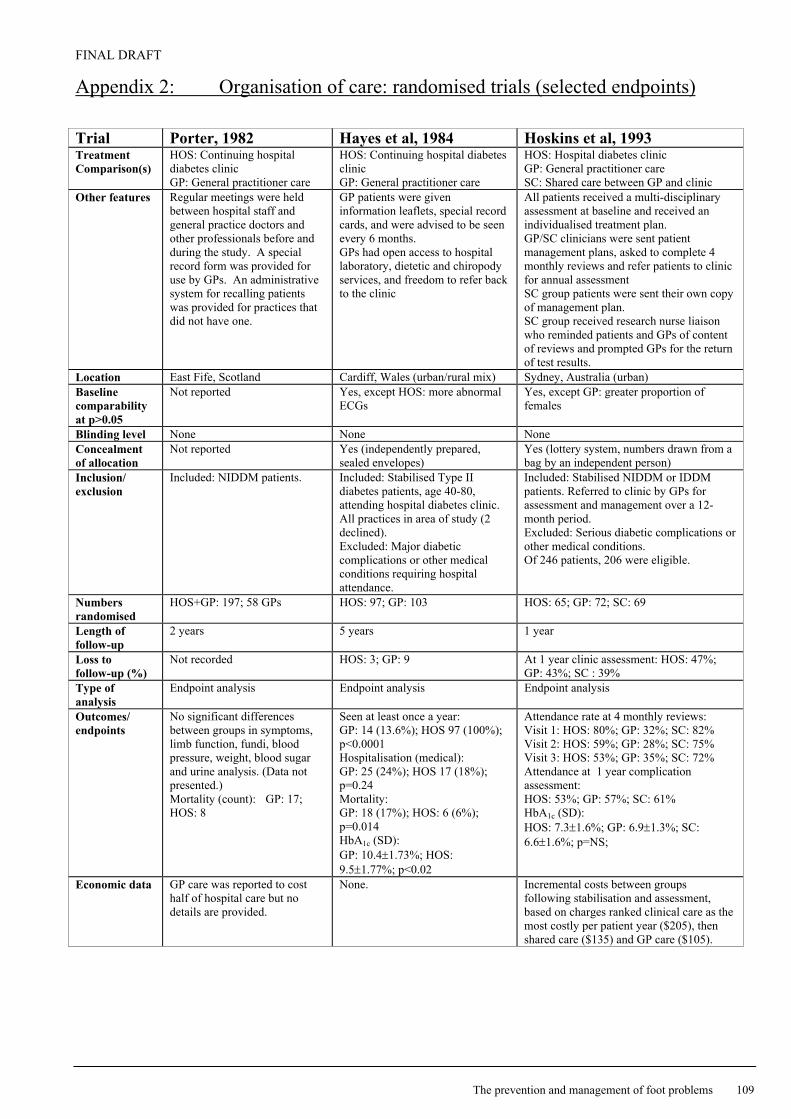
Appendix 2: Organisation of care: randomised trials (selected endpoints)
Trial Porter, 1982 Hayes et al, 1984 Hoskins et al, 1993 Treatment Comparison(s)
HOS: Continuing hospital diabetes clinic GP: General practitioner care
HOS: Continuing hospital diabetes clinic GP: General practitioner care
HOS: Hospital diabetes clinic GP: General practitioner care SC: Shared care between GP and clinic
Other features Regular meetings were held between hospital staff and general practice doctors and other professionals before and during the study. A special record form was provided for use by GPs. An administrative system for recalling patients was provided for practices that did not have one.
GP patients were given information leaflets, special record cards, and were advised to be seen every 6 months. GPs had open access to hospital laboratory, dietetic and chiropody services, and freedom to refer back to the clinic
All patients received a multi-disciplinary assessment at baseline and received an individualised treatment plan. GP/SC clinicians were sent patient management plans, asked to complete 4 monthly reviews and refer patients to clinic for annual assessment SC group patients were sent their own copy of management plan. SC group received research nurse liaison who reminded patients and GPs of content of reviews and prompted GPs for the return of test results.
Location East Fife, Scotland Cardiff, Wales (urban/rural mix) Sydney, Australia (urban) Baseline comparability at p>0.05
Not reported Yes, except HOS: more abnormal ECGs
Yes, except GP: greater proportion of females
Blinding level None None None Concealment of allocation
Not reported Yes (independently prepared, sealed envelopes)
Yes (lottery system, numbers drawn from a bag by an independent person)
Inclusion/ exclusion
Included: NIDDM patients. Included: Stabilised Type II diabetes patients, age 40-80, attending hospital diabetes clinic. All practices in area of study (2 declined). Excluded: Major diabetic complications or other medical conditions requiring hospital attendance.
Included: Stabilised NIDDM or IDDM patients. Referred to clinic by GPs for assessment and management over a 12- month period. Excluded: Serious diabetic complications or other medical conditions. Of 246 patients, 206 were eligible.
Numbers randomised
HOS+GP: 197; 58 GPs HOS: 97; GP: 103 HOS: 65; GP: 72; SC: 69
Length of follow-up
2 years 5 years 1 year
Loss to follow-up (%)
Not recorded HOS: 3; GP: 9 At 1 year clinic assessment: HOS: 47%; GP: 43%; SC : 39%
Type of analysis
Endpoint analysis Endpoint analysis Endpoint analysis
Outcomes/ endpoints
No significant differences between groups in symptoms, limb function, fundi, blood pressure, weight, blood sugar and urine analysis. (Data not presented.) Mortality (count): GP: 17; HOS: 8
Seen at least once a year: GP: 14 (13.6%); HOS 97 (100%); p<0.0001 Hospitalisation (medical): GP: 25 (24%); HOS 17 (18%); p=0.24 Mortality: GP: 18 (17%); HOS: 6 (6%); p=0.014 HbA1c (SD): GP: 10.4±1.73%; HOS: 9.5±1.77%; p<0.02
Attendance rate at 4 monthly reviews: Visit 1: HOS: 80%; GP: 32%; SC: 82% Visit 2: HOS: 59%; GP: 28%; SC: 75% Visit 3: HOS: 53%; GP: 35%; SC: 72% Attendance at 1 year complication assessment: HOS: 53%; GP: 57%; SC: 61% HbA1c (SD): HOS: 7.3±1.6%; GP: 6.9±1.3%; SC: 6.6±1.6%; p=NS;
Economic data GP care was reported to cost half of hospital care but no details are provided.
None. Incremental costs between groups following stabilisation and assessment, based on charges ranked clinical care as the most costly per patient year ($205), then shared care ($135) and GP care ($105).

FINAL DRAFT
110 Clinical Guidelines for Type 2 Diabetes
Appendix 2 (contd): Organisation of care: randomised trials Trial Hurwitz et al, 1993 DICE, 1994
Treatment comparison(s)
HOS: Continuing hospital diabetes clinic GP: Prompted general practitioner care
HOS: Continuing hospital diabetes clinic GP: Integrated general practitioner care
Other features GP patients: A computer database sent requests every six months to patients for blood and urine samples to be taken in a local health centre or in hospital. Results were sent to patients who were requested to visit their GP within 10 days for review. Annual eye review at a local optometrist was also prompted. Review could occur at hospital as well as with the GP. The database compiled results and provides patient details for referral visits.
A computer-based record system was used. GP: Patients were sent reminders to visit their GP every 3 to 4 months and annually at the clinic. Clinicians were given written guidelines for care, were prompted when a visit was due and sent a record card for return on completion. HOS: Patients were sent routine clinical appointments.
Location London, England (urban), 38 general practices, 11 optometrists, 2 hospital outpatient clinics in Islington
Grampian, Scotland (urban/coastal mix) Hospital diabetes clinic in Aberdeen and 3 general practices
Baseline comparability at p>0.05
Yes, except: HOS: Greater mean systolic blood pressure GP: More patients with leg ischaemia
Yes
Blinding level None None Concealment of allocation
Not clear (Cambridge tables of random numbers) Not reported
Inclusion/ exclusion
Included: Mobile NIDDM patients <80 years of age. Excluded: Women of child bearing age, significant levels of diabetic complication Of 570 patients: 415 were eligible; 215 agreed to participate; 209 randomised; 28 excluded after randomisation; 181 analysed.
Included: Stabilised NIDDM or IDDM patients. Excluded: <18 years of age, pregnant or planning pregnancy, serum creatinine >200 µmol/l, medical problems requiring clinic attendance. Of 311 patients: 284 were eligible; 274 agreed to participate.
Numbers randomised
HOS: 92; GP: 89 HOS: 135; GP: 139
Length of follow-up
2 years (median) 2 years
Loss to follow up (%)
Not recorded HOS: 24; GP: 15
Type of analysis
Endpoint analysis Endpoint analysis
Outcomes/ endpoints
Seen at least once: GP: 86/89 (96.6%); HOS: 78/92 (84.8%); p=0.013 Number of reviews/patient/year (mean±SD) GP: 3.0±3.8; HOS: 2.4±1.3; p=NS Hospitalisation (diabetes related): GP: 8/89 (9%); HOS: 17/92 (18%); p=NS Referral to dietitian: GP: 29/86 (34%); HOS: 32/78 (41%); p=NS Referral to chiropodist: GP: 7/86 (8%); HOS: 10/78 (13%); p=NS Mortality: GP: 7/89 (8%); HOS: 7/92 (8%); p=NS HbA1c (mean±SD) GP: 10.3±2.3 %; HOS: 10.6±2.5 %; p=NS
Reviews/patient in 2 years, (mean±SD): GP: 5.3±1.4; HOS: 4.8±1.7; p<0.05 Foot assessments/patient in 2 years (mean±SD): GP: 1.4±1.0; HOS: 0.5±0.6; p<0.05 Seen by dietician: GP: 32/124 (26%); HOS: 44/111 (40%); p<0.05 Seen by chiropodist: GP: 72/124 (58%); HOS: 29/111 (26%); p<0.05 Mortality: GP: 11/124 (7.5%); HOS: 10/111 (7.9%); p=NS HbA1c (mean±SD): GP: 5.3±1.7 %; HOS: 5.3±1.7 %; p=NS
Economic data Clinic care was estimated to cost £55 /patient year; integrated care was £78 and £101 based on data from two practices. The practice with the lower cost care used routine surgeries to see patients whereas the practice with the higher cost provided weekly diabetes mini-clinics run by one doctor.

FINAL DRAFT
The prevention and management of foot problems 111
Appendix 2 (contd): Organisation of care: randomised trials
Author(s)
Study Type of intervention Setting and location
Numbers randomised
Inclusion criteria/ Exclusion criteria
Mean age±SD (years)
Male/female ratio
Ethnicity
Follow-up period
Main outcome measures
Donohoe ME et al, 2000
Cluster randomised trial T1: integrated care model centred on primary care-based annual review at which GP or practice nurse examines patients’ feet, plus package of supportive and complementary educational initiatives to clarify contemporary management of diabetic foot, referral criteria, and responsibilities of professionals. Items included: practice visits over 6 months, training, introduction of monofilament, guidelines for referral to chiropody and specialist diabetic foot clinic, foot care leaflets for patients, training for chiropodists. T2: practice visit with unrelated educational intervention (diabetic nephropathy) and continuation of current foot care arrangements
Primary care Practices T1: 5 T2: 5 Patients T1: 981 T2: 958 Responders T1: 858 T2: 810
Inclusion at practice level: existence of diabetes practice register, structured approach to diabetes care, defined relationship with chiropodist, Type 1 or Type 2. Exclusion of patients: if GP considered them unable to complete a questionnaire
T1: 66.7 (18.7-95.8) T2: 64.8 (18.0-93.6) T1: M463, F395 T2: 427, F383
6 months Primary outcomes: Patient’s’ attitudes towards foot problems Patients’ foot care knowledge Healthcare professionals’ knowledge Secondary outcomes: Appropriateness of referrals to specialist foot clinic and to community chiropody clinics

FINAL DRAFT
112 Clinical Guidelines for Type 2 Diabetes
Results There were significant differences between responders and non-responding patients by age, HbA1c and percentage with Type 1 diabetes (all p<0.001). Patients: Attitudes No differences in baseline attitude scores between T1 (81.1%) and T2 (81.9%) (p=0.32). Improvement in overall attitude towards their foot care over time, T1: 3.9 (p<0.001) and T2: 0.7 (p<0.001). Mean change in attitude significantly greater in T1 vs T2 (p=0.01). Attitude towards patients’ personal foot care responsibilities improved in T1: by 2.5% (p<0.001) vs T2 decrease of 0.2%, difference in change between T1 and T2 (p=0.027). Attitude towards foot care provided increased in both groups, T1: 3% (p<0.001), T2: 1.8% (p<0.001), with no difference in change between T1 vs T2 (p=0.26). Knowledge No differences in baseline mean percentage knowledge scores, T1: 65.6%, T2: 66.0% (p=0.549). Improvement in knowledge scores in both groups, with mean percentage change, T1: 1.1 (p=0.015), T2: 1.3 (p=0.002), with no difference in change between T1 vs T2 (p=0.54). Foot examination More patients had their foot examined in T1 vs T2 (p<0.001), received foot care education (p<0.001) and found the education useful (p=0.03). No difference between T1 vs T2 in numbers receiving an annual review (p=0.35) Healthcare professionals No difference in baseline knowledge scores between T1: 33.3% and T2: 33.0% (p=0.88). Knowledge scores improved in T1 and difference between T1 and T2 became significant (p=0.008). Service utilization Increase in number of appropriate referrals to specialist foot clinic, particularly those with high risk feet having inappropriate footwear in six months following intervention vs six months before intervention in T1: before 9/13, after 26/28, (p=0.046), but no changes in T2: before 8/10, after 10/10 (p=0.14). At baseline, in T1: 31/40 (78%) and T2: 33/42 (79%) of consecutive diabetes patients attending subservient community chiropody clinics were deemed at high risk of ulceration and hence ‘appropriate’. No improvements seem at follow up, T1: 28/40 (70%), T2: 31/45 (69%) consecutive patients. Costs Total costs of providing educational programme to five intervention practices, including primary and secondary care time attending educational sessions and cost of materials was £4216 Provision of integrated care arrangements for the diabetic foot can have a positive impact on the knowledge of primary care staff and attitudes of patients, resulting in increased number of appropriate referrals to acute specialist services.

FINAL DRAFT
The prevention and management of foot problems 113
Appendix 3: Patient education: systematic review
Author(s)
Study Type of intervention Setting and
location
Numbers randomised
Inclusion criteria/ Exclusion criteria
Mean age±SD (years) Male/female ratio
Ethnicity
Follow-up period
Main outcome measures
Valk DMW et al, 2002 also Valk et al 2002 End search date March 2001
Systematic review of 8 randomised controlled trials (6 of which were in the original guideline evidence). 9 rejected (4 were in the original guideline. (note: paper says 19 considered but gives no details on those rejected, Cochrane review gives 8 included, 9 rejected, with details). 4 compared intensive foot care education with brief education. 1 compared single group education session on foot care and skin hygiene with no intervention. 2 compared patient education on diabetes in general including foot, tailored to individual patient needs, with usual care. 1 offered modules of instruction depending on educational needs, 1 of which covered foot care. 1 targeted specific areas of diabetes self management with greatest need. 1 compared diabetic foot prevention with usual care.
Home environment (1) primary care (3) podiatry outpatient care (1) outpatient (3)
70-749
Inclusion: prospective RCTs evaluating educational programmes for prevention of foot ulcer in people with diabetes mellitus, Type 1 or Type 2, subjects aged ≥18 years. Exclusion: studies solely aimed at optimising blood glucose levels, those lacking explicit focus on foot care. Methodological quality of all included RCTs was poor.
Primary: Incidence of foot ulceration, infection, amputation, ulcer recurrence. Secondary: callus development, resolution of callus, number and duration of hospital admissions for diabetic foot problems, foot care knowledge, and patients’ behaviour assessment.
Results The reviewers concluded that patient education may have positive, but short-lived, effects on foot care knowledge and behaviour in patients with diabetes and may reduce foot ulceration and amputations, especially in high risk patients. But the quality of the evidence was poor.

FINAL DRAFT
114 Clinical Guidelines for Type 2 Diabetes
Appendix 3 (contd): Patient education: randomised trials (selected endpoints)
Trial Rettig et al, 1986 Bloomgarden et al, 1987 Malone et al, 1989
Treatment comparison(s)
INT: Home education (general diabetes care and foot care) provided by nurse CON: Not receiving home education
INT: Nine education sessions (general diabetes care and foot care) in addition to usual care CON: Usual care
INT: One education session (foot care) in addition to usual care CON: Usual care
Other features INT: Patients received a nurse home visit and completed a needs assessment survey at baseline. Information obtained led to a tailored program of instruction. The number of educational home visits varied, with a maximum of 12. Education areas were diet, urine testing, medication and foot care. No charge was made for participation
INT: Patients attending at least 7 sessions were considered ‘graduates’. Patients were attending a diabetes clinic. Approximately 90% of enrolees were black or Hispanic. The program lasted 1.6±0.3 years in the education group, with 1.5±0.3 years of care in the control group.
Usual care: hospital patients with diabetes received routine diabetes teaching on diet, weight, medication, exercise and medication. INT: Patients received a 1-hour educational class which included a slide-show of infected feet and amputated limbs, and a patient instruction checklist.
Location Nebraska, USA New York, USA Arizona, USA Baseline comparability at p>0.05
Yes Yes, except: CON: Foot lesions more common INT: Higher fasting blood glucose, higher number of hospitalisations in previous year
Yes, except INT: foot callus more common
Blinding level No effective blinding None apparent None apparent Concealment of allocation
Not clear Not clear Yes (based on odd/even last digit of Social Security number)
Inclusion/ exclusion
Inclusion: NIDDM and IDDM, <65 years old, not terminally ill, inclusion approved by own physician. Less than 30% of inpatients with diabetes were eligible. About 70% of eligible patients enrolled
Inclusion: Type I and Type II Diabetes. Of 749 eligible patients receiving primary care at the diabetes clinic, 302 were enrolled.
Inclusion: NIDDM and IDDM patients referred for podiatry or surgery, following treatment, and with uninfected foot ulcers or prior amputation. Exclusion: Patients requiring wound debridement, formal incision and drainage of infection, amputation or vascular reconstruction.
Numbers randomised
INT:228; CON: 243 INT: 145; CON: 157 INT: 103 (203 limbs); CON: 100 (193 limbs)
Length of follow-up
6 months for primary endpoints, telephone survey at 12 months for clinical consultations and hospitalisations
Mean 1.5 years INT: mean 13.2 months; CON: mean 9.2 months
Loss to follow-up (%)
INT: 21%; CON: 21% INT: 12%; CON: 11% INT: 13; CON: 8
Type of analysis
Endpoint analysis Endpoint analysis Endpoint analysis
Outcomes/ endpoints
Assessed by nurse at 6 months: Foot care knowledge score (mean ±SE): INT: 60.2±1.3; CON: 51.6±1.4; p=0.001 Foot care skill score (mean ±SE): INT: 71.8±2.0; CON: 68.9±1.8; p=NS Foot appearance score (mean ±SE): INT: 70.2±0.7; CON: 68.8±0.7; p=NS Assessed by telephone survey at 12 months: Preventable diabetes related hospitalisation rates (per 1000 subjects/year ±SE): INT: 94.4±35.8; CON: 41.5±16.1; p=NS Preventable diabetes related inpatient length of stay (mean ±SE): INT: 6.88±1.54; CON: 6.13±1.17; p=NS
Assessed by interviewer at 18 months: Knowledge score (mean ±SD): INT: 5.8±1.6; CON: 5.3±1.7; p=0.0073 Behaviour score (mean ±SD): INT: 4.3±1.6; CON: 4.1±1.6; p=0.01044 HbA1c (mean ±SD): INT: 6.1±2.0; CON: 6.3±2.0; p=0.1995 Foot lesions (minor and severe), at final evaluation: INT: 51%; CON: 65%; p=NS (56% of the intervention group were considered graduates: this sub-group scored consistently better than non-graduates in knowledge and behaviour scores)
Clinically assessed at 2 years: Limbs without infection, ulcer or amputation: INT: 160/177 (90)%; CON: 128/177 (72%); p≤0.0005 Infected limbs: INT: 2/177 (1%); CON: 2/177 (1%); p=NS Ulcerated limbs: INT: 8/177 (5%); CON: 26/177 (15%); p≤0.005 Amputated limbs: INT: 7/177 (4%); CON: 21/177 (12%); p≤0.025 Mortality: INT: 3%; CON: 4%; p=NS Statistical calculations assume ‘independence’ of limbs and no influence of different duration of follow-up.
Economic data Home education was costed at $175 per patient although no details are provided.
Not reported. Simple calculations based on charges are used to explore the probable cost-saving nature of intervention.

FINAL DRAFT
The prevention and management of foot problems 115
Appendix 3 (contd): Patient education: randomised trials (selected endpoints) Trial Barth et al, 1990 Kruger et al, 1992
Treatment comparison(s)
INT: Four special foot care sessions in addition to normal education programme CON: Normal education programme
INT: Participatory education (foot care) in addition to usual care CON: Usual care
Other features Recruitment by radio and newspaper campaign, general practice referral and diabetes clinic referral. Patients received either conventional or intensive education in groups of 8–10. CON: 14 hours over 3 consecutive days (including foot care: 1 hour session). INT: Additional 4 weekly sessions of 1.5–2.5 hours (total 9 hours) on foot care using motivational techniques. A podiatrist took 3 sessions and a psychologist one.
The study enrolled patients entering a hospital diabetes programme. Usual care: Videotape and supplementary explanation from an instructor on foot care. Patients were encouraged to examine their feet daily and given a daily checklist. INT: Participatory hands-on teaching/learning sessions (actual foot washing, inspection, care of corns and calluses, cutting toe-nails, evaluating problems and suitable footwear). Patients received an education kit with materials (buff pads and an inspection mirror).
Location Sydney, Australia Wichita, USA Baseline comparability at p>0.05
Yes, except: INT: Greater peripheral vascular disease
Not reported
Blinding level Assessment by an independent, blinded podiatrist None apparent Concealment of allocation
Not clear Not clear; randomisation by odd/even week of enrolment
Inclusion/ exclusion
Inclusion: Type II diabetes, >30 years old, duration of diabetes >3 months, duration of current treatment >1 month, sub-optimal glucose control HbA1 ≥ 9.5%; overweight (BMI ≥25 kg m-2); energy intake as fat ≥ 35%; no diabetes education in last 6 months; no major physical or mental disabilities. Out of 350 volunteers, 86 passed the entrance criteria, and 70 were randomised.
Inclusion: NIDDM and IDDM patients of ≥5 years duration and no major complications.
Numbers randomised
INT: 32; CON: 38 INT: 23; CON: 27
Length of follow-up
6 months 6 months
Loss to follow-up (%)
INT: 5; CON: 3 INT: 8 (35%); CON: 12 (44%)
Type of analysis
Endpoint analysis Endpoint analysis
Outcomes/ endpoints
Assessed by a podiatrist at baseline, 1, 3, and 6 months: (Analyses using repeated measures with baseline covariates) The intensive care group showed significantly greater improvement in foot care knowledge (p<0.001) and compliance with foot care routine (p=0.012). However, both groups showed significant improvement over time and differences in absolute scores were small at 6 months, approximately 2/12 for knowledge and 1/12 for compliance. The intensive care group showed significantly greater compliance with advice to consult a podiatrist (p=0.008) and a greater reduction in foot problems (p<0.006) at 1 month but neither of these effects were significant at 6 months.
Assessed by trialists: Knowledge score: INT: 19/23 (83%); CON: 22/27 (82%); p=NS Self reported measures: Daily foot inspection: INT: 10/15 (66.7%); CON: 10/15 (66.7%); p=NS Daily foot washing: INT: 13/15 (86.7%); CON:11/15 (73.3%); p=NS Use of pumice stones for corns: INT: 4/15 (26.7%); CON: 4/15 (26.7%); p=NS Trimming toenails regularly: INT: 12/15 (80.0%); CON: 10/15 (66.7%); p=NS Improvement in keeping toenails shorter: INT: 12/15 (80.0%); CON: 13/15 (86.7%); p=NS No significant differences were found in assessment skills, neurometer readings, or assessment of photographs of feet by podiatrists.
Economic data Not reported.
FINAL DRAFT
116 Clinical Guidelines for Type 2 Diabetes
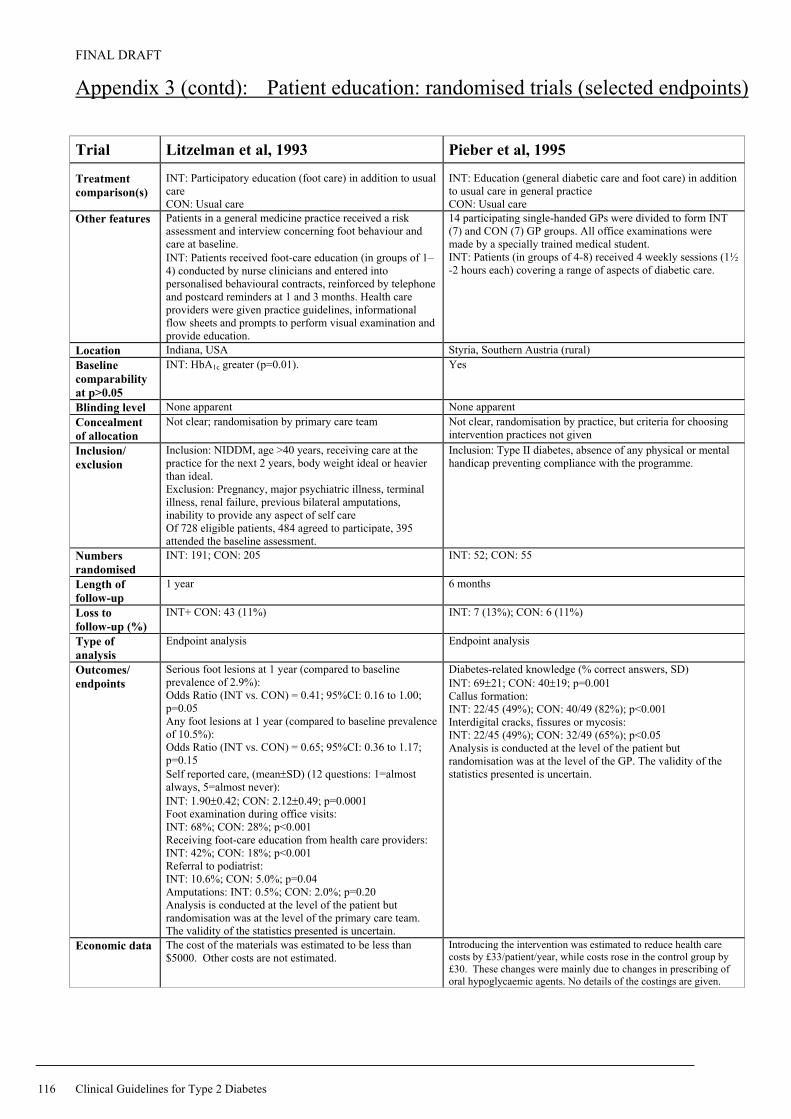
Appendix 3 (contd): Patient education: randomised trials (selected endpoints) Trial Litzelman et al, 1993 Pieber et al, 1995
Treatment comparison(s)
INT: Participatory education (foot care) in addition to usual care CON: Usual care
INT: Education (general diabetic care and foot care) in addition to usual care in general practice CON: Usual care
Other features Patients in a general medicine practice received a risk assessment and interview concerning foot behaviour and care at baseline. INT: Patients received foot-care education (in groups of 1–4) conducted by nurse clinicians and entered into personalised behavioural contracts, reinforced by telephone and postcard reminders at 1 and 3 months. Health care providers were given practice guidelines, informational flow sheets and prompts to perform visual examination and provide education.
14 participating single-handed GPs were divided to form INT (7) and CON (7) GP groups. All office examinations were made by a specially trained medical student. INT: Patients (in groups of 4-8) received 4 weekly sessions (1½ -2 hours each) covering a range of aspects of diabetic care.
Location Indiana, USA Styria, Southern Austria (rural) Baseline comparability at p>0.05
INT: HbA1c greater (p=0.01). Yes
Blinding level None apparent None apparent Concealment of allocation
Not clear; randomisation by primary care team Not clear, randomisation by practice, but criteria for choosing intervention practices not given
Inclusion/ exclusion
Inclusion: NIDDM, age >40 years, receiving care at the practice for the next 2 years, body weight ideal or heavier than ideal. Exclusion: Pregnancy, major psychiatric illness, terminal illness, renal failure, previous bilateral amputations, inability to provide any aspect of self care Of 728 eligible patients, 484 agreed to participate, 395 attended the baseline assessment.
Inclusion: Type II diabetes, absence of any physical or mental handicap preventing compliance with the programme.
Numbers randomised
INT: 191; CON: 205 INT: 52; CON: 55
Length of follow-up
1 year 6 months
Loss to follow-up (%)
INT+ CON: 43 (11%) INT: 7 (13%); CON: 6 (11%)
Type of analysis
Endpoint analysis Endpoint analysis
Outcomes/ endpoints
Serious foot lesions at 1 year (compared to baseline prevalence of 2.9%): Odds Ratio (INT vs. CON) = 0.41; 95%CI: 0.16 to 1.00; p=0.05 Any foot lesions at 1 year (compared to baseline prevalence of 10.5%): Odds Ratio (INT vs. CON) = 0.65; 95%CI: 0.36 to 1.17; p=0.15 Self reported care, (mean±SD) (12 questions: 1=almost always, 5=almost never): INT: 1.90±0.42; CON: 2.12±0.49; p=0.0001 Foot examination during office visits: INT: 68%; CON: 28%; p<0.001 Receiving foot-care education from health care providers: INT: 42%; CON: 18%; p<0.001 Referral to podiatrist: INT: 10.6%; CON: 5.0%; p=0.04 Amputations: INT: 0.5%; CON: 2.0%; p=0.20 Analysis is conducted at the level of the patient but randomisation was at the level of the primary care team. The validity of the statistics presented is uncertain.
Diabetes-related knowledge (% correct answers, SD) INT: 69±21; CON: 40±19; p=0.001 Callus formation: INT: 22/45 (49%); CON: 40/49 (82%); p<0.001 Interdigital cracks, fissures or mycosis: INT: 22/45 (49%); CON: 32/49 (65%); p<0.05 Analysis is conducted at the level of the patient but randomisation was at the level of the GP. The validity of the statistics presented is uncertain.
Economic data The cost of the materials was estimated to be less than $5000. Other costs are not estimated.
Introducing the intervention was estimated to reduce health care costs by £33/patient/year, while costs rose in the control group by £30. These changes were mainly due to changes in prescribing of oral hypoglycaemic agents. No details of the costings are given.

FINAL DRAFT
The prevention and management of foot problems 117
Appendix 3 (contd): Patient education: randomised trials (selected endpoints)
Author(s)
Study Type of intervention Setting and
location
Numbers randomised
Inclusion criteria/ Exclusion criteria
Mean age±SD (years) Male/female ratio
Ethnicity
Follow-up period
Main outcome measures
Campbell EM et al 1996
Randomised trial T1: minimal instruction programme (2 x 1hr sessions delivered within 2 weeks of referral)
T2: education programme of individual visits (2 x 1hr sessions delivered within 2 weeks of referral by nurse and dietician, plus monthly sessions, 30 minutes long with nurse until 12 months from initial session T3: educational programme incorporating a group education course (at least 2 individual sessions followed by a 3 day course, and further 2hr group follow-up sessions at 3 and 9 months after course. Course sessions provided by nurse educator, dietician, occupational therapist, podiatrist. 1 x 2hr diet lecture optional). T4: a behavioural programme (individual visits from nurse educator, 3 in first month, then a minimum of one at 3, 6 and 12 months interspersed with telephone calls from educator. All sessions except first in patient’s home).
Diabetes Education Service, and general practice, Newcastle, Australia
T1: 59 T2: 57 T3: 66 T4: 56
Inclusion: Type 2 diagnosed < 5 years, <80 years of age, able to speak, read and understand English, received no previous formal instruction in diabetes care, not taking >75% of maximum dosage of oral hypoglycaemic agents, not terminally ill. Exclusion: Not stated
T1: 58.2±1.3 (SE) T2: 58.4±1.4 T3: 56.8±1.5 T4: 60.9±1.4 T1: M22, F37 T2: M35, F31 T3: M33, F24 T4: M24, F32
3,6 12 months Process: Checklist completed by educators for each consultation and audio-taped consultation. Outcome: blood glucose, diabetes treatment, BMI, blood lipids, blood pressure, smoking, diabetes knowledge, patient satisfaction with diabetes education, consultation with podiatrist, ophthalmologist, utilisation of medical services
Results No difference between the 4 groups for age and sex at baseline. Percentage change from baseline to 3 months in numbers consulting a podiatrist, T1 12%, T2: 21%, T3: 10%, T4: 43%, (p=0.003, T1 vs T4, T2 vs T4 and T3 vs T4 all sig differences) Percentage change from baseline to 6 months in numbers consulting podiatrist, T1: 27%, T2: 53%, T3: 33%, T4: 65% (p=0.005, T1 vs T4, T3 vs T4 all sig differences) Percentage change from baseline to 12 months in numbers consulting a podiatrist, T1 no info, T2 73%, T3: 55%, T4: 74% (p>0.05) Behavioural programme most effective in promoting podiatrist consultations.

FINAL DRAFT
118 Clinical Guidelines for Type 2 Diabetes
Appendix 3 (contd): Patient education: randomised trials (selected endpoints)
Author(s)
Study Type of intervention Setting and
location
Numbers randomised
Inclusion criteria/ Exclusion criteria
Mean age±SD (years) Male/female ratio
Ethnicity
Follow-up period
Main outcome measures
Hamalainen H et al 1998
Randomised trial, randomisation within separate sex and age groups, split <2 years>. T1: podiatrist care (individual counselling and primary prevention measures, treatment by podiatrist as required, all provided free for 1 year) T2: control group, written instructions only
Helsinki, Finland
T1: 267 T2: 263 At 1 year FU T1: 233 T2: 226 At 7 year FU T1: 169 T2: 163
Inclusion: on National Drug Reimbursement Register, aged 10-80 years, living in Turku or surroundings, Type 1 or Type 2. Exclusion: visited podiatrist in preceding 6 months and continuing to receive care, needing foot care for infection, ulcer, amputation.
Mean age of total group, which has approx 100 patients in each age stratum. (n=733) 46.9±19.1
1 and 7 years Information about diabetes Podiatric examination
Results Knowledge scores similar in T1 and T2 at baseline, and improved in both groups (p<0.001) and both sexes (p<0.001) over 7 years. Level of knowledge higher in T1 compared with T2 at 1 year FU (p=0.025). Self care scores similar in T1 and T2 at baseline but women had higher scores than men at baseline (p<0.001) and in FU. Men’s scores increased significantly over time but no difference between T1 and T2 (p=0.186). For women, scores also increased over time (p<0.001) but greater increases seen in T1 compared with T2 (p=0.011) over FU with greatest changes in year 1. Visits to podiatrist: Baseline T1 T2 Seven year FU T1 T2 never visited 73.4% 76.1% 17.7% 50.3% not visited within last 6 years 12.4% 10.4% 30.8% 25.2% visited between 1 and 6 years ago 14.2% 13.5 (p=0.819) 51.5% 24.5% (p<0.001) No differences between T1 and T2 for number of patients whose feet had been inspected by a physician during a routine examination or because of foot problems requiring a visit to a doctor (p>0.05). No difference between T1 and T2 for other foot abnormalities (all P>0.05). Counselling improved podiatrist visits but did not make any difference to prevalence of foot lesions.

FINAL DRAFT
The prevention and management of foot problems 119
Appendix 4: Risk factors: foot ulceration
Author(s)
Study Type of intervention Setting and
location
Numbers randomised
Inclusion criteria/ Exclusion criteria
Mean age±SD (years) Male/female ratio
Ethnicity
Follow-up period
Main outcome measures
Frykberg RG et al, 1998
Cross-sectional (baseline data for prospective study)
3 diabetic foot centres, USA
None randomised N=251
Inclusion: all attending diabetic foot centre, Type 1 or Type 2. Exclusion: none stated
58.5±12.5 (20-83) M126, F125 Caucasian 121, Black 36, Hispanic 94 Type 1: 49 Type 2: 202
None Foot ulceration associated with: demographic factors, diabetes-associated factors
Results
Multivariate logistic regression, controlling for age, diabetes duration, sex, and race, (all p<0.05), other predictors of ulceration were maximum peak plantar pressures ≥6kg/cm2, (OR 2.1, 95% CI 1.3, 3.4, p=0.002), vibration perception threshold ≥25V (4.4, 2.6, 7.5, p<0.0001), Semmes-Weinstein monofilament tests ≥5.07 (4.1, 1.89< 8.87, p<0.001). Presence of pulses and body mass index were protective in univariate analysis but not significant after adjustment for other covariates. Multivariate logistic regression for ulceration by race, after adjustment for age, duration of diabetes and sex, showed some variation between the three races studied. For Caucasians, the risk factors were as above, maximum peak plantar pressure (OR 7.7, 95% CI 2.07, 28.4, p=0.002), vibration perception (7.4, 2.4, 22.9, p=0.001), monofilament tests (3.7, 1.3, 10.3, p=0.013). For Black, peak plantar pressures were not significant (OR 0.53, 95% CI 0.05, 5.8, p=608) but vibration perception (7.2, 1.2, 43.7, p=0.032), and monofilament tests (19.8, 1.1, 344.2, p=0.041) were. For Hispanic, only vibration perception was significant (OR 6.6, 95% CI 2.3, 18.5, p<0.001). Note CI very wide.

FINAL DRAFT
120 Clinical Guidelines for Type 2 Diabetes
Appendix 4 (contd): Risk factors: foot ulceration
Author(s)
Study Type of intervention Setting and
location
Numbers randomised
Inclusion criteria/ Exclusion criteria
Mean age±SD (years) Male/female ratio
Ethnicity
Follow-up period
Main outcome measures
Sriussadaporn et al 1997
Case control Cases: Type 2 with foot ulcers Controls: Type 2 without foot ulcers
Diabetic clinic, Bangkok, Thailand
None randomised T1: 55 T2: 110
Inclusion for cases: Type 2, foot ulcers duration >14 days, severe infection, necrosis or gangrene Exclusion: both groups – past history of foot ulcer, lower limb amputation, chronic venous ulcer, cerebrovascular disease, spinal cord disease.
Ages not stated Cases: M13, F42 Controls: M27, F83
Foot ulceration associated with: Demographic factors Clinical characteristics Peripheral vascular status Diabetic-related factors Diabetic knowledge and foot care behaviour
Results
No differences in age and sex between cases and controls. Multiple logistic regression analyses showed that the risk of developing foot ulcers in patients with diabetes was independently associated with three factors: short-latency somatosensory evoked potentials following stimulation of the tibial nerve (OR 1.67, 95% CI 0.31, 8.97, p<0.001), visual acuity (OR 0.223 per unit decrease in decimal visual acuity, 95% CI 0.005, 0.39, p<0.005), and fasting blood glucose level (OR 1.01 per mmol/l increase, 95% CI 1.00, 1.02, p<0.005). Other variables significant at the univariate level but not following multiple logistic regression were: HbA1c, urea, creatinine, diabetic knowledge score, foot care score. Peripheral neuropathy, visual impairment and poor glycaemic control are major risk factors associated with foot ulceration in Thai Type 2 patients.
FINAL DRAFT
The prevention and management of foot problems 121
Appendix 4 (contd): Risk factors: foot ulceration
Author(s)
Study Type of intervention Setting and
location
Numbers randomised
Inclusion criteria/ Exclusion criteria
Mean age±SD (years) Male/female ratio
Ethnicity
Follow-up period
Main outcome measures
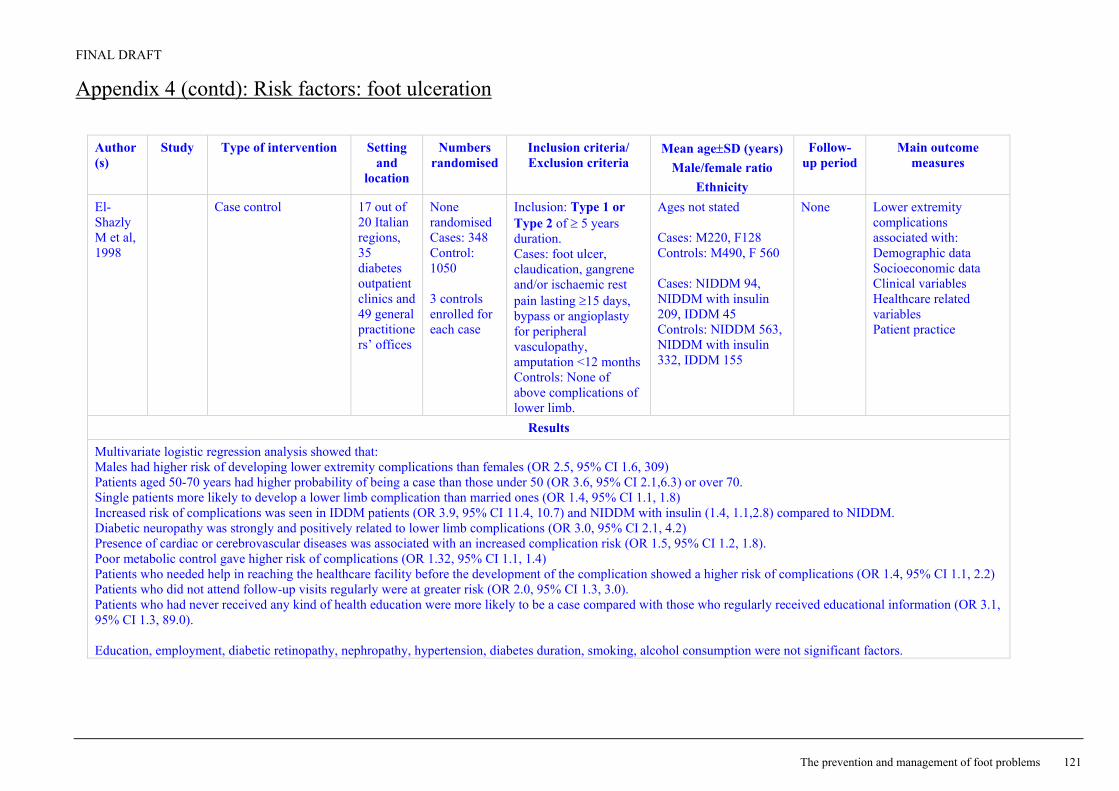
El-Shazly M et al, 1998
Case control
17 out of 20 Italian regions, 35 diabetes outpatient clinics and 49 general practitioners’ offices
None randomised Cases: 348 Control: 1050 3 controls enrolled for each case
Inclusion: Type 1 or Type 2 of ≥ 5 years duration. Cases: foot ulcer, claudication, gangrene and/or ischaemic rest pain lasting ≥15 days, bypass or angioplasty for peripheral vasculopathy, amputation <12 months Controls: None of above complications of lower limb.
Ages not stated Cases: M220, F128 Controls: M490, F 560 Cases: NIDDM 94, NIDDM with insulin 209, IDDM 45 Controls: NIDDM 563, NIDDM with insulin 332, IDDM 155
None Lower extremity complications associated with: Demographic data Socioeconomic data Clinical variables Healthcare related variables Patient practice
Results
Multivariate logistic regression analysis showed that: Males had higher risk of developing lower extremity complications than females (OR 2.5, 95% CI 1.6, 309) Patients aged 50-70 years had higher probability of being a case than those under 50 (OR 3.6, 95% CI 2.1,6.3) or over 70. Single patients more likely to develop a lower limb complication than married ones (OR 1.4, 95% CI 1.1, 1.8) Increased risk of complications was seen in IDDM patients (OR 3.9, 95% CI 11.4, 10.7) and NIDDM with insulin (1.4, 1.1,2.8) compared to NIDDM. Diabetic neuropathy was strongly and positively related to lower limb complications (OR 3.0, 95% CI 2.1, 4.2) Presence of cardiac or cerebrovascular diseases was associated with an increased complication risk (OR 1.5, 95% CI 1.2, 1.8). Poor metabolic control gave higher risk of complications (OR 1.32, 95% CI 1.1, 1.4) Patients who needed help in reaching the healthcare facility before the development of the complication showed a higher risk of complications (OR 1.4, 95% CI 1.1, 2.2) Patients who did not attend follow-up visits regularly were at greater risk (OR 2.0, 95% CI 1.3, 3.0). Patients who had never received any kind of health education were more likely to be a case compared with those who regularly received educational information (OR 3.1, 95% CI 1.3, 89.0). Education, employment, diabetic retinopathy, nephropathy, hypertension, diabetes duration, smoking, alcohol consumption were not significant factors.

FINAL DRAFT
122 Clinical Guidelines for Type 2 Diabetes
Appendix 4 (contd): Risk factors: foot ulceration
Author(s)
Study Type of intervention Setting and
location
Numbers randomised
Inclusion criteria/ Exclusion criteria
Mean age±SD (years) Male/female ratio
Ethnicity
Follow-up period
Main outcome measures
Kastenbauer T et al, 2001
Prospective
Diabetes centre, Vienna, Austria
None randomised N=187 Dropouts N=25 (13%)
Inclusion: Type 2, no history of foot ulcer or lower limb amputation, <75 years of age Exclusion: past or current foot ulcers, lower extremity amputation, severe peripheral arterial disease (intermittent claudication), severe neurological deficits due to other diseases than diabetes, presence of any other cause of peripheral neuropathy, Charcot’s foot
Vibration threshold <25V 57.1±7.7 Vibration threshold≥25V 62.6±7.3 Vibration threshold <25V M 45.9, F54.1 Vibration threshold≥25V M76.9, F23.1
Every year for mean of 3.6 years (461.9 person years)
Incidence of foot ulceration Ulcer free survival Risk factors for foot ulceration
Results
52 patients had elevated vibration perception thresholds at baseline (≥25V). Ten patients developed 18 neuropathic foot ulcers during follow-up, nine of which had an elevated perception threshold at baseline. Annual incidence of foot ulceration was 1.6% (95% CI 0.7, 2.6). Incidence density of first foot ulceration (n=10) was 21.7 per 1,000 person-years (95% CI 8.2, 35.1). Six of the patients who developed an ulceration incurred eight recurrent foot ulcers, five of those with repeat ulceration had an elevated vibration perception threshold. Patients with foot ulcers were: significantly heavier, 90.9±12.8kg vs 82.1±13.3kg (p=0.04) had significantly lower peroneal nerve conduction velocity, 37.1±4.5m/sec vs 43.1±4.5m/sec (p=0.02) had significantly higher vibration perception thresholds, 36.8±8.6V vs 17.6±9.2V (p<0.0001) Age, duration of diabetes, HbA1c were not significantly different in the two groups. Those with ulcers, 70% had symptoms of sensory neuropathy at baseline but none lacked perception of the 10g monofilament. Factors most predictive for foot ulceration (multiple Cox proportional hazards regression analysis) were: Elevated vibration perception threshold (RR 25.4 95% CI 3.1, 205, p=0.0024) Mean plantar pressure >2SD in at least one forefoot region (RR 5.1, 95% CI 1.2, 32.7, (p=0.0291) Daily alcohol intake (no quantities) (RR 5.1, 95% CI 1.1, 24.0, p=0.0404) Mediasclerosis (RR 0.07, 95% CI 0.01, 0.6 p=0.0174)

FINAL DRAFT
The prevention and management of foot problems 123
Appendix 4 (contd): Risk factors: lower limb complications Author(s)
Study Type of intervention Setting and
location
Numbers randomised
Inclusion criteria/ Exclusion criteria
Mean age±SD (years) Male/female ratio
Ethnicity
Follow-up period
Main outcome measures
Adler AI et al, 1999
Seattle Diabetic Foot Study
Prospective
General medicine clinic, Seattle, USA
None randomised N=776
Inclusion: outpatients in general medicine clinic of Veterans Affairs, with diabetes, Type 1 or Type 2 Exclusion: too ill to participate, unable to walk, unable or declined to consent
Median 65 years (28-91) M 98.2% White 78% Type 1: 51, Type 2 725
Median 3.3 years (0-5.8), 2305 patient-years
Peripheral sensory neuropathy (10 g Semmes-Weinstein monofilament) Peripheral vascular disease Foot ulcer Lower limb amputation, and time to amputation
Results
Three multivariate models used incorporating different measurements or peripheral vascular disease: ankle arm index, transcutaneous oximetry, and palpation of posterior tibialis and dorsalis pedis pulses. Irrespective of model, former amputation, lower extremity ulcers, peripheral sensory neuropathy, and treatment with insulin were associated with an increased risk of lower limb amputation when controlling for duration of diabetes. Peripheral sensory neuropathy only achieved significance in the model in which peripheral vascular disease was measured by oximetry. The crude incidence rate for lower limb amputation was 13.4 per 1,000 patient years. Age standardised incidence rate per 1,000 patient years of follow-up for men was 11.3. Peripheral sensory neuropathy, foot ulcers, peripheral vascular disease, former amputation and treatment with insulin are independent risk factors for lower limb amputation in people with diabetes.

FINAL DRAFT
124 Clinical Guidelines for Type 2 Diabetes
Appendix 4 (contd): Risk factors: lower limb complications
Author(s)
Study Type of intervention Setting and
location
Numbers randomised
Inclusion criteria/ Exclusion criteria
Mean age±SD (years) Male/female ratio
Ethnicity
Follow-up period
Main outcome measures
Boyko EJ et al, 1999
Seattle Diabetic Foot Study
Prospective General medicine clinic, Seattle, USA
None randomised N=776 (1483 lower limbs)
Inclusion: outpatients in general medicine clinic of Veterans Affairs, with diabetes, Type 1 or Type 2 Exclusion: too ill to participate, unable to walk, unable or declined to consent
Median 65 years (28-91) M 98.2% White 78% Type 1: 95 (lower limbs) Type 2: 1388 (lower limbs)
Fu at 12-18 month intervals Mean 3.7 years (0-5.8), 2305 patient-years
Peripheral sensory neuropathy (10 g Semmes-Weinstein monofilament) Peripheral vascular disease Foot ulcer
Results
Two Cox proportional hazards models used, with and without inclusion of orthostatic blood pressure drop, because of missing orthostatic blood pressure data. In the first model, including orthostatic blood pressure drop, the variables associated with risk of foot ulcer were: sensory neuropathy by 5.07 monofilament (RR 2.17, 95% CI 1.52, 3.08, p<0.001), history of foot ulcer (RR 1.63, 95% CI 1.17, 2.26, p=0.004), history of amputation (2.81, 1.84, 4.29, p<0.001), insulin use (1.59, 1.14, 2.22, p=0.006), transcutaneous oximetry dorsal foot (mm Hg) (0.8, 0.69, 0.93, p=0.004), weight (kg) (1.23, 1.06, 1.43, p=0.006), log ankle arm index (0.83, 0.73, 0.96, p=0.011), Charcot deformity (3.49, 1.22, 9.92, p=0.019), and vision <20/40 (1.93, 1.42, 2.63, p<0.001). The only difference between model 1 and model 2 is that Charcot foot is no longer significantly associated with foot ulcer. Two interactions observed between past history of foot ulcer and hammer toe deformity (p=0.006) and poor vision and laser photocoagulation history (p=0.049).

FINAL DRAFT
The prevention and management of foot problems 125
Appendix 4 (contd): Risk factors: lower limb complications
Author(s)
Study Type of intervention Setting and
location
Numbers randomised
Inclusion criteria/ Exclusion criteria
Mean age±SD (years) Male/female ratio
Ethnicity
Follow-up period
Main outcome measures
Peters EJG & Lavery LA, 2001
Prospective case control to evaluate effectiveness of diabetic foot risk classification (International Working Group on the Diabetic Foot).
Health Science Centre, Texas, USA
None randomised N=236 FU N=213
Inclusion: diabetes, Type not stated Exclusion: Any receiving amputation were disqualified from further analyses
52.6±10.4 Mean 30 months
Foot ulcer Amputation Peripheral arterial bypass
Results
Patients allocated to one of four groups: group 0, no neuropathy, Group 1 neuropathy, Group 2 neuropathy, vascular disease and/or deformity, Group 3 previous ulcer. There were significantly more ulcerations and amputations (p<0.001) in higher risk groups. All amputations were found in Groups 2 and 3 (3.1% and 20.9%, p<0.001). During 3 years of follow-up, ulceration occurred in 5.1, 14.3, 18.8 and 55.8% of the patients in groups 0, 1, 2, and 3 respectively (linear by linear association p<0.001). Patients in Group 3 were 34.1 times (95% CI 11.0, 105.8) to develop an ulcer in the follow-up period.

FINAL DRAFT
126 Clinical Guidelines for Type 2 Diabetes
Appendix 4 (contd): Risk factors: lower limb complications
Author(s)
Study Type of intervention Setting and
location
Numbers randomised
Inclusion criteria/ Exclusion criteria
Mean age±SD (years) Male/female ratio
Ethnicity
Follow-up period
Main outcome measures
Lehto S et al, 1996
Cohort Finland None randomised N=1044
Inclusion: Type 2 diabetes, aged 45-64 years, born and living in East or West Finland, on register to receive drug reimbursement for diabetes Exclusion: previous amputation
Men, East Finland 56.8±0.3
Men, West Finland, 57.2±0.3
Women, E Finland 58.9±0.3
Women W Finland 58.7±0.3
7 years Hospitalisation because of lower limb amputation
Results
Cox regression analysis used to investigate risk factors for amputation. Variables associated with risk of lower leg amputation after adjustment for age and sex were: retinopathy (RR 3.6, 95% CI 2.2, 6.1, p<0.001), total cholesterol >6.2 mmol/l (1.8, 1.1, 3.2, p=0.047), urinary protein (1.3, 1.1, 1.6, p=0.003), fasting plasma glucose >13.4mmol/l (2.5, 1.5, 4.3, p<0.001), HbA1c >10.7% (2.4, 1.4, 4.0, p=0.001), duration of diabetes >9 years (2.2, 1.3, 3.6, p=0.004), absence of two or more peripheral artery pulses (3.9, 2.3, 6.8, p<0.001), femoral artery bruit on ascultation (2.1, 1.1, 4.0, p=0.022), bilateral absence of Achilles tendon reflexes (4.3, 2.5, 7.3, p<0.001), bilateral absence of vibration sense (2.7, 1.6, 4.7, p<0.001). Poor glycemic control is an important predictor for amputation in patients with Type 2 diabetes in addition to detectable peripheral arterial disease and peripheral neuropathy.

FINAL DRAFT
The prevention and management of foot problems 127
Appendix 4(contd): Risk factors: amputation
Author(s)
Study Type of intervention Setting and
location
Numbers randomised
Inclusion criteria/ Exclusion criteria
Mean age±SD (years) Male/female ratio
Ethnicity
Follow-up period
Main outcome measures
Hamalainen H et al 1999
Cohort Cases: with amputation Controls 1: without amputation Controls 2: age sex matched patients without amputation
Drug reimbursement register, Finland
None randomised Patients from a FU of 1986 study, after 7 years N=728 Cases: 25 Controls 1: 703 Controls 2: 75 (subgroup of controls 1, age and sex matched 3:1 against cases)
Inclusion: Type 1 or Type 2, registered in national drug reimbursement register (all users of any antidiabetic medication), resident in Turku or surroundings, selected through stratification by age bands
Cases: 62.0±13.7 Controls 1: 46.9±19.1 Controls 2: 61.9±13.6 Cases: M10, F15 Controls 1: M354, F349 Controls 2: M30, F45 Type 2: 76.0% Type 2: 53.2% Type 2: 76.0%
7 years Factors associated with lower limb amputation
Results
Differences between cases and controls 1 at baseline and also with age sex matched controls 2 group for duration of diabetes, history of diabetic complications (retinopathy, nephropathy, hypertension) and serum creatinine levels. Factors associated with lower limb amputation, in logistic regression analysis: vibration perception threshold (OR 14.5, 95% CI 3.6, 57.8, p=0.0001), ankle/brachial pressure index (OR 8.2, 95% CI 2.8, 24.0, p=0.0001), history of retinopathy (OR 6.1, 95% CI 1.9, 19.6, p=0.0024), visual handicap (OR 4.9, 95% CI 1.4, 17.4, p=0.0129, male sex (OR 3.3, 95% CI 1.0, 10.8, p=0.0431). A repeat analysis, excluding ankle/brachial pressure due to missing values, resulted in vibration perception threshold, serum creatinine, visual handicap, and history of retinopathy as independent predictors of amputation.

FINAL DRAFT
128 Clinical Guidelines for Type 2 Diabetes
Appendix 4 (contd): Risk factors: amputation
Author(s)
Study Type of intervention Setting and
location
Numbers randomised
Inclusion criteria/ Exclusion criteria
Mean age±SD (years) Male/female ratio
Ethnicity
Follow-up period
Main outcome measures
Gurlek A et al, 1998
Retrospective University hospital, Turkey
None randomised N=147 Amputees: 54 Nonamputees: 93
Inclusion: consecutive patients with diabetic foot, referred to University hospital, 1992-1996
59.2±10.1 (30-87) M 97, F50 Type 1: 11 Type 2: 136 All Caucasian
Factors associated with lower limb amputation
Results
Factors significantly associated with lower limb amputation were: peripheral vascular disease (OR 4.0, 95% CI 1.17, 13.4, p=0.03), osteomyelitis (OR 3.73, 95% CI 1.08, 12.6 p=0.04), and gangrene (grade 4 or 5 lesions (OR 30.8, 95% CI 7.39, 121.5, p<0.0001). Factors not statistically associated with lower limb amputation in the logistic regression model included age, sex, diabetes duration, smoking history, hypertension, nephropathy, retinopathy, peripheral neuropathy.

FINAL DRAFT
The prevention and management of foot problems 129
Appendix 5: Screening: randomised trials Trial McCabe et al, 1998
Treatment comparison(s)
INT: Identification and protection of patients at a substantially raised risk of ulceration CON: Usual care
Other features Patients were recruited from diabetic outpatient clinics and randomly assigned to screening or usual care. INT: All patients were screened. Patients with foot deformities, history of foot ulceration, or an ankle-brachial index ≤0.75, were asked to re-attend and were reassessed. Measurement by monofilaments, biothesiometer, and palpitation of pedal pulses was included but only gross cases of peripheral vascular or neuropathic disease were enrolled and the usefulness of these techniques is unclear. Patients confirmed at risk were entered into a foot protection programme (FPP). FPP: Weekly clinics provided chiropody and hygiene maintenance, hosiery, protective shoes as well as education about daily hygiene, clothing and footwear.
Location Liverpool, England Baseline comparability at p>0.05
Not reported
Blinding level None apparent Concealment of allocation
Not reported
Inclusion/ exclusion
Inclusion: Type II diabetes, attending outpatients. Exclusion: (From effectiveness measures) 4 patients who had ulceration at enrolment and were included in the intervention group.
Numbers randomised
INT:1001; CON: 1000
Length of follow-up
2 years
Loss to follow-up (%)
Not complying fully with screening programme: INT: and 33/259 (13%) Not attending follow-up examination: INT: 323/1001 (32%); however, 159 (16%) had attended, but not at special appointment CON: 531/1001 (53%)
Type of analysis
Endpoint analysis
Outcomes/ endpoints
Ulceration (incidence) at 2 years: INT: 24/1001 (2.4%); CON: 35/1000 (3.5%); p>0.14 Proportion of ulcers proceeding to amputation: INT: 7/24 (29%); CON: 23/35 (66%); p=0.006 Amputations (major or minor): INT: 7/1001 (0.7%); CON: 23/1001 (2.3%); p<0.04 Amputations (major): INT: 1/1001 (0.1%); CON: 6/1001 (0.6%); p<0.01 Chiropody, regular attendance: INT: 47%; CON: 36% Use of protective footwear: FPP: 127 patients. 87 (68.5%) responded to a questionnaire about usage; 36% claimed to use provided footwear at all times, 27% never wore the footwear.
Economic data Accountancy costs were used to estimate values for labour, capital equipment, disposables, transport, estate and administration. Second year costs were discounted at 6%. Footwear, provided by a private firm, was costed at market prices. The total cost of screening and 2-year protection, without savings from disease avoided was £100/patient. The authors estimate that savings in the prevented amputation procedures alone would exceed the costs of screening and prevention.

FINAL DRAFT
130 Clinical Guidelines for Type 2 Diabetes
Appendix 5 (contd): Screening: randomised trials
Author(s)
Study Type of intervention Setting and
location
Numbers randomised
Inclusion criteria/ Exclusion criteria
Mean age±SD (years) Male/female ratio
Ethnicity
Follow-up period
Main outcome measures
Meijer J-WG et al 2000
Observational Neuropathy Impairment Score in the lower limbs (modified Neuropathy Disability Score). Semmes-Weinstein monofilaments tested on plantar surface of hallux and centrally on heel Vibration perception thresholds on dorsum of hallux on interphalangeal joint, mean of 3 readings.
Separate study on N=10 to test intra and inter-rater agreement
Diabetes outpatient clinic, Department of Diabetes Rehabilitation Centre, Netherlands
None randomised N=73
Inclusion: Type 1 or Type 2, nothing stated Exclusion: factors that may interfere with neurological condition of subject other than diabetic polyneuropathy.
73 M43, F30 T1 24, T2 49
None To develop a Diabetic Neuropathy Examination score (by modifying the Neuropathy Disability score). Sensitivity and specificity for Neuropathy Impairment score against Semmes-Weinstein monofilaments and vibration perception thresholds as clinical standards
Results
Modification of the Neuropathy Disability score resulted in an 8-item scale – the Diabetic Neuropathy Examination. At a cut-off point of 3-4 on diabetes neuropathy examination score, for an abnormal result using monofilaments, sensitivity was 96%, specificity 51%. Using vibration perception threshold, sensitivity was 97% and specificity 59%. Other details given in paper around validation and reliability of instrument. Cut-offs chosen to achieve high sensitivity with an acceptable specificity. Aim of Neuropathy Disability Score is to evaluate neuropathy in general, so may not be suitable for use in diabetic foot clinic. The Diabetic Neuropathy Examination is fast, easy to perform, hierarchical, and sensitive for polyneuropathy.

FINAL DRAFT
The prevention and management of foot problems 131
Appendix 6: Footwear: randomised trials
Author(s)
Study Type of intervention Setting and
location
Numbers randomised
Inclusion criteria/ Exclusion criteria Mean age±SD (years)
Male/female ratio Ethnicity
Follow-up period
Main outcome measures
Reiber, G et al (2002)
Randomised placebo-controlled trial T1: therapeutic shoes and cork inserts T2: therapeutic shoes and prefabricated (polyurethane) inserts T3: placebo (usual footwear)
Washington state (US) health care organisations (2)
T1: 121 T2: 119 T3: 160
Inclusion: age 45-84 yrs, diagnosed diabetes, history of full thickness foot lesion or foot infection requiring antibiotic treatment, no foot deformities requiring custom shoe, US shoe size 8 to 12½ for men and 7 to 10½ for women (limited sizes to contain manufacturing. costs), ability to walk 1 block and climb 1 flight of stairs per day 9 to ensure footwear was worn) Exclusion: prior lower extremity amputation of more than 1 digit, presence of either unhealed or healed lesion in prior month, requirement of boots, custom shoes or non-traditional footwear for daily activities, non-ambulatory status, terminal illness that would make 2-year survival unlikely, severe foot deformities, Charcot foot
T1: 61±10.1 T2: 62±10.1 T3: 63±10.0 overall 62 ±10.1 T1: 22% female T2: 23% female T3: 23% female overall 23% female T1: 79% White, 12% Black, 8% other T2: 82% White, 10% Black, 8% other T3: 74% White, 14% Black, 12% other overall 78% White, 13% Black, 10% other T1: 7% Type 1 T2: 5% Type 1 T3: 8% Type 1 overall 7% Type 1
four visits within first month since enrolment then every 17 weeks follow up for two years
incidence of foot ulcer
FINAL DRAFT
132 Clinical Guidelines for Type 2 Diabetes
Results
T1 T2 T3 Incidence per person
cumulative incidence per person (95% CI) 0.15 (0.09 – 0.22) 0.14 (0.09 – 0.22 0.17 (0.11 – 0.24) risk ratio for ulcers (95% CI) 0.88 (0.51 – 1.52) 0.85 (0.48 – 1.48) 1.00
Incidence per person year incidence rate (95% CI) 0.11 (0.06 – 0.19) 0.14 (0.08 – 0.23) 0.13 (0.08 – 0.20) rate ratio (95% CI) 0.87 (0.43 – 1.75) 1.09 (0.56 – 2.13) 1.00
Ulcer episodes incidence rate (95% CI) 0.11 (0.06 – 0.17) 0.10 (0.06 – 0.17) 0.12 (0.08 – 0.18) rate ratio (95% CI) 0.86 (0.45 – 1.63) 0.80 (0.41 – 1.56) 1.00
author conclusions: study did not provide evidence to support the practice of freely dispensing therapeutic shoes and inserts to patients customised cork inserts offer no benefit over prefabricated polyurethane inserts and control patients wearing their usual footwear fared as well as intervention patients in therapeutic shoes careful attention to foot care by health care professional may be more important than therapeutic footwear the study does not negate the possibility that special footwear is beneficial in persons with diabetes who either do not receive such close attention to foot care by their health care professionals or have severe foot deformities strategies to reduce external trauma unrelated to shoes appear to be indicated, including safe house slippers highest risk patients, those who have foot insensitivity, are also most vulnerable to complications

FINAL DRAFT
The prevention and management of foot problems 133
Appendix 6 (contd): Footwear: randomised trials Trial Colagiuri et al, 1995 Uccioli et al, 1995
Treatment comparison(s)
INT: Treatment with a custom-made rigid orthotic device CON: Conventional podiatric care
INT: Patients wearing therapeutic shoes with custom- moulded insoles CON: Patients wearing own shoes
Other features All patients were assessed by a podiatrist including grading of callus, lower limb biomechanics and gait analysis, vibration sensation with a biothesiometer, and Doppler studies of foot arteries. INT: Plaster casts of callused feet were taken. From the cast, a rigid orthotic device was made of a thermal pliable plastic and was balanced for position and contact. The device was light, extending from the heel to behind the metatarsal heads and could be used in sports shoes. Subjects were asked to wear the device at least 7 hours a day and to be reviewed 1–3 weeks after commencement for appropriate fitting. Patients in this group did not have callus debrided. CON: Patients attended the podiatrist at 3-monthly intervals for treatment of callus.
Patients were enrolled at one of two teaching hospitals. All patients received guidance on foot care and footwear. Neuropathy was evaluated by vibration perception threshold and peripheral vascular disease by ankle/brachial index. INT: Therapeutic shoes were provided at the beginning and 6 months into the study. Shoes were of soft thermoformable leather with semi-rocker soles, and were super-depth to fit customised insoles and toe deformities. Insoles were made of a special dual material to relieve local pressure and absorb high pressure points. CON: Patients attended the podiatrist at 3-monthly intervals.
Location New South Wales, Australia Rome and Milan, Italy Baseline comparability at p>0.05
Yes Measures of neuropathy and peripheral vascular disease are comparable; however, levels of previous ulceration are not recorded
Blinding level None apparent None apparent Concealment of allocation
Not reported Not reported
Inclusion/ exclusion
Inclusion: Patients with plantar callus and no history of ulceration. Exclusion: Patients with callus including haematoma, ulcer or infected ulcer.
Inclusion: Patients with previous ulceration or considered at high risk. Exclusion: Patients with present ulceration, previous minor or major amputation, major foot deformities such as Charcot joints.
Numbers randomised
INT: 9; CON: 11 INT: 33; CON: 36
Length of follow-up
1 year 1 year
Loss to follow-up (%)
None None
Type of analysis
Endpoint analysis Endpoint analysis
Outcomes/ endpoints
Mean callus grade at baseline: INT: 1.9; CON: 1.6 Mean callus grade at 12 months: INT: 1.2; CON: 1.7 Number of calluses (at 12 months): Improved: INT: 16; CON: 2 Same: INT: 6; CON: 23 Worse: INT: 0; CON: 7 (reported Fischer’s exact test p<0.02) However, this statistic is inappropriately precise since calluses are not independent but clustered by foot.
Relapse rate (at 1 year), first new ulcer: INT: 9/33 (27.7%); CON: 21/36 (58.3%); p=0.009
Economic data The cost of the orthotic device was recorded as AUS$100, provided through the commercial manufacturer: it is unclear whether casting and other additional costs are included in this figure.
None reported.

FINAL DRAFT
134 Clinical Guidelines for Type 2 Diabetes
Appendix 7: Antibiotic treatment: randomised trials Trial Lipsky et al, 1990 Chantelau, 1996
Treatment comparison(s)
T1: Oral clindamycin hydrochloride (300 mg) T2: Oral cephalexin (500 mg)
INT: Amoxicillin (500 mg) and clavulanic acid (125 g) CON: Placebo
Other features Diabetic outpatients, at an acute care hospital. All patients had lesions cleansed and debrided, and were given instructions for care and dressing of lesions. Patients in both groups received oral therapy 4 times daily for 2 weeks. Patients whose infections failed to improve or worsened were withdrawn and hospitalised for parenteral therapy
All patients had necrotic tissue debrided and lesions cleansed. Complete pressure relief was provided by half shoes and walking aid or wheelchair. Outpatients received cleansing and dressings daily in their homes from qualified nurses. INT: Antibiotics taken 3 times daily. Treatment could be discontinued during the study if pathogens or lesion were unresponsive to therapy.
Location Seattle, Washington, USA Düsseldorf, Germany Baseline comparability at p>0.05
Yes Yes
Blinding level Clinician blinded Double blind (patient and doctor) Concealment of allocation
Not reported Unclear, (a computer-generated randomisation code was used)
Inclusion/ exclusion
Inclusion: Diabetic patients with an infected lesion regardless of type or duration who had not received systemic or topical antimicrobial therapy in the last 2 weeks. Exclusion: Presence of systemic toxicity, or if the infection was a threat to life or limb; unable to perform daily wound care; history of non-compliance with outpatient treatment; unwilling to attend regular outpatient visits, or allergic to study drugs.
Inclusion: Diabetic patients with purely neuropathic ulcers of severity 1A (superficial with or without cellulitis) to 2A (deeper, reaching to joints and tendons) on the Wagner and Harkless classification. Exclusion: Hypersensitivity to treatment, antibiotic treatment in preceding 7 days, bilateral foot lesions, osteomyelitis, pregnancy, peripheral vascular disease, immunosuppression, prior organ transplantation, inability to comply with wound monitoring protocol, microbials from swab not responsive to treatment.
Numbers randomised
T1: 27; T2: 29 INT: 22; CON: 22
Length of follow-up
2 weeks (also 15 month unblinded case reports) 20 days
Loss to follow-up (%)
None INT: 3; CON: 2
Type of analysis
Endpoint analysis Endpoint analysis
Outcomes/ endpoints
Wound healing (size of ulceration), n=52: Healed: T1: 10/25 (40%); T2: 9/27 (33%) Healing progress: T1: 14/25 (56%); T2: 18/27 (67%) Unimproved: T1: 1/25 (4%); T2: 0/27 (0%) (4 patients did not have open wounds) Infection response, n=56: Cured: T1: 21/27 (78%); T2: 21/29 (72%) Improved: T1: 5/27 (19%); T2: 4/29 (14%) Failed: T1: 1/27 (4%); T2: 4/29 (14%) No differences between treatments were statistically significantly different. Adverse events are not reported.
Completely closed lesions (within 20 days): INT: 6/19 (32%); CON: 10/20 (50%) Mean reduction in ulcer radius (mm2/day): INT: 0.27 (95%CI: 0.15–0.39); CON: 0.41 (95%CI: 0.21–0.61)
Economic data None reported.

FINAL DRAFT
The prevention and management of foot problems 135
Appendix 7 (contd): Randomised trials of antibiotic treatment Trial Lipsky et al, 1996 Grayson et al, 1994
Treatment comparison(s)
T1: IV ofloxacin and then oral ofloxacin T2: IV ampicillin/sulbactam and then oral amoxicillin/clavulanic acid
T1: Imipenem/cilastatin T2: Ampicillin/sulbactam
Other features Both treatments were given for 14–28 days. IV therapy ran for about 1 week in both groups. T1: Intravenous ofloxacin (400 mg) followed by oral ofloxacin (400 mg) every 12 hours. T2: Intravenous ampicillin (1–2 g)/sulbactam (0.5–1 g) followed by amoxicillin (500 mg)/clavulanic acid (125 g) every 8 hours. Patients not improving could receive additional antibiotic therapy (metronidazole to the ofloxacin group, and gentamicin or trimethoprim-sulfamethoxazole to the amino-penicillin regimen).
T1: Intravenous, 500 mg every 6 hours, mean duration of therapy was 13 days. T2: Intravenous, 3 g every 6 hours, mean duration of therapy was 15 days. Treatment could be modified after 5 days for non-response, but blinding to the randomised treatment was maintained. Sharp debridement was carried out where indicated.
Location Multi centre, USA Boston, Massachusetts, USA Baseline comparability at p>0.05
Yes Yes
Blinding level None apparent Double blind, patient and doctor Concealment of allocation
Not reported Yes, by pharmacy using computer-generated randomisation code
Inclusion/ exclusion
Inclusion: Diabetic patients with foot infection requiring antibiotic therapy. Exclusion: Patients with osteomyelitis in which infected bone was not to be removed, infection resistant to study regimens, allergic to study regimens, pregnancy, undergoing renal dialysis.
Inclusion: Diabetic patients over 18 years of age with limb-threatening infections of lower extremities (presence of cellulitis with or without ulceration or purulent discharge). Exclusion: Serum creatinine >3.5 mg/dL, pregnancy, hypersensitivity to study drugs, immunosuppression, prior organ transplantation.
Numbers randomised
T1: 55 T2: 53
T1: 48 episodes in 46 patients T2: 48 episodes in 47 patients
Length of follow-up
28 days Primary assessment at 5 days and then at end of treatment
Loss to follow-up (%)
None, of 88 reported 20 patients were excluded for a range of reasons but it is unclear at what stage in the study these occurred
13/90 (14%)
Type of analysis
Endpoint analysis Endpoint analysis of episodes
Outcomes/ endpoints
Cure: T1: 23/47 (49%); T2: 23/41 (56%). Improvement: T1: 17/47 (36%); T2: 11/41 (27%) Failure: T1: 7/47 (15%); T2: 7/41 (17%) Side effects: T1: 17/47 (36%); T2: 9/41 (22%) Attribution of side effects to therapy is unclear. No side effect was reported severe enough to lead to discontinuation of therapy.
Clinical assessment: at 5 days end of therapy T1 T2 T1 T2 Cure: 29 (60%) 28 (58%) 41 (85%) 39 (81%)Improvement: 18 (38%) 17 (35%) 0 (0%) 0 (0%) Failure: 1 (2%) 3 (6%) 6 (13%) 8 (17%)Indeterminate: 0 (0%) 0 (0%) 1 (2%) 1 (2%) No significant differences were found
Economic data Both therapies are reported identical in cost.

FINAL DRAFT
136 Clinical Guidelines for Type 2 Diabetes
Appendix 7 (contd): Randomised trials of antibiotic treatment – health economics
Author(s) Study Type of intervention Setting and
location
Numbers randomised
Inclusion criteria/ Exclusion criteria
Mean age±SD (years)
Male/female ratio Ethnicity
Follow-up period
Main outcome measures
McKinnon PS et al, 1997
Cost effectiveness analysis of RCT of T1: ampicillin/sulbactam T2: imipenem/ cilastatin
New York, USA
Inclusion: diabetes, Type not stated, need for hospitalisation, limb-threatening infection of lower limb, ≥18 years age. Exclusion: known hypersensitivity to β-lactam antibiotics, need for other antibiotics, serum creatinine≥3.5mg/dL, survival expected>48 hours, immunosuppression secondary to underlying disease or drug therapy
Cure of infection costs of treatment
Results
Mean per-patient treatment costs: T1: $US14,084, T2: $17,008 (p=0.05). Sensitivity analysis varying drug prices or hospital costs suggested T1 consistently more cost effective than T2.
Eckman MH et al, 1995
Markov model for cost effectiveness for different treatments
Inclusion: Type 2, foot infections, suspected osteomyelitis
Quality-adjusted life expectancy, costs
Results
Culture-guided empiric treatment for osteomyelitis with 10 weeks or oral antibiotic therapy had similar effectiveness as testing followed by long course of antibiotic therapy if any test result is positive. Empiric treatment is least expensive strategy.
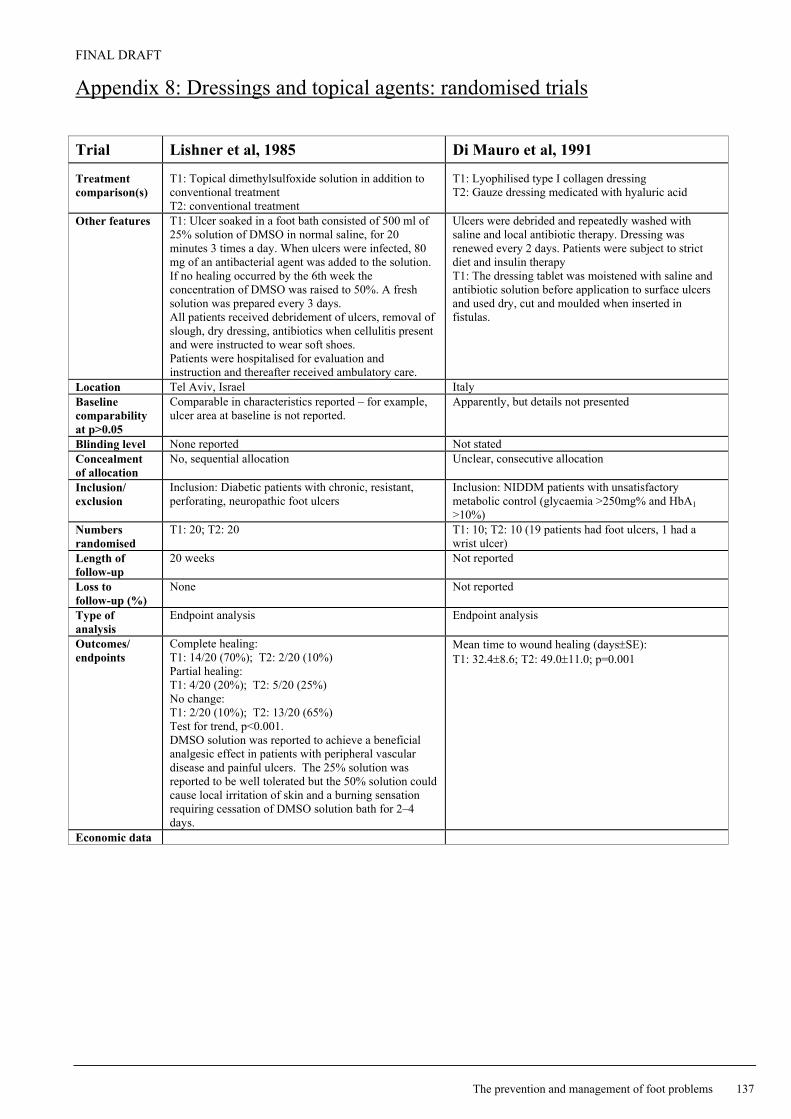
FINAL DRAFT
The prevention and management of foot problems 137
Appendix 8: Dressings and topical agents: randomised trials Trial Lishner et al, 1985 Di Mauro et al, 1991
Treatment comparison(s)
T1: Topical dimethylsulfoxide solution in addition to conventional treatment T2: conventional treatment
T1: Lyophilised type I collagen dressing T2: Gauze dressing medicated with hyaluric acid
Other features T1: Ulcer soaked in a foot bath consisted of 500 ml of 25% solution of DMSO in normal saline, for 20 minutes 3 times a day. When ulcers were infected, 80 mg of an antibacterial agent was added to the solution. If no healing occurred by the 6th week the concentration of DMSO was raised to 50%. A fresh solution was prepared every 3 days. All patients received debridement of ulcers, removal of slough, dry dressing, antibiotics when cellulitis present and were instructed to wear soft shoes. Patients were hospitalised for evaluation and instruction and thereafter received ambulatory care.
Ulcers were debrided and repeatedly washed with saline and local antibiotic therapy. Dressing was renewed every 2 days. Patients were subject to strict diet and insulin therapy T1: The dressing tablet was moistened with saline and antibiotic solution before application to surface ulcers and used dry, cut and moulded when inserted in fistulas.
Location Tel Aviv, Israel Italy Baseline comparability at p>0.05
Comparable in characteristics reported – for example, ulcer area at baseline is not reported.
Apparently, but details not presented
Blinding level None reported Not stated Concealment of allocation
No, sequential allocation Unclear, consecutive allocation
Inclusion/ exclusion
Inclusion: Diabetic patients with chronic, resistant, perforating, neuropathic foot ulcers
Inclusion: NIDDM patients with unsatisfactory metabolic control (glycaemia >250mg% and HbA1 >10%)
Numbers randomised
T1: 20; T2: 20 T1: 10; T2: 10 (19 patients had foot ulcers, 1 had a wrist ulcer)
Length of follow-up
20 weeks Not reported
Loss to follow-up (%)
None Not reported
Type of analysis
Endpoint analysis Endpoint analysis
Outcomes/ endpoints
Complete healing: T1: 14/20 (70%); T2: 2/20 (10%) Partial healing: T1: 4/20 (20%); T2: 5/20 (25%) No change: T1: 2/20 (10%); T2: 13/20 (65%) Test for trend, p<0.001. DMSO solution was reported to achieve a beneficial analgesic effect in patients with peripheral vascular disease and painful ulcers. The 25% solution was reported to be well tolerated but the 50% solution could cause local irritation of skin and a burning sensation requiring cessation of DMSO solution bath for 2–4 days.
Mean time to wound healing (days±SE): T1: 32.4±8.6; T2: 49.0±11.0; p=0.001
Economic data

FINAL DRAFT
138 Clinical Guidelines for Type 2 Diabetes
Appendix 8 (contd): Dressings and topical agents: randomised trials Trial Ahroni et al, 1993 Blackman et al, 1994
Treatment comparison(s)
T1: Calcium alginate dressing changed once daily T2: Dry sterile gauze (non-adherent dressing) changed twice daily
T1: Semi-permeable polymeric membrane dressing T2: Conventional therapy (wet-to-dry saline gauze dressing)
Other features Ulcers received thorough debridement at baseline and patients received instructions for foot care. Wounds were cleansed with a half strength hydrogen peroxide and rinsed with saline. Patients attended weekly outpatient clinics. Oral antibiotics were prescribed for signs of soft tissue infection.
Wounds were surgically debrided before treatment where necessary and patients were given self-care advice and guidance on changing dressings. Ulcer assessment occurred every 3 weeks, patients were allowed to cross-over from T2 to T1 after 2 months.
Location Washington, USA Chicago, USA Baseline comparability at p>0.05
Yes, except significantly more patients in T2 entered the study on antibiotics (p=0.03)
Yes
Blinding level None Not reported Concealment of allocation
Not reported Not reported
Inclusion/ exclusion
Inclusion: Patients with diabetic foot ulcers that penetrated the epidermis but did not involve joint spaces, tendon or bone, and willing to comply with protocol. Exclusion: Patients who required inpatient management of ulcers (e.g. severe infection, cellulitis, osteomyelitis) or evidence of systemic toxicity.
Inclusion: Diabetic patients with partial or full thickness open wound foot ulcer and free of hard eschar. Exclusions: Ulcers with initial Wagner stage III or higher, patients in need of vascular surgery, ulcers from charcot joints or of non-diabetic origin.
Numbers randomised
T1: 20; T2: 19 T1: 11; T2: 7
Length of follow-up
4 weeks 2 months for primary analysis
Loss to follow-up (%)
T1: 5; T2: 3 (all admitted to hospital) 2 patients in each group progressed to Wagner stage III ulcers and were not included in the final analysis. It is unclear whether these are included in the numbers randomised.
Type of analysis
Endpoint analysis Endpoint analysis
Outcomes/ endpoints
At 4 weeks: T1: T2: Healed: 5 (25%); 7 (37%) Unhealed: 10 (50%); 9 (47%) Withdrawn: 5 (25%); 3 (16%) p=0.65 Eventually (time period not stated): T1: T2: Healed: 12 14 Unhealed: 3 2 Surgery: 2 0 Amputation: 2 2 Expired: 1 1 p=0.68 For patients not withdrawn: Healing rate, area: mm2/day (±SD): T1: –2.19 (±4.0); T2: –2.04 (±2.61), p>0.99 Healing rate, linear: mm/day (±SD): T1: 0.094 (±0.147); T2: 0.084 (±0.100), p=0.87
Ulcer area (cm2±SE): Initial: T1: 2.67±1.2; T2: 1.81±0.75 Final: T1: 0.84±0.37; T2: 2.77±1.85 % of baseline: T1: 35±16; T2: 105±26; p<0.03 Complete healing: T1: 3/11(27%); T2: 0/7 (0%) Substantial improvement in ulcer size at 2 months T1: 10/11 (91%); T2: 2/7 (29%) 5 subjects randomised to T2 crossed over to T1 after 2 months of treatment
Economic data
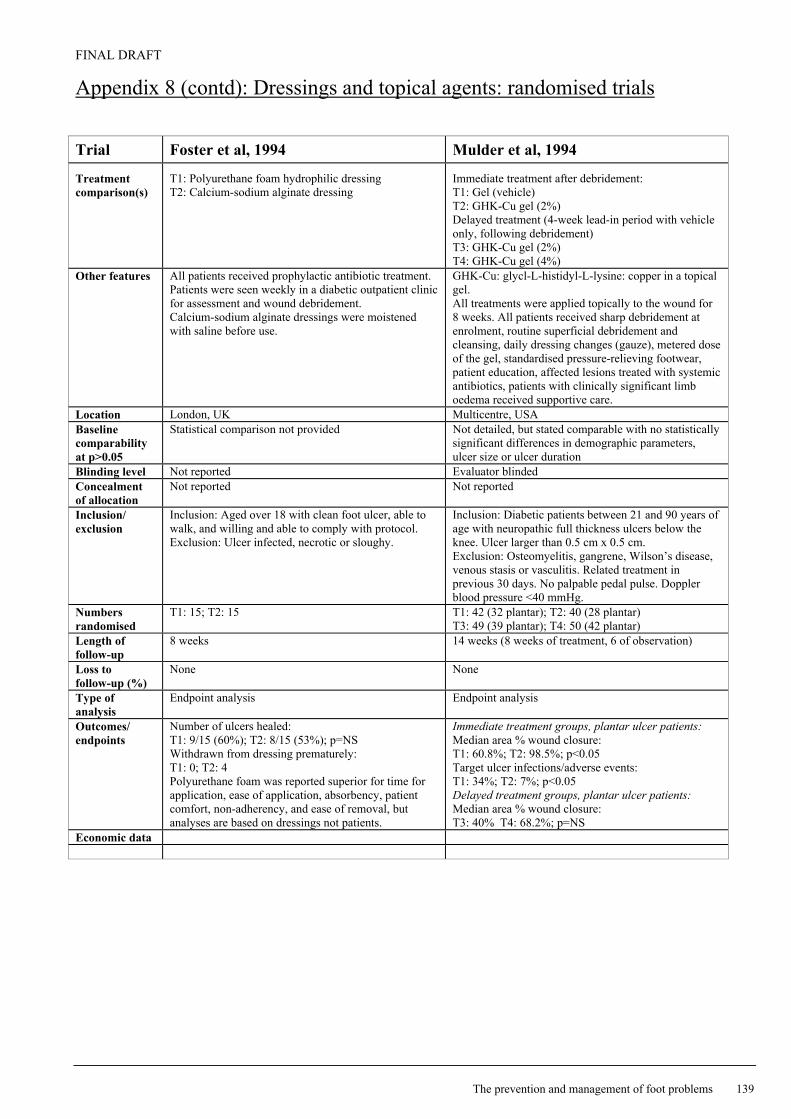
FINAL DRAFT
The prevention and management of foot problems 139
Appendix 8 (contd): Dressings and topical agents: randomised trials Trial Foster et al, 1994 Mulder et al, 1994
Treatment comparison(s)
T1: Polyurethane foam hydrophilic dressing T2: Calcium-sodium alginate dressing
Immediate treatment after debridement: T1: Gel (vehicle) T2: GHK-Cu gel (2%) Delayed treatment (4-week lead-in period with vehicle only, following debridement) T3: GHK-Cu gel (2%) T4: GHK-Cu gel (4%)
Other features All patients received prophylactic antibiotic treatment. Patients were seen weekly in a diabetic outpatient clinic for assessment and wound debridement. Calcium-sodium alginate dressings were moistened with saline before use.
GHK-Cu: glycl-L-histidyl-L-lysine: copper in a topical gel. All treatments were applied topically to the wound for 8 weeks. All patients received sharp debridement at enrolment, routine superficial debridement and cleansing, daily dressing changes (gauze), metered dose of the gel, standardised pressure-relieving footwear, patient education, affected lesions treated with systemic antibiotics, patients with clinically significant limb oedema received supportive care.
Location London, UK Multicentre, USA Baseline comparability at p>0.05
Statistical comparison not provided Not detailed, but stated comparable with no statistically significant differences in demographic parameters, ulcer size or ulcer duration
Blinding level Not reported Evaluator blinded Concealment of allocation
Not reported Not reported
Inclusion/ exclusion
Inclusion: Aged over 18 with clean foot ulcer, able to walk, and willing and able to comply with protocol. Exclusion: Ulcer infected, necrotic or sloughy.
Inclusion: Diabetic patients between 21 and 90 years of age with neuropathic full thickness ulcers below the knee. Ulcer larger than 0.5 cm x 0.5 cm. Exclusion: Osteomyelitis, gangrene, Wilson’s disease, venous stasis or vasculitis. Related treatment in previous 30 days. No palpable pedal pulse. Doppler blood pressure <40 mmHg.
Numbers randomised
T1: 15; T2: 15 T1: 42 (32 plantar); T2: 40 (28 plantar) T3: 49 (39 plantar); T4: 50 (42 plantar)
Length of follow-up
8 weeks 14 weeks (8 weeks of treatment, 6 of observation)
Loss to follow-up (%)
None None
Type of analysis
Endpoint analysis Endpoint analysis
Outcomes/ endpoints
Number of ulcers healed: T1: 9/15 (60%); T2: 8/15 (53%); p=NS Withdrawn from dressing prematurely: T1: 0; T2: 4 Polyurethane foam was reported superior for time for application, ease of application, absorbency, patient comfort, non-adherency, and ease of removal, but analyses are based on dressings not patients.
Immediate treatment groups, plantar ulcer patients: Median area % wound closure: T1: 60.8%; T2: 98.5%; p<0.05 Target ulcer infections/adverse events: T1: 34%; T2: 7%; p<0.05 Delayed treatment groups, plantar ulcer patients: Median area % wound closure: T3: 40% T4: 68.2%; p=NS
Economic data

FINAL DRAFT
140 Clinical Guidelines for Type 2 Diabetes
Appendix 8 (contd): Dressings and topical agents: randomised trials Trial Apelqvist et al, 1996 Clever and Dreyer, 1996
Treatment comparison(s)
T1: Cadexomer iodine ointment in addition to standard care T2: Standard care
T1: Hydroactive polyurethane gel dressing T2: Hydrophilic polyurethane foam dressing
Other features Standard treatment (dry saline gauze changed once or twice daily, gentamicin solution for infection, streptodornase/streptokinase for necrotic tissue). Footwear was provided or corrected where necessary and oral antibiotics were used for infection. When ulcers stopped exuding, petroleum gauze was used in both groups until the end of the study. Patients were treated as outpatients by a multi-disciplinary foot care team. T1: Cadexomer iodine applied topically once daily during first week and daily or every 2nd or 3rd day subsequently for 8 weeks in total. All patients had signs of severe sensory neuropathy VPT>30.
All patients received standard treatment: half shoe pressure relief, therapeutic footwear, crutches as necessary, infection control with antibiotics, wound cleansing, debridement and removal of callus as required in a diabetic foot clinic.
Location Lund, Sweden Hamburg, Germany Baseline comparability at p>0.05
Not detailed; the authors report no major differences between groups in clinical characteristics
Yes, except smoking T1: 9/20; T2: 4/20; p<0.01
Blinding level Blinded evaluation of wound assessment None reported Concealment of allocation
Computer-generated list of randomly permuted blocks of patients where the size of blocks was unknown to the investigator
Not reported
Inclusion/ exclusion
Inclusion: Caucasian, over 40 years with known diabetes, exuding cavity ulcer below ankle (Wagner ulcer grade I or II) with an ulcer area >1 cm2, systolic toe pressure >30 mmHg or systolic ankle pressure >80 mmHg; if more than one ulcer the largest was chosen. Exclusion: Patients with ulcers >25 cm2, osteomyelitis, gangrene, ulcer: Wagner grade III-IV.
Inclusion: Patients aged 18–80 years old with superficial ulcer, size 1–5 cm in diameter. Exclusion: Large vessel disease, ulcers requiring additional topical treatment, known allergy to any product used.
Numbers randomised
T1: 22; T2: 19 T1: 20; T2: 20
Length of follow-up
12 weeks 16 weeks
Loss to follow-up (%)
T1: 5/22; T1: 1/19 T1: 2; T2: 4
Type of analysis
Endpoint analysis Endpoint analysis
Outcomes/ endpoints
Complete healing: T1: 5/17 (29%); T2: 2/18 (11%); p=NS Clinically relevant improvement (area reduced by >50% or improvement in Wagner grade): T1: 12/17(71%); T2: 13/18 (72%); p=NS Weekly cost: T1 T2 Staff: 380 884 p<0.0001 Transportation: 100 2 p<0.0001 Materials and drugs: 423 294 p=NS Total: 903 1421 p<0.01
Mean time to healing (±SD): T1: 25.19 days (±23.52) T2: 20.43 days (±14.74) Median time to healing (range): T1: 16.5 days (4–76) T2: 15.5 days (4–52) Wound size at 4 weeks (±SD): T1: 32.37 mm2 (±54.12) T2: 33.46 mm2 (±75.22) No differences between groups were statistically significant. Subjective evaluation by the investigator and patients revealed no significant differences between dressings
Economic data Direct costs were estimated for material and drugs, staff and transportation (patient and health service).
There were no significant differences in frequency of dressing changes.

FINAL DRAFT
The prevention and management of foot problems 141
Appendix 8 (contd): Dressings and topical agents: randomised trials Trial Donaghue, 1996 Baker et al, unpublished Treatment comparison(s)
T1: Collagen alginate wound dressing T2: Gauze moistened with saline
T1: Polyurethane foam hydrophilic dressing T2: Calcium alginate dressing
Other features All patients received initial debridement, instructions on dressing changes (as often as required), and adhesive foam pads to limit weight bearing. Patients had weekly outpatient clinics.
All patients: Wound cleansed with saline. Dressings were changed weekly in an ulcer clinic and by a district nurse at home if more frequent changes were required. All wounds had superficial depth.
Location Boston, Massachusetts, USA Southampton, UK Baseline comparability at p>0.05
Yes Yes
Blinding level None None apparent Concealment of allocation
Not reported Not clear, patients allocated by computer-generated randomisation code
Inclusion/ exclusion
Inclusion: Diabetic foot ulcer, patient age ≥21 years, adequate nutrition intake, adequate blood flow to extremities, ulcer area ≥1 cm2 after initial debridement. Exclusion: Renal impairment, serious medical disorders that may impair healing.
Inclusion: Diabetic outpatients with neuropathic foot lesions, ≥18 years of age with palpable pedal pulses. Exclusion: Sloughy, necrotic or infected wounds, history of intermittent claudication or rest pain.
Numbers randomised
T1: 50; T2: 25 T1: 10; T2: 9
Length of follow-up
8 weeks 12 weeks
Loss to follow-up (%)
T1: 6 (12%); T2: 8 (32%) None
Type of analysis
Endpoint analysis Endpoint analysis
Outcomes/ endpoints
Complete healing T1: 24/44 (55%); T2: 9/17 (53%) Time to complete healing (weeks±SE) T1: 6.2±0.4; T2: 5.8±0.6 ≥50% wound area reduction: T1: 43/44 (98%); T2: 15/17 (88%) Time to 50% healing (weeks±SE): T1: 2.4±0.3; T2: 2.5±0.7 Reduction in wound area (%±SE): T1: 80.6%±0.1; T2: 61.1%±0.3 No differences between dressings were statistically significant. Patient assessment of ease of application and removal is reported to favour the collagen alginate dressing. No difference is reported in the number and severity of reported adverse reactions between groups.
Number of ulcers healed at week 12: T1: 9/10 (90%); T2: 4/9 (44%); Median time to healing: T1: 28 days; T2: 84 days Withdrawn from dressing prematurely: T1: 1; T2: 2 T1: Reported more absorbent, less adherent to wounds and easier to remove than Sorbsan dressing, but analyses are based on dressings not patients. Patient comfort was reported comparable.
Economic data
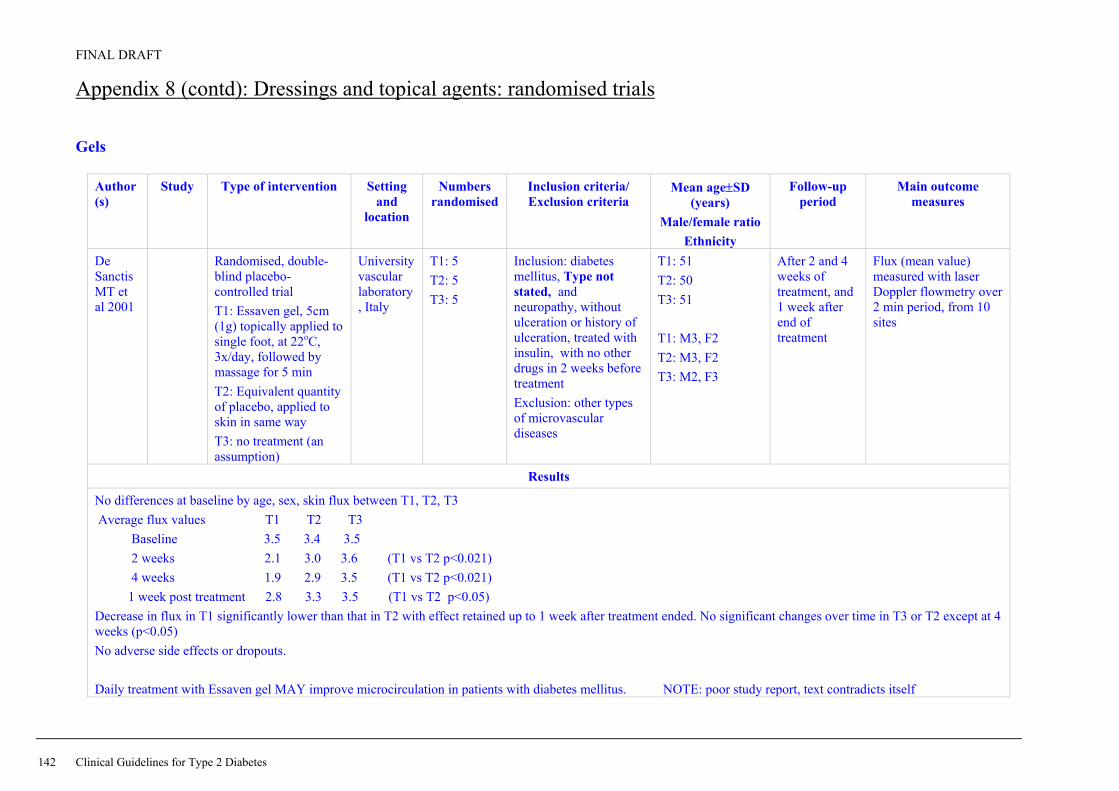
FINAL DRAFT
142 Clinical Guidelines for Type 2 Diabetes
Appendix 8 (contd): Dressings and topical agents: randomised trials Gels
Author(s)
Study Type of intervention Setting and
location
Numbers randomised
Inclusion criteria/ Exclusion criteria
Mean age±SD (years)
Male/female ratio Ethnicity
Follow-up period
Main outcome measures
De Sanctis MT et al 2001
Randomised, double-blind placebo-controlled trial T1: Essaven gel, 5cm (1g) topically applied to single foot, at 22oC, 3x/day, followed by massage for 5 min T2: Equivalent quantity of placebo, applied to skin in same way T3: no treatment (an assumption)
University vascular laboratory, Italy
T1: 5 T2: 5 T3: 5
Inclusion: diabetes mellitus, Type not stated, and neuropathy, without ulceration or history of ulceration, treated with insulin, with no other drugs in 2 weeks before treatment Exclusion: other types of microvascular diseases
T1: 51 T2: 50 T3: 51 T1: M3, F2 T2: M3, F2 T3: M2, F3
After 2 and 4 weeks of treatment, and 1 week after end of treatment
Flux (mean value) measured with laser Doppler flowmetry over 2 min period, from 10 sites
Results
No differences at baseline by age, sex, skin flux between T1, T2, T3 Average flux values T1 T2 T3 Baseline 3.5 3.4 3.5 2 weeks 2.1 3.0 3.6 (T1 vs T2 p<0.021) 4 weeks 1.9 2.9 3.5 (T1 vs T2 p<0.021) 1 week post treatment 2.8 3.3 3.5 (T1 vs T2 p<0.05) Decrease in flux in T1 significantly lower than that in T2 with effect retained up to 1 week after treatment ended. No significant changes over time in T3 or T2 except at 4 weeks (p<0.05) No adverse side effects or dropouts. Daily treatment with Essaven gel MAY improve microcirculation in patients with diabetes mellitus. NOTE: poor study report, text contradicts itself

FINAL DRAFT
The prevention and management of foot problems 143
Appendix 8 (contd): Dressings and topical agents: randomised trials Gels
Author(s)
Study Type of intervention Setting and
location
Numbers randomised
Inclusion criteria/ Exclusion criteria
Mean age±SD (years)
Male/female ratio Ethnicity
Follow-up period
Main outcome measures
Cesarone MR et al 2001
? same study as De Sanctis, but 2 week FU with more pt
Randomised, double-blind placebo-controlled trial T1: Essaven gel, 5cm (1g) topically applied to single foot, at 22oC, 3x/day, followed by massage for 5 min T2: Equivalent quantity of placebo, applied to skin in same way T3: no treatment (an assumption)
University vascular laboratory, Italy
T1: 12 T2: 10 T3: 13
Inclusion: diabetes mellitus, Type not stated, and neuropathy, without ulceration or history of ulceration, treated with insulin, with no other drugs in 2 weeks before treatment Exclusion: other types of microvascular diseases
T1: 56 T2: 55 T3: 56 T1: M6, F6 T2: M6, F4 T3: M6, F7
Two weeks Flux (mean value) measured with laser Doppler flowmetry over 2 min period, from 10 sites
Results
No differences at baseline by age, sex, skin flux between T1, T2, T3. Positive changes in flux measurements in T1. Average flux values T1 T2 T3 Baseline 3.4 3.2 3.3 2 weeks 1.3 2.2 3.4 No adverse side effects or dropouts. NOTE: poor study report, text contradicts itself

FINAL DRAFT
144 Clinical Guidelines for Type 2 Diabetes
Appendix 8 (contd): Dressings and topical agents: randomised trials Gels
Author(s)
Study Type of intervention Setting and
location
Numbers randomised
Inclusion criteria/ Exclusion criteria
Mean age±SD (years)
Male/female ratio Ethnicity
Follow-up period
Main outcome measures
Incandela L et al 2001
? same study as De Sanctis, but diff FU
Randomised, double-blind placebo-controlled trial T1: Essaven gel, 5cm (1g) topically applied to single foot, at 22oC, followed by massage for 5 min T2: Equivalent quantity of placebo, applied to skin in same way T3: no treatment (an assumption)
University vascular laboratory, Italy
T1: 10 T2: 11 T3: 9
Inclusion: diabetes mellitus and neuropathy, Type not stated, without ulceration or history of ulceration, treated with insulin, with no other drugs in 2 weeks before treatment Exclusion: other types of microvascular diseases
T1: 56 T2: 55 T3: 56 T1: M5, F5 T2: M7, F4 T3: M6, F3
2 hours, at 20 minute intervals, then every 40 minutes up to 10 hours
Flux (mean value) measured with laser Doppler flowmetry over 2 min period, from 10 sites
Results
No differences at baseline by age, sex, skin flux between T1, T2, T3. In T1, average flux decreased to normal values at 2 hours (p<0.02), effect still retained at 10 hours. T2 also decreased in first hour (p<0.05) but after that T2 = T3 No adverse side effects or dropouts. Local application of Essaven gel improves microcirculation
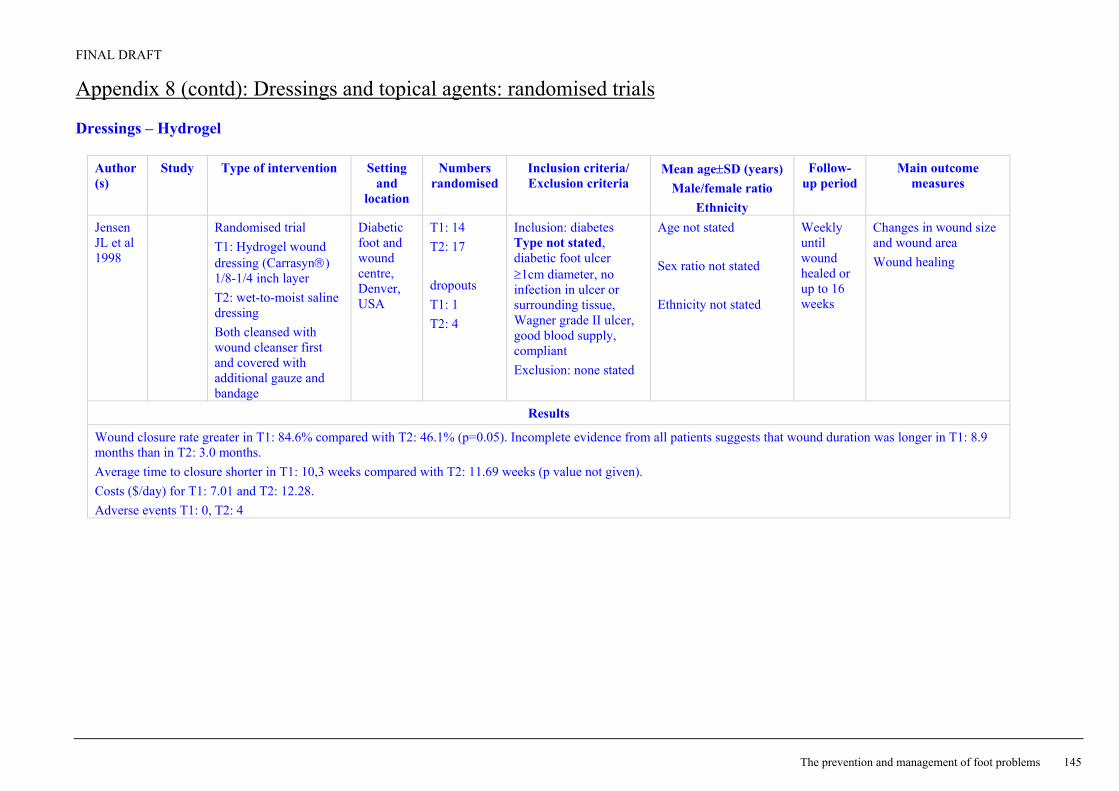
FINAL DRAFT
The prevention and management of foot problems 145
Appendix 8 (contd): Dressings and topical agents: randomised trials Dressings – Hydrogel
Author(s)
Study Type of intervention Setting and
location
Numbers randomised
Inclusion criteria/ Exclusion criteria
Mean age±SD (years) Male/female ratio
Ethnicity
Follow-up period
Main outcome measures
Jensen JL et al 1998
Randomised trial T1: Hydrogel wound dressing (Carrasyn) 1/8-1/4 inch layer T2: wet-to-moist saline dressing Both cleansed with wound cleanser first and covered with additional gauze and bandage
Diabetic foot and wound centre, Denver, USA
T1: 14 T2: 17 dropouts T1: 1 T2: 4
Inclusion: diabetes Type not stated, diabetic foot ulcer ≥1cm diameter, no infection in ulcer or surrounding tissue, Wagner grade II ulcer, good blood supply, compliant Exclusion: none stated
Age not stated Sex ratio not stated Ethnicity not stated
Weekly until wound healed or up to 16 weeks
Changes in wound size and wound area Wound healing
Results
Wound closure rate greater in T1: 84.6% compared with T2: 46.1% (p=0.05). Incomplete evidence from all patients suggests that wound duration was longer in T1: 8.9 months than in T2: 3.0 months. Average time to closure shorter in T1: 10,3 weeks compared with T2: 11.69 weeks (p value not given). Costs ($/day) for T1: 7.01 and T2: 12.28. Adverse events T1: 0, T2: 4
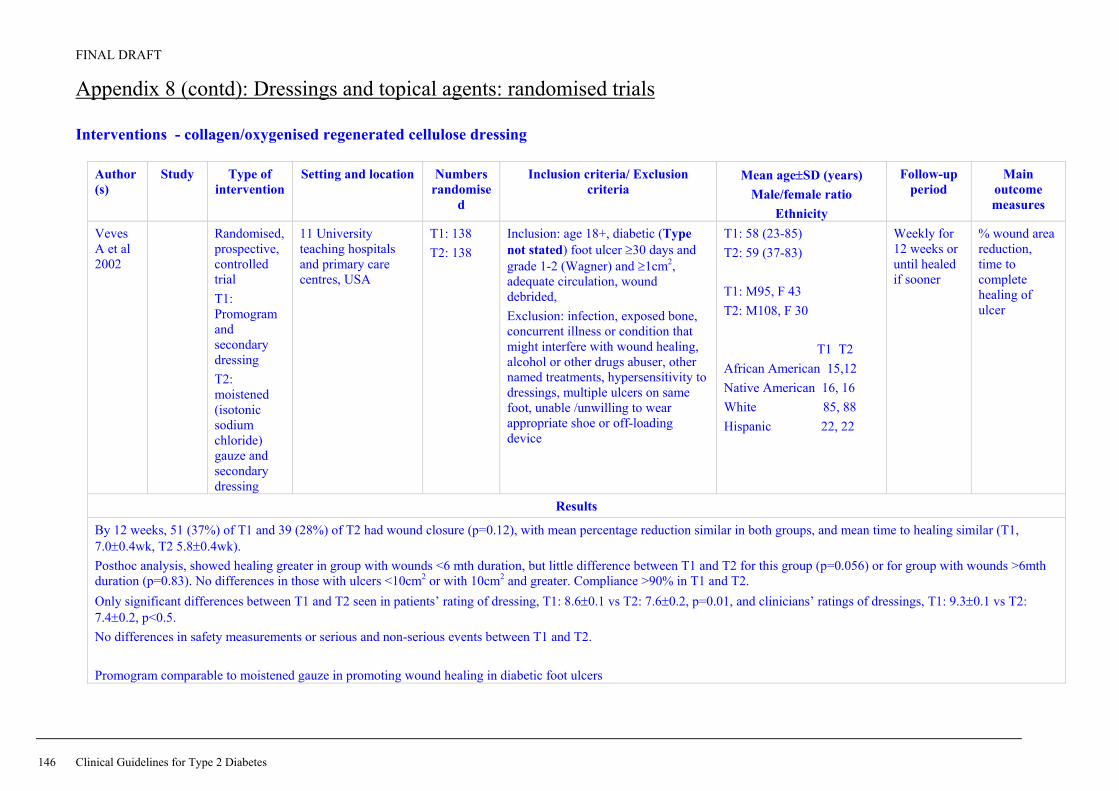
FINAL DRAFT
146 Clinical Guidelines for Type 2 Diabetes
Appendix 8 (contd): Dressings and topical agents: randomised trials Interventions - collagen/oxygenised regenerated cellulose dressing
Author(s)
Study Type of intervention
Setting and location Numbers randomise
d
Inclusion criteria/ Exclusion criteria
Mean age±SD (years) Male/female ratio
Ethnicity
Follow-up period
Main outcome measures
Veves A et al 2002
Randomised, prospective, controlled trial T1: Promogram and secondary dressing T2: moistened (isotonic sodium chloride) gauze and secondary dressing
11 University teaching hospitals and primary care centres, USA
T1: 138 T2: 138
Inclusion: age 18+, diabetic (Type not stated) foot ulcer ≥30 days and grade 1-2 (Wagner) and ≥1cm2, adequate circulation, wound debrided, Exclusion: infection, exposed bone, concurrent illness or condition that might interfere with wound healing, alcohol or other drugs abuser, other named treatments, hypersensitivity to dressings, multiple ulcers on same foot, unable /unwilling to wear appropriate shoe or off-loading device
T1: 58 (23-85) T2: 59 (37-83) T1: M95, F 43 T2: M108, F 30 T1 T2 African American 15,12 Native American 16, 16 White 85, 88 Hispanic 22, 22
Weekly for 12 weeks or until healed if sooner
% wound area reduction, time to complete healing of ulcer
Results
By 12 weeks, 51 (37%) of T1 and 39 (28%) of T2 had wound closure (p=0.12), with mean percentage reduction similar in both groups, and mean time to healing similar (T1, 7.0±0.4wk, T2 5.8±0.4wk). Posthoc analysis, showed healing greater in group with wounds <6 mth duration, but little difference between T1 and T2 for this group (p=0.056) or for group with wounds >6mth duration (p=0.83). No differences in those with ulcers <10cm2 or with 10cm2 and greater. Compliance >90% in T1 and T2. Only significant differences between T1 and T2 seen in patients’ rating of dressing, T1: 8.6±0.1 vs T2: 7.6±0.2, p=0.01, and clinicians’ ratings of dressings, T1: 9.3±0.1 vs T2: 7.4±0.2, p<0.5. No differences in safety measurements or serious and non-serious events between T1 and T2. Promogram comparable to moistened gauze in promoting wound healing in diabetic foot ulcers

FINAL DRAFT
The prevention and management of foot problems 147
Appendix 8 (contd): Dressings and topical agents: randomised trials Dressings – collagen-alginate
Author(s)
Study Type of intervention
Setting and
location
Numbers randomised
Inclusion criteria/ Exclusion criteria Mean age±SD (years)
Male/female ratio
Ethnicity
Follow-up period
Main outcome measures
Donaghue VM et al, 1998
Randomised open trial T1: collagen-alginate test dressing T2: saline-moistened gauze dressing
Boston, USA
T1: 50 T2: 25 Completed T1: 44 T2: 17 Randomisation planned as 2:1
Inclusion: diabetes Type not stated, ≥21 years of age, serum albumin >2.5g/dL, palpable pulses in lower extremities, foot ulceration ≥1cm2 after debridement. Exclusion: severe renal or liver impairment, any serious medical disorder that interferes with wound healing, osteomyelitis, infection, history of drug or alcohol abuse
T1: 59 (30-81) T2: 60 (33-79) T1: M33, F17 T2: M21, F4
Weekly until wound healed or a maximum of 8 weeks
Wound area Intention to treat analysis
Results
No differences in age, sex, duration of diabetes, duration of ulcer, ulcer size, between T1 and T2 at baseline. Mean percentage reduction in wound area T1: 80.6±6%, T2: 61.1±26% (p=0.47). Complete healing, T1: 48%, T2: 36% (p=0.39). Mean time to complete healing, T1: 6.2±0.4 weeks, T2: 5.8±0.4 weeks. Irrespective of treatment, ulcers <6 months duration healed at faster rate than those >6 months duration (P=0.0001). In multivariate analysis, using ulcer area, T1 was better than T2 (p=0.0401). Wound size, averaged over 8 weeks, was significantly reduced in T1 compared with T2 (p=0.0049). Frequency of dressing changes was higher in T2, 87.2% changed once a day, T1 52.7% (p=0.002). No difference in adverse events between T1 and T2. Collagen-alginate dressing more effective at reducing wound size than saline-moistened dressing.

FINAL DRAFT
148 Clinical Guidelines for Type 2 Diabetes
Appendix 8 (contd): Dressings and topical agents: randomised trials Dressings – sodium carboxyl-methyl-cellulose
Author(s)
Study Type of intervention Setting and
location
Numbers randomised
Inclusion criteria/ Exclusion criteria Mean age±SD (years)
Male/female ratio Ethnicity
Follow-up period
Main outcome measures
Piaggesi A et al, 2001
Randomised placebo-controlled trial T1: Hydro-fibres dressing, changed every 2-3 days T2: saline-moistened gauze dressing renewed 2x/day. Both covered with several layers of gauze, both had special pressure relieving shoes and used crutches, both had surgical debridement beforehand.
Foot clinic, Pisa, Italy
T1: 10 T2: 10
Inclusion: age 18-75, Type 1 or Type 2 > 5 years, foot ulcers > 3 weeks and >1cm wide, 1 cm deep, good peripheral blood supply, palpable peripheral pulses or ABPI>0.9. Ulcers due to diabetic neuropathy, or surgical drainage of previous infection or both. Exclusion: active infection, serum creatinine >2mg/dL, recent episodes of ketoacidosis, malignancies, any chronic pathology or systemic therapy that could obstruct wound healing, candidates for major amputation.
T1: 63.1±4.6 T2: 61.3±8.9 Sex distribution not stated Ethnicity not stated T1: Type 1: 2, Type 2: 8 T2: Type 1: 1, Type 2: 9
weekly for 8 weeks
Healing time
Results
No differences at baseline in age, Type of diabetes, duration of diabetes, duration of ulcer, size of ulcer between T1 and T2. Healing time in T1 was shorter than that in T2, T1: 127±46 days, T2: 234±61 days (p<0.001). At 8 weeks, % reduction in ulcer volume higher in T1 (26%0 compared with T2 (26%) (p<0.01). Adverse events T1: 1, T2 2, infective complications T1: 1, T2: 3 (p=0.582). Carboxyl-methyl cellulose dressings are safe, give shorter healing time than saline-moistened gauze in the treatment of non-infected deep diabetic foot ulcers.

FINAL DRAFT
The prevention and management of foot problems 149
Appendix 8 (contd): Dressings and topical agents: randomised trials Author(s) Study Type of
intervention Setting and
location Numbers
randomised Inclusion criteria/ Exclusion criteria
Mean age±SD (years)
Male/female ratio
Ethnicity
Follow-up period
Main outcome measures
Alvarez et al 2003
General foot care
Prospective, randomised, parallel group, open label, trial T1: noncontact normothermic wound therapy (wound cover serving as primary wound dressing, heating element and power supply) T2: saline dressing All had therapeutic sandals and off loading.
New York, USA T1: 10 T2: 10
Inclusion: Type 1 or 2 diabetes, neuropathic ulcer on plantar surface, ABI >0.7, palpable pulses, subcutaneous depth. Exclusion: clinical infection, osteomyelitis, cellulitis, uncontrolled diabetes, conditions that impair wound healing, specific medication/ treatments in previous month.
Mean age (range) T1: 61 (38-75) T2: 53 (47-78) M/F T1: 60/40% T2: 40/60% Type 1/Type 2 T1: 10/80 T2: 0/90
12 weeks Proportion healed
Results Note: interim analysis of ongoing study. No differences at baseline in demographics or ulcer size between T1 and T2. Non-significant difference in healing rates between T1 and T2, all p>0.05 at each week. After 6 weeks, 30% of ulcers in T1 had healed and 10% in T2 (p=0.11). At 12 weeks, the figures were 70% and 40% respectively (p=0.069). Good compliance with T1 and judged easy to use, no adverse effects in either group.

FINAL DRAFT
150 Clinical Guidelines for Type 2 Diabetes
Appendix 8 (contd): Dressings and topical agents: randomised trials – health economics Author(s) Study Type of intervention Setting and
location Numbers
randomised Inclusion criteria/ Exclusion criteria
Mean age±SD (years)
Male/female ratio
Ethnicity
Follow-up period
Main outcome measures
Ghatnekar O et al, 2002
Markov-based model for non-superficial foot ulcers adapted to compare T1: Pomogran T2: good wound care
Sweden RCT 1 year Outcomes from RCT: ulcer healing rate, number of months in healed state. Cost data from France, Germany, Switzerland, UK
Results
Promogran treatment found to be cost-saving in all 4 countries using 2000 Euro values. Tables of costs per patient in the 4 countries given for 4 ulcer states: uninfected, infected, gangrene, healed.

FINAL DRAFT
The prevention and management of foot problems 151
Appendix 9: Debridement: systematic review
Author(s)
Study Type of intervention Setting and
location
Numbers randomised
Inclusion criteria/ Exclusion criteria
Mean age±SD (years)
Male/female ratio Ethnicity
Follow-up period
Main outcome measures
Smith J, 2002
Meta-analysis of 3 studies hydrogel compared with gauze or good wound care, outcome number of ulcers completely healed
5 RCTs (3 assessed effectiveness of a hydrogel, 1 evaluated surgical debridement, 1 evaluated larval therapy vs a hydrogel) Test for heterogeneity NS
Outpatients 2 studies, rest unreported
29-172 (31, 42,140) Groups balanced at baseline demonstrated in 2 studies. Blinded outcome demonstrated in 1 study. Losses to FU reported in 4 studies
Inclusion: Type 1 or Type 2, active foot ulcer of neuropathic, neuroischaemic, or ischaemic aetiology, RCTs
Primary : (all 5 studies) wound closure (time taken, or proportions of wounds achieving complete would closure) Secondary: healing rates (3 studies)
Results
RR (95% CI) RR 1.84 (1.30, 2.61), n=51/99 hydrogel, 28/99 gauze or good wound care Systematic review comments: studies small and of poor methodological quality. Evidence suggests that hydrogel increases healing of diabetic foot ulcers compared with gauze or standard wound care. Not clear if this effect is due to debridement.
Smith J. Debridement of diabetic foot ulcers (Cochrane Review). In: The Cochrane Library, Issue 4, 2002. Oxford: Update Software Note: Search up to January 2000 so need any RCT published on debridement between February 2000 and October 2002

FINAL DRAFT
152 Clinical Guidelines for Type 2 Diabetes
Appendix 9 (contd): Debridement Author(s) Study Type of
intervention Setting and
location Numbers
randomised Inclusion criteria/ Exclusion criteria
Mean age±SD (years)
Male/female ratio
Ethnicity
Follow-up period
Main outcome measures
Saap & Falanga 2002
FOR OTHER TABLES, AN INTERVENTION FOR ALL DIABETIC FEET
Validation of a scoring system – DPI (Debridement Performance Index) to assess performance and adequacy of debridement in diabetic foot ulcers using patients in a controlled randomised trial T1: Bilayered biogengineered skin graft, up to 5 applications in 4 weeks T2: standard care – twice daily moist gauze dressings, offloading Photographs taken pre and post debridement and scored at day 0
143 patient digital photographs from T1: 78 T2: 65
Inclusion: Diabetes, Type 1 or 2, 18-80 years of age, HbA1c 6-12%, full thickness neuropathic ulcers (excluding dorsum of foot and calcaneus) ≥2 weeks, postdebridement ulcer size 1-16cm2, audible dorsalis pedis and posterior tibia pulses. Exclusion: Clinical infection at study sight, ABI<0.65, absent pulses, active Charcot’s disease, non-diabetic ulcer, other conditions that impair wound healing.
6 months
Results
Significant association between Debridement Performance Index and complete healing in T1 and T2 (p=0.0276) and significant trend with lower score and lower incidence of complete wound closure (p=0.0341). Patients with a score of 3-6 were 2.4 times more likely to heal than those with a score of 0-2. With control for treatment received, the Debridement Performance Index was an independent predictor of wound closure OR 2.4, 95% CI 1.0, 5.6.

FINAL DRAFT
The prevention and management of foot problems 153
Appendix 10: Off-loading: randomised trials
Author(s) Study Type of intervention Setting and
location
Numbers randomised
Inclusion criteria/ Exclusion criteria
Mean age±SD (years)
Male/female ratio Ethnicity
Follow-up period
Main outcome measures
Caravaggi C et al, 2000
Randomised trial T1: nonremovable total off-loading cast made of fibreglass bandages with variable rigidity T2: therapeutic shoes with rigid rocker-bottom sole with unloading sole
Milan, Italy
T1: 24 T2: 26
Inclusion: diabetes Type not stated with neuropathic plantar ulcers, insensitive to Semmes-Weinstein 5.07 monofilament and had vibration perception threshold of 25 V on malleolus. Exclusion: infection or underlying osteomyelitis, transcutaneous PO2, severe problems in maintaining equilibrium, severe visual deficit, skin lesions of foot or leg in addition to ulcer under study, limb amputation, plantar bilateral ulcerations, not on antibiotics or treated with local antiseptic.
T1: 60.5±10.7 T2: 59.2±9.9 T1: M18, F8 T2: M16, F8
30 days Ulcer size Ulcer complete healing
Results
No differences between T12 and T2 at baseline for age, sex, duration of diabetes, ulcer size (all P>0.05). At 30 days, complete ulcer healing was seen in T1: 13 compared with T2: 5 (χ2=4.61, p=0.032). Significantly faster reduction in ulcer size in T1 compared with T2 (results plotted only) (p=0.0004). No adverse events in either group. A fibreglass cast appear to promote faster reduction in ulcer size compared with a cloth shoe with a rigid sole and an unloading alkaform insole.

FINAL DRAFT
154 Clinical Guidelines for Type 2 Diabetes
Appendix 10 (contd): Off-loading: randomised trials
Author Study Type of intervention Setting and location
Numbers randomised
Inclusion criteria/Exclusion criteria
Mean age±SD (years) Male/female ratio Ethnicity
Follow up period
Main outcome measures
Armstrong DG et al, 2001
Randomised trial T1: total-contact casts T2: half shoe T3: Aircast diabetic walker
Medical Centre, Arizona, USA
T1: 19 T2: 24 T3: 20
Inclusion: diabetes Type not stated, loss of protective sensation (>25V), minimum of 1 palpable foot pulse or transcutaneous oximetry >40mmHg on forefoot, neuropathic plantar diabetic foot ulcer grade 1A Exclusion: infection, unable to walk without wheelchair assistance, wounds on foot not in plantar area, severe peripheral vascular disease.
Age not given T1: M15, F 4 T2: M20, F 4 T3: M18, F2
Weekly for 12 weeks
Proportion of complete wound healing at 12 weeks Activity level (steps /day)
Results
No differences in baseline for age, sex, duration of diabetes, size or location of wounds, duration of plantar wounds between T1 and T2 and T3. No differences in healing associated with sex (p=0.15) but healed wounds were smaller at baseline (1.1cm2±1.0 compared with 1.9±1.3, p=0.02). Proportion of healing was T1: 89.5%, T2: 58.3%, T3: 65.0%. At 12 weeks, (T1 vs T2&T3 = 89.5 vs 61.4%, p=0.026, OR 5.4, 95% CI 1.1, 26.1). Difference in cumulative wound survival at 12 weeks, T1 compared with T2 (p=0.0012), and T1 compared with T3 (p=0.033). In those who healed within the 12 weeks, the mean time to healing was T1: 33.5±5.9 vs T2: 61.0±6.5 days (p=0.005), and T1 vs T3: 50.4±7.2 days (p=0.07). T1 patients were less active (600.1±320.0 daily steps compared with T2 (1461.8±1452.3 daily steps, p=0.04) but not compared with T3 (767.6±563.3 daily steps p=0.67). or between T2 and T3 (p=0.15). The total cast appears to heal a higher proportion of wounds in a shorter amount of time than the half shoe or removable cast walker.

FINAL DRAFT
The prevention and management of foot problems 155
Appendix 10 (contd): Off-loading: randomised trials
Author(s)
Study Type of intervention Setting and
location
Numbers randomised
Inclusion criteria/ Exclusion criteria
Mean age±SD (years) Male/female ratio
Ethnicity
Follow-up period
Main outcome measures
Armstrong DG and Nguyen HC, 2000
Randomised, double-blind, placebo-controlled trial T1: pulsatile pneumatic foot compression T2: similar equipment but no compression
Texas, USA
T1: 59 T2: 56 FU T1: 52 T1: 45
Inclusion: Diabetes mellitus, Type not stated, with foot infections requiring incision and debridement Exclusion: diagnosed active congested heart failure, end-stage renal disease, serum creatinine >177µmol/L (>2.0mg/dl) on day of hospital admission, in receipt of lower-extremity by-pass graft during study period
T1: 49.3±10.3 T2: 51.8±10.2 T1: M38, F14 T2: M34, F11 T1, T2 Mexican American 45, 35 non-Hispanic White 6, 8 African American 1, 2
Weekly for 12 weeks
Wound healing
Results
No differences in age, sex, ethnicity, wound size at baseline between t1 and T2. Larger wounds (>5.0cm2) less likely to heal than smaller wounds. Higher proportion of healing in T1: 39/52, 75% vs T2: 23/45, 51% (χ2=6.0, p<0.02, odds ratio 2.9 (95% CI 1.2, 6.8) Time to healing better in T1 vs T2 but only after 8 weeks (p=). 04). No significant differences in wound size, time of use, proportion of non-compliance between T1 and T2. For T1, more patients healed in compliant group (p=0.03), for T2, no difference in healing between compliant and non-compliant groups ((p=0.10). Prolonged oedema reduction through use of intermittent compression may increase wound healing in patients with diabetes, after debridement of foot infections

FINAL DRAFT
156 Clinical Guidelines for Type 2 Diabetes
Appendix 10 (contd): Off-loading: randomised trials Trial Mueller et al, 1989
Treatment comparison(s)
T1: Total contact casting T2: Normal dressing and accommodative footwear provision
Other features T1: The ulcer was covered with a thin layer of gauze, cotton was placed between the toes to prevent maceration, a stocking applied to lower leg with felt pads, and foam pad placed around toes. The plaster shell was moulded around the lower leg, reinforced with splints and a walking heel was attached to the plantar surface. A fibreglass roll was applied around the plaster for extra durability. Casts were removed after 5–7 days for inspection, and if there were no complications the cast was reapplied and changed every 2–3 weeks. T2: Patients received wet-to-dry dressing, changed 2–3 times daily, by patient, carer or visiting nurse, and were told to avoid weight bearing. All patients received routine wound care and debridement.
Location Washington, USA Baseline comparability at p>0.05
Yes
Blinding level Not reported Concealment of allocation
Not reported
Inclusion/ exclusion
Inclusion: Diabetic patients with plantar ulcers. Exclusion: Gross infection, osteomyelitis or gangrene.
Numbers randomised
T1: 21; T2: 19
Length of follow-up
Apparently until patient discharged
Loss to follow-up (%)
T2: 2
Type of analysis
Endpoint analysis
Outcomes/ endpoints
Ulcer healed: T1: 19/21 (90%) T2: 6/19 (32%); p<0.05 Time to ulcer healed, (days, mean ±SD): T1: 42±29; T2: 65±29 Infection requiring hospitalisation: T1 0/21 (0%); T2: 5/19 (26%); p<0.05 Amputation: T1 0/21 (0%); T2: 2/19 (11%)
Economic data The authors note that the initial higher cost of total contact casting may be offset in long run because of reduction in infections, hospitalisation and amputation.