
Clinical evaluation of plasma free phenytoin measurement and factors influencing its protein binding
8
Received 21 February 2005 Accepted 27 September 2005 Copyright # 2005 John Wiley & Sons, Ltd. BIOPHARMACEUTICS & DRUG DISPOSITION Biopharm. Drug Dispos. 27: 77–84 (2006) Published online in Wiley InterScience (www.interscience.wiley.com). DOI: 10.1002/bdd.486 Clinical Evaluation of Plasma Free Phenytoin Measurement and Factors Influencing its Protein Binding Takuya Iwamoto 1, *, Yoshiyuki Kagawa 1 , Yutaka Naito 2 , Shigeki Kuzuhara 2 and Masahiro Okuda 1 1 Department of Pharmacy, Mie University Hospital, Tsu, Mie 514-8507, Japan 2 Department of Neurology, Mie University Hospital, Tsu, Mie 514-8507, Japan ABSTRACT: The relationship between free phenytoin concentrations and clinical responses, and the factors influencing protein binding of phenytoin were investigated. A total of 119 plasma samples from 70 patients treated orally with phenytoin were analysed. The mean free phenytoin concentration was significantly higher in the patients who received phenytoin monotherapy and were classified as having a complete response (1:25 1:09 mg=ml) than that in the partial response group (0:59 0:07 mg=ml), whereas the mean total concentrations were not significantly different between the two groups. Samples were divided into three groups based on the free fraction of phenytoin, i.e. low, 55%; medium, 5%–10%; high, >10%. The mean age (55:3 10:9 years) was significantly higher in the high group than in the low (42:7 21:2 years) and medium (42:8 16:0 years) groups. The mean creatinine clearance (CLcr) (55:3 10:9 ml=min) and serum albumin concentration (3:30 1:25 g=dl) were significantly lower in the high group than the low (88:3 29:0 ml=min and 4:08 0:50 g=dl, respectively) and medium (95:0 32:8 ml=min and 3:95 0:92 g=dl, respectively) groups. These results suggest that the free phenytoin concentration, rather than the total concentration, is more useful for monitoring antiepileptic effects in patients receiving phenytoin monotherapy. It was also found that the free phenytoin fraction was significantly influenced by aging, CLcr and serum albumin levels. Copyright # 2005 John Wiley & Sons, Ltd. Key words: phenytoin; free phenytoin; therapeutic drug monitoring; protein binding Introduction Phenytoin is regarded as a typical drug having nonlinear kinetics and a narrow therapeutic range [1], and requiring therapeutic drug mon- itoring (TDM) to assess compliance, evaluate the response to therapy and adjust the dosage. The TDM of phenytoin has been well established in the management of epilepsy. The accepted therapeutic range of the total phenytoin concen- trations in plasma is 10–20 mg/ml, which repre- sents the sum of the protein-free and -bound phenytoin concentrations [2,3]. Since only free phenytoin molecules can penetrate the blood– brain barrier and exert pharmacological effects [4], the free phenytoin concentration is consid- ered to better reflect clinical status than the total concentration. There are some reports insisting on the clinical usefulness of measuring the free phenytoin concentration, suggesting it to be a better marker than the total concentration for the development of side effects [5–7]. To our knowl- edge, however, only a few retrospective studies have been conducted on the relationship between the free phenytoin concentration and antiepilep- tic effects [6,8]. Usually only the total phenytoin concentration is measured, from which the free concentration is *Correspondence to: Department of Pharmacy, Mie University Hospital, 2-174 Edobashi, Tsu, Mie 514-8507, Japan. E-mail: [email protected]
-
Upload
takuya-iwamoto -
Category
Documents
-
view
212 -
download
0
Transcript of Clinical evaluation of plasma free phenytoin measurement and factors influencing its protein binding
Received 21 February 2005Accepted 27 September 2005Copyright # 2005 John Wiley & Sons, Ltd.
BIOPHARMACEUTICS & DRUG DISPOSITIONBiopharm. Drug Dispos. 27: 77–84 (2006)
Published online in Wiley InterScience (www.interscience.wiley.com). DOI: 10.1002/bdd.486
Clinical Evaluation of Plasma Free Phenytoin Measurementand Factors Influencing its Protein Binding
Takuya Iwamoto1,*, Yoshiyuki Kagawa1, Yutaka Naito2, Shigeki Kuzuhara2 and Masahiro Okuda1
1 Department of Pharmacy, Mie University Hospital, Tsu, Mie 514-8507, Japan2 Department of Neurology, Mie University Hospital, Tsu, Mie 514-8507, Japan
ABSTRACT: The relationship between free phenytoin concentrations and clinical responses, andthe factors influencing protein binding of phenytoin were investigated. A total of 119 plasmasamples from 70 patients treated orally with phenytoin were analysed. The mean free phenytoinconcentration was significantly higher in the patients who received phenytoin monotherapy andwere classified as having a complete response (1:25� 1:09 mg=ml) than that in the partial responsegroup (0:59� 0:07 mg=ml), whereas the mean total concentrations were not significantly differentbetween the two groups. Samples were divided into three groups based on the free fraction ofphenytoin, i.e. low, 55%; medium, 5%–10%; high, >10%. The mean age (55:3� 10:9 years) wassignificantly higher in the high group than in the low (42:7� 21:2 years) and medium (42:8� 16:0years) groups. The mean creatinine clearance (CLcr) (55:3� 10:9 ml=min) and serum albuminconcentration (3:30� 1:25 g=dl) were significantly lower in the high group than the low(88:3� 29:0 ml=min and 4:08� 0:50 g=dl, respectively) and medium (95:0� 32:8 ml=min and3:95� 0:92 g=dl, respectively) groups. These results suggest that the free phenytoin concentration,rather than the total concentration, is more useful for monitoring antiepileptic effects in patientsreceiving phenytoin monotherapy. It was also found that the free phenytoin fraction wassignificantly influenced by aging, CLcr and serum albumin levels. Copyright # 2005 John Wiley &Sons, Ltd.
Key words: phenytoin; free phenytoin; therapeutic drug monitoring; protein binding
Introduction
Phenytoin is regarded as a typical drug havingnonlinear kinetics and a narrow therapeuticrange [1], and requiring therapeutic drug mon-itoring (TDM) to assess compliance, evaluate theresponse to therapy and adjust the dosage. TheTDM of phenytoin has been well established inthe management of epilepsy. The acceptedtherapeutic range of the total phenytoin concen-trations in plasma is 10–20 mg/ml, which repre-sents the sum of the protein-free and -bound
phenytoin concentrations [2,3]. Since only freephenytoin molecules can penetrate the blood–brain barrier and exert pharmacological effects[4], the free phenytoin concentration is consid-ered to better reflect clinical status than the totalconcentration. There are some reports insistingon the clinical usefulness of measuring the freephenytoin concentration, suggesting it to be abetter marker than the total concentration for thedevelopment of side effects [5–7]. To our knowl-edge, however, only a few retrospective studieshave been conducted on the relationship betweenthe free phenytoin concentration and antiepilep-tic effects [6,8].
Usually only the total phenytoin concentrationis measured, from which the free concentration is
*Correspondence to: Department of Pharmacy, Mie UniversityHospital, 2-174 Edobashi, Tsu, Mie 514-8507, Japan.E-mail: [email protected]
predicted. Although the free fraction of pheny-toin is assumed to be 5%–10% under normalconditions [9], recent studies have supported themeasurement of free drug concentrations for thereason that there are many factors influencing thefree fraction of phenytoin [10,11]. Several factorsare known to reduce the protein binding ofphenytoin in plasma, including hypoalbumine-mia [12,13], renal failure [6] and the concomitantuse of drugs that displace phenytoin from itsplasma binding site [11,14]. Therefore, it wasconsidered difficult to estimate accurately thefree phenytoin concentration from the totalconcentration.
This study compared the relationship betweenthe total or free phenytoin concentration inplasma and antiepileptic effects in order to assessthe usefulness of monitoring the free concentra-tions of phenytoin. Furthermore, the factors thatinfluence the free phenytoin fraction were in-vestigated.
Methods
Precision and accuracy of free phenytoin mea-surements
Precision and accuracy studies for free phenytoinconcentrations were performed using threeweighed-in serum concentrations. Phenytoinpurchased from Wako Pure Chemical Industries(Osaka, Japan) was weighed, dissolved in 20 ml ofmethanol, and then diluted with 180 ml ofdistilled water. This mixture was further dilutedten-fold with patients’ protein-free serum, whichhad been ultrafiltrated with an Ultrafree-MCmembrane (Millipore Corporation, Billerica, MA)in a 5000g centrifuge at room temperature. Eachweighed-in phenytoin sample was measuredfive times with a TDx analyser (Abbott JapanCorporation, Tokyo, Japan).
Subjects and phenytoin measurements
Total and free phenytoin concentrations weremeasured in 119 plasma samples from 70 patientsreceiving oral phenytoin (Aleviatin1, DainipponPharmaceutical Co. Ltd, Osaka, Japan) for morethan 7 days (Table 1). This study involved no
patients who switched from monotherapy tomultidrug therapy. All patients received theTDM service in Mie University Hospital fromJune 2002 to June 2004. The plasma concentra-tions of total and free phenytoin were measuredwith the TDx analyser. According to the packageinsert of the TDx, this method has a coefficient ofvariation (CV) of less than 3% for both between-run and within-run imprecision. Since the lowerlimit of detection was 0.5 mg/ml, blood samples(n ¼ 8) of less than 0.5 mg/ml were excluded inthis study. Specimens were assayed according tothe manufacturer’s instructions. Linear regres-sion analysis and the Pearson correlation coeffi-cient were used to assess the relationshipbetween the total and free phenytoin concentra-tions in the patient blood samples. To examinewhether the free phenytoin concentrations werepredictable based on the total drug concentrationand serum albumin level, the relationshipbetween the free phenytoin concentration andthe [total phenytoin]/[serum albumin] ratio [15]was investigated.
Relationship between total or free phenytoinconcentrations and clinical responses
A total of 119 plasma samples from 70 patientswere classified into three groups, those showing
Table 1. Patient demographic characteristics and phenytoinconcentrations
No. of samples 119No. of patients (male/female) 70 (45/25)Agea (years) 44 [12–87]Type of seizure (no. of patients)
Generalized seizures (tonic-clonic/absence)
22 (18/4)
Partial seizures (simple/complex) 48 (11/37)Phenytoin dosage regimen (no. ofsamples/patients)
Monotherapy 54/33Multidrug therapy 65/37
Daily dose of phenytoina (mg/kg) 4.3 [2.3–12.8]Plasma phenytoin concentrationa
Total (mg/ml) 14.2 [1.9–29.9]Free (mg/ml) 0.68 [0.50–5.09]Free fraction (%) 5.63 [2.13–26.3]
Creatinine clearancea (ml/min) 84.4 [7.9–157.1]Serum albumin levela (g/dl) 4.1 [1.9–6.4]
Creatinine clearance was estimated using the Cockcroft-Gault
equation.a Data are expressed as the median [range].
Copyright # 2005 John Wiley & Sons, Ltd. Biopharm. Drug Dispos. 27: 77–84 (2006)
T. IWAMOTO ET AL.78
a complete response (CR), partial response (PR)and no response (NR) as determined by thephysicians in charge based on the clinicalcondition and electroencephalography. The CRgroup included 34 patients (51 samples) who hadmaintained a seizure-free status or markedimprovement of the clinical status during phe-nytoin therapy. The PR group included 19patients (33 samples) whose seizure frequencywas reduced or electroencephalography wasimproved on a monthly basis, but they stillexperienced seizures during phenytoin therapy.The NR group included three patients (threesamples) whose seizure frequency did notchange during phenytoin therapy. The clinicalresponses to phenytoin could not be evaluated infor 32 samples, because these samples weredrawn within 1 month after the start of pheny-toin therapy or changes in seizure frequencywere not written in the patient’s medical records.These groups were further divided based on thetreatment regimen, i.e. monotherapy or multi-drug therapy. Also compared were the mean age,type of seizures, seizure frequency, daily dose ofphenytoin, total and free phenytoin concentra-tions, creatinine clearance (CLcr) and serumalbumin among the groups.
Factors influencing free fraction of phenytoin
To investigate the factors influencing the freefraction of phenytoin, 119 plasma samples from70 patients were divided into three groups basedon the free phenytoin fraction, i.e. low, 55%(n ¼ 43), medium, 5%–10% (n ¼ 52) and high,>10% (n ¼ 24). The sample numbers obtainedrepeatedly from the same patients were 13 of 43samples for the low, 14 of 52 samples for themedium, and 11 of 24 samples for the high group.Age, CLcr, serum albumin concentrations, con-comitant use of drugs that might inhibit pheny-toin-albumin binding, such as warfarin, sodiumvalproate and furosemide, and daily doses ofphenytoin were compared among the threegroups. All data are given as the mean� SD.
Statistical analyses
The Scheffe test and Mann-Whitney U-test wereused to compare the data from three and two
groups, respectively. A p value of less than 0.05was considered statistically significant.
Results
Precision and accuracy of free phenytoin mea-surements
Precision and accuracy studies for free phenytoinconcentrations were performed using threeweighed-in serum concentrations. All CV valuesobtained from the TDx analyser were less than8% at the weighed-in concentrations of 0.5, 1.0and 2.0 mg/ml. The accuracy relative to the threeweighed-in concentrations was within the rangeof 95%–117%.
Relationship between total and free phenytoinconcentrations in patient blood samples
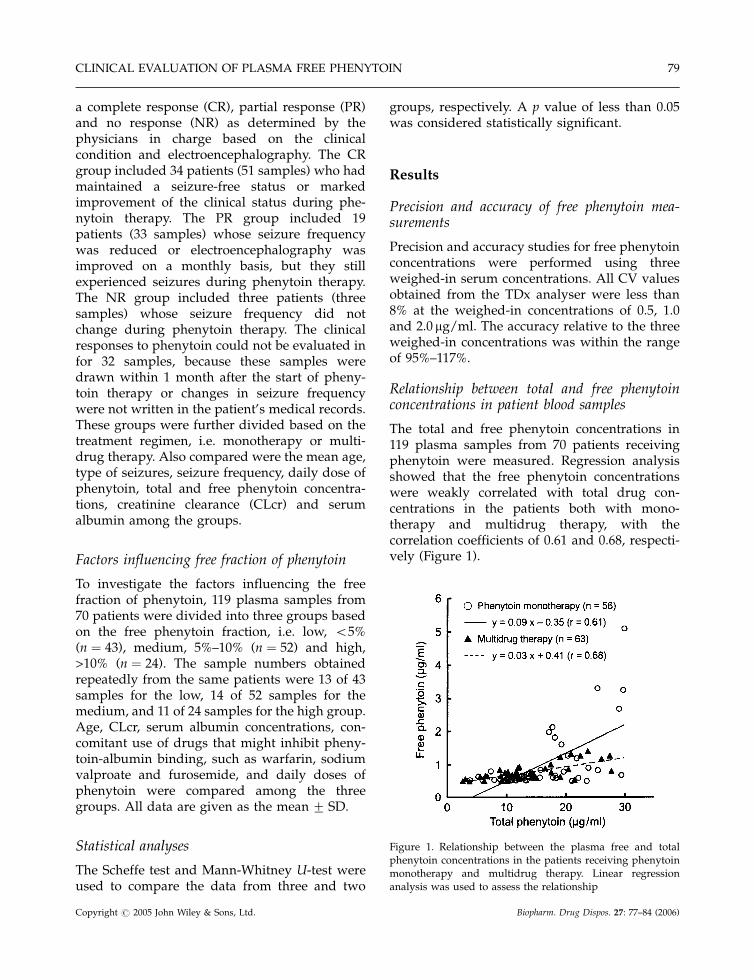
The total and free phenytoin concentrations in119 plasma samples from 70 patients receivingphenytoin were measured. Regression analysisshowed that the free phenytoin concentrationswere weakly correlated with total drug con-centrations in the patients both with mono-therapy and multidrug therapy, with thecorrelation coefficients of 0.61 and 0.68, respecti-vely (Figure 1).
Figure 1. Relationship between the plasma free and totalphenytoin concentrations in the patients receiving phenytoinmonotherapy and multidrug therapy. Linear regressionanalysis was used to assess the relationship
Copyright # 2005 John Wiley & Sons, Ltd. Biopharm. Drug Dispos. 27: 77–84 (2006)
CLINICAL EVALUATION OF PLASMA FREE PHENYTOIN 79
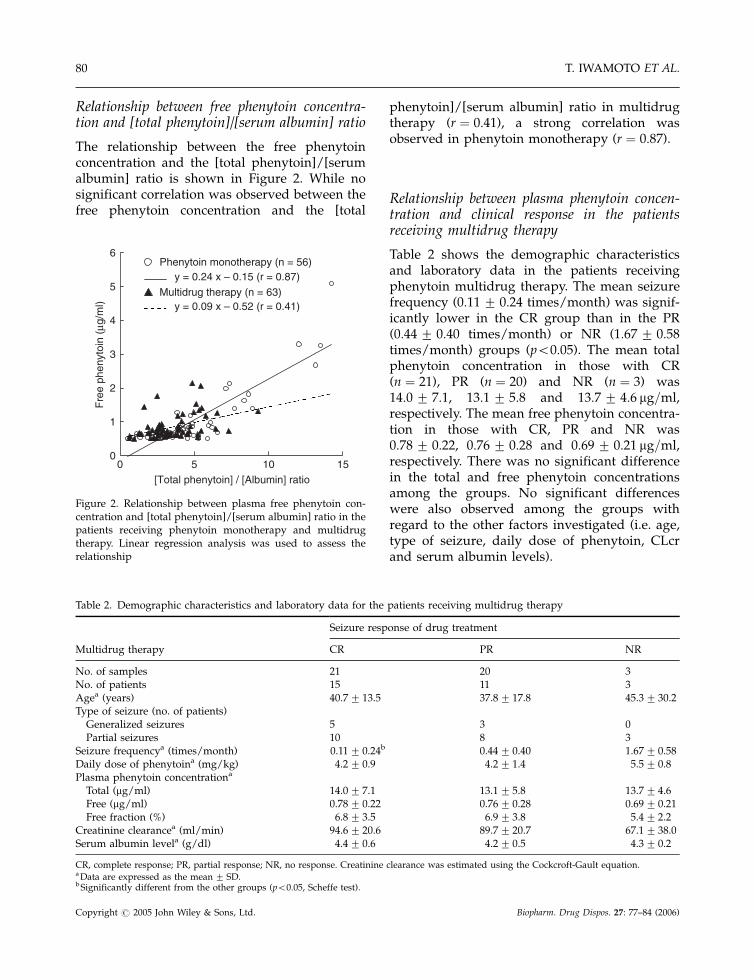
Relationship between free phenytoin concentra-tion and [total phenytoin]/[serum albumin] ratio
The relationship between the free phenytoinconcentration and the [total phenytoin]/[serumalbumin] ratio is shown in Figure 2. While nosignificant correlation was observed between thefree phenytoin concentration and the [total
phenytoin]/[serum albumin] ratio in multidrugtherapy (r ¼ 0:41), a strong correlation wasobserved in phenytoin monotherapy (r ¼ 0:87).
Relationship between plasma phenytoin concen-tration and clinical response in the patientsreceiving multidrug therapy
Table 2 shows the demographic characteristicsand laboratory data in the patients receivingphenytoin multidrug therapy. The mean seizurefrequency (0:11� 0:24 times/month) was signif-icantly lower in the CR group than in the PR(0:44� 0:40 times/month) or NR (1:67� 0:58times/month) groups (p50:05). The mean totalphenytoin concentration in those with CR(n ¼ 21), PR (n ¼ 20) and NR (n ¼ 3) was14:0� 7:1, 13:1� 5:8 and 13:7� 4:6 mg=ml,respectively. The mean free phenytoin concentra-tion in those with CR, PR and NR was0:78� 0:22, 0:76� 0:28 and 0:69� 0:21 mg=ml,respectively. There was no significant differencein the total and free phenytoin concentrationsamong the groups. No significant differenceswere also observed among the groups withregard to the other factors investigated (i.e. age,type of seizure, daily dose of phenytoin, CLcrand serum albumin levels).
Table 2. Demographic characteristics and laboratory data for the patients receiving multidrug therapy
Seizure response of drug treatment
Multidrug therapy CR PR NR
No. of samples 21 20 3No. of patients 15 11 3Agea (years) 40.7� 13.5 37.8� 17.8 45.3� 30.2Type of seizure (no. of patients)
Generalized seizures 5 3 0Partial seizures 10 8 3
Seizure frequencya (times/month) 0.11� 0.24b 0.44� 0.40 1.67� 0.58Daily dose of phenytoina (mg/kg) 4.2� 0.9 4.2� 1.4 5.5� 0.8Plasma phenytoin concentrationa
Total (mg/ml) 14.0� 7.1 13.1� 5.8 13.7� 4.6Free (mg/ml) 0.78� 0.22 0.76� 0.28 0.69� 0.21Free fraction (%) 6.8� 3.5 6.9� 3.8 5.4� 2.2
Creatinine clearancea (ml/min) 94.6� 20.6 89.7� 20.7 67.1� 38.0Serum albumin levela (g/dl) 4.4� 0.6 4.2� 0.5 4.3� 0.2
CR, complete response; PR, partial response; NR, no response. Creatinine clearance was estimated using the Cockcroft-Gault equation.a Data are expressed as the mean� SD.b Significantly different from the other groups (p50:05, Scheffe test).
0
1
2
3
4
5
6
0 5 10 15[Total phenytoin] / [Albumin] ratio
Fre
e ph
enyt
oin
(µg/
ml)
Phenytoin monotherapy (n = 56) y = 0.24 x – 0.15 (r = 0.87)
Multidrug therapy (n = 63) y = 0.09 x – 0.52 (r = 0.41)
Figure 2. Relationship between plasma free phenytoin con-centration and [total phenytoin]/[serum albumin] ratio in thepatients receiving phenytoin monotherapy and multidrugtherapy. Linear regression analysis was used to assess therelationship
Copyright # 2005 John Wiley & Sons, Ltd. Biopharm. Drug Dispos. 27: 77–84 (2006)
T. IWAMOTO ET AL.80
Relationship between plasma phenytoin concen-tration and clinical response in the patientsreceiving phenytoin monotherapy
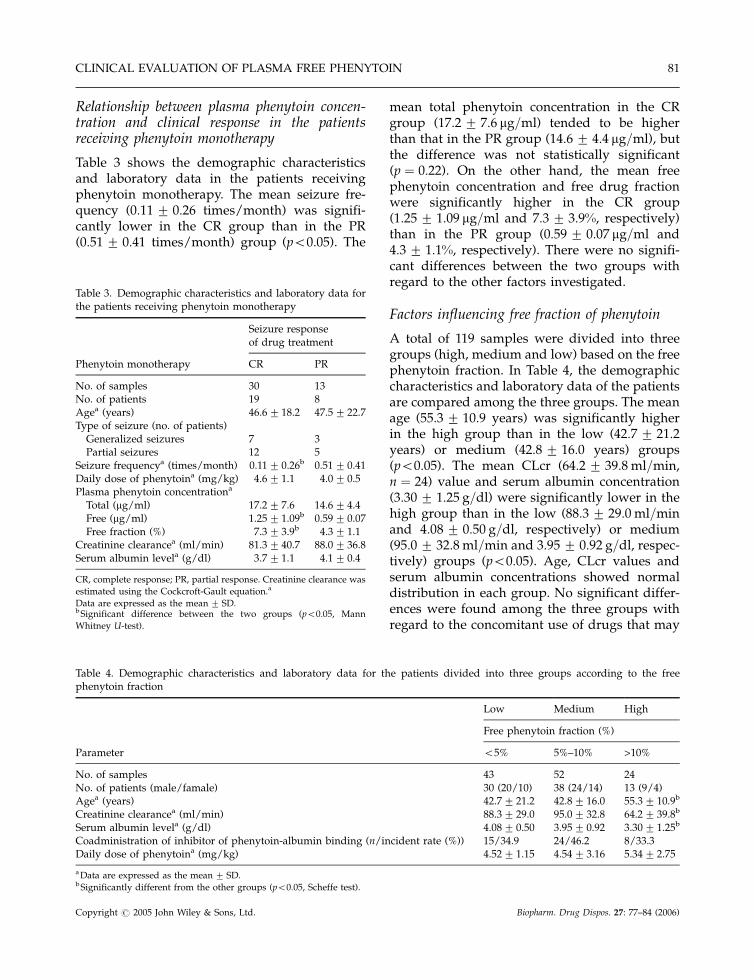
Table 3 shows the demographic characteristicsand laboratory data in the patients receivingphenytoin monotherapy. The mean seizure fre-quency (0:11� 0:26 times/month) was signifi-cantly lower in the CR group than in the PR(0:51� 0:41 times/month) group (p50:05). The
mean total phenytoin concentration in the CRgroup (17:2� 7:6 mg=ml) tended to be higherthan that in the PR group (14:6� 4:4 mg=ml), butthe difference was not statistically significant(p ¼ 0:22). On the other hand, the mean freephenytoin concentration and free drug fractionwere significantly higher in the CR group(1:25� 1:09 mg=ml and 7:3� 3:9%, respectively)than in the PR group (0:59� 0:07 mg=ml and4:3� 1:1%, respectively). There were no signifi-cant differences between the two groups withregard to the other factors investigated.
Factors influencing free fraction of phenytoin
A total of 119 samples were divided into threegroups (high, medium and low) based on the freephenytoin fraction. In Table 4, the demographiccharacteristics and laboratory data of the patientsare compared among the three groups. The meanage (55:3� 10:9 years) was significantly higherin the high group than in the low (42:7� 21:2years) or medium (42:8� 16:0 years) groups(p50:05). The mean CLcr (64:2� 39:8 ml=min,n ¼ 24) value and serum albumin concentration(3:30� 1:25 g=dl) were significantly lower in thehigh group than in the low (88:3� 29:0 ml=minand 4:08� 0:50 g=dl, respectively) or medium(95:0� 32:8 ml=min and 3:95� 0:92 g=dl, respec-tively) groups (p50:05). Age, CLcr values andserum albumin concentrations showed normaldistribution in each group. No significant differ-ences were found among the three groups withregard to the concomitant use of drugs that may
Table 3. Demographic characteristics and laboratory data forthe patients receiving phenytoin monotherapy
Seizure responseof drug treatment
Phenytoin monotherapy CR PR
No. of samples 30 13No. of patients 19 8Agea (years) 46.6� 18.2 47.5� 22.7Type of seizure (no. of patients)
Generalized seizures 7 3Partial seizures 12 5
Seizure frequencya (times/month) 0.11� 0.26b 0.51� 0.41Daily dose of phenytoina (mg/kg) 4.6� 1.1 4.0� 0.5Plasma phenytoin concentrationa
Total (mg/ml) 17.2� 7.6 14.6� 4.4Free (mg/ml) 1.25� 1.09b 0.59� 0.07Free fraction (%) 7.3� 3.9b 4.3� 1.1
Creatinine clearancea (ml/min) 81.3� 40.7 88.0� 36.8Serum albumin levela (g/dl) 3.7� 1.1 4.1� 0.4
CR, complete response; PR, partial response. Creatinine clearance was
estimated using the Cockcroft-Gault equation.a
Data are expressed as the mean� SD.b Significant difference between the two groups (p50:05, Mann
Whitney U-test).
Table 4. Demographic characteristics and laboratory data for the patients divided into three groups according to the freephenytoin fraction
Low Medium High
Free phenytoin fraction (%)
Parameter 55% 5%–10% >10%
No. of samples 43 52 24No. of patients (male/famale) 30 (20/10) 38 (24/14) 13 (9/4)Agea (years) 42.7� 21.2 42.8� 16.0 55.3� 10.9b
Creatinine clearancea (ml/min) 88.3� 29.0 95.0� 32.8 64.2� 39.8b
Serum albumin levela (g/dl) 4.08� 0.50 3.95� 0.92 3.30� 1.25b
Coadministration of inhibitor of phenytoin-albumin binding (n/incident rate (%)) 15/34.9 24/46.2 8/33.3Daily dose of phenytoina (mg/kg) 4.52� 1.15 4.54� 3.16 5.34� 2.75
a Data are expressed as the mean� SD.b Significantly different from the other groups (p50:05, Scheffe test).
Copyright # 2005 John Wiley & Sons, Ltd. Biopharm. Drug Dispos. 27: 77–84 (2006)
CLINICAL EVALUATION OF PLASMA FREE PHENYTOIN 81
inhibit the binding of phenytoin to albumin, anddaily doses of phenytoin.
Discussion
It is generally recognized that only free pheny-toin molecules are pharmacologically active. Thedevelopment of side effects has been reported tocorrelate better with free phenytoin than totalphenytoin [5–7]. Banh et al. showed that mostpatients who developed phenytoin toxicity had anormal or low total phenytoin concentration butan elevated free serum phenytoin concentration[7]. There have been only a limited number ofstudies with regard to the relationship betweenthe free phenytoin concentration and antiepilep-tic effects [6,8]. Peterson et al. showed that thetotal concentration provided as good an indica-tion of clinical response as the free phenytoinconcentration in 85.8% of the patients evaluated,while in the remaining patients (14.2%), the freeserum phenytoin concentrations were betterindices of the drug’s clinical effect [6]. This resultimplies that the total phenytoin concentrationalone does not provide enough information withwhich to monitor antiepileptic effects. Theodoreet al. did not find a relationship between the freephenytoin concentrations and the weekly seizurefrequency [8]. Their study included patientsreceiving both monotherapy and multidrugtherapy with phenytoin, and therefore mightnot have been able to evaluate the single effectsof phenytoin with accuracy.
The present study showed that in patientsreceiving phenytoin monotherapy to treat gen-eralized or partial seizures, the mean freephenytoin concentration and the free drug frac-tion of the CR group were significantly higherthan that of the PR group. Although the meantotal phenytoin concentration of the CR groupwas also higher, a significant difference was notobserved between the two groups. This resultindicates that the free phenytoin concentrationtended to reflect the antiepileptic effect betterthan the total concentrations in the patientsrelatively sensitive to phenytoin monotherapy.A well-known therapeutic range of the freephenytoin concentration is 1.0–2.0. This study
shows that good clinical responses were ob-served in the patients receiving phenytoin mono-therapy with free drug concentrations above1.0 mg/ml. Therefore, it is proposed that the freephenytoin concentration should be raised above1.0 mg/ml when the clinical response to pheny-toin monotherapy is insufficient. However, nocorrelation was found between clinical responsesand free phenytoin concentrations in the patientsreceiving multidrug therapy. Since these patientshad not exhibited good responses to an anti-epileptic monotherapy, a combination of two ormore drugs might be required to optimizeseizure control. Therefore, several factors besidesthe free phenytoin concentration were consideredto influence the antiepileptic effects in patientsreceiving multidrug therapy, including pharma-codynamic interactions with other antiepilepticdrugs and seizure severity.
It was shown that a weak correlation existsbetween the plasma free and total phenytoinconcentrations in the patients receiving pheny-toin monotherapy and those receiving multidrugtherapy. Because our data excluded the plasmasamples of free phenytoin concentrations lessthan 0.5 mg/ml, the free drug fraction was some-what higher in the low concentration range oftotal phenytoin. The exclusion of such samplesmight be one of the reasons for the weakcorrelation between the plasma free and totalphenytoin concentrations. Dasgupta et al. re-ported that the free phenytoin concentrationand the [total phenytoin]/[serum albumin] ratiomay have clinical value in predicting freephenytoin concentrations in the majority ofpatients with normal or elevated levels of serumalbumin [15]. Although our data include plasmasamples with hypoalbuminemia as well asnormal or hyperalbuminemia, a strong correla-tion was found between the free phenytoinconcentration and [total phenytoin]/[serumalbumin] ratio in the patients receiving pheny-toin monotherapy. It was also shown that themean serum albumin concentration was signifi-cantly lower in the patients with a high freefraction of phenytoin (>10%) than those with anormal or low free fraction (2.1%–10%). Theseresults strongly indicate that serum albuminconcentration is an important determinant ofthe protein binding of phenytoin in the patients
Copyright # 2005 John Wiley & Sons, Ltd. Biopharm. Drug Dispos. 27: 77–84 (2006)
T. IWAMOTO ET AL.82
receiving phenytoin monotherapy. The freephenytoin concentrations are considered to bepredictable by the total drug concentrations andserum albumin levels.
It was also found that the patients with a highfree fraction of phenytoin had significantly lowerCLcr values than those with a normal or low freephenytoin fraction. Liponi et al. attempted todefine the relationship between the free pheny-toin fraction and renal impairment, showing thata decrease in protein binding of phenytoin wasapparent in patients whose CLcr levels werebelow 25 ml/min [16]. Although the mechanismof the decrease in phenytoin protein bindingremains unclear, a study suggested that anaccumulation of an endogenous ligand, 3-car-boxy-4-methyl-5-propyl-2-furanpropanoic acid,may be as important as or more important thanalbumin concentrations in explaining the alteredphenytoin protein binding that was observed inthe patients with renal dysfunction [17]. Renaldysfunction often accompanies low albuminconcentrations. In fact, many of the patients withhypoalbuminemia had low CLcr values in ourstudy. However, the regression analysis indicatedthat no significant correlation (r ¼ 0:2) wasobserved between serum albumin and CLcrlevels in our study (data not shown). Therefore,it is assumed that the influence of CLcr levels onthe protein binding of phenytoin is independentof the serum albumin levels.
It was also shown that the mean age wassignificantly higher in the patients with a highfree fraction of phenytoin than those with anormal or low free fraction. Although severalstudies have assessed the influence of age on thebinding of phenytoin to albumin, all concludedthat aging was not a contributing factor in theaffinity of phenytoin for albumin [18–20]. Thisresult may suggest that the free fraction ofphenytoin in the elderly increased in proportionto the decrease in the serum albumin concentra-tion and CLcr level. Since the mean free fractionof phenytoin increases with aging, pharmacolo-gical effects may appear at lower total concentra-tions in the elderly than in the young.
In conclusion, our results suggest that the freephenytoin concentration is more useful than thetotal concentration for monitoring antiepilepticeffects in patients receiving phenytoin monother-
apy. In addition, it was found that the freephenytoin fraction was significantly influencedby aging, CLcr and serum albumin values. Thisstudy was performed retrospectively using med-ical records of patients receiving phenytoin, and acontrolled clinical trial will provide more informa-tion about the clinical benefits of monitoring freephenytoin concentrations in patients with epilepsy.
References
1. Nuwer MR, Browne TR, Dodson WE, et al. Genericsubstitutions for antiepileptic drugs. Neurology 1990; 40:1647–1651.
2. Kutt H, McDowell F. Management of epilepsy withdiphenylhydantoin sodium. Dosage regulation for pro-blem patients. JAMA 1968; 203: 969–972.
3. Lund M, Jorgensen RS, Kuehl V. Serum diphenylhydan-toin (phenytoin) in ambulant patients with epilepsy.Epilepsia 1964; 5: 51–58.
4. Soldin SJ. Free drug measurements. When and why? Anoverview. Arch Pathol Lab Med 1999; 123: 822–823.
5. DeMonaco HJ, Lawless LM. Variability of phenytoinprotein binding in epileptic patients. Arch Neurol 1983;40: 481–483.
6. Peterson GM, Khoo BH, von Witt RJ. Clinical responsein epilepsy in relation to total and free serum levels ofphenytoin. Ther Drug Monit 1991; 13: 415–419.
7. Banh HL, Burton ME, Sperling MR. Interpatient andintrapatient variability in phenytoin protein binding. TherDrug Monit 2002; 24: 379–385.
8. Theodore WH, Yu L, Price B, et al. The clinicalvalue of free phenytoin levels. Ann Neurol 1985; 18:90–93.
9. May TW, Rambeck B, Jurges U, Blankenhorn V, Jurgens U.Comparison of total and free phenytoin serum concentra-tions measured by high-performance liquid chromatogra-phy and standard TDx assay: implications for theprediction of free phenytoin serum concentrations. TherDrug Monit 1998; 20: 619–623.
10. Lenn NJ, Robertson M. Clinical utility of unboundantiepileptic drug blood levels in the management ofepilepsy. Neurology 1992; 42: 988–990.
11. Burt M, Anderson DC, Kloss J, Apple FS. Evidence-basedimplementation of free phenytoin therapeutic drugmonitoring. Clin Chem 2000; 46: 1132–1135.
12. Fedler C, Stewart MJ. Plasma total phenytoin: a possiblymisleading test in developing countries. Ther Drug Monit1999; 21: 155–160.
13. Levine M, Chang T. Therapeutic drug monitoring ofphenytoin. Rationale and current status. Clin Pharmacoki-net 1990; 19: 341–358.
14. Kilpatrick CJ, Wanwimolruk S, Wing LM. Plasma con-centrations of unbound phenytoin in the management ofepilepsy. Br J Clin Pharmacol 1984; 17: 539–546.
Copyright # 2005 John Wiley & Sons, Ltd. Biopharm. Drug Dispos. 27: 77–84 (2006)
CLINICAL EVALUATION OF PLASMA FREE PHENYTOIN 83
15. Dasgupta A, Dennen DA, Dean R, McLawhon RW.Prediction of free phenytoin levels based on [totalphenytoin]/[albumin] ratios. Potential errors with hy-poalbuminemia. Am J Clin Pathol 1991; 95: 253–256.
16. Liponi DF, Winter ME, Tozer TN. Renal function andtherapeutic concentrations of phenytoin. Neurology 1984;34: 395–397.
17. Mabuchi H, Nakahashi H. A major inhibitor of phenytoinbinding to serum protein in uremia. Nephron 1988; 48:310–314.
18. Bender AD, Post A, Meier JP, Higson JE, Reichard G Jr.Plasma protein binding of drugs as a function ofage in adult human subjects. J Pharm Sci 1975; 64:1711–1713.
19. Patterson M, Heazelwood R, Smithurst B, Eadie MJ.Plasma protein binding of phenytoin in the aged: in vivostudies. Br J Clin Pharmacol 1982; 13: 423–425.
20. Baird-Lambert J, Manglick MP, Wall M, Buchanan N.Identifying patients who might benefit from free pheny-toin monitoring. Ther Drug Monit 1987; 9: 134–138.
Copyright # 2005 John Wiley & Sons, Ltd. Biopharm. Drug Dispos. 27: 77–84 (2006)
T. IWAMOTO ET AL.84


![Research Paper The Circadian Clock Gene Bmal1 Controls ... · embryonic factor) and DBP (D-site binding protein) as well as E4BP4 (E4 promoter-binding protein 4)] ... influencing](https://static.fdocuments.net/doc/165x107/604a8989f9ae380cc8298336/research-paper-the-circadian-clock-gene-bmal1-controls-embryonic-factor-and.jpg)

