
Clinic-based Family Planning and Reproductive Health ... · not sold for profit. Population Council...
266
Clinic-Based Family Planning and Reproductive Health Services in Africa: Findings from Situation Analysis Studies E D I T O R S Kate Miller • Robert Miller • Ian Askew Marjorie C. Horn • Lewis Ndhlovu
Transcript of Clinic-based Family Planning and Reproductive Health ... · not sold for profit. Population Council...
Clinic-Based Family Planningand Reproductive Health Servicesin Africa: Findings fromSituation Analysis Studies
E D I T O R S
Kate Miller • Robert Miller • Ian AskewMarjorie C. Horn • Lewis Ndhlovu

Clinic-Based Family Planning and Reproductive Health Servicesin Africa: Findings fromSituation Analysis Studies
EDITORS
Kate Miller • Robert Miller • Ian Askew Marjorie C. Horn • Lewis Ndhlovu
Africa Operations Research and Technical Assistance Project
U.S. AGENCY FORINTERNATIONALDEVELOPMENT

The Population Council seeks to improve the wellbeing and reproductive healthof current and future generations around the world and to help achieve ahumane, equitable, and sustainable balance between people and resources. TheCouncil, a nonprofit, nongovernmental research organization established in1952, has a multinational board of trustees; its New York headquarters supportsa global network of regional and country offices.
Population CouncilOne Dag Hammarskjold PlazaNew York, New York 10017 USAtel: (212) 339-0500fax: (212) 755-6052e-mail: [email protected]
© 1998 by The Population Council, Inc.
Any part of this document may be reproduced without permission so long as it isnot sold for profit.
Population Council Cataloging-in-Publication Data
Clinic-based family planning and reproductive health services in Africa : findings from situation analysis studies / by Kate Miller, Robert Miller, Ian Askew, Marjorie C. Horn and Lewis Ndhlovu. ; forewords by Elizabeth Maguire and Ayo Ajayi. Ñ New York : The Population Council, 1998.
p. cm.ISBN 0-87834-094-7
1. Birth control programs Ñ Africa. 2. Women Ñ Health and Hygiene ÑAfrica. I. Miller, Kate. II. Miller, Robert. III. Askew, Ian. IV. Horn, Marjorie C. V. Ndhlovu, Lewis. VI. Population Council. Africa Operations Research andTechnical Assistance Project. VII. United States Agency for InternationalDevelopment.
HQ 766.5 .A35 C439 1998
This publication was supported by the Population CouncilÕs Africa OperationsResearch and Technical Assistance Project II. The Africa OR/TA Project II isfunded by the U.S. Agency for International Development (USAID), Office ofPopulation, Contract No. CCP-3030-C-00-3008-00, Strategies for ImprovingFamily Planning Service Delivery.
The observations, conclusions, and recommendations set forth in this publication are those of the authors and do not necessarily represent the viewsof USAID.

Abbreviations ............................................................................................................................................................iv
Contributors ................................................................................................................................................................v
Foreword ....................................................................................................................................................................vi
Foreword ..................................................................................................................................................................vii
Preface and Acknowledgments ............................................................................................................................viii
Purpose and Organization ......................................................................................................................................ix
Contents
I. OVERVIEW
1. Introduction..........................................................3
2. Descriptions of the Family Planning Programs Studied ............................13
II. BASIC STUDY FINDINGS & THEIR UTILIZATION
3. Indicators of Readiness andQuality: Basic Findings ....................................29
4. Using Situation Analysis toImprove Reproductive Health Programs................................................87
III. FACTORS AFFECTING QUALITY
5. Determinants of Quality ofFamily Planning Services:A Case Study of Kenya ..................................107
6. Unrealized Quality and MissedOpportunities in FamilyPlanning Services ............................................125
7. Urban and Rural Family PlanningServices: Does Service QualityReally Differ?....................................................141
IV. STANDARDS AND GUIDELINES FOR SERVICES
8. How Providers Restrict Access toFamily Planning Methods: Results from Five African Countries ..........................159
9. Tests and Procedures Required of Clients in ThreeCountries of West Africa ................................181
V. CURRENT AND FUTURE PROGRAM DIRECTIONS
10. Integrating STI and HIV/AIDSServices at MCH/FamilyPlanning Clinics ..............................................197
11. Changes in Quality ofServices Over Time..........................................217
VI. SUMMARY, CONCLUSIONS, FUTURE DIRECTIONS, AND RECOMMENDATIONS
12. Clinic-Based Family Planning and Reproductive Health Programs in Sub-Saharan Africa ....................................245

AIDS acquired immuno-deficiency syndrome
ANOVA analysis of variationAVSC AVSC International
(not an abbreviation)BOTSPA Botswana Population Assistance
ProjectBP blood pressureCBD community-based distributionCOC combined oral contraceptivesCOPE client oriented and provider efficientCPR contraceptive prevalence rate (modern
contraceptives only)CYP couple-years of protectionDfID Department for International
DevelopmentDHS Demographic and Health SurveyFHI Family Health InternationalFP family planningGFPHP Ghana Family Planning and
Health ProgramGHANAPA Ghana Population and
AIDS ProjectGRMA Ghana Registered Midwives
AssociationGTZ Gesellschaft f�r Technische
ZussammenarbeitHIV human immuno-deficiency virusHSD Honestly Significance DifferenceICPD International Conference on Population
and Development, Cairo, 1994IEC information, education, and
communicationINTRAH Program for International
Training in HealthIPPF International Planned
Parenthood Federation IUD intrauterine deviceJHPIEGO Johns Hopkins Program for
International Education inReproductive Health
JHU/PCS Johns Hopkins University/PopulationCommunication Services
JSI John Snow IncorporatedLAM lactational amenorrhea methodLMP last menstrual periodMAQ Maximize Access and Quality (USAID
initiative)MCH maternal and child health
MSH Management Services for HealthML/GA mini-laparotomy/general anestheticML/LA mini-laparotomy/local anestheticMOH Ministry of HealthMOH&CW Ministry of Health and
Child WelfareNCC Nairobi City Commission (Kenya)NCPD National Council for Population and
DevelopmentNFP natural family planningNGO nongovernmental organizationOC oral contraceptiveOR Operations ResearchORS oral rehydration saltsPID pelvic inflammatory diseasePNPF Programme National pour la
Panification FamilialePOP progestin-only pillPPAG Planned Parenthood Association
of GhanaPPFN Planned Parenthood Federation of
NigeriaPRICOR Primary Health Care Operations
ResearchRH reproductive healthRTI reproductive tract infectionSA Situation AnalysisSDP service delivery pointSEATS Family Planning Service Expansion
and Technical Support Project, John Snow Inc.
STD sexually transmitted diseaseSTI sexually transmitted infectionTA technical assistanceTFR total fertility rateTL tubal ligationUNAIDS Joint United Nations Programme on
HIV/AIDSUNDP United Nations Development
ProgrammeUNFPA United Nations Population Fund USAID United States Agency for International
DevelopmentVSC voluntary surgical contraceptionWHO World Health OrganizationZNFPC Zimbabwe National Family Planning
Council
iv
Abbreviations

EDITORS
Kate Miller, M.P.H.Formerly Staff ProgramAssociate, Population Council,New York; currently doctoralstudent, Department ofDemography, University ofPennsylvania, Philadelphia
Robert Miller, Dr.P.H.Senior Program Associate,Population Council, New York
Ian Askew, Ph.D.Senior Associate and ProjectDirector, Africa OperationsResearch and TechnicalAssistance Project II, PopulationCouncil, Nairobi, Kenya
Marjorie C. Horn, Ph.D.Deputy Chief, Research Division, Office of Population,U.S. Agency for InternationalDevelopment, Washington, D.C.
Lewis Ndhlovu, M.Sc.Associate, Population Council,Nairobi, Kenya
v
ContributorsAUTHORS
Lisanne F. Brown, Ph.D.Research Assistant Professor,Department of InternationalHealth and Development, TulaneSchool of Public Health andTropical Medicine, New Orleans
Judith Bruce, B.A.Senior Associate and ProgramDirector, Gender, Family, andDevelopment Program,Population Council, New York
Goli Fassihian, M.P.H.Data Analyst, PopulationCouncil, New York
Andrew Fisher, Sc.D.Senior Associate and ProgramDirector, Horizons Project,Population Council, Washington, D.C.
Martin Gorosh, Dr.P.H.Clinical Professor of PublicHealth, Center for Populationand Family Health, Joseph L.Mailman School of PublicHealth, Columbia University,New York; and Consultant,SEATS Project, John Snow Inc.,Arlington, Virginia
Nicole Haberland, M.P.H.Program Associate, PopulationCouncil, New York
Heidi Jones, B.A.Data Analyst, PopulationCouncil, New York
Ndugga Maggwa, M.D., M.Sc.Associate, Population Council,Nairobi, Kenya
Gwendolyn T. Morgan, M.P.H.Doctoral student, Department ofInternational Health andDevelopment, Tulane School ofPublic Health and TropicalMedicine, New Orleans
Melinda Ojermark, M.P.H.Formerly Regional Director forAfrica, SEATS Project, John Snow Inc., Arlington, Virginia;currently Chief Advisor to theVietnam-Sweden HealthCooperation, Ministry of Health,InDevelop, Hanoi, Vietnam
Elizabeth Pearlman, B.A.Program Assistant, PopulationCouncil, New York
Brian Pence, B.A.Program Assistant, PopulationCouncil, New York
Carolyn Gibb Vogel, M.P.H.Formerly Technical Officer,SEATS Project, John Snow Inc.,Arlington, Virginia; currentlyResearch Associate, PopulationAction International,Washington, D.C.
The United States Agency for International Develop-ment (USAID) is proud to have supported publica-tion of Clinic-Based Family Planning and ReproductiveHealth Services in Africa: Findings from SituationAnalysis Studies. This volume well reflects USAID'sstrong commitment to improving the quality ofreproductive health care and expanding access forunderserved groups. Nowhere are these effortsmore important than in Africa, where use of familyplanning and other measures of reproductivehealth status are lowest among the worldÕs regions.Helping to provide high-quality health servicesthat meet couples' reproductive needs is a sociallyjust and humane goal in itself. Moreover, higher-quality services can reasonably be expected toresult in better outcomes with regard to measuresof client satisfaction, continuation of use of contra-ception, and reproductive health, which in turnhave positive implications for both the individualclient and the population at large.
As we strive to improve quality of care, it isimportant to be able to define and measure it.Building on the pioneering work of Bruce and Jainin this area, staff of the Africa Operations Researchand Technical Assistance Project operationalizedthe definition of quality at the field level with theSituation Analysis methodology, transforming thedefinition into measurable variables. Managersand donor agencies welcomed these studiesbecause they provided the tools necessary to diag-nose and treat critical service-delivery problems.The project has demonstrated that when programmanagers are involved in all phases of theresearch, its results will be utilized. USAIDMissions, program managers, and other donorshave been using Situation Analysis findings for thelast decade in Africa and other regions to betteridentify and understand the extent and nature ofproblems of access and quality, and to help focusour assistance and programmatic support on over-coming these problems.
While much progress has been made in provid-ing access to quality services in sub-SaharanAfrica, the Situation Analysis data from the studiesreported here highlight major challenges for
improving reproductive health service delivery.Inadequate client counseling is a pervasive patternin the region, along with insufficient attention toinfection prevention. Further, the integration ofsexually transmitted infection (STI)/HIV/AIDSprevention with family planning services is shownto exist in only rudimentary form in many pro-grams, and even the relatively straightforwardpromotion of condoms as a way of preventing bothpregnancy and the spread of STIs/HIV/AIDS isoften found to be weak.
The findings reported in this volume, alongwith the entire body of material from which theywere taken, will require discussion, critique, anddebate. Utilization of these findings is key for mak-ing important policy and program changes toimprove service delivery. Ultimately, many of thesolutions to the programmatic problems describedin this volume will need to be further developed,tested, evaluated, expanded to the national level,and diffused throughout the region and beyond.
Operations Research will address many of thesetasks through the new FRONTIERS in ReproductiveHealth Program, funded by USAID. In addition,USAID will continue to provide support for addi-tional studies of program operations at the fieldlevel through the MEASURE program, whichbegan this year. Through these and other researchactivities, we plan to expand the use of qualitativeresearch on issues such as client satisfaction, whichare not captured well by facility- or clinic-basedstudies.
Responding to the critical issues raised in thisvolume will require the support and cooperationof program managers, policy makers, and donors.Our challenge and responsibility now is to under-take the sustained efforts necessary to use thesefindings to vastly improve the reproductive healthof women and men around the world.
Elizabeth MaguireDirector
Office of PopulationUnited States Agency for
International Development
vi
Foreword

vii
Organized family planning services have beenoffered in one form or another in sub-Saharan Africafor the past three decades. During most of this peri-od, contraceptive services have been offered withinthe context of broader maternal and child health(MCH) services, which should make integration ofservices much easier. Yet the studies documented inthis volume show that while millions of women andmen have been able to obtain contraceptive methodsof their choice at these clinics, the degree of integra-tion of family planning services with other repro-ductive health services is extremely poor. The pauci-ty of integrated services for diagnosis and treatmentof preexisting conditions such as reproductive tractinfections (RTIs) and the lack of counseling of clientson their risk of sexually transmitted infections (STIs)raise not just concerns about inefficient utilization ofresources, but also serious ethical issues in an envi-ronment in which levels of AIDS-related mortalityand morbidity are the highest in the world. Servicesshould focus not only on enabling individuals toavoid unwanted childbearing, but also on helpingthem prevent disease. The paradoxical situation ofunintegrated services within an MCH context is aproduct of the history and evolution of family plan-ning services in the region, whereby family plan-ning services were initiated and established withdonor funds.
The Situation Analysis methodology providedthe first tool for a systematic assessment of the stateof readiness of service delivery points (SDPs) tooffer family planning services. Although lateradapted and revised to assess family planning ser-vices within the context of a broader reproductivehealth approach, most of the studies included inthis volume were conducted prior to the 1994International Conference on Population andDevelopment. The poor performance of the clinicsstudied on a wide range of variables is a clear indi-cation of the amount of work that needs to be doneto fully operationalize the reproductive healthapproach at the level of the SDP. This volume pro-vides the most comprehensive review to date ofclinic-based services in Africa and represents thestate of the art in measuring, ensuring, and
improving the quality of family planning services.The results presented herein form a commonknowledge base and serve as a framework thatshould guide current and future efforts to improvethe quality of family planning services and ensurethat the limited and declining resources availablefor health care are utilized in the most effective andefficient way.
The 12 country assessments included in thisvolume highlight two important points about thecentral role of the service provider in improvingthe quality of services provided to clients. First,through their attitudes, knowledge, skill, andenthusiasm, service providers serve as the mainlink between the entire service system and itsclients. Equally important, however, is the contentof the information that is exchanged between theprovider and the client. In addition to informationrelating to specific contraceptive methods, thisinformation should include the role of sexual part-ners in the risk of infection, the key symptoms ofthe most serious RTIs, and the degree of protectionfrom RTIs and STIs offered by various contra-ceptives. It is obvious, therefore, that the properselection, training, and supervision of serviceproviders offer perhaps the most direct and cost-effective approach for improving the quality offamily planning and reproductive health servicesreceived by clients.
The Situation Analysis approach, which waspioneered in Africa and of which Africans are justi-fiably proud, has made significant contributions tothe family planning field. The continent now hasan opportunity to lead efforts to expand theapproach to include broader reproductive healthservices. If such efforts enable us to discover howbest to give clients the information they need toincrease their knowledge and change their behav-ior to prevent both disease and unwanted child-bearing, we will have bridged the gap betweenwhat is and what should be.
Ayo AjayiRegional Director, East and Southern Africa
Population Council, Nairobi
Foreword

As was noted in the Preface and Acknowledgments toThe Situation Analysis Approach to Assessing FamilyPlanning and Reproductive Health Services: A Handbook,published in 1997, the Situation Analysis studymethodology was developed and first used inAfrica. As the study methodology diffused throughmuch of Africa and the world, the studies could nothave been implemented without the cooperationand support of national family planning programmanagers and ministry of health officials who werecommitted to seeing how their programs were func-tioning at the field level, "warts and all."
The thousands of field visits, interviews, andobservations documented in this volume attest to thededication and hard work of many hundreds of fieldresearchers and the patience and openness of both ser-vice providers and the women attending servicedelivery points. We remain deeply indebted to thethousands of family planning and reproductive healthstaff in all 11 countries who welcomed our researchteams at their facilities, often found places for them tosleep, opened their cupboards and records for inspec-tion, allowed their clients to be interviewed andobserved, and patiently answered our numerousquestions. We thank the thousands of women whoallowed us to observe them receiving services andwho then proceeded to answer dozens of sometimesintimate questions. We received so much assistancefrom so many Population Council staff in the imple-mentation of the studies that we are hesitant toattempt to name them all. Yet we would definitely beremiss if we did not recognize our heavy debts toNafissatou Diop, Joanne Gleason, Inoussa Kabore,Barbara Mensch, Naomi Rutenberg, DiouratieSanogo, Kathleen Siachitema, John Skibiak, Julie Solo,Placide Tapsoba, and Mounir Toure.
This volume presents a summary of many find-ings and an analysis of several program issues. We aregrateful that so many reproductive health researchersand practitioners in a variety of institutions have beeninterested in using the Situation Analysis data toexplore these issues. We do not doubt that many addi-tional issues deserve similar treatment, and we hopeour database can continue to be used productively byother researchers. Despite the fact that this volume
represents the culmination of 10 years of effort inconducting Situation Analysis studies in Africa, wehope that the data will remain useful long into thefuture as a source of additional insights for programmanagers, as a source of data for researchers inter-ested in a variety of program issues, and as a baselinefor assessing future program progress.
Throughout the process of implementing themany studies included in this volume, we receivedconsiderable financial and technical support fromUSAID Washington and the many USAID Missionstaff who provided approvals for all of the studiesand were frequently contributors to the researchprocess. We remain greatly indebted to USAID forthis support and encouragement. The high level ofencouragement, frequent utilization of study find-ings, and numerous technical suggestions forimproving the study methodology are gratefullyacknowledged.
We are greatly indebted to Rona Briere, whopainstakingly edited the entire volume and providednumerous creative suggestions for its formatting. Weare indebted as well to the staff of the PopulationCouncilÕs Office of Publications for designing thecover and text, and offering additional creative for-matting suggestions. Alisa Decatur assisted our edi-tor by typing the manuscript and facilitating quicktransmission. Brian Pence provided research assis-tance, proofread all of the chapters, and coordinatedcommunications throughout the entire editing andproduction process. We would also like to thankNicholas Gouede and Peggy Knoll for developing aninitial distribution plan for this volume.
We benefited greatly from the review, comments,and suggestions of many of our colleagues andfriends, including Michael Commons, RalphFrerichs, Steve Green, Anrudh Jain, Young-Mi Kim,Gitanjali Pande, James Shelton, and Eugene Weiss.The production of this volume has been an intensive,collaborative process among the editors and authors.We would appreciate receiving comments and sug-gestions from readers, and reports from those whocarry out situation analysis studies.
The Editors
viii
Preface and Acknowledgments
This volume presents results from 12 SituationAnalysis studies conducted in sub-Saharan Africabetween 1989 and 1996. It summarizes the studyfindings on about 100 variables; analyzes significantregional patterns and trends, including the integra-tion of family planning and HIV/AIDS activities;identifies major problems with the quality of ser-
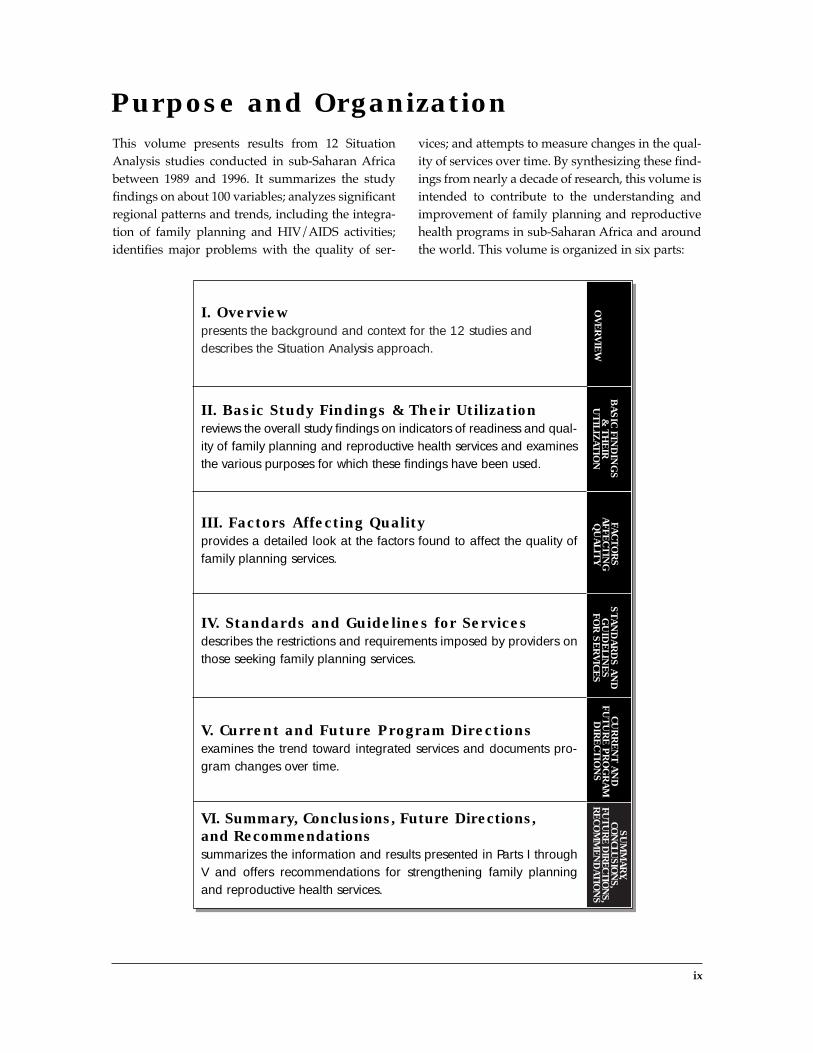
vices; and attempts to measure changes in the qual-ity of services over time. By synthesizing these find-ings from nearly a decade of research, this volume isintended to contribute to the understanding andimprovement of family planning and reproductivehealth programs in sub-Saharan Africa and aroundthe world. This volume is organized in six parts:
ix
Purpose and Organization
I. Overviewpresents the background and context for the 12 studies anddescribes the Situation Analysis approach.
II. Basic Study Findings & Their Utilizationreviews the overall study findings on indicators of readiness and qual-ity of family planning and reproductive health services and examinesthe various purposes for which these findings have been used.
III. Factors Affecting Qualityprovides a detailed look at the factors found to affect the quality offamily planning services.
IV. Standards and Guidelines for Servicesdescribes the restrictions and requirements imposed by providers onthose seeking family planning services.
V. Current and Future Program Directionsexamines the trend toward integrated services and documents pro-gram changes over time.
VI. Summary, Conclusions, Future Directions, and Recommendationssummarizes the information and results presented in Parts I throughV and offers recommendations for strengthening family planningand reproductive health services.
OV
ER
VIE
W
BA
SIC
FIN
DIN
GS
&
TH
EIR
UT
ILIZ
AT
ION
FAC
TO
RS
AFFE
CT
ING
QU
ALIT
Y
ST
AN
DA
RD
S A
ND
GU
IDE
LIN
ES
FO
R S
ER
VIC
ES
CU
RR
EN
T A
ND
FU
TU
RE
PR
OG
RA
MD
IRE
CT
ION
S
SU
MM
AR
Y,CO
NCLU
SIO
NS,
FUT
UR
E D
IRECT
ION
S,
RE
CO
MM
EN
DAT
ION
S

I. OVERVIEW
1
Introductionreviews the history of family planning in sub-SaharanAfrica and describes theSituation Analysis approach.
2
Descriptions of theFamily PlanningPrograms Studieddescribes the context for eachof the programs examined bythe 12 Situation Analysis studies included in this volume.


OV
ER
VIE
W
Introduction 3
Access to high-quality family planning and repro-ductive health services, including the control ofsexually transmitted infections (STIs), is a centraland growing concern in sub-Saharan Africa todayfor many reasons. First, sub-Saharan Africa has thehighest population growth rates of any region,averaging almost 3 percent per year, and govern-ments are increasingly concerned about theadverse effects of such rapid population growth ondevelopment efforts. Women in Africa have chil-dren early and in large numbers, with completedfamily size averaging around 6 children. Second,an estimated 22 million women in the region havean unmet need for family planning services, mean-ing that they are not currently using family plan-ning, but want to delay or avoid future pregnancies(Rosen and Conly, 1998). Third, 40 percent of theworldÕs 215,000 annual deaths among women inchildbirth occur in the region (Rosen and Conly,1998). Fourth, both health problems stemmingfrom illegal abortion and the increasing sexualactivity of adolescents fuel a growing interest inand response to family planning and broaderreproductive health programs (Alan GuttmacherInstitute, 1998). Finally, and perhaps most impor-tant, the worldÕs HIV/AIDS pandemic is hittingAfricaÑespecially East and Southern AfricaÑharder than any other region; sub-Saharan Africa ishome to over two-thirds of all people in the worldliving with HIV and the site of 83 percent of globalAIDS deaths (UNAIDS and World HealthOrganization, 1998). Thus the need for more com-prehensive high-quality health services is apparentfrom many different perspectives.
Yet despite these compelling reasons for familyplanning and reproductive health services, anddespite the unmet need in the region, those services
that do exist often are underutilized (Fisher andMiller, 1996). One hypothesis explaining this con-flict between need and practice is the poor qualityof the services that are offered. (Other explanationsrelate to high demand for children, low levels ofmotivation for avoiding pregnancy, and womenÕslack of empowerment to implement their goals.)Situation Analysis is a tool for examining the quali-ty of family planning and reproductive health ser-vices, with the ultimate objective of helping pro-gram managers identify and solve problems thatcompromise the quality of their programs.
This volume reports the results and implicationsof 12 Situation Analysis studies undertaken in 11countries since 1989 under the Population CouncilÕsAfrica Operations Research and TechnicalAssistance (OR/TA) Projects, funded by the UnitedStates Agency for International Development(USAID). The purpose of these studies was to deter-mine the quality of family planning and reproduc-tive health services in sub-Saharan Africa. The con-text for the studies includes an international advo-cacy movement that culminated in the CairoInternational Conference on Population andDevelopment (ICPD) of 1994, which ratified aworldwide commitment to the provision of compre-hensive reproductive health services, including fam-ily planning and the control of STIs, and to a broadfocus on the special problems of women and girls.
HISTORY OF FAMILY PLANNING IN AFRICA
In the 1970s, access to modern contraception wasextremely limited in Africa, except for pilot pro-gram activities (National Research Council, 1993)
IntroductionRobert Miller, Andrew Fisher, and Ian Askew
1

and the early efforts of International PlannedParenthood affiliates and other nongovernmentalorganizations (NGOs), which operated mainly inurban areas. African policy makers did not experi-ence the absolute numbers and the high populationdensity that characterized the Asian context.Consequently, they expressed little support forpopulation control, which was the stimulus for thefirst family planning programs in India in the 1950sand in much of the rest of Asia and Latin Americain the 1960s. Further, policy makers tended to shyaway from family planning, which was controver-sial in the sociocultural setting in much of Africa.This was especially true in Francophone WestAfrica, which was strongly influenced by conserv-ative French laws. At the Bucharest WorldPopulation Conference in 1974, African leadersjoined others from the developing world in voicingsupport for socioeconomic development and Òanew world order,Ó rather than a more demograph-ically oriented approach to Third World problems(National Research Council, 1993; Miller andRosenfield, 1996).
During the 1980s, considerable change occurredin the African policy climate. The climate becameincreasingly favorable for population policies andfamily planning programs as governments docu-mented and grew more concerned about high pop-ulation growth rates. In 1984, African leadersendorsed the Kilimanjaro Programme of Action forAfrican Population and Self-Reliant Development,formulated in Tanzania, which called for the provi-sion of family planning services and their integra-tion into maternal and child health (MCH) pro-grams (National Research Council, 1993).
Thus in contrast with the Asian context, wherefamily planning services were often developedindependently from health services in special verti-cal programs supported by economic and demo-graphic rationales, African policy makers opted fora health rationale, an emphasis on spacing (ratherthan limiting) of births, and the delivery of familyplanning and reproductive health services withinintegrated health programs. In Africa, the healthapproach was considered both culturally and polit-ically more appropriate than a demographic orien-tation for dealing with the interconnected prob-lems associated with reproductive health, rapid
population growth, and economic development. Atthe ICPD, the world endorsed integrated reproduc-tive health programs more in line with the ideal(but infrequently realized) African models thanwith the earlier vertical Asian models.
GOVERNMENTAL PROGRAMS INCLINIC SETTINGS
In most African countries in the 1990s, the vastmajority of women1 receive modern family plan-ning methods from governmental sources, ratherthan from nongovernmental agencies, pharmacies,or private practitioners. Among users of modernmethods, the proportions receiving them from gov-ernmental sources range from 95% in Botswanaand 71% in Kenya (two of the most successful pro-grams) to a low of 43% in Ghana (Ross et al., 1993).These governmental sources are most frequentlyhealth facilities rather than community-based dis-tribution (CBD) systems, which have been imple-mented on a much smaller scale in Africa than wasthe case in Asia in the 1970s and 1980s (Phillips andGreene, 1993). A wide range of health facilitiesÑhospitals, clinics, and health postsÑare still themajor source of supply of modern methods inAfrica. The rationale behind clinical programs inhealth settings is succinctly described by Bertrand(1991:21Ð22):
Clinic-based programs can offer a wider rangeof contraceptive methods than any of the otherservice delivery mechanisms because theyprovide methods that can be administeredonly by clinical personnel (male and femalesterilization, IUDs, implants, and injectables),as well as the so-called non clinical methods(the pill, condoms, and spermicides)É. Whatclinic-based facilities have in common is thatthe personnel serving the public have receivedclinical training as physicians, nurses, and insome cases midwives; that they are capable ofdoing a clinical examination in the course ofprescribing contraceptives (if they so choose);that they generally have basic gynecologicalequipment; and that in urban areas, they usu-ally have access to laboratory facilities (eitheron the premises or nearby).
4 Clinic-Based Family Planning and Reproductive Health Services in Africa

The clinic-based service-delivery system inAfrica has been a major focus of African policymakers and the donor community. However,recent developmentsÑICPD and the worsening ofthe HIV/AIDS pandemic in the regionÑhaveresulted in still greater emphasis on the clinic-based system. In response, Ministries of Health(MOHs) and the donor community are increasingefforts to test potential strategies for some of themost important and relevant ICPD components.Particular emphasis is being placed on the integra-tion of family planning with the prevention andtreatment of STIs, including HIV/AIDS (Maggwaand Askew, 1997). (Detail on the program contextfor each of the 12 Situation Analysis study sites isprovided in Chapter 2.)
Views on the effectiveness of the clinic-basedapproach to family planning programs in Africahave changed substantially in the last decade.Caldwell and Caldwell referred in 1988 (p. 21) to Ò...the complete failure of African familyplanning programs to reduce fertility....Ó However,the decade since that comment was made has seendramatic declines in fertility in several Africancountries with active family planning programs(such as Kenya, Zimbabwe, and Botswana), alongwith significant changes in education, family eco-nomics, urbanization, and other factors. Kirk andPillet (1998:17) conclude that Òan assessment of fer-tility trends has uncovered evidence of initial fertil-ity decline in two-thirds of the countries of sub-Saharan Africa that had conducted a DHS[Demographic and Health Survey] before mid-1995,Ó but Òwithin a group of countries in East andSouthern Africa...the fertility transition is now wellestablished and progressing at a rapid pace.ÓMoreover, Kirk and Pillet indicate that Òcontracep-tive use is by far the most important factor account-ing for across country differences (in fertility).Ó
OPERATIONS RESEARCH AND THESUPPLY-DEMAND CONTROVERSY
As family planning programs in Asia and LatinAmerica expanded rapidly during the 1970s and1980s and became more comprehensive in cover-age and services, they also became more complex
and expensive. New approaches were needed tomake them more efficient, more effective, and lesscostly. In this context, the five-stage problem-solv-ing process of operations research (OR)2 (Fisher etal., 1991) was well suited to helping programsfocus on supply-side problems and test new ser-vice-delivery approaches. USAID provided sub-stantial funding for such studies in every region.Throughout Asia and Latin America, the experi-mental findings from numerous OR studies wereinstrumental in helping family planning programsidentify new approaches and fine-tune existingservice-delivery mechanisms. Family planningprograms introduced numerous new programtechniques and ways of expanding service deliv-eryÑinitially tested through a process of ORexperimental and quasi-experimental studies.These new approaches included CBD; competen-cy-based, experiential training programs; tradi-tional and modern forms of information, educa-tion, and communication (IEC); social marketing;and integrated reproductive health services (Shaneand Chalkley, 1998).
In Africa, on the other hand, few family plan-ning programs even existed in the 1970s, and thosethat did (or were subsequently initiated in the1980s) generally suffered from very serious weak-nesses or hardly functioned at all. Program effortscores were universally weak in 1982 (Ross et al.,1993), and contraceptive prevalence rates wereuniversally low. However, whether low contracep-tive prevalence rates were due to poorly function-ing programs, lack of demand for family planning,or both was controversial (van de Walle and Foster,1990; Pritchett, 1994).
Commenting on the increasing change in expe-rience and perspectives that pervaded Africa in themid-1990s, Fisher (1993:20) notes that until recent-ly, conventional wisdom suggested that Òregard-less of how effective African family planning pro-grams are in making services available and acces-sible, the use of family planning services in Africawill remain low because the demand for these ser-vices is very low.Ó However, he points to three newsources of data that challenge this Òweak demandÓhypothesis. DHS surveys conducted throughoutAfrica indicate that demand for family planningÑespecially for purposes of spacing birthsÑexists,
OV
ER
VIE
W
Introduction 5

often at levels far higher than expected. Further,the Situation Analysis studies that form the basisfor this volume reveal that in every country wherethese studies have been conducted, significantweaknesses in the supply of services affect the abil-ity of programs to satisfy demand. And OR studiescompleted throughout the continent demonstratethat Òwhen supply side weaknesses are corrected,when services are made more available, easilyaccessible, and of higher quality, the use of familyplanning increases substantially and rapidlyÓ(Fisher, 1993:20). In short, there is demand for fam-ily planning services, there are severe service-delivery weaknesses, and numerous OR studiesclearly demonstrate the potential to satisfy thedemand when those weaknesses are corrected.
THE SITUATION ANALYSISAPPROACH3
If demand is less of a factor restricting family plan-ning use than was thought to be the case just a fewyears ago, it would seem likely that the supply ofservices may be more of a barrier to use than wasexpected. Indeed, in each of the 11 countries inwhich a Situation Analysis study has been con-ducted, major weaknesses have been observed inthe availability, functioning, and quality of familyplanning services, and substantial opportunitiesfor strengthening the quality of care have beenidentified.
Correcting the weaknesses of African familyplanning and reproductive health programs is noeasy task. In addition to the usual complicationsÑscarce resources, lack of trained personnel, poorcommunications, nonavailability of proven, appro-priate modelsÑmanagement information systemsare generally nonexistent or nonfunctioning.Anecdotal accounts and the opinions of ÒexpertsÓabounded until 1989, when the first SituationAnalysis study was implemented in Kenya. Prior tothis study, there was little or no information basedon field-level assessments about how programswere functioning. There were no baseline measuresby which to evaluate the impact of innovations.Beginning in 1989, representative studies of nation-al service-delivery systems, which included actual
observations of the quality of care being received byclients, began to provide systematic information onprogram strengths and weaknesses that could beused to evaluate and improve programs.
Situation Analysis is a comprehensive and stan-dardized approach for systematically assessingboth the readiness of family planning/reproduc-tive health programs to deliver services and thequality of care received by clients. The SituationAnalysis approach grew out of a perceived need onthe part of program managers to know the actualstate of their programs at the field level. It evolvedfrom a simple request by the Division of FamilyHealth within the Kenyan MOH for assistance indetermining their equipment needs.
In developing a response to this request, AfricaOR/TA Project staff were influenced by the sys-tems thinking of the Primary Health CareOperations Research (PRICOR) Project (Center forHuman Services, 1988), the Rapid SurveyMethodology (Frerichs, 1989a; Frerichs and Tar Tar,1989b), and the quality-of-care framework outlinedby Bruce and Jain (Bruce, 1990). The staff recom-mended a data collection procedure that wouldprovide a more comprehensive picture of programoperations than that represented by the originalrequest, including the functioning of each of theprogramÕs subsystems, as well as the quality ofcare being delivered to clients. The MOH acceptedthis proposal.
The Situation Analysis approach is defined asfollows:
A description and evaluation of: 1) currentfamily planning policies and service deliverystandards, and the availability and function-ing of family planning subsystems at a rep-resentative sample of service delivery points(SDPs) or all SDPs in a geographic area; 2)the readiness of these subsystems to deliverquality of care to clients; 3) the actual qualityof care received by clients at these SDPs; and4) the impact quality of care has on the fertil-ity behavior of clients (Miller et al., 1997:5). As Mensch et al. (1994:19) note:
Although Situation Analysis borrowsfrom other methodologies, it is consideredinnovative because it integrates a number ofapproaches to family planning program
6 Clinic-Based Family Planning and Reproductive Health Services in Africa

evaluation. These include (1) a systems per-spective for identifying crucial subsystemcomponents of program operation; (2) visitsto a large sample of SDPs rather than visitsto only a few SDPs or reliance on expertopinion; (3) a client-oriented focus on quali-ty of care; (4) structured interviews withmanagers, providers, and clients rather thanwith community informants as is the casewith the DHS availability module; (5)recording of clinic facilities, equipment andcommodities available on the day of theteam visit; and (6) nonparticipant directobservation of all family planning client-provider interactions on the day of theresearch teamÕs visit.The core set of Situation Analysis data collec-
tion procedures includes the following:■ A representative sample of SDPs4 or all SDPs
within a geographic area of interest (country,city, district, province) are visited for a mini-mum of a full day by a team of three or morepeople, including at least one with clinicaltraining (a physician, nurse, or nurse/midwife)and at least one with a social science back-ground and field interview experience.
■ A complete inventory is taken of equipmentand supplies.
■ Service statistics (if available) are recorded forthe past 12 months.
■ All family planning service providers are inter-viewed regarding family planning and otherreproductive health issues.
■ Observations are made of the interactionbetween service providers and all new and con-tinuing family planning clients on the day ofthe visit.
■ All clients observed are subsequently inter-viewed as they leave the SDP. A selection ofMCH clients are interviewed as well.Some Situation Analysis studies also include
interviews with program managers, observationsof non-family planning services, and specializedquestionnaires for CBD agents and pharmacies.Examination of the quality of services received fol-lows the Bruce-Jain quality-of-care framework(Bruce, 1990), which has the following components: ■ Choice of methods refers to the number and
intrinsic variability of methods actually offered. ■ Information given to clients relates to the
range of information provided to clients duringcounseling that allows them to choose andemploy contraception effectively. It includesinformation on advantages and disadvantagesof various methods; possible side effects andtheir management; relationship of the methods
OV
ER
VIE
W
Introduction 7

8 Clinic-Based Family Planning and Reproductive Health Services in Africa
to STIs, including HIV/AIDS; and the fact thatthe client can switch to another method if she isnot satisfied with her initial choice.
■ Technical competence involves the clinicaltechniques of the providers, including properattention to cleanliness and asepsis during clin-ical procedures.
■ Interpersonal relations relate to the personalcomponent of provider-client interactions.
■ Mechanisms to encourage continuity refer tosupporting well-informed users in managingcontinuity on their own, and follow-up mecha-nisms such as revisit appointments and homevisits for checkups and support.
■ Appropriate constellation of services refers tosituating services so they are convenient andacceptable to clients and respond to clientsÕrelated health needs. The basic underlying model for Situation
Analysis studies (see Figure 1-1) holds that the func-tioning of subsystemsÑsuch as IEC, equipment andsupplies, logistics, supervision, and records andreportingÑrepresents a degree of readiness to pro-vide a certain level of quality of care, and that thisreadiness influences the actual quality of care deliv-ered by providers and received by clients.
Situation Analysis emphasizes the collection ofdata on qualityÑespecially the important compo-nents of the counseling processÑby trainedobservers. In separate studies, researchers havedetermined that such observation data are relative-ly reliable (Huntington et al., 1996), and while itmay be somewhat positively biased, it is probablyof greater validity than client reports (Ndhlovu,1998). Five basic minimum data collection instru-ments were used in all of the studies documentedin this report: ■ Inventory for Facilities Available and Services
Provided at the Service Delivery Point
■ Observation Guide for Interaction BetweenFamily Planning Clients and Service Providers
■ Exit Interview for Family Planning Clients■ Interview for Staff Providing Family
Planning/Reproductive Health Services at theService Delivery Point
■ Interview for MCH Clients Attending theService Delivery PointThe units of analysis for a Situation Analysis
study are SDPs, providers, and clients. The samplesizes and other background information on each ofthe 12 studies included here are provided in Annex1.1.
The usability of the Situation Analysis approachwas demonstrated in the Kenyan context with theresults of the first national study (Miller et al., 1992)and the Nairobi City Commission study (Menschet al., 1994). Managers quickly developed a varietyof uses for the data as a basis for administrativedecision making. These included conducting prob-lem-solving discussions among various levels ofprogram managers; ordering/redistributing need-ed equipment; redesigning and reorienting train-ing programs; redesigning staff deployment plansto better reflect actual case loads; redesigning tech-nical assistance programs; and documenting andrepresenting program needs, such as missingequipment, to donor agencies. Additionally, thefindings were used in OR training programs as abasis for selecting important problems to beaddressed through the design and implementationof OR subprojects (see chapter 4 and Miller andFrerichs, 1992Ð1993).
Although the Situation Analysis approach wasoriginally designed for the African context, it dif-fused rapidly around the world (Miller et al., 1997).USAID recently funded an initiative (DHS+) thatwill develop 25 facility-based surveys between1998 and 2002.

OV
ER
VIE
W
Introduction 9
Annex Table 1-1 gives the sample sizes (nÕs) forfour of the data collection instruments in all 12study sites.5 The data in the inventory are weight-ed, but those collected by the other three instru-ments are not. The inventory data are fairly easy toweight because their unit of analysis, the SDP, isalso the sampling unit, so the sampling plans yieldthe weights quite clearly. Nonetheless, the weight-ed results in the inventory are quite close to theunweighted results, so the effect of weighting isnot extreme. The one exception is IUD-relateditems in Zimbabwe, which are greatly affected byweighting (see endnote 5 in Chapter 3).
Ideally, all the data would have been weighted,but this was not possible for the staff interviews,
client-provider observations, and exit interviews.To properly weight the staff interviews, one wouldneed information on the universe of staff at eachSDP on the day of the visit. This informationwould then need to be combined with the SDPweight to yield a final weight. However, the uni-verse of staff is not collected in all studies, andwhere it is, the data are not particularly reliable.One test of weighting the staff interviews inSenegal, where the universe of staff was collected,showed that doing so resulted in extremely smalldifferences in results.
To weight the client-provider observations, onewould need information on the universe of clientswho visited the SDP on the day of the study visit.
Annex 1-1: Sampling and Weighting
Annex Table 1-1. Sample sizes, by module
FamilyPlanning
Staff Client-Provider Client ExitStudy Inventories Interviews Observations Interviews
Botswana 184 456 406 386
Burkina Faso 337 685 509 509
Côte d’Ivoire 13 51 163 355
Ghana 313 570 819 811
Kenya 216 448 741 741
Madagascar 159 316 1163 1163
Nigeria 178 289 393 390
Senegal 180 361 1123 1123
Tanzania 348 598 451 451
Zambia 254 358 396 392
Zanzibar 101 191 144 144
Zimbabwe 192 376 759 746

The Situation Analysis methodology calls forobservation of all clients who come to the SDP onthat day, but this is clearly not possible in majorhospitals with many staff and clients. For mostSDPs, then, no weight is necessary since theobserved clients constitute a census, but for hospi-tals, no weight is possible because there is no infor-mation on the universe of clients on the day of thevisit. The same argument holds for the family plan-ning client exit interviews.
The SDP weight alone could also have beenapplied to the other three modules in the absenceof other weights. This was not done because of acombination of time and logistical constraints, aswell as a desire to keep the nÕs on the other mod-ules close to their original values. (Since the num-bers of staff and clients vary among SDPs, applyingthe SDP weight would significantly alter the nÕs onthe other modules.)
Following are brief descriptions of the weight-ing procedure applied to the inventory of eachstudy.
Botswana. The sample in Botswana is fairlystraightforward and is stratified by type. Itincludes 72% of all hospitals, 59% of all clinics, and15% of health posts. The data were weightedaccordingly.
Burkina Faso. In Burkina Faso, the fieldworkbegan as a census of all SDPs, but after 8 of 30provinces had been covered, it was switched to asample stratified by province. Where a sample wasdrawn, the sampling fraction by province rangedfrom about .25 to .57, and the remaining provinceshad a sampling fraction of 1. The weights correctfor this skewed sample.
C�te dÕIvoire. The Situation Analysis in C�tedÕIvoire assessed 13 pilot SDPs in Abidjan, whichrepresented a census of SDPs offering family plan-ning at the time. No weighting is necessary.
Ghana. The Ghana sample is stratified by type:50% of hospitals, 25% of maternities, 25% of MOHclinics, and 100% of Planned Parenthood Associationof Ghana clinics. The actual achieved sampling frac-tions differed slightly from these, and the weights areadjusted accordingly.
Kenya. The Kenya sample cannot be weightedbecause of difficulties with identifying universesand sampling fractions. However, all Nairobi City
Council (NCC) clinics were included purposively,which is probably the most skewed element of thesample. For this reason, several of these clinicswere removed from the data sets, resulting in aproportion similar to the overall sampling fraction.This mitigates the overrepresentation of NCC clin-ics in the sample.
Madagascar. This Situation Analysis is notnationally representative, but instead focuses on acensus of SDPs in two major provinces: Antana-narivo and Fianarantsoa. Because the data includedscattered SDPs in other provinces, these SDPs wereexcluded from the analysis. The remaining data werenot weighted since they consist of a census.
Nigeria. The Nigeria sample is complex. First, 6of 30 provinces were selected based on targetprovinces for upcoming MOH and Department forInternational Development (DfID) projects. Theseprojects had not begun at the time of the fieldwork,and the 6 provinces were judged by program man-agers to be representative of the country (Askew etal., 1994). Then a total sample size of 171 was cal-culated and divided evenly among the 6 provinces,for 30 SDPs each. In this way, the sampling fractionin each province differs because the universes dif-fer. Furthermore, within each province, the 30 SDPswere stratified by type, with various levels of rep-resentation among hospitals, health centers, clinics,and Planned Parenthood Federation of Nigeria(PPFN) clinics. The weights correct for these differ-ences in representation at the type and provincelevels.
Senegal. This Situation Analysis is a census ofall SDPs in the country, so no weights are needed.
Tanzania. The Tanzania sampling plan wasbased on the six zones of the country, each of whichis made up of three to four regions. In each zone,one region was randomly selected, and a census ofSDPs was taken. For this reason, the weights arebased solely on the number of regions per zone. Inaddition, Dar Es Salaam was purposively included,so it is weighted accordingly.
Zambia. The Zambia sample was not drawnrandomly. Instead, it consists mainly of SDPs thatare targeted for program interventions by organi-zations such as USAID, CARE, the United NationsFund for Population Activities (UNFPA), and theFamily Planning Service Expansion and Technical
10 Clinic-Based Family Planning and Reproductive Health Services in Africa

Support (SEATS) Project. In only a handful of caseshad the intervention already begun at the time ofthe fieldwork. No information is available on howthese SDPs were selected, so the sample cannot besaid to be representative. However, it does consti-tute a substantial proportion of all SDPs, it is clear-ly distributed by region and type, and it is judgedby program managers to be reasonably representa-tive. The data are not weighted.
Zanzibar. This Situation Analysis consisted of acensus of SDPs, so no weights are necessary.
Zimbabwe. The sample for the 1996 SituationAnalysis consists of the same SDPs that were visit-ed in the 1991 study, with a few small corrections.In 1991, the sample was randomly drawn such thatit was self-weighting and representative byprovince and type. The universe of SDPs changedinsignificantly between the two studies, so smallweights are applied in 1996 to adjust the sampleaccordingly.
REFERENCES
The Alan Guttmacher Institute. 1998. Into A New World:Young WomenÕs Sexual and Reproductive Lives. TheAlan Guttmacher Institute, New York.
Askew, I., B. Mensch, and A. Adewuji. 1994. ÒIndicatorsfor measuring the quality of family planning ser-vices in Nigeria.Ó Studies in Family Planning,25,5:268Ð283.
Bertrand, J. 1991. ÒRecent lessons from OperationsResearch on service delivery mechanisms.Ó InSeidman, M. and M. Horn, Operations Research:Helping Family Planning Programs Work Better. JohnWiley & Sons, New York.
Bruce, J. 1990. ÒFundamental elements of the quality ofcare: A simple framework.Ó Studies in FamilyPlanning, 21,2:61Ð91.
Caldwell, J.C. and P. Caldwell. 1988. ÒIs the Asian fami-ly planning program model suited to Africa?ÓStudies in Family Planning, 19,1:19Ð28.
Center for Human Services. 1988. Primary Health CareThesaurus: A List of Services and Support Indicators.Center for Human Services, Chevy Chase,Maryland.
Fisher, A., J. Laing, J. Stoeckel, and J. Townsend. 1991.Handbook for Family Planning Operations ResearchDesign, Second Edition. Population Council, NewYork.
Fisher, A. 1993. ÒFamily planning in Africa: A summaryof recent results from Operations Research studies.Ó
In Africa Operations Research and Technical AssistanceProject: End-of-Project Conference, Nairobi, 4Ð7 October.Population Council, New York.
Fisher, A. and K. Miller. 1996. ÒConditions required atSDPs to deliver quality family planning services:Why so many do so little.Ó Paper presented at theAnnual Meeting of the American Public HealthAssociation, New York.
Frerichs, R. 1989a. ÒSimple analytic procedures forrapid microcomputer-assisted cluster surveys indeveloping countries.Ó Public Health Reports,104,1:24Ð34.
Frerichs, R. and K. Tar Tar. 1989b. ÒComputer-assistedrapid surveys in developing countries.Ó Public HealthReports, 104,1:14Ð23.
Huntington, D., K. Miller, and B. Mensch. 1996. ÒThereliability of the Situation Analysis observationguide.Ó Studies in Family Planning, 27,5:277Ð282.
Kirk, D. and B. Pillet. 1998. ÒFertility levels, trends, anddifferentials in sub-Saharan Africa in the 1980s and1990s.Ó Studies in Family Planning, 29,1:1Ð20.
Maggwa, N. and I. Askew. 1997. Integrating STI/HIVManagement Strategies into Existing MCH/FPPrograms: Lessons from Case Studies in East andSouthern Africa. Population Council, Nairobi, Kenya.
Mensch, B., R. Miller, A. Fisher, J. Mwita, N. Keyonzo,F.M. Ali, and C. Ndeti. 1994. ÒA Situation Analysis ofcity commission clinics.Ó International FamilyPlanning Perspectives, 20,2:48Ð54.
Miller, K. and A. Rosenfield. 1996. ÒPopulation andwomenÕs reproductive health: An international per-spective.Ó Annual Review of Public Health, 17:359Ð382.
Miller, R., L. Ndhlovu, M. Gachara, and A. Fisher. 1992.ÒSituation Analysis study of KenyaÕs family plan-ning program.Ó In Jain, A., Ed., Managing Quality ofCare in Population Programs. Kumarian Press, WestHartford.
Miller, R. and R. Frerichs. 1992Ð1993. ÒAn integratedapproach to Operations Research for strengtheningfamily planning programs: A case example inKenya.Ó International Quarterly of Community HealthEducation, 13,3:183Ð199.
Miller, R., A. Fisher, K. Miller, L. Ndhlovu, N. Maggwa,I. Askew, D. Sanogo, and P. Tapsoba. 1997. TheSituation Analysis Approach to Assessing FamilyPlanning and Reproductive Health Services: A Handbook.Population Council, New York.
National Research Council. 1993. Factors AffectingContraceptive Use in Sub-Saharan Africa. NationalAcademy Press, Washington, D.C.
Ndhlovu, L. 1998. ÒLessons learned from SituationAnalysis studies in Africa.Ó Paper presented at theAnnual Meeting of the Population Association ofAmerica, Chicago.
Phillips, J. and W. Greene. 1993. Community BasedDistribution of Family Planning in Africa: Lessons from
OV
ER
VIE
W
Introduction 11

Operations Research (Final Report). PopulationCouncil, New York.
Pritchett, L. 1994. ÒDesired fertility and the impact ofpopulation policies.Ó Population and DevelopmentReview, 20,1:1Ð55.
Rosen, J. and S. Conly. 1998. AfricaÕs PopulationChallenge: Accelerating Progress in Reproductive Health.Population Action International, Washington, D.C.
Ross, J., W.P. Mauldin, and V. Miller. 1993. FamilyPlanning and Population: A Compendium ofInternational Statistics. United Nations PopulationFund and Population Council, New York.
Shane, B. and K. Chalkley. 1998. From Research to Action:How Operations Research Is Improving ReproductiveHealth Services. Population Reference Bureau,Washington, D.C.
UNAIDS and World Health Organization. 1998. Reporton the Global HIV/AIDS Epidemic: June 1998. UNAIDSand WHO.
Van de Walle, E. and A. Foster. 1990. Fertility Decline inAfrica: Assessment and Prospects. Technical Paper No.125, African Technical Department Series, WorldBank, Washington, D.C.
NOTES
1 Throughout this chapter, as elsewhere in the volume,clients are referred to in the feminine form, since vir-tually all clients of African integrated maternal andchild health (MCH) centers are women. At the sametime, it is recognized that the clients of some pro-grams are men.
2 Problem identification, strategy selection, strategyexperimentation, dissemination of results, and uti-lization of results.
3 A more complete description of the SituationAnalysis methodology is presented in the SituationAnalysis Handbook (Miller et al., 1997).
4 See Annex 1-1 for details on sampling.5 Data from the fifth instrument (exit interview with
MCH clients) are not used in this volume, so samplesizes are not given.
12 Clinic-Based Family Planning and Reproductive Health Services in Africa

Situation Analysis results should be interpreted inlight of the unique set of circumstances facing eachfamily planning program at the time of the study.Political support, client characteristics, programmaturity, and the state of the AIDS epidemic ineach country all affect the ability of programs todeliver high-quality care, and they all vary amongthe 12 study sites included here. This chapter pro-vides a brief description of each of the 12 studysites and the status of its family planning programat the time of the Situation Analysis fieldwork. Thedescriptions also include information on the pop-ulation of family planning clients, such as age,marital status, and reproductive intentions, asgathered from the Situation Analysis exit inter-views. Annex 2-1 contains the detailed results ofthese client characteristics.
Program maturity is categorized using anapproach developed by Destler and colleagues(1990). This framework groups family planningprograms into five levels based on the prevalencerate of modern contraceptives (CPR) in that coun-try. The programs in a given category tend to sharecertain general characteristics:■ Emergent programs (0% to 7% CPR) have lim-
ited service delivery and low levels of familyplanning awareness among the population.
■ Launch programs (8% to 15%) possess a broad-er institutional base as compared with theemergent level and offer increased access to awider range of contraceptive methods.
■ Growth programs (16% to 34%) have success-fully reached a large portion of the more urbanand better-educated populace, with demandgrowing for services among other segments ofthe population and for long-term and perma-nent methods among all segments.
■ Consolidation programs (35% to 49%) have amore heterogeneous, younger clientele; a highCPR among the urban and educated popula-tions; and expanding services for the rural andpoor. In addition, while the public sectorremains the primary provider for clinical meth-ods such as the IUD and sterilization, the pri-vate sector is beginning to assume responsibili-ty for delivering temporary methods.
■ Mature programs (50% and over) are effective-ly reaching most segments of the population.The most popular methods are sterilization, theIUD, and oral contraceptives.The majority of the sites have CPRs below 15%:1
6 of the 12 programs studied fall into the launchcategory, and three others have emergent pro-grams. The analysis also includes three of theregionÕs most successful family planning pro-grams: the programs of Botswana, Kenya, andZimbabwe have all attained growth status (and yetBotswana and Zimbabwe are two of the countrieshardest hit by the HIV/AIDS pandemic). All thesites show a substantial increase in program effortscores between 1982 and 1989,2 and in most cases,contraceptive prevalence is on the rise. The sitesexhibit high total fertility rates (TFRs), rangingfrom 4.5 to nearly 7.43; TFRs are declining in allsites, however, in some more precipitously than inothers. In all sites, the local Ministry of Health is byfar the largest source of family planning servicesfor contraceptive users.
Estimates of HIV seroprevalence among thegeneral populations of the study sites range from0.1% in Madagascar to 17Ð18% in Botswana,Zambia, and Zimbabwe. Two-thirds of the studysites have seroprevalence rates over 6%. Amongurban antenatal clients, HIV seroprevalence rates
Descriptions of the Family Planning Programs Studied 13
OV
ER
VIE
W
Descriptions of the Family PlanningPrograms StudiedKate Miller and Brian Pence
2
were measured at over 10% in two-thirds of thesites and at over 25% in Botswana, Zambia, andZimbabwe.4 Since heterosexual sex is by far themost common mode of HIV transmission in sub-Saharan Africa (World Bank, 1997), family planningprograms in the region have an increased responsi-bility to inform and protect clients in this regard.
The following descriptions of program contextare based on Situation Analysis reports, Demo-graphic and Health Survey (DHS) data, UnitedNations and World Bank databases, and resultsfrom the 12 Situation Analysis studies themselves.The list of references at the end of this chapterincludes citations of all the DHS and SituationAnalysis reports used here.
BOTSWANA
Population: 1.5 million
The Botswana family planning program is uniquein many ways. For one, family planning services inBotswana have historically been integrated withother health services, so no separate family plan-ning program has been established. Between 1982and 1989, the government sharply increased itsefforts on family planning services, and perhaps asa result, Botswana has one of the highest CPRs inthe region (29% of all women of reproductive agein 1988), and has experienced one of the steepestdrops in TFR over the last few decades (from 6.4 inthe late 1970s to 4.5 in the late 1990s). The methodmix in Botswana consists mainly of pills (61%),IUDs (16%), and injectables (11%), a mix that is fair-ly typical for the region.5 Botswana is also extreme-ly wealthy relative to the other 11 study sites: in1992 its per capita gross domestic product was over$3,000, as compared with a range of $100 to $1,000among the other countries.6
Botswana is a fairly small country, so the pro-gram also caters to a relatively small number ofwomen of reproductive age. When the SituationAnalysis was carried out in 1995, there were364,000 women of reproductive age in the country,as compared with several million in the otherstudy sites included here.7 However, Botswana isone of the countries hardest hit by the HIV
epidemic: seroprevalence in late 1994 was estimat-ed by the World Health Organization at fully 18%among the general adult population, and was mea-sured at 34% of urban antenatal clients in 1995.
The population of family planning clients inBotswana differs sharply from that in other coun-tries. Only 35% of clients in Botswana are in amonogamous union, and fully 46% are not in a for-mal union, a much higher percentage than in anyother study site. The clients are fairly young, witha mean age of 27; fully 13% are under 20 years old.The clients have a relatively small number of livingchildren (mean 2.5), and 59% want more children.Clients in Botswana are also particularly highlyeducated, and have an unusual pattern of religion:37% are African Spiritual, 31% are Protestant, and22% practice no religion at all.
BURKINA FASO
Population: 10.2 million
The Ministry of Health in Burkina Faso beganoffering family planning services in 1985 in thecapital city of Ouagadougou, and services quicklyexpanded thereafter across the country. An ambi-tious population policy adopted in 1991 set the tar-get CPR at 60%. Although the governmentÕsincreased attention to family planning is reflectedin a substantial rise in its program effort scoresbetween 1982 and 1989, the 1993 DHS found thatthe CPR among all women of reproductive age wasonly 4%. About half of these users were taking oral
14 Clinic-Based Family Planning and Reproductive Health Services in Africa
Summary: Botswana
At the time of the 1995 Situation Analysisstudy, Botswana had:❑ A growth-level family planning program.❑ High levels of political support for family
planning and a strong basis for domesticprogram funding.
❑ Significant contraceptive use.❑ A particularly educated client base.❑ A young and largely unmarried client base.❑ Extremely high HIV seroprevalence.

contraceptives, 22% were using condoms, and 17%IUDs. The TFR in Burkina Faso was consistentlyhigh (6.5) until quite recently, when it began todrop slightly.
The first Burkina Faso Situation Analysis tookplace in 1992 and the second in 1995 (see Chapter 11for a comparison of the results of these studies). Thecountry suffered a sizable loss in donor supportwhen the United States Agency for InternationalDevelopment (USAID) country mission was closedin 1994. Thus, although the family planning pro-gram had been in operation for 11 years by the timeof the 1995 Situation Analysis, it still ranked in theemergent category and had not achieved a highlevel of sustainability or effectiveness.
Burkina FasoÕs client base is almost 60%Muslim and about 30% Catholic. Although 60% arein a monogamous union, fully 28% are in polyga-mous unions, a finding that has ramifications forcontraceptive method mix because of the associat-ed risk of sexually transmitted infection (STI). In1994, HIV prevalence among the general adultpopulation was estimated to be 6.7%, and wasmeasured at 12% of urban antenatal clients. Familyplanning clients are among the least educatedacross the 12 study sites: 55% have no formal edu-cation, and fewer than 10% can read easily in eitherFrench or a local language. Reflecting the countryÕsfairly high fertility, clients have an average of 3.5living children, and two-thirds want more chil-
dren. The mean client age is 29, and 6% areteenagers.
CïTE DÕIVOIRE
Population: 12.7 million
The government of C�te dÕIvoire vigorouslyopposed the adoption of a family planning policylong after many of its neighbors had initiated fam-ily planning services; it was not until 1991 that thegovernment decided to offer family planning ser-vices through its maternal and child health (MCH)program. In that year, family planning serviceswere introduced in 13 clinics in the capital city ofAbidjan, with the intention of eventually expand-ing services throughout the country. The SituationAnalysis was undertaken in 1992 to help plannersidentify the strengths and weaknesses of the pro-gram in these clinics prior to the programÕs expan-sion. This Situation Analysis is therefore uniqueamong the 12 in that it involves only these 13 clin-icsÑnot a representative sample, but a census ofthe pilot project SDPs. The C�te dÕIvoire programis also by far the youngest of the 12 family plan-ning programs at the time of the Situation Analysisfieldwork. The results from C�te dÕIvoire must beinterpreted with these points in mind.
Like Burkina Faso, C�te dÕIvoire has one of themost persistently high TFRs in the region (over 7until quite recently). It also has a very low CPR ofunder 5% of currently married women, showingno great increase between 1980 and 1994. Much ofthis prevalence is accounted for by condom use(33% of all users). HIV prevalence among the gen-eral adult public in C�te dÕIvoire was estimated at6.8% in 1994, and measured at 12% in 1995Ð1996among urban antenatal clients. However, theSituation Analysis study took place several yearsbefore these estimates, so HIV prevalence mayhave been lower at that time. C�te dÕIvoire is alsorelatively wealthy. In 1992, its per capita grossdomestic product was over $1,000, much largerthan that of all other study sites except Botswana.
Family planning clients in C�te dÕIvoire havean average of 3.2 living children, but fully 85%express a desire for more children, reflecting the
Descriptions of the Family Planning Programs Studied 15
OV
ER
VIE
W
Summary: Burkina Faso
At the time of the 1995 Situation Analysisstudy, Burkina Faso had:❑ A long-standing but still emergent family
planning program.❑ Increasing levels of domestic political sup-
port for family planning, but decreasingdonor program support.
❑ Very low contraceptive use.❑ A fairly uneducated client population,
largely Muslim.❑ A large proportion of clients in polygamous
unions.❑ Fairly high HIV prevalence.

countryÕs extremely high fertility. About half ofclients are in a monogamous union, about 40% aresingle, and the remaining clients are in polyga-mous unions. About a third have no formal educa-tion. Religious affiliations are largely split amongMuslim, Catholic, and Animist. The clients are rel-atively young: 11% are under 20 years old.
GHANA
Population: 17.8 million
Although a National Family Planning Secretariathad been established in Ghana in 1969, its activitiesdid not at first succeed in significantly raising theCPR, which was about 10% of all women in 1979,or decreasing the TFR, which remained above 6until the late 1980s. However, government familyplanning efforts increased in the course of the1980s, as shown by an increase in program effortscores, and in 1991 the Ghana Family Planning andHealth Project was established to increase contra-ceptive prevalence and combat the spread of HIVand other STDs. This project placed renewedemphasis on family planning services, and since itwas undertaken, the TFR has fallen to 5.5. The CPRhas remained steady at 10%. The contraceptivemethod mix as measured in 1993 was characterizedby a fairly large reliance on condoms (28%), pills(30%), and injectables (13%).
HIV seroprevalence in Ghana is low relative toother countries reviewed here, but still reached anestimated 2.3% of the general population in 1994.The prevalence rate was measured at 2.2% of urbanantenatal clients in 1995. In general, the populationof Ghana shows one of the smallest differences inHIV prevalence between populations at high andlow risk of infection.
Most clients in Ghana are in a monogamousunion (72%), and about a fifth are in polygamousunions. ClientsÕ mean age is fairly high (31), andonly 2% are teenagers. Their religious affiliationsare divided among Protestant, Catholic, otherChristian, and Muslim. The mean number of chil-dren among clients is 3.6, and a relatively low per-centage (55%) express the desire for more children,reflecting the declining TFR. Clients are not verywell educated: 37% have had no education at all,and only 22% can read a letter in English or a locallanguage.
KENYA
Population: 30.5 million
The government of Kenya began to offer familyplanning services in 1967, long before many of itsneighbors. However, the program evolvedextremely slowly, and was judged ÒweakÓ by sev-eral evaluation efforts over the ensuing 20 years(see Miller et al., 1992). Nonetheless, the TFR inKenya did decline from about 8 in the late 1970s toabout 7 by the late 1980s. In 1987, the government
16 Clinic-Based Family Planning and Reproductive Health Services in Africa
Summary: Côte d’Ivoire
At the time of the 1992 Situation Analysisstudy, Côte d’Ivoire had:❑ An emergent pilot family planning pro-
gram.❑ Low but rising levels of domestic political
support for family planning, with possibili-ties for domestic program funding.
❑ Very low contraceptive use.❑ A large population of spacing clients.❑ Situation Analysis results from 13 extremely
new clinics.❑ Fairly high HIV prevalence.
Summary: Ghana
At the time of the 1996 Situation Analysisstudy, Ghana had:❑ A launch-level family planning program.❑ A declining TFR and a steady CPR.❑ Increasing political attention to family plan-
ning.❑ Relatively low HIV prevalence.❑ A relatively older, less-educated client base,
with declining fertility desires.
initiated a more serious commitment to familyplanning services, which is reflected in a largeincrease in program effort scores between 1982and 1989. After 1987, the TFR continued to decline,and the CPR continued to rise. Although the TFRis still high (5.8), its decline over the last twodecades has been one of the largest in the region.Thus, the 1995 Situation Analysis was carried outon a growth-level family planning program whichwas mature and largely effective, catering to a rel-atively large population of 6.25 million women ofreproductive age.
The client population in Kenya is over 90%Protestant, Catholic, or other Christian, and fully78% of clients are in monogamous unions. Clientsare also fairly well educated: only 11% have no for-mal education, and 62% can easily read in English.Their average age is 28, and 5% are below age 20.The mean number of living children per client is3.2, but only 41% want more children (the lowestresult of all 12 study sites), reflecting KenyaÕsdeclining TFR. The method mix among users inKenya consists mainly of pills (36%), injectables(27%), and IUDs (14%). Again consistent with thefalling TFR, 19% of users have had tubal ligations,a remarkably high percentage among these studysites. This method mix has consequences for STDtransmission: the HIV seroprevalence was estimat-ed in 1994 to be 8.3% of the general adult popula-tion, and in 1995 to be almost 14% of those attend-ing urban antenatal clinics.
MADAGASCAR (Antananarivo and Fianarantsoa)
Population: 15.4 million
Although family planning services were availablethrough an International Planned ParenthoodFederation (IPPF) affiliate in Madagascar startingin 1967, the Ministry of Health itself did not begina serious effort to offer services until about 1991,after a population policy had been put in place in1990. Since that date, there has been steady growthin the number and type of clinics offering familyplanning; in 1995, a population of 3.3 millionwomen of reproductive age was served. However,the TFR in Madagascar remained persistently high(6.6) until recently, and the 1992 DHS found a CPRamong all women of reproductive age of only 4%,indicating that the program remains in the emer-gent category. Of these users, about a third usedoral contraceptives, another third injectables, and14% condoms. A relatively high 17% have hadtubal ligations.
The 1996 Situation Analysis in Madagascar didnot cover the entire country, only the main urbanprovinces of Antananarivo and Fianarantsoa. Thedata are therefore not nationally representative,although for simplicity this study is referred to asthe Madagascar Situation Analysis.
HIV seroprevalence in Madagascar is extraor-dinarily low. It was estimated in 1994 to be 0.1% ofthe adult population, and the same prevalence wasfound among urban antenatal clients in 1995. Evenamong high-risk populations in major cities, HIVprevalence has been measured at only 0.3%. Forthis reason, the family planning program inMadagascar has a unique opportunity to assist thecountryÕs health system in preventing the epidem-ic altogether.
About a quarter of clients in Madagascar are ina polygamous union, and 69% are in a monoga-mous union. The client population appears to befairly well educated: only 5% have had no formaleducation, and although almost none can read inFrench, 66% can read easily in their local language.The average age of clients is 30, and only 3% areteenagers. The vast majority of clients are eitherProtestant or Catholic. Fewer than half express a
Descriptions of the Family Planning Programs Studied 17
OV
ER
VIE
W
Summary: Kenya
At the time of the 1995 Situation Analysisstudy, Kenya had:❑ A growth-level family planning program.❑ High levels of domestic political support for
family planning.❑ A rising CPR and falling TFR.❑ A fairly well-educated, largely Christian,
and monogamous population of clients.❑ A relatively small population of spacing
clients.❑ Fairly high HIV prevalence.
desire for more children, a relatively low result thatis probably related to the fairly high prevalence oftubal ligation.
NIGERIA
Population: 102.1 million
Nigeria is by far the most populous country inAfrica. At the time of the Situation Analysis studyin 1992, the family planning program in Nigeriahad to serve an overwhelming population of over23 million women of reproductive age. Seriousgovernmental attention to family planning servicesdid not begin until 1983, when substantial donorsupport became available, and a national popula-tion policy was adopted in 1988. The effect of thisattention can be seen in a steep rise in programeffort scores between 1982 and 1989. However, theTFR in Nigeria has consistently remained at about6.5, and the low CPR (8%) showed no changebetween 1981 and 1990. In more recent years, theTFR has begun to fall.
HIV prevalence was estimated in 1994 to be2.2% of the general adult population, and was mea-sured at 3.8% among a population of urban antena-tal clients in 1993Ð1994. The Situation Analysis tookplace a few years before these estimates, so preva-lence may have been lower at that point.
Family planning clients in Nigeria have onaverage 4.3 living children, the largest number of
any study site included here; 60% would like tohave another child. The client population is mod-erately educated, and split fairly evenly amongProtestants, Muslims, and Catholics. These clientsare among the oldest across the study sites: themean age is 31, and only 1% are below age 20. Two-thirds are in a monogamous union, and anotherquarter are in polygamous unions.
SENEGAL
Population: 8.1 million
In 1981 and 1982, major projects by USAID andthe United Nations Population Fund (UNFPA)enabled the first widespread provision of familyplanning services in Senegal through several non-governmental organizations (NGOs). In 1991, theadoption of a national population policy by thegovernment allowed the Ministry of PublicHealth to coordinate the NGO efforts through anational program of family planning. The increasein program effort scores between 1982 and 1989reflects this growing interest on the part of thegovernment.
The TFR in Senegal dropped steadily from 7 inthe late 1970s to 5.6 in the late 1990s. The CPR,although rising, remained under 10% throughoutthe 1980s. The method mix comprises mostly pills(45%), IUDs (27%), and condoms (16%); injectable
18 Clinic-Based Family Planning and Reproductive Health Services in Africa
Summary: Madagascar
At the time of the 1996 Situation Analysisstudy, Madagascar had:❑ An emergent family planning program.❑ Increasing levels of domestic political sup-
port for family planning.❑ A very low CPR and high but falling TFR.❑ A fairly well-educated, largely Christian
population of clients.❑ A relatively small population of spacing
clients.❑ Extraordinarily low HIV prevalence.
Summary: Nigeria
At the time of the 1992 Situation Analysisstudy, Nigeria had:❑ A family planning program that was on the
border between emergent and launch level,despite being long-standing.
❑ Increasing levels of domestic political sup-port for family planning.
❑ A persistently low CPR and a high TFR.❑ A moderately educated and relatively old
population of clients, commonly in polyga-mous unions.
❑ Relatively low HIV prevalence.

use is quite uncommon (2%). HIV prevalence inSenegal is fairly low: in 1994, 1.4% of the generaladult population were estimated to be infected,and 1.1% of urban antenatal clients were HIV-pos-itive. Rates among high-risk populations are some-what higher.
The vast majority of family planning clients inSenegal are Muslim. A relatively high proportion(27%) are in polygamous unions, and 60% are inmonogamous unions. The level of education isquite low: 41% have no formal education, 20% canread in French, and only 2% can read in a local lan-guage. Senegalese clients have an average ofalmost 4 living children, a relatively high numberfor these study sites, and 73% want more children,reflecting the higher TFR of 1994. The mean age is30, and 4% are teenagers.
TANZANIA (See also Zanzibar)
Population: 27.3 million
In 1974, the government of Tanzania officially per-mitted its health facilities to offer family planning,but the actual provision of services was slow tocome about. By 1982, 37% of clinics were offeringfamily planning, and by 1987, 80%. A national pop-ulation policy was approved in 1992, and donorsupport began to increase thereafter. Of all thestudy sites included in this analysis, Tanzania has
since the late 1980s had the lowest per capita grossdomestic product ($100 in 1992).
Tanzania is one of the most populous countriesin sub-Saharan Africa; in 1992 the population ofwomen of reproductive age was 6.27 million. HIVprevalence is fairly high, estimated at 6.4% of thegeneral adult population in 1994, and measured atabout 14% of clients of urban antenatal clinics in1995Ð1996. The TFR in Tanzania has declined from6.8 in the late 1970s to a recent 5.5. The CPR amongall women has been growing steadily, but remainsat just above 10%. Most users take oral contracep-tives (41%), but a large proportion use the injectable(32%) and condoms (11%); sterilization accounts fora relatively high 12% of the method mix.
Clients in Tanzania have an average of 3.4 liv-ing children, and fully three-quarters express thedesire for more children. The population is fairlyyoung, with a mean age of 27, and 8% are underage 20. In light of these high fertility desires andthis young age distribution, the relatively commonuse of tubal ligation is surprising. The majority ofclients (70%) are in monogamous unions, with therest divided almost evenly between polygamousunions and single status. Clients are dividedamong the Muslim, Catholic, and Protestant faiths,and levels of education are moderate as comparedwith the other study sites (18% have no formaleducation).
Descriptions of the Family Planning Programs Studied 19
OV
ER
VIE
W
Summary: Senegal
At the time of the 1994 Situation Analysisstudy, Senegal had:❑ A launch-level family planning program.❑ High levels of political support for family
planning.❑ A low but rising CPR and high but falling
TFR.❑ A largely Muslim, uneducated client base
with high fertility desires.❑ A relatively high proportion of clients in
polygamous unions.❑ Relatively low HIV prevalence. Summary: Tanzania
At the time of the 1992 Situation Analysisstudy, Tanzania had:❑ A launch-level family planning program.❑ Low but rising political support for family
planning, and little basis for domestic finan-cial program support.
❑ A low but rising CPR and declining TFR.❑ A mixed-religion, moderately educated, rel-
atively young client base with high fertilitydesires.
❑ A relatively high proportion of clients inpolygamous unions.
❑ Fairly high HIV prevalence.

ZAMBIA
Population: 9.4 million
ZambiaÕs National Family Planning Program waslaunched in 1992 in response to a population poli-cy adopted in 1989. The program is focused on ser-vice delivery; information, education, and commu-nication (IEC); commodity and equipment logis-tics; and training. In 1993, USAID launched aZambia Family Planning Services project to assistin strengthening family planning services.Although this project did not get fully under wayuntil the early 1990s, the TFR in Zambia has beenfalling since the late 1970s, from 7.2 to about 5.5 in1997. Program effort scores rose dramaticallybetween 1982 and 1989, but the CPR, althoughincreasing, was still only about 10% of all womenin 1996. The method mix is typically heavy on thepill (41%) and injectables (32%), but sterilization isalso relatively common (12%).
As part of the ÒAIDS beltÓ in Southern Africa,Zambia has an extremely high HIV prevalence rate.It was estimated in 1994 that 17% of the generaladult population were infected, and prevalencewas measured at 27.9% of urban antenatal clientsin the same year.
Family planning clients in Zambia are relative-ly well educated (7% have no formal education). Amajority (71%) are in monogamous unions, and therest are split about evenly between polygamousand single. The vast majority of clients are eitherProtestant or Catholic, and the mean age is 28.Clients in Zambia have an average of 3.4 children,and 62% express the desire for more children.
ZANZIBAR (see also Tanzania)
Population: 800,000
Zanzibar consists of several islands lying off thecoast of Tanzania, and although it shares certaingovernment structures with Tanzania (home andforeign affairs, defense, communications, currency,and higher education), it is otherwise separate andindependent (see Mapunda, 1996). Since the tworegions have separate health systems, Zanzibar isincluded in this report as a separate study.
In contrast to Tanzania, Zanzibar has a verysmall client base: in 1995 the islands had an esti-mated 180,000 women of reproductive age. Familyplanning services first became available throughthe MCH system in 1985 under the ZanzibarFamily Planning Project, funded by UNFPA. Theseservices were available at 6 clinics initially, and atall 104 SDPs by 1994. The DHS studies for Tanzaniaincluded Zanzibar, so the results can be used as aproxy for Zanzibar as well. Again, fertility wasstubbornly high (6.8) until recently, when it beganto decline, and the CPR is increasing, although it isstill just above 10%.
Family planning clients in Zanzibar have anaverage of 4.2 children, almost the highest acrossthe study sites. Fully 75% express a desire for morechildren, reflecting the high fertility of the region.The clients are also almost exclusively Muslim(95%), and as in Tanzania, 71% are in a monoga-mous union, with the rest divided fairly evenlybetween polygamous and single. The mean age is29, and 10% have no formal education.
20 Clinic-Based Family Planning and Reproductive Health Services in Africa
Summary: Zambia
At the time of the 1997 Situation Analysisstudy, Zambia had:❑ A launch-level family planning program.❑ Increasing domestic political support for
family planning.❑ A steadily declining TFR but low CPR.❑ Extremely high HIV prevalence.❑ Relatively well-educated clients, most in
monogamous unions.
Summary: Zanzibar
At the time of the 1995 Situation Analysisstudy, Zanzibar had:❑ A launch-level family planning program.❑ Low but rising political support for family
planning, and little basis for domestic finan-cial program support.
❑ A low but rising CPR and persistently highTFR.
❑ A Muslim client base with high fertilitydesires.

ZIMBABWE
Population: 11.4 million
The family planning program in Zimbabwe isclearly one of the most successful in sub-SaharanAfrica. Although the first scattered family plan-ning services were available in Zimbabwe in the1950s, the government officially introduced familyplanning into its general health system in 1981. In1985, the Zimbabwe National Family PlanningCouncil was formed to coordinate all the countryÕsfamily planning activities.
ZimbabweÕs TFR fell from 6.6 in the late 1970sto 4.5 about 20 years later. Moreover, the CPRamong all women of reproductive age is the high-est across the countries included here: 31% in 1994(a rate rivaled only by Botswana). This high levelof contraceptive use is credited mainly to theZimbabwe National Family Planning CouncilÕsemphasis on community-based distribution(CBD), which serves up to 30% of family planningclients. Because the CBD program has focused onpills, the method mix in Zimbabwe is stronglydominated by that method (77% of users).
HIV prevalence in Zimbabwe is among thehighest in Africa. It was estimated at 17.4% of thegeneral adult population in 1994, and measured atfully 35% among urban antenatal clients in
1995Ð1996. Among urban, high-risk populations,the prevalence is 86%.
Fully 86% of clients in Zimbabwe are in amonogamous union, by far the highest proportionof all the study sites; only 2% are in a polygamousunion, and the remaining 12% are single. Clientshave an average of 3 living children, and 55%express a desire for more; both these figures are rel-atively low and reflect the plunging TFR inZimbabwe. The great majority (85%) of clients areProtestant, Catholic, or other Christian. Clients arefairly well educated: 47% can read in English, 71%can read in a local language, and only 8% have hadno formal education. The mean age is 28.
Descriptions of the Family Planning Programs Studied 21
OV
ER
VIE
W
Summary: Zimbabwe
At the time of the 1997 Situation Analysisstudy, Zimbabwe had:❑ A growth-level family planning program.❑ Extraordinarily high levels of domestic polit-
ical support for family planning.❑ A strong CBD program that serves a third of
contraceptive users.❑ Extremely high HIV prevalence.❑ A fairly well-educated client population with
declining fertility desires.
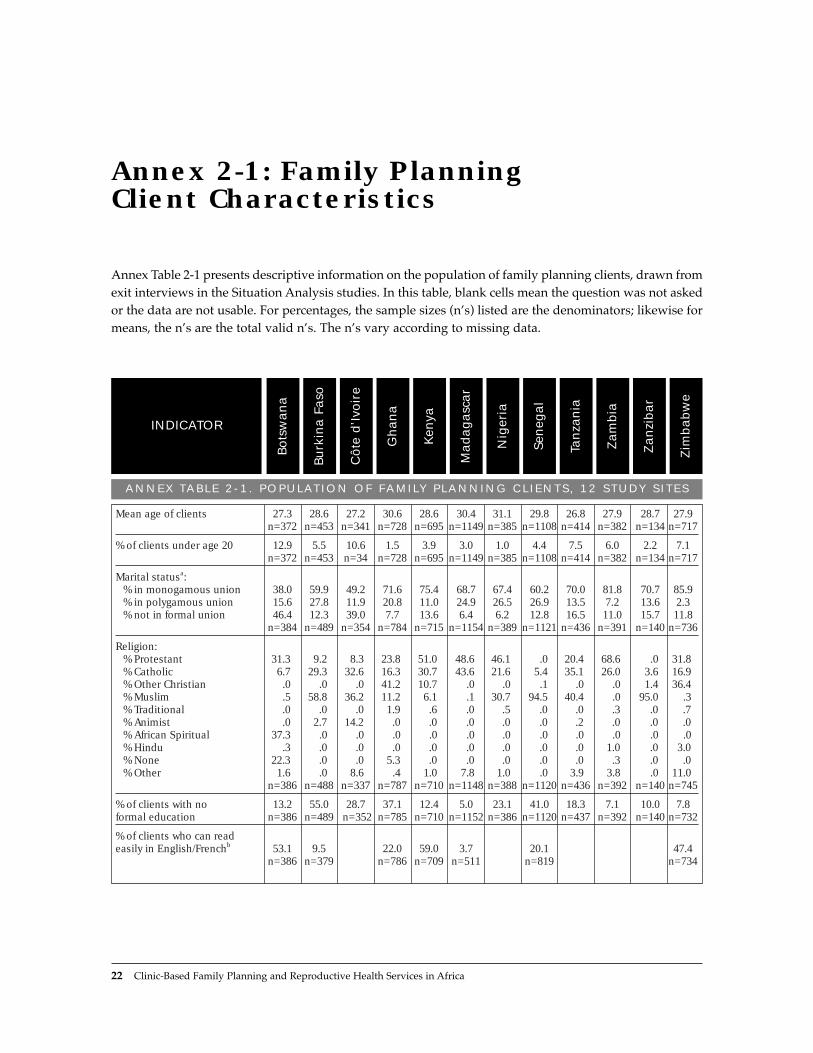
Annex Table 2-1 presents descriptive information on the population of family planning clients, drawn fromexit interviews in the Situation Analysis studies. In this table, blank cells mean the question was not askedor the data are not usable. For percentages, the sample sizes (nÕs) listed are the denominators; likewise formeans, the nÕs are the total valid nÕs. The nÕs vary according to missing data.
22 Clinic-Based Family Planning and Reproductive Health Services in Africa
Annex 2-1: Family Planning Client Characteristics
ANNEX TABLE 2-1 . POPULAT ION OF FAMILY PLANNING CL IENTS, 12 STUDY S ITES
Zim
bab
we
Zan
zib
ar
Zam
bia
Tan
zan
ia
Sen
egal
Nig
eria
Mad
ag
asc
ar
Ken
ya
Gh
an
a
Côte
d’I
voir
e
Burk
ina F
aso
Bots
wan
a
INDICATOR
Mean age of clients 27.3 28.6 27.2 30.6 28.6 30.4 31.1 29.8 26.8 27.9 28.7 27.9n=372 n=453 n=341 n=728 n=695 n=1149 n=385 n=1108 n=414 n=382 n=134 n=717
% of clients under age 20 12.9 5.5 10.6 1.5 3.9 3.0 1.0 4.4 7.5 6.0 2.2 7.1n=372 n=453 n=34 n=728 n=695 n=1149 n=385 n=1108 n=414 n=382 n=134 n=717
Marital statusa:% in monogamous union 38.0 59.9 49.2 71.6 75.4 68.7 67.4 60.2 70.0 81.8 70.7 85.9% in polygamous union 15.6 27.8 11.9 20.8 11.0 24.9 26.5 26.9 13.5 7.2 13.6 2.3% not in formal union 46.4 12.3 39.0 7.7 13.6 6.4 6.2 12.8 16.5 11.0 15.7 11.8
n=384 n=489 n=354 n=784 n=715 n=1154 n=389 n=1121 n=436 n=391 n=140 n=736
Religion:% Protestant 31.3 9.2 8.3 23.8 51.0 48.6 46.1 .0 20.4 68.6 .0 31.8% Catholic 6.7 29.3 32.6 16.3 30.7 43.6 21.6 5.4 35.1 26.0 3.6 16.9% Other Christian .0 .0 .0 41.2 10.7 .0 .0 .1 .0 .0 1.4 36.4% Muslim .5 58.8 36.2 11.2 6.1 .1 30.7 94.5 40.4 .0 95.0 .3% Traditional .0 .0 .0 1.9 .6 .0 .5 .0 .0 .3 .0 .7% Animist .0 2.7 14.2 .0 .0 .0 .0 .0 .2 .0 .0 .0% African Spiritual 37.3 .0 .0 .0 .0 .0 .0 .0 .0 .0 .0 .0% Hindu .3 .0 .0 .0 .0 .0 .0 .0 .0 1.0 .0 3.0% None 22.3 .0 .0 5.3 .0 .0 .0 .0 .0 .3 .0 .0% Other 1.6 .0 8.6 .4 1.0 7.8 1.0 .0 3.9 3.8 .0 11.0
n=386 n=488 n=337 n=787 n=710 n=1148 n=388 n=1120 n=436 n=392 n=140 n=745
% of clients with no 13.2 55.0 28.7 37.1 12.4 5.0 23.1 41.0 18.3 7.1 10.0 7.8formal education n=386 n=489 n=352 n=785 n=710 n=1152 n=386 n=1120 n=437 n=392 n=140 n=732
% of clients who can read easily in English/Frenchb 53.1 9.5 22.0 59.0 3.7 20.1 47.4
n=386 n=379 n=786 n=709 n=511 n=819 n=734

ANNEX TABLE 2-1. POPULATION OF FAMILY PLANNING CLIENTS, 12 STUDY SITES (concluded)
Zim
bab
we
Zan
zib
ar
Zam
bia
Tan
zan
ia
Sen
egal
Nig
eria
Mad
ag
asc
ar
Ken
ya
Gh
an
a
Côte
d’I
voir
e
Burk
ina F
aso
Bots
wan
a
INDICATOR
% of clients who can read easily in a local language 79.0 3.7 22.1 65.8 2.2 71.4
n=386 n=379 n=787 n=518 n=819 n=746
Mean number of living children among clients 2.5 3.5 3.2 3.6 3.4 3.6 4.3 3.9 3.4 3.4 4.2 2.9
n=386 n=460 n=353 n=785 n=710 n=1144 n=389 n=1112 n=437 n=391 n=140 n=733
% of clients who want more childrenc 58.6 67.4 84.5 57.0 39.0 42.8 59.9 73.3 75.4 62.3 76.5 55.4
n=353 n=475 n=336 n=739 n=672 n=1081 n=354 n=1094 n=427 n=374 n=136 n=677
a “Monogamous union” includes monogamous marriage and cohabiting. “Polygamous union” includes polygamousmarriage and visiting. “No formal union” includes single, divorced, separated, and widowed.
b French applies in Madagascar, Burkina Faso, and Senegal, whereas English applies in Ghana, Zimbabwe,Botswana, and Kenya.
c Excludes the 2% of clients whose fertility decisions “depend on God” or “depend on husband.”
OV
ER
VIE
W
Descriptions of the Family Planning Programs Studied 23
REFERENCES
Demographic Health Surveys
Botswana, Central Statistical Office. 1988. BotswanaDemographic and Health Survey, 1988. MacroInternational, Calverton, MD.
Burkina Faso, Institut National de la Statistique et de laD�mographie. 1994. Enqu�te D�mographique et deSant�, Burkina Faso, 1993. Macro International,Calverton, MD.
C�te dÕIvoire, Institut National de la Statistique. 1995.Enqu�te D�mographique et de Sant�, C�te dÕIvoire, 1994.Macro International, Calverton, MD.
Ghana, Ghana Statistical Service. 1994. GhanaDemographic and Health Survey, 1993. MacroInternational, Calverton, MD.
Kenya, Central Bureau of Statistics. 1994. KenyaDemographic and Health Survey, 1993. MacroInternational, Calverton, MD.
Madagascar, Centre National de Recherches surlÕEnvironnement. 1994. Enqu�te NationaleD�mographique et Sanitaire, 1992. Macro International,Calverton, MD.
Nigeria, Federal Office of Statistics. 1992. NigeriaDemographic and Health Survey, 1990. MacroInternational, Calverton, MD.
Senegal, Minist�re de lÕEconomie, des Finances et duPlan. 1997. Enqu�te D�mographique et de Sant� auS�n�gal, 1994. Macro International, Calverton, MD.
Tanzania, Bureau of Statistics. 1997. TanzaniaDemographic and Health Survey, 1996. MacroInternational, Calverton, MD.
Zambia, Central Statistical Office. 1993. ZambiaDemographic and Health Survey, 1992. MacroInternational, Calverton, MD.
Zanzibar. See Tanzania.
Zimbabwe, Central Statistical Office. 1995. ZimbabweDemographic and Health Survey, 1994. MacroInternational, Calverton, MD.
Situation Analysis Studies
BotswanaBaakile, B., N. Maggwa, L. Maribe, and R. Miller. 1996.
A Situation Analysis of the Maternal and ChildHealth/Family Planning (MCH/FP) Program inBotswana. Ministry of Health MCH/FP Unit andPopulation Council, Botswana.
Burkina FasoBakouan, D., P. Sebgo, I. Askew, Y. Ouedraogo, P.
Tapsoba, C. Viadro, and S. Kanon. 1992. AnalyseSituationnelle du Programme de Planification Familialeau Burkina Faso. Minist�re de la Sant�, de l'ActionSociale et de la Famille, Direction de la Sant� de laFamille, and Population Council, Burkina Faso.
Bamba, A., B. Millogo, J. Nougtara, Y. Ouedraogo, P.Tapsoba, and I. Kabore. 1996. Rapport Final: Deuxi�me

Analyse Situationnelle du Programme de PlanificationFamiliale au Burkina Faso. Minist�re de la Sant�,Direction de la Sant� de la Famille, and PopulationCouncil, Burkina Faso.
C�te dÕIvoireKouakou, K., K. Kouame, and D. Huntington. 1992.
Analyse Situationnelle du Programme dÕExtension desServices de Planification Familiale en C�te dÕIvoire.Association Ivoirienne pour le Bien-ætre Familial andPopulation Council, New York.
GhanaTwum-Baah, K., P. Wolf, P. Nyarko, and H. Odai. 1994.
A Situation Analysis Study of Family Planning ServiceDelivery Points in Ghana. Ghana Statistical Service,USAID, and Population Council, Accra, Ghana.
Twum-Baah, K., E. Ameka, E. Okrah, and A. Ohene-Okai. 1997. Second Round Situation Analysis Study ofFamily Planning Service Delivery Points in Ghana.Ghana Statistical Service, Accra, Ghana.
KenyaMiller, R., L. Ndhlovu, and M. Gachara. 1989. A
Situation Analysis of the Family Planning Program ofKenya: The Availability, Functioning, and Quality ofMOH Services. Population Council, New York.
Ndhlovu, L., J. Solo, R. Miller, K. Miller., and A.Omunde. 1997. An Assessment of Clinic-Based FamilyPlanning Services in Kenya: Results from the 1995Situation Analysis. Ministry of Health, Division ofFamily Health, Nairobi, Kenya, and the PopulationCouncil, New York.
MadagascarMinist�re de la Sant�, R�publique du Madagascar. 1996.
Analyse Situationnelle du Syst�me de Prestation deServices de Planification Familiale dans les ProvincesdÕAntananarive et de Fianarantsoa: Rapport de Synth�se.Population Council, New York.
NigeriaFederal Ministry of Health, Nigeria. 1992. Nigeria: The
Family Planning Situation Analysis Study. PopulationCouncil, New York.
SenegalMinist�re de la Sant� et de lÕAction Sociale du S�n�gal
and Population Council. 1995. Analyse Situationnelledu Syst�me de Prestation de Services de PlanificationFamiliale au S�n�gal: Rapport Final. PopulationCouncil, Dakar, Senegal.
TanzaniaMinistry of Health, Tanzania. 1992. Tanzania: The Family
Planning Situation Analysis Study. PopulationCouncil, New York.
ZambiaCentral Statistical Office, Zambia. 1998. Zambia Situation
Analysis, 1997. Central Statistical Office andPopulation Council, Zambia.
ZanzibarMapunda, P. 1996. The Zanzibar Family Planning
Situation Analysis Study. Ministry of Health andPopulation Council, Tanzania.
ZimbabweZimbabwe National Family Planning Council,
Population Council, and SEATS. 1992. Zimbabwe: ASituation Analysis of the Family Planning Programme.Population Council, Harare, Zimbabwe.
Dube, H., C. Marangwanda, and L. Ndhlovu. 1998. AnAssessment of the Zimbabwe Family PlanningProgramme: Results from the 1996 Situation AnalysisStudy. Evaluation and Research Unit, ZimbabweNational Family Planning Council, and thePopulation Council, Harare, Zimbabwe and Nairobi,Kenya.
Other References
Destler, H., D. Liberi, J. Smith, and J. Stover. 1990.Family Planning: Preparing for the 21st Century. UnitedStates Agency for International Development,Washington, D.C.
Lapham, R.J. and W.P. Mauldin. 1985. "Contraceptiveprevalence: The influence of organized family plan-ning programs." Studies in Family Planning,16,3:117Ð137.
Mapunda, P.S. 1996. The Zanzibar Family PlanningSituation Analysis Study. Zanzibar Family PlanningProgram, Zanzibar, Tanzania.
Miller, R., L. Ndhlovu, M. Gachara, and A. Fisher. 1992."Situation Analysis Study of Kenya's FamilyPlanning Program." In Jain, A., Ed., Managing Qualityof Care in Population Programs. Kumarian Press,Connecticut.
Ross, J., W.P. Mauldin, and V. Miller. 1993. FamilyPlanning and Population: A Compendium ofInternational Statistics. United Nations PopulationFund and Population Council, New York.
United Nations. 1997. Demographic Yearbook 1995.United Nations, Department for Economic andSocial Information and Policy Analysis, StatisticsDivision, New York.
United Nations. 1996a. Demographic Yearbook 1994.United Nations, Department for Economic andSocial Information and Policy Analysis, StatisticsDivision, New York.
United Nations. 1996b. Statistical Yearbook 1994. UnitedNations, Department for Economic and Social
24 Clinic-Based Family Planning and Reproductive Health Services in Africa
Information and Policy Analysis, Statistics Division,New York.
World Bank. 1997. Confronting AIDS: Public Priorities ina Global Epidemic. World Bank, Washington, D.C.
NOTES
1 All CPRs are from the relevant Demographic andHealth Surveys (DHS) (see the list of references atthe end of this chapter). Unless otherwise noted,CPRs are reported for all women of reproductiveage and include only modern methods.
2 Program effort scores are from two rounds of studies(in 1982 and 1989) by Lapham, Mauldin, and Rossthat measure a governmentÕs commitment to itsfamily planning program. Information is collectedon official national policies, service-related activities,national recordkeeping and evaluation programs,and availability and accessibility of contraceptivesupplies and services. This information is then
standardized to a score ranging from 0 to 100 thatrepresents the percentage of the maximum effortthat is being applied. For this chapter, all programeffort scores are from Ross et al. (1993).
3 All TFRs are from United Nations (1997).4 All HIV seroprevalence levels are from World Bank
(1997). The 1994 prevalence rates among generaladult populations are World Bank estimates, andprevalence rates among urban antenatal clients arefrom studies contained in the U.S. CensusHIV/AIDS Surveillance Database. All rates are forHIV-1.
5 All information on method mixes is from the rele-vant DHS studies, and is for all women of reproduc-tive age using modern methods.
6 All gross domestic products are from UnitedNations (1996b).
7 All populations of women of reproductive age arecalculated from United Nations (1996a), with sup-plemental information on women of reproductiveage as a percent of total population from UnitedNations (1997).
Descriptions of the Family Planning Programs Studied 25
OV
ER
VIE
W


II. BASIC STUDY FINDINGS& THEIR UTILIZATION
3
Indicators ofReadiness and Quality: Basic Findingspresents the overall findings ofapproximately 100 indicatorsof the readiness and quality offamily planning services in the12 study sites.
4
Using SituationAnalysis to ImproveReproductive Health Programsexamines how SituationAnalysis is being used not onlyto assess program strengthsand weaknesses, but also, forexample, to evaluate changesin programs over time andmeasure the impact of interventions.


BA
SIC
ST
UD
Y F
IND
ING
S
& T
HE
IR U
TIL
IZAT
ION
Indicators of Readiness and Quality: Basic Findings 29
One objective of Situation Analysis studies is todescribe the readiness and quality of family plan-ning services offered at service delivery points(SDPs). A general description of services in sub-Saharan Africa can be constructed from over 100indicators generated by each of the 12 SituationAnalysis studies included in this volume. Thatdescription indicates various strengths and weak-nesses of the 12 programs and, most important,identifies those aspects of services most criticallyin need of attention. To some extent, the quality ofa countryÕs services is related to the maturity of itsfamily planning program, but certainly not all theresults reported here follow this pattern.
Many of the consistent program strengthsrevolve around readiness to provide services:
■ The infrastructure of most SDPs, especially inurban areas, is quite serviceable, and manyhave the equipment required for basic familyplanning services.
■ The pattern of methods offered is in some waysquite appropriate, the one serious problembeing the lack of full availability of condoms insome countries.
■ Stockout rates for most methods appear gener-ally to be under control, with the exception ofinjectables.
Several strengths are also evident in the quality ofservices given to clients:
■ The physical assessment of new family plan-ning clients with weight, blood pressure, lastmenstrual period, and medical history, forexample, is carried out fairly consistently.
■ The quality of injections is quite high in mostcountries, especially with regard to aseptic pro-ceduresÑan important finding given theincreasing use of injectables in many contexts.
■ Across all the study sites, the vast majority ofclients are given revisit dates, thereby encour-aging continuity of method use.
However, three overall weaknesses are clearly evi-dent and call for direct attention:
■ Counseling on family planning is broadly lack-ing across all study sites, in terms of both infor-mation taken from the client and informationgiven to the client about her method. Theseactivities are particularly important becausethey are directly related to client satisfaction,appropriateness of method selected, continuityof use, and sexually transmitted disease(STD)/HIV risk.
■ Aseptic procedures are not always followed,which is extremely serious given the highSTD/HIV prevalence in many countries. Inparticular, findings related to availability ofclean water, handwashing and glove use during pelvic exams, and use of sterileinstruments during IUD insertion raise thisconcern.
ClientsÕ STD/HIV risk is generally not ade-quately addressed. Availability of condoms isquite low in some contexts, and where available,they are often not discussed with clients.Moreover, clients are rarely told how their methodrelates to STD/HIV transmission or screened forSTD symptoms.
KEY POINTS AND CONCLUSIONS
Indicators of Readiness and Quality: Basic Findings
3


This chapter presents the basic findings from themost recent Situation Analysis studies in the 12 sub-Saharan African countries described in Chapter 2. Itincludes over 100 indicators calculated in as manystudies as the data will allow, resulting in an over-all picture of the quality of family planning servicesin the region. These indicators reflect the readinessof programs to provide services and the quality ofservices delivered, as defined by the Bruce-Jainquality-of-care framework (see Chapter 1 for a dis-cussion of this framework).1
The indicators are grouped under the various ele-ments of readiness, such as infrastructure and com-modity management, and of quality of care deliv-ered, such as technical competence and informationexchange. The indicators within each element arediscussed individually, and a summary of each ele-ment is then presented under the heading ÒGeneralAssessment.Ó For ease of tracking and cross-refer-encing, the elements and indicators are numberedconsecutively according to the following scheme:elements under readiness and quality are numbered,respectively, R.1, R.2, ... and Q.1, Q.2, .... Indicatorsare then numbered R.1-1, R.1-2, and so on. For exam-ple, R.1-1 is the first indicator discussed under thefirst element of readiness, while Q.3-2 is the secondindicator discussed under the third element of qual-ity. Readers who are interested in an overview of theresults may want to read only the general assessmentsections and the concluding section of the chapter.Those who want more detail on a particular elementmay wish to read the individual indicator results andalso refer to Annex 3-1, which contains all the resultsand sample sizes in tabular form, in the order inwhich they are discussed in the text. Annex 3-1 also provides a more detailed breakdown of the
indicators discussed in the main text. References forall of the Situation Analysis studies and Demo-graphic and Health Surveys (DHS) used here aregiven at the end of Chapter 2.
READINESS TO PROVIDE SERVICES
R.1 Infrastructure and Facilities
R.1-1 Do SDPs have adequate waiting areas?Family planning clients should have an appropriateplace to wait for services. For this indicator, an Òade-quateÓ waiting area is defined as an area protectedfrom both rain and sun and with enough seats toaccommodate the average daily client load. Theresults range from about 50% of service deliverypoints (SDPs) in Tanzania and Madagascar to 100%in C�te dÕIvoire. In 7 of the 12 study sites, 86% ormore of the SDPs have an adequate waiting area.
R.1-2 Do SDPs have electricity and piped runningwater?Electricity and clean water are both essential to theprovision of certain types of family planning ser-vices. Although they may not be necessary for thedispensing of pills, they are needed for the inser-tion of IUDs, which requires aseptic proceduresand sterile instruments. In most cases, injectablesare given with disposable needles, but in some clin-ics, sterilization of needles is still necessary.
The availability of electricity and water variesconsiderably across the study sites.2 In Senegal andGhana, almost all SDPs have electricity, but inZanzibar, the proportion is just 36%. Similarly, 91%of SDPs have piped running water in Botswana,
BA
SIC
ST
UD
Y F
IND
ING
S
& T
HE
IR U
TIL
IZAT
ION
Indicators of Readiness and Quality: Basic Findings 31
Indicators of Readiness and Quality: Basic FindingsKate Miller, Heidi Jones, and Marjorie C. Horn
3

but only 44% in Zambia. The availability of elec-tricity and water is strongly determined by thelocation of the SDP. For each study site, both elec-tricity and water are significantly more available inurban and semi-urban SDPs than in rural SDPs (p < .01).3 However, rural SDPs may obtain bothwater and energy from alternative sources. TheKenya Situation Analysis report in particular notesthat some rural SDPs collect rainwater and burngas or firewood for heating.
R.1-3 Do SDPs have working toilets for clients?In many cases, clients wait for several hours forfamily planning services, so SDPs should haveworking toilets available to clients. In 10 of the 12study sites, 74% or more of the SDPs have workingtoilets for clients. The proportion is somewhatlower in Madagascar (56%) and Zanzibar (61%),but in general, toilets are available to clients.
R.1-4 Do SDPs have adequate examination areas?An examination area is considered ÒadequateÓ if it isclean, has sufficient light, and has a supply of cleanwater. All of these characteristics are desirable for aphysical exam and necessary for a pelvic exam. In all the study sites, 79% or more of SDPs have sufficient light in their exam rooms. In half the study
sites, the vast majority of SDPs have clean examina-tion areas (89% to 100%), whereas in the other halfthe proportion is about two-thirds (63% to 73%).
As Figure 3-1 shows, more variation is apparentin the results for the availability of adequate water,which is defined as a sufficient quantity of cleanwater for washing hands and equipment. Thewater supply does not have to include piped run-ning water, only a source of clean water that can berefreshed in the examination room. In 5 study sites,three-quarters or more of SDPs have adequatewater in their exam rooms, but in 7 other sites, theavailability ranges from 69% (Kenya) to only 34%(Burkina Faso). For the latter countries, this indica-tor is significantly affected by location: the vastmajority of urban SDPs have water in exam rooms,but in Burkina Faso and Madagascar, for example,as few as 29% of rural SDPs have adequate water.
R.2 Accessibility
R.2-1 Do SDPs open on time?Failure of an SDP to open at its stated opening timecan represent a restriction on the accessibility ofservices to clients. Eight of the study sites showgreat variation in the proportion of SDPs open ontime. About 80% of SDPs in Tanzania and Zanzibar
32 Clinic-Based Family Planning and Reproductive Health Services in Africa

were open on time the day of the study visit,whereas in Kenya the proportion was only 5%.Other sites range between these extremes.
Some final Situation Analysis reports state thatSDPs do not open on time because staff are busypreparing for the dayÕs services by sterilizing instru-ments and cleaning examination areas. However,from the clientÕs point of view, access is still restrict-ed if the clinic is not giving services at the statedhour. If service preparation is causing the delay inopening, the schedule for preparation might berearranged or the stated opening hour delayed.
R.2-2 Do SDPs have signs announcing familyplanning services?Signs announcing an SDPÕs family planning ser-vices raise clientsÕ awareness of those services.Across the 12 study sites, 68% or fewer of the SDPshave such a sign either inside or outside the facili-ty. This indicator shows a good deal of variation,ranging from 68% in Ghana to 10% in Tanzania.Generally, signs announcing family planning ser-vice availability are not common.
The appropriateness of signs announcing fami-ly planning services is debated in the Senegal andNigeria Situation Analysis reports. Both family
planning programs question the utility of suchsigns when many clients would like to protect theiranonymity; thus signs might actually be a deter-rent to obtaining contraceptive services. However,in Zimbabwe and Kenya, signs are not seen asplaying an important role in influencing clients,and thus are not emphasized. B
AS
IC S
TU
DY F
IND
ING
S
& T
HE
IR U
TIL
IZAT
ION
Indicators of Readiness and Quality: Basic Findings 33
General Assessment ofInfrastructure and Facilities
With a few exceptions, adequate waiting areas(R.1-1) and toilets for clients (R.1-3) are gen-erally available in SDPs at the study sites. Notsurprisingly, the other indicators are heavilydetermined by location: in general, moreurban SDPs have electricity and running water(R.1-2) and adequate examination rooms(R.1-4) than do rural SDPs. (See Chapter 7 formore discussion of this point.)
The infrastructural item of greatest concernis the availability of clean water in examina-tion rooms. This water is used for washinghands between exams and for washing equip-ment, thereby reducing the risk of cross-infec-tion of clients. In areas of high unrecognizedSTD/HIV prevalence, this is a matter of criticalimportance.
General Assessment ofAccessibility
The two indicators included under this ele-ment—opening on time and having signsannouncing family planning services—areillustrative only, and are not intended to pre-sent a full picture of accessibility. Accessibilityalso includes factors such as travel time, cost,and psychosocial accessibility, all of which areoutside the scope of the Situation Analysisstudies. (However, see Q.7, “Appropriatenessand Acceptability of Services,” for discussionof related issues.)
However, these two indicators do reveal agood degree of variation in accessibility of ser-vices. The variation does not seem to be deter-mined by the overall maturity of the program,since some of the most mature programs scorepoorly and vice versa. Although the country-level performance is difficult to explain, withincountries these indicators seem to vary with thetype of SDP. For both opening on time (R.2-1)and signs announcing family planning services(R.2-2), the larger SDPs, such as hospitals andclinics with maternities, do significantly betterthan health posts and smaller clinics. This dif-ference is statistically significant for openingtimes in Ghana, Nigeria, Tanzania, andZambia, and for family planning signs inZimbabwe, Zanzibar, Zambia, Kenya, Ghana,Burkina Faso, and Botswana (p < .05). Further-more, the availability of signs appears to berelated to the location of the SDP: in severalstudy sites, urban SDPs are more likely thanrural SDPs to have signs announcing familyplanning services. This difference is statisticallysignificant in Zambia, Tanzania, Nigeria,Kenya, Ghana, and Burkina Faso (p < .05).
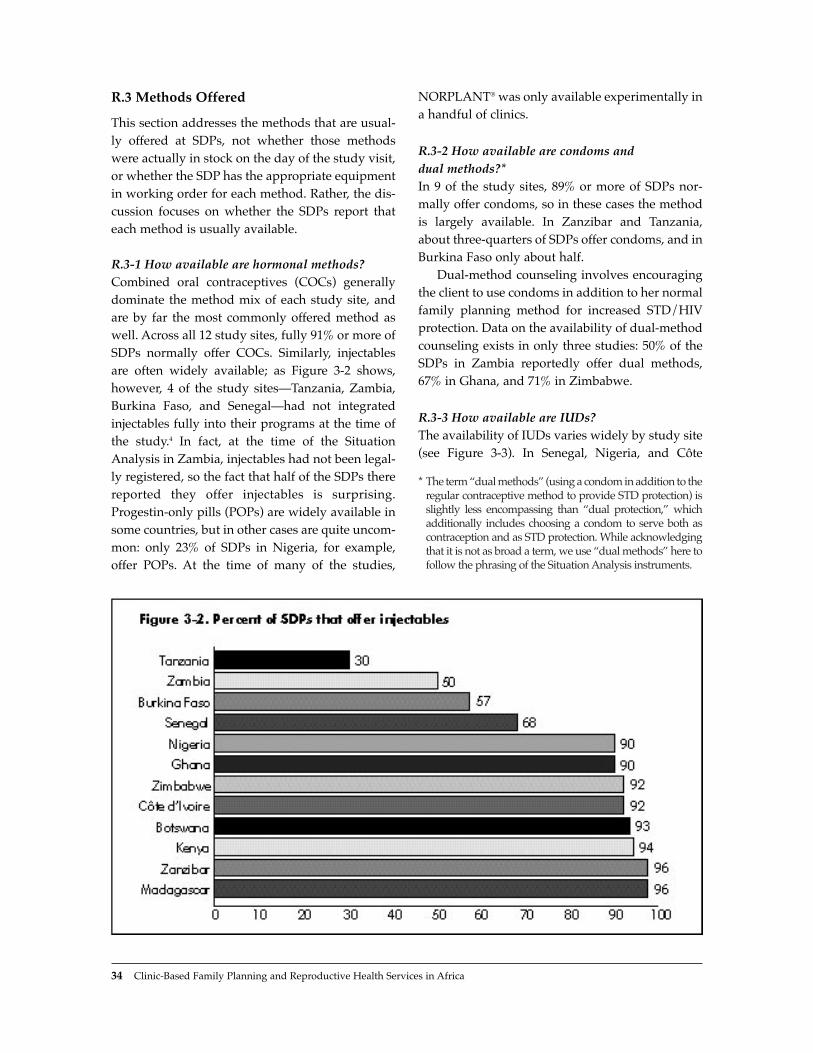
R.3 Methods Offered
This section addresses the methods that are usual-ly offered at SDPs, not whether those methodswere actually in stock on the day of the study visit,or whether the SDP has the appropriate equipmentin working order for each method. Rather, the dis-cussion focuses on whether the SDPs report thateach method is usually available.
R.3-1 How available are hormonal methods?Combined oral contraceptives (COCs) generallydominate the method mix of each study site, andare by far the most commonly offered method aswell. Across all 12 study sites, fully 91% or more ofSDPs normally offer COCs. Similarly, injectablesare often widely available; as Figure 3-2 shows,however, 4 of the study sitesÑTanzania, Zambia,Burkina Faso, and SenegalÑhad not integratedinjectables fully into their programs at the time ofthe study.4 In fact, at the time of the SituationAnalysis in Zambia, injectables had not been legal-ly registered, so the fact that half of the SDPs therereported they offer injectables is surprising.Progestin-only pills (POPs) are widely available insome countries, but in other cases are quite uncom-mon: only 23% of SDPs in Nigeria, for example,offer POPs. At the time of many of the studies,
NORPLANT¨ was only available experimentally ina handful of clinics.
R.3-2 How available are condoms and dual methods?*In 9 of the study sites, 89% or more of SDPs nor-mally offer condoms, so in these cases the methodis largely available. In Zanzibar and Tanzania,about three-quarters of SDPs offer condoms, and inBurkina Faso only about half.
Dual-method counseling involves encouragingthe client to use condoms in addition to her normalfamily planning method for increased STD/HIVprotection. Data on the availability of dual-methodcounseling exists in only three studies: 50% of theSDPs in Zambia reportedly offer dual methods,67% in Ghana, and 71% in Zimbabwe.
R.3-3 How available are IUDs?The availability of IUDs varies widely by study site(see Figure 3-3). In Senegal, Nigeria, and C�te
34 Clinic-Based Family Planning and Reproductive Health Services in Africa
* The term Òdual methodsÓ (using a condom in addition to theregular contraceptive method to provide STD protection) isslightly less encompassing than Òdual protection,Ó whichadditionally includes choosing a condom to serve both ascontraception and as STD protection. While acknowledgingthat it is not as broad a term, we use Òdual methodsÓ here tofollow the phrasing of the Situation Analysis instruments.

Indicators of Readiness and Quality: Basic Findings 35
BA
SIC
ST
UD
Y F
IND
ING
S
& T
HE
IR U
TIL
IZAT
ION
dÕIvoire, over 80% of SDPs offer IUDs, whereas inZimbabwe, Tanzania, Zambia, and Burkina Faso,the proportion is 25% or less.5 In all cases, hospitalsand clinics with maternity services offer IUDs morefrequently than do health posts, often because ofequipment needs or national service policy.
R.3-4 How available are tubal ligation andvasectomy?These methods are the most unavailable across allstudy sites because they require substantial infra-structure and specially trained staff. For this rea-son, most SDPs that offer surgical sterilization inthe study sites are hospitals or high-level clinics.
Ghana has by far the greatest availability ofboth methods: 23% of SDPs offer vasectomy and50% tubal ligation. These methods are also preva-lent in Kenya, where 29% offer tubal ligation and14% vasectomy. In other countries, 10% or feweroffer tubal ligation and 5% or fewer vasectomy.
Overall, these methods are not widely available,and vasectomy is less available than tubal ligation.A simple comparison of those SDPs that offer thesemethods shows that if an SDP offers vasectomy, itprobably offers tubal ligation as well, but thereverse is not true; thus it is extremely rare to findSDPs that offer vasectomy and not tubal ligation.
R.3-5 How available are natural family planningand lactational amenorrhea methods?These two methods require staff trained to counselproperly, but do not require any equipment orinfrastructure. The availability of natural familyplanning counseling ranges widely, from 3% inTanzania to fully 74% in Ghana. Information on theavailability of lactational amenorrhea method(LAM) is presented in only 4 studies, but it tooshows great variability: 10% of SDPs offer LAM inBurkina Faso, 39% in Zimbabwe, 63% in Zambia,and 83% in Ghana.
R.4 Contraceptive Supplies and Logistics
R.4-1 How often do SDPs experience stockouts ofcontraceptive supplies?If SDPs run out of stocks of methods, clientsÕchoice of methods and continuation of method useare necessarily constrained. For this reason, contra-ceptive stockouts affect the quality of services thatcan be delivered. Stockout rates of contraceptivesupplies vary greatly by method and by country.6
Stockout rates are the highest for injectables. Over6 of the study sites, an average of 22% of SDPsoffering injectables had experienced a stockout.

36 Clinic-Based Family Planning and Reproductive Health Services in Africa
General Assessment of Methods Offered
Three broad characteristics of sub-Saharan African populations should influence the appropriaterange of method availability: reproductive intentions, STD risk, and breastfeeding status.7 In many ofthe study sites, a majority of clients express the desire for spacing rather than limiting their births, andthus the high availability of COCs and injectables (R.3-1) is appropriate in terms of meeting the needsof spacers. Similarly, because the expressed demand for limiting is not currently very high, the rela-tively low availability of tubal ligation and vasectomy (R.3-4) may be appropriate. Demand for limit-ing may well rise in coming decades, however (see Westoff, 1991), and availability of these methodscould be expected to rise accordingly. At the same time, because these methods require intensiveinvestment in staff training and infrastructure, broadening their availability is more difficult than formany other methods. (See indicators R.6-3 through R.6-9 for more information on the availability oftrained staff for the various methods.)
Clients may also be at serious risk of STD/HIV, and pills, injectables, and surgical methods offer noprotection against STD/HIV transmission. For this reason, the availability of condoms and use of dualmethods (R.3-2) are particularly crucial. Although the majority of facilities in most countries do offercondoms, some do not. Moreover, as will be seen later, condoms and dual methods are often not dis-cussed with clients even when available (see Q.3-5). Dual-method counseling is important since clientsmay not be aware that condoms can be used for STD/HIV prevention in conjunction with other meth-ods. The 3 studies that collected this information do not show full availability of dual-method counsel-ing. Again, because of the high risk of STD/HIV transmission in many of these sites, both condomsalone and counseling for dual methods should be available at every SDP.
The high prevalence of STD/HIV also critically affects IUD users, since the insertion procedure maynot be aseptic; clients may therefore be placed at risk of iatrogenic infections, and clients with undi-agnosed STDs placed at risk of pelvic inflammatory disease (PID). Availability of IUD insertion (R.3-3)does vary with the size of the SDP, which is appropriate since insertion involves a certain amount ofequipment and infrastructure. However, as will be discussed later (see Q.5-3), the providers of thismethod have a particular responsibility to protect clients against STD transmission, and in many casesclients are not being adequately protected. In short, the sheer availability of IUD services seems appro-priate, but the implementation of these services may require attention.
Lastly, the breastfeeding status of clients affects method choice because breastfeeding is a con-traindication for COC use. Instead, breastfeeding clients who would otherwise use COCs should usePOPs. Given that a large proportion of clients are breastfeeding, and in most study sites large pro-portions are potential COC users, the availability of POPs (R.3-1) should be more widespread than theresults here reveal. Upcoming sections will address whether COCs and POPs are actually mentionedto clients (see Q.3-2 and Q.3-3), and reveal that in many cases COCs are being used where POPswould be more appropriate.
Because of high breastfeeding rates, LAM would probably be an appropriate method for manyclients, and indeed most women in Africa know about suppressed fertility during breastfeeding.However, LAM has not been emphasized by many programs because of misunderstanding of the dif-ference between breastfeeding and LAM. If LAM is to work reliably, appropriate counseling and sup-port should be available to clients. This method shows varying degrees of availability in the study sites(R.3-5). Yet because LAM counseling requires no infrastructure or equipment, only staff training is nec-essary to add it to the list of methods offered at an SDP.

Fully 50% of SDPs in Nigeria had experienced aninjectable stockout in the previous 6 months. Therelatively high injectable stockout rates may reflectthe increasing popularity of injectables in sub-Saharan Africa and the relative novelty of themethod. (See R.4-2 for more discussion ofinjectable stockouts.)
Condoms have the lowest overall stockoutrates. In all the study sites, about one-quarter orfewer SDPs had experienced a stockout of con-doms in the 6 months previous to the SituationAnalysis study. COCs and POPs have slightlyhigher stockout rates: in all the study sites aboutone-third or fewer SDPs had experienced thesestockouts. IUDs have a stockout rate of 22% or lessin most of the study sites, but in Kenya, 36% ofSDPs offering IUDs had run out of them in a 6-month period.
NORPLANT¨ was being introduced experi-mentally at the time of many of the SituationAnalysis studies, so it was offered by only a hand-ful of SDPs. In Senegal, Nigeria, Madagascar,Burkina Faso, and Botswana, none of the SDPsoffering NORPLANT¨ had experienced a stockoutin the previous 6 months. However, the stockoutinformation for NORPLANT¨ is not very represen-tative given the unavailability of this method at thetime of the studies.
Stockout rates also vary by country. Figure 3-4shows the percentage of SDPs in each country thathad experienced at least one stockout of at leastone offered method in the 6 months preceding thestudy. At 65%, Nigeria had experienced the moststockouts, and about half of SDPs in Kenya,Zambia, and Zimbabwe had experienced at leastone stockout. Senegal, Madagascar, and Zanzibarhad the lowest overall stockout rates.
R.4-2 Do SDPs have commodity inventory lists,and are they related to stockout rates?One way an SDP can control its stocks of contra-ceptives is to keep a running commodity invento-ry to monitor stock levels. The percentage of SDPswith commodity inventories varies widely acrossthe study sites, ranging from 29% in Burkina Fasoto 100% in C�te dÕIvoire. The presence of a writtencommodity inventory might be associated withfewer stockouts, since it helps clinic managersidentify low supplies and reorder before a methodis fully stocked out. However, a simple comparisonof SDPs with and without commodity inventoriesshows no clear relationship between such invento-ries and stockouts. In most countries and for mostmethods, no statistically significant relationshipholds. However, certain methods in some coun-tries are significantly less likely to be stocked out if
BA
SIC
ST
UD
Y F
IND
ING
S
& T
HE
IR U
TIL
IZAT
ION
Indicators of Readiness and Quality: Basic Findings 37

a commodity register is present: POPs in BurkinaFaso, COCs and IUDs in Ghana, and IUDs inZanzibar. These results do not fall into a simplepattern.
This observed lack of a clear relationshipbetween commodity inventories and stockout ratesmay be due to the fact that stockouts often resultfrom systemwide distribution problems ratherthan clinics neglecting to order stocks. For exam-ple, 19% of SDPs in Ghana had experienced astockout of injectables in the 6 months prior to thestudy, even though 98% of the SDPs had a com-modity register. However, in that period the nation-al supplier of injectables changed from the UnitedStates Agency for International Development(USAID) to the United Nations DevelopmentProgramme (UNDP), and difficulties in keepingdistribution constant during the switchover result-ed in a nationwide 3-month stockout. Local com-modity registers would of course have no effect onthis type of problem.
R.4-3 Do SDPs have adequate storage forcontraceptive stocks?For this indicator, ÒadequateÓ is defined as protect-ed from rain, sun, adverse temperatures,8 and pests.In almost all the study sites, three-quarters or moreof SDPs have adequate contraceptive storage. Theexception is C�te dÕIvoire, in which only 1 of 13SDPs reported adequate contraceptive storage. Inthe Situation Analysis report for C�te dÕIvoire, thereasons for inadequate storage are cited as poorventilation, storage of commodities on the floor,and storage of commodities in the managerÕs office.
R.5 Equipment
Equipment needs vary depending on the type ofSDP. For the present analysis, SDPs have beendivided into three general categories: hospitals,large clinics with maternities, and small clinics orhealth posts. Clearly, differences in client loads andservices in these types of SDPs affect their equip-ment needs. For this analysis, an SDP is consideredto have the minimum equipment needed if it meetsthe requirements shown in Table 3-1, which weredrawn up for the purposes of this analysis. Equip-ment that is necessary only for specific methods,
such as uterine sounds for IUDs, is reported onlyfor SDPs that offer those methods.
General Assessment ofContraceptive Supplies andLogistics
In general, storage areas for contraceptivestocks are appropriate (R.4-3), but stockoutscan pose a larger problem (R.4-1). The gen-eral rate of stockouts, as shown in Figure 3-4,varies greatly by country and seems to berelated to overall contraceptive prevalence.That is, the more users a program serves, themore commodities are consumed, and thegreater are the chances for a stockout.Zimbabwe, Botswana, and Kenya have someof the highest contraceptive prevalence ratesand also among the highest stockout rates forat least one offered method. Conversely,Madagascar, Senegal, and Tanzania have lowcontraceptive prevalence and lower stockoutrates. This correlation is also reflected in theconsistently higher stockout rates of injecta-bles, a rapidly growing method in the region.Since this method is new relative to pills andcondoms, the supply mechanisms may not yetbe as firmly established as those for othermethods. The one counterexample is Nigeria,which has the highest overall stockout rate byfar, but quite low contraceptive prevalence.However, the Nigerian family planning pro-gram serves about 23 million women, four toten times as many as any of the other studysites. The contraceptive prevalence rate is low,but the sheer number of users is dauntinglylarge and may pose extraordinary distributionproblems.
Lastly, stockout rates do not seem to berelated to the presence of a commodity inven-tory (R.4-2). This is probably because stockoutsoften result from central distribution problems,such as incorrect amounts supplied or trans-portation difficulties, rather than on individualSDPs’ neglecting to order stocks on time.
38 Clinic-Based Family Planning and Reproductive Health Services in Africa

R.5-1 Do SDPs have basic equipment?Although the basic equipment necessary for fami-ly planning provision differs widely across coun-tries, the present analysis focuses on four verybasic items: stethoscope, blood pressure machine(sphygmomanometer), adult weighing scale, andaccess to a means of sterilizing equipment.
Of these four items, adult weighing scales arethe most available across all the study sites. Over73% of all SDPs across all sites have such scales.Blood pressure machines and stethoscopes show awider range of availability. Across 10 of the studysites, between 55% and 90% of SDPs have bloodpressure machines, and stethoscope availabilityranges between 51% and 94% of SDPs. Access tosterilizing equipment also varies greatly across allthe sites (see Figure 3-5).
One additional issue is the clustering of equip-ment. That is, if an SDP has one item of basic equip-ment, does it tend also to have the other three? Forall study sites with available data, correlation coef-ficients among these four items consistently show
that blood pressure machines and stethoscopes arehighly correlated. That is, if an SDP has a bloodpressure machine, it probably also has a stetho-scope and vice versa. Correlation coefficients forthe other pairs of equipment are much lower.
R.5-2 Do SDPs have equipment for pelvic exams?Whether to give pelvic exams to new clients as amatter of course is a controversial issue in sub-Saharan Africa. On the one hand, some providersargue that pelvic exams are part of a normal STDscreening program and should be performed forthe clientÕs safety before a method is provided.Moreover, in many contexts, women have very fewcontacts with the healthcare system; thus if theycome for family planning care, the argument is thatthese services should be integrated with overallhealth care. On the other hand, pelvic exams maybe seen by women as overly intrusive and maypresent a barrier to obtaining family planning ser-vices. Also, for purely practical reasons, if an SDPdoes not have the capability to do pelvic exams, it
BA
SIC
ST
UD
Y F
IND
ING
S
& T
HE
IR U
TIL
IZAT
ION
Indicators of Readiness and Quality: Basic Findings 39
Table 3-1. Minimum equipment thresholds used in this analysis
Equipment Type Hospitals Clinics with HealthMaternity Posts
Blood pressure machines 3 1 1
Stethoscopes 3 1 1
Access to sterilizer 5 1 1
Adult scales 1 1 1
Examination couches 3 1 1
Angle poise lamps/flashlights 3 1 1
Specula 15 5 1
Gloves* 100 30 5
Sterilization lotion (liters) 5 1 1
Tenacula 3 1 1
Uterine sounds 3 1 1
Needles and syringes 15 5 1
NORPLANT® kits 3 1 1
* This item refers to the availability of sterile gloves. It includes the number of disposable pairs, plus the number of reusable pairs if a functioning sterilizer is present.

should not be prevented from dispensing certainmethods, such as pills or injectables. (See Chapter 9for further discussion of this point.)
Nonetheless, in at least some cases a pelvicexam will be indicated for particular clients. TheSituation Analysis offers information on the avail-ability of five basic items needed for providingpelvic exams: examination couch, angle poise lampor working flashlight, specula, gloves, and steriliz-ing lotion. All of these items show considerablevariation across the study sites. Across 9 of the
sites, from about 50% of SDPs (Tanzania) to 95%(Botswana) have examination couches, and from18% of SDPs (Tanzania) to 85% (C�te dÕIvoire) haveangle poise lamps or flashlights.
The availability of gloves is critically important.Figure 3-6 shows that in 4 of the study sites, about45% of SDPs have sufficient gloves, and in an addi-tional 7 sites, the proportion is 60% or higher. InBurkina Faso, glove supplies are seriously inade-quate. Specula are also necessary for a pelvic exam,and availability of this equipment ranges from 38%
40 Clinic-Based Family Planning and Reproductive Health Services in Africa
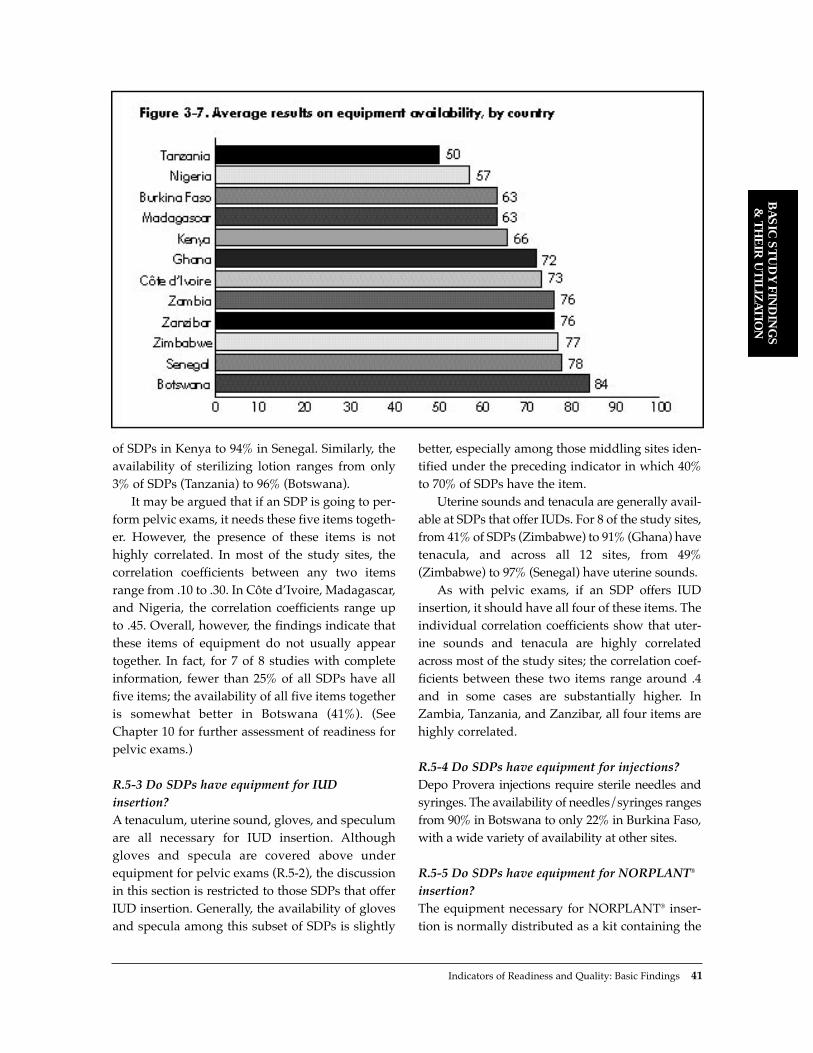
Indicators of Readiness and Quality: Basic Findings 41
BA
SIC
ST
UD
Y F
IND
ING
S
& T
HE
IR U
TIL
IZAT
ION
of SDPs in Kenya to 94% in Senegal. Similarly, theavailability of sterilizing lotion ranges from only3% of SDPs (Tanzania) to 96% (Botswana).
It may be argued that if an SDP is going to per-form pelvic exams, it needs these five items togeth-er. However, the presence of these items is nothighly correlated. In most of the study sites, thecorrelation coefficients between any two itemsrange from .10 to .30. In C�te dÕIvoire, Madagascar,and Nigeria, the correlation coefficients range upto .45. Overall, however, the findings indicate thatthese items of equipment do not usually appeartogether. In fact, for 7 of 8 studies with completeinformation, fewer than 25% of all SDPs have allfive items; the availability of all five items togetheris somewhat better in Botswana (41%). (SeeChapter 10 for further assessment of readiness forpelvic exams.)
R.5-3 Do SDPs have equipment for IUDinsertion?A tenaculum, uterine sound, gloves, and speculumare all necessary for IUD insertion. Althoughgloves and specula are covered above underequipment for pelvic exams (R.5-2), the discussionin this section is restricted to those SDPs that offerIUD insertion. Generally, the availability of glovesand specula among this subset of SDPs is slightly
better, especially among those middling sites iden-tified under the preceding indicator in which 40%to 70% of SDPs have the item.
Uterine sounds and tenacula are generally avail-able at SDPs that offer IUDs. For 8 of the study sites,from 41% of SDPs (Zimbabwe) to 91% (Ghana) havetenacula, and across all 12 sites, from 49%(Zimbabwe) to 97% (Senegal) have uterine sounds.
As with pelvic exams, if an SDP offers IUDinsertion, it should have all four of these items. Theindividual correlation coefficients show that uter-ine sounds and tenacula are highly correlatedacross most of the study sites; the correlation coef-ficients between these two items range around .4and in some cases are substantially higher. InZambia, Tanzania, and Zanzibar, all four items arehighly correlated.
R.5-4 Do SDPs have equipment for injections? Depo Provera injections require sterile needles andsyringes. The availability of needles/syringes rangesfrom 90% in Botswana to only 22% in Burkina Faso,with a wide variety of availability at other sites.
R.5-5 Do SDPs have equipment for NORPLANT¨
insertion?The equipment necessary for NORPLANT¨ inser-tion is normally distributed as a kit containing the

NORPLANT¨ rods, compresses, sterile gloves,antiseptic, local anesthetic, and a scalpel. NOR-PLANT¨ services also require the presence of a
specifically trained provider, but this section is con-cerned with equipment only. In all study sitesincluded here, NORPLANT¨ was being offered ona trial basis, and staff had been trained as part of aspecial pilot program. In many of the study sites,NORPLANT¨ was available on a trial basis at onlya handful of SDPs, and some studies did not askabout the availability of NORPLANT¨ kits at all.However, in Nigeria (1 clinic), Senegal (4 clinics),and Burkina Faso (6 clinics), all the SDPs for whichdata are available had NORPLANT¨ kits. In Kenya,20 of 21 clinics had them, and in Madagascar 6 of 8.In Botswana, only 2 clinics were offering NOR-PLANT¨ and had data on kit availability: 1 had themethod, and 1 did not. In general, these levels ofavailability are fairly high, but they cannot betaken as indicative of the availability of NOR-PLANT¨ kits once the method has been fully inte-grated into more SDPs in each country.
R.6 Staffing
R.6-1 What types of staff provide family planningservices?The majority of family planning services in sub-Saharan Africa are provided by nurses. Across allthe study sites, about three-quarters or more ofSDPs had a nurse on duty on the day of the studyvisit, except Zanzibar, in which 38% of SDPs had anurse on duty. Doctors are less common in familyplanning settings, since most methods do notrequire physician training. In many countries 8%or fewer of the SDPs had a physician on duty. In 4of the study sitesÑC�te dÕIvoire, Madagascar,Nigeria, and ZambiaÑa third or more of SDPswere found to have a physician on duty.11
R.6-2 How experienced are family planning staff?Levels of staff experience in delivering family plan-ning services vary among the study sites. In 7 sites,staff were asked how long they had been providingfamily planning services to clients. Their responsesrange from a mean of 3.4 years in Burkina Faso to6.3 years in Tanzania. In 2 additional sites (Kenyaand Botswana), staff were asked how long theyhad been providing family planning services at this particular SDP. Their responses are not quite
42 Clinic-Based Family Planning and Reproductive Health Services in Africa
General Assessment ofEquipment Availability
In general, stethoscopes, adult weighingscales, and blood pressure machines are avail-able at most SDPs (R.5-1). Access to sterilizingequipment is more restricted in some of thestudy sites, which raises concern over possibleuse of unsterilized instruments. Equipment forpelvic exams (R.5-2) shows a range of avail-ability, with a lack of gloves in particular beingobserved in some contexts. Those SDPs thatoffer IUD insertion show a general availabilityof the necessary equipment (R.5-3), but somestudy sites show serious deficiencies in thisregard. Moreover, the items needed for basicfamily planning, pelvic exams, and IUDs gen-erally do not appear together in one SDP,9
although some clustering of blood pressuremachines and stethoscopes and of uterinesounds and tenacula does occur.
Assessing equipment availability by countryis difficult because results on all indicators arenot available for all the study sites. Instead ofcounting pieces of equipment, one can exam-ine the average percentage results on allequipment availability indicators to get anidea of the equipment availability by country(see Figure 3-7).10 These results, althoughblunt, show that the more mature launch andgrowth family planning programs are onaverage better equipped than the emergentprograms. (See Chapter 2 for discussion ofthis terminology.) The one counterexample isCôte d’Ivoire, which had a very young pro-gram at the time of the Situation Analysis, butthis study included only 13 SDPs in the capitalcity. These results suggest that as programsmature, their ability to distribute and maintainequipment increases, rather than their beingsubject to increasing loss and breakage ofequipment.

comparable with the others, since they do notinclude years spent providing family planning ser-vices at other SDPs. Nonetheless, these responsesare fairly similar to the others: 4.4 years in Kenyaand 6.6 years in Botswana.
The results on this indicator are directly relatedto the age of the family planning program. InBurkina Faso, Nigeria, Senegal, and Zanzibar, veryfew providers reported offering family planningservices for longer than the family planning pro-gram itself had been in place. However, 27% ofproviders in Madagascar and 15% in Kenya report-ed offering family planning services before themajor emphasis had been placed on such services.These results indicate the prevalence of familyplanning activities in those countriesÑfor exam-ple, through International Planned ParenthoodFederation (IPPF) affiliatesÑbefore major atten-tion was paid by the respective governments. Thiscorrelation with age is probably the reason providersin Botswana reported the longest period of provid-ing family planning services; the family planningprogram there is the oldest among the 12 study sites,so providers have had the greatest opportunity tooffer these services for the longest period of time.
R.6-3 Did providersÕ basic training include familyplanning, or have they ever had training inclinical family planning?Every family planning provider should have been
trained at least once in basic clinical family plan-ning skills. In 9 of the study sites, providers wereasked whether their basic training had includedfamily planning, and in the remaining 3 sites,providers were asked whether they had ever hadgeneral clinical family planning training. Becausethese questions were asked somewhat differently,the two groups are not directly comparable, sothey are addressed separately here.
In the first group (9 sites), the proportion ofproviders whose basic training had included familyplanning ranged from over 90% in Ghana andBotswana to only 41% in C�te dÕIvoire. These resultsare probably strongly affected by the start date offamily planning services in each country. Figure 3-8presents for 3 of the 9 countries with appropriatedata the percentage of providers whose basic train-ing had included family planning, by whether thetraining took place before or after the start of thefamily planning program. This graph shows thatonce family planning services had started inearnest, the vast majority of providers were beingtrained. Yet the problem remains of the manyproviders whose basic training did not include fam-ily planning, but who are offering these services,although they may have been trained in familyplanning outside of basic training. For 6 of these 9countries, the next indicator (R.6-4) addresseswhether these providers had received post-basic orrefresher training in family planning.
BA
SIC
ST
UD
Y F
IND
ING
S
& T
HE
IR U
TIL
IZAT
ION
Indicators of Readiness and Quality: Basic Findings 43
In the remaining 3 study sites (Madagascar,Senegal, and Burkina Faso), providers were askedwhether they had ever had general clinical familyplanning training, either basic, post-basic, orrefresher training. These results are in the samerange as those for the other 9 sites: 40% inMadagascar, 62% in Senegal, and 68% in BurkinaFaso. Once again, the results relate to the date ofthe start of family planning services. In all 3 ofthese countries, over 85% of the providers who hadhad this training took the course after the familyplanning program had officially begun. The largeproportion of providers who have not been trainedin family planning in any courses yet are providingthese services reveals significant training needs inthese 3 countries.
R.6-4 Have providers had refresher training infamily planning?In 6 of the study sites, providers were further askedwhether they had had refresher training in familyplanning. In 5 countries, the results range from 74%(Ghana) to 54% (Zambia). In C�te dÕIvoire, only 6%of providers had had refresher training, which isunderstandable given that the family planning pro-gram was only a year old at the time of the study.
The previous indicator (R.6-3) gave the percent-age of providers who had been trained in familyplanning during their basic training or had receivedgeneral clinical family planning training. In manycases in which providersÕ basic training hadoccurred before the start of the family planning pro-gram, that training did not cover family planning.However, the information from the present indica-tor can be added to those results to determine thepercentage of providers who had covered familyplanning in either basic or refresher training.12 Theresults show that the vast majority of providers hadbeen trained at some point in family planning inZambia (92%), Botswana (98%), Kenya (87%),Zimbabwe (94%), and Ghana (98%). Again, theresult in C�te dÕIvoire is much lower (41%) becauseof the very recent start of family planning activities.
R.6-5 Do family planning staff report that theyalso provide STD/HIV services?One measure of integration of family planning andSTD/HIV services is whether staff provide both
services themselves. In 5 of the study sites, staffproviding family planning were asked whetherthey also provide STD or HIV management at thisSDP. In Zambia and Zimbabwe, over 90% ofproviders reported that they do provide some formof HIV counseling or testing or other STD counsel-ing, diagnosis, or treatment. In Ghana and Botswana,about two-thirds of providers offer similar services,and in Kenya only 18% reported doing so. However,observations with clients show that most providersdo not discuss these issues during family planningcounseling (see Q.2-7, Q.2-8, Q.4-3, and Q.4-4). (SeeChapter 10 for more information on integration ofSTD/HIV and family planning services.)
R.6-6 Have providers had basic or refreshertraining in STD/HIV, and how recently?Given the prevalence of STDs and particularly HIVin sub-Saharan Africa, staff training in these areasis particularly critical. Unfortunately, informationon STD/HIV training among staff is available foronly 5 of the study sites,13 and these are mainlycountries that are placing extra emphasis on theirSTD/HIV programs. For this reason, these resultsare probably not representative of the area, but arehigher than average.
STD or HIV management had been covered inthe basic training of 49% of providers in Kenya,66% in Botswana, and 70% in Zambia. When thesefigures are revised to reflect those providers whohad had either basic or refresher training in STDsor HIV, the results rise to 54% in Kenya, 77% inZambia, and fully 84% in Botswana.
The Ghana and Zimbabwe studies asked onlywhether a provider had had refresher training inSTDs or HIV, but not basic training. Affirmativeresponses were given by 34% of providers inGhana and 48% in Zimbabwe. However, it is diffi-cult to assess the true level of staff training in thesecountries because of the lack of information aboutbasic training.
R.6-7 Have providers had training in familyplanning counseling/information, education, andcommunication (IEC), and how recently?This indicator includes training in Òfamily plan-ning counselingÓ or ÒIEC skillsÓ as refresher orpost-basic training. The questionnaires differ on
44 Clinic-Based Family Planning and Reproductive Health Services in Africa

this training question. Some ask about IEC skillstraining alone, some about family planning coun-seling training alone, and some about both. Theresults presented here combine all the availableinformation for each country, and they are notencouraging (see Figure 3-9). In 7 of 10 study sites,about 25% or less of staff had received any suchtraining. In Senegal, Zimbabwe, and Ghana, theproportions are somewhat higher, but 50% or moreof providers still had had no IEC training.
In 7 of the study sites, providers reported thedate of their most recent training in family plan-ning counseling/IEC. The dates reported are gen-erally quite recent, ranging from 2.4 years ago inZambia and Madagascar to 5.3 years ago in Kenya.In Zambia, among providers who had had thistraining, 65% had received it less than 1 year priorto the study. As with clinical family planning train-ing, in most cases the recency of counseling/IECtraining is related to the age of the family planningprogram itself. However, in Senegal andZimbabwe, the family planning programs arequite mature, but counseling/IEC training hasoccurred more recently. In Burkina Faso, fully 90%of the staff who had had such training received itwithin 3 years prior to the study, although the fam-ily planning program had been in place for 11
years. Thus counseling/IEC training is a morerecent addition to clinical family planning trainingin some programs.
R.6-8 Have providers had training in IUDinsertion/removal, and how recently?The proportion of all providers who had had thistype of training varies greatlyÑfrom only 7% inMadagascar to over 80% in Zanzibar. The recencyof IUD training ranges from 2.4 years in Zambia to7 years in Kenya. In fact, in Zambia the trainingwas extremely close in time to the SituationAnalysis fieldwork: over 60% of IUD-trained staffreported that they had received their training with-in the previous year.
Because IUD services are not offered at all SDPs,these results may be more informative if calculatedonly for providers at those SDPs that offer such ser-vices.14 Interestingly, the results for this subset ofproviders are not very different. In most cases, thestaff trained in IUD insertion/removal are not con-centrated in SDPs that actually offer IUD services.The one exception is Zimbabwe, where 18% of allstaff had been trained in IUD insertion/removal, butfully 50% of staff at those SDPs that offer IUDs hadbeen so trained. Thus staff are concentrated in SDPswhere their skills can be put to use. However,
BA
SIC
ST
UD
Y F
IND
ING
S
& T
HE
IR U
TIL
IZAT
ION
Indicators of Readiness and Quality: Basic Findings 45

according to the Demographic and Health Survey(DHS), IUDs account for only 2% of the method mixin Zimbabwe, and this efficient distribution of staffwould be more useful in places such as Botswana,Burkina Faso, and Senegal where IUDs comprise amuch higher proportion of the method mix.
The results on mean years since IUD trainingamong staff working at SDPs that offer IUDs donot differ greatly from the results among the gen-eral population of staff. Again, the one exception isZimbabwe: mean years since IUD training amongall staff is 5.7, whereas the figure among staff atSDPs that offer IUDs is 8.2 years. Thus the staff thathave been trained more recently are not necessari-ly being placed at SDPs that can utilize their skills;rather, the staff trained less recently are those con-centrated in the SDPs that offer IUD services.
R.6-9 Have providers had surgical training intubal ligation, and how recently?In some of the study countries, only certain typesof staff are permitted to have sterilization training;in several countries, however, community healthnurses and even nursesÕ aides have been trained intubal ligation. For this reason, results for this indi-cator are not restricted to a particular type of staff,such as physicians or high-level nurses.
The results show that very few providers havehad this type of training: 10% or fewer in 7 of 9study sites. The percentages are a bit higher inGhana (14%) and Zimbabwe (26%). However, asdiscussed above, only a very small percentage ofSDPs offer tubal ligation, with the exception ofKenya, Nigeria, and Ghana, where the procedure ismore available. It is worth noting that tubal liga-tion comprises over 10% of the mix in Tanzania andZambia and almost 20% of the mix in Kenya andMadagascar according to DHS data.
This indicator may be more informative ifrestricted to providers working at those SDPs thatactually offer sterilization. The results forBotswana, Senegal, Burkina Faso, and Zambia arenot encouraging. In Botswana, the sample includedonly 2 providers who had been so trained, inSenegal 8, and in Burkina Faso 35. In all 3 of thesesites, all the trained providers were interviewed atSDPs that do not offer tubal ligation. In Zambia,only 1 of 22 providers thus trained worked at an
SDP that offers sterilization.15 In short, those SDPsthat do offer tubal ligation were without stafftrained in performing the procedure. Before con-cluding that the staff are poorly distributed, how-ever, it is important to note that the prevalence oftraining in tubal ligation is quite low, and theSituation Analysis sample in these countries maynot represent this subpopulation well. In otherwords, these results may be due to small samplesizes. In addition, the fact that no providers trainedin tubal ligation were interviewed at SDPs offeringthe method in Botswana, Senegal, and BurkinaFaso does not necessarily imply that untrainedproviders are performing sterilizations at theseSDPs. Providers trained in tubal ligation who workat these SDPs may simply not have been present onthe day of the Situation Analysis data collection.
The other 5 countries have complete data, the nÕsare larger, and the results are more credible. InKenya and Ghana, the percentage of trained staffamong those working at SDPs offering tubal ligationdoes not differ much from the percentage among allstaff. As with the previous indicator on IUDs (R.6-8),this finding may point to trained staff not being con-centrated at SDPs that can use their skills.
On the other hand, the proportion of trained staffat SDPs that offer tubal ligation is 27% in Madagascarand 64% in Zimbabwe. In both cases, these figures aremuch higher than the proportions among all staff,indicating that staff trained in tubal ligation are con-centrated in those SDPs that offer this service.
The mean years since training in tubal ligationamong all staff ranges from 1.7 in Zambia to 5.7 inKenya. As with the IUD training results, training intubal ligation in Zambia seems to have taken placequite recently. Again, over 60% of trainedproviders in Zambia reported that they had beentrained within the year. For all studies, these meansare not significantly different among staff workingat SDPs that offer sterilization.
R.7 IEC Materials and Activities
R.7-1 Do SDPs have IEC materials on family planning?IEC materials are excellent aids to communicationwith clients, and many family planning programs
46 Clinic-Based Family Planning and Reproductive Health Services in Africa

include the procurement and distribution of thesematerials. The present analysis includes threetypes of IEC materials on family planning: posters,brochures, and flip charts. Posters can be used forreference during counseling, brochures are oftengiven to clients to read at home, and flip charts canbe used interactively with clients to describe howvarious methods work or to address other repro-ductive health issues. The indicators under thiselement measure whether these materials areavailable at SDPs.
In general, IEC materials on family planningare not widely available. Posters are by far themost prevalent, appearing in over half of SDPs in10 of the 12 study sites. Brochures on family plan-ning are largely available in Nigeria and C�tedÕIvoire, but are available in 60% or fewer of SDPsin 9 other study sites. In Zambia and Tanzania,they appear in fewer than 10% of clinics. Flip
charts are the least available: in 8 of the 10 studysites they are available in fewer than half of theSDPs.
Moreover, these items are not usually clusteredat one SDP. In all the studies, the correlation coefficient for each pair of items is about .3 or wellbelow. The only exception is a strong correlationbetween the presence of flip charts and brochuresin Madagascar and Nigeria.
R.7-2 Do SDPs have IEC materials on STDs or HIV?Unfortunately, IEC materials on STDs or HIV areeven less common than family planning materials.Again, the most available items are posters.Among 5 of the study sites, a range of 46%(Zambia) to 66% (Botswana) of SDPs have postersabout HIV on the wall, while only 19% (Ghana) to43% (Botswana) have posters on STDs.
BA
SIC
ST
UD
Y F
IND
ING
S
& T
HE
IR U
TIL
IZAT
ION
Indicators of Readiness and Quality: Basic Findings 47
General Assessment of Staffing
The indicators under this element generate an overall picture of staff training that is in some ways quiteappropriate. Nurses provide most of the services (R.6-1), and have a suitable level of training for mostfamily planning methods. Training in clinical family planning has generally been integrated into basictraining since the start of family planning services (R.6-3), and IEC training has been on the rise inrecent years in most of the study sites (R.6-7). In a few countries, the majority of family planningproviders have also had training in STD/HIV services (R.6-6).
On the other hand, the presence of even one provider with no training in clinical family planningis of concern to any program. Many of the providers who have not had family planning training appearto have been through basic training prior to the launch of or reemphasis on family planning services,so their lack of training is only a historical accident. However, this does not mitigate the fact that theyare providing services without formal training. Moreover, the relatively low prevalence of training inIEC/family planning counseling (R.6-7) may have a detrimental effect on services: counseling indica-tors covered below under “information exchange” (Q.2 and Q.4) show that providers with IEC train-ing may perform better on those elements.
The distribution of specially trained staff may also pose a problem in some contexts. In most of thestudy sites, staff that have been trained in IUD insertion and removal (R.6-8) are not placed at SDPsthat offer this method. Similarly, staff trained in tubal ligation (R.6-9) do not seem to be clustered atSDPs where this method is provided, although this result may be due to an extremely small number ofcases in the Situation Analysis data.
Most Situation Analysis studies do not ask about STD/HIV training (R.6-6), although family planningproviders do offer these services in some contexts. In the 5 study sites with information on STD/HIVtraining, the training levels are fairly high in Zambia and Botswana, but lower in Kenya, Ghana, andZimbabwe. Again, the prevalence of STDs and HIV in most of the study sites calls for giving STD/HIVtraining to all family planning providers.

In Botswana, 45% of SDPs have a brochure onSTDs and 63% a brochure on HIV, but the results inother countries are not as encouraging. Fewer than25% of SDPs in 4 other study sites have a brochureon STDs or HIV. And no study found more than18% of SDPs in possession of a flip chart on STDsor HIV.
In each country, three-quarters or more of theSDPs that have any of these six IEC items onSTDs or HIV have only one or two; thus in largepart the items do not cluster. This effect is some-what reduced in Botswana, where a greater pro-portion of SDPs tend to have more than one ortwo items.
48 Clinic-Based Family Planning and Reproductive Health Services in Africa
General Assessment of IEC Materials and Activities
IEC materials on family planning (R.7-1) are widely available in a few of the study sites, but are ratheruncommon in most; IEC materials on STDs or HIV (R.7-2) are extremely uncommon in almost all studysites. Botswana has markedly higher availability of all six IEC items, reflecting a particular emphasison IEC and STDs/HIV in that program. Health talks generally cover family planning more often thanthey cover STDs or HIV (R.7-3), but these results are still not encouraging in most study sites.
The lack of IEC materials at the SDP level can have several causes. It may be that the family plan-ning program simply has not generated these materials, or it may be that all the consumable IECmaterials, such as brochures, have been used up. Commonly, however, these materials have been pro-duced centrally, but the distribution system is faulty. In these cases, the IEC materials may be centrallylocated, simply waiting for distribution. The Botswana Situation Analysis report describes exactly thissituation.
R.7-3 Do group health talks at SDPs addressfamily planning, STDs, or HIV?This indicator is calculated for those SDPs thatgave a group health talk on the day of the studyvisit. For family planning, the results range enor-mously. In Senegal, 100% of the health talks wit-nessed by the study teams included informationon family planning, but in Botswana only 10% didso. Figure 3-10 shows that inclusion of informationon STDs or HIV is extremely uncommon: 16% orfewer of health talks included information onSTDs, and 7% or fewer addressed HIV.
R.8 Recordkeeping and Supervision
R.8-1 Do SDPs have client record cards in good condition?A usable client record card system is essential to afamily planning program, since it allows a clientÕsmedical history, clinical information, and familyplanning experience to be available to providers atevery visit. This in turn enables better continuityof care.
In most of the study sites, client records arekept in good condition. ÒGood conditionÓ isdefined as well-ordered enough to be usable,16
and is restricted to those SDPs that keep clientrecords on site rather than leaving them withclients. In 9 of the 11 sites for which informationon this indicator is available, two-thirds or moreof the SDPs keep their cards in such condition. InZimbabwe, the figure is 55% of SDPs and inTanzania only 29%. With a few exceptions, clientrecord cards appear to be well maintained.However, this finding does not indicate whetherthe information on the cards is accurate or com-plete, but only whether the recordkeeping systemis working.
R.8-2 How often are SDPs supervised?Supervision is critical to any family planning pro-gram, but it is difficult to measure meaningfully.Various Situation Analysis studies approach thequestion differently; the simplest and most compa-rable measure that can be included here is whethereach SDP had had at least one visit from a supervi-sor, for the purpose of supervision, in the 6 months
preceding the study. Even using this blunt level ofmeasurement, there are some visible difficultieswith supervision.
The results fall into roughly three groups. InBotswana, Tanzania, Zanzibar, and Zimbabwe,over 93% of SDPs had received a supervisory visitin the previous 6 months, so the amount of super-vision in these sites may meet some minimumlevel.17 In Zambia, Kenya, and Ghana, 78% to 79%of SDPs had received a visit. This is still a rela-tively high percentage, but it means that about20% of SDPs had not been supervised over a 6-month period, which could have serious conse-quences for service quality. Lastly, only 48% ofSDPs had received a supervisory visit in Senegaland only 22% in Burkina Faso. In both of thesecountries, supervision systems require seriousattention.
QUALITY OF SERVICES
Q.1 Interpersonal Relations
Interpersonal relations is one of the most difficultelements to measure because it is so subjective. Thetwo sources of information for this element are (1)observation of the client-provider interaction, inwhich an observer notes the providerÕs interper-sonal treatment of the client, and (2) the exit inter-view, in which the client herself reports on how shewas treated. Both of these approaches havemethodological difficulties.
During the interaction, observers may beasked to judge subjective events, such as whethera greeting is ÒfriendlyÓ or not. In the training ofobservers, a clear definition of Òfriendly greetingÓis agreed upon, using local customs and norms asguides. But this concept still may be measureddifferently by different providers, making thissort of data collection less reliable than might bedesired.
On the other hand, reports from clients them-selves are subject to a strong Òcourtesy bias,Ówhereby clients understandably do not want toappear rude or ungrateful for the services theyhave just received. For this reason, reports of satis-faction from clients normally are universally high
BA
SIC
ST
UD
Y F
IND
ING
S
& T
HE
IR U
TIL
IZAT
ION
Indicators of Readiness and Quality: Basic Findings 49

and show little variation. This effect is eliminatedto some extent if the questions are very specific, orif they do not relate to the provider herself but toother aspects of the experience, such as waitingtime or cost.
For the above reasons, the Situation Analysis isnot particularly strong on measuring this element,which might be measured more satisfactorily withqualitative methods removed from the clinicalenvironment. Nonetheless, four indicators of inter-personal relations are presented here, althoughthey should be interpreted in light of the method-ological difficulties involved.
Q.1-1 Are clients greeted in a friendly manner?A friendly greeting helps put clients at ease.Information on this indicator was collected duringthe observation of client-provider interactions,using a definition of Òfriendly greetingÓ relative toeach context, as discussed above. The results arealmost universally high: in 9 of 10 sites, the per-centage of positive findings on this indicator is 80%or higher; in C�te dÕIvoire, the percentage is lower(66%).
Q.1-2 Do clients ask questions and getsatisfactory responses?An important part of interpersonal relations ismaking clients feel comfortable enough to askquestions. Once asked, the questions should betreated respectfully and answered in full. In theexit interview, clients were asked whether they hadposed a question and if so, whether it had beenanswered satisfactorily. However, not all clientsmay have a question, so this indicator is not calcu-lated for all clients. Instead, it is assumed that allnew clients, returning clients with a problem,returning clients who wanted to switch methods,and returning clients who wanted to stop usingcould all reasonably be expected to have at leastone question. These groups of clients form thedenominator for this indicator.
The results for this indicator fall roughly intotwo groups. In Madagascar, Senegal, Botswana,and Kenya, 70% or more of clients had asked aquestion. In 5 other sites, only 42% to 49% of clientshad done so. These results suggest there is room forimprovement in making clients comfortableenough to ask questions and encouraging them todo so.
50 Clinic-Based Family Planning and Reproductive Health Services in Africa
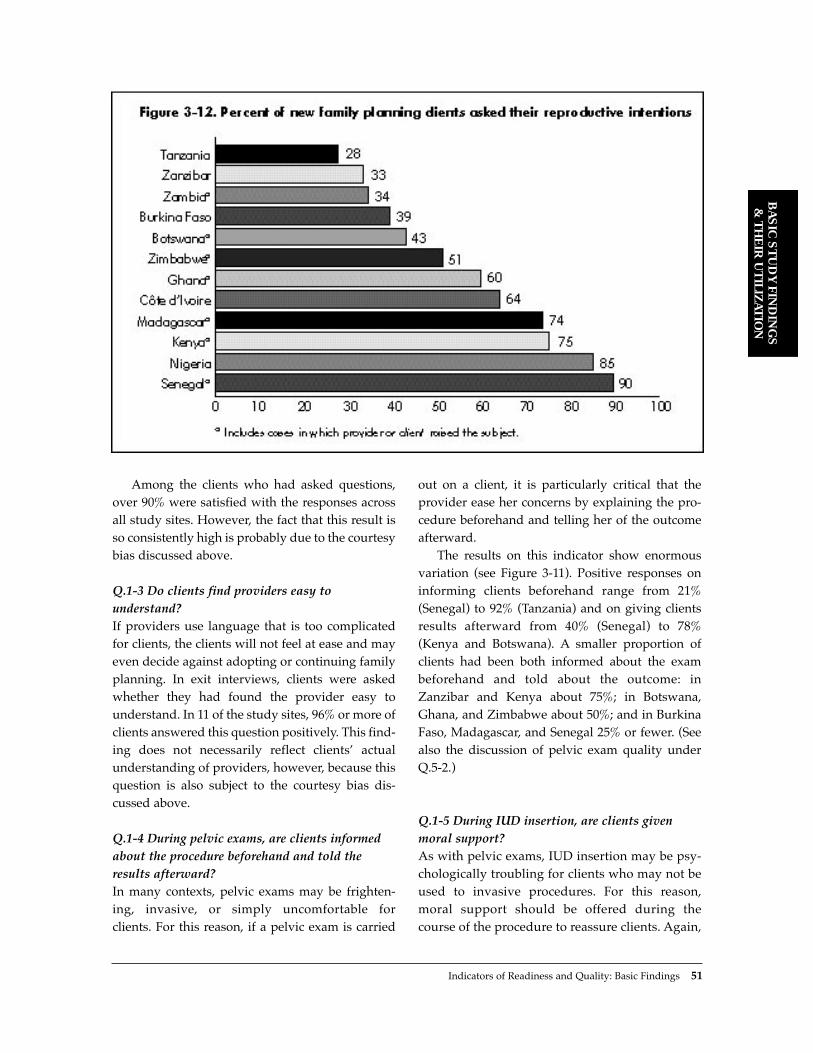
Among the clients who had asked questions,over 90% were satisfied with the responses acrossall study sites. However, the fact that this result isso consistently high is probably due to the courtesybias discussed above.
Q.1-3 Do clients find providers easy tounderstand?If providers use language that is too complicatedfor clients, the clients will not feel at ease and mayeven decide against adopting or continuing familyplanning. In exit interviews, clients were askedwhether they had found the provider easy tounderstand. In 11 of the study sites, 96% or more ofclients answered this question positively. This find-ing does not necessarily reflect clientsÕ actualunderstanding of providers, however, because thisquestion is also subject to the courtesy bias dis-cussed above.
Q.1-4 During pelvic exams, are clients informedabout the procedure beforehand and told theresults afterward?In many contexts, pelvic exams may be frighten-ing, invasive, or simply uncomfortable for clients. For this reason, if a pelvic exam is carried
out on a client, it is particularly critical that theprovider ease her concerns by explaining the pro-cedure beforehand and telling her of the outcomeafterward.
The results on this indicator show enormousvariation (see Figure 3-11). Positive responses oninforming clients beforehand range from 21%(Senegal) to 92% (Tanzania) and on giving clientsresults afterward from 40% (Senegal) to 78%(Kenya and Botswana). A smaller proportion ofclients had been both informed about the exambeforehand and told about the outcome: inZanzibar and Kenya about 75%; in Botswana,Ghana, and Zimbabwe about 50%; and in BurkinaFaso, Madagascar, and Senegal 25% or fewer. (Seealso the discussion of pelvic exam quality underQ.5-2.)
Q.1-5 During IUD insertion, are clients givenmoral support?As with pelvic exams, IUD insertion may be psy-chologically troubling for clients who may not beused to invasive procedures. For this reason,moral support should be offered during thecourse of the procedure to reassure clients. Again,
BA
SIC
ST
UD
Y F
IND
ING
S
& T
HE
IR U
TIL
IZAT
ION
Indicators of Readiness and Quality: Basic Findings 51
the proportion of positive results on this indicatorvaries widely, from only 17% in Madagascar to100% in Botswana and Zimbabwe. However, thesample sizes on these insertions can be quite low,so these results may not be representative of allIUD insertions. (See also the discussion of IUDinsertion quality under Q.5-3.)
Q.2 Information Exchange: InformationTaken from Clients
Q.2-1 Are new clients asked their reproductiveintentions?A clientÕs reproductive intentions are among the most important information that must be
52 Clinic-Based Family Planning and Reproductive Health Services in Africa
General Assessment of Interpersonal Relations
Measurement of interpersonal relations is hampered by methodological difficulties. For example, theresults on whether providers are easy to understand are not entirely informative since they do not varymuch and are subject to a strong courtesy bias. Of the indicators included under this element, those onpelvic exams and IUD insertion (Q.1-4 and Q.1-5) appear to be the most informative, although the IUDinformation suffers from very small sample sizes on the individual country level. These indicators areexamined more closely here.
The results on informing clients during pelvic exams do not seem to vary by the maturity of the fam-ily planning program, but they do seem to differ between anglophone and francophone countries. The3 francophone countries for which data on this indicator are available—Senegal, Madagascar, andBurkina Faso—do appear to have consistently lower results than those for the other countries, which areall anglophone. Since interpersonal relations are plausibly influenced by cultural factors, this findingmay point to cultural differences between the two groups of countries, such as the degree of hierarchi-cal relations between professional staff and lower-status clients. This finding generally holds for givingmoral support during IUD insertion as well, although not as clearly. The countries do fall into fran-cophone and anglophone groups, but the difference between the groups is not as large, and Ghanahas the lowest percentage of all.
Interestingly, provider training (R.6) does not appear to be strongly related to these two indicators. In5 of 6 countries for which the data can be linked, provider training in neither clinical family planningnor IEC/counseling had any effect on whether the provider informed the client before and after pelvicexams. The only counterexample is Kenya, where providers with training in family planning counselingare significantly more likely to inform clients about pelvic exams (p < .05). Overall, however, the con-nection is not strong. (See Q.5-2 for information on training and the technical quality of pelvic exams.)
Findings on the relationship between training and giving moral support to clients during IUD insertionare similar. In several of the study countries, IUD insertions had been performed by providers who report-ed in the staff interview that they had never received training in IUD insertion and removal—a finding thatis in itself of great concern. Comparison of this untrained group with those trained in the procedure showsthat, as with the pelvic exam results, providers trained in IUD insertion are not more likely to give moralsupport. The only counterexample is Ghana, in which IUD training is positively correlated with givingmoral support (p < .05). Similarly, training in IEC/counseling is not related to giving moral support dur-ing IUD insertion. (See Q.5-3 for information on IUD training and the technical quality of IUD insertions.)
Although the evidence for this element is scant and may be affected by methodological difficulties, col-lectively it suggests that interpersonal relations are influenced by cultural factors. Traditional training inter-ventions may not substantially improve this element of quality, possibly because they do not directlyaddress these issues. Further research is needed to develop more valid indicators of this element of ser-vice quality.

ascertained before a method can be provided. If aclient does not want any more children, sheshould receive more information about long-termmethods, whereas if she does want more chil-dren, she should receive information about amethod that will allow her to space births appro-priately. Results on this indicator vary greatly,from 28% in Tanzania to 90% in Senegal (seeFigure 3-12).
Q.2-2 Are new clients asked their breastfeedingstatus?Breastfeeding status is also among the most impor-tant information to be gathered from a client.COCs are not appropriate for breastfeedingwomen because estrogen can affect the quality andquantity of breastmilk (Hatcher et al., 1994).Instead, breastfeeding clients who want to useorals should be provided with a progestin-onlymethod, such as POPs or injectables. Breastfeedingrates among clients in the study sites are probablyfairly high, given the relatively high fertility andthe traditionally prolonged period of breastfeeding(18 to 23 months) in many sub-Saharan Africancontexts (Jolly and Gribble, 1993).
Results on this indicator vary from 28% inGhana to 79% in Senegal.18 It may be argued thatproviders may not be inquiring in many casesbecause the client is an injectable or POP user, andthus her breastfeeding status is not as important.However, this indicator was also calculated amongonly those clients who had accepted COCs by theend of their consultations. The results are similar,ranging from 30% in Botswana to 94% in Nigeria.Thus with a few exceptions, a substantial propor-tion of COC clients are not being asked theirbreastfeeding status.
Q.2-3 Are new clients asked their method preference?Client method preference is important becauseclients have been found to continue longer on apreferred method (Pariani et al., 1987). However, aclient should not automatically receive her pre-ferred method because it may not address herspacing/limiting needs properly, or may be con-traindicated. Rather, asking a new clientÕs prefer-ence is a starting point for a family planning coun-
seling session. The positive results on this indicatorare moderate, ranging from 42% in Burkina Faso to81% in Senegal.
Q.2-4 Are new clients asked about previousmethod use?A client who has previously used a method proba-bly already knows what she likes and dislikesabout that method. This existing knowledge isextremely useful to the provider in prescribing anappropriate method. Again, positive results on thisindicator vary widely, from only 19% in Zanzibarto over 80% in Zimbabwe.
Q.2-5 Are revisit clients asked whether they hadproblems with their method?Most indicators of information exchange refer tonew clients only, because these items should clear-ly be addressed in initial counseling sessions. Onthe other hand, problems with their method is oneof the few issues that should clearly be addressedwith all revisit clients. As with the other indicatorsunder this element, results vary widely, from 37%in Zanzibar to 84% in Kenya.
Q.2-6 Are new clients asked whether they discussfamily planning with their partner?A clientÕs relationship with her sexual partner hasramifications for the method she should adopt. Ifher partner is unaware or unsupportive of her useof family planning, she may want to select amethod that is not visible, such as the injectablerather than the pill. The positive results on thisindicator are generally lower than for the otherindicators under this element: 8 of 9 studies foundthat about half or fewer clients had been askedwhether they discuss family planning with theirpartners. The exception is Ghana, in which 69% ofclients had been asked.
Q.2-7 Are clients asked about their sexualrelations?The nature, frequency, and timing of a clientÕs sex-ual relations should also affect her method choice.In addition, this information gives providers anidea of exposure to STD risk, which may affect themethod provided as well.
BA
SIC
ST
UD
Y F
IND
ING
S
& T
HE
IR U
TIL
IZAT
ION
Indicators of Readiness and Quality: Basic Findings 53

This indicator addresses both new and revisitfamily planning clients. Among new clients, theresults are quite low, ranging from 33% (Kenya) toonly 5% (Zambia) for 8 of 9 study sites. In Zanzibar,
59% of new clients had been asked about this issue.For revisit clients the results are even lower: fewerthan 10% of revisit clients had been asked thisquestion in 6 of 7 countries, and only 13% in the
54 Clinic-Based Family Planning and Reproductive Health Services in Africa

Indicators of Readiness and Quality: Basic Findings 55
BA
SIC
ST
UD
Y F
IND
ING
S
& T
HE
IR U
TIL
IZAT
ION
seventh (Kenya). (See Chapter 6 for more informa-tion on this point.)
Q.2-8 Are clients asked about STD symptoms?Since family planning clients are sexually active,they are at risk for STDs and should be screened.The exact screening questions that should be usedare a subject of controversy, since not all symptomsare indicative of STD infection in particular, ratherthan other conditions. Moreover, a clientÕs judg-ment about what constitutes unusual symptoms or
even pain can vary greatly, so reporting of physicalsymptoms may not be fully informative.
The available Situation Analysis data reveal afairly blunt measure of screening activities:whether the provider asks clients about anyunusual bleeding or discharge. The proportion ofpositive results on this measure, which are avail-able for both new and revisit clients, is generallyquite low.
Figure 3-13 shows that in 11 of the study sites,half or fewer of new clients had been asked aboutunusual bleeding. In Senegal, only 7% had been
General Assessment of Information Taken from Clients
Given the large range of results on the indicators under this element, it is difficult to form a clear over-all picture of how information is being solicited from clients. One way to clarify the picture is to calcu-late the mean number of items asked of each client per country. Figure 3-15 presents the mean num-ber of questions asked of new and revisit clients under each of the above indicators in each country.In each case, some studies are excluded because they did not include all the questions.
Figure 3-15 shows that for new clients, the more mature family planning programs identified in thecountry descriptions generally do take more information from clients during counseling. However, evenin the highest-scoring country, Senegal, only about 4 of the 8 specific questions shown are being askedof clients. As for revisit clients, the same observation applies about the maturity of the program, butfindings for Botswana are surprisingly low, while Nigeria fares quite well. Results for Kenya and Nigeriaare the highest, with 1.1 of 4 specific questions being asked of revisit clients on average.
Can the results be further explained by provider training? For 8 of the study sites, information isavailable on all the questions asked of new clients, and among these, the data from 5—Burkina Faso,Kenya, Senegal, Zambia, and Zimbabwe—can link staff information with observation information. Thisallows for a comparison of counseling behavior between staff that have and have not received differ-ent types of training. In Burkina Faso, Kenya, and Zambia, those providers that had received trainingin IEC/counseling (R.6-7) had asked clients on average a significantly (p < .05) higher number of thequestions shown in Figure 3-15.21 The same relationship holds for Zimbabwe, but the results are notsignificant. Interestingly, in all 5 countries, no significant difference was found between providers thathad been trained in clinical family planning (R.6-3) and those that had not.
Do the above findings also hold for treatment of revisit clients? In this case, data are available from7 countries about questions asked of revisit clients, and for 4 of these (Ghana, Kenya, Zimbabwe, andZambia), staff information and observation information can be linked. These results show no signifi-cant difference in questions asked with either IEC/counseling training or clinical training. The excep-tion is Zimbabwe, in which providers trained in counseling had asked a significantly higher number ofquestions of revisit clients than had those not so trained; those trained in clinical skills had also askedsignificantly more questions than those without that training.
Overall, the results on this element reveal serious shortcomings in obtaining critical information fromclients, even among the best family planning programs in the region. The lack of screening for STDsymptoms is especially troubling. Moreover, information gathering from new clients may improve withtraining in IEC/counseling skills, but does not appear to be related to training in clinical family planning.
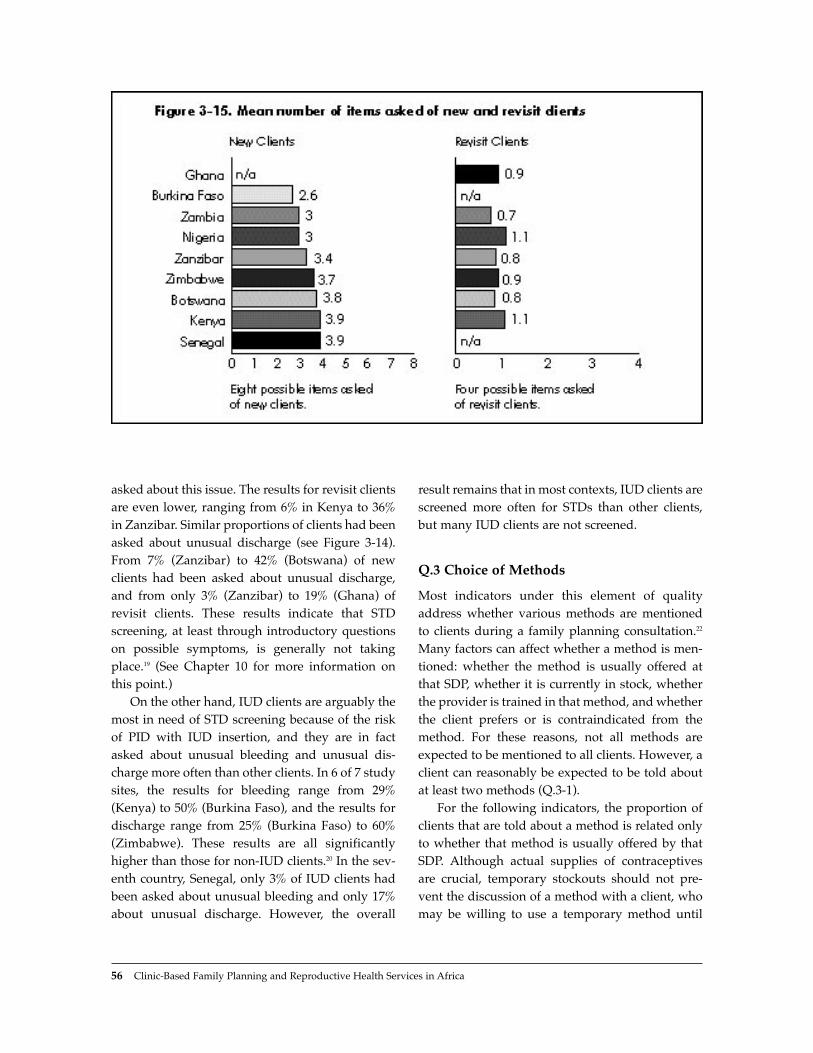
asked about this issue. The results for revisit clientsare even lower, ranging from 6% in Kenya to 36%in Zanzibar. Similar proportions of clients had beenasked about unusual discharge (see Figure 3-14).From 7% (Zanzibar) to 42% (Botswana) of newclients had been asked about unusual discharge,and from only 3% (Zanzibar) to 19% (Ghana) ofrevisit clients. These results indicate that STDscreening, at least through introductory questionson possible symptoms, is generally not takingplace.19 (See Chapter 10 for more information onthis point.)
On the other hand, IUD clients are arguably themost in need of STD screening because of the riskof PID with IUD insertion, and they are in factasked about unusual bleeding and unusual dis-charge more often than other clients. In 6 of 7 studysites, the results for bleeding range from 29%(Kenya) to 50% (Burkina Faso), and the results fordischarge range from 25% (Burkina Faso) to 60%(Zimbabwe). These results are all significantlyhigher than those for non-IUD clients.20 In the sev-enth country, Senegal, only 3% of IUD clients hadbeen asked about unusual bleeding and only 17%about unusual discharge. However, the overall
result remains that in most contexts, IUD clients arescreened more often for STDs than other clients,but many IUD clients are not screened.
Q.3 Choice of Methods
Most indicators under this element of qualityaddress whether various methods are mentionedto clients during a family planning consultation.22
Many factors can affect whether a method is men-tioned: whether the method is usually offered atthat SDP, whether it is currently in stock, whetherthe provider is trained in that method, and whetherthe client prefers or is contraindicated from themethod. For these reasons, not all methods areexpected to be mentioned to all clients. However, aclient can reasonably be expected to be told aboutat least two methods (Q.3-1).
For the following indicators, the proportion ofclients that are told about a method is related onlyto whether that method is usually offered by thatSDP. Although actual supplies of contraceptivesare crucial, temporary stockouts should not pre-vent the discussion of a method with a client, whomay be willing to use a temporary method until
56 Clinic-Based Family Planning and Reproductive Health Services in Africa

Indicators of Readiness and Quality: Basic Findings 57
BA
SIC
ST
UD
Y F
IND
ING
S
& T
HE
IR U
TIL
IZAT
ION
stocks of the preferred method become available.Moreover, given the available data, analysis of theother factors affecting whether a method is men-tioned proved to be too cumbersome.
Q.3-1 Are new clients told about at least two methods?In order to make even the simplest of choices, aclient must be told about more than one method.The appropriateness of each method varies withthe clientÕs characteristics, and the optimum num-ber of methods to present to clients is debated (seeChapter 6 for further discussion). The present indi-cator is a crude measure of choice, particularlysince the client may have knowledge of methodsfrom other sources and may present a preference tothe provider. Nonetheless, this indicator gives avery rough measure of choice of methods offeredto the client.
The results on the indicator vary, but in all 12study sites, about 50% or more of clients have thisextremely basic choice. In Kenya and Ghana, thefigures are 85% and 87% respectively. The resultsfor the indicator do not appear to vary with thematurity of the program. The results for Zimbabweare among the lowest, even though it has a verystrong family planning program. The relationshipbetween the number of methods offered and thenumber mentioned is addressed in the ÒGeneralAssessmentÓ section at the end of this element.
Q.3-2 How often do providers mention COCs tonew clients?COCs are by far the most common method used bywomen in almost all the study sites; in Zimbabwethey comprise over three-quarters of the methodmix. COCs can be safely prescribed to mostwomen, so it is not surprising that they are easilythe method most frequently mentioned to clients.However, COCs are not appropriate for breast-feeding women (see Q.2-2), so clients should beasked about their breastfeeding status when thismethod is mentioned. As noted under Q.2-2, inmost contexts a large proportion of COC clients arenot asked about their breastfeeding status, a find-ing that casts doubt on the quality of screening forthis method.
Since COCs are also offered by almost all SDPsin all the study sites, most clients are attending SDPswhere this method is usually available. This meansthat in almost all cases in which a client is not toldabout COCs, the method is in fact available at theSDP. The most extreme example is Zimbabwe,where fully 66% of new clients attend SDPs thatoffer COCs, but the method was not mentioned dur-ing counseling. However, in recognition of thebreastfeeding issue, the Zimbabwe family planningprogram has been emphasizing POP use (see Q.3-3below), which explains the low proportion of clientshearing about COCs in that country.
Q.3-3 How often do providers mention POPs tonew clients?POPs are designed for use by breastfeedingwomen, but they are mentioned to a relativelysmall proportion of clients. In 9 of 11 study sites,POPs were mentioned to well below 50% of clients.Again, the relative lack of questioning aboutbreastfeeding status suggests that POPs may notbe being presented to the proper audience. Twocounterexamples are Zimbabwe and Kenya, inwhich about two-thirds of clients were told aboutPOPs. In Zimbabwe in particular, this findingreflects a new emphasis on POP use at the time ofthe fieldwork (see Q.3-2 above).
POPs are fairly commonly available method. In6 of 11 study sites, nearly half or more of clientsattend SDPs that offer POPs, but were not toldabout them. In Senegal, fully 71% of clients werenot told about POPs, although the method isoffered at their SDP. Again, providers may avoidmentioning this method because the client is notbreastfeeding, but the relative lack of discussion ofbreastfeeding, along with the high breastfeedingrates in the area, undermines this supposition.
In Zanzibar, 12% of clients were told aboutPOPs although the method is not available at theirSDP. This finding suggests the beginnings of areferral system in which methods are mentioned toa client regardless of their source, and the client isreferred to another SDP for the method if neces-sary. In no other study site was such a large pro-portion of clients told about POPs at SDPs that donot offer the method.
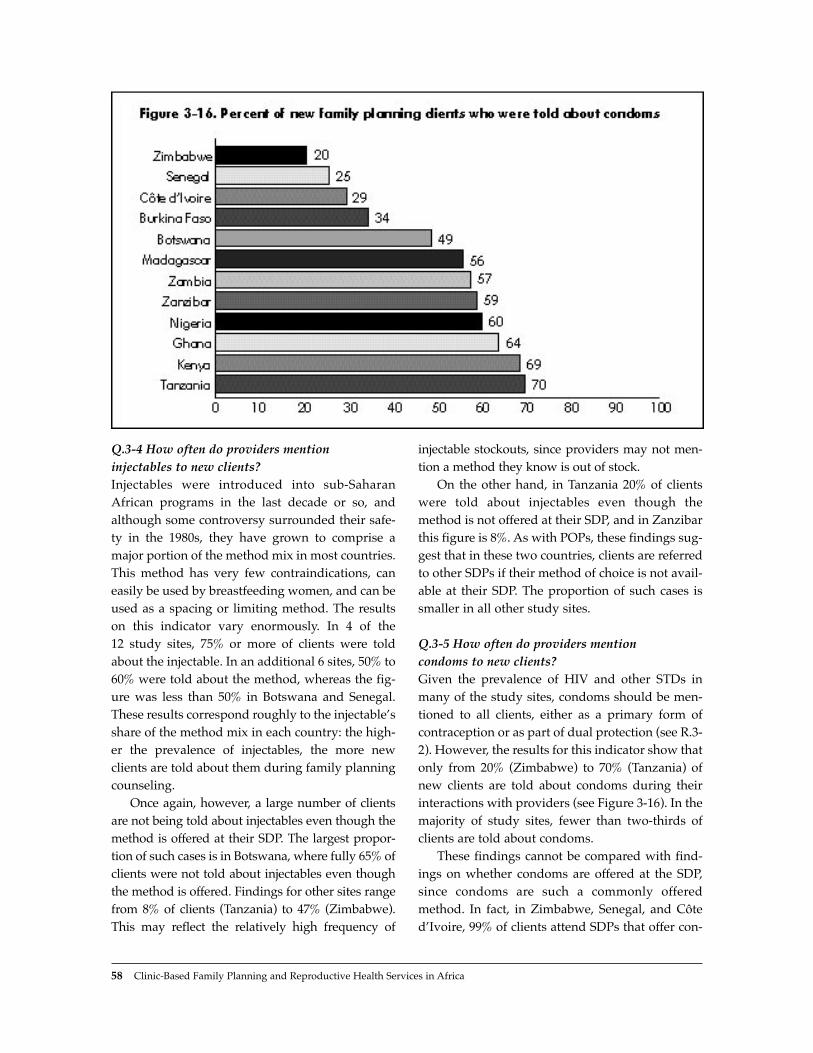
Q.3-4 How often do providers mention injectables to new clients?Injectables were introduced into sub-SaharanAfrican programs in the last decade or so, andalthough some controversy surrounded their safe-ty in the 1980s, they have grown to comprise amajor portion of the method mix in most countries.This method has very few contraindications, caneasily be used by breastfeeding women, and can beused as a spacing or limiting method. The resultson this indicator vary enormously. In 4 of the 12 study sites, 75% or more of clients were toldabout the injectable. In an additional 6 sites, 50% to60% were told about the method, whereas the fig-ure was less than 50% in Botswana and Senegal.These results correspond roughly to the injectableÕsshare of the method mix in each country: the high-er the prevalence of injectables, the more newclients are told about them during family planningcounseling.
Once again, however, a large number of clientsare not being told about injectables even though themethod is offered at their SDP. The largest propor-tion of such cases is in Botswana, where fully 65% ofclients were not told about injectables even thoughthe method is offered. Findings for other sites rangefrom 8% of clients (Tanzania) to 47% (Zimbabwe).This may reflect the relatively high frequency of
injectable stockouts, since providers may not men-tion a method they know is out of stock.
On the other hand, in Tanzania 20% of clientswere told about injectables even though themethod is not offered at their SDP, and in Zanzibarthis figure is 8%. As with POPs, these findings sug-gest that in these two countries, clients are referredto other SDPs if their method of choice is not avail-able at their SDP. The proportion of such cases issmaller in all other study sites.
Q.3-5 How often do providers mention condoms to new clients?Given the prevalence of HIV and other STDs inmany of the study sites, condoms should be men-tioned to all clients, either as a primary form ofcontraception or as part of dual protection (see R.3-2). However, the results for this indicator show thatonly from 20% (Zimbabwe) to 70% (Tanzania) ofnew clients are told about condoms during theirinteractions with providers (see Figure 3-16). In themajority of study sites, fewer than two-thirds ofclients are told about condoms.
These findings cannot be compared with find-ings on whether condoms are offered at the SDP,since condoms are such a commonly offeredmethod. In fact, in Zimbabwe, Senegal, and C�tedÕIvoire, 99% of clients attend SDPs that offer con-
58 Clinic-Based Family Planning and Reproductive Health Services in Africa

doms, but three-quarters of clients were not toldabout the method during consultation.
On the other hand, in Ghana and Tanzania,about 18% of clients were told about condomsalthough the method is not offered at their SDP.Again, this is a positive sign of the beginnings of areferral system, which in the case of condoms maysimply involve informing clients about the nearestsource of supply. In all other study sites, if the SDPdoes not offer condoms, this method is generallynot mentioned to clients.
This distribution of mentioning condoms is noteasy to analyze. It does not vary with the maturityof the family planning program, nor does it reflectthe share of condoms in the method mix or eventhe HIV prevalence of the country. Zimbabwe andBotswana have the two most advanced familyplanning programs, and they both suffer extreme-
ly high HIV prevalence, yet half or fewer of theirnew clients hear about condoms. Failure to men-tion condoms may reflect providersÕ discomfortwith discussing sexual relations with clients,although this is conjectural. It may also be arguedthat where condoms are not mentioned in the con-text of family planning, they may be mentioned atanother time in the context of disease prevention.See the discussion below of whether new familyplanning clients are told that condoms preventSTDs (Q.4-4) for results on this point.
Q.3-6 How often do providers mention IUDs tonew clients?Again, the results on this indicator vary greatly,from 22% in Zimbabwe to 78% in Nigeria.Interestingly, these results do not seem to reflectthe IUDÕs share of the method mix (as measured by
BA
SIC
ST
UD
Y F
IND
ING
S
& T
HE
IR U
TIL
IZAT
ION
Indicators of Readiness and Quality: Basic Findings 59
General Assessment of Choice of Methods
Of the methods mentioned or not mentioned to clients, the one that warrants most concern is condoms(Q.3-5). Although in many cases the majority of clients are told about more than one method, thosemethods clearly do not always include condoms. Given the prevalence of HIV in many of these studysites, condoms should be mentioned to every new client without fail.
Hormonal methods are mentioned most frequently, but they are not necessarily targeted to theappropriate users. COCs (Q.3-2) are mentioned quite often, but frequently not in conjunction with theimportant screening question about breastfeeding status. POPs (Q.3-3) are mentioned less often,although they would be a better method for breastfeeding clients. Injectables (Q.3-4) would also beappropriate for breastfeeding clients, but the extent of their presentation to clients appears to reflecttheir existing share of the method mix in each country. In the best case, a client would be asked herbreastfeeding status, and the answer to that question would determine whether she would hear aboutCOCs or POPs. This does not seem to be the case currently in most of the study sites.
With regard to IUDs (Q.3-6) and tubal ligation (Q.3-7), their mention to clients appears to beroughly determined by their availability at the SDP. However, not all clients at SDPs that offer thesemethods are actually told about them. In general, about half the clients at SDPs that offer IUDs are toldabout them during consultation.
Overall, then, the methods presented to clients do not seem to be related to the methods usuallyoffered at the SDP, except in the case of IUDs and tubal ligation. Providers’ mention of condoms andhormonal methods is governed by factors other than availability, but does not appear to take screen-ing questions into account. Moreover, for effective choice of methods, clients should be able to takeadvantage of a referral system, but such systems generally do not appear to be in place, except tosome extent in Tanzania and Zanzibar, and more for tubal ligation than for other methods. In addi-tion, in about 10% to 30% of cases, one method is emphasized to clients over others. In all study sites,client choice could be improved through proper screening and mention of all appropriate methods,whether offered at the SDP or available through referral. (See Chapter 6.)

the DHS). For example, IUDs make up 27% of themethod mix in Senegal, and half of clients hearabout them, whereas IUDs account for only 8% ofthe mix in Ghana, and three-quarters of clients hearabout them.
Instead, these results seem to vary with theavailability of IUDs at SDPs in a country. Fully 80%of SDPs offer IUDs in Nigeria, and three-quartersof clients are told about them, whereas only 8% ofSDPs offer IUDs in Zimbabwe (see endnote 5), andonly 22% of clients are told about them.23 The othercountries generally follow this pattern, except forZambia, Tanzania, and Zanzibar, which seem tohave healthy referral systems for IUDs. InTanzania, for example, fully 33% of clients attendSDPs that do not offer IUDs, yet they are told aboutIUDs in consultation. In Zanzibar this figure is 31%and in Zambia 22%.
Q.3-7 How often do providers mention tuballigation to new clients? This indicator is unique because tubal ligationwould presumably be mentioned only to clientswho want no more childrenÑa minority in manyof the study sites included here. Therefore, thisindicator is restricted to clients who in their exitinterview expressed the desire to have no morechildren. Since the information on whether tuballigation is mentioned was gathered from the obser-vation, it is not clear whether providers actuallyknew the clientÕs status as a limiter. However,because few clients are asked their reproductiveintentions (see Q.2-1 above), it is fair to assume thatmany providers do not know a client actuallywants to limit her births.
Few limiting clients are told about tubal liga-tion. The proportions range from only 3% inBotswana to 39% in Kenya, and may be related tothe percentage of SDPs that actually offer thismethod. Ghana and Kenya provide the mostopportunities for tubal ligation, and they fare bet-ter than most on this indicator.
Tubal ligation is one method that clearly callsfor a referral system, since it is usually offered onlyat larger SDPs (see R.3-4). In fact, referral systemsare more in evidence for this than for other meth-ods: in 6 of the study sites, from 11% (Ghana) to30% (Tanzania) of limiting clients were told about
tubal ligation even though the method is notoffered at their SDP. Thus although tubal ligationshould probably be discussed more frequentlywith limiting clients, the beginnings of a referralsystem are already in place in some contexts.
Q.3-8 Do providers overemphasize particularmethods to new clients?During the observation, the observer answered thequestion: ÒDid the provider emphasize onemethod in particular?Ó The answer to this questionis admittedly subjective, but the definition ofÒoveremphasizeÓ was carefully reviewed in theobserver training, and was always defined toexclude cases in which methods are emphasizedbecause of a contraindication for that client orother medical reason. Instead, this question encom-passes cases in which providers emphasize onemethod regardless of the clientÕs condition ordesires. It is designed to identify clients who mayhave been pressed into using a method as a resultof provider bias.
The results on this indicator are remarkably con-sistent, ranging between 11% and 28% for 9 studysites. In 5 countries, observers recorded whichmethod was overemphasized, and pills, IUDs, andinjectables accounted for most or all of the cases.Sterilization is rarely overemphasized in these coun-tries. It may also be noted that emphasizing onemethod over others during consultation does notappear to be related to whether the provider hasbeen trained in IEC/counseling (R.6-7).
Q.4 Information Exchange: InformationGiven to Clients
Q.4-1 Are new clients told how to use theirmethod?Once a client has decided on a method, she must betold how to use it, or failure rates will probablyincrease. This is an especially important point forusers of pills and condoms, which are particularlyuser dependent. Even an IUD user, however, mustknow how to check that the strings are in place andthat she must return for checkups. Likewise,injectable users must be told about the schedule ofreinjection. If this sort of information is omitted,
60 Clinic-Based Family Planning and Reproductive Health Services in Africa

Indicators of Readiness and Quality: Basic Findings 61
BA
SIC
ST
UD
Y F
IND
ING
S
& T
HE
IR U
TIL
IZAT
ION
General Assessment of Information Given to Clients
The first four indicators under this element naturally fall into two pairs: how to use the method (Q.4-1) and its side effects (Q.4-2), and how the method relates to STD transmission (Q.4-3) and the fact that condoms prevent STDs (Q.4-4). The first pair shows a range of results fromlow to high and addresses purely contraceptive issues, whereas the second pair is quite universally lowand addresses STD prevention. The two pairs are addressed separately here.
The percentage of new clients who were told both how to use their method and its side effects ispresented in Figure 3-17. As with information taken from clients (Q.2), the younger programs do notgenerally fare as well as the more mature programs in this regard, although there are some excep-tions, such as Zimbabwe, which has a fairly low result. Moreover, the results overall are not encour-aging. Even in the best case, Botswana, only two-thirds of clients are receiving critical informationabout their method.
A look at the relationship between training and the provision of this information shows thatproviders who have had clinical family planning training (R.6-3) tend to give clients more of this infor-mation, but these results are not statistically significant in any of the studies for which the data on theseindicators can be linked (Burkina Faso, Ghana, Kenya,24 Senegal, Zambia, and Zimbabwe).
The same is true for training in IEC/counseling (R.6-7), but the results here are statistically signifi-cant in Zambia, where 77% of providers trained in IEC/counseling told clients both pieces of informa-tion, but only 44% of providers without this training did so (p <.01). This suggests that training inIEC/counseling may indeed improve information given to clients.
Information on the pair of indicators related to STD transmission is available for only 4 of the studysites. The results for these 4 sites show that very few clients are receiving information on both theirmethod’s ability to prevent STDs and the fact that condoms prevent STDs. The percentages are 12%for Botswana, 7% for Zambia, 2% for Zimbabwe, and 2% for Ghana. Because these percentages areso small, no tests of provider training are statistically significant. However, the results do show a pos-sible relationship to training in that only providers trained in clinical family planning or IEC/counsel-ing actually provided this information to clients.
As for use of IEC materials, no summary measure of this indicator is necessary since use of thesematerials is universally low. In general, IEC materials are not being used with clients in any program,the only exception being clients in Ghana and Zambia, who are sometimes counseled with flip charts.The use of IEC materials may be related to training in IEC/counseling, but the data on this issue donot yield many statistically significant results. Findings on this indicator were compared amongproviders who have had such training and those who have not; the results show only scattered statis-tical significance, but they are in the expected direction. For example, in Zambia 61% of clients whowere counseled by providers trained in IEC were shown flip charts, compared to only 15% of clientscounseled by untrained providers (p <.01). This finding suggests that IEC training may be related touse of IEC materials.
In general, information given to clients is an extremely weak program element in all countries sur-veyed, both in terms of family planning information and even more so in terms of STD/HIV informa-tion. However, more mature family planning programs do seem to fare relatively better. Providers whoare trained in IEC/counseling or basic clinical family planning may do a better job of giving informa-tion to clients, but the relationship is not extremely strong, and providers trained in IEC/counseling donot necessarily use IEC materials more often. (See Chapter 5 for more detail on Kenya.)

the client will probably not have a satisfactorylong-term experience with the method. The resultson this indicator are in general quite high: in 9 of 11study sites, almost 80% or more of new clients weretold how to use their method; 62% were told inC�te dÕIvoire, and only 14% in Tanzania.
Q.4-2 Are new clients told the side effects of theirmethod?Awareness of side effects is particularly important,since they are a common reason for discontinuingmany methods (Ross and Frankenberg, 1993). Ifclients are aware of side effects and their manage-ment beforehand, they may not discontinue themethod as quickly should a side effect occur.Unfortunately, the results for this indicator are notparticularly high, ranging from 24% in BurkinaFaso to 68% in Botswana.
Q.4-3 Are new clients told how their methodrelates to STD/HIV transmission?Given the high prevalence of HIV and otherasymptomatic STDs in the region, family planningprograms have a particular responsibility to informclients as to whether their method can protect them from STD transmission. This question wasincluded in only 4 of the Situation Analysis studies,
and in all cases yielded very low results: 19% ofnew clients in Botswana, 9% in Zambia, 5% inZimbabwe, and only 3% in Ghana. These findingsare especially troubling because in all 4 countries,pills, IUDs, and injectables comprise a large por-tion of the method mix and do not provide protec-tion against STDs.
Q.4-4 Are new clients told that condoms preventSTDs/HIV?Aside from hearing about the ability of their chosenmethod to prevent STDs, clients should be told thatcondoms are the most effective method of STD pre-vention. Again, the high STD/HIV prevalence in theregion makes this an issue of great importance.Unfortunately, the results on this indicator are notencouraging. Fewer than one-third of new clientsgenerally and in some areas fewer than 10% of clientsreceive this information. (See also Q.3-5 above.)
Q.4-5 Are IEC materials used with new clients?The content of information given to clients is criti-cally important, but the form of communicationalso has an effect on whether the information isretained. Use of posters, flip charts, brochures,anatomical models, and other supports enablesclients to understand and remember information
62 Clinic-Based Family Planning and Reproductive Health Services in Africa

more effectively. This indicator reveals whethernew clients are being counseled using posters,brochures, and flip charts on family planning. Ineach case, the results include only clients at SDPswith a poster, brochure, or flip chart available.With a few exceptions, use of IEC materials isremarkably low. (See Chapter 6 for more discus-sion of this point; see also R.7-1 above.)
Where flip charts are available, they are used tocounsel more than 50% of clients in Ghana andZambia. In 9 other study sites, however, they areused with only about 25% or fewer clients, and inZanzibar and Botswana the flip charts are simplynever used. In all 12 study sites, 25% or fewerclients had been counseled using brochures, and in10 study sites only 11% or fewer clients had beencounseled using posters. In each case, the brochureor poster was available, but had not been not usedwith the vast majority of clients.
Q.5 Technical Competence
Q.5-1 How are new clients assessed?Many of the countries included here have serviceprotocols governing the assessment of new familyplanning clients. Because these protocols differ andcan be quite complex, the present analysis focuses
on five simple assessments: medical history,weight, last menstrual period (LMP), blood pres-sure, and physical exam.25 Not all of these proce-dures are necessary for all new clients. For exam-ple, the Kenya and Zimbabwe programs havedropped their requirement for medical history andweight. International family planning guidelinesrarely require these procedures (United StatesAgency for International Development, 1994). Insome cases, these procedures may even constitutea barrier to services for clients who are uncomfort-able with medical procedures. On the other hand,clients who come for family planning servicesdeserve a broader concern for their general repro-ductive health (a theme of the InternationalConference on Population and Development[ICPD]), and they may appreciate the medicalattention (Ndhlovu, 1995). Regardless of thisdebate, this indicator addresses only whether thesefive simple assessments were performed on newclients (see Chapter 9 for more information).
Weight, LMP, and blood pressure are almostuniversally taken.26 The results for weight rangefrom 66% of clients in Ghana to 92% in Botswana,and the results for LMP range from 73% of clientsin Zimbabwe to 97% in Burkina Faso. Similarly,blood pressure is taken with 69% (Ghana) to 93%(Senegal) of clients. Results for medical history
BA
SIC
ST
UD
Y F
IND
ING
S
& T
HE
IR U
TIL
IZAT
ION
Indicators of Readiness and Quality: Basic Findings 63

show a little more variation, fueled mainly bylower percentages for Zimbabwe (51%) and Ghana(60%). The others range from 69% (Zambia) to 86%(C�te dÕIvoire).
Physical exams are the least common item ofthe five. Although 85% of new clients in BurkinaFaso receive a physical exam, this is the case in only31% (Ghana) to 65% (Senegal) of the remainingsites. The rates at which physical exams are per-formed do not appear to vary with the methodaccepted by clients.
In general, the results for this indicator arehigher than those for information exchange (Q.2and Q.4) and choice of methods (Q.3). One way tosummarize the client assessment indicator is to cal-culate the mean number of the above five itemsperformed with clients in each country. Figure 3-18 shows that these results exhibit a fairlynarrow range, although the higher means are sta-tistically different from the lower means.27
Interestingly, this result does not seem to vary withthe maturity and effectiveness of the family plan-ning program: Burkina FasoÕs mean is relativelyhigh, while ZimbabweÕs is relatively low.
A comparison of the clinical training of pro-viders and their assessment of clients is possible forBurkina Faso and Senegal. (In all other countries, sofew providers had not had clinical family planningtraining that a comparison of trained and untrained
groups was not possible.) In both cases, providerstrained in clinical family planning carried out a sig-nificantly higher number of assessment procedureswith new clients than did untrained providers. InSenegal, providers trained in clinical family plan-ning carried out 4.5 of the 5 assessments on average,versus 3.9 among untrained providers (p < .01). InBurkina Faso, trained providers carried out an aver-age of 4.3 assessments, versus 3.4 among untrainedproviders (p < .05).
Q.5-2 What is the technical quality of pelvic exams?The quality of pelvic exams is usually measuredaccording to six items in the Situation Analysis:informing clients about the procedure beforehand,washing hands beforehand, using a clean or sterilespeculum, using clean or sterile gloves, washinghands afterward, and informing clients of theresults.28 Two of these itemsÑinforming clientsbeforehand and afterwardÑare covered aboveunder Q.1-4. Three othersÑwashing hands before,washing hands after, and using clean or sterileglovesÑrelate to protecting clients from cross-infections. Providers often disagree on whether allthree of these steps are necessary with each pelvicexam, or whether one or two are sufficient forensuring cleanliness. For the purposes of thisanalysis, performing all three items represents the
64 Clinic-Based Family Planning and Reproductive Health Services in Africa

highest-quality pelvic exam, since it best protectsthe client from infection. Clearly, performing noneof these actions puts clients at serious risk.
The results for handwashing before pelvicexams are given in Figure 3-19, and range fromonly 12% in Senegal to 82% in Nigeria. In 4 of thecountries, information is also available on wash-ing hands after the exam, and the results are high-er: Botswana (71%), Zimbabwe (75%), Ghana(81%), and Kenya (87%). However, if the results onhandwashing beforehand are compared withthose on handwashing afterward in these 4 sites,one still finds that a moderate percentage of pelvicexams involve no handwashing at all. The per-centages of pelvic exams during which theprovider washed hands before or after are 76% forBotswana, 81% for Zimbabwe, 89% for Ghana, and94% for Kenya.
Use of gloves is also particularly important foraverting infections, and the results on this item aresomewhat higher, ranging from 72% in Botswanato 98% in Kenya. However, providers may beselecting between using gloves and washing handsbefore exams: in the 9 studies for which the dataare available, 80% or more of pelvic examsinvolved either gloves or handwashing before-hand. This result is better than that for handwash-ing alone, but up to 20% of clients may be experi-encing pelvic exams with no protection from cross-infection at all.
In Senegal and Burkina Faso, the data allow acomparison of training in clinical family planningwith handwashing before and glove use.Disappointingly, in both countries those providerstrained in clinical family planning show no statisti-cally significant difference in handwashing fromthose not trained. In Senegal, trained providers douse gloves statistically more often (p < .05).
The final indicator relates to using clean or ster-ile specula. Speculum use is fairly high for 7 of 10study sites, ranging from 83% in Senegal to 97% in Tanzania. In the other 3 sites, the percentage isconsiderably less: 65% in Ghana, 58% in BurkinaFaso, and 52% in Madagascar. Again, these resultsare only for SDPs that have at least two speculaavailable.
In general, the quality of pelvic exams is vari-able. One of the most critical technical aspects ofthe exam is use of clean techniques, but many ofthe studies found this lacking, which places clientsat risk of cross-infection.
Q.5-3 What is the technical quality of IUD insertions?IUD insertions are fairly rare events in many of thestudy sites included here. In the 6 countries forwhich data on this indicator are available, thenumber of IUD insertions observed ranges fromonly 5 in Zimbabwe to 44 in Ghana. For this rea-son, these results must be interpreted with great
BA
SIC
ST
UD
Y F
IND
ING
S
& T
HE
IR U
TIL
IZAT
ION
Indicators of Readiness and Quality: Basic Findings 65

caution. Quality of IUD insertion is measuredaccording to three items in Situation Analysis:sounding the uterus,29 using sterile instruments,and offering moral support. Findings on offeringmoral support are covered above under Q.1-5.
The results for using sterile instruments are notvery encouraging (see Figure 3-20). Although inSenegal and Kenya over 90% of IUD insertionsinvolve sterile instruments, results in the other 4sites range from 59% in Ghana to 85% inMadagascar. In these contexts, a considerable pro-portion of clients are being exposed to cross-infec-tion through the use of nonsterile instruments.
Sounding the uterus is important because if theIUD is not placed properly within the uterus, thereis a risk of discomfort, expulsion, or perforation. InMadagascar, Senegal, and Kenya, almost all clientsare sounded, but the results are lower for BurkinaFaso (88%), Zimbabwe (80%), Ghana (67%), andBotswana (64%).
For 5 of the countries, it was possible to linkinformation from the staff interview to the observa-tion data, so a comparison between quality of IUDinsertion and provider training in the procedurecould be made. In all 5 countries, at least some ofthe observed IUD insertions were being performedby providers who reported in the staff interviewthat they had received no particular training in IUDinsertion, which is itself a pressing issue (see R.6-
8).30 Among those who did report such training, thequality of IUD insertion was significantly higher onall three of the above items. For example, 89% of theproviders trained in IUD insertion used sterileinstruments, as compared with 59% of untrainedproviders. Similarly, 89% of trained providers useda sound, versus 70% of untrained providers. Lastly,78% of trained providers offered moral support, ascompared with 48% of untrained providers.31
Q.5-4 What is the technical quality of injections?Injections are more common than IUD insertions inthe study sites, so the sample sizes on this indicatorare larger and more reliable. The quality of injec-tions is measured according to four items: disin-fecting the injection site, shaking the vial, using asterile needle, and not massaging the injection site.In general, the results on these indicators are quitehigh, with the exception of not massaging the injec-tion site, which shows more variation.
Across all study sites, 95% or more of observedinjections involved sterile needles. This result isoften attributable to the fact that Depo Provera, oneof the most common injectables, is deliveredprepackaged in a sterile, disposable needle andsyringe. Because infectious material can reside onthe outer skin, it is imperative to disinfect the injec-tion site so that the needle itself does not act as aninstrument of infection. In 6 of 9 sites, over 94% of
66 Clinic-Based Family Planning and Reproductive Health Services in Africa

injections involved disinfecting the injection site.In Zimbabwe and Zanzibar, about 75% of the injec-tion sites were disinfected, and in Ghana only 39%.
In most cases, providers vigorously shook theinjectable vial before injection. The results rangefrom 89% in Senegal to 100% in Botswana. InBurkina Faso, however, this figure was just 63%.
For most injections, such as antibiotics or vac-cines, massaging the injection site after injection isstandard practice, as it aids in uptake of the mate-rial. However, Depo Provera is carefully timed torelease hormones at a specific rate into the blood-stream over several monthsÕ time. Massaging the
injection site interferes with this process (UnitedStates Agency for International Development,1994). In 7 of 9 study sites, massaging of injectionsites appears to be common practice, since onlyabout 25% of injections were not massaged. InBurkina Faso, 47% were not massaged, and inGhana 74%.
Q.6 Mechanisms to Encourage Continuity
Q.6-1 Are clients told that they can switch methods?Many clients who discontinue a method do sobecause of dissatisfaction with side effects, modeof action, or intrusiveness of the method itself. Ifclients are aware that they can switch methodsshould they encounter problems, they may bemore likely to return to the SDP for a new methodrather than discontinue altogether (Ross andFrankenberg, 1993). However, not many clients aretold that they can switch. The results range fromonly 11% in Ghana to 54% in Zanzibar, and none ofthese results are significantly related to staff train-ing in IEC/counseling (R.6-7).
Q.6-2 Are clients given a date for a return visit?If clients leave the SDP without a date for a returnvisit, they may feel it is unnecessary to return tothe clinic for follow-up care or may not knowwhen and where to obtain care. Conversely, havinga return date encourages clients to continue theirmethod. Giving clients a return visit date appearsto be fairly standard practice across all study sites.The results range from 78% of clients in Zimbabweto fully 100% in Senegal.
Q.7 Appropriateness and Acceptability of Services
Q.7-1 Do clients receive the information and services they desire?This question was asked of clients as they left theSDP, and it is subject to a strong courtesy bias (seeQ.1). The results are uniformly high, ranging from87% in Botswana to 99% in Madagascar. Again,these results are not highly informative, but some
BA
SIC
ST
UD
Y F
IND
ING
S
& T
HE
IR U
TIL
IZAT
ION
Indicators of Readiness and Quality: Basic Findings 67
General Assessment ofTechnical Competence
Overall, most clients are assessed with weight,blood pressure, and LMP, with a little morevariation in frequency of medical histories andphysical exams. Findings on the quality ofpelvic exams and IUD insertions are notencouraging. The main concern is clean oraseptic procedures, particularly handwashingand use of gloves during pelvic exams. Asepsisduring injections is more under control gener-ally, although most injections involve massag-ing the injection site, which is not appropriate.
The findings on these indicators suggest anoverall relationship between training and tech-nical competence. Although results for theeffects of clinical training are available fromonly two countries (Senegal and Burkina Faso),they show that providers trained in clinical fam-ily planning perform more assessments ofclients. However, the association between train-ing in clinical family planning and observanceof aseptic procedures is extremely sketchy,showing statistical significance only in Senegal,and only for using gloves. Clinical training doesnot seem to have an effect on handwashing.On the other hand, training in IUD insertionand removal does seem to improve the qualityof IUD insertions significantly. Perhaps the morespecific a training course is, the stronger is itseffect on quality of care.

of the following indicators are more specific andgenerate more variation in response.
Q.7-2 Are clients satisfied with the duration oftheir consultation?Clients were asked whether the time of consultationwas too short, just right, or too long. Figure 3-21shows that where there was a complaint, clientstended to feel that their consultation was too short;this was particularly the case in Madagascar.Interestingly, the results differ for new and revisitclients. In all the study countries, substantially morerevisit than new clients reported that their visit wastoo short.32 It may be assumed that a revisit clientsimply wants to refill her method and be on herway, but the results show that some of these clientswould appreciate more time for discussion.
Q.7-3 Do clients find waiting time reasonable?Actual waiting times vary greatly among clientsand study sites, but the information is not collectedthrough a patient-flow analysis. Instead, theSituation Analysis asks clients to estimate how
long they waited, and whether they feel this lengthof time was reasonable. The estimates of waitingtime are not generally reliable, but for program-matic purposes, the clientsÕ opinions on the accept-ability of the waiting time can reveal whether they
are waiting too long, however they define this.Although the results are subject to a courtesy bias,they do show some variation: from 67% (C�tedÕIvoire) to 92% (Nigeria) of clients felt the waitwas reasonable. This indicator is calculated onlyfor those clients who waited.
Q.7-4 Do clients find the cost of services acceptable?In some family planning programs, services andcommodities are free, and in others the chargesvary by sector and method. In those study sites thatcharge for services, clients were asked whetherthey find the cost of services reasonable or afford-able. Again, this question is subject to a courtesybias, but it does show some variation, from 78% inZimbabwe to 100% in Zanzibar.
Measurement of cost and affordability is a com-plex subject that cannot be addressed with onequestion. For proper measurement, one wouldneed at least to add detailed information on theprice paid and the financial resources of clients.However, these items currently lie outside thescope of the Situation Analysis methodology.
CONCLUSION
The myriad individual pieces of information onfamily planning service readiness and quality pre-sented in this chapter can be used to construct anoverall picture of service quality in sub-SaharanAfrica. The Situation Analysis methodology in noway measures every aspect of quality, nor is it freefrom various biases. The results are informativenonetheless, and the general picture of servicequality given here is presented in the spirit of rec-ognizing the valuable information SituationAnalysis can offer.
In general, the maturity of the family planningprogram alone predicts much of the quality of fam-ily planning services. Overall, Botswana andZimbabwe, with two of the most mature and well-funded programs in sub-Saharan Africa, fare rela-tively well on many indicators, while the oppositeis true for some of the less developed programs.This result is not surprising, and in fact one needonly read the country descriptions in Chapter 2 to
68 Clinic-Based Family Planning and Reproductive Health Services in Africa
General Assessment ofAppropriateness andAcceptability of Services
All family planning programs are aimed atsatisfying clients in terms of both the methodaccepted and the acceptability of the visititself. The indicators under this elementattempt to get at client satisfaction with ser-vices, but many are not extremely informativesince they are strongly affected by a courtesybias and show little variation. In short, clientsatisfaction might better be measured usingqualitative techniques rather than the SituationAnalysis.

anticipate many of the results. However, programmaturity in no way determines all of the results.The sheer size of the population of women ofreproductive age served, the method mix of eachcountry, the quality and extent of training pro-grams, and even the various cultures all affect ser-vice quality directly.
Many of the stronger points of family planningand reproductive health services in sub-SaharanAfrica appear to revolve around readiness to pro-vide services. The infrastructure of most SDPs,especially in urban areas, is quite adequate, andmany have the equipment required for basic fami-ly planning services. Moreover, the pattern ofmethods offered is in some ways quite appropriate(the one serious problem being the lack of fullavailability of condoms in some countries), andstockout rates for most methods appear generallyto be under control, excepting injectables.
Several strengths are also evident in the qualityof services given to clients. The physical assess-ment of new family planning clients with weight,blood pressure, LMP, and medical history, forexample, is carried out fairly consistently. Thequality of injections is quite high in most countries,especially with regard to aseptic proceduresÑanimportant finding given the increasing use ofinjectables in many contexts. Also, across all thestudy sites, the vast majority of clients are givenrevisit dates, thereby encouraging continuity ofmethod use.
The overall weaknesses of the programsrevolve mainly around family planning counsel-ing, asepsis, and STD/HIV integration. Withregard to counseling, two aspects must be consid-ered: information taken from clients about repro-ductive intentions, breastfeeding status, and otheritems that relate to family planning use, and infor-mation given to clients about the method acceptedand STD risk. In both of these aspects, counselingis broadly lacking across all study sites. Theseactivities are particularly important because theyare directly related to client satisfaction, appropri-ateness of method selected, continuity of use, andSTD/HIV risk. Moreover, IEC materials areextremely uncommon in most contexts, and evenwhere they are present, are not usually used withclients. This nonuse of existing IEC materials rep-
resents missed opportunities to communicateeffectively with clients about their methods. (SeeChapter 6 for more discussion of this point.)
The issue of asepsis also stands out as an area ofconcern. Many examination rooms do not haveadequate water for washing hands or equipment,and handwashing and/or glove use are not prac-ticed consistently during pelvic exams, even wherewater and gloves are available. In some cases,clients undergoing pelvic exams are given no pro-tection whatsoever against cross-infection fromother clients. Moreover, sterile instruments werenot used for all observed IUD insertions. BecauseSTD and HIV prevalence is so high in many of thestudy contexts, there can be no margin for errorallowed on asepsis, so even the smallest lapsesshould be viewed as extremely serious.
Family planning clients are by definition sexu-ally active, so they are at risk for STDs and HIV, butmost programs do not adequately address thisrisk. Admittedly, most of the Situation Analysisstudies included in this chapter were carried outbefore the ICPD in Cairo, at which the importanceof STD/HIV integration with family planning ser-vices was stressed. Nonetheless, the results pre-sented here reveal the great distance that manysub-Saharan African programs must travel to reachfull integration. To begin with, the availability ofcondoms is in some places quite low, and evenwhere they are available in most SDPs, they areoften not discussed with clients with respect toeither family planning or prevention of STD/HIVtransmission. Moreover, clients are rarely told howtheir method relates to STD transmission orscreened for STD symptoms. (See Chapter 10 for amore detailed discussion of STI/HIV integration.)
Many of the above observed strengths andweaknesses depend on the actions of staff, who arecharged with the actual provision of family plan-ning services. In turn, it is the responsibility offamily planning programs to train providers ade-quately so their actions will result in high-qualitycare. The results of staff interviews show that fam-ily planning has in fact been integrated into manybasic training courses, so most of the newerproviders are trained. In addition, many programsappear recently to have been increasing theirrefresher training programs in IEC/counseling.
BA
SIC
ST
UD
Y F
IND
ING
S
& T
HE
IR U
TIL
IZAT
ION
Indicators of Readiness and Quality: Basic Findings 69

However, a certain proportion of providers whoattended basic training before the inclusion of fam-ily planning in the curriculum are still providingservices. Of even more concern is the small numberof providers who reported that they had had notraining in IUD insertion and removal, yet wereobserved inserting IUDs. Thus although trainingprograms may be improving in their preparation ofnew staff, older and untrained staff are still beingused for service delivery. Moreover, the distribu-tion of specially trained staff may be a problem insome contexts. That is, staff who are trained in IUDinsertion or tubal ligation do not appear to beplaced at SDPs that provide these services.
Some aspects of the relationship betweenprovider training and activities with clients can alsobe seen from these data. Certain aspects appear tobe clear and encouraging. An example is theincrease in quality of counseling (information takenfrom and given to clients) among providers trainedin IEC/counseling. Similarly, IEC training may be
related to increased use of IEC materials.Interestingly, these activities do not appear relatedto training in clinical family planning. Clinicaltraining may, however, increase the number ofphysical assessments of clients carried out. In addi-tion, IUD training appears to be related to increasedquality of IUD insertions. Yet not all of the relation-ships between training and quality of care are aspositive. For example, training in IEC/counselingdoes not appear to be related to refraining frominappropriate overemphasis of a method. Also, inSenegal and Burkina Faso, clinical family planningtraining does not appear to be related to followingaseptic procedures during pelvic exams. Perhapsnot as surprisingly, training in IEC/counseling isnot associated with improved interpersonal skills. In general, however, the data suggest that providertraining can improve the quality of actions andinteractions with clients, and the more specific thetraining, the stronger its effect on specific aspects ofthe quality of service provision.
70 Clinic-Based Family Planning and Reproductive Health Services in Africa
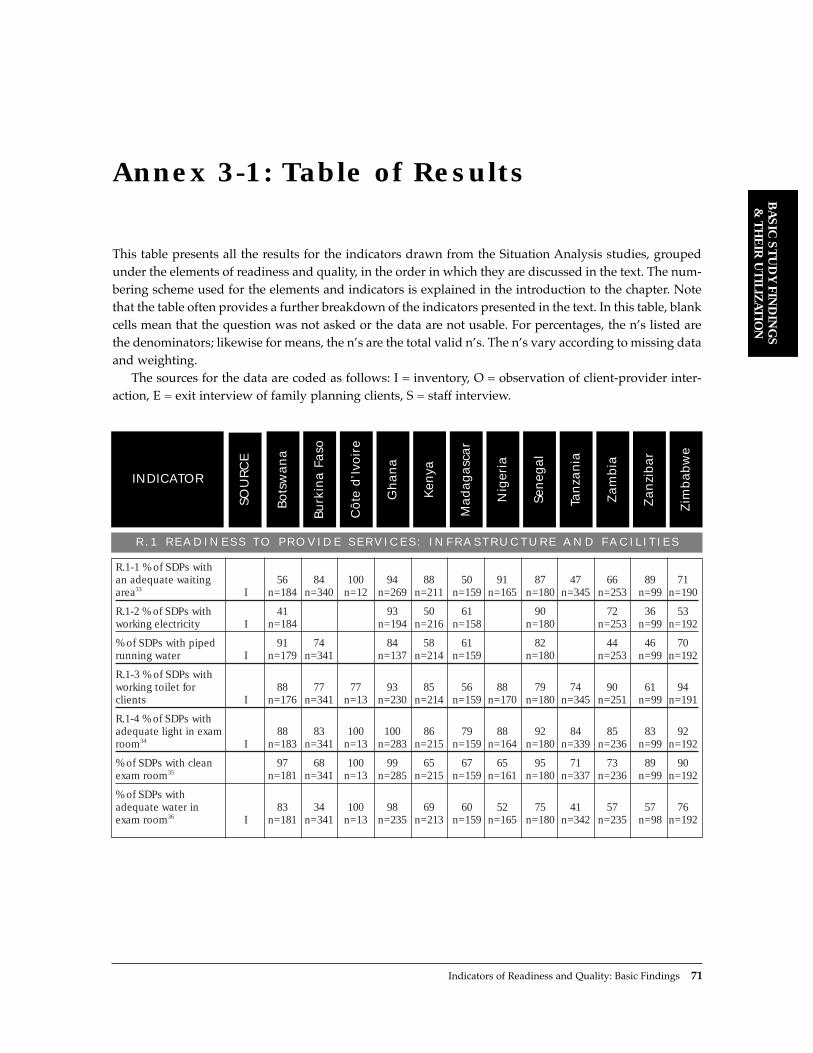
This table presents all the results for the indicators drawn from the Situation Analysis studies, groupedunder the elements of readiness and quality, in the order in which they are discussed in the text. The num-bering scheme used for the elements and indicators is explained in the introduction to the chapter. Notethat the table often provides a further breakdown of the indicators presented in the text. In this table, blankcells mean that the question was not asked or the data are not usable. For percentages, the nÕs listed arethe denominators; likewise for means, the nÕs are the total valid nÕs. The nÕs vary according to missing dataand weighting.
The sources for the data are coded as follows: I = inventory, O = observation of client-provider inter-action, E = exit interview of family planning clients, S = staff interview.
BA
SIC
ST
UD
Y F
IND
ING
S
& T
HE
IR U
TIL
IZAT
ION
Indicators of Readiness and Quality: Basic Findings 71
Annex 3-1: Table of Results
R . 1 R E A D I N E S S T O P R O V I D E S E R V I C E S : I N F R A S T R U C T U R E A N D F A C I L I T I E S
Zim
bab
we
Zan
zib
ar
Zam
bia
Tan
zan
ia
Sen
egal
Nig
eria
Mad
ag
asc
ar
Ken
ya
Gh
an
a
Côte
d’I
voir
e
Burk
ina F
aso
Bots
wan
a
SOU
RC
E
INDICATOR
R.1-1 % of SDPs with an adequate waiting 56 84 100 94 88 50 91 87 47 66 89 71area33 I n=184 n=340 n=12 n=269 n=211 n=159 n=165 n=180 n=345 n=253 n=99 n=190
R.1-2 % of SDPs with 41 93 50 61 90 72 36 53working electricity I n=184 n=194 n=216 n=158 n=180 n=253 n=99 n=192
% of SDPs with piped 91 74 84 58 61 82 44 46 70running water I n=179 n=341 n=137 n=214 n=159 n=180 n=253 n=99 n=192
R.1-3 % of SDPs withworking toilet for 88 77 77 93 85 56 88 79 74 90 61 94clients I n=176 n=341 n=13 n=230 n=214 n=159 n=170 n=180 n=345 n=251 n=99 n=191
R.1-4 % of SDPs with adequate light in exam 88 83 100 100 86 79 88 92 84 85 83 92room34 I n=183 n=341 n=13 n=283 n=215 n=159 n=164 n=180 n=339 n=236 n=99 n=192
% of SDPs with clean 97 68 100 99 65 67 65 95 71 73 89 90exam room35 n=181 n=341 n=13 n=285 n=215 n=159 n=161 n=180 n=337 n=236 n=99 n=192
% of SDPs with adequate water in 83 34 100 98 69 60 52 75 41 57 57 76exam room36 I n=181 n=341 n=13 n=235 n=213 n=159 n=165 n=180 n=342 n=235 n=98 n=192

R . 2 R E A D I N E S S T O P R O V I D E S E R V I C E S : A C C E S S I B I L I T Y
Zim
bab
we
Zan
zib
ar
Zam
bia
Tan
zan
ia
Sen
egal
Nig
eria
Mad
ag
asc
ar
Ken
ya
Gh
an
a
Côte
d’I
voir
e
Burk
ina F
aso
Bots
wan
a
SOU
RC
E
INDICATOR
R.2-1 % of SDPs open 61 5 27 64 22 81 43 80on time I n=214 n=191 n=143 n=148 n=68 n=269 n=233 n=98
R.2-2 % of SDPs with sign announcing family planning services inside or 14 29 58 68 43 43 40 10 45 59 33outside SDP37 I n=178 n=341 n=12 n=309 n=211 n=172 n=180 n=348 n=251 n=97 n=190
72 Clinic-Based Family Planning and Reproductive Health Services in Africa
R . 3 R E A D I N E S S T O P R O V I D E S E R V I C E S : M E T H O D S O F F E R E D
R.3-1 % of SDPs that 97 98 100 91 98 97 95 99 96 95 98 99offer COCs I n=183 n=341 n=13 n=313 n=214 n=159 n=168 n=180 n=348 n=250 n=100 n=191
% of SDPs that offer 93 57 92 90 94 96 90 68 30 50 96 92injectables I n=184 n=337 n=13 n=313 n=213 n=159 n=161 n=180 n=348 n=250 n=95 n=190
% of SDPs that offer 96 62 92 73 93 77 23 98 56 69 51 99POPs I n=183 n=341 n=13 n=313 n=213 n=159 n=165 n=180 n=348 n=249 n=73 n=191
% of SDPs that offer 1 2 7 14 5 1 3 0 0 4 NORPLANT® 38 I n=184 n=337 n=313 n=212 n=159 n=153 n=180 n=348 n=249 n=188
R.3-2 % of SDPs 99 53 92 89 98 94 94 97 74 97 70 98that offer condoms I n=183 n=341 n=13 n=313 n=214 n=159 n=160 n=180 n=348 n=251 n=79 n=190
% of SDPs that offer dual-method 67 50 71counseling I n=313 n=251 n=191
R.3-3 % of SDPs that 56 26 92 57 72 70 80 83 14 19 55 8offer IUDs I n=182 n=341 n=13 n=313 n=214 n=159 n=168 n=180 n=348 n=250 n=69 n=190
R.3-4 % of SDPs that 5 1 0 50 29 6 10 5 2 9 9offer tubal ligation I n=184 n=341 n=13 n=313 n=214 n=159 n=152 n=180 n=348 n=250 n=191
% of SDPs that offer 3 0 0 23 14 3 1 1 0 5 3vasectomy I n=184 n=341 n=13 n=313 n=213 n=159 n=153 n=180 n=348 n=251 n=191
R.3-5 % of SDPs thatoffer natural family 12 12 54 74 16 4 37 4 3 53 31 28planning I n=183 n=341 n=13 n=313 n=214 n=159 n=156 n=180 n=348 n=249 n=100 n=190
% of SDPs that offer 10 83 63 39LAM I n=341 n=313 n=251n=190

R.4 READINESS TO PROVIDE SERVICES: CONTRACEPTIVE SUPPLIES AND LOGISTICS 39
Zim
bab
we
Zan
zib
ar
Zam
bia
Tan
zan
ia
Sen
egal
Nig
eria
Mad
ag
asc
ar
Ken
ya
Gh
an
a
Côte
d’I
voir
e
Burk
ina F
aso
Bots
wan
a
SOU
RC
E
INDICATOR
R.4-1 % of SDPs that have experienced a stockout of condoms in the previous 22 16 7 14 6 16 6 5 12 0 296 months40 I n=171 n=175 n=279 n=194 n=145 n=137 n=173 n=249 n=235 n=53 n=180
% of SDPs that have experienced a stockout of COCs in the previous 10 14 18 35 6 30 0 196 months41 I n=168 n=285 n=195 n=149 n=323 n=236 n=97 n=185
% of SDPs that have experienced a stockout of POPs in the previous 13 20 17 18 32 3 13 34 0 226 months42 I n=167 n=200 n=229 n=187 n=23 n=175 n= 186 n=170 n=37 n=186
% of SDPs that have experienced a stockout of IUDs in the previous 12 10 36 21 3 16 5 226 months43 I n=82 n=177 n=135 n=126 n=42 n=45 n=38 n=15
% of SDPs that have experienced a stockout of injectables in the 19 50 5 28 1 29previous 6 months44 I n=281 n=135 n=92 n=123 n=88 n=172
% of SDPs that have experienced a stockout of NORPLANT® in the 0 0 5 22 0 0 0 100 14previous 6 months45 I n=2 n=6 n=22 n=23 n=4 n=1 n=5 n=1 n=7
% of SDPs that have experienced at least one stockout of an offered method in 37 24 33 49 6 65 8 13 49 2 53the last 6 months I n=174 n=258 n=293 n=199 n=147 n=152 n=179 n=336 n=247 n=98 n=188
R.4-2 % of SDPs with a commodity 77 29 100 98 56 85 85 52 38 71 82 93inventory I n=169 n=335 n=13 n=212 n=176 n=157 n=160 n=172 n=343 n=248 n=100 n=191
R.4-3 % of SDPs with adequate storage facilities for 77 76 8 100 86 84 84 79 83 89 81 99commodities46 I n=162 n=304 n=13 n=261 n=190 n=155 n=156 n=173 n=326 n=235 n=100 n=190
BA
SIC
ST
UD
Y F
IND
ING
S
& T
HE
IR U
TIL
IZAT
ION
Indicators of Readiness and Quality: Basic Findings 73

R . 5 R E A D I N E S S T O P R O V I D E S E R V I C E S : E Q U I P M E N T 4 7
Zim
bab
we
Zan
zib
ar
Zam
bia
Tan
zan
ia
Sen
egal
Nig
eria
Mad
ag
asc
ar
Ken
ya
Gh
an
a
Côte
d’I
voir
e
Burk
ina F
aso
Bots
wan
a
SOU
RC
E
INDICATOR
R.5-1 % of SDPs with enough adult 95 89 85 89 84 74 91 75 96 93 98weighing scales I n=184 n=341 n=13 n=214 n=159 n=166 n=178 n=348 n=254 n=100 n=192
% of SDPs with enough blood 90 83 69 60 70 56 75 55 87 85pressure machines I n=183 n=341 n=13 n=214 n=159 n=159 n=178 n=348 n=100 n=187
% of SDPs with 94 87 77 65 69 52 80 62 85 90enough stethoscopes I n=184 n=339 n=13 n=214 n=159 n=160 n=178 n=348 n=100 n=185
% of SDPs with access to sterilizing 75 57 77 78 70 44 86 66 97equipment I n=184 n=341 n=13 n=211 n=159 n=152 n=178 n=348 n=100
R.5-2 % of SDPs with 95 66 85 81 70 72 92 53 86enough exam couches I n=183 n=341 n=13 n=214 n=159 n=167 n=178 n=348 n=100
% of SDPs with enough angle poise 48 64 85 35 54 61 72 18 54lamps or flashlights I n=184 n=341 n=13 n=210 n=159 n=160 n=178 n=348 n=100
% of SDPs with 80 80 85 47 40 41 52 92 38 60 86 81enough specula48 I n=179 n=341 n=13 n=254 n=211 n=159 n=157 n=178 n=348 n=248 n=100 n=186
% of SDPs with 96 22 46 71 74 44 49 61 44 89 62 96enough gloves I n=184 n=341 n=13 n=200 n=208 n=159 n=154 n=178 n=348 n=243 n=100 n=186
% of SDPs withenough sterilizing 96 43 39 52 63 38 3 39lotion49 I n=175 n=341 n=13 n=200 n=159 n=147 n=348 n=100
R.5-3 % of SDPs with 64 91 73 79 57 70 84 41enough tenacula50 I n=101 n=165 n=151 n=123 n=49 n=47 n=69 n=16
% of SDPs with enough uterine 73 91 83 92 79 79 84 97 66 72 83 49sounds51 I n=101 n=87 n=12 n=170 n=152 n=111 n=133 n=148 n=49 n=46 n=69 n=17
% of SDPs with 94 23 50 72 76 52 55 62 50 82 71 93enough gloves52 I n=101 n=87 n=12 n=124 n=147 n=111 n=128 n=148 n=49 n=45 n=38 n=16
% of SDPs with 86 92 92 60 38 48 57 94 55 62 84 64enough specula53 I n=98 n=87 n=12 n=172 n=152 n=111 n=131 n=148 n=49 n=45 n=38 n=15
R.5-4 % of SDPs with enough needles and 90 22 82 74 27 33 58 55syringes I n=184 n=341 n=206 n=159 n=146 n=178 n=347 n=100
R.5-5 % of SDPs with enough NORPLANT® 50 100 95 75 100 100kits54 I n=2 n=6 n=21 n=8 n=1 n=4
74 Clinic-Based Family Planning and Reproductive Health Services in Africa
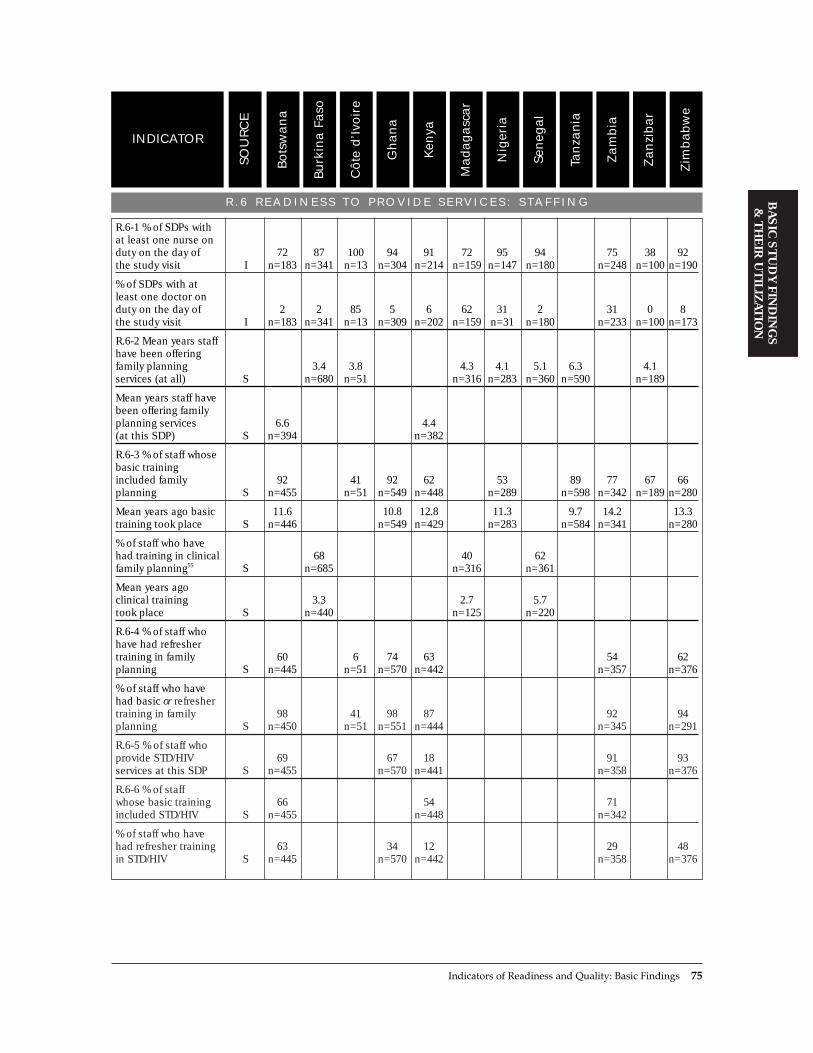
R . 6 R E A D I N E S S T O P R O V I D E S E R V I C E S : S TA F F I N G
Zim
bab
we
Zan
zib
ar
Zam
bia
Tan
zan
ia
Sen
egal
Nig
eria
Mad
ag
asc
ar
Ken
ya
Gh
an
a
Côte
d’I
voir
e
Burk
ina F
aso
Bots
wan
a
SOU
RC
E
INDICATOR
R.6-1 % of SDPs with at least one nurse on duty on the day of 72 87 100 94 91 72 95 94 75 38 92the study visit I n=183 n=341 n=13 n=304 n=214 n=159 n=147 n=180 n=248 n=100 n=190
% of SDPs with at least one doctor on duty on the day of 2 2 85 5 6 62 31 2 31 0 8the study visit I n=183 n=341 n=13 n=309 n=202 n=159 n=31 n=180 n=233 n=100 n=173
R.6-2 Mean years staff have been offering family planning 3.4 3.8 4.3 4.1 5.1 6.3 4.1services (at all) S n=680 n=51 n=316 n=283 n=360 n=590 n=189
Mean years staff have been offering family planning services 6.6 4.4(at this SDP) S n=394 n=382
R.6-3 % of staff whose basic training included family 92 41 92 62 53 89 77 67 66planning S n=455 n=51 n=549 n=448 n=289 n=598 n=342 n=189 n=280
Mean years ago basic 11.6 10.8 12.8 11.3 9.7 14.2 13.3training took place S n=446 n=549 n=429 n=283 n=584 n=341 n=280
% of staff who have had training in clinical 68 40 62family planning55 S n=685 n=316 n=361
Mean years ago clinical training 3.3 2.7 5.7took place S n=440 n=125 n=220
R.6-4 % of staff who have had refresher training in family 60 6 74 63 54 62planning S n=445 n=51 n=570 n=442 n=357 n=376
% of staff who have had basic or refresher training in family 98 41 98 87 92 94planning S n=450 n=51 n=551 n=444 n=345 n=291
R.6-5 % of staff who provide STD/HIV 69 67 18 91 93services at this SDP S n=455 n=570 n=441 n=358 n=376
R.6-6 % of staff whose basic training 66 54 71included STD/HIV S n=455 n=448 n=342
% of staff who have had refresher training 63 34 12 29 48in STD/HIV S n=445 n=570 n=442 n=358 n=376
BA
SIC
ST
UD
Y F
IND
ING
S
& T
HE
IR U
TIL
IZAT
ION
Indicators of Readiness and Quality: Basic Findings 75

R . 6 R E A D I N E S S T O P R O V I D E S E R V I C E S : S TA F F I N G ( c o n t d . )
Zim
bab
we
Zan
zib
ar
Zam
bia
Tan
zan
ia
Sen
egal
Nig
eria
Mad
ag
asc
ar
Ken
ya
Gh
an
a
Côte
d’I
voir
e
Burk
ina F
aso
Bots
wan
a
SOU
RC
E
INDICATOR
Mean years ago refresher STD/HIV 2.7 3.0 1.5 2.2training took place S n=166 n=51 n=101 n=179
% of staff who have had basic or refresher 84 59 77training in STD/HIV S n=448 n=443 n=344
R.6-7 % of staff who have had training in family planning 13 21 22 54 11 27 1 37 27 80 45counseling or IEC56 S n=153 n=685 n=51 n=570 n=439 n=316 n=289 n=361 n=357 n=191 n=37
Mean years ago training in family planning counseling 1.9 3.3 5.3 2.4 3.5 2.4 3.7or IEC took place S n=136 n=268 n=48 n=85 n=133 n=94 n=169
R.6-8 % of staff who have had training in IUD insertion and 25 42 29 53 7 59 17 82 18removal S n=154 n=685 n=570 n=440 n=316 n=361 n=357 n=191 n=376
Mean years ago IUD 3.3 7.0 5.0 2.4 5.7training took place S n=149 n=227 n=22 n=60 n=69
R.6-9 % of staff who have had training in 1 5 14 6 3 2 2 10 26tubal ligation57 S n=153 n=685 n=570 n=440 n=316 n=289 n=361 n=357 n=376
Mean years ago tubal ligation training took 2.8 5.7 2.8 1.7 4.8place S n=65 n=25 n=10 n=33 n=95
76 Clinic-Based Family Planning and Reproductive Health Services in Africa
R . 7 R E A D I N E S S T O P R O V I D E S E R V I C E S : I E C M AT E R I A L S A N D A C T I V I T I E S
R.7-1 % of SDPs with a poster on family planning on the 59 66 54 85 77 70 69 82 36 48 79 83walls58 I n=183 n=341 n=13 n=313 n=215 n=159 n=170 n=180 n=348 n=244 n=100 n=188
% of SDPs with a brochure on family 60 15 85 44 37 58 84 17 3 8 30planning59 I n=179 n=341 n=13 n=313 n=213 n=159 n=98 n=180 n=348 n=245 n=191
% of SDPs with a flip chart on family 35 27 66 35 46 65 19 5 23 21planning60 I n=181 n=341 n=313 n=213 n=159 n=57 n=180 n=348 n=252 n=192
R.7-2 % of SDPs with a poster on HIV on 66 49 64 46 64the walls61 I n=183 n=313 n=216 n=250 n=185
% of SDPs with a poster on STDs on 43 19 29 37 37the walls62 I n=183 n=313 n=215 n=249 n=180
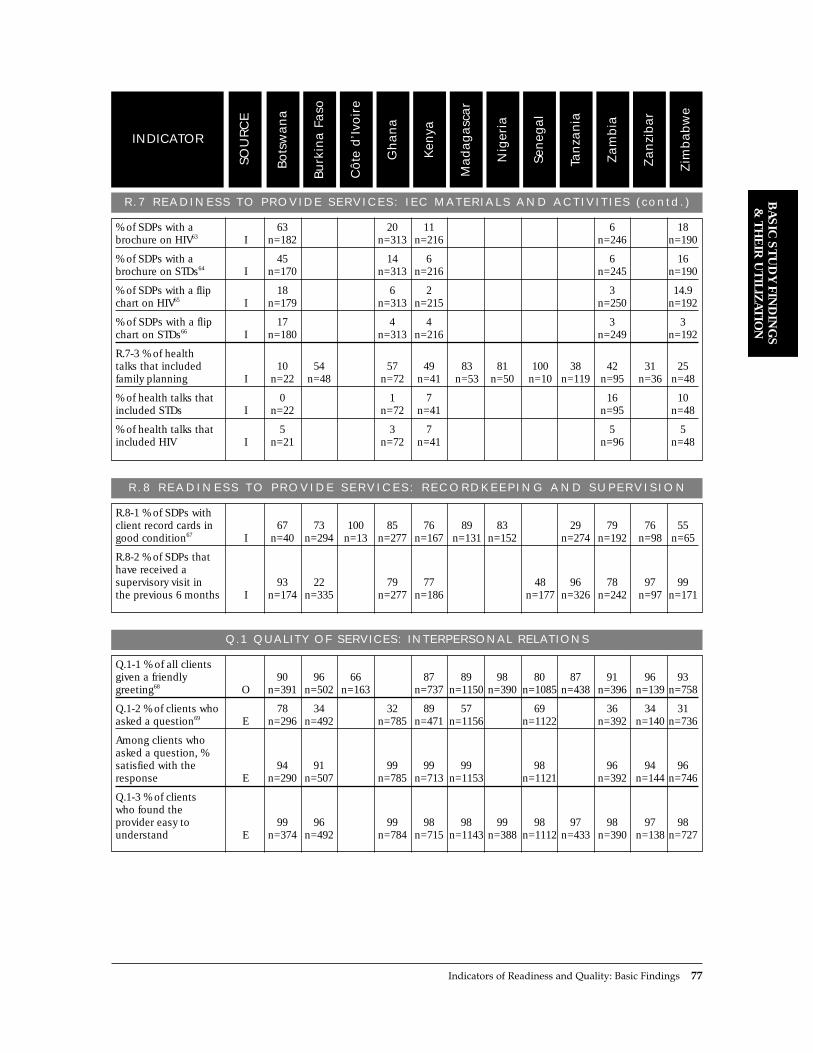
R .7 READ INESS TO PROV IDE SERV ICES : I EC MATER IALS AND ACT IV I T I ES ( con td . )
Zim
bab
we
Zan
zib
ar
Zam
bia
Tan
zan
ia
Sen
egal
Nig
eria
Mad
ag
asc
ar
Ken
ya
Gh
an
a
Côte
d’I
voir
e
Burk
ina F
aso
Bots
wan
a
SOU
RC
E
INDICATOR
% of SDPs with a 63 20 11 6 18brochure on HIV63 I n=182 n=313 n=216 n=246 n=190
% of SDPs with a 45 14 6 6 16brochure on STDs64 I n=170 n=313 n=216 n=245 n=190
% of SDPs with a flip 18 6 2 3 14.9chart on HIV65 I n=179 n=313 n=215 n=250 n=192
% of SDPs with a flip 17 4 4 3 3chart on STDs66 I n=180 n=313 n=216 n=249 n=192
R.7-3 % of health talks that included 10 54 57 49 83 81 100 38 42 31 25family planning I n=22 n=48 n=72 n=41 n=53 n=50 n=10 n=119 n=95 n=36 n=48
% of health talks that 0 1 7 16 10included STDs I n=22 n=72 n=41 n=95 n=48
% of health talks that 5 3 7 5 5included HIV I n=21 n=72 n=41 n=96 n=48
BA
SIC
ST
UD
Y F
IND
ING
S
& T
HE
IR U
TIL
IZAT
ION
Indicators of Readiness and Quality: Basic Findings 77
R . 8 R E A D I N E S S T O P R O V I D E S E R V I C E S : R E C O R D K E E P I N G A N D S U P E R V I S I O N
R.8-1 % of SDPs with client record cards in 67 73 100 85 76 89 83 29 79 76 55good condition67 I n=40 n=294 n=13 n=277 n=167 n=131 n=152 n=274 n=192 n=98 n=65
R.8-2 % of SDPs that have received a supervisory visit in 93 22 79 77 48 96 78 97 99the previous 6 months I n=174 n=335 n=277 n=186 n=177 n=326 n=242 n=97 n=171
Q.1 QUALITY OF SERVICES: INTERPERSONAL RELATIONS
Q.1-1 % of all clients given a friendly 90 96 66 87 89 98 80 87 91 96 93greeting68 O n=391 n=502 n=163 n=737 n=1150 n=390 n=1085 n=438 n=396 n=139 n=758
Q.1-2 % of clients who 78 34 32 89 57 69 36 34 31asked a question69 E n=296 n=492 n=785 n=471 n=1156 n=1122 n=392 n=140 n=736
Among clients who asked a question, % satisfied with the 94 91 99 99 99 98 96 94 96response E n=290 n=507 n=785 n=713 n=1153 n=1121 n=392 n=144 n=746
Q.1-3 % of clients who found the provider easy to 99 96 99 98 98 99 98 97 98 97 98understand E n=374 n=492 n=784 n=715 n=1143 n=388 n=1112 n=433 n=390 n=138 n=727
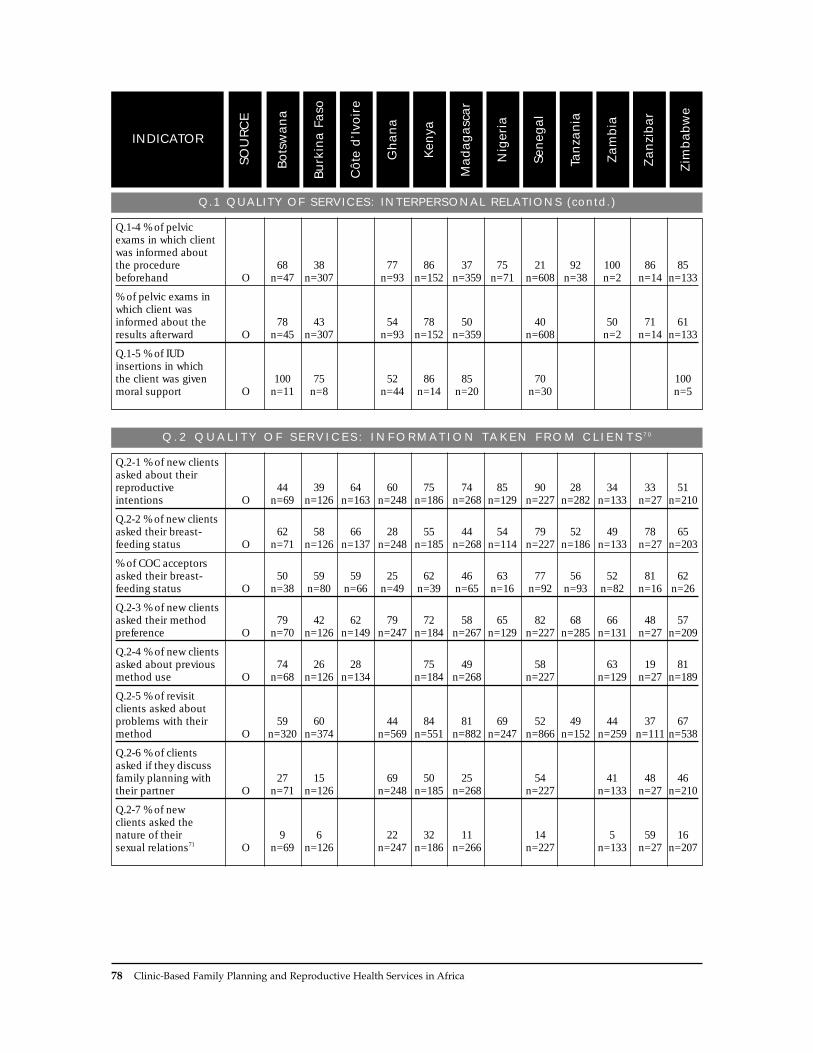
Q.1 QUALITY OF SERVICES: INTERPERSONAL RELATIONS (contd.)
Zim
bab
we
Zan
zib
ar
Zam
bia
Tan
zan
ia
Sen
egal
Nig
eria
Mad
ag
asc
ar
Ken
ya
Gh
an
a
Côte
d’I
voir
e
Burk
ina F
aso
Bots
wan
a
SOU
RC
E
INDICATOR
Q.1-4 % of pelvic exams in which client was informed about the procedure 68 38 77 86 37 75 21 92 100 86 85beforehand O n=47 n=307 n=93 n=152 n=359 n=71 n=608 n=38 n=2 n=14 n=133
% of pelvic exams in which client was informed about the 78 43 54 78 50 40 50 71 61results afterward O n=45 n=307 n=93 n=152 n=359 n=608 n=2 n=14 n=133
Q.1-5 % of IUD insertions in which the client was given 100 75 52 86 85 70 100moral support O n=11 n=8 n=44 n=14 n=20 n=30 n=5
78 Clinic-Based Family Planning and Reproductive Health Services in Africa
Q. 2 Q U A L I T Y O F S E R V I C E S : I N F O R M AT I O N TA K E N F R O M C L I E N T S 7 0
Q.2-1 % of new clients asked about their reproductive 44 39 64 60 75 74 85 90 28 34 33 51intentions O n=69 n=126 n=163 n=248 n=186 n=268 n=129 n=227 n=282 n=133 n=27 n=210
Q.2-2 % of new clients asked their breast- 62 58 66 28 55 44 54 79 52 49 78 65feeding status O n=71 n=126 n=137 n=248 n=185 n=268 n=114 n=227 n=186 n=133 n=27 n=203
% of COC acceptors asked their breast- 50 59 59 25 62 46 63 77 56 52 81 62feeding status O n=38 n=80 n=66 n=49 n=39 n=65 n=16 n=92 n=93 n=82 n=16 n=26
Q.2-3 % of new clients asked their method 79 42 62 79 72 58 65 82 68 66 48 57preference O n=70 n=126 n=149 n=247 n=184 n=267 n=129 n=227 n=285 n=131 n=27 n=209
Q.2-4 % of new clients asked about previous 74 26 28 75 49 58 63 19 81method use O n=68 n=126 n=134 n=184 n=268 n=227 n=129 n=27 n=189
Q.2-5 % of revisit clients asked about problems with their 59 60 44 84 81 69 52 49 44 37 67method O n=320 n=374 n=569 n=551 n=882 n=247 n=866 n=152 n=259 n=111 n=538
Q.2-6 % of clients asked if they discuss family planning with 27 15 69 50 25 54 41 48 46their partner O n=71 n=126 n=248 n=185 n=268 n=227 n=133 n=27 n=210
Q.2-7 % of new clients asked the nature of their 9 6 22 32 11 14 5 59 16sexual relations71 O n=69 n=126 n=247 n=186 n=266 n=227 n=133 n=27 n=207

Q. 2 Q U A L I T Y O F S E R V I C E S : I N F O R M AT I O N TA K E N F R O M C L I E N T S 7 0 ( c o n t d . )
Zim
bab
we
Zan
zib
ar
Zam
bia
Tan
zan
ia
Sen
egal
Nig
eria
Mad
ag
asc
ar
Ken
ya
Gh
an
a
Côte
d’I
voir
e
Burk
ina F
aso
Bots
wan
a
SOU
RC
E
INDICATOR
Q.2-8 % of revisit clients asked the nature of their sexual 3 3 13 5 1 8 9relations72 O n=312 n=569 n=551 n=882 n=257 n=111 n=543
Q.2-8 % of new clients asked about unusual 46 45 23 18 21 36 8 26 23 52 24bleeding O n=70 n=126 n=248 n=185 n=268 n=128 n=227 n=285 n=134 n=27 n=210
% of revisit clients asked about unusual 10 18 23 6 15 9 15 36 13bleeding O n=322 n=376 n=571 n=550 n=882 n=866 n=262 n=111 n=548
% of new clients asked about unusual 42 25 34 11 24 32 13 13 22 7 19discharge O n=69 n=126 n=248 n=185 n=268 n=128 n=227 n=286 n=134 n=27 n=210
% of revisit clients asked about unusual 8 11 19 5 7 13 6 3 5discharge O n=321 n=376 n=571 n=550 n=882 n=866 n=262 n=111 n=548
% of IUD clients asked about unusual 46 25 36 36 55 17 60bleeding O n=11 n=8 n=44 n=14 n=20 n=30 n=5
% of IUD clients asked about unusual 46 50 36 29 30 3 40discharge O n=11 n=8 n=44 n=14 n=20 n=30 n=5
BA
SIC
ST
UD
Y F
IND
ING
S
& T
HE
IR U
TIL
IZAT
ION
Indicators of Readiness and Quality: Basic Findings 79
Q. 3 Q U A L I T Y O F S E R V I C E S : C H O I C E O F M E T H O D S
Q.3-1 % of new clients told about at least 61 64 49 87 85 74 61 61 77 66 75 48two methods O n=71 n=126 n=163 n=248 n=187 n=268 n=129 n=227 n=286 n=134 n=28 n=210
Q.3-2 % of new clients to whom COCs were 77 77 76 81 83 74 72 75 86 86 89 35mentioned O n=68 n=126 n=163 n=248 n=183 n=268 n=116 n=227 n=286 n=134 n=27 n=21
Q.3-3 % of new clients to whom POPs were 36 32 38 63 30 9 29 30 40 26 66mentioned O n=69 n=126 n=248 n=183 n=268 n=115 n=227 n=286 n=134 n=27 n=210
Q.3-4 % of new clients to whom injectables 35 55 53 86 84 76 60 42 62 58 78 51were mentioned O n=68 n=126 n=163 n=248 n=183 n=268 n=115 n=227 n=286 n=134 n=27 n=210
Q.3-5 % of new clients to whom condoms 49 34 29 64 69 56 60 25 70 58 59 21were mentioned O n=69 n=126 n=163 n=248 n=182 n=268 n=116 n=227 n=286 n=134 n=27 n=210
Q.3-6 % of new clients to whom IUDs were 36 55 40 73 72 62 78 54 64 44 67 22mentioned O n=69 n=126 n=163 n=248 n=182 n=268 n=116 n=227 n=286 n=134 n=27 n=210

Q. 3 Q U A L I T Y O F S E R V I C E S : C H O I C E O F M E T H O D S ( c o n t d . )
Zim
bab
we
Zan
zib
ar
Zam
bia
Tan
zan
ia
Sen
egal
Nig
eria
Mad
ag
asc
ar
Ken
ya
Gh
an
a
Côte
d’I
voir
e
Burk
ina F
aso
Bots
wan
a
SOU
RC
E
INDICATOR
Q.3-7 % of new clients to whom tubal ligation was 3 4 4 29 39 36 27 2 33 16 10mentioned73 O n=69 n=126 n=163 n=248 n=183 n=268 n=115 n=227 n=286 n=134 n=210
Q.3-8 % of new clients to whom one method 14 11 21 16 15 20 28 15 14was overemphasized O n=70 n=126 n=140 n=185 n=268 n=227 n=134 n=27 n=210
80 Clinic-Based Family Planning and Reproductive Health Services in Africa
Q. 4 Q U A L I T Y O F S E R V I C E S : I N F O R M AT I O N G I V E N T O C L I E N T S
Q.4-1 % of newacceptors told how 88 80 62 86 86 90 57 86 14 87 79 81to use their method O n=64 n=111 n=151 n=225 n=172 n=213 n=86 n=210 n=247 n=129 n=28 n=174
Q.4-2 % of new acceptors told the side effects of their 68 24 33 56 68 50 54 49 33 67 64 51method O n=63 n=111 n=151 n=225 n=171 n=213 n=82 n=210 n=247 n=129 n=28 n=174
% of new acceptors told how to use their method and its side 68 22 31 53 64 49 42 48 5 59 61 49effects O n=63 n=111 n=151 n=225 n=171 n=213 n=84 n=210 n=247 n=129 n=28 n=174
Q.4-3 % of new acceptors told about their method’s ability to protect against 19 3 9 5STD/HIV O n=63 n=225 n=129 n=174
Q.4-4 % of new clients specifically told that condoms protect 33 10 25 14 17 2 36 31 7against STD/HIV O n=63 n=126 n=240 n=185 n=268 n=227 n=133 n=26 n=210
Q.4-5 % of new clients with whom a flip 0 11 53 31 28 3 7 15 54 0 3chart was used74 O n=19 n=63 n=191 n=85 n=183 n=33 n=89 n=20 n=52 n=7 n=58
% of new clients with whom a brochure 8 0 7 13 4 25 0 12 19 6 0 5was used75 O n=39 n=22 n=147 n=124 n=74 n=129 n=56 n=61 n=16 n=16 n=26 n=84
% of new clients with whom a poster was 11 3 6 11 4 4 4 7 0 5used76 O n=47 n=107 n=81 n=206 n=162 n=224 n=195 n=86 n=22 n=176

Q. 5 Q U A L I T Y O F S E R V I C E S : T E C H N I C A L C O M P E T E N C E
Zim
bab
we
Zan
zib
ar
Zam
bia
Tan
zan
ia
Sen
egal
Nig
eria
Mad
ag
asc
ar
Ken
ya
Gh
an
a
Côte
d’I
voir
e
Burk
ina F
aso
Bots
wan
a
SOU
RC
E
INDICATOR
Q.5-1 % of new clients 92 84 90 66 84 72 73 92 91 79 81 81who were weighed77 O n=65 n=122 n=123 n=212 n=160 n=235 n=113 n=212 n=234 n=130 n=26 n=202
% of new clients 93 97 86 95 88 94 94 93 90 85 73whose LMP was taken O n=70 n=126 n=248 n=184 n=268 n=128 n=227 n=284 n=134 n=27 n=210
% of new clients whose blood 88 76 81 69 85 76 73 93 89 86 78 87pressure was taken78 O n=66 n=126 n=133 n=207 n=185 n=188 n=101 n=174 n=187 n=131 n=27 n=198
% of new clients whose medical 70 77 86 60 77 71 80 84 86 69 82 51history was taken O n=70 n=126 n=138 n=248 n=184 n=268 n=128 n=227 n=285 n=134 n=27 n=210
% of new clients who were given a general 62 84 31 64 45 56 65 62 46 41physical exam O n=71 n=126 n=248 n=184 n=268 n=128 n=227 n=284 n=134 n=210
Q.5-2 % of pelvic exams before which the provider washed 57 24 73 77 29 82 12 71 67 67hands79 O n=44 n=223 n=70 n=116 n=263 n=50 n=608 n=24 n=9 n=111
% of pelvic exams after which the provider washed 71 81 87 75hands80 O n=41 n=70 n=152 n=112
% of pelvic exams during which clean/sterile speculum 83 58 65 94 52 94 83 97 100 86 87was used81 O n=47 n=279 n=82 n=137 n=303 n=62 n=594 n=29 n=2 n=14 n=119
% of pelvic exams during which clean/sterile gloves 72 90 99 81 75 79 86 100 73 92were used82 O n=32 n=72 n=132 n=330 n=55 n=283 n=29 n=2 n=11 n=116
Q.5-3 % of IUD insertions during which the uterus 64 88 67 92 100 97 80was sounded83 O n=11 n=8 n=30 n=12 n=20 n=30 n=5
% of IUD insertions during which the provider used sterile 73 75 59 92 85 93 80instruments O n=11 n=8 n=44 n=13 n=20 n=30 n=5
Q.5-4 % of injections during which a sterile 100 100 98 95 100 100 100 98 100needle was used O n=69 n=19 n=377 n=340 n=435 n=55 n=3 n=48 n=150
% of injections before which the injection 94 100 39 98 100 100 100 77 75site was disinfected O n=70 n=19 n=377 n=341 n=435 n=55 n=3 n=48 n=150
BA
SIC
ST
UD
Y F
IND
ING
S
& T
HE
IR U
TIL
IZAT
ION
Indicators of Readiness and Quality: Basic Findings 81

Q. 5 Q U A L I T Y O F S E R V I C E S : T E C H N I C A L C O M P E T E N C E (contd.)
Zim
bab
we
Zan
zib
ar
Zam
bia
Tan
zan
ia
Sen
egal
Nig
eria
Mad
ag
asc
ar
Ken
ya
Gh
an
a
Côte
d’I
voir
e
Burk
ina F
aso
Bots
wan
a
SOU
RC
E
INDICATOR
% of injections before which the vial was 100 63 94 92 89 98vigorously shaken O n=70 n=19 n=329 n=435 n=55 n=48
% of injections after which the injection 4 47 74 13 27 16 0 19 19site was not massaged O n=70 n=19 n=377 n=341 n=435 n=55 n=3 n=48 n=150
82 Clinic-Based Family Planning and Reproductive Health Services in Africa
Q. 6 Q U A L I T Y O F S E R V I C E S : M E C H A N I S M S T O E N C O U R A G E C O N T I N U I T Y
Q.6-1 % of new acceptors told that they can switch 25 19 16 11 37 32 27 31 54 12methods O n=63 n=111 n=127 n=225 n=171 n=213 n=210 n=129 n=28 n=174
Q.6-2 % of clients given a date of 93 78 96 99 95 91 100 90 96 97 78return84 O n=457 n=117 n=777 n=711 n=1001 n=390 n=1014 n=439 n=129 n=136 n=174
Q.7 QUALITY OF SERVICES : APPROPRIATENESS AND ACCEPTABIL ITY OF SERVICES
Q.7-1 % of clients who received all the information and 87 91 95 94 99 88 96 92 93 94services they desired E n=381 n=492 n=786 n=716 n=1156 n=388 n=1122 n=430 n=392 n=737
Q.7-2 Client satisfaction with time of consultation:
% too long 22 8 8 9 39 9 16 18 12 % just right 60 86 87 82 43 84 74 77 81% too short 18 6 5 9 19 7 10 4 7
E n=384 n=491 n=782 n=714 n=1151 n=1120 n=392 n=141 n=736
Q.7-3 % of clients who found the wait 67 87 67 88 72 84 92 68 83 73 72 71reasonable85 E n=378 n=489 n=353 n=768 n=714 n=1151 n=387 n=1112 n=435 n=386 n=140 n=739
Q.7-4 % of clients who found the cost of 97 98 94 84 95 92 86 100 78services acceptable86 E n=503 n=331 n=769 n=714 n=1144 n=1107 n=390 n=142 n=733

REFERENCES
Askew, I., B. Mensch, and A. Adewuji. 1994. ÒIndicatorsfor measuring the quality of family planning ser-vices in Nigeria.Ó Studies in Family Planning,25,5:268Ð283.
Hatcher, R., J. Trussell, F. Stewart, G. Steward, D. Kowal, F. Guest, W. Cates, Jr., and M. Policar.1994. Contraceptive Technology, 16th Edition.Irvington Publishers, New York.
Jolly, L. and J. Gribble. 1993. ÒThe proximate determi-nants of fertility.Ó In Foote, K., K. Hill, and L.Martin, Eds., Demographic Change in Sub-SaharanAfrica. National Academy Press, Washington, D.C.
Ndhlovu, L. 1995. Quality of Care in Family PlanningServices in Kenya: ClientsÕ and ProvidersÕ Perspectives.Ministry of Health, Kenya, and Population Council,New York.
Pariani, S., D. Heer, and M. Van Arsdol. 1987.ÒContinued contraceptive use in five family plan-ning clinics in Surabaya, Indonesia.Ó Studies inFamily Planning, 22,6:384Ð390.
Ross, J. and E. Frankenberg. 1993. Findings from TwoDecades of Family Planning Research. PopulationCouncil, New York.
Sinding, S., J. Ross, and A. Rosenfield. 1994. ÒSeekingcommon ground: Unmet need and demographicgoals.Ó International Family Planning Perspectives,20,1:23Ð27.
United States Agency for International Development,Technical Guidance Working Group. 1994.Recommendations for Updating Selected Practices inContraceptive Use: Results of a Technical Meeting,Volume I and Volume II. INTRAH (University ofNorth Carolina at Chapel Hill), PathfinderInternational, USAID, and Family HealthInternational, Washington, D.C.
Westoff, C. 1991. Reproductive Preferences. ComparativeStudies 3, Demographic and Health Surveys, MacroSystems, Inc., Columbia, Maryland.
NOTES
1 Because Situation Analysis data should be interpret-ed in light of the maturity of the family planningprogram in each country, the reader is encouraged torefer to the brief descriptions of each country in theprevious chapter.
2 The availability of water and electricity was mea-sured on the day of the study visit. If an SDP hadpipes but the water was not running that day, thefacility was counted as not having water. In thisway, the national estimates of water and electricityavailability take water shortages and power outagesinto account.
3 In Botswana and Ghana, urban SDPs have a slightlyhigher availability of piped running water, but thisresult is not statistically significant.
4 The Tanzania study was done in 1992 and theSenegal study in 1994, when the safety of themethod was being questioned, demand for injecta-bles may not have been as high, and staff trainingprograms for the method may not have been fully inplace.
5 IUD-related results for Zimbabwe are stronglyaffected by weighting. All the clinics of theZimbabwe National Family Planning Council werepurposively included in the study, so they received arelatively small weight, decreasing their influence inthe overall sample. However, their IUD services aregenerally of higher quality than those of other SDPsin the country, so when the influence of these clinicsis weighted relatively lightly, the overall result isdecreased substantially. Nevertheless, the weightedresults paint a more representative picture of IUDservices in the country.
6 All stockout rates are calculated only among thoseSDPs that offer each method.
7 This discussion emphasizes the appropriateness ofmethods based on meeting individual clientsÕ andcouplesÕ reproductive intentions, rather than meet-ing demographic targets of contraceptive prevalenceor fertility rates. Although some countries in sub-Saharan Africa do have stated demographic goals intheir population policies, Sinding et al. (1994) foundthat meeting individual reproductive intentions willresult in meeting or exceeding demographic targets.In this way, meeting individual reproductive inten-tions is actually consistent with meeting demo-graphic targets.
8 Protection from adverse temperatures does notrequire that a storage space be air-conditioned.
9 See Askew et al. (1994) for more discussion of clus-tering of equipment.
10 NORPLANT¨ kits are not included in these averagesbecause the number of SDPs offering NORPLANT¨
is so small. 11 The definition of Òon dutyÓ is not entirely clear in
the data. It is taken to mean a physician physicallypresent at the time of data collection, but it mayrefer to physicians on duty for an entire health facili-ty, rather than just the maternal and child health(MCH)/family planning unit. Therefore, the resultsfrom C�te dÕIvoire, Madagascar, Nigeria, andZambia may be artificially high.
12 Unfortunately, data on the date of the refreshertraining are not available, so it is not possible torelate the refresher training to the start of the familyplanning program.
13 These are the 5 most recent studies included in thischapter.
14 In some countries, only a certain level of providermay attend IUD training. However, since theserestrictions apply differently across all countries andthe data vary, it was not possible to restrict the
BA
SIC
ST
UD
Y F
IND
ING
S
& T
HE
IR U
TIL
IZAT
ION
Indicators of Readiness and Quality: Basic Findings 83
analysis to provider types who may attend IUDtraining.
15 Annex 3.1 lists 33 providers in Zambia trained intubal ligation, rather than 22. The group of 22 is usedhere because of missing data on the crosstabulation.
16 This is one of the few areas in which fieldresearchers are asked to make a qualitative judg-ment.
17 To truly evaluate the supervision in these countries,one would need to compare this visiting rate withthe planned rate, and report information on whatactions the supervisors took during the visits.
18 This indicator excludes the few clients who werebreastfeeding in view of the provider at the time ofthe consultation, because in such cases the providerwould not have to ask her status.
19 Another question in many of these studies asksdirectly whether the provider inquired about Òcur-rent or previous STD symptoms.Ó Because this ques-tion covers much the same ground as the indicatorsincluded under this element, and because the resultsare quite similar, this indicator has not been includedhere.
20 Most comparisons are significant at p < .05.21 The mean number of questions asked by providers
trained in counseling vs. those not trained in coun-seling was 3.2 vs. 2.4 in Burkina Faso, 5.0 vs. 3.6 inKenya, and 3.6 vs. 2.6 in Zambia.
22 Note that this includes methods mentioned onlyduring the observed consultation, not during healthtalks.
23 Note that this discussion involves two units ofanalysis: the SDP and the client. For this reason, thetwo numbers are not strictly comparable, but in factthis finding holds even if the unit of analysis isswitched to the client throughout. That is, the per-centage of clients who hear about IUDs in consulta-tion follows roughly the percentage of clients whoattend SDPs that offer IUDs.
24 See Chapter 5, where significant results are found forKenya using a different model for this issue.
25 The definition of Òphysical examÓ varies from coun-try to country.
26 The results for weight and blood pressure are report-ed only for clients attending SDPs that have adultscales and blood pressure machines available,respectively (see R.5-1).
27 In general, results for the higher-scoring countries(Nigeria, Kenya, Botswana, Burkina Faso, Tanzania,and Senegal) are significantly higher than those forthe lower-scoring countries (Ghana, Zimbabwe,Madagascar, and Zambia) (p < .01). Within these twogroups, means are not statistically different fromeach other.
28 Handwashing is calculated only for those SDPs thathave adequate water in the exam room. Results forgloves are restricted to those SDPs that have glovesavailable, and results for specula are similarlyrestricted to those SDPs that have specula available.(See also R.5-1.)
29 Sounding the uterus is counted only for those IUDinsertions at SDPs where uterine sounds are avail-able.
30 In Botswana and Zimbabwe, this finding isexplained by some staff having had on-the-job train-ing in IUD insertion, which they did not report asformal IUD training in the staff interview.
31 Since the individual country sample sizes are sosmall, this relationship can be explored only in theaggregate. All results are significantly different at p< .01.
32 This result is statistically significant (p < .05) for allcountries except Zimbabwe, Zanzibar, and Senegal.
33 ÒAdequateÓ is defined as protected from rain andsun, and with enough seats for clients. There are nodata available for Botswana and Kenya on seatingavailability, and none for Zimbabwe on protectionfrom rain and sun.
34 ÒAdequateÓ is defined as functioning electric light orsufficient natural light.
35 ÒCleanÓ is defined as floors swept and mopped atthe start of the day, and no dust on tables or win-dowsills.
36 ÒAdequateÓ is defined as a sufficient quantity ofclean water for washing hands and equipment.
37 In C�te dÕIvoire, this also includes signs in otherunits of the SDP.
38 All items related to NORPLANT¨ in the inventoryare not weighted because so few SDPs offer thismethod.
39 For Burkina Faso, Madagascar, and Senegal, a num-ber of stockout indicators are missing here althoughthey were collected in the respective inventories. Thereason is that in these studies, several brands werelisted under each contraceptive, and each brand wasmarked as stocked out or not. This makes the overallstockout information very difficult to determine. If,for example, three brands of COCs are offered andone had a stockout, does that count as a stockout ofthe method if the others were available? Also, if allthree were stocked out, one cannot know whetherthey were stocked out simultaneously or sequential-ly. Because these data are not comparable with thosefor the other countries, they are not included here.
40 Among SDPs that offer condoms.41 Among SDPs that offer COCs.42 Among SDPs that offer POPs.43 Among SDPs that offer IUDs.44 Among SDPs that offer injectables.45 Among SDPs that offer NORPLANT¨. All items
related to NORPLANT¨ in the inventory are notweighted because so few SDPs offer this method.
46 ÒAdequateÓ is defined as protected from rain, sun,adverse temperatures, and pests.
47 For the definitions of ÒenoughÓ of each type ofequipment, see Table 3-1 in the text. For Ghana,Zambia, and Zimbabwe, certain types of equipmentare included in the inventory, but the data includeonly whether some of the equipment is available, nothow many of each item. This makes it impossible to
84 Clinic-Based Family Planning and Reproductive Health Services in Africa

calculate these indicators in a manner comparable tothat for the other countries.
48 In Burkina Faso and Madagascar, this combinessmall, medium, and large specula.
49 In Kenya, Tanzania, and Nigeria, this is Òsterilizinglotion.Ó In C�te dÕIvoire and Botswana it is Òantisep-tic lotion.Ó In Burkina Faso it is Òantiseptic/chemicallotion.Ó In Madagascar it is Òantiseptic lotionÓ orÒformol comprimes.Ó In Zanzibar, it is ÒJik,ÓÒDettol,Ó or Òother sterilizing lotion.Ó
50 Among SDPs that offer IUDs.51 Among SDPs that offer IUDs.52 Among SDPs that offer IUDs.53 Among SDPs that offer IUDs.54 Among SDPs that offer NORPLANT¨. All items
related to NORPLANT¨ in the inventory are notweighted because so few SDPs offer this method.
55 Not specified as part of basic, postbasic, or refreshertraining.
56 In Zambia and Ghana, this is family planning coun-seling training only. In Senegal, Burkina Faso, andZimbabwe, this is training in IEC or family planningcounseling. In all others, this is IEC training only.
57 In Senegal and Madagascar, this includes staff withformal minilap or formal laparoscopy training. InBurkina Faso, this is defined as Òpractical training intubal ligation.Ó In Zimbabwe, this includes stafftrained in mini-laparotomy/local anesthetic(ML/LA) or mini-laparotomy/general anesthetic(ML/GA).
58 In Madagascar, Zimbabwe, and Ghana, this questiondoes not specify Òon the walls.Ó
59 In Zambia, this includes only brochures Òon dis-play.Ó
60 In Zambia, this includes only flip charts Òon dis-play.Ó
61 In Zambia and Ghana, this question does not specifyÒon the walls.Ó
62 In Zimbabwe and Ghana, this question does notspecify Òon the walls.Ó
63 In Zambia, this includes only brochures Òon dis-play.Ó
64 In Zambia, this includes only brochures Òon dis-play.Ó
65 In Zambia, this includes only flip charts Òon dis-play.Ó
66 In Zambia, this includes only flip charts Òon dis-play.Ó
67 Among SDPs that keep client record cards at theclinic rather than giving them to clients.
68 In C�te dÕIvoire, this includes new clients only.69 This is calculated among new clients, revisit clients
who wanted to switch or stop, and revisit clientswho were having a problem with their method.These clients can all reasonably be assumed to haveat least one question to pose. For Kenya, Botswana,and Senegal, this is the percentage of clients whomthe provider ÒletÓ ask a question, as opposed toother studies, which simply asked whether the clientposed a question.
70 For Madagascar, Senegal, Kenya, Ghana, Zimbabwe,Botswana, and Zambia, the questions under this ele-ment address whether the discussion took place,regardless of whether the subject was brought up bythe provider or the client. In the remaining studies,the observer noted only whether the provider raisedthe subject. This may seem a biasing factor, but thepercentage of times subjects are brought up by theclient is minuscule in each country.
71 In Zambia, Zimbabwe, and Ghana, new clients wereasked Òif more than one sexual partner in the lastyear.Ó In Botswana, they were asked Òthe number ofsexual partners in the last year,Ó and in Kenya theywere asked Òthe nature of the clientÕs sexual rela-tionsÓ or Òthe number of sexual partners in the lastyear.Ó In all other countries, this was phrased as Òthenature of the clientÕs sexual relations.Ó
72 In Zambia, Zimbabwe, and Ghana, the client wasasked Òif more than one sexual partner in the pastyear,Ó in Botswana, this is Òthe number of sexualpartners since the last visit,Ó and in Kenya it is Òthenature of the clientÕs sexual relationsÓ or Òthe num-ber of sexual partners since the last visit.Ó In allother countries, this is Òthe nature of the clientÕs sex-ual relations.Ó
73 Among clients who want no more children, as iden-tified through the exit interview.
74 Among clients at SDPs with at least one family plan-ning flip chart available.
75 Among clients at SDPs with at least one family plan-ning brochure available.
76 Among clients at SDPs with at least one family plan-ning poster available.
77 Among clients at SDPs with adult weighing scalesavailable.
78 Among clients at SDPs with blood pressuremachines available.
79 Among pelvic exams at SDPs with water availablein the exam room.
80 Among pelvic exams at SDPs with water availablein the exam room.
81 Among pelvic exams at SDPs with at least two spec-ula available.
82 Among pelvic exams at SDPs with sterile glovesavailable.
83 Among IUD insertions at SDPs with uterine soundsavailable.
84 In Zimbabwe, C�te dÕIvoire, and Zambia, thisincludes new clients only.
85 Among clients who waited at all.86 Among clients who paid anything. In Senegal,
Madagascar, and Zanzibar, clients were askedwhether the cost is Òreasonable,Ó in Burkina Fasowhether it is Òaffordable,Ó and in C�te dÕIvoirewhether it is ÒacceptableÓ or Ònot expensive.Ó In allother sites, the word ÒacceptableÓ was used.
BA
SIC
ST
UD
Y F
IND
ING
S
& T
HE
IR U
TIL
IZAT
ION
Indicators of Readiness and Quality: Basic Findings 85


Using Situation Analysis to Improve Reproductive Health Programs 87
BA
SIC
ST
UD
Y F
IND
ING
S
& T
HE
IR U
TIL
IZAT
ION
The Situation Analysis approach has been adoptedin several countries as a way of providing man-agers with an assessment of the functioning oftheir program and the quality of services receivedby clients. Situation Analysis has clearly met anurgent need for such information as managersstruggle with developing and refining what formany countries in Africa are still fairly new pro-grams. Indeed, managers and donors still use theapproach primarily for assessing the strengths andweaknesses of their programs.
With its evolution and refinement over time,however, Situation Analysis is now being used forseveral other purposes. In many countries, studiesare now being undertaken at two or more points intime to evaluate whether a program has changedover time. The approach is also being adapted andused in operations research studies that testwhether an intervention designed to improve thequality of services in clinics has had the intendedeffect. Research studies aimed at measuringwhether different levels of service quality have animpact on the acceptance and continued use offamily planning are using the approach to providemeasures of service quality. As maternal and childhealth/family planning programs in Africa beginproviding a more comprehensive and integratedpackage of reproductive health services, theSituation Analysis approach is also being broad-ened to collect information on other services,notably for sexually transmitted infections andHIV/AIDS, for child health, and for postabortioncare. And as the number of data sets generated bySituation Analysis studies grows, so, too, does theopportunity to undertake comparative analyses ofservice-delivery issues across several programsand countries. This volume is the first systematic
attempt to do so, but clearly it is not exhaustive,and further analyses are needed.
The purpose of a Situation Analysis studydetermines the way it is designed and implement-ed. Full participation by managers and a compre-hensive strategy for disseminating the results haveproven essential for ensuring that the informationcollected through any type of operations researchis actually used. At two recently conducted work-shops, program managers and others who hadplayed an active role in implementing SituationAnalysis studies and utilizing their results madethe following suggestions:
■ Ensure early and broad participation by serviceproviders and managers from the regional anddistrict levels so they can help identify the infor-mation to be collected and select the sample.
■ Extend dissemination to all levels of the pro-gram, including clinics, so that all providersand managers are aware of the programÕsstrengths and weaknesses and can take appro-priate action themselves.
■ Integrate data from Situation Analysis studieswith data from other sources so that managerscan have a broader picture of the relationshipsbetween the demand for and use of familyplanning and service-delivery activities.
■ Although standardized instruments exist,ensure that each Situation Analysis study is tai-lored to meet the specific needs of the program,whether to plan future interventions, monitorand evaluate ongoing activities, or describe theoverall program functioning.
These suggestions are relatively easy to imple-ment, and to a large extent have been incorporatedin the more recent Situation Analysis studies.
KEY POINTS AND CONCLUSIONS
Using Situation Analysis to Improve Reproductive Health Programs
4


The publication of this volume marks the tenthanniversary of the development and initial appli-cation of the Situation Analysis approach. Thoseinvolved with the first study, conducted in Kenyain 1988Ð1989, will hardly recognize the approach asit is applied today. They certainly could not haveenvisioned the wide variety of applications towhich that first simple study has led. As discussedin Chapter 1, the Kenya study originated with asimple request by the Kenya Ministry of Health(MOH) for assistance in determining how wellfamily planning services were being provided intheir clinics. The MOH then used this informationto make a number of improvements in clinic oper-ations, most of which were accomplished withminimal or no additional resources.
Following the Kenya study, the SituationAnalysis approach was rapidly adopted in severalcountries as a way of providing managers with aneeds assessment of the functioning of their pro-grams and the quality of services received byclients. There was a clear need for such informationas managers struggled with developing and refin-ing what for many countries in Africa were stillfairly new family planning programs. Indeed,managers and donors still tend to use the approachprimarily for this purpose.
As the Situation Analysis approach evolved andwas refined over time and became more familiar tomanagers, donors, and researchers, SituationAnalysis began to be used for several other purpos-es (see Box 1). For example, countries are conduct-ing studies at two or more points in time to evalu-ate whether their program has changed over thattime (see Chapter 11). The approach is also beingadapted and used in operations research (OR) stud-ies designed to test whether an intervention aimed
at improving the quality of services in clinics hashad the intended effect. Research studies that seekto measure whether different levels of service qual-ity have an impact on the acceptance and continueduse of family planning are using the approach toprovide measures of service quality. As maternaland child health (MCH)/family planning programsin Africa begin providing a more comprehensiveand integrated package of reproductive health ser-vices, the Situation Analysis approach is beingbroadened to collect information on other services,notably for sexually transmitted infections (STIs)and HIV/AIDS (see Chapter 10), for child health,and for postabortion care. And finally, as the num-ber of completed studies grows, so, too, does theopportunity to undertake comparative analyses ofspecific service-delivery issues across several pro-grams. This volume is the first systematic attemptto do so, but it is clearly not exhaustive, and furtheranalyses are certainly needed.
This chapter reviews and explores these differ-ent ways in which the Situation Analysis approachis being used. The purpose for which a SituationAnalysis study is undertaken determines the wayit is designed and implemented. Full participationby managers and a comprehensive strategy for dis-seminating the study results have proven essentialfor ensuring that the information collected throughany type of OR is actually used (Solo et al., 1998).Accordingly, the chapter provides specific exam-ples of how Situation Analysis studies have beenimplemented to illustrate how this can best beaccomplished. The use of Situation Analysis for thefollowing purposes is examined:■ Diagnosing and strengthening program readi-
ness and service quality■ Analyzing and explaining quality of care
Using Situation Analysis to Improve Reproductive Health Programs 89
BA
SIC
ST
UD
Y F
IND
ING
S
& T
HE
IR U
TIL
IZAT
ION
Using Situation Analysis to Improve Reproductive Health ProgramsIan Askew
4

■ Evaluating national programs over time■ Developing and validating indicators of service
delivery■ Evaluating specific interventions in MCH/fam-
ily planning clinics■ Evaluating the impact of programs on family
planning behavior and fertilityThe chapter then reviews means by which the
dissemination and utilization of Situation Analysisresults can be maximized.
DIAGNOSING ANDSTRENGTHENING PROGRAMREADINESS AND SERVICE QUALITY
As noted, the original purpose of SituationAnalysis studies was to provide program man-agers with basic information on the readiness oftheir programs to offer a basic level of family plan-ning services, and to give some indication of thequality of services received by family planningclients. This has continued to be the main purposefor carrying out such studies. For example, studiesimplemented in Mali, Mauritania, Cameroon, andGuinea1 over the past 2 years were requested togive program managers (and the donor agenciessupporting the programs) information that wouldhelp them strengthen their programsÕ subsystems.Basic Situation Analysis studies are most frequent-ly requested when a donor agency, or the program
itself, has acquired additional resources and needsinformation to guide the design of new program-strengthening activities.
Most commonly, the results from basicSituation Analysis studies are used first to identifyareas of weakness in a program, and then to sug-gest ways in which those weaknesses can bereduced or even eliminated (see Box 2). The collec-tion and analysis of data are designed so that theresults can be presented in relation to the key sub-systems of a family planning program (see Chapter1). Thus data are collected on staff experience,training, and skills; information, education, andcommunication (IEC) materials; supervision proce-dures; recordkeeping and reporting; and infra-structure, equipment, and commodities and sup-plies logistics. In this way, managers find it rela-tively easy to identify specific administrative deci-sions that can improve their programs becausethere are usually separate units, departments, orindividuals responsible for each of these subsys-tems. Moreover, donors and technical assistanceagencies usually organize their support (andindeed sometimes their own operations2) accord-ing to these subsystems. Having study resultsarranged by subsystem therefore provides bothmanagers and donors with an easily understand-able set of data about how a program is functioningfrom which decisions about how to strengthen theprogram can be made.
Results from Situation Analysis studies are alsoused to guide the formulation of, as well as to eval-uate, national or organizational policies and actionplans (see Box 3). The study reports themselveshave frequently been used as background resourcematerials during the planning process. AllSituation Analysis study reports include a sectionpresenting recommended actions toward thedevelopment of a stronger program offering high-er-quality services. These recommendations haveproven useful to those responsible for preparingpolicies and plans because they result from afocused analysis of the situation based on empiri-cal data, rather than from anecdotal, impressionis-tic, or politically motivated evidence. Moreover,these recommendations usually have credibilitywith planners because they have been developednot solely by the researchers who collected the
90 Clinic-Based Family Planning and Reproductive Health Services in Africa
Box 1
Situation Analysis studies are being used to:❑ Diagnose and strengthen program readi-
ness and service quality.❑ Analyze and explain quality of care.❑ Evaluate national programs over time.❑ Develop and validate indicators for service
delivery.❑ Evaluate specific interventions in maternal
and child health (MCH)/family planningclinics.
❑ Evaluate the impact of programs on familyplanning behavior and fertility.

Using Situation Analysis to Improve Reproductive Health Programs 91
BA
SIC
ST
UD
Y F
IND
ING
S
& T
HE
IR U
TIL
IZAT
ION
Box 2Using Results from Situation Analysis Studies to Strengthen Program Subsystems
Country Date Utilization of Results
Botswana 1995 Task Force established to review client record forms, service provider guidelines, and IEC materials after weaknesses identified by study.
Training course developed in logistics management.
Supervisory checklist developed for integrated services; will be tested on a pilot basis as an OR study.
Burkina Faso 1991 New training curricula and materials for training providers in1995 counseling developed by MOH.
“Reference guide” on contraceptive methods developed to improve information provided.
Data analyzed by Gesellschaft für Technische Zussammenarbeit (GTZ) to strengthen services at those clinics it supports.
Guide for undertaking a training needs assessment developed by Program for International Training in Health (INTRAH).
IEC materials on contraceptives developed by Johns Hopkins University/Population Communication Services.
Findings used by Family Planning Service Expansion and Technical Support (SEATS) Project to advise the MOH on a program of integration.
Ghana 1993 Results of items on training used by the Johns Hopkins Program for1997 International Education in Reproductive Health (JHPIEGO) to
monitor implementation of revised curriculum.
Kenya 1990 Results used by Nairobi City Commission (NCC) and Pathfinder to assess1991 and strengthen infection control, counseling, and IEC activities.1995 Decision made by Pathfinder to support clinic strengthening in all
44 NCC clinics, rather than 10 as originally planned.
Results disseminated to six provinces and used by managers to plan improvements at subprovince level.
Senegal 1994 Decentralized dissemination led to rapid training sessions for 1996 improving providers’ attitudes and beliefs about contraception.
Training manual developed for managing contraceptive supplies.

data, but in conjunction with, and sometimes by,the managers and staff directly responsible for theday-to-day running of a program.
Immediately following the first SituationAnalysis study in Kenya, a deliberate attempt wasmade to encourage program managers in thatcountry to use the study results for identifying key service-delivery problems that could beaddressed through OR studies. Three problems
were identified,3 and a small-scale OR study thattested alternative solutions was completed for each(Miller and Frerichs, 1992Ð1993). This strategy ofusing Situation Analysis studies to diagnose prob-lems and then identify and test potential solutionshas rarely been used since. Although intuitively itmay seem surprising that this strategy has not beenmore widely adopted, the realities facing programmanagers may help explain why.
92 Clinic-Based Family Planning and Reproductive Health Services in Africa
Box 2 (contd.)Using Results from Situation Analysis Studies to Strengthen Program Subsystems
Country Date Utilization of Results
Zanzibar 1994 Equipment found missing at specific facilities purchased by MOH.
Management and supervision courses added to program.
Zimbabwe 1991 Basic family planning training curriculum revised by Zimbabwe 1996 National Family Planning Council (ZNFPC) to encourage full
counseling on methods.
Counseling skills training module developed, with special emphasis on long-term and permanent methods.
Interpersonal communications training module developed.
Checklist developed to improve follow-up visits to continuing clients.
Selection criteria for those being trained in family planning revisedto ensure that all clinics have at least one provider trained in family planning.
Decentralized training initiated at district level to increase number of staff trained in family planning.
Increased attention and resources allocated to training doctor-nurse teams for sterilization and IUD services.
Frequency of refresher training increased through training of provincial staff.
System for distributing IEC materials to provinces improved.
Health Information Form improved, with training provided in completion of the family planning component to improve service statistics.
Proposal developed for study to train providers in reproductive tract infection (RTI) management with IUD clients; proposal funded and supported by JHPIEGO.
Pilot study to test depot-holder approach as alternative CBD strategy developed and implemented.

Using Situation Analysis to Improve Reproductive Health Programs 93
BA
SIC
ST
UD
Y F
IND
ING
S
& T
HE
IR U
TIL
IZAT
ION
Box 3Using Results from Situation Analysis Studies to Guide and Evaluate Policies and Programs
Country Date Utilization of Results
Botswana 1995 Reproductive health section of Government of Botswana’s 5-year National Development Plan formulated.
Indicators for monitoring integrated reproductive health services developed.
Data used by USAID as baseline measure for evaluating its bilateral BOTSPA integrated services project.
United Nations Population Fund (UNFPA) 5-year Project Review and Strategy Development Plan developed.
Burkina Faso 1991 Comparative analysis of results from 1991 and 1995 studies funded 1995 by UNFPA, as was a regional-level analysis of the 1995 data, to
guide joint planning with the MOH.
Results used by MOH to guide World Bank-funded decentralization process.
Ghana 1993 Results used by FHI to assess adherence by providers to new 1997 standards and guidelines.
Kenya 1990 Study report used by program managers to identify specific resource 1991 needs in discussions with donors.
MOH Reproductive Health Strategy developed.
National Implementation Plan for Family Planning Program (1995–2000) developed.
Data used by Marie Stopes International to develop proposals for the World Bank.
Senegal 1994 1996 National Action Plan developed.
1996 Fees policy reviewed and standardized nationwide.
Standards and guidelines finalized.
Provision of injectables begun by International Planned Parenthood Federation (IPPF) affiliate.
Data used as baseline for USAID bilateral child health/family planning project implemented by Management Sciences for Health (MSH).
Zambia 1997 Data used as baseline for evaluating:• USAID bilateral clinic-strengthening project implemented by John
Snow Incorporated (JSI).• USAID Child Health Project.• UNFPA reproductive healthcare project in 10 districts.• MOH Lusaka health program.
Zanzibar 1994 Next 5-year program with UNFPA funding developed.
Zimbabwe 1991 1997–2001 national reproductive health program developed.
1996 Changes in program since 1991 assessed.
1995

First, many of the identified problems lendthemselves to immediate administrative action. Ifequipment is not available at clinics because it islocked up in a storeroom in the capital city, man-agers do not need a research study to find a solu-tion. Many findings from Situation Analysis stud-ies are of this nature, in which case the challenge isto optimize the procedures by which remedialaction is taken. One potential drawback, however,is that because study results are normally present-ed in a clear-cut and precise fashion, managersusually draw from their own experience to identi-fy a single solution to the problem that may or maynot be the most appropriate approach. Thus havingused research to identify a problem, they rely onintuition to solve it.
Second, most program managers rely heavilyon external funds to support OR studies. Thus evenif the need for an OR study is identified, a programmanager is unlikely to be in a position to undertakesuch a study unless funds are available immediate-ly for the purpose (as was the case in Kenya). Theproblem is in part the lack of resources allocated byservice-delivery organizations to research general-ly. It is also due to the fact that, with the notableexception of the first Kenya study, SituationAnalysis studies have not been designed or fundedto allow for follow-on OR projects. To enhance thefuture utility of Situation Analysis studies, then, itis important for those who fund and support suchstudies to consider including additional resourcesto allow for possible follow-on work. (See Box 4.)
ANALYZING AND EXPLAININGQUALITY OF CARE
Despite 10 years of intensive attention by programmanagers, donor agencies, and technical assistanceorganizations to strengthening the quality of clinicservicesÑand by researchers to defining and mea-suring qualityÑlittle is really known about whysome clients receive higher-quality services thanothers, what determines these differences, andwhether improving service quality actually makesa difference. As Shelton (in Miller et al., 1997:vi)points out, Situation Analysis Òis the first system-atic data collection tool which credibly documents
what goes on inside the formidable Ôblack boxÕ ofservice delivery.Ó To date, however, very little usehas been made of the ever-increasing amount ofdata on quality of service delivery that has beencollected through Situation Analysis studies. Thisvolume marks the first systematic attempt to gobeyond simply describing quality of care. It pre-sents a number of analyses, none particularlyrefined methodologically, that seek to explain whyclinics function the way they do and why providersoften behave in ways that are less than optimal.
A few other attempts have been made to exploitthese data sets more thoroughly. In particular,researchers have been seeking to establish whethergeneralizable patterns exist across programs in dif-ferent countries. For example, Fisher (1993) useddata from Zimbabwe, Nigeria, Ghana, andTanzania to demonstrate that 20Ð30 percent of allclinics deliver services to 70Ð80 percent of all newfamily planning clients attending clinics, even after
94 Clinic-Based Family Planning and Reproductive Health Services in Africa
Box 4Importance of Follow-onOperations Research
Ensuring that financial and technical supportis available for follow-on OR studies is essen-tial. For example, following the nationalSituation Analysis study in Botswana, theMCH/family planning unit realized that theclient record forms it had been using in pro-viding family planning services were inap-propriate for recording the information need-ed to provide integrated services to clients.Although it was possible to simply redesignthe form so that it included space for theadditional information, the MCH/familyplanning unit wanted to test the new form onan experimental basis to determine how wellproviders were able to adapt to using it, andwhether it improved their ability to offer inte-grated services. Because no funds were avail-able for this study, either from within theMOH or from an external donor, it was notundertaken.
controlling for clinic type. Mensch and colleaguesexamined the relationship of this finding to sub-system functioning. They found that Òvariation inthe number of new acceptors is not adequatelyexplained by subsystem functioningÓ (Mensch etal., 1996:26). Measham et al. (1996) looked at thequality of care provided to family planning clientswho were breastfeeding at clinics in Nigeria andSenegal, and were able to develop a number of rec-ommendations for improving the service offered tothis important group of clients. Stein (1996) com-pared the perception of service quality by familyplanning and MCH clients in Botswana, Tanzania,and Kenya, and found that MCH clients were sig-nificantly less satisfied than family planningclients.
Clearly, there is tremendous scope for lookingin greater detail at many aspects of quality of careand for identifying what determines the level ofquality provided by a clinic.4 All Situation Analysisdata sets have been standardized to the extent pos-sible so that cross-study analyses can be undertak-en, and all are in the public domain.5
EVALUATING NATIONALPROGRAMS OVER TIME
Evaluation of family planning programs over timeis acknowledged to be a difficult undertaking.Opinions differ about the level of effect or impactthat should be measured, the most appropriateindicators to use, and the best means of collectingthe data (Buckner et al., 1995; Samara et al., 1996).The Situation Analysis approach offers a new eval-uation strategy that can be used to measure subsys-tem functioning and service quality at two or morepoints in time. The first country to undertake a sec-ond Situation Analysis study was Burkina Faso.Since then, Ghana, Kenya, Senegal, and Zimbabwehave completed second Situation Analysis studies,and Botswana and Zambia plan to do so in the nearfuture. (See Chapter 11 for the key results from fourof these comparisons over time.)
As experience in Burkina Faso and in Kenya(see Miller et al., 1996) has shown, however, unless the first and second Situation Analysis stud-ies are deliberately planned for use in program
evaluation, substantial differences in sampling anddata collection may effectively render them non-comparable. In both Burkina Faso and Kenya,comparisons made over time could be only Òacci-dentalÓ rather than planned because methodologi-cal differences between the two studies (due toimprovements in the methodology over time)meant that very few indicators could actually bemeasured in the same way. The first and secondstudies undertaken in Zimbabwe succeeded inhaving the same sampling plan, but substantialchanges in the data collection instruments between1991 and 1996 limited the number of indicatorsthat were comparable for both studies. The twostudies carried out in Ghana represented the firstattempt at deliberately planning a series ofSituation Analysis studies to measure changes inthe national program over time (see Chapter 11); athird study is planned for 1999.
The use of the Situation Analysis approach forevaluation purposes has been most fully devel-oped in Senegal. Whereas the studies in Ghana arecomparing the national program at three points intime, effectively creating a time-series evaluationdesign (Fisher et al., 1991), the strategy in Senegalhas gone two steps further in strengthening the useof the approach.6 First, the evaluation designincludes an experimental group of clinics (allMOH clinics in four designated provinces) thathave received a clinic-strengthening interventionand a comparison group of clinics that have notreceived this intervention (all clinics in the remain-ing six provinces). Following the first SituationAnalysis study in 1994, which provided the base-line measures,7 the clinic-strengthening interven-tion was introduced by the Programme Nationalpour la Planification Familiale (PNPF) with sup-port from USAIDÕs bilateral Child Survival andFamily Planning Project. This evaluation designmeans that the clinics receiving the interventioncan be compared in two ways: over time to seewhether they themselves have changed, and withthe clinics that did not receive the intervention tosee whether changes in the two groups differ.Second, as discussed below, data collected from thefirst Situation Analysis study were used to developa set of measurable indicators of program func-tioning and service quality.
Using Situation Analysis to Improve Reproductive Health Programs 95
BA
SIC
ST
UD
Y F
IND
ING
S
& T
HE
IR U
TIL
IZAT
ION

DEVELOPING AND VALIDATINGINDICATORS OF SERVICE DELIVERY
To date, most Situation Analysis studies have beenused as a reservoir of information for use by man-agers to serve particular purposes. As SituationAnalysis studies are increasingly designed and usedexplicitly for evaluation purposes, however, the roleof indicators that can be used and understood byprogram managers becomes more important.
The recently completed EVALUATION Project(implemented by the University of North Carolina,Tulane University, and others with funding fromUSAID) has made a tremendous contribution toprogram evaluation, particularly the identificationof service-delivery indicators that can be used byprogram managers and donors (Bertrand et al.,1993). Drawing from the list of indicators, Askew etal. (1994) used data from the 1992 Situation Analysisstudy in Nigeria to validate those indicators
proposed by the EVALUATION Project for measur-ing quality of care that could be measured using thisdata. A similar approach was taken by Brown andcolleagues using data from a Situation Analysisstudy in Morocco (Brown et al., 1995).
These initial studies have paved the way for amore systematic consideration of indicator devel-opment and measurement during the adaptation ofstandard data collection instruments for nationalSituation Analysis studies (see Askew et al. [1995]for a review of how Situation Analysis data havebeen used for measuring indicators). Indeed, theSituation Analysis Handbook (Miller et al., 1997)includes a description of 138 programmatic indica-tors that can be measured using the standard datacollection instruments.
The Situation Analysis Handbook also describesthe indicators developed in Senegal, which providemanagers with succinct empirical information aboutchanges in program functioning and quality in the
96 Clinic-Based Family Planning and Reproductive Health Services in Africa
Box 5Example of Indicators Measured by USAID/Senegal Using SituationAnalysis Data
Indicators for Key Intermediate Result 1—Increase access to MCH/family planning and STI/AIDS services:a
❑ Proportion of clinics offering family planning services to men and adolescents❑ Proportion of clinics having trained staff and adequate equipment and supplies to offer family plan-
ning services❑ Proportion of clinics having at least one person trained in managing diarrhea and an adequate
stock of oral rehydration salts (ORS)❑ Proportion of clinics having at least one person trained in malnutrition, as well as equipment need-
ed to screen for malnutrition❑ Proportion of clinics meeting the “baby-friendly hospital” criterionb
Indicators for Key Intermediate Result 2—Improve the quality of MCH/family planning and STI/AIDS services:❑ Proportion of clinics offering a complete range of contraceptive methods❑ Proportion of clinics at which clients receive counseling that conforms to service-delivery norms and standards❑ Proportion of clinics receiving at least one supervisory visit every 3 months❑ Continuation rate for family planning clients
Source: Touré et al. (1997a).a Key intermediate results are those outcomes that must be accomplished to achieve a USAID Mission’s strategic
objective.b This indicator refers to 10 questions regarding the existence and implementation of a breastfeeding policy, the
existence of a support system for breastfeeding women, staff training, and staff attitudes and practices towardbreastfeeding mothers and their children.

experimental and control clinics. Most important,key decision makers from the PNPF and from thedonors supporting the intervention directed thedevelopment of these indicators. Consequently, theindicators provide a credible means for evaluatingthe program. They were used for an interim evalua-tion of the situation in the experimental clinics in1996; the first post-intervention study, in which allthe clinics from the pre-intervention study wererevisited, was completed in September 1998.
One of the major donors for the Senegal pro-gram (USAID) is also using the Situation Analysisdata to measure its own indicators of progress withits bilateral support project. The USAID Mission inSenegal (with technical assistance from the AfricaOR/TA Project II) has identified 10 indicators forevaluating progress on its strategic objective forservice delivery, on which it is expected to report toUSAID headquarters in Washington every 2 years(see Box 5). Data from the 1996 Situation Analysisstudy was used to measure these indicators (Tour�et al., 1997a), as will the data from the 1998 study.
EVALUATING SPECIFICINTERVENTIONS IN MCH/FAMILYPLANNING CLINICS
The Situation Analysis approach is essentially ameans of collecting data that describe how clinicservices are being provided. It can therefore beadapted fairly easily to evaluate interventions thatare introduced at clinics. One of the first attempts todo so was undertaken by The Johns HopkinsUniversity/Population Communication Services(JHU/PCS), which refined the observation andclient interview instruments to collect moredetailed data on the nature of informationexchanged during client counseling (Kim andLettenmaier, 1995). Data collected with these instru-ments have been used extensively to revise trainingcurricula in Kenya, Tanzania, Zimbabwe, andNigeria (Y. Kim, 1998, personal communication).
Since the increased focus on integratingSTI/HIV/AIDS services at MCH/family planningclinics that resulted from the 1994 InternationalConference on Population and Development(ICPD) in Cairo (see Chapter 10), the Situation
Analysis approach has proved extremely useful inassessing the degree to which such integration isfeasible (see Box 6). Maggwa and Askew (1997)report on a series of case studies undertaken inEast and Southern Africa to examine projects thathave sought to introduce interventions aimed atproviding services in a more integrated fashion.These case studies used revised versions of theSituation Analysis instruments to collect data onwhether the clinics had the necessary equipment,supplies, and drugs to offer both types of services;on the level of staff training and experience in pro-viding STI/HIV/AIDS information and services;on how well the providers had implemented therevised procedures for integrated service delivery;and on clientsÕ knowledge of the symptoms,modes of transmission, and means of protectionfor STIs. Versions of these case study instrumentsare currently being used by the Navrongo HealthResearch Centre in northern Ghana to evaluate theeffect of an intervention (supported by JHPIEGO)to introduce STI management services in four dis-trict clinics.
Now that most national MCH/family planningprograms in the region are integrating STI/HIV/AIDS services within their standard service-delivery procedures, many of the questions devel-oped for the case study instruments are beingincluded in the regular Situation Analysis instru-ments used for national studies. For example,Chapter 11 uses data from five national SituationAnalysis studies that incorporated many of thequestions on STI services developed for the casestudies.
Botswana was the first country to include mod-ules on STI management in its national SituationAnalysis study (Baakile et al., 1996). The data col-lected gave the MOH a baseline for evaluatingchanges in the quality of care provided to clientsafter the introduction of an intervention thattrained staff and equipped clinics to offer integrat-ed services. Instead of repeating a complete nation-al Situation Analysis study to measure the effect ofthis intervention, the MOH requested assistancefrom the Africa OR/TA Project II to develop andtest a mechanism for quickly and accurately mea-suring the effect of the intervention on the wayclinics and staff function. The resulting mechanism
Using Situation Analysis to Improve Reproductive Health Programs 97
BA
SIC
ST
UD
Y F
IND
ING
S
& T
HE
IR U
TIL
IZAT
ION
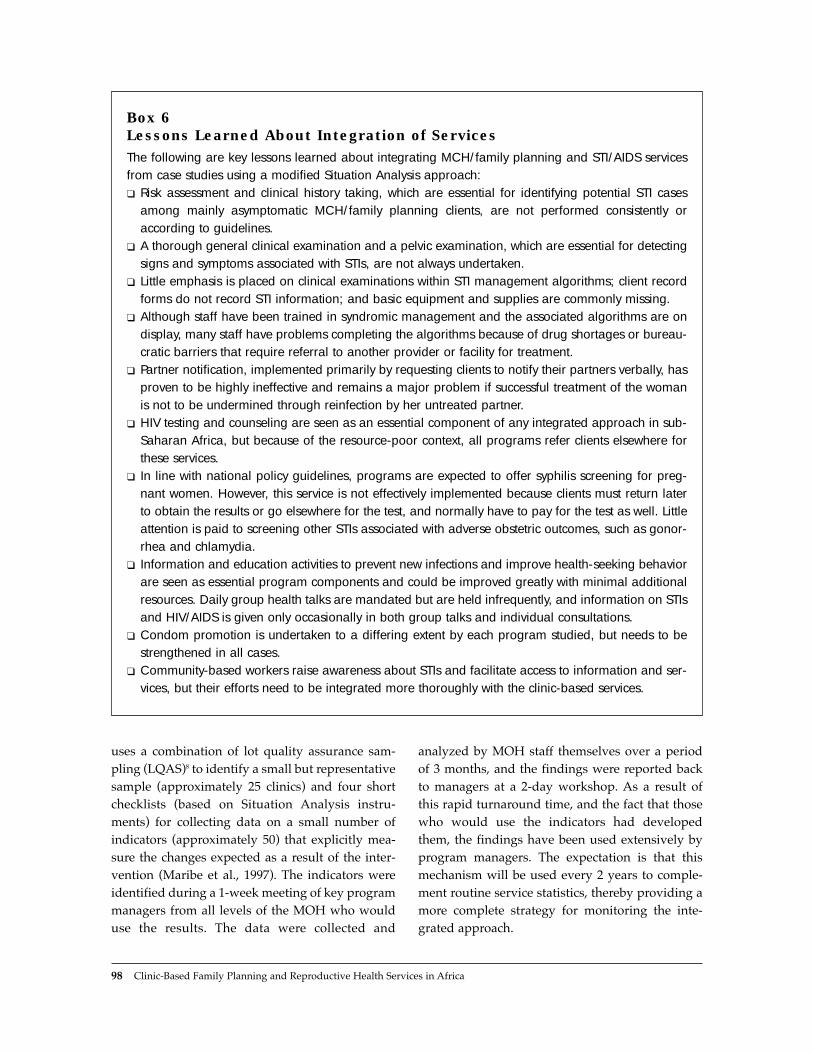
uses a combination of lot quality assurance sam-pling (LQAS)8 to identify a small but representativesample (approximately 25 clinics) and four shortchecklists (based on Situation Analysis instru-ments) for collecting data on a small number ofindicators (approximately 50) that explicitly mea-sure the changes expected as a result of the inter-vention (Maribe et al., 1997). The indicators wereidentified during a 1-week meeting of key programmanagers from all levels of the MOH who woulduse the results. The data were collected and
analyzed by MOH staff themselves over a periodof 3 months, and the findings were reported backto managers at a 2-day workshop. As a result ofthis rapid turnaround time, and the fact that thosewho would use the indicators had developedthem, the findings have been used extensively byprogram managers. The expectation is that thismechanism will be used every 2 years to comple-ment routine service statistics, thereby providing amore complete strategy for monitoring the inte-grated approach.
98 Clinic-Based Family Planning and Reproductive Health Services in Africa
Box 6Lessons Learned About Integration of Services
The following are key lessons learned about integrating MCH/family planning and STI/AIDS servicesfrom case studies using a modified Situation Analysis approach:❑ Risk assessment and clinical history taking, which are essential for identifying potential STI cases
among mainly asymptomatic MCH/family planning clients, are not performed consistently oraccording to guidelines.
❑ A thorough general clinical examination and a pelvic examination, which are essential for detectingsigns and symptoms associated with STIs, are not always undertaken.
❑ Little emphasis is placed on clinical examinations within STI management algorithms; client recordforms do not record STI information; and basic equipment and supplies are commonly missing.
❑ Although staff have been trained in syndromic management and the associated algorithms are ondisplay, many staff have problems completing the algorithms because of drug shortages or bureau-cratic barriers that require referral to another provider or facility for treatment.
❑ Partner notification, implemented primarily by requesting clients to notify their partners verbally, hasproven to be highly ineffective and remains a major problem if successful treatment of the womanis not to be undermined through reinfection by her untreated partner.
❑ HIV testing and counseling are seen as an essential component of any integrated approach in sub-Saharan Africa, but because of the resource-poor context, all programs refer clients elsewhere forthese services.
❑ In line with national policy guidelines, programs are expected to offer syphilis screening for preg-nant women. However, this service is not effectively implemented because clients must return laterto obtain the results or go elsewhere for the test, and normally have to pay for the test as well. Littleattention is paid to screening other STIs associated with adverse obstetric outcomes, such as gonor-rhea and chlamydia.
❑ Information and education activities to prevent new infections and improve health-seeking behaviorare seen as essential program components and could be improved greatly with minimal additionalresources. Daily group health talks are mandated but are held infrequently, and information on STIsand HIV/AIDS is given only occasionally in both group talks and individual consultations.
❑ Condom promotion is undertaken to a differing extent by each program studied, but needs to bestrengthened in all cases.
❑ Community-based workers raise awareness about STIs and facilitate access to information and ser-vices, but their efforts need to be integrated more thoroughly with the clinic-based services.

Situation Analysis studies have also been usedto explore providersÕ and clientsÕ perceptions ofunwanted pregnancies and the potential or actualrole played by abortion in managing such situa-tions (Huntington et al., 1993, 1996). Moreover,since the promotion of a more comprehensiveapproach to providing both reproductive healthand MCH services, a number of modules haverecently been developed and used to assess sever-al other services being provided at MCH/familyplanning clinics. For example, in Zambia, Senegal,and Guinea, data are being collected on the qualityof diarrhea management services for childrenthrough observations of client-provider interac-tions and interviews with the childrenÕs caregivers.In Guinea and Senegal, prenatal services are beingobserved and clients interviewed, and in Guinea,clients attending clinics for STI or HIV/AIDS ser-vices are being observed and interviewed. In addi-tion, the Situation Analysis approach has beenadapted by Sloan and colleagues to develop arapid assessment tool for measuring the readinessand quality of emergency obstetric services at pri-mary and secondary health facilities (Sloan et al.,1995).
With the promotion of a more comprehensiveand integrated approach to providing reproduc-tive health services, the role played by national ser-vice-delivery standards and guidelines is currentlyunder close scrutiny. Originally developed to gov-ern how clinic staff provide family planning ser-vices, these guidelines are now being revised bymany countries to expand the number and types ofservices included. The results from SituationAnalysis studies can contribute directly to thisprocess (as has been the case in Ghana, Kenya, andSenegal) by demonstrating how services are cur-rently being provided and offering suggestions forchanges to the guidelines that would result in theprovision of a better quality and wider range ofservices (Hardee et al., 1998). As discussed inChapter 8, at present many providers do notalways follow existing standards and guidelines,and thereby impose unnecessary barriers on theuse of family planning by certain clients.
A number of programs are currently imple-menting more broad-based interventions tostrengthen the overall ability of clinics and their
staff to offer high-quality family planning services.The Situation Analysis approach has been adaptedto evaluate the effectiveness of clinic-strengtheninginterventions in two West African countries. InBurkina Faso, the MOH has trained staff and re-equipped 13 clinics in Baz�ga Province as part ofits experimental study to test alternative strategiesfor providing family planning services to ruralpopulations. The national Situation Analysis studyundertaken in 1995 provided baseline data formany of these clinics,9 as well as for the 8 clinicsassigned to the comparison group. A mini-Situation Analysis study was undertaken in 1997,18 months after the intervention had been imple-mented, in all experimental and comparison clin-ics. A comparison is currently under way (using 15summary indicators) to ascertain whether theintervention has in fact strengthened the clinicsÕreadiness to offer quality services.
A slightly different approach is being taken inSenegal, where the PNPF has introduced a strategyfor strengthening 14 selected clinics so that theywill become Òreference centersÓ or Òmodel clin-ics.Ó10 As part of a larger study to examine theimpact on family planning behavior of improvingservice quality (see the next section), the quality ofservices provided at a sample of 5 model clinics isbeing measured and compared with that of 5 com-parison clinics at three points in time.
EVALUATING THE IMPACT OFPROGRAMS ON FAMILY PLANNINGBEHAVIOR AND FERTILITY
The idea that improving service quality willincrease family planning acceptance and use hasbeen broadly accepted since seminal papers by Jain(1989) and Bruce (1990) first proposed that such arelationship exists. To date, however, surprisinglylittle empirical evidence has been collected toeither prove or disprove this relationship. In largepart, this is because of the difficulty of designingresearch studies that can systematically link thequality of care offered in clinics with the familyplanning and ultimately the fertility behavior ofclinic clients and the general population. Recently,Fisher et al. (1998) have proposed three ways in
Using Situation Analysis to Improve Reproductive Health Programs 99
BA
SIC
ST
UD
Y F
IND
ING
S
& T
HE
IR U
TIL
IZAT
ION

which Situation Analysis studies can be used toassess the impact of programs on family planningbehavior and fertility.
The first, which they describe as an ÒoutputevaluationÓ study, seeks to evaluate how the readi-ness of clinics to offer high-quality services mayhave changed as a result of program improve-ments. Such an evaluation would require twoSituation Analysis studies undertaken at least 3years apart, using the same or similar samples ofclinics. The comparisons undertaken in BurkinaFaso and Ghana described above and in moredetail in Chapter 11 are examples of this approach.
The second type of impact study would mea-sure the effect of improving service quality onclientsÕ contraceptive behavior. The ongoing stud-ies at the model clinics in Senegal and in Baz�ga,Burkina Faso (mentioned above) are examples ofthis approach. For the Senegal study, the objectiveis to determine whether clients attending clinicswith better-quality services are likely to continue touse a family planning method more consistentlyand longer than clients attending clinics where ser-vice quality has not been strengthened. This impactis being measured by following cohorts of womenattending both strengthened and nonstrengthenedclinics over time.11 In Baz�ga, impact is being mea-sured at two levels: the study is examining whetherclinics that have been strengthened attract andretain more new and revisit clients, and by addinga catchment area panel survey to the evaluationdesign, it is also assessing the impact on the use offamily planning in the clinic catchment areas overtime. A series of Situation Analysis studies con-ducted at the clinics over time describes changes inthe quality of care offered.
The third type of impact study also seeks torelate use of services in the catchment area withthe quality of care provided, but does so by linkinga Situation Analysis study with a Demographicand Health Survey (DHS) in the same geographicarea. Such a study was undertaken by Mensch andcolleagues in Peru (Mensch et al., 1996). Theyfound that there is a small but significant relation-ship between quality and use: if all women hadaccess to clinics with the highest-quality care, con-traceptive prevalence would be at least 16 percenthigher. Unfortunately, the stringent and costly
methodological requirements for this study, whichsought to link data on contraceptive prevalence inDHS clusters with quality measures for clinicsaccessible to the cluster populations, have made itimpossible to replicate the study elsewhere. Underthe USAID-funded MEASURES Project, a numberof studies have been proposed that would attemptto address this issue more efficiently by linking thecollection of facility- and population-based data ina single study. The facility-based data would becollected using an adaptation of the SituationAnalysis approach.
MAXIMIZING THE DISSEMINATIONAND UTILIZATION OF SITUATIONANALYSIS RESULTS
As the Situation Analysis approach has evolvedover time, so, too, has the process by whichSituation Analysis studies are implemented. Asdemonstrated in this chapter, the data fromSituation Analysis studies have been used for avariety of purposes, but the most importantremains its use by managers to guide improve-ments in the functioning and quality of the servicesprovided by their programs. Consequently, muchattention has been paid to ensuring that SituationAnalysis studies are implemented so that theirresults are widely disseminated and, whereverpossible, they can be acted upon by program man-agers and donors.
A process for implementing Situation Analysisstudies has emerged that focuses on ensuringdirect participation by managers at all levels ineach of the key phases of implementing a study.Use of a participatory approach has proven invalu-able for increasing managersÕ understanding of theresearch process, and for ensuring that the studyproduces information the managers believe to beimportant and on which they can take action. First,a 2- to 3-day orientation and planning meeting isheld among the senior managers, policy makers,and donors who will use the results and theresearch team that will undertake the study. At thismeeting, several activities are completed:■ The methodology and data collection proce-
dures are discussed in detail.
100 Clinic-Based Family Planning and Reproductive Health Services in Africa

■ The sampling plan is developed to ensure thateveryone is satisfied that the results will be rep-resentative.
■ The core data collection instruments (see Milleret al., 1997:Ch. 3) are adapted to the local needsand adjusted to meet any special circum-stances.
■ Participants agree to their roles during andafter the fieldwork, with particular attention tofacilitating the research teamsÕ access to thesampled clinics.The credibility of the results and recommenda-
tions from a Situation Analysis study rests heavilyon the representativeness of the studyÕs samplingplan. The sampling plans for the studies reportedin this volume are described in Chapter 1, where itcan be seen that there is no universally applicableplan. The guiding principle followed for each sam-ple was that it should be regarded as representa-tive by those who would be using the data. Indeed,the 1994 and 1998 studies in Senegal and the studyin Zanzibar did not draw a sample at all: the fami-ly planning program managers insisted that a cen-sus of every clinic that provides family planningservices should be included.
More commonly, a sample is drawn that isnational in scope, but is stratified in ways that arebelieved by program managers to best representthe program (e.g., by province, by type of clinic). Inseveral studies, the sample has also deliberatelyincluded an oversampling of clinics representing aparticular component of the program (e.g., inNigeria and the first study in Ghana, all hospitalswere sampled) or the clinics of another organiza-tion in addition to the MOH (e.g., in Ghana, sam-ples were drawn of the IPPF-affiliate clinics and ofthe Ghana Registered Midwives Association[GRMA] program clinics, while in Kenya, all clin-ics of the Nairobi City Council were included).
The importance of having an acceptable andcredible sample is emphasized here because quiteoften the study results may be contentious in thatthey frequently portray a program that is not func-tioning as well as was expected. When the results donot meet everyoneÕs expectations, questions areusually raised about the sample because there is afeeling that Òthe wrong clinicsÓ must have been vis-ited. However well a sample was designed, it is
always possible to find some fault with it, particu-larly if random selection was used. For example, theTanzania study undertaken in 1992 used a randomsampling plan for the whole country. Unfortunately,the random selection process drew a sample thatdid not include any clinics from one of the provincesin the north of the country. To compound the prob-lem, this province has by far the highest contracep-tive prevalence rate, so there had been great interestin finding out more about the family planning pro-gram there. Data collection proceeded at the clinicsthat had been randomly selected, and as a result theentire study suffered a lack of credibility because itdid not include representation from every province.In hindsight, the sample should have been stratifiedby province to avoid this problem. This examplehighlights the importance of involving all thoseinterested in the study results from the beginning ofthe process, including sample selection.
Once the data have been collected, rapid pro-cessing is essential for the production of frequencytabulations for all indicators, with some basic crosstabulations being done where necessary. A datainterpretation workshop (usually lasting 1Ð2 days)is held for the same group of managers, policymakers, donors, and researchers to discuss thesepreliminary results. One of the basic purposes ofthis workshop is to allow managers to see the pre-liminary data before a final report has been writtenand before the data are disseminated more widely.In this way, managers are directly involved in giv-ing meaning to the data, rather than having to relyon the interpretation of researchers as is the casewith most research studies. The objective of theworkshop is to obtain overall agreement on theprogrammatic implications of the data.
Following the data interpretation workshop, adraft report is written (usually by the researchers)to synthesize the key study results in a simple-to-read format (see Miller et al., 1997:Ch. 4). This draftreport serves as the background documentation fora national (or program-level) dissemination semi-nar at which the study results are presented to anddiscussed with a wider range of interested parties.Attention is paid to ensuring that the results arepresented in an easily understandable form; to thisend, bar charts are commonly used to present thedata graphically.12 Programmatic recommenda-
Using Situation Analysis to Improve Reproductive Health Programs 101
BA
SIC
ST
UD
Y F
IND
ING
S
& T
HE
IR U
TIL
IZAT
ION

tions and commitments to ameliorative action aresometimes made prior to the dissemination semi-nar and presented for approval. Often, however,the drafting of such recommendations forms anintegral part of the seminar itself. A final report isthen produced, which describes both the studyresults and the programmatic recommendations.
Because many Situation Analysis studies areundertaken for a national program, a decentralizeddissemination strategy has emerged that explicitlyincludes the presentation of results to subnationallevels of the program. This strategy has been fol-lowed in Burkina Faso, Ghana, Kenya, Nigeria, andZimbabwe, and has been most fully exploited inSenegal. Diop et al. (1996) describe how this decen-tralized strategy was developed for the firstSituation Analysis study in Senegal. In summary, itconsisted of four phases:1. Analyzing the data by administrative region2. Planning and organizing the regional dissemi-
nation seminars3. Facilitating the 1-day seminars4. Synthesizing the regional-level results and pro-
grammatic recommendations into a regionalreportThe objective of disseminating the results in this
manner was twofold: to maximize the number ofpeople at different levels of the program whowould hear of the results, and to enable regionaland district-level managers to develop recommen-dations and action plans that would be based on thefindings from their clinics. In the implementation ofthis decentralized strategy, remarkable differencesemerged between national- and regional-level man-agers with regard to the perceived strengths andweaknesses of the programs (see Diop et al.[1996:173] for examples). This outcome reinforcedthe resolve of the PNPF to strengthen its decentral-ized approach to program management. It has alsoresulted in subsequent Situation Analysis studiesbeing planned and disseminated at both the nation-al and regional levels (as was the case with the sec-ond Senegal study in 1996 [Tour� et al., 1997b]).
To learn more from managers themselves abouthow best to maximize the dissemination and uti-lization of Situation Analysis study results, tworegional workshops were convenedÑone atNairobi, Kenya, in May 1996 (Leonard, 1997) and
another in Dakar, Senegal, in June 1997. Programmanagers and others who had played an active rolein implementing Situation Analysis studies and uti-lizing their results participated in these workshops.The major suggestions made were as follows:■ Ensure early and broad participation by service
providers and managers from the regional anddistrict levels so they can help identify the infor-mation to be collected and select the sample.
■ Extend dissemination to all levels of the pro-gram, including clinics, so that all providersand managers are aware of the programÕsstrengths and weaknesses and can take appro-priate action themselves.
■ Integrate data from Situation Analysis studieswith data from other sources so that managerscan have a broader picture of the relationshipsbetween the demand for and use of family plan-ning and service-delivery activities.
■ Although standardized instruments exist,ensure that each Situation Analysis study is tai-lored to meet the specific needs of the program,whether to plan future interventions, monitorand evaluate ongoing activities, or describe theoverall program functioning.These suggestions are relatively easy to imple-
ment, and to a large extent have been incorporatedin the more recent Situation Analysis studies.13
CONCLUSION
The ways in which the Situation Analysis approachcan be used have increased over time. From a toolused to describe the functioning and quality of fam-ily planning services provided at health facilities ata particular point in time, the approach has broad-ened in its application to serve more evaluativepurposes. In addition to assessments of entire fam-ily planning programs over time, the approach hasbeen adopted for evaluations of specific service-delivery interventions. As this volume demon-strates, data from several studies can be used aswell for secondary analyses that compare differentprograms and allow generalizations about patternsof service delivery. The utilization of the approachhas also mirrored changes in the field of familyplanning and reproductive health generally,
102 Clinic-Based Family Planning and Reproductive Health Services in Africa
through the development of quality-of-care indica-tors that can be measured empirically, and throughthe development of modules that allow reproduc-tive health services other than family planning tobe described and assessed. Although tremendousprogress has been made in a short period of time,there is scope for wider utilization of the approach,particularly for research studies aimed at exploringthe impact of service quality on family planningand fertility behavior by linking facility- and popu-lation-based data.
REFERENCES
Askew, I., B. Mensch, and A. Adewuji. 1994. ÒIndicatorsfor measuring the quality of family planning servicesin Nigeria.Ó Studies in Family Planning, 25,5:268Ð283.
Askew, I., K. Miller, and B. Mensch. 1995. ÒKey indica-tors for measurement of quality of family planningservices.Ó Paper presented at The EVALUATIONProjectÕs Service Delivery Working Group Meeting,Washington, D.C., October.
Baakile, B., N. Maggwa, L. Maribe, and R. Miller. 1996.A Situation Analysis of the Maternal and ChildHealth/Family Planning (MCH/FP) Program inBotswana. Prepared by the Africa OR/TA Project II incooperation with the Ministry of Health MCH/FPUnit, Family Health Division. Gaborone, Botswana.
Bertrand, J., R. Magnani, and J. Knowles. 1993.Handbook of Indicators for Family Planning ProgramEvaluation. The EVALUATION Project, CarolinaPopulation Center, Chapel Hill, North Carolina.
Brown, L., M. Tyane, J. Bertrand, D. Lauro, M. Abou-ouakil, and L. deMaria. 1995. ÒQuality of care infamily planning services in Morocco.Ó Studies inFamily Planning, 26,3:154Ð168.
Bruce, J. 1990. ÒFundamental elements of the quality ofcare: A simple framework.Ó Studies in FamilyPlanning, 21,2:61Ð91.
Buckner, B., A. Tsui, A. Hermalin, and C. McKaig, Eds.1995. A Guide to Methods of Family Planning ProgramEvaluation, 1965Ð1990. The EVALUATION Project,Carolina Population Center, Chapel Hill, NorthCarolina.
Diop, N., A. Cerulli, and D. Sanogo. 1996. ÒRegionaldissemination of SenegalÕs Situation Analysis studyresults: A promising way to maximize OperationsResearch utilization.Ó African Journal of Fertility,Sexuality and Reproductive Health, 1,2:169Ð173.
Fisher, A. 1993. ÒFamily planning in Africa: A summaryof recent results from Operations Research studies.ÓIn Africa Operations Research and Technical AssistanceProject: End-of-Project Conference, Nairobi, 4Ð7 October.Population Council, New York.
Fisher, A., J. Laing, J. Stoekel, and J. Townsend. 1991.Handbook for Family Planning Operations ResearchDesign. Population Council, New York.
Fisher, A., K. Miller, and R. Miller. 1998. ÒSituationAnalysis: Assessing the functioning and quality ofthe service delivery environment.Ó In Tsui, A. and J.Phillips, Eds., Methods for Evaluating Family PlanningProgram Impact. Oxford University Press, Oxford,United Kingdom.
Hardee, K., B. Janowitz, J. Stanback, and M. Villinski.1998. ÒWhat have we learned from studying changesin service guidelines and practices?Ó InternationalFamily Planning Perspectives, 24,2:84Ð90.
Huntington, D., B. Mensch, and N. Toubia. 1993. ÒAnew approach to eliciting information about inducedabortion.Ó Studies in Family Planning, 24,2:120Ð124.
Huntington, D., B. Mensch, and V. Miller. 1996. ÒSurveyquestions for the measurement of induced abortion.ÓStudies in Family Planning, 27,3:155Ð161.
Jain, A. 1989. ÒFertility reduction and the quality offamily planning services.Ó Studies in Family Planning,20,1:1Ð16.
Kim, Y. and C. Lettenmaier. 1995. Tools to Assess FamilyPlanning Counseling: Observation and Interview. JohnHopkins School of Public Health Center forCommunication Programs, April.
Leonard, A., Ed. 1997. Situation Analysis: How Can WeUse It Better? Report of a workshop on strengtheningthe utilization of Situation Analysis for planning,managing, and evaluating reproductive health ser-vices, Nairobi, Kenya, May 29Ð31, 1996. PopulationCouncil, Nairobi, Kenya.
Maggwa, N. and I. Askew. 1997. Integrating STI/HIVManagement Strategies Into Existing MCH/FPPrograms: Lessons From Case Studies in East andSouthern Africa. Population Council, Nairobi, Kenya.
Maribe, L., N. Maggwa, I. Askew, and K. Miller. 1997.Using a Rapid Assessment Approach to Evaluate theQuality of Care in an Integrated Program: The Experienceof the Family Health Division, Ministry of Health,Botswana. Population Council, Nairobi, Kenya.
Measham, D., K. Stein, and B. Winikoff. 1996. TheUnmet Family Planning Needs of Breastfeeding Women:Lessons from Nigeria and Senegal. Report of TechnicalAssistance provided by the Africa OperationsResearch and Technical Assistance Project II toWellstart International and the Population CouncilÕsEbert Program. Population Council, New York.
Mensch, B., M. Arends-Kuenning, and A. Jain. 1996.ÒThe impact of the quality of family planning ser-vices on contraceptive use in Peru.Ó Studies in FamilyPlanning, 27,2:59Ð75.
Miller, R. and R. Frerichs. 1992Ð1993. ÒAn integratedapproach to Operations Research for strengtheningfamily planning programs: A case example inKenya.Ó International Quarterly of Community HealthEducation, 13,3:183Ð199.
Using Situation Analysis to Improve Reproductive Health Programs 103
BA
SIC
ST
UD
Y F
IND
ING
S
& T
HE
IR U
TIL
IZAT
ION

Miller, R., K. Miller, L. Ndhlovu, J. Solo, and O. Achola.1996. ÒA comparison of the 1995 and 1989 KenyaSituation Analysis study findings.Ó African Journal ofFertility, Sexuality, and Reproductive Health,1,2:162Ð168.
Miller, R., A. Fisher, K. Miller, L. Ndhlovu, N. Maggwa,I. Askew, D. Sanogo, and P. Tapsoba. 1997. TheSituation Analysis Approach to Assessing FamilyPlanning and Reproductive Health Services: A Handbook.Population Council, New York.
Samara, R., B. Buckner, and A. Tsui. 1996. UnderstandingHow Family Planning Programs Work: Findings fromFive Years of Evaluation Research. The EVALUATIONProject, Carolina Population Center, Chapel Hill,North Carolina.
Sloan, N., C. Quimby, B. Winikoff, and N. Schwalbe.1995. Guidelines and Instruments for a SituationAnalysis of Obstetric Services. Population Council,New York.
Solo, J., A. Cerulli, R. Miller, I. Askew, and E. Pearlman.1998. Strengthening the Utilization of Family PlanningOperations Research: Findings from Case Studies inAfrica. Africa OR/TA Project II, Nairobi, Kenya.
Stein, K. 1996. ÒService quality among women receivingMCH and family planning services.Ó African Journalof Fertility, Sexuality, and Reproductive Health,1,2:146Ð152.
Tour�, I., N. Diop, A. Diallo, and D. Sanogo. 1997a.Evaluation des programmes de sant� de la reproduction.Prepared by the Africa OR/TA Project II in coopera-tion with the Minist�re de la Sant� et de lÕActionSociale, and Programme National de PlanificationFamiliale, Dakar, Senegal.
Tour�, I., N. Diop, and D. Sanogo. 1997b. Indicateurs delÕobjectif strategique. Report of Technical Assistanceprovided by the Africa OR/TA Project II to theMinist�re de la Sant�. Dakar, Senegal.
Valadez, J. 1991. Assessing Child Survival Programs inDeveloping Countries: Testing Lot Quality AssuranceSampling. Department of Population andInternational Health, Harvard School of PublicHealth, Boston, Massachusetts.
Valadez, J., R. Transgrud, M. Mbugua, and T. Smith.1997. ÒAssessing family planning service-deliveryskills in Kenya.Ó Studies in Family Planning,28,2:143Ð150.
NOTES
1 The study in Mali was requested and funded by theUSAID-funded community-based distribution (CBD)program (implemented by the Population Council).The study in Mauritania was requested and fundedby the United Nations Population Fund (UNFPA).Both studies were undertaken by the CentredÕEtudes et de Recherche sur la Population pour le
D�veloppement (CERPOD). The studies inCameroon and Guinea were funded and undertakenthrough the USAID-supported Africa OperationsResearch and Technical Assistance (OR/TA) ProjectII.
2 For example, within the USAID system there areprojects devoted solely to supporting logistics, man-agement, training, IEC, research, etc.
3 The three problems were missed opportunities toeducate MCH clients about family planning, littleinformation on tubal ligation given during familyplanning counseling, and long waiting times at clinics.
4 To give just one example, the time spent byproviders interacting with clients is frequently felt tobe too short. Situation Analysis studies collect dataon the duration of client-provider interactions. Thusit would be relatively easy to ascertain the averagetime spent with clients, whether this varies with theclientÕs characteristics, whether it affects the amountof information exchanged, and so on.
5 Data sets are available upon request from thePopulation Council, New York.
6 A similar approach is planned for Zambia, in thatthe sample includes both experimental and compari-son clinics; the baseline study was completed in1996. To date, however, no attempt has been made todevelop a set of indicators that will be used to makecomparisons in the future.
7 This evaluation strategy is known by researchers as aÒpre-intervention post-intervention nonequivalentcomparison groupÓ design, which is a form of quasi-experiment (Fisher et al., 1991).
8 The LQAS approach has its origins in industrial qual-ity assurance and was adapted for evaluating prima-ry healthcare interventions in developing countries(e.g., Valadez, 1991). More recently, the LQASapproach has been used to evaluate family planningtraining interventions in Kenya (Valadez et al., 1997).
9 Unfortunately, it was not possible to collect datafrom all experimental and comparison clinics duringthe national study.
10 This intervention consists of three broad activities:training staff; equipping clinics with medical sup-plies, laboratory tests, and all contraceptive meth-ods; and establishing a mechanism to facilitate clientfollow-up.
11 This study is part of an ongoing program of researchbeing undertaken by the Population Council (withfunding from the Rockefeller Foundation) to addressthe issue of measuring the impact of improving ser-vice quality.
12 In Ghana, The Futures Group International assistedthe MOH in presenting the data via user-friendlysoftware, similar to the EASEVAL software used topresent DHS data.
13 Solo et al. (1998) drew similar conclusions in theirreview of lessons learned on how to increase the uti-lization of results from OR studies generally.
104 Clinic-Based Family Planning and Reproductive Health Services in Africa

III. FACTORSAFFECTING QUALITY
5
Determinants ofQuality of FamilyPlanning Services: ACase Study of Kenyaprovides a detailed look at the relationship between the readiness of a facility to deliverfamily planning services andthe quality of services receivedby clients.
6
Unrealized Qualityand MissedOpportunities inFamily PlanningServicesexamines how existingresources could be utilizedmore effectively to improve the quality of family planningservices.
7
Urban and RuralFamily PlanningServices: Does ServiceQuality Really Differ?presents findings that challenge the common expectation that urban familyplanning services are superiorto rural services.


Using data from the 1995 Situation Analysis conduct-ed in Kenya, this chapter analyzes the readiness andquality of family planning programs and the role ofclientsÕ personal characteristics to assess whether thereis a relationship between how well prepared a facilityisÑin terms of infrastructure, equipment and sup-plies, and staff trainingÑto deliver family planningservices, and the quality of services received by clients.The analysis leads to the following conclusions:
■ Only provider training in long-term or perma-nent contraceptive methods, such as NOR-PLANT¨ and female sterilization, is related tothe providerÕs mentioning those methods toclients. No similar relationship exists for short-term methods, such as combined oral contra-ceptives (COCs) and condoms.
■ Discussions with clients on IUDs, NORPLANT¨,and spermicides are related to the facilityÕs pre-paredness to provide those methods, whereasdiscussions with clients on injectables, con-doms, and COCs are not.
■ The availability of medical equipment, such asblood pressure machines, at a facility isbelieved to motivate providers to use thatequipment for assessing medical contraindica-tions to certain contraceptive methods.
■ There is an association among the presence ofcertain information, education, and communi-cation (IEC) materials (specifically contracep-tive samples and anatomical models) at a facil-ity, their use in counseling, and the amount ofinformation given to clients about their methodof choice.
■ Client characteristics play a mediating role inthe way services are provided. Providers useclient characteristics not only to identify themost suitable method, but also to restrict accessto contraception. Specifically, marital statusand number of children have the greatest influ-ence on which methods providers mention toclients. Married women are more likely to hearabout progestin-only pills (POPs), condoms,and IUDs, and women with more children areless likely to hear about any method other thanfemale sterilization. On the other hand, clientcharacteristics have no significant impact onwhether a client is told about the advantagesand side effects of a method or about the abili-ty to switch methods if she so desires.
■ There is an association between the clientÕseducational level and the information shereceives on how to use a method, its disadvan-tages, and what to do in case of a problem.Clients with secondary education are muchmore likely than clients with primary educationto be told about problem management.
The overall conclusion of the analysis is thatreadiness indicators are not always directly relat-ed to quality indicators. For example, specifictraining on family planning methods doesimprove quality of care in terms of both counsel-ing and the use of IEC materials with clients.However, general family planning training doesnot have the same impact on counseling and isnot associated with our indicators of technicalcompetence.
FAC
TO
RS
AF
FE
CT
ING
QU
AL
ITY
Determinants of Quality of Family Planning Services: A Case Study of Kenya 107
KEY POINTS AND CONCLUSIONS
Determinants of Quality of Family Planning Services: A Case Study of Kenya
5


BACKGROUND
Several Situation Analysis studies conducted insub-Saharan Africa since 1989 have identifiedweaknesses in the regionÕs family planning pro-grams in terms of availability, functioning, andquality of family planning services (see Chapter 3).As discussed in Chapter 1, a major contribution ofSituation Analysis has been the ability to identifyprogram weaknesses and suggest interventions toimprove program planning and operations.Interventions usually aim at improving the healthfacility infrastructure (see Chapter 11), under theassumption that improvements in infrastructurecomponents lead to better service quality forclients. This chapter presents an analysis of therelationship between health facility infrastructureand service quality.
The analysis of service quality in this chapter isbased on the Bruce-Jain conceptual framework(Bruce, 1990), an adapted version of which isdepicted in Figure 5-1. The health facility infra-structure, or readinessÑbox A, Facility Prepared-ness, in the figure1Ñconsists of five elements: (1)contraceptives and supplies; (2) physical facilitiesand equipment; (3) staff training and attitudes; (4)supervision and management; and (5) information,education, and communication (IEC) materials andactivities. It is postulated that having fully pre-pared health facilities leads to improved servicequality (box C), broadly defined as (1) methodchoice, (2) information given to clients, and (3)technical competence.
ClientsÕ personal characteristics (box B) are alsohypothesized to affect service quality. The services
that providers offer to clients are mediated by con-sideration of the clientÕs age, marital status, numberof children, and educational level. In turn, improvedservice quality is hypothesized to have a positiveimpact on contraceptive behavior and demographicoutcomes (box D), namely clientsÕ knowledge, satis-faction, health, and contraceptive use; the total fer-tility rate; and contraceptive prevalence.
Since the mid-1980s, there have been a numberof quality-of-care studies based on the Bruce-Jainframework, yet there has been limited research onthe relationships among the components of theframework shown in Figure 5-1. This despite thefact that researchers have been keenly interested indetermining the effects of service quality onwomenÕs behavior and demographic outcomes(Bertrand et al., 1995; Veney et al., 1993; Beegle,1995; Feyisetan and Ainsworth, 1994; Oliver, 1995).This issue is of interest to both researchers and pro-gram managers for a number of reasons.Historically, population researchers were con-cerned mainly with population growth. Quality ofcare did not become a central concern until elabo-rated by Bruce and Jain in 1990. Hence family plan-ning programs were assessed largely for theirpotential impact on demographic outcomes, suchas contraceptive prevalence, adoption, continua-tion, and total fertility rate. More recently, recom-mendations from and responses to the 1994International Conference on Population andDevelopment (ICPD) have added impetus to con-cerns about clientsÕ health and satisfaction.
In examining the impact of health facility infra-structure on service quality, it is important to notethat extensive evidence from Situation Analysis
FAC
TO
RS
AF
FE
CT
ING
QU
AL
ITY
Determinants of Quality of Family Planning Services: A Case Study of Kenya 109
Determinants of Quality of Family Planning Services: A Case Study of KenyaLewis Ndhlovu
5

studies in the region and other studies shows awide variability in the infrastructure of health facil-ities in sub-Saharan countries (see Chapter 3). Thisvariability suggests that the quality of servicesclients receive is likely to vary as well. It is there-fore important to investigate the factors that deter-mine quality. It would be unrealistic to expect uni-form standards of quality for all programs (Jain etal., 1992), but it is important to identify elements ofthe infrastructure that are correlates of quality.
ClientsÕ views about service quality indicatethat, in addition to good interpersonal relationswith providers, they consider facility infrastructureto be important. For example, they perceive facili-ties to be of good quality if they have adequatesupplies and equipment for medical examinations(Ndhlovu, 1995; Collins et al., 1996; United Nations
Development Programme, World Bank, and WHO1994). Haddad and Fournier (1995) describe astudy in Zaire in which villagers stated that if thenearest health facility lost its equipment (for exam-ple, a microscope), they would seek services fromanother facility, even if it were farther away. Astudy by Tsui (1980) in rural Mexico corroboratesthe importance clients attach to the availability ofmedical supplies and equipment for examinations.Therefore, an analysis of the relationship betweeninfrastructure and quality can assist in understand-ing clientsÕ views of service quality and incorporat-ing those views into the services provided (Veneyet al., 1993).
Situation Analysis studies reveal that access toand quality of services are restricted by service pro-viders based on certain background characteristics
110 Clinic-Based Family Planning and Reproductive Health Services in Africa

of clients (see Chapter 8). For example, serviceproviders report that they consider the clientÕs age,number of children, and marital status, as well asspousal consent, to be important factors in whatcontraceptives they recommend to clients. Data onthe personal characteristics shown in box B inFigure 5-1 (age, marital status, number of children,and education) is analyzed below with respect tothe elements of quality shown in box C. Thehypothesis is that providers base their decisions onpolicy guidelines recommended by the Ministry ofHealth.
DATA AND METHODS
This chapter uses Kenya as an illustrative casestudy to analyze the relationships among facilitypreparedness, client characteristics, and the quali-ty of services offered at health facilities. Thoughthe Bruce-Jain framework has been used extensive-ly by researchers, it does not provide means oflinking the large array of indicators of facilityinfrastructure and service quality. Therefore, thefirst task of this analysis was to identify salientindicators in terms of logical connection, impor-tance, and relevance. The process of identifyingthese indicators and the possible links among theminvolved consultations with program managers,researchers, and service providers.
This analysis is based on a 1995 SituationAnalysis study of 254 health facilities in Kenya,including 473 interviews with providers and 241observations of new family planning clients.2 Of thesampled service delivery points (SDPs), 58% are inthe governmental sector, which provides the majori-ty of health services in Kenya. However, these facili-ties have been facing a gradual deterioration in infra-structure since the late 1980s. Nairobi CityCommission (NCC) health facilities, which consti-tute 17% of the sample, represent a municipalauthority that serves densely populated urban areas,and these facilities tend to have better resources thangovernment centers. The rest of the sample consistsof nongovernmental organization (NGO)-sectorSDPs, which are supported by the Family PlanningAssociation of Kenya, Marie Stopes International,and the Christian Association of Kenya.
In addition, facilities can be divided into hospi-tals, health centers, and dispensaries. Hospitals(24% of the sample) are generally best endowed interms of staff, equipment, and range of servicesoffered. Health centers (48% of the sample) anddispensaries (28%) have fewer resources. Dispen-saries are the smallest units of service delivery inKenya, and they are nearest physically to themajority of the population.
Table 5-1 shows the hypothesized relationshipsbetween several elements of readiness that areinvestigated in this chapter and various indicatorsof quality. (Annex 5-1 lists the specific indicators ofreadiness, quality of care, and client characteristicsused for this analysis.) The indicators under theelements of readiness shown in the center columnof Table 5-1 are measured mainly at the SDP level,and the indicators of quality in the righthand col-umn are measured at the client level. However, inorder to relate readiness to quality, the two units ofanalysis must be the same. For this analysis, thecomparison is carried out on the SDP level, soresults from the client level are averaged to giveoverall results for each SDP.
The readiness indicators are fairly straightfor-ward, having either a ÒyesÓ or ÒnoÓ response foreach SDP that is taken directly from the inventoryand staff provider responses. For example, there isa yes/no response at the SDP level for the presenceof a flip chart at an SDP. The only exception is indi-cators of staff training, which are taken at the stafflevel. An SDP may have two or more providers,each with different levels of training. For thisanalysis, if an SDP has at least one provider withthe training of interest, it receives a ÒyesÓ on indicators measuring the presence of trainedproviders.
Assigning yes/no scores to the quality indica-tors is a bit more complex since they are usuallybased on several client observations. For example,suppose five clients were observed at an SDP thathas a flip chart, and the flip chart was used withthree of the five. In this analysis, if an action istaken with half or more of observed clients at anSDP, that SDP receives a ÒyesÓ on that quality indi-cator. Otherwise the SDP receives a Òno.Ó In thisway, SDP-level indicators of readiness and qualitycan be correlated.
FAC
TO
RS
AF
FE
CT
ING
QU
AL
ITY
Determinants of Quality of Family Planning Services: A Case Study of Kenya 111

It is also important to note certain limitations ofthe data. First, the quality indicators are based on avarying number of observations of client-providerinteractions per facility. Of the 254 health facilitiesvisited during the study, just over half (53%) had atleast one new family planning client observed. Ofthe latter facilities, 53% had only one clientobserved, 27% had two, 11% had three, and 9% hadmore than three. The remaining facilities, at whichrevisit clients but no new family planning clientswere observed, were excluded from this analysis.Revisit clients were excluded from the analysisbecause the Ministry of Health policy guidelinesdo not require the performance of extensive proce-dures for these clients, and this limited the indica-
tors of quality that could be observed. Thus forthese facilities, it is not possible to describe thequality of services offered.
Second, the use of summary scores to charac-terize client-provider interactions needs cautiousinterpretation. A typical maternal and child health(MCH)/family planning facility in Kenya has anaverage of one to two nurse midwives providingservices, and the care providers gave during theirinteraction with clients on the day of the study visitis assumed to be representative of the quality ofservices delivered at that facility. This assumptionhas some validity since clients usually do notreceive services from a single provider, but arecounseled and examined by a number of different
112 Clinic-Based Family Planning and Reproductive Health Services in Africa
Table 5-1. Hypothesized relationships between readiness and quality indicators
These readiness elements . . . . . . may affectthese quality indicators
Readiness elements affecting method choice
Readiness elements affecting informationexchange
Readiness elements affecting technical competence
Staff training
Equipment and supplies foreach methodb
Staff trainingc
Use of IEC materialse
Equipment for client assessmentf
Staff trainingc
Individual methods mentioned
Total methods mentioneda
Individual methods mentioneda
Total methods mentioneda
Information given on acceptedmethodd
Information given on acceptedmethodd
Client assessmentg
Client assessmentg
a Methods include combined oral contraceptives (COCs), progestin-only pills (POPs), condom, IUD, injectable,NORPLANT®, lactational amenorrhea method (LAM), vasectomy, and female sterilization.
b Equipment for COCs, condoms, and spermicide: blood pressure machine and scale; equipment for IUDs:gloves, cotton wool, swabs, speculum, tenaculum, and light source; equipment for injectables: cotton wool,antiseptic lotion, needles, and syringes; equipment for voluntary surgical contraception (VSC): minilap kit,gloves, local anesthesia, needles/syringes, sutures/needles, and antiseptic lotion.
c Training includes clinical family planning skills; IUD insertion/removal; mini-laparotomy/local anesthetic(ML/LA); NORPLANT® insertion/removal; vasectomy; management/planning; supervision/evaluation; infor-mation, education, and communication (IEC) skills; LAM; and natural family planning (NFP) counseling.
d Information given includes how to use method, advantages, disadvantages, side effects, management of sideeffects, and possibility of switching methods.
e IEC materials include flip charts, contraceptive samples, and anatomical models.f Equipment includes blood pressure machine and scales.g Client assessment includes medical history, last menstrual period (LMP), weight, blood pressure, and physi-
cal exam.

nurses before they finally obtain their contracep-tives. For the client, the process of receiving care isan experience more with a health facility than withindividual providers.
Although the Bruce-Jain framework proposessix elements of quality, only three of these are dis-cussed in this chapter. Measurements of interper-sonal relations from quantitative surveys have notyielded satisfactory findings, and hence this indi-cator is excluded. ClientsÕ responses about inter-personal relations are subject to a courtesy bias andlack variation (see the discussion under Q.1 inChapter 3). Another element of the framework thatis subject to the same problem is mechanisms toensure continuity of care. Similarly, only a fewindicators of infrastructure that have logical anddirect links with service quality indicators areexamined; other infrastructure indicators, includ-ing supervision, management, and recordkeeping,could not be analyzed because relevant informa-tion for these indicators is not available.
The analysis of the relationship between clientcharacteristics and quality of family planning ser-vices is carried out a bit differently. Information onclientsÕ personal characteristics was gathered inexit interviews with the clients. As shown in Table5-2, this information is hypothesized to affectmethods mentioned and information given to theclient about the accepted method during the con-sultation. Because both the exit interview and theobservation were conducted at the client level, nocombining of scores is necessary. The unit of analy-sis is the client.
Most of the analysis presented here relies on sim-ple statistical techniques: frequency distributions,cross-tabulations, and measures of association basedon the chi square test of independence. Multivariateanalysis using logistic regression is applied to thedata on clientsÕ personal characteristics.
The next section presents the results of theanalysis with regard to readiness indicators affect-ing methods discussed with clients, readiness indi-cators affecting information given to clients abouttheir selected method, readiness indicators affect-ing client assessment, client characteristics affect-ing methods discussed with clients, and finallyclient characteristics affecting information given toclients about their selected method. The final
section of the chapter presents conclusions drawnfrom these results.
RESULTS
Readiness Indicators Affecting MethodsDiscussed with Clients
The availability of family planning methods athealth facilities is hypothesized to influence themethod choice actually offered to clients. Whereservice providers are able to counsel clients on avariety of methods, they may be more likely tomeet client needs. In this section, provider trainingand equipment availability for individual methods(readiness) are related to the methods discussedwith clients and the total number of methods men-tioned to clients (quality).
Staff TrainingSince the early 1980s, the Kenyan government hasinvested heavily in the training of staff for repro-ductive health. The 1995 Situation Analysis studyshowed that the majority of service providers inMCH/family planning units had attended at least
FAC
TO
RS
AF
FE
CT
ING
QU
AL
ITY
Determinants of Quality of Family Planning Services: A Case Study of Kenya 113
Table 5-2. Hypothesized relationshipbetween client characteristics andquality indicators
These personalcharacteristics . . . . . . may affect these
quality indicators
Age
Marital status
Number of children
Age of youngestchild
Educational level
Individual methodsmentioneda
Information given onaccepted methodb
a Methods include COCs, POPs, condom, IUD,injectable, NORPLANT®, LAM, vasectomy, andfemale sterilization.
b Information given includes how to use method,advantages, disadvantages, side effects, manage-ment of side effects, and possibility of switchingmethods.

one family planning course since their post-basictraining. These courses covered IUD insertion andremoval, clinical family planning skills, mini-laparo-tomy/local anesthetic (ML/LA), NORPLANT¨
insertion and removal, vasectomy, counseling forvoluntary surgical contraception (VSC), manage-ment/planning, supervision and evaluation, IECskills, lactational amenorrhea method (LAM), andnatural family planning (NFP) counseling. Adetailed analysis of this training shows that thecourses varied in duration, depth, and breadth, andmany of the topics covered were found to overlap.
Though it is widely assumed that trainingimparts skills to service providers and leads toimprovements in service quality, this may notalways be the case (Maggwa and Askew, 1997; seealso Chapter 11). The present analysis shows thatonly specific training in long-term and permanentmethods is related to higher rates of mentioningthese methods to clients. For example, at 62% offacilities with at least one provider trained infemale sterilization, the majority of clients weretold about ML/LA. In contrast, the majority ofclients were told about ML/LA at only 41% ofSDPs without providers trained in this method.Generally, clients who attended health facilitieswith at least one provider trained in ML/LA,NORPLANT¨, and vasectomy counseling weremore likely to be told about these methods, as wellas LAM. However, no type of refresher trainingappears to increase discussion of any other meth-ods: no differences were observed with regard toindividual methods discussed with clients at facili-ties with providers trained in clinical family plan-ning, IUD insertion/removal, or IEC.
Staff training can also be related to the totalnumber of methods discussed with clients, specifi-cally with whether the majority of clients at an SDPwere told about five or more methods. Only train-ing in long-term methods, NFP, and LAM appearsto be related to mentioning more methods toclients. For example, where there was at least oneprovider trained in ML/LA, five or more methodswere discussed with the majority of clients at 52%of facilities, compared with 35% of facilities withproviders not so trained. A similar pattern wasobserved for facilities with providers trained inNORPLANT¨, NFP, and LAM. As above, however,
no difference in total methods mentioned to clientswas observed at SDPs with at least one providertrained in clinical family planning, IUD inser-tion/removal, or IEC skills.
The observed influence of training in long-termand permanent methods may be due to the fact thatproviders with these skills are more likely to belocated at hospitals. However, providers at healthcenters and dispensaries are expected to referclients for methods they do not provide. In fact,there is only a small difference in the mean numberof methods providers discussed with clients at hos-pitals (six methods), health centers (six methods),and dispensaries (five methods). This finding leadsto the conclusion that the number of methods men-tioned is not a function of the size of the SDP. (SeeChapter 6 for further discussion of providers notdiscussing available methods.)
Commodity and Equipment AvailabilityReferrals aside, the availability of contraceptivemethods and the equipment needed to providethose methods are prerequisites for successful pro-vision of any method. In this analysis, an SDP isconsidered fully prepared to deliver a method if ithad all the equipment and supplies necessary, andif it had not experienced a stockout of the method inthe 6 months prior to the study visit. Annex 5-1 liststhe equipment deemed necessary for each methodby an expert group of researchers and family plan-ning managers. We now turn to the relationshipbetween preparedness to deliver a method andwhether that method is mentioned to the majorityof clients. Note that male and female sterilizationprocedures were offered at only a limited numberof facilities and thus could not be analyzed.
The results vary by method. For the IUD, NOR-PLANT¨, and spermicides, the majority of clientswere told about these methods at more SDPs thatwere prepared to deliver them, as compared withthose that were not prepared. For Depo Provera,condoms, and oral contraceptives, which were gen-erally available in most facilities, discussions dur-ing counseling sessions did not appear to be relat-ed to the availability of these methods. The lack ofvariation in the availability of these methods mayexplain the lack of correlation with their beingmentioned to clients.
114 Clinic-Based Family Planning and Reproductive Health Services in Africa

Other indicators of method choice include thetotal number of methods discussed and whetherclients were asked about their method preference.However, these indicators were not correlated withavailability of equipment and contraceptive sup-plies at health facilities.
Readiness Indicators Affecting Information Given to Clients About Their Selected Method
Successful use of contraceptives is dependentupon proper and sufficient counseling for clients.In this section, information given to clients abouttheir selected method includes how to use it, itsadvantages, its disadvantages, its side effects,management of side effects, and the possibility ofswitching methods. In general, it appears thatproviders discussed important information withclients: how to use the method (86% of clients),side effects (65%), advantages (66%), and disad-vantages (62%). Less than half of clients were toldabout the possibility of switching methods.Though the figures appear high for individual dataitems, providers did not offer a full range of infor-mation about each method (see Chapter 6 for fur-ther discussion of complete counseling).
Staff TrainingStaff training, particularly in IEC skills, is hypoth-esized to increase the amount of information givento clients about their chosen method. Indeed, train-ing in IEC skills, NFP, and VSC counseling appearsto have an effect on the amount of informationgiven to clients. The majority of clients receivedinformation about the advantages, disadvantages,and management of side effects of their chosenmethod at a larger proportion of facilities with atleast one provider trained in IEC skills, NFP, andVSC counseling, as compared with facilities with-out these trained providers (see Chapter 3 for moreinformation on the relationship between trainingin IEC skills and observed counseling).
The association with NFP and LAM training isparticularly strong. For example, in 78% of facili-ties where providers were trained in NFP, themajority of clients were told about the disadvan-tages of their accepted method, compared with
63% at SDPs where providers were not so trained.Likewise, the majority of clients were told aboutdisadvantages at 90% of SDPs with at least oneprovider trained in LAM, compared with 62% offacilities where no providers had this training.Courses in these two user-dependent methods areknown to pay strong attention to counseling andinformation exchange so clients can understandand properly use their method. The above findingssuggest that intensive training in counseling forservice providers can improve the quality of infor-mation given to clients about their acceptedmethod.
Training in clinical family planning skills andother specific methods showed no relationshipwith information given to clients about theiraccepted method. This finding appears to be par-ticularly notable for providers trained in IUDinsertion/removal, who showed no difference inthe information given clients about that method.
IEC UseIEC materials normally found at health facilitiesinclude flip charts, brochures, pamphlets, samplesof contraceptives, posters, anatomical models,charts, and calendars. The extent to whichproviders used IEC materials during counselingvaried considerably. Most of the clients were coun-seled with contraceptive samples (80% of clients),followed by anatomical models (25%) and flipcharts (14%). Other IEC materials were used in lessthan 5% of client-provider interactions.3
A provider can use IEC materials only if theyare physically present at the SDP, which is a mea-sure of facility readiness. In this section, the use ofIEC materials is analyzed with respect to the infor-mation given to clients on their accepted method.This comparison relates an indicator associatedwith both quality and readiness (IEC use) to anindicator of quality (information given to clients).
Providers who used contraceptive samples andanatomical models during counseling sessionsappeared to provide more contraceptive informa-tion to clients. Table 5-3 shows that at SDPs whereproviders generally used these IEC materials, themajority of clients were more likely to be toldabout important aspects of their accepted method.The relationship appears to hold as well for use of
FAC
TO
RS
AF
FE
CT
ING
QU
AL
ITY
Determinants of Quality of Family Planning Services: A Case Study of Kenya 115

flip charts, although the results are not significant.In general, these results indicate an associationamong the presence of certain IEC materials, theiruse in counseling, and the amount of informationgiven to clients about their selected method.
Readiness Indicators Affecting Client Assessment
There has been extensive debate among researchersand program managers about the importance andrelevance of medical procedures such as takingclientsÕ weight or blood pressure for family plan-ning services (see Chapters 8 and 9). One view isthat medical examinations constitute a barrier to ser-vices for women who need contraceptives, in partbecause of the associated cost, and in part because ofthe inconvenience, discomfort, or embarrassmentexperienced by many clients. Accordingly, theKenyan program and many others in Africa nolonger require clients to have medical examinationsbefore most contraceptives can be prescribed (seeChapter 9). Another view, supporting sentiments
expressed at the ICPD, encourages a broaderapproach to family planning services, wherebymedical examinations are viewed as an importantcomponent of womenÕs overall health. Evidencefrom qualitative studies conducted in Kenya showsthat clients place great value on medical examina-tions, and this finding may indicate that clients viewmedical examinations as an important dimension ofservice quality (Solo et al., 1998; Ndhlovu, 1995).
In the present analysis, assessment of clients formedical contraindications based on LMP, medicalhistory, blood pressure, and weight was found tobe nearly universal in Kenyan health facilities.Providers generally asked clients about their LMP(94%) and medical history (81%). They also tookthe clientÕs blood pressure (87%) and weight (82%).(See Chapter 9 for more discussion).
Equipment Availability Availability of equipment at MCH/family plan-ning units can motivate providers to use it forassessing clientsÕ medical conditions. This is animportant point since data collectors found that in
116 Clinic-Based Family Planning and Reproductive Health Services in Africa
Table 5-3. Percent of SDPs at which the majority of clients were given information ontheir accepted method, by use or nonuse of certain IEC materials
% OF SDPs AT WHICH MOST CLIENTS WERE TOLD:Were Majority of How Advantages Disadvan- Side Possible ManagementClients Counseled to Use of tages of Effects of to ofUsing IEC Materials? Method Method Method Method Switch Problems
Flip ChartYes (n=100) 100 60 70 70 60 67No (n=75) 91 71 65 75 45 69
Samples of Contraceptives
Yes (n = 179) 92 73 67 68 45 71No (n = 43) 63a 39a 42a 52b 26b 50b
Anatomical ModelsYes (n = 46) 100 83 78 85 54 84No (n = 108) 82a 69a 57a 63a 36b 60a
a p < 0.01.b p < 0.05.
Note: Posters were not observed to be used for counseling, and pamphlets or brochures were used in only 10interactions.

some facilities, providers borrowed equipmentfrom other departments in order to conduct med-ical examinations, a situation that discouragesproviders from taking blood pressure or weight.The point is supported by the data on availabilityand use of blood pressure machines and scales. Atfacilities where a blood pressure machine wasavailable, 97% of providers took blood pressure,compared with 53% who had to borrow. Staff witha scale located at the MCH/family planning unitwere nearly twice as likely to take weight as com-pared with those who had to borrow.
Staff TrainingTable 5-4 shows the percentage of facilities atwhich most clients were assessed with various pro-cedures, by whether the facility had at least oneprovider trained in various methods and skills. Formost combinations of assessment and training,there appears to be a very weak relationship. Onthe other hand, among SDPs with a providertrained in IUD insertion/removal or in clinicalfamily planning, the majority of clients were morelikely to be assessed with medical history, LMP,and blood pressure. Among SDPs with a providertrained in IEC skills, the majority of clients weremore likely to be assessed with medical history,blood pressure, and physical exam. These resultsindicate that, at least for courses in clinical familyplanning, IEC skills, and IUD insertion/removal,provider training may be associated with more fre-quent performance of certain client assessments.
Client Characteristics Affecting Methods Discussed with Clients
This section investigates the relationship betweenclient characteristics and the methods they are toldabout, irrespective of the readiness of the facility.Client characteristics included in this analysis areage, marital status, parity, age of youngest child,reproductive intentions, and educational level.Providers can use these characteristics to identifyand recommend the contraceptives most suitableto each client. On the other hand, findings fromSituation Analysis studies strongly suggest thatproviders use the same characteristics to limitclientsÕ access to contraceptives (see Chapter 8).
The various client characteristics were investi-gated with respect to factors providers mentionedto clients concerning their accepted method (Table5-5). Results that are indicated as statistically sig-nificant in Table 5-5 reveal the client characteristicsconsidered most important by providers duringclient counseling.
Of the five client characteristics included inTable 5-5, marital status and number of children hadthe greatest influence on which methods were men-tioned. In general, married women were far morelikely to hear about POPs, condoms, and IUDs thanwere unmarried clients. And women with morechildren were decreasingly likely to hear about anymethod except female sterilization. Interestingly,women with secondary education were almost sixtimes as likely to hear about POPs as women withless education, but this relationship does not holdfor the other methods. The ages of clients and theirchildren do not figure significantly in the picture.Note also that Depo Provera is not included in Table5-5 because no client characteristics appeared toinfluence discussions about this method.
That providers offer different levels of counsel-ing based on clientsÕ education and marital statuscan likely be attributed to the providersÕ social val-ues. The findings suggest that providers considersex and use of contraceptives to be a preserve ofmarital relationships.
Client Characteristics Affecting Information Given
As noted earlier, important information thatshould be provided to clients about their acceptedmethod includes how it should be used, its advan-tages, its disadvantages, possible side effects, man-agement of side effects, and the possibility ofswitching to other methods. In this section, thesesix items of information are examined relative toclientsÕ background characteristics.
Interestingly, client characteristics had no sig-nificant effect on whether a client was told aboutthe advantages of the selected method, its possibleside effects, or the ability to switch methods. Thisfinding indicates that for some of the most impor-tant information, providers do not discriminateamong clients based on their characteristics.
FAC
TO
RS
AF
FE
CT
ING
QU
AL
ITY
Determinants of Quality of Family Planning Services: A Case Study of Kenya 117

Results for the other information are shown inTable 5-6. ClientsÕ level of education had a signifi-cant effect on whether they were told about how to
use a method, its disadvantages, and how to man-age side effects. As compared with women havingno education, those with secondary education
118 Clinic-Based Family Planning and Reproductive Health Services in Africa
Table 5-4. Percentage of health facilities where most clients were assessed for medicalconditions, by whether at least one provider had attended different training courses
% OF FACILITIES AT WHICH MOST CLIENTSWERE ASSESSED WITH TEST/PROCEDURE
Did Facility Have At Least Medical Blood PhysicalOne Provider Trained in: History LMP Weight Pressure Exam
IUD Insertion/RemovalYes (n=183) 91 98 86 92 74No (n=19) 67a 83a 75 58a 50
Clinical Family PlanningYes (n=166) 91 99 85 91 71No (n=36) 75a 85a 85 75a 70
ML/LAYes (n=31) 91 43 30 96 65No (n=171) 82 36 17 76a 57
NORPLANT® Insertion/Removal
Yes (n=38) 92 96 80 96 72No (n=163) 87 97 86 86 71
VasectomyYes (n=39) 100 100 96 96 91No (n=163) 85 95 82 86 66a
VSC CounselingYes (n=81) 92 93 86 94 78No (n=121) 85 100a 84 84a 66
SupervisionYes (n=69) 90 100 85 93 76No (n=133) 87 94 84 86 69
IEC SkillsYes (n=62) 97 100 92 97 86No (n=140) 84a 95 81 84a 64a
NFPYes (n=74) 94 98 85 90 67No (n=128) 84 95 85 87 75
LAMYes (n=44) 93 100 85 96 70No (n=158) 87 95 85 86 71
a p < 0.05.

were 11 times more likely to be told about man-agement of side effects, while those with primaryeducation were 6 times more likely. Interestingly,since providers generally do not ask clients abouttheir educational attainment, this judgment is like-ly to be based on visual appraisal of clients.
In addition, the clientÕs age was shown to be animportant factor in the information given byproviders. Women over age 20 were nearly six
times as likely to be counseled about managementof contraceptive side effects than were adolescents.
ProvidersÕ decisions about counseling based onclientsÕ age and number of children have their ori-gins in the Kenyan family planning proceduresmanual of 1988, which was most probably fol-lowed by the majority of providers in 1995 (Cege etal., 1988). The manual states that women over age35 are contraindicated for COCs and POPs. The
FAC
TO
RS
AF
FE
CT
ING
QU
AL
ITY
Determinants of Quality of Family Planning Services: A Case Study of Kenya 119
Table 5-5. Effects of clients’ background characteristics on odds of being told aboutvarious contraceptivesa
ODDS RATIOSb
Client Fem.Characteristic COCs POPs Condom IUD LAM Steril.
Age 15-19 1.00 1.00 1.00 n/a 1.37 0.4720-29 1.20 0.92 0.58 0.98 0.3430-46 0.80 0.60 0.35 1.00 1.00
Marital StatusMarried 1.00 1.00 1.00 1.00 1.00 0.85Not married 0.34 0.19c 0.41d 0.35d 0.51 0.62
No. of Children0-1 1.00 1.00 1.00 1.00 1.00 1.002-4 0.77 0.75 0.65 0.38d 0.48 0.635+ 0.24d 0.27d 0.26d 0.15c 0.12d 1.36
Age of Youngest ChildUp to 1 year 1.00 1.00 n/a n/a n/a 1.001-2 years 1.44 1.39 0.40> 2 years 2.03 0.94 0.84
Highest EducationalLevel
No school 1.00 1.00 1.00 1.00 1.00 1.00Primary 1.89 2.32 1.54 2.07 1.33 1.94Secondary 2.67 5.91d 1.73 2.27 2.73 1.32
Significance of Model 0.006 0.000 0.002 0.000 0.009 0.014
No. of Observations 213 213 225 226 210 209
a A multivariate logistic regression was carried out for each method.b The odds ratio indicates the likelihood of the provider mentioning a particular contraceptive to a client given
the client’s background characteristics. For example, the top left box shows that a client in the age group 20–29is 1.20 times as likely to hear about COCs than a client who is in the 15–19 year age group, whereas a clientin the 30–46 year age group is only 0.80 times as likely to hear about COCs as one in the age group 15–19.
c p < 0.01.d p < 0.05.
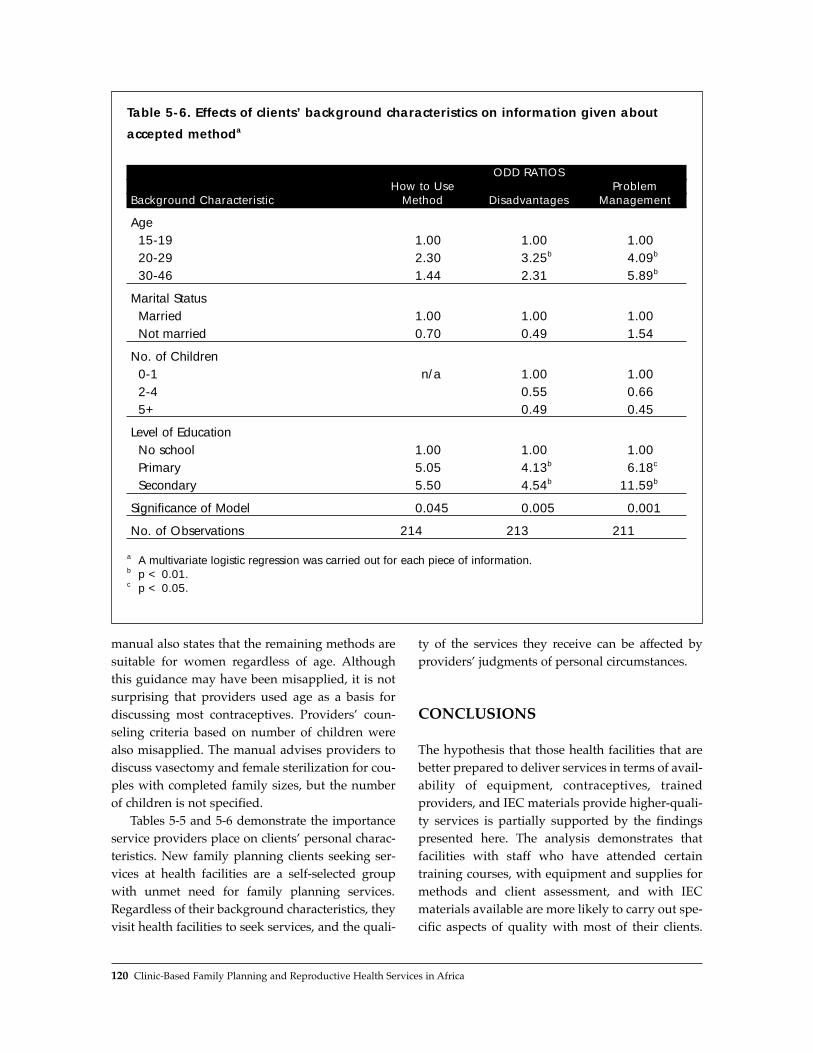
manual also states that the remaining methods aresuitable for women regardless of age. Althoughthis guidance may have been misapplied, it is notsurprising that providers used age as a basis fordiscussing most contraceptives. ProvidersÕ coun-seling criteria based on number of children werealso misapplied. The manual advises providers todiscuss vasectomy and female sterilization for cou-ples with completed family sizes, but the numberof children is not specified.
Tables 5-5 and 5-6 demonstrate the importanceservice providers place on clientsÕ personal charac-teristics. New family planning clients seeking ser-vices at health facilities are a self-selected groupwith unmet need for family planning services.Regardless of their background characteristics, theyvisit health facilities to seek services, and the quali-
ty of the services they receive can be affected byprovidersÕ judgments of personal circumstances.
CONCLUSIONS
The hypothesis that those health facilities that arebetter prepared to deliver services in terms of avail-ability of equipment, contraceptives, trainedproviders, and IEC materials provide higher-quali-ty services is partially supported by the findingspresented here. The analysis demonstrates thatfacilities with staff who have attended certaintraining courses, with equipment and supplies formethods and client assessment, and with IECmaterials available are more likely to carry out spe-cific aspects of quality with most of their clients.
120 Clinic-Based Family Planning and Reproductive Health Services in Africa
Table 5-6. Effects of clients’ background characteristics on information given about
accepted methoda
ODD RATIOSHow to Use Problem
Background Characteristic Method Disadvantages Management
Age 15-19 1.00 1.00 1.0020-29 2.30 3.25b 4.09b
30-46 1.44 2.31 5.89b
Marital StatusMarried 1.00 1.00 1.00Not married 0.70 0.49 1.54
No. of Children0-1 n/a 1.00 1.002-4 0.55 0.665+ 0.49 0.45
Level of EducationNo school 1.00 1.00 1.00Primary 5.05 4.13b 6.18c
Secondary 5.50 4.54b 11.59b
Significance of Model 0.045 0.005 0.001
No. of Observations 214 213 211
a A multivariate logistic regression was carried out for each piece of information.b p < 0.01.c p < 0.05.

However, many of the hypothesized relationshipsbetween readiness and quality are not borne out bythese findings (see also Chapter 6).
The choice of methods offered to clients appearsto be improved by the presence at an SDP ofproviders trained in long-term methods. In addi-tion, training in NFP and LAM is associated withoffering more methods to each client, possiblyreflecting the strong counseling component of thesemethods. However, training in clinical family plan-ning and IEC skills is not associated with offeringan expanded choice of methods. The presence ofcommodities and equipment for a method is relat-ed to whether clients hear about the method, butonly for IUDs, NORPLANT¨, and spermicides. ForCOCs, injectables, and condoms, no relationshipwas found, possibly because virtually all healthfacilities in Kenya offer these methods.
Detailed counseling about contraceptives wasshown to be influenced by the type of IEC materi-als available at a health facility and used duringcounseling sessions. Use of available contraceptivesamples and anatomical models was significantlyassociated with more detailed information given toclients about contraceptives, and the use of flipcharts showed a similar, but not significant, associ-ation. It is not clear whether providers who usedthese materials were highly motivated to do so, ortheir availability at health facilities led to theirgreater use.
Moreover, the presence of providers trained inIEC skills, NFP, and LAM was found to be relatedto an increase in certain information given to themajority of clients on their accepted method. Thisfinding is encouraging, although the presence ofproviders trained in clinical family planning and inIUD insertion/removal did not appear to have aneffect on the information given to clients. Theimplication is that providers who attend courseswith strong counseling components are likely toserve clients better. Therefore, it is recommendedthat family planning courses for service providerscover training in counseling skills, including theuse of IEC materials.
Client assessment through weight and bloodpressure is strongly affected by the presence of thenecessary equipment in the MCH/family planningunit itself. In addition, the presence of at least one
provider trained in clinical family planning, IECskills, or IUD insertion/removal is associated withincreased performance of certain client assess-ments. Interestingly, the presence of staff who hadattended a range of other training coursesappeared to have no significant effect on the clientassessments carried out. Taking clientsÕ weightappears to be a fairly universal practice. The use-fulness of carrying out these assessments is debat-ed, but the data show that the relationship betweentraining and carrying out these assessments is notconsistent.
Finally, providersÕ consideration of clientsÕ per-sonal characteristics in the provision of servicesposes a challenge to the Kenyan program. In somecases, such as the provision of injectables or tellingclients about the advantages and side effects oftheir chosen method, providers do not appear to beaffected by clientsÕ personal characteristics.However, the methods presented to clients doappear to be affected by their marital status andparity. In addition, informing clients about how touse their method, its disadvantages, and how tomanage side effects is clearly related to the clientsÕage and educational status. Many SituationAnalysis studies in Africa have tended to concen-trate on age, spousal consent, and number of chil-dren as barriers to clientsÕ access to contraceptives(see Chapter 8). This analysis has shown thatanother factor, the clientÕs educational level, playsa critical role in providersÕ decisions about the ser-vices offered to clients. This finding calls for moreexploration of these provider biases in order todetermine effective ways of overcoming them,thereby providing quality services in a more equi-table manner.
REFERENCES
Beegle, K. 1995. ÒThe quality and availability of familyplanning services and contraceptive use inTanzania.Ó Living Standards Measurement StudyWorking Paper No. 114, Policy ResearchDepartment, World Bank, Washington, D.C.
Bertrand J., K. Hardee, R. Magnani, and M. Angle. 1995.ÒAccess, quality of care and medical barriers in fam-ily planning programs.Ó International Family PlanningPerspectives, 21:64Ð69.
FAC
TO
RS
AF
FE
CT
ING
QU
AL
ITY
Determinants of Quality of Family Planning Services: A Case Study of Kenya 121

Bruce, J. 1990. ÒFundamental elements of the quality ofcare: A simple framework.Ó Studies in FamilyPlanning, 21,2:61Ð91.
Cege, L.W., M.A. Odipo, et al. 1988. Family PlanningProcedure Manual for Health Workers. Division ofFamily Health, Nairobi, Kenya.
Collins, D., J. Quick, S. Musau, and D. Kraushaar. 1996.Health Financing Reform in Kenya: The Fall and Rise ofCost Sharing, 1989Ð1994. Management Sciences forHealth, Boston.
Feyisetan, B. and M. Ainsworth. 1994. ÒThe impact ofthe availability, price and quality of services on thedemand for contraception in Nigeria.Ó LivingStandards Measurement Study Working Paper No.108, Policy Research Department, World Bank,Washington, D.C.
Haddad, S. and P. Fournier. 1995. ÒQuality, cost and uti-lization of health services in developing countries: Alongitudinal study in Zaire.Ó Social Science andMedicine, 40,6:743Ð753.
Jain, A., J. Bruce, and B. Mensch. 1992. ÒSetting stan-dards of quality in family planning programs.ÓStudies in Family Planning, 23,6:392Ð395.
Maggwa, N. and I. Askew. 1997. Integrating STI/HIVManagement Strategies into Existing MCH/FPPrograms: Lessons from Case Studies in East andSouthern Africa. Population Council, Nairobi, Kenya.
Ndhlovu, L. 1995. Quality of Care in Family PlanningService Delivery in Kenya: ClientsÕ and ProvidersÕPerspectives. Population Council, Nairobi, Kenya.
Oliver, R. 1995. ÒContraceptive use in Ghana: The roleof service availability, quality and price.Ó LivingStandards Measurement Study Working Paper No.111, Policy Research Department, World Bank,Washington, D.C.
Solo, J. et al. 1998. ÒImproving the management of sexu-ally transmitted infections among MCH/FP clientsat the Nakuru Municipal Council health clinics.ÓUnpublished draft. Population Council, New York.
Tsui, V.D. 1980. ÒUnderutilization of health centres inrural Mexico: A qualitative approach to evaluationand planning.Ó Studies in Family Planning,11,4:145Ð153.
United Nations Development Programme, World Bank,and World Health Organization. 1994. ÒQuality ofhealth care for women: Report of a workshop held inBudapest, Hungary, October 1994.Ó SpecialProgramme for Research and Training in TropicalDiseases; Division of Family Health; SpecialProgramme of Research, Development and ResearchTraining in Human Reproduction, WHO; and FordFoundation.
Veney, J., R. Magnani, and P. Gorbach. 1993.ÒMeasurement of the quality of family planning ser-vices.Ó Population Research and Policy Review,12:243Ð259.
NOTES
1 The term Òhealth facility infrastructureÓ is defined asthe enabling environment for delivering services,which in turn is commonly referred to as ÒfacilitypreparednessÓ or Òprogram subsystems.Ó Theseterms are often used interchangeably in this chapter.
2 These sample sizes differ slightly from those cited inChapter 1 because of the different methods used toweight the data.
3 These results do not account for the presence orabsence of the IEC materials at the SDP.
122 Clinic-Based Family Planning and Reproductive Health Services in Africa

FAC
TO
RS
AF
FE
CT
ING
QU
AL
ITY
Determinants of Quality of Family Planning Services: A Case Study of Kenya 123
Annex 5-1: Indicators of Readiness,Quality, and Client Characteristics Used for This Analysis
Readiness Indicators
Equipment and SuppliesPercentage of facilities with gloves, cotton wool, swabs, speculum, tenaculum, and light sourcePercentage of facilities with cotton wool, antiseptic lotion, needles, and syringesPercentage of facilities with blood pressure machines and scalesAvailability of minilap kit, gloves, local anesthesia, needles/syringes, and antiseptic lotion
Information, Education, and CommunicationPercentage of client-provider interactions using flip chart for counselingPercentage of client-provider interactions using contraceptive samples for counselingPercentage of client-provider interactions using anatomical models for counseling
Staff TrainingPercentage of health facilities with staff trained in IUD insertion/removalPercentage of health facilities with staff trained in clinical family planningPercentage of health facilities with staff trained in mini-laparotomy/local anestheticPercentage of health facilities with staff trained in NORPLANT® insertion/removalPercentage of health facilities with staff trained in vasectomy counselingPercentage of health facilities with staff trained in supervision/evaluationPercentage of health facilities with staff trained in IEC skillsPercentage of health facilities with staff trained in natural family planningPercentage of health facilities with staff trained in lactational amenorrhea method (LAM)
Quality-of-Care Indicators
Methods DiscussedPercentage of interactions in which clients were counseled about combined oral contraceptives (COCs)Percentage of interactions in which clients were counseled about progestin-only pills (POPs)Percentage of interactions in which clients were counseled about condomsPercentage of interactions in which clients were counseled about the IUDPercentage of interactions in which clients were counseled about NORPLANT®
Percentage of interactions in which clients were counseled about LAMPercentage of interactions in which clients were counseled about vasectomyPercentage of interactions in which clients were counseled about Depo ProveraPercentage of interactions in which clients were counseled about female sterilization

124 Clinic-Based Family Planning and Reproductive Health Services in Africa
Information Given About MethodPercentage of clients counseled about how to use method acceptedPercentage of clients counseled about advantages of method acceptedPercentage of clients counseled about disadvantages of method acceptedPercentage of clients counseled about possible side effects of method acceptedPercentage of clients counseled about possibility of switchingPercentage of clients counseled about management of method problems
Technical Competence: Assessment for Medical ConditionsPercentage of health facilities where medical history was takenPercentage of health facilities where clients were asked about last menstrual periodPercentage of health facilities where clients had their weight takenPercentage of health facilities where clients had their blood pressure takenPercentage of health facilities where physical examinations were conducted
Clients’ Personal CharacteristicsAge: percentage of clients in defined age groups (15–19 years, 20–29 years, 30–46 years)Marital status: percentage of clients in defined marital status groups (married, not married)Number of children: percentage of clients with number of children falling into defined categories (0–1,
2–4, > 4)Age of youngest child: percentage of clients with children in defined age groups (up to 1 year,
1–2 years, above 2 years)Highest level of education: percentage of clients falling into defined educational categories (no school,
primary, secondary +)

The 1994 International Conference on Populationand Development in Cairo set forth the broad chal-lenge of ensuring that clients receive an adequatequality of care. In light of this emphasis, the ques-tion naturally arises of whether the resources existto meet this objective. While technological andfinancial inputs are often necessary to incorporateclosely related reproductive health services intothe scope of family planning programs, the analy-sis in this chapter suggests that substantial oppor-tunities exist to increase the quality of care and itscontribution to clientsÕ reproductive health simplyby using available resources more effectively. Thefollowing specific conclusions, based principallyon data from Botswana, Burkina Faso, Kenya,Senegal, and Zambia, are drawn:
■ The number of contraceptive options offered tonew clients seeking to space pregnancies is con-sistently fewer than the number of spacingmethods physically present in the clinic,restricting clientsÕ ability to choose the mostappropriate or desirable method.
■ Providers generally do not make use of avail-able information, education, and communica-tion (IEC) materials, which could improveclientsÕ understanding and assist them in mak-ing more fully informed decisions.
■ The majority of providers see three or fewerclients (including both family planning andmaternal and child health clients) per day, sug-gesting that a significant amount of staff time maybe available to increase the length of client visits,improve the quality of information given, andexpand the reproductive health services offered.
■ Providers commonly make use of equipmentsuch as blood pressure machines and uterinesounds when available; however, they often fail
to follow asepsis procedures during pelvicexams, even when clean water and gloves arein the exam room, putting clients at unneces-sary risk of infection.
■ Providers frequently do not inquire about theclientÕs sexual context (number and frequencyof partners, whether the partner is included inthe decision to seek contraception), and arethus unable to assess contraindications for agiven method or recommend methods appro-priate to the clientÕs situation.
■ The ability of a given method to protect againstsexually transmitted infections, and in particu-lar the dual-protection benefit of condoms, israrely discussed.
Although these conclusions focus on only a fewspecific aspects of the quality of care received byclients, they imply that providers can substantiallyraise the level of quality of services through suchpractical measures as improving informationexchange and observing proper asepsis procedures.In addition, in many clinics a significant amount ofstaff time appears to be untapped and could be har-nessed to broaden the scope of services.
Taking advantage of these unused resourceswill arguably increase the cost-efficiency ofresource use, but will not be cost-free. It willrequire establishing appropriate protocols thatdefine the minimum information to be given toclients and the operational meaning of offeringchoice of methods, and that identify as a clear pri-ority ensuring the safety of services. It will also benecessary to shift the emphasis of staff training tofocus more on providing higher-quality servicesand being sensitive to clientsÕ expressed needs, andto implement a supervisory program that regular-ly supports and evaluates providers in these areas.
FAC
TO
RS
AF
FE
CT
ING
QU
AL
ITY
Unrealized Quality and Missed Opportunities in Family Planning Services 125
KEY POINTS AND CONCLUSIONS
Unrealized Quality and Missed Opportunities in Family Planning Services
6


Much of the debate following the CairoInternational Conference on Population andDevelopment (ICPD) of 1994 has centered, directlyor indirectly, on the feasibility of offering repro-ductive health services in a climate of diminishingforeign aid and limited national budgets (Potts,1996). That is, do the resources needed to meet thechallenges set forth in Cairo (and in the BeijingFourth World Conference on Women of 1995) real-ly exist? Indeed, some contend that implementa-tion of the tenets of ICPD would be detrimentalwithout additional funding: ÒÉif broader, morecomprehensive programs are attempted withoutadditional funds either coverage will be reduced orquality will decline, the most likely prospect beingthat both elements will sufferÓ (Finkle andMcIntosh, 1996:111Ð112).
There has been relatively little questioning ofthe efficiency of current resource utilization (seeZeitlin et al., 1994, for a critique of assumptionsabout and bias toward the supply-side approach incommon resource requirements analysis). Thus indiscussions about implementation of the principlesof Cairo, questions such as the following remainlargely unexamined: To what degree are existinginputs such as staff time, equipment, and suppliesactually used within standard family planning ser-vices? Are service delivery points (SDPs) and staffalready operating at full capacity? Will the changescalled for by the ICPD strain a fragile and efficientsystem, or is there room within family planningprograms to take on parts of the Cairo agendaÑright now, and with existing resources?
Traditional methods of data collection in thepopulation field typically do not cast much light on
questions of resource utilization. Two sets of dataare often the focus: one defines the amount ofmoney being spent, staff trained, clinics open, etc.,as the inputs; the other (often assumed to be corre-lated with the first) may track the steady increasein immunization, or in this case numbers of contra-ceptive users or couple-years of protection (CYPs),as an indication that the program is working andthat resources are being well allocated (Barberisand Harvey, 1997; Janowitz and Bratt, 1994).Unfortunately, comparison of these broad inputsagainst broad output models leaves muchunknown, or, as some have pointed out, ÒÉtreat[s]the operations of the family planning program as aÔblack boxÕÉÓ (Bertrand et al., 1994:11). Theseanalyses can tell us nothing about how equipment,supplies, and staff time are expended for clinicoperations.
By using a sample of observations of what isactually happening in the clinic setting, along withinformation on supplies and resources available ata site, Situation Analysis can provide a far moreaccurate picture of what resources are being uti-lized in the process of client care, and whether infact those resources are being used optimally.1 Withthis data, one can begin to understand how theavailable contraceptives, staff time, and clinicalequipment are being mobilized, as well as whethercritical discussions with clients are taking place.
The hypothesis explored in this chapter is thatthere is underutilization of existing resources,which diminishes quality and choice for clients.The chapter examines observation-based data fromfive sub-Saharan countries in order to begin gaug-ing the gap between resource availability and the
FAC
TO
RS
AF
FE
CT
ING
QU
AL
ITY
Unrealized Quality and Missed Opportunities in Family Planning Services 127
Unrealized Quality and Missed Opportunities in Family Planning ServicesNicole Haberland, Kate Miller, Judith Bruce, and Goli Fassihian
6

care clients actually receive. This gap, which weterm Òunrealized quality,Ó represents the untappedcapacity of SDPs to deliver care of adequate quali-ty. Operationally, this means there are program-matic inputs, such as contraceptives or clinicalinstruments, within an SDP that are not used oroffered in the course of client care. For instance,although a clinic may be ready to provide a broadrange of methods in terms of its contraceptivestocks, clients may not be being told about themethods available.
We should caution that the discussion here is notbased on an experimental analysis that began with ahypothesis, then developed methods, and collectedand analyzed data accordingly. We do begin with ahypothesis, but use existing data sets that were nottailored to our inquiry. This analysis is thus intend-ed to be preliminary and indicative, and to con-tribute to discussions on policy and programoptions and spur more structured investigation.
METHODS
Data from Situation Analysis studies conducted infive countries of sub-Saharan Africa were used forthis analysis: Botswana (1995), Burkina Faso (1995),Kenya (1995), Senegal (1994), and Zambia (1996).(See Chapter 2 for descriptions of these countriesÕfamily planning programs and the relevant studyreferences, and Chapter 1 for information on thesample sizes and sampling plans for these fivestudies.) These studies were chosen for the analysisbecause they collected the relevant information.For example, earlier Situation Analyses in C�tedÕIvoire and Tanzania did not include many of thesalient indicators of client-provider interaction andinformation exchange. Even among the five datasets included here, some do not include all the rel-evant information for our selected indicators.
The question of the potential gap between whatis available at the SDP and what clients receive(unrealized quality) was not included in the origi-nal Situation Analysis studies. Moreover, thedegree to which sexuality, partnership, and socialcontext are addressed in the client-providerexchange was not a central concern when theSituation Analysis instruments were initially
developed. Thus the scope of this analysis, as wellas the way different indicators are defined, is limit-ed accordingly. Nonetheless, the available dataallow us to examine the degree to which four com-ponents of existing resources and opportunities arecurrently employed by family planning programs:■ Contraceptive method choice■ Use of staff time (client load)■ Use of clinic equipment and water■ Consideration of social context and clientsÕ sex-
ual relationshipsThe results of the analysis for each of these com-
ponents are given below. The discussion includes adescription of the particular indicators used toexplore the extent of unused quality in each case.
RESULTS
Contraceptive Method Choice
The importance of choice, outlined by womenÕshealth advocates and incorporated in the Bruce-Jain quality-of-care framework developed in thedecade before Cairo (Bruce, 1990), was under-scored by the ICPD (Programme of Action, 1994).Expanding choice has been an active policy agendafor policy makers and program managers in manycountries, as well as for nongovernmental organi-zations (NGOs) and international agencies. Somemeasures seek to improve choiceÑand reproduc-tive rightsÑby removing barriers such as eligibili-ty criteria (see Chapter 8), as well as targets andevaluation criteria that effectively promote onemethod over others or even pressure clients. Othermeasures seek to expand the range of contracep-tive options available at the receiving point. Wefocus here on the latter, as well as the interperson-al exchanges that make the available contraceptiveoptions ÒrealÓ to clients.
Providing an expanded contraceptive methodmix allows the client to choose the contraceptivethat best meets her own reproductive needs, aswell as being compatible with the sexual behaviorof the client and her partner. For instance, a womanconcerned about the risk of sexually transmittedinfections (STIs)/HIV has the option of choosing amethod that protects against disease transmission,
128 Clinic-Based Family Planning and Reproductive Health Services in Africa

FAC
TO
RS
AF
FE
CT
ING
QU
AL
ITY
Unrealized Quality and Missed Opportunities in Family Planning Services 129
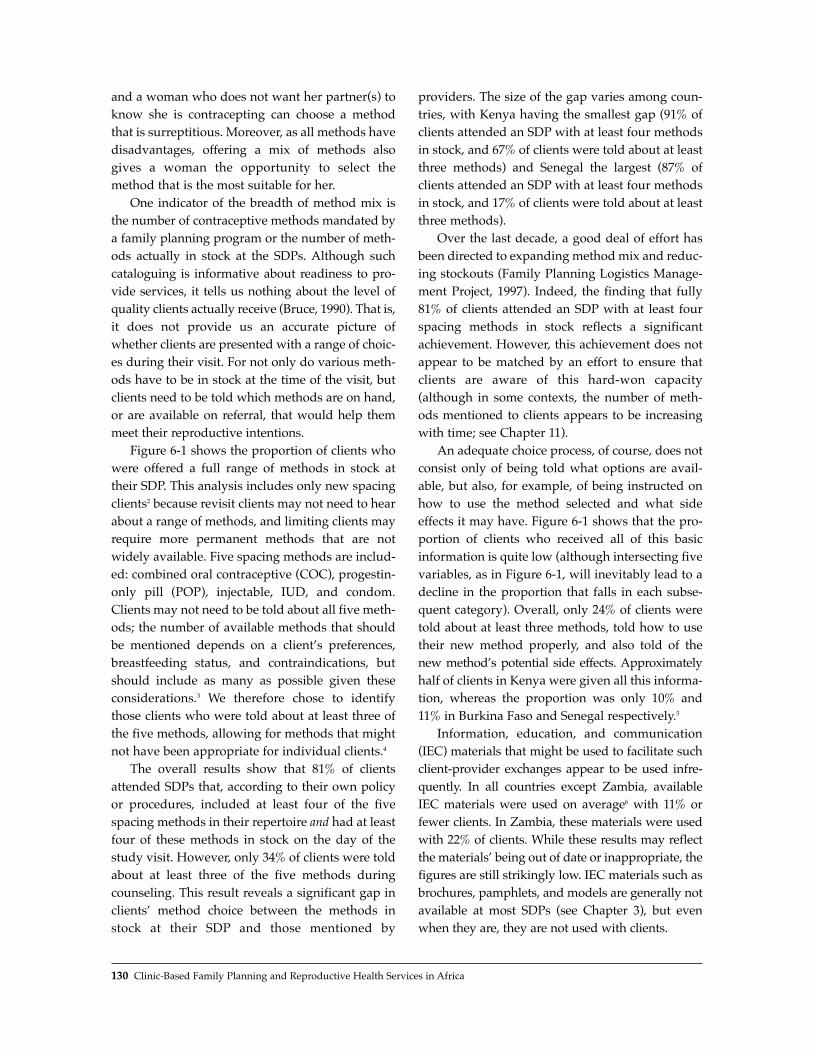
and a woman who does not want her partner(s) toknow she is contracepting can choose a methodthat is surreptitious. Moreover, as all methods havedisadvantages, offering a mix of methods alsogives a woman the opportunity to select themethod that is the most suitable for her.
One indicator of the breadth of method mix isthe number of contraceptive methods mandated bya family planning program or the number of meth-ods actually in stock at the SDPs. Although suchcataloguing is informative about readiness to pro-vide services, it tells us nothing about the level ofquality clients actually receive (Bruce, 1990). That is,it does not provide us an accurate picture ofwhether clients are presented with a range of choic-es during their visit. For not only do various meth-ods have to be in stock at the time of the visit, butclients need to be told which methods are on hand,or are available on referral, that would help themmeet their reproductive intentions.
Figure 6-1 shows the proportion of clients whowere offered a full range of methods in stock attheir SDP. This analysis includes only new spacingclients2 because revisit clients may not need to hearabout a range of methods, and limiting clients mayrequire more permanent methods that are notwidely available. Five spacing methods are includ-ed: combined oral contraceptive (COC), progestin-only pill (POP), injectable, IUD, and condom.Clients may not need to be told about all five meth-ods; the number of available methods that shouldbe mentioned depends on a clientÕs preferences,breastfeeding status, and contraindications, butshould include as many as possible given theseconsiderations.3 We therefore chose to identifythose clients who were told about at least three ofthe five methods, allowing for methods that mightnot have been appropriate for individual clients.4
The overall results show that 81% of clientsattended SDPs that, according to their own policyor procedures, included at least four of the fivespacing methods in their repertoire and had at leastfour of these methods in stock on the day of thestudy visit. However, only 34% of clients were toldabout at least three of the five methods duringcounseling. This result reveals a significant gap inclientsÕ method choice between the methods instock at their SDP and those mentioned by
providers. The size of the gap varies among coun-tries, with Kenya having the smallest gap (91% ofclients attended an SDP with at least four methodsin stock, and 67% of clients were told about at leastthree methods) and Senegal the largest (87% ofclients attended an SDP with at least four methodsin stock, and 17% of clients were told about at leastthree methods).
Over the last decade, a good deal of effort hasbeen directed to expanding method mix and reduc-ing stockouts (Family Planning Logistics Manage-ment Project, 1997). Indeed, the finding that fully81% of clients attended an SDP with at least fourspacing methods in stock reflects a significantachievement. However, this achievement does notappear to be matched by an effort to ensure thatclients are aware of this hard-won capacity(although in some contexts, the number of meth-ods mentioned to clients appears to be increasingwith time; see Chapter 11).
An adequate choice process, of course, does notconsist only of being told what options are avail-able, but also, for example, of being instructed onhow to use the method selected and what sideeffects it may have. Figure 6-1 shows that the pro-portion of clients who received all of this basicinformation is quite low (although intersecting fivevariables, as in Figure 6-1, will inevitably lead to adecline in the proportion that falls in each subse-quent category). Overall, only 24% of clients weretold about at least three methods, told how to usetheir new method properly, and also told of thenew methodÕs potential side effects. Approximatelyhalf of clients in Kenya were given all this informa-tion, whereas the proportion was only 10% and11% in Burkina Faso and Senegal respectively.5
Information, education, and communication(IEC) materials that might be used to facilitate suchclient-provider exchanges appear to be used infre-quently. In all countries except Zambia, availableIEC materials were used on average6 with 11% orfewer clients. In Zambia, these materials were usedwith 22% of clients. While these results may reflectthe materialsÕ being out of date or inappropriate, thefigures are still strikingly low. IEC materials such asbrochures, pamphlets, and models are generally notavailable at most SDPs (see Chapter 3), but evenwhen they are, they are not used with clients.
130 Clinic-Based Family Planning and Reproductive Health Services in Africa
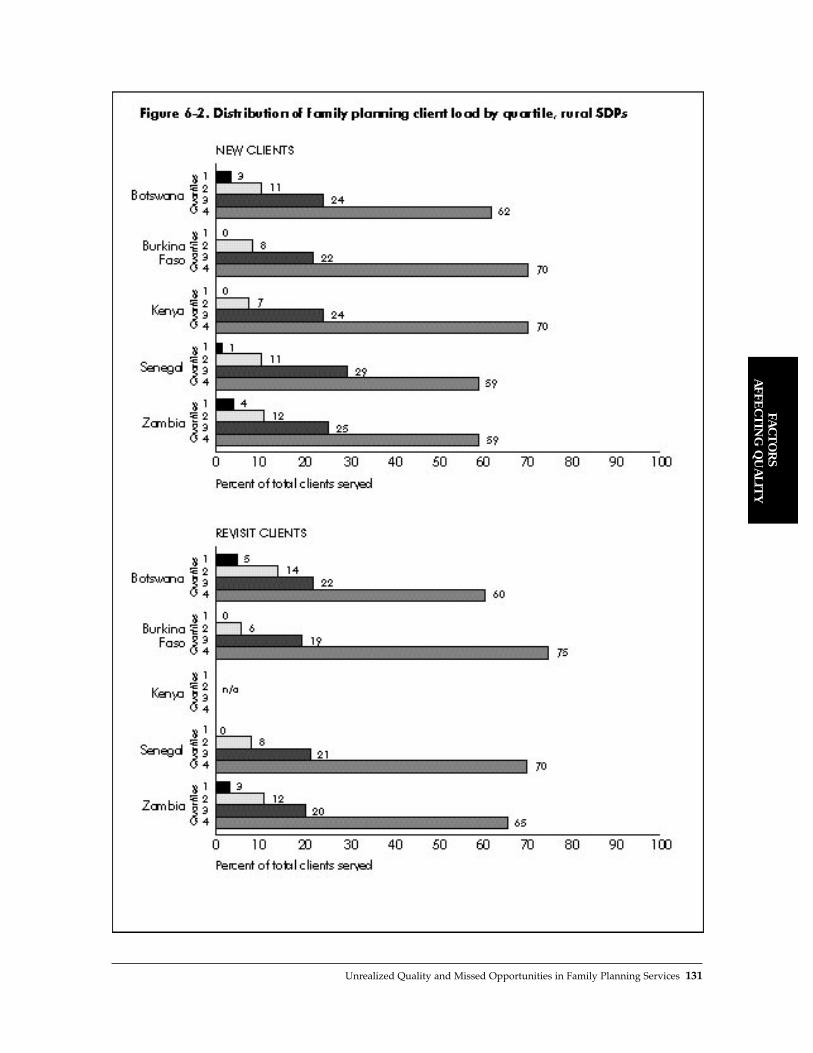
FAC
TO
RS
AF
FE
CT
ING
QU
AL
ITY
Unrealized Quality and Missed Opportunities in Family Planning Services 131

Use of Staff Time (Client Load)
One reason it may be difficult to improve quality ofcare in the context of existing resources is that clin-ics already carry a heavy client load, which placeshigh demands on providersÕ time. The profile ofclient load across SDPs in the five countries includ-ed in this analysis, however, indicates that mostclinics do not fall into this category. We groupedSDPs in the five countries into quartiles based onannual client load.7 SDPs in the first quartile havethe lightest client loads, and those in the fourthquartile have the heaviestÑwith equal numbers ofclinics placed in each quartile for a country. Theresults of this analysis (Figure 6-2) show that evenin rural areas, 60% to 75% of clients are served byonly a quarter of the SDPs (Fisher and Miller, 1996).In addition, the proportions do not changemarkedly among countries or between new andrevisit clients. Very similar results are found amongurban SDPs.
Figure 6-2 shows that some SDPs carry a dispro-portionate share of the family planning client load,which may relate to the number of staff working atthat SDP. To examine this finding, we compared theannual number of all maternal and child health(MCH)/family planning clients with the number ofdoctors, nurses, and midwives at each SDP.8 Figure 6-3 shows the number of MCH/family planningclients per day per provider served by SDPs. Overall,27% of SDPs have one client or fewer per day perprovider, and 58% of SDPs have three clients orfewer. Across countries, between 45% (Burkina Faso)and 78% (Botswana) of SDPs have three or fewerclients per day per provider. These results indicatethat most SDPs included in our analysis have a fair-ly light MCH/family planning client load, evenallowing for daily administrative and preparatorytasks that may occupy providersÕ time.8
As these figures may reflect differences in pop-ulation density, we stratified our results by ruraland urban SDPs. Since the number of users may belower in rural areas, the number of SDPs with fewclients per provider might be expected to be higherthan in urban areas. Surprisingly, 55% of SDPs inrural areas have three or fewer clients per day perprovider, a proportion only slightly lower than thatamong urban SDPs (63%). As for individual coun-
tries, only Senegal shows a higher proportion ofrural than urban SDPs with three or fewer clientsper day per provider; all other countries have theopposite pattern. This finding suggests that lowpopulation density does not fully explain the rela-tively low client-per-provider load.
Complete parity across sites cannot reasonablybe expected; access, population density, and thescope of workersÕ responsibilities all shape thepotential client/provider ratio. Moreover, the waySDPs are configured can also affect the results. Inthe Situation Analyses included here, SDPs weredefined as any facility offering family planning ser-vices, including hospitals, maternities, and healthposts. The present analysis includes all MCH andfamily planning clients, but as some SDPs alsoserve other community health needs (such as cura-tive services and emergency care), there may beother clients who make demands on providersÕtime. Presumably, such a diversity of needs is lesslikely in more specialized urban clinics. Yet the datashow that the vast majority of urban SDPs also donot appear to have particularly high client loads.
The low client/provider ratio indicates, at thevery least, that at most SDPs, overextended staff isprobably not the reason clients are not receivingadequate care as defined here. It also suggests thatthere may be substantial staff resources that can bereoriented and better deployed. For example, fam-ily planning counseling is often neglected (seeabove and Chapter 3), whereas time for counselingmay be available. Similarly, although broadeningthe range of reproductive health services offered toinclude, for instance, reproductive tract infection(RTI) diagnosis and treatment would require train-ing and stocking of appropriate tests and medica-tions, the staff time needed to provide these ser-vices may well be available.
Use of Clinical Equipment and Water
High-quality services require proper clinical proce-dures, including infection prevention. In manyhealth and family planning clinics in low-resourcesettings, the ability of program managers andproviders to ensure the use of such procedures iscompromised by the context and realities of theenvironment. In some areas, for example, water
132 Clinic-Based Family Planning and Reproductive Health Services in Africa

FAC
TO
RS
AF
FE
CT
ING
QU
AL
ITY
Unrealized Quality and Missed Opportunities in Family Planning Services 133

may not be available regularly, if at all, or the pro-gram may not be able to afford sufficient equip-ment, such as blood pressure machines, for all itsclinics. But how are such resources used in settingswhere they are available? To assess this, we lookedat whether specific physical resources availableand functioning in a clinic were used by providersduring relevant clinical procedures. Figure 6-4shows the mean proportion of new clients whoseblood pressure was taken in clinics where bloodpressure machines were available, who wereweighed in clinics where a scale was available, andwhose uterus was sounded for an IUD insertion inclinics where a uterine sound was available.
In all countries, the mean proportion ofproviders who used these available resources withnew clients was quite highÑranging from 81% to94%.10 Taken alone, the use of blood pressuremachines in settings where they were available wasalso high, ranging from 76% (Burkina Faso) to 93%(Senegal). This is a positive and heartening finding.
The appropriateness of carrying out each of theseassessments is a local decision (see the discussion inChapters 3 and 9), but the point here is that whereinstruments are available, they are being used.
Washing hands between pelvic exams is animportant step in infection prevention. Figure 6-4shows the proportion of providers at SDPs withwater available in the exam room who washedtheir hands before pelvic exams. Between 23% and88% of providers did not wash their hands before apelvic exam despite the availability of water in theexam room. In four countries, 1024 pelvic examswere observed in settings where water was avail-able in the exam room. Providers washed theirhands before only 26% of these exams, thoughthere is large variation by country.
This low proportion may be explained by theuse of gloves instead of washing (see Chapter 3), orby the providerÕs having washed hands after theprevious pelvic exam. Although the necessity ofhandwashing is debated, for our purposes the most
134 Clinic-Based Family Planning and Reproductive Health Services in Africa
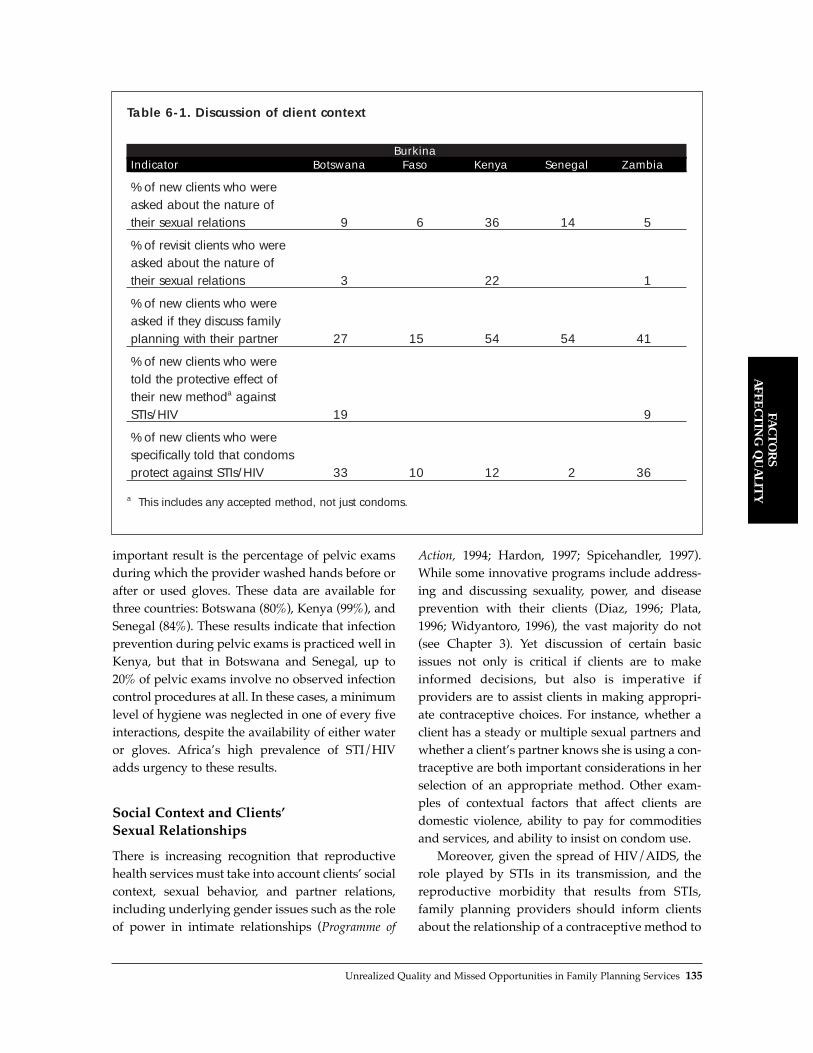
important result is the percentage of pelvic examsduring which the provider washed hands before orafter or used gloves. These data are available forthree countries: Botswana (80%), Kenya (99%), andSenegal (84%). These results indicate that infectionprevention during pelvic exams is practiced well inKenya, but that in Botswana and Senegal, up to20% of pelvic exams involve no observed infectioncontrol procedures at all. In these cases, a minimumlevel of hygiene was neglected in one of every fiveinteractions, despite the availability of either wateror gloves. AfricaÕs high prevalence of STI/HIVadds urgency to these results.
Social Context and ClientsÕSexual Relationships
There is increasing recognition that reproductivehealth services must take into account clientsÕ socialcontext, sexual behavior, and partner relations,including underlying gender issues such as the roleof power in intimate relationships (Programme of
Action, 1994; Hardon, 1997; Spicehandler, 1997).While some innovative programs include address-ing and discussing sexuality, power, and diseaseprevention with their clients (Diaz, 1996; Plata,1996; Widyantoro, 1996), the vast majority do not(see Chapter 3). Yet discussion of certain basicissues not only is critical if clients are to makeinformed decisions, but also is imperative ifproviders are to assist clients in making appropri-ate contraceptive choices. For instance, whether aclient has a steady or multiple sexual partners andwhether a clientÕs partner knows she is using a con-traceptive are both important considerations in herselection of an appropriate method. Other exam-ples of contextual factors that affect clients aredomestic violence, ability to pay for commoditiesand services, and ability to insist on condom use.
Moreover, given the spread of HIV/AIDS, therole played by STIs in its transmission, and thereproductive morbidity that results from STIs,family planning providers should inform clientsabout the relationship of a contraceptive method to
FAC
TO
RS
AF
FE
CT
ING
QU
AL
ITY
Unrealized Quality and Missed Opportunities in Family Planning Services 135
Table 6-1. Discussion of client context
BurkinaIndicator Botswana Faso Kenya Senegal Zambia
% of new clients who were asked about the nature of their sexual relations 9 6 36 14 5
% of revisit clients who were asked about the nature of their sexual relations 3 22 1
% of new clients who were asked if they discuss family planning with their partner 27 15 54 54 41
% of new clients who were told the protective effect of their new methoda against STIs/HIV 19 9
% of new clients who were specifically told that condoms protect against STIs/HIV 33 10 12 2 36
a This includes any accepted method, not just condoms.

such infections, as well as emphasize the dual pro-tection role of condoms (see Chapter 10). ClientsÕknowledge of this type of information improvesthe appropriateness of their method choice. In arecent study in Mexico, providers informed clientsabout the relationship of different contraceptivemethods to STIs, including the dangers of IUD usewhen a woman has an infection, and the fact that awomanÕs, and her partnerÕs, sexual behavior couldplace her at risk for STIs. Preliminary findings indi-cate that with this information, clients were muchbetter than medical providers at screening them-selves out of inappropriate IUD use (Langer et al.,1998).
To gauge the extent to which providers seizethe opportunity to discuss such issues with clients,we identified variables that reflect conversationsabout sexual behavior or the clientÕs context. TheSituation Analysis methodology does not includemany variables on this issue, but the more recentstudies in Botswana and Zambia included relative-ly more questions on these topics.
Table 6-1 reveals limited consideration ofwomenÕs sexual behavior, partner relations, andSTI prevention among providers. Among newclients in all countries, only 5% to 36% were askedthe nature of their sexual relationships.11 InBotswana, Kenya, and Zambia, this same questionwas asked of only 1% to 22% of revisit clients (ask-ing revisit clients about their partner relations andsexual behavior is not redundant, as sexual rela-tions change with time). Providers more frequent-lyÑthough only approximately half the time orless (15% to 54%)Ñasked new clients whether theydiscuss family planning with their partner.
Two studies looked at whether providers toldnew clients about the protection their chosenmethod offered against STIs. In Botswana, 19% ofproviders did so, and in Zambia, only 9%. All fivestudies examined whether providers told newclients about the ability of condoms to preventSTIs. Between 2% and 36% of clinicians shared thisinformation with new clients.
The overall point is that providers do not systematically discuss with clients basic aspects ofsexuality that bear on client safety and satisfaction.Yet findings from other settings, such as theInternational Planned Parenthood Federation/
Western Hemisphere Region affiliates in Brazil,Honduras, and Jamaica, indicate that providers,when properly supported and guided, can discussintimate topics such as sexuality with their clients(Becker et al., 1997).
DISCUSSION
This analysis is not definitive, but rather indicativeof the actual choice and quality of care given toclients in sub-Saharan Africa. The results presentedabove suggest that there is substantial unusedquality within current resource and service config-urations, and therefore missed opportunities tooffer better care. This overall finding challenges thenotion that services cannot be improved withoutsignificant additional resources; indeed, it appearsthat many critical resources needed to improve ser-vices are already at hand, but substantially under-utilized. We do not imply that no new funding isneeded to implement a broader array of reproduc-tive health services. Rather, we suggest that theefforts expended on broadening family planningservices might begin with using existing facilitiesand staff time more efficiently. Several more specif-ic points can be made regarding each of the fourareas discussed above.
Contraceptive Method Choice. Examination ofthe actual choice of methods given to clientsdemonstrates that it is necessary to look beyondinventories of contraceptives in the clinic storageroom. Once one begins to observe the process ofchoice from beginning to end, it becomes evidentthat the contraceptive options presented to clientsare consistently fewer than the methods physicallyavailable for distribution. Further, providers do notgenerally make use of available IEC materials. Theclient-provider interaction is a mediating variablethat can significantly reduce the options availableto the client.
Use of Staff Time. Although some staff areoverburdened with client care, the data consistent-ly show that most providers in the countries stud-ied have a light case load. Thus, it appears that considerable staff capacity remains untapped.Perhaps training, supervisory support, protocols,and appropriate rewards would enable staff to pro-
136 Clinic-Based Family Planning and Reproductive Health Services in Africa

vide better-quality services within the existing nar-row scope of services, and could also allow theexpansion of services to include other reproductiveand sexual health needs.
Use of Clinical Equipment and Water.Providers frequently use clinic equipment, such asblood pressure machines and uterine sounds, dur-ing consultations with clients. However, infectionprevention procedures during pelvic examsappear to be lacking in many settings, even wherewater and gloves are available in the exam room.
Social Context and ClientsÕ SexualRelationships. The available data show that clientcontext is not commonly discussed during familyplanning consultations. Few clinicians ask clientsabout the nature of their sexual relations, informthem of their methodÕs ability to protect againstSTIs, or explain the role of condoms in preventingdisease transmission. Addressing sexual behavior,partner relations, and power in intimate relation-ships is imperative from a public health perspec-tive, particularly in the era of HIV/AIDS. Ignoringthese aspects of the client context clearly decreasesfamily planning service quality. In addition, giventhe importance of such discussions, the SituationAnalysis methodology and other approaches usedto measure the quality of client counseling shouldgather more information on these topics.
CONCLUSION
Situation Analysis data make it possible to examinethe capacity of SDPs to offer high-quality services,as well as whether SDPs actually utilize this capaci-ty. It appears that the deficits in quality of familyplanning services are often not traceable to overex-tension, but rather to underutilization of what is athand. In short, technological and monetary inputsdo not equal quality. The presence of resources isobviously essential in terms of having a mix ofmethods, clean water, and enough staff to serveclients adequately. However, observation of what ishappening in the client-provider interaction revealsthat these tangible resources alone are not sufficient.
The problem is not that providers are negligent,but that program emphasis, protocols, supervisoryprocedures, and the like must support providers in
giving the best possible care with given resources.To maximize the degree of quality received byclients, it is necessary to (1) implement policies thatmake adequate service quality and sensitivity toclientsÕ social context clear priorities, (2) generateprotocols that guide providers in how to offer suchservice quality and conduct such discussions, (3)provide appropriate training, (4) support workersin providing a high level of care and addressingclientsÕ social context and sexual behavior, and (5)improve the amount and quality of data collectedon whether client context and sexuality are dis-cussed with clients.
There are clearly resource and cost implicationsfor such rethinking of priorities. For example,whereas staff time to take on additional servicesmay exist, providers must be trained to offer thoseservices, and whereas most health budgets allocatefunds for training, curricula need revising.However, we suggest that achieving improvedquality and a broadened scope of services requiresless new funding and more will and creative think-ing. These achievements will certainly not be free,but there are already resources on hand that can bebetter deployed or redirected.12 Much of what wesuggest to improve service quality and move familyplanning programs closer to the reproductive healthapproach put forth in Cairo is thus not an allocationof new resources, but an affirmation of client-cen-tered principles of care and the mobilization of oftenunderutilized human and material resources.
REFERENCES
Barberis, M. and P.D. Harvey. 1997. ÒCosts of familyplanning programmes in fourteen developing coun-tries by method of service delivery.Ó Journal ofBiosocial Science, 29,2:219Ð233.
Becker, J., E. Leitman, and M.F. Fathalla. 1997.ÒIntroducing sexuality within family planning: Theexperience of three HIV/STD prevention projectsfrom Latin America and the Caribbean.ÓQuality/Calidad/Qualit�. No. 8, Population Council,New York.
Bertrand, J., R. Magnani, and J. Knowles. 1994.Handbook of Indicators for Family Planning ProgramEvaluation. The Evaluation Project, UNC-ChapelHill, Chapel Hill, North Carolina.
FAC
TO
RS
AF
FE
CT
ING
QU
AL
ITY
Unrealized Quality and Missed Opportunities in Family Planning Services 137

Bruce, J. 1990. ÒFundamental elements of the quality ofcare: A simple framework.Ó Studies in FamilyPlanning, 21,2:61Ð91.
Diaz, M. 1996. ÒThe evolution of a sexuality educationprogram: From research to action.Ó In Zeidenstein, S.and K. Moore, Eds., Learning About Sexuality: APractical Beginning. Population Council, New York.
Family Planning Logistics Management Project. 1997.ÒContraceptive fact sheets: A tool for logistics advi-sors.Ó John Snow Inc., Arlington, Virginia.
Finkle, J. and A. McIntosh. 1996. ÒCairo revisited: Somethoughts on the implications of the ICPD.Ó HealthTransition Review, 6,1:110Ð113.
Fisher, A. and K. Miller. 1996. ÒConditions required atSDPs to deliver family planning services: Why somany do so little.Ó Paper presented at the AnnualMeeting of the American Public Health Association,New York.
Hardon, A. 1997. ÒReproductive rights in practice: Acomparative assessment of quality of care.Ó InHardon, A. and E. Hayes, Eds., Reproductive Rights inPractice: A Feminist Report on Quality of Care. ZedBooks, Ltd., London and New York.
Janowitz, B. and J.H. Bratt. 1994. Methods for CostingFamily Planning Services. United Nations PopulationFund (UNFPA), New York.
Kim, Y. and C. Lettenmaier. 1995. Tools to Assess FamilyPlanning Counseling: Observation and Interview. JohnsHopkins School of Public Health Center forCommunication Program, Baltimore, Maryland.
Kim, Y., C. Marangwanda, and A. Kols. 1997. ÒQualityof counseling of young clients in Zimbabwe.Ó EastAfrican Medical Journal, 74,8:4Ð5.
Kim, Y., A. Kols, and S. Mucheke. 1998. ÒInformedchoice and decision making in family planning coun-seling in Kenya.Ó International Family PlanningPerspectives, 24,1:4Ð11.
Langer A., B. Winikoff, and C. Coggins. 1998.ÒEvaluation of information and self-selection forappropriate IUD provision in a family planning clin-ic.Ó Unpublished results from a Population Councilresearch study in collaboration with INSP and IMSS,Mexico.
Pariani, S., D. Heer, and D. Van Arsdol. 1991. ÒDoeschoice make a difference to contraceptive use?Evidence from East Java.Ó Studies in Family Planning,22,6:384Ð390.
Plata, M.I. 1996. ÒBringing men and women together infamily planning clinics.Ó In Zeidenstein, S. and K.Moore, Eds., Learning About Sexuality: A PracticalBeginning. Population Council, New York.
Potts, M. 1996. ÒThe crisis in international family plan-ning.Ó Health Transition Review, 6,1:114Ð119.
Programme of Action of the International Conference onPopulation and Development. Cairo, 5Ð13 September1994.
Spicehandler, J. 1997. ÒIssues to consider in operational-izing reproductive health.Ó Advances in Contraception,13,2-3:345Ð350.
Vernon, R. 1998. ÒProviding comprehensive sexual andreproductive health care.Ó Paper presented at theAnnual Meeting of the Population Association ofAmerica.
Widyantoro, N. 1996. ÒLearning about sexualitythrough family planning counseling sessions inIndonesia.Ó In Zeidenstein, S. and K. Moore, Eds.,Learning About Sexuality: A Practical Beginning.Population Council, New York.
Zeitlin, J., R. Govindaraj, and L. Chen. 1994. ÒFinancingreproductive and sexual health services.Ó In Sen, G.,A. Germain, and L. Chen, Eds., Population PoliciesReconsidered: Health, Empowerment and Rights.Harvard School of Public Health, Boston.
NOTES
1 Population Communication Services and other orga-nizations have also developed methodologies thatexplore how providers use their time and what theydo with clients (see Kim and Lettenmaier, 1995; Kimet al., 1997; and Kim et al., 1998).
2 Spacing clients are defined as those who wish tohave another child, but not in the next 2 years. Thesmall number of new clients who did not accept afamily planning method were excluded from thisanalysis, since they arguably did not need to hearabout all methods.
3 In another approach to this question, Pariani (1991)and colleagues argue that client preference is themost important of these issues and that providingmethods other than those preferred by the client willlead to increased discontinuation.
4 See Kim et al. (1998) for a more detailed approach tothis issue.
5 It is the case, however, that in 9 of the 11 study sites,nearly all of the new clients were told how to usetheir methodÑa crucial but single step in the choiceprocess. (See chapter 3.)
6 Average of % of new clients with whom existing flipcharts were used, % of new clients with whom exist-ing brochures were used, and % of new clients withwhom existing posters were used.
7 Annual client loads are measured through clinic ser-vice statistics, where available.
8 We eliminated 104 SDPs in Zambia from this analy-sis because their client loads constituted extremeoutliers, and the quality of the data was question-able. Similarly, data from Kenya was omittedbecause of concerns regarding data quality.Estimates of the number of clients per day are basedon the average number of days per week SDPs areopen for family planning in each country and aworking year of 50 weeks per provider.
9 The fact that roughly 10% of SDPs in all settingshave 20 or more clients per day per provider isanother issue, possibly one of overextendedresources. However, the great majority of SDPs withfar fewer clients per provider are the focus here.
138 Clinic-Based Family Planning and Reproductive Health Services in Africa

10 The results for all constituent indicators were simi-larly high, so the mean of the indicators fairly repre-sents the results.
11 Wording on these questions differed across coun-tries, but most were posed as Òthe nature of theclientÕs sexual relations,Ó which was defined locally,or Òthe number of partners in the last yearÓ (new
clients) and Òthe number of partners since the lastvisitÓ (revisit clients).
12 For instance, operations research projects inGuatemala, Honduras, Mexico, and Peru have testedthe use of job aids as a means of training providersto offer a broader spectrum of reproductive healthservices (Vernon, 1998).
FAC
TO
RS
AF
FE
CT
ING
QU
AL
ITY
Unrealized Quality and Missed Opportunities in Family Planning Services 139

As urban growth rates quickly increase in sub-Saharan Africa, the infrastructure in cities, particu-larly that of urban health systems, becomesincreasingly strained. However, it might still beassumed that the quality of urban health services isbetter than that of rural services for a variety ofreasons, including a greater concentration oftrained personnel, larger health facilities, andshorter supply routes. To help family planningprogram managers assess the readiness of servicedelivery points (SDPs) to provide quality servicesand design future reproductive health programs,this chapter compares the quality of services inurban and rural areas. The analysis is based ondata from Situation Analysis studies conducted inBotswana, Burkina Faso, Ghana, Kenya, Zanzibar,and Zimbabwe.
Overall, there is less difference in servicesbetween urban and rural SDPs than might beexpected. In fact, it appears that the quality of carein rural SDPs is in most cases as good as that inurban SDPs, and sometimes better. This findingmay arise from the fact that quality of care isdefined by indicators of counseling and informa-tion exchange, which do not rely heavily on infra-structure and readiness. Specifically, the data leadto the following conclusions:
■ For indicators related to infrastructure, such asavailability of electricity and water, urban SDPsshow a clear advantage.
■ Almost half or more of overall readiness indi-catorsÑincluding staffing; accessibility of ser-vices; infrastructure; logistics; equipment;supervision; information, education, and com-munication (IEC) materials; and contraceptivemethods offeredÑshow similar results forurban and rural SDPs.
■ There is significantly less difference between thequality of care offered at urban and rural SDPsthan there is between the readiness of urban andrural SDPs to provide services. The majority ofquality-of-care indicators show no differencesbetween urban and rural SDPs, and a significantnumber of indicators show a rural advantage.
■ The quality and frequency of counseling andinformation exchange appear to be similaramong urban and rural SDPs within each coun-try, and the technical competence of providersappears to be roughly equal as well.
Are urban services deteriorating, are rural ser-vices improving, or has urban and rural servicequality always been similar? Further research withtime series data is required to answer these ques-tions. Nevertheless, the results presented here sug-gest that there needs to be a reassessment of com-mon assumptions about the quality of services inurban and rural areas and a potential refocusing ofprogram design in order to prepare for the popula-tion changes expected in the coming century.
Urban and Rural Family Planning Services: Does Service Quality Really Differ? 141
FAC
TO
RS
AF
FE
CT
ING
QU
AL
ITY
KEY POINTS AND CONCLUSIONS
Urban and Rural Family PlanningServices: Does Service Quality Really Differ?
7

Africa currently has the highest rate of urbangrowth of any region in the world. The urbangrowth rate is 11% in Burkina Faso; 5Ð7% inBotswana, Kenya, and Zanzibar; and about 4% inGhana and Senegal. It is estimated that by the year2020, over half of the population in Africa will livein urban centers (United Nations, 1995). As Africancountries grapple with this population growth intheir cities, the public- and private-sector infra-structure serving these populations is being heavi-ly strained. Rapid urbanization has had enormousconsequences for housing, water and electricalsupplies, transportation, basic education, and eco-nomic development (Sadik, 1996), and in particularfor urban health systems (Gorosh et al., 1995). Arecent study states, ÒIn sub-Saharan Africa, contin-uing massive out-migration from impoverishedrural areas and high natural increaseÑdespiteyears of sustained recessionÑfuels persistent rapidurban growth, at nearly twice the world average,putting increased pressure on already strainedeconomies and management capacities of bothlarge and small urban centersÓ (Brockerhoff andBrennan, 1997:14).
Nonetheless, family planning and other repro-ductive health services in urban areas might beassumed to be better than those provided in ruralareas for a variety of reasons: there is generally alarger concentration of trained personnel living inurban areas, health facilities tend to be larger andto have better resources, supply routes are shorter,and supervision should be easier given the smallerdistances between facilities. Furthermore, there isusually a stronger demand for and use of such
services in urban areas, attributable to higher levelsof education and greater desire for a smaller fami-ly size due to the social and economic characteris-tics of urban populations (Weinberger, 1991; Shah,1994). On the other hand, many governments, withthe support of external donors, promote a widerange of primary healthcare initiatives in ruralareas because this is where the majority of the pop-ulation currently lives and where access to servicesis most restricted (Gilson, 1995; Dean, 1991).Family planning and reproductive health pro-grams are no exception to this trend.
Whether there is a difference between urbanand rural areas in the readiness of clinics to offerhigh-quality services is an important issue for poli-cy makers and healthcare planners. Reproductivehealth services in the largest African cities are oftenimplemented and funded separately from thenational program because these cities are adminis-tered as separate entities for all public-sector ser-vices. The allocation of resources to rural health ser-vices, combined with the increasing demands facedby urban services, may be causing a difference inrural and urban areas in terms of the quality of ser-vices offered. However, there is little empirical evi-dence describing the relative conditions of urbanand rural services (for descriptions of urban ser-vices, see Muvandi et al., 1995; Maggwa et al.,1995a; and Maggwa et al., 1995b). Is there a differ-ence between them? If so, which have the advan-tage, and what aspects of service delivery are dif-ferent? Such information is becoming increasinglyimportant to policy makers and donors as they facethe realities of rapid urbanization.
Urban and Rural Family Planning Services: Does Service Quality Really Differ? 143
FAC
TO
RS
AF
FE
CT
ING
QU
AL
ITY
Urban and Rural Family PlanningServices: Does Service Quality Really Differ?Elizabeth Pearlman, Heidi Jones, Martin Gorosh, Carolyn Gibb Vogel, and Melinda Ojermark
7

Situation Analysis data on the readiness andquality of family planning services in several sub-Saharan African countries can be used to illustratethe extent of the differences between services inurban and rural areas. This chapter providesdescriptive and comparable information on thestate of urban and rural services in six countrieswhere such data were collected: Botswana, BurkinaFaso, Ghana, Kenya, Senegal, and Zanzibar.1 Thisanalysis can inform the discussion in these coun-tries, and elsewhere in Africa, on the future alloca-tion of resources for family planning and otherreproductive health services.
METHODOLOGY
This analysis uses the Bruce-Jain framework (Bruce,1990) for describing readiness and quality of care(see Chapter 1) to compare services at rural andurban service-delivery points (SDPs). The urbanand rural sample sizes for the six Situation Analysisstudies that provided the data for the analysis areshown in Table 7-1.2 Data from the inventory ques-tionnaires in Botswana, Burkina Faso, Ghana, andKenya are weighted. As part of the SituationAnalysis approach, SDPs are normally identified asbeing located in urban, rural, or peri-urban areas, asdefined by local program managers. For the pur-poses of this chapter, we have combined peri-urbanand urban SDPs for the four country studies thatincluded peri-urban locations.3
Not surprisingly, there is a correlation betweentype of SDP and urban or rural location: in all sixcountries, urban areas have more hospitals andlarger SDPs, whereas rural areas have more healthposts and small clinics. For this reason, differencesbetween urban and rural areas may be due simplyto their different types of SDPs, rather than thelocation itself. However, the present analysis isprotected from this effect in two ways. First, mostindicators are defined at a basic level that shouldbe present in all SDPs. For example, having ade-quate storage for commodity stocks or clean waterin the exam room should be required of all types ofSDPs. All new clients should be asked their repro-ductive intentions, regardless of the type of SDPthey are attending. An exception is the availabilityof long-term methods in urban and rural areas,which is in fact affected by the distribution of typeof SDP, as discussed later in the chapter. Second,some indicators are calibrated differently based onthe type of SDP or type of client. The indicatorsaddressing the amount of equipment at SDPs aremeasured in terms of differing amounts of equip-ment required for different types of SDPs and theirvarying client loads. For example, a hospital musthave more specula than a health post to be consid-ered as having ÒenoughÓ specula. (See Chapter 3for more detailed discussion.) And the indicators ofquality of IUD insertion are measured only amongclients who have an IUD inserted, so the differencein availability of IUD services does not affect the indicator. For these reasons, the issue of the
144 Clinic-Based Family Planning and Reproductive Health Services in Africa
Table 7-1. Rural, urban, and total sample sizes
Number of FamilyPlanning Clients
Number of SDPs Visited ObservedCountry Year Rural Urban Total Rural Urban Total
Botswana 1995 110 74 184 190 215 405
Burkina Faso 1995 273 64 339 160 349 509
Ghana 1996 170 143 313 378 441 819
Kenya 1995 134 119 253 351 610 961
Senegal 1994 48 132 180 88 1035 1123
Zanzibar 1995 85 15 100 58 86 114
distribution of types of SDPs does not affect theanalysis greatly.
The indicators presented here were collectedthrough an inventory of equipment and supplies,and observations of interactions between clientsand providers. The unit of analysis for inventoryindicators is the SDP, while for observations it is theclient. It was not possible to address all elements ofreadiness and quality in this analysis, but the ele-ments included are believed to be adequately repre-sentative of the services provided. All urban/ruralcomparisons are made on the basis of statisticallysignificant differences, using a p-value of .05.
The goal of this analysis is twofold: to comparepatterns of quality of care between rural and urbanSDPs within each of the six countries, and to com-pare overall patterns of quality of care betweenrural and urban SDPs within the region. If datafrom a majority of the six countries show similarresults, we consider a regional pattern to be estab-lished. Comparisons are expressed in terms ofÒrural advantageÓ or Òurban advantageÓ if there isa significant rural/urban difference in results foran indicator within a country; if there is no signifi-cant difference, this is expressed as Òno difference.Ó
RESULTS
Indicators of clinic readiness are discussed first.They include indicators under eight elements:staffing; accessibility; infrastructure; contraceptivesupplies and logistics; equipment; supervision;information, education, and communication (IEC)materials; and methods available. The quality-of-care indicators are then presented, and addressfour elements: choice of methods, informationexchange, mechanisms to ensure continuity, andtechnical competence.4
Readiness to Provide Services
Table 7-2 shows rough results for 34 readiness indi-cators. To simplify the presentation, the indicatorsthat showed no difference between urban andrural areas are left blank. Those with an urbanadvantage are shaded grey, and those with a ruraladvantage are shaded black. A glance at the table
shows that overall there is more urban advantagethan rural, but many indicators show no differ-ence, and there is some rural advantage.
Staffing
The presence of a nurse on site is necessary for themajority of reproductive health services and manymethods of contraception. In both rural and urbanareas, a nurse was present in the vast majority ofSDPs. The one exception was Zanzibar, in whichthe low percentage of SDPs with a nurse on site(60% urban, 34% rural) was attributed to sickness,training, or staff being on leave. Overall, urbanclinics demonstrated a slight advantage over ruralones, although this difference was significant onlyin Botswana and Kenya.
The presence of a physician on site may not berequired by the Ministry of Health and is not nec-essary for most contraceptive methods.Consequently, the proportion of family planningclinics in which doctors were reported to be onduty during study visits was under 10% in bothrural and urban areas, and the Zanzibar studyshowed no presence of a doctor at any SDP.Contrary to what was expected, there were fewsignificant differences between rural and urbanclinics in this regard. In only two countries, Ghanaand Kenya, was there an urban advantage.However, it is probable that when needed foremergencies or complex procedures, doctors aremore available at urban sites because of the prox-imity of other medical facilities.
Accessibility
The first accessibility indicator is whether SDPsopen on time. Although this result differed greatlyamong the six countriesÑwith 3% of SDPs inurban Kenya opening on time compared with 87%of SDPs in urban ZanzibarÑthe rates were similarbetween rural and urban sites within each country.
The second indicator, whether the SDP had avisible sign indicating the availability of familyplanning services, showed differences betweenrural and urban areas. In every country exceptSenegal, a much higher percentage of urban clinicshad such a sign. However, as noted in Chapter 3
Urban and Rural Family Planning Services: Does Service Quality Really Differ? 145
FAC
TO
RS
AF
FE
CT
ING
QU
AL
ITY

Table 7-2. Significant urban and rural differences in readiness indicators
146 Clinic-Based Family Planning and Reproductive Health Services in Africa
Zan
zib
ar
Sen
egal
Ken
ya
Gh
an
a
Burk
ina
Faso
Bots
wan
aNo differenceUrban advantageRural advantage
n/a
n/a
n/an/a
n/an/an/a
n/a
n/an/a
n/a
n/an/a
Staffing % of SDPs with at least one nurse on duty. . . with at least one doctor on duty
Accessibility . . . open on time. . . with a sign announcing family planning services
Infrastructure . . . with electricity. . . with a water source. . . with adequate water in exam room. . . with clean exam room. . . with adequate light in exam room. . . with a working toilet for clients. . . with an adequate waiting area
Contraceptive . . . with adequate storage for stocksSupplies and . . . with a commodity inventoryLogistics . . . that have experienced a stockout of
POPs*. . . that have experienced a stockout of COCs* . . . that have experienced a stockout of condoms*. . . that have experienced a stockout of IUDs*
Equipment . . . with enough blood pressure machines. . . with enough scales. . . with enough stethoscopes. . . with enough specula. . . with enough gloves. . . with enough light sources. . . with enough sterilizers
Supervision . . . that have received a supervisory visit in last 6 months
IEC Materials . . . that have a brochure on family planning. . . that have a poster on family planning
Methods . . . that usually offer POPsAvailable . . . that usually offer COCs
. . . that usually offer condoms
. . . that usually offer injectables
. . . that usually offer IUDs
. . . that usually offer NORPLANT®
. . . that usually offer female sterilization
Note: p < 0.05. n/a = not available. *For these indicators, an advantage means lower stockout rates.
n/a

(indicator R.2-2) staff in some rural clinics feel thatfamily planning signs compromise confidentiality,and therefore choose not to have a visible sign.Consequently, the appropriateness of a sign maydepend on local context.
Infrastructure
Infrastructure comprises the basic facilitiesrequired for clinic functioning, such as water orelectricity, and thus is an important facet of pro-viding high-quality care to clients. While someinfrastructure indicators do not demonstrate sig-nificant differences between rural and urban clin-ics, those that do show an urban advantage.
Not surprisingly, access to electricity and waterwas markedly higher in urban than in rural SDPs.The largest differences in electricity emerged inBotswana, Kenya, and Zanzibar, where fewer than30% of rural clinics had electricity on the days onwhich data were collected, compared with over 82%of urban clinics. Availability of water at rural SDPswas greater than that of electricity, but was still as lowas 41% (Zanzibar). The percentage of urban clinicswith running water was never lower than 72%(Kenya). Botswana is the only country in which avail-ability of water was similar in urban and rural areas.
One could debate the value of this measure,arguing that perhaps adequate water from wells,rainwater collection, or some other source of cleanwater is available. However, adequate water in examrooms is essential for maintaining procedures thatprevent infection. Water, either running or fromother sources, proved to be more common in urbanthan in rural areas in Burkina Faso, Kenya, andSenegal, and differences between rural and urbanareas were substantial. For example, in Burkina Fasoonly 29% of rural clinics had adequate water in theexam room, compared with 71% of urban clinics.
In three countries, a higher proportion ofurban than rural SDPs had clean exam rooms.Results on this indicator were 80% or higher in allareas except rural Burkina Faso and Kenya gener-ally, where the results ranged from 60% to 65%.As for adequate light source in the exam room, anurban advantage was found only in Burkina Faso; however, this result did not fall below 80% inany region.
Working toilets for clients5 were significantlymore common in urban than rural clinics inBotswana, Burkina Faso, and Zanzibar. In Kenya,however, toilets were more common in rural (90%)than in urban (66%) SDPs.
In the six countries studied, the data showedlittle difference between rural and urban areas inthe percentage of SDPs with adequate waitingareas for clients.6 In fact, the data show only smalldifferences among the countries. With the excep-tion of rural Botswana, between 79% and 95% ofSDPs had adequate waiting space. In Botswana,44% of rural clinics had adequate waiting space forpatients, compared with 83% of urban SDPs.
Contraceptive Supplies and Logistics
The element of contraceptive supplies and logisticsincludes not only each clinicÕs ability to providecontraceptives on site, but also its ability to man-age its inventory through regulated systems. Itcould be argued that because rural clinics mayhave more difficulty acquiring materials, they maybe less likely to keep systematized inventories.However, this was not borne out by the data.
No urban/rural differences were found in anyof the countries in terms of space for stockingequipment and goods. Moreover, no clear urbanadvantage was seen for use of systematizedinventories. Although more urban than ruralSDPs in Senegal and Burkina Faso had commodi-ty inventory forms, the reverse was true inBotswana and Kenya, and there were no differ-ences between rural and urban SDPs in Zanzibarand Ghana.
Similarly, for all methods of contraception,there was no difference between stockouts in ruraland urban SDPs in the majority of countries.7
Stockouts of progestin-only pills (POPs) were fair-ly equal between rural and urban SDPs, with theexception of SDPs in Kenya, where such stockoutswere slightly more common in rural areas (i.e.there was an urban advantage). For combined oralcontraceptives (COCs), stockouts were similarlyfound throughout each country in urban and ruralSDPs. Condom stockouts varied, but in BurkinaFaso and Botswana, urban SDPs showed an advan-tage on this indicator (meaning they had lower
Urban and Rural Family Planning Services: Does Service Quality Really Differ? 147
FAC
TO
RS
AF
FE
CT
ING
QU
AL
ITY

stockout rates). These results suggest that differ-ences in commodity availability between rural andurban sites are not as great as might be expected.One possible explanation is that supplies are oftendistributed centrally, so stockouts may be beyondthe control of individual clinics.
Equipment
One would expect access to equipment to be betterin areas that are closer to central suppliers andhave better transportation. Thus, urban SDPsmight be expected to have more equipment onhand. However, as with contraceptives, this expec-tation rarely proved to be true. In most cases, thepercentages of rural and urban SDPs with enoughworking equipment were fairly equal. When therewas an advantage, it was more often rural overurban than the reverse.
The availability of an adequate number of bloodpressure gauges, scales, stethoscopes, specula,
gloves, light sources, and sterilizing facilities wasgenerally similar in rural and urban SDPs. Therewere some exceptions: a rural advantage was foundfor blood pressure machines in Burkina Faso andZanzibar, for sterilizers and stethoscopes in Kenya,and for lights and blood pressure machines inZanzibar. An urban advantage was found for spec-ula in Burkina Faso, gloves in Kenya, and lights inBotswana. However, these results show no overalltrend in equipment availability across urban andrural contexts.
Supervision
As Figure 7-1 indicates, the percentage of SDPsreceiving a supervisory visit in the 6 months priorto the study visit was comparable between ruraland urban clinics within each country, with no sig-nificant differences.8 Thus although urban clinicsare physically closer together, they are not neces-sarily supervised more frequently.
148 Clinic-Based Family Planning and Reproductive Health Services in Africa

Information, Education, andCommunication Materials
The presence of brochures on family planning wasfairly consistent across rural and urban areas with-in most countries, yet it varied considerablyamong countries (10% in rural Senegal to 61% inrural Botswana). The presence of posters appearedto be more common in urban than rural areas inmost countries, and showed a smaller range thanthat of brochures (55% in rural Botswana to 90% inurban Ghana). Overall, more urban than ruralSDPs had available stocks of IEC materials.
Methods Available
No distinguishable pattern was found for urban andrural SDPs that usually offer oral contraceptives,condoms, or injectables. Figure 7-2 shows that forPOPs, which are used by women who are breast-feeding, there was no rural or urban advantage, withthe exception of Botswana (rural advantage) and
Burkina Faso (urban advantage). Similarly, no differ-ence was found for COCs, except in Botswana,which showed a rural advantage, and Ghana, whichshowed an urban advantage. Data on SDPs offeringcondoms revealed differences in Burkina Faso andZanzibar, both showing an urban advantage. As forthe injectable, Senegal and Burkina Faso showed anurban and Botswana a rural advantage. The fact thatpills, condoms, and injectables are fairly easy toadminister probably facilitates the equality com-monly found between urban and rural areas onthese indicators. Moreover, these methods are themost commonly available in general (see Chapter 3).
Not surprisingly, the differences become morestriking among contraceptive methods that are rel-atively more complicated to administer: IUDs,NORPLANT¨, and female sterilization. In almostall cases, the percentage of SDPs offering eachmethod was higher in urban than rural areas. Thiswould be expected because urban clinics are morelikely to have the trained staff and infrastructure
Urban and Rural Family Planning Services: Does Service Quality Really Differ? 149
FAC
TO
RS
AF
FE
CT
ING
QU
AL
ITY
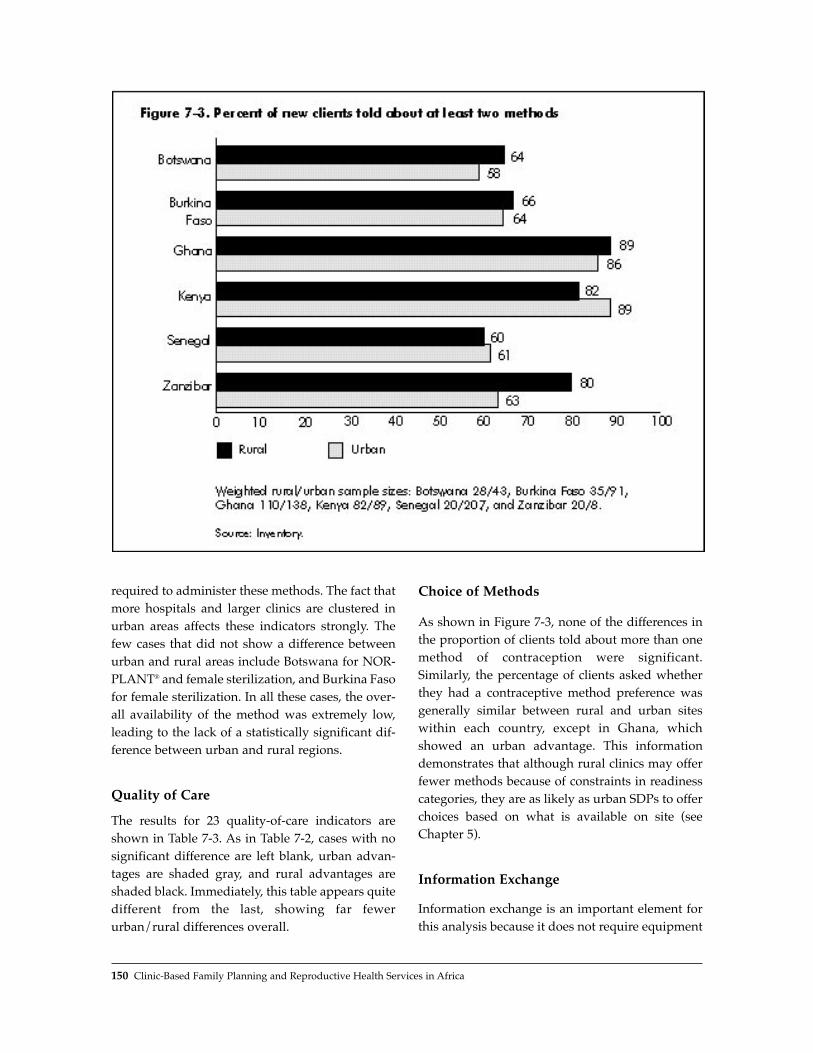
required to administer these methods. The fact thatmore hospitals and larger clinics are clustered inurban areas affects these indicators strongly. Thefew cases that did not show a difference betweenurban and rural areas include Botswana for NOR-PLANT¨ and female sterilization, and Burkina Fasofor female sterilization. In all these cases, the over-all availability of the method was extremely low,leading to the lack of a statistically significant dif-ference between urban and rural regions.
Quality of Care
The results for 23 quality-of-care indicators areshown in Table 7-3. As in Table 7-2, cases with nosignificant difference are left blank, urban advan-tages are shaded gray, and rural advantages areshaded black. Immediately, this table appears quitedifferent from the last, showing far fewerurban/rural differences overall.
Choice of Methods
As shown in Figure 7-3, none of the differences inthe proportion of clients told about more than onemethod of contraception were significant.Similarly, the percentage of clients asked whetherthey had a contraceptive method preference wasgenerally similar between rural and urban siteswithin each country, except in Ghana, whichshowed an urban advantage. This informationdemonstrates that although rural clinics may offerfewer methods because of constraints in readinesscategories, they are as likely as urban SDPs to offerchoices based on what is available on site (seeChapter 5).
Information Exchange
Information exchange is an important element forthis analysis because it does not require equipment
150 Clinic-Based Family Planning and Reproductive Health Services in Africa
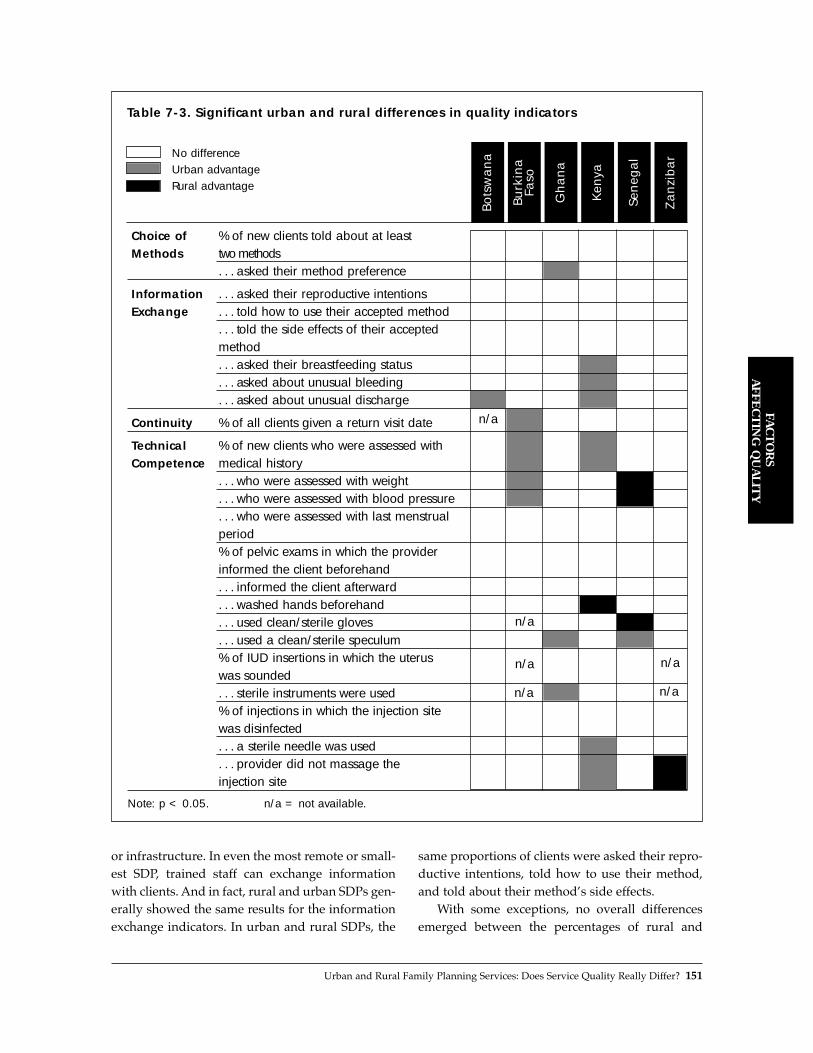
Urban and Rural Family Planning Services: Does Service Quality Really Differ? 151
FAC
TO
RS
AF
FE
CT
ING
QU
AL
ITY
Table 7-3. Significant urban and rural differences in quality indicators
Zan
zib
ar
Sen
egal
Ken
ya
Gh
an
a
Burk
ina
Faso
Bots
wan
aNo differenceUrban advantageRural advantage
or infrastructure. In even the most remote or small-est SDP, trained staff can exchange informationwith clients. And in fact, rural and urban SDPs gen-erally showed the same results for the informationexchange indicators. In urban and rural SDPs, the
same proportions of clients were asked their repro-ductive intentions, told how to use their method,and told about their methodÕs side effects.
With some exceptions, no overall differencesemerged between the percentages of rural and
n/a
n/a
n/a
n/a
n/a
n/a
Choice of % of new clients told about at leastMethods two methods
. . . asked their method preference
Information . . . asked their reproductive intentionsExchange . . . told how to use their accepted method
. . . told the side effects of their accepted method. . . asked their breastfeeding status. . . asked about unusual bleeding. . . asked about unusual discharge
Continuity % of all clients given a return visit date
Technical % of new clients who were assessed with Competence medical history
. . . who were assessed with weight
. . . who were assessed with blood pressure
. . . who were assessed with last menstrual period% of pelvic exams in which the provider informed the client beforehand. . . informed the client afterward. . . washed hands beforehand. . . used clean/sterile gloves. . . used a clean/sterile speculum% of IUD insertions in which the uterus was sounded. . . sterile instruments were used% of injections in which the injection site was disinfected. . . a sterile needle was used. . . provider did not massage the injection site
Note: p < 0.05. n/a = not available.
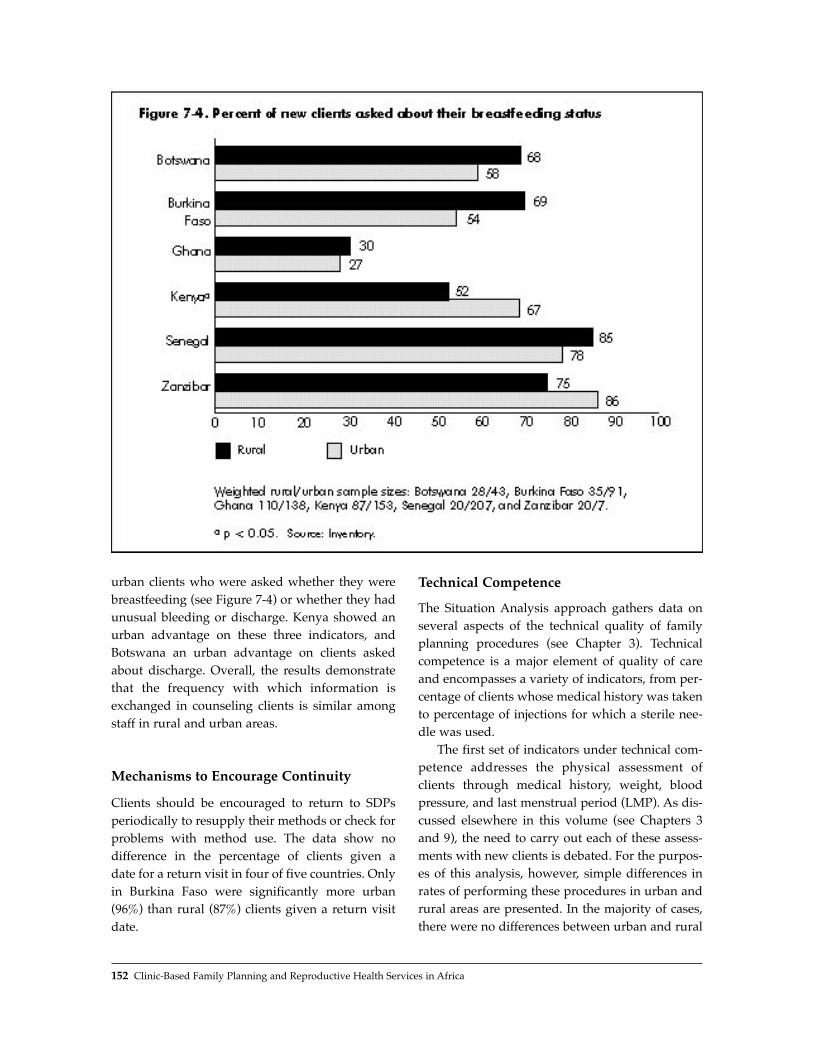
urban clients who were asked whether they werebreastfeeding (see Figure 7-4) or whether they hadunusual bleeding or discharge. Kenya showed anurban advantage on these three indicators, andBotswana an urban advantage on clients askedabout discharge. Overall, the results demonstratethat the frequency with which information isexchanged in counseling clients is similar amongstaff in rural and urban areas.
Mechanisms to Encourage Continuity
Clients should be encouraged to return to SDPsperiodically to resupply their methods or check forproblems with method use. The data show no difference in the percentage of clients given a date for a return visit in four of five countries. Onlyin Burkina Faso were significantly more urban(96%) than rural (87%) clients given a return visitdate.
Technical Competence
The Situation Analysis approach gathers data onseveral aspects of the technical quality of familyplanning procedures (see Chapter 3). Technicalcompetence is a major element of quality of careand encompasses a variety of indicators, from per-centage of clients whose medical history was takento percentage of injections for which a sterile nee-dle was used.
The first set of indicators under technical com-petence addresses the physical assessment ofclients through medical history, weight, bloodpressure, and last menstrual period (LMP). As dis-cussed elsewhere in this volume (see Chapters 3and 9), the need to carry out each of these assess-ments with new clients is debated. For the purpos-es of this analysis, however, simple differences inrates of performing these procedures in urban andrural areas are presented. In the majority of cases,there were no differences between urban and rural
152 Clinic-Based Family Planning and Reproductive Health Services in Africa

areas in rates of performing these assessments.Where differences did emerge, they tended toshow an urban advantage, although weight andblood pressure showed a rural advantage inSenegal. Overall, no consistent differences werefound.
For quality of pelvic exams, generally consis-tent services appear to be offered within eachcountry. No urban/rural difference was found inany country between the percentages of clientswho were informed about their exam before itstarted and after it was completed. On the indica-tors of handwashing before the exam and the useof gloves during the exam, there was one countrywith a rural advantage for each (Kenya for hand-washing and Senegal for gloves). Conversely, anurban advantage was demonstrated for the use ofsterile specula in Ghana and Senegal. It is impor-tant to note that the indicators of handwashing,sterile specula use, and glove use take into accountwhether clean water, specula, and gloves are avail-able at the SDP. Again, however, no overall differ-ence in quality of pelvic exams in urban and ruralareas is apparent.
The next two indicators address whether prop-er procedures were followed during IUD inser-tions. These results indicate an urban advantage inone case, but do not show an overall pattern. Thepercentage of IUD insertions in which a uterinesound was used was the same for rural and urban
SDPs in each country (ranging from 50% in ruralGhana to 100% in rural Kenya and Senegal).Moreover, the percentage of insertions duringwhich sterile instruments were used was similar inrural and urban areas in three of the four countriessurveyed on this indicator; Ghana was the excep-tion, showing an urban advantage.
Injection quality shows similar results. Therewere no significant rural/urban differences in thepercentage of injections for which the site was dis-infected in any country. Sterile needles were usedfor roughly the same percentage of injections inrural and urban SDPs in five of the six countries,but showed an urban advantage in Kenya. Lastly,no differences emerged between rural and urbanareas in terms of not massaging the injection site,except in Kenya (urban advantage) and Zanzibar(rural advantage).9
DISCUSSION AND CONCLUSIONS
Figures 7-5 and 7-6 display the percentage of indi-cators that show a rural advantage, urban advan-tage, or no difference for each country. Figure 7-5addresses the 34 readiness indicators in Table 7-2,and Figure 7-6 the 23 quality indicators in Table 7-3.
Figure 7-5 shows that where differences exist inreadiness indicators, urban areas tend to have theadvantage in each country. This is most apparent
Urban and Rural Family Planning Services: Does Service Quality Really Differ? 153
FAC
TO
RS
AF
FE
CT
ING
QU
AL
ITY

for indicators that relate to infrastructure, such asthe availability of water or electricity, and of IUD,NORPLANT¨, and female sterilization services.
The remaining results are more unexpected,however. About half or more of the readiness indi-cators in each country show no significanturban/rural difference. In particular, there is nocountry in which an urban or rural advantage isshown for rates of supervision, stockouts of COCs,or storage areas for commodities. Moreover, up to12% of the indicators for each country exhibit arural advantage. These rural advantages are clus-tered around equipment availability, presence ofcommodity inventory, and, in Botswana, the avail-ability of hormonal methods.
By country, Burkina Faso and Kenya appear toexhibit the most differences between urban andrural areas. In Burkina Faso, half of the indicatorsshow an urban advantage. In Kenya, over a third ofthe indicators show an urban advantage, but fully12% exhibit a rural advantage, as high as any coun-try included here.
Comparison of these readiness results with thequality indicators shown in Figure 7-6 reveals adistinctly different pattern of urban and ruraladvantage. Although the quality of care in bothurban and rural settings often demonstrates seri-ous shortcomings (see Chapter 3), the majority ofquality indicators show no difference betweenurban and rural SDPs. In Botswana and Zanzibar,
fully 95% of the indicators show no differencebetween urban and rural contexts. Moreover, thoseurban and rural advantages that do exist do notcluster around any particular element of quality orshow an easily generalizable pattern. Taken over-all, the data show that quality of care across urbanand rural areas in the six countries included here isroughly equal. This may be explained by the factthat these indicators of quality emphasize informa-tion exchange and counseling, which does not relyheavily on infrastructure or readiness.10 In addi-tion, the Ministry of Health in each country is themain supplier of family planning services and runsstandard training courses for its entire staff. Asthese staff are distributed among urban and ruralSDPs, the consistency of their behavior may reflecttheir shared training.
How do the results presented here reflect on theassumption, presented at the beginning of the chap-ter, that urban services should be of higher qualitythan rural services? There are a number of consid-erations. First, because the majority of the popula-tion in Africa has historically lived in rural areas,government and nongovernmental organization(NGO) development efforts have focused primarilyon rural areas (Gilson, 1995; Dean, 1991). Second,because urban standards of living have long showna consistent advantage over rural areas, there hasbeen an added emphasis on efforts to rectify the sit-uation in rural areas. It may be that the attention
154 Clinic-Based Family Planning and Reproductive Health Services in Africa

given to rural services has improved them marked-ly, bringing them more in line with the higher-qual-ity urban services. Alternatively, the increasingdemands being faced by services in urban areasmay be contributing to a decline in quality in thoseareas, bringing them closer to the levels of serviceprovided in rural areas. A combination of these twofactors could be at work. However, analysis of thesituations in urban and rural areas over time wouldbe needed to examine whether either or both ofthese trends are responsible (see Chapter 11). It isalso possible, of course, that the assumed urbanadvantage never existed at all.
Furthermore, as noted earlier, this analysis isbased on ÒqualityÓ as defined by the Bruce-Jainframework. Although this framework is widelyaccepted, there may be differences between urbanand rural services that are not measured using theapproach applied here, and that would provideinsights into the above conclusions. The Bruce-Jainframework emphasizes indicators of counseling,information exchange, and training. The use ofother frameworks to compare rural and urbanSDPs might result in different conclusions (UnitedNations, 1995).
Nevertheless, the results presented here sug-gest that policy makers and researchers need toexamine common assumptions about the qualityand readiness of reproductive health care in urbanand rural settings. It is no longer safe to assume anurban advantage in clinic-based family planningservices in sub-Saharan Africa. Moreover, withprojections that sub-Saharan populations will beover 50% urban by the year 2020, refocusing andcreating a new vision for urban family planningand reproductive health services is essential.
REFERENCES
Brockerhoff, M. and E. Brennan. 1997. ÒThe poverty ofcities in the developing world.Ó Working Paper No.96, Population Council, New York.
Bruce, J. 1990. ÒFundamental elements of the quality ofcare: A simple framework.Ó Studies in FamilyPlanning, 21,2:61Ð91.
Dean, M. 1991. ÒNairobi perspective: Health for howmany by 2000?Ó Lancet, 330:239Ð240.
Gilson, L. 1995. ÒManagement and health care reformin sub-Saharan Africa.Ó Social Science & Medicine,40,5:695Ð710.
Gorosh, M., N. Maggwa, I. Muvandi, et al. 1995.Findings from the Sub-Saharan Africa Urban FamilyPlanning Study: Overview of Studies Conducted inBlantyre, Malawi; Bulawayo, Zimbabwe; and Mombasa,Kenya. The Center for African Family Studies,Nairobi, Kenya; John Snow Inc., Arlington, VA; andthe Center for Population and Family Health, NewYork.
Maggwa, N., I. Muvandi, M. Gorosh, et al. 1995a.ÒFindings from the sub-Saharan Africa urban familyplanning study: Mombasa city report.Ó John SnowInc., Arlington, VA.
Maggwa, N., I. Muvandi, M. Gorosh, et al. 1995b.ÒFindings from the sub-Saharan Africa urban familyplanning study: Blantyre city report.Ó John SnowInc., Arlington, VA.
Muvandi, I., N. Maggwa, M. Gorosh, et al. 1995.ÒFindings from the sub-Saharan Africa urban familyplanning study: Bulawayo city report.Ó John SnowInc., Arlington, VA.
Sadik, N. 1996. The State of World Population, 1996:Changing PlacesÑPopulation, Development and theUrban Future. United Nations Population Fund, New York.
Shah, I.H. 1994. ÒFamily planning in sub-SaharanAfrica.Ó World Health, 47,3:20Ð21.
United Nations. 1995. World Urbanization Prospects, the1994 Revision. United Nations Department forEconomic and Social Information and PolicyAnalysis, Population Division, New York.
Weinberger, M.B. 1991. ÒRecent trends in contraceptivebehavior.Ó In Demographic and Health Surveys WorldConference: Proceedings, Vol. 1. IRD/MacroInternational, Inc., Columbia, Maryland.
NOTES
1 Although Zanzibar is part of Tanzania, it retains anindependent health program and was therefore ana-lyzed separately. For the purposes of this chapter, itis referred to as a country.
2 See Chapter 2 for information on these countriesÕfamily planning programs and Chapter 1 for studysampling information.
3 The following are the percentages of total SDPs usedin this analysis that are peri-urban: Botswana, 17%;Burkina Faso, 9%; Kenya, 9%; and Senegal, 25%. Theinclusion of these semi-urban SDPs in the urban cat-egory may have diluted urban/rural differences,particularly in Botswana and Senegal.
4 Note that for some of the indicators discussed in thissection, data were not available for all six countries.
Urban and Rural Family Planning Services: Does Service Quality Really Differ? 155
FAC
TO
RS
AF
FE
CT
ING
QU
AL
ITY

In each case, the results presented are based on theavailable data.
5 Defined as flush toilets or any other type.6 Adequate waiting areas are defined in a fairly con-
sistent manner across all countries, and generallyinclude seating for clients and a waiting space pro-tected from rain.
7 Data on stockouts of injectables and NORPLANT¨
implants were not collected in all countries.
8 Although the differences were not significant, morerural than urban SDPs had been visited by a super-visor in four of the six countries.
9 Not massaging the injection site is believed toincrease the efficacy of injectable contraception. SeeChapter 3 for further detail.
10 It is not the purpose of this chapter to examine therelationship between quality of care and readiness indepth; this is done in Chapter 5.
156 Clinic-Based Family Planning and Reproductive Health Services in Africa

IV. STANDARDS ANDGUIDELINES FOR SERVICES
8
How Providers RestrictAccess to FamilyPlanning Methods:Results from FiveAfrican Countriesdetails the extent to whichproviders impose variousrestrictions—such as maritalstatus, parity, and age—onwomen seeking family plan-ning services, and comparesthese restrictions againstnational service protocols.
9
Tests and ProceduresRequired of Clients inThree Countries ofWest Africareviews the requirements forlaboratory tests and othermedical procedures—such asblood pressure, weight taking,and pelvic exams—imposedon clients and compares theserequirements against interna-tional standards.


Since 1992, Situation Analysis studies have gath-ered data on provider attitudes and behaviors tomeasure the extent to which providers impose var-ious restrictions on the availability of contraceptivemethods. A review of five recent and comparablestudies on staff-imposed restrictions (in Botswana,Burkina Faso, Kenya, Senegal, and Zanzibar) andthe analogous country service protocols leads tothe following conclusions:■ Providers from Zanzibar are the most restric-
tive in providing contraceptive methodsaccording to marital status. This is to be expect-ed given the countryÕs strong religious contextand the Islamic norms of the service protocols.
■ In all five countries, marital status restrictionsare imposed most commonly in prescribingIUDs and female sterilization, and least com-monly in prescribing condoms.
■ An unmarried woman in Botswana, BurkinaFaso, and Senegal might actually have an easi-er time obtaining contraception than a marriedwoman who does not have her husbandÕs con-sent. With the exception of female sterilization,however, none of the countries studied has con-sent restrictions on any method, implying thatproviders are imposing this barrier on theirown initiative.
■ A considerable proportion of providers imposeparity requirements for the provision of IUDsand injectables. This is not surprising given thatrestrictions on IUDs are actually required bypolicy in Burkina Faso, Kenya, and Zanzibar. InKenya, however, where the providers are themost restrictive of any of the five countries in
terms of parity requirements, methods such ascondoms are also significantly restricted on thebasis of parity, even though service protocols donot require such restrictions.
■ An examination of minimum age requirementssuggests that providers generally considerCOCs and condoms appropriate for youngerwomen (average minimum age required: 15-17); IUDs, injectables, and NORPLANT¨ appro-priate for women in their middle reproductiveyears (minimum age: 17-27); and female steril-ization appropriate for women who have com-pleted their childbearing (minimum age: 35 orover). Apart from IUDs in Senegal and femalesterilization, however, the service protocolshave no such requirements, and internationalguidelines place no strict age requirements onany method.
■ In each of the five countries, providers on aver-age impose twice as many eligibility criteria asare required or encouraged by national guide-lines; in Kenya, Botswana, and Zimbabwe,providers impose from one-quarter to two-thirds of all eligibility criteria examined.
Overall, it can be concluded that providersÕ atti-tudes and behavior play a significant role in the wayservices are provided and in the restrictions imposedon particular methods. Interviews with providers inGhana revealed that providers impose these restric-tions with the intent of protecting both the client andsociety. Revised service protocols and training pro-grams may remove the concerns about clientsÕ well-being, but addressing broader societal and culturalconcerns will require more careful attention.
ST
AN
DA
RD
S A
ND
GU
IDE
LIN
ES
FO
RS
ER
VIC
ES
How Providers Restrict Access to Family Planning Methods: Results from Five African Countries 159
KEY POINTS AND CONCLUSIONS
How Providers Restrict Access toFamily Planning Methods:Results from Five African Countries
8


Access to family planning services and quality ofcare are both critical issues in the delivery of ser-vices. Access to services includes a clientÕs ability toreceive methods regardless of her age, parity, mar-ital status, or spousal consent. This chapteraddresses the ways in which providers restrictmethods based on these Òeligibility criteria,Ó asmeasured through direct provider interviews.
Bertrand et al. (1995) provide an exhaustiveclassification of restrictions to family planning ser-vices, grouped as access barriers and medical bar-riers. To physically reach a service delivery point(SDP), a client must have geographic, economic,administrative, cognitive, and psychosocial access.Moreover, once at the SDP, a client should not bedenied a family planning method because of med-ical barriers, outdated contraindications, eligibilitycriteria, process or scheduling hurdles, serviceprovider qualifications, provider bias for or againstmethods, inappropriate management of sideeffects, or regulatory barriers. Shelton et al.(1992:1334) define these medical barriers Ò...aspractices, derived at least partly from a medicalrationale, that result in a scientifically unjustifiableimpediment to, or denial of, contraception.ÓProvider-imposed limitations on family planningservices have been considered an underappreciat-ed impediment to quality and have received sub-stantial attention in the last 5 years (McDonald etal., 1995; Herndon, 1993; Jato et al., 1995).
Since 1992, Situation Analysis interviews withproviders have documented the extent to whicheligibility criteria are imposed by staff. In a follow-up to the 1994 Situation Analysis study in Ghana(Ghana Statistical Service, 1994), Twum-Baah and
Stanback (1995) used the Ghanaian data to identifySDPs at which providers impose the most eligibili-ty criteria. They revisited these 46 highly restrictiveSDPs to check the validity of the Situation Analysisdata through a review of clinic records and reinter-viewed providers on their views. The study con-cluded that service restrictions varied among andbetween different providers at each site, thatproviders had inadequate knowledge of con-traindications and side effects of modern methods(especially injectables), and that providers imposedtheir personal moral standards on their clients.
Shelton et al. (1992) postulate that medical bar-riers appear at two levels of the provider-clientinterfaceÑthe macro level of policies, protocols,and regulations, and the micro level of individualprovider attitudes and behaviors. This chapteraddresses the macro level by examining familyplanning service protocols established by fiveMinistries of Health, and the micro level by review-ing provider reports about the eligibility criteriathey impose. It explores how reports of providerrestrictions relate to national program guidelinesand considers other possible sources of restrictions.The objective is to describe possible regional pat-terns in these restrictions as a basis for furtherdevelopment of targeted interventions (FamilyHealth International, 1994).
METHODOLOGY
Situation Analysis Data
Of the available Situation Analysis studies, fivehave recent and comparable data on staff-imposed
ST
AN
DA
RD
S A
ND
GU
IDE
LIN
ES
FO
RS
ER
VIC
ES
How Providers Restrict Access to Family Planning Methods: Results from Five African Countries 161
How Providers Restrict Access toFamily Planning Methods:Results from Five African CountriesKate Miller, Robert Miller, Goli Fassihian, and Heidi Jones
8
restrictions on family planning access:1 Botswana(1995), Burkina Faso (1995), Kenya (1995), Senegal(1994), and Zanzibar2 (1995). These five countriesalso constitute a broad geographical spread acrossthe continent.3 The specific restrictions investigatedare as follows:■ Marital status■ Spousal consent■ Parity requirements■ Minimum age requirements■ Maximum age requirements
Each restriction is examined with respect to sixmethods of contraception:■ Combined oral contraceptives (COCs)■ Condoms■ Intrauterine devices (IUDs)■ Injectables■ NORPLANT¨ implants■ Female sterilization
Specifically, the interviews with providersincluded the following questions:■ Would you provide pill/condom/IUD/
injectable/NORPLANT¨ implants/female ste-rilization to an unmarried woman?
■ Would you provide pill/condom/IUD/injectable/NORPLANT¨ implants/female ste-rilization to a woman without her husbandÕsconsent?
■ What is the minimum number of children awoman must have before you would provide orrefer her for pill/condom/IUD/injectable/NORPLANT¨ implants/female sterilization?
■ What is the age range outside of which you willnot provide or refer a client for pill/condom/IUD/injectable/NORPLANT¨ implants/femalesterilization? (specify minimum and maximum)These questions were asked similarly across the
five studies, with some exceptions. NORPLANT¨
implants and female sterilization were not includ-ed in the list of methods for Botswana andZanzibar. The interviews were conducted in Frenchin Senegal and Burkina Faso, and in Swahili inZanzibar. In Kenya, although the question on agerestrictions was asked, the results cannot be report-ed because of difficulties with coding and inter-preting the data.
All the results are presented later in the chapterin Figures 8-1 through 8-8.4 The results for marital
status and spousal consent are expressed simply asthe percentage of providers who reported that theyimpose these restrictions. The results for parityrestrictions are expressed by two indicators: thepercentage of providers who impose a restrictionof at least one child, and among those providers,the mean number of children required. The agedata are also presented as two indicators: the per-centage of providers that impose the restriction,5
and among those providers, the mean age (bothminimum and maximum) required.6
Situation Analysis studies collect informationnot only on the barriers a provider imposes, butalso on the methods she has actually provided toclients in the last 3 months. All results were calcu-lated among all staff, as well as among those thathad provided in the last few months, by method.No marked differences emerged between these twogroups, and the few differences that were founddid not follow an easily interpreted pattern. Forthis reason, only results from among all staff arepresented here.
Family Planning Service Protocols
To enable comparison of the eligibility criteriareported by providers with those required bynational service protocols, service guidelines ineffect at the time of the Situation Analysis fieldworkwere collected (see the references at the end of thechapter for citations). Some of these guidelines havebeen updated since the Situation Analysis studieswere conducted, but the comparison here isbetween providersÕ reports and the guidelines ineffect at the time of the data collection.
RESULTS
Family Planning Service Protocols
The service protocols generally do not imposerestrictions related to marital status or spousal con-sent. In four of the five countries, the protocols con-tain no statements that a client must be marriedbefore she can receive family planning services.The exception is Zanzibar, where protocols hintthat marital status is required, stating, for example,
162 Clinic-Based Family Planning and Reproductive Health Services in Africa

that condoms and foam tablets Òcan be suppliedfreely to any married person.Ó The strong Islamicnorms in Zanzibar lend force to these statements,and discussions with the Zanzibar Ministry ofHealth lead us to believe that a de facto marital sta-tus requirement is in place for all methods.
Similarly, spousal consent is not generallyrequired across all five countries, except for steril-ization. Interestingly, the countries whose proto-cols require spousal consent for sterilization do sofor both male and female sterilization. In Botswanaand Burkina Faso, spousal consent is required forboth tubal ligations and vasectomies. In Senegal,spousal consent is desired for tubal ligations, withno mention of consent for vasectomy clients.Senegalese providers are encouraged to discuss thespouseÕs concerns with the tubal ligation client. InKenya, protocols suggest that couples attend coun-seling together, and women or men whose part-ners oppose sterilization are to be assessed at theproviderÕs discretion.
Parity, minimum age, and maximum agerequirements are a bit more complex, and are sum-marized in Table 8-1. Burkina Faso, Kenya, andZanzibar all impose some parity requirements onvarious methods, usually requiring only one child.
Burkina Faso has the most restrictive parityrequirement found in these protocols: at least threechildren are required for tubal ligation clients.
Tubal ligation is also restricted by minimumage in Burkina Faso, Kenya, and Zanzibar.Injectables have a virtual minimum age restrictionin Senegal, which requires that a client have beenmenstruating for at least 2 years before injectablesare given. Maximum age requirements areimposed only on COCsÑin Burkina Faso, Kenya,and Zanzibar.
Overall, service protocols in effect across all fivecountries infrequently impose eligibility criteria forfamily planning methods. Most combinations ofcountry, barrier, and method have no officialrestriction at all. Female sterilization is the mostrestricted method, mainly by minimum age, parity,and spousal consent. IUDs are frequently restrictedby parity, and COCs are restricted mainly by maxi-mum age. As the notes to Table 8-1 indicate, manyof these restrictions are not absolute, but constitutea recommendation or warning against use.Condoms are the least restricted method.
Across countries, the protocols of Botswana andSenegal are the least restrictive. Burkina Faso hassome uncommonly stringent restrictions, such as
ST
AN
DA
RD
S A
ND
GU
IDE
LIN
ES
FO
RS
ER
VIC
ES
How Providers Restrict Access to Family Planning Methods: Results from Five African Countries 163
Table 8-1. Parity and age norms required by service protocols
Country Parity Minimum Age Maximum AgeCOC Con IUD Inj Nor TL COC Con IUD Inj Nor TL COC Con IUD Inj Nor TL
Botswana
Burkina Faso 1 3 35 50a
Kenya 1b 1c 1c 1d ✓e 40
Senegal ✓f
Zanzibar 1 1g 30h 40
a For the purposes of this analysis, 50 is not considered a restriction; 45 is the cut-off.b Delivered 1 or more times; 2+ is better.c Proven fertility, assuming this means a completed pregnancy.d Low parity requires especially careful counseling.e Low reproductive age requires especially careful counseling.f Must have been menstruating for at least 2 years.g Parity of 1 is not strictly required, but “those...with low parity must be counseled strongly about the perma-
nence of the method.”h Recommended, but not strictly required: “those who are young (below 30 years) must be counseled strongly
about the permanence of the method.”
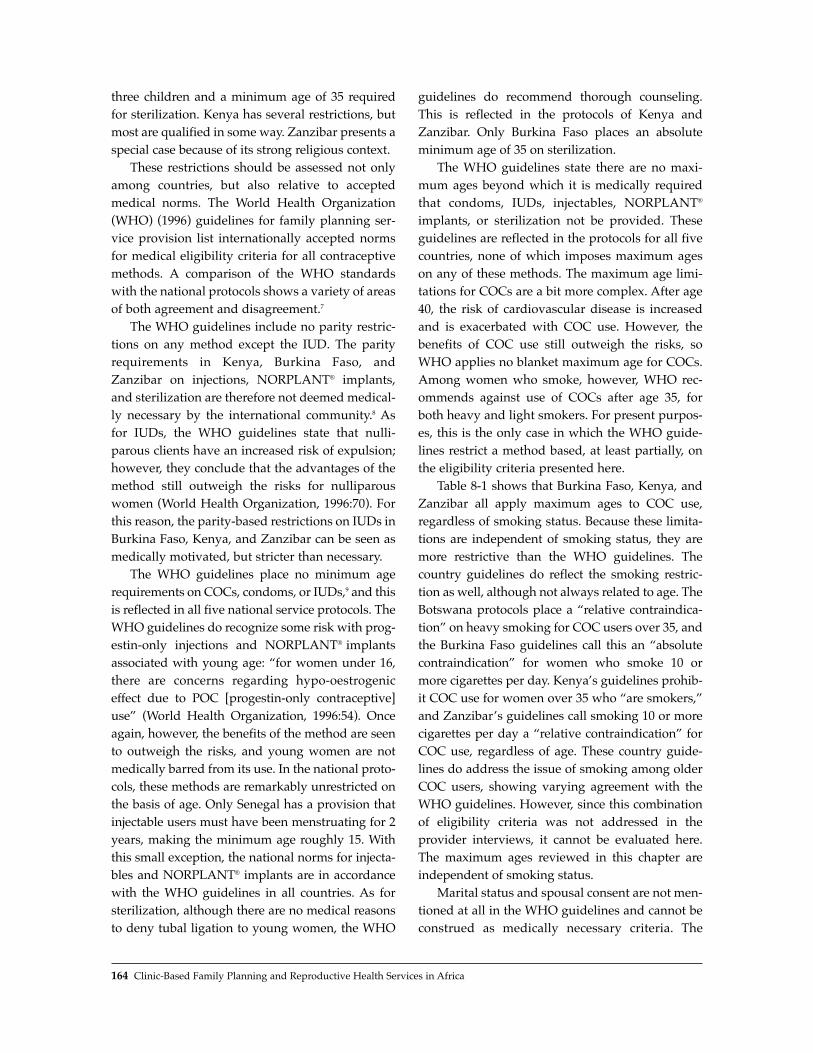
three children and a minimum age of 35 requiredfor sterilization. Kenya has several restrictions, butmost are qualified in some way. Zanzibar presents aspecial case because of its strong religious context.
These restrictions should be assessed not onlyamong countries, but also relative to acceptedmedical norms. The World Health Organization(WHO) (1996) guidelines for family planning ser-vice provision list internationally accepted normsfor medical eligibility criteria for all contraceptivemethods. A comparison of the WHO standardswith the national protocols shows a variety of areasof both agreement and disagreement.7
The WHO guidelines include no parity restric-tions on any method except the IUD. The parityrequirements in Kenya, Burkina Faso, andZanzibar on injections, NORPLANT¨ implants,and sterilization are therefore not deemed medical-ly necessary by the international community.8 Asfor IUDs, the WHO guidelines state that nulli-parous clients have an increased risk of expulsion;however, they conclude that the advantages of themethod still outweigh the risks for nulliparouswomen (World Health Organization, 1996:70). Forthis reason, the parity-based restrictions on IUDs inBurkina Faso, Kenya, and Zanzibar can be seen asmedically motivated, but stricter than necessary.
The WHO guidelines place no minimum agerequirements on COCs, condoms, or IUDs,9 and thisis reflected in all five national service protocols. TheWHO guidelines do recognize some risk with prog-estin-only injections and NORPLANT¨ implantsassociated with young age: Òfor women under 16,there are concerns regarding hypo-oestrogeniceffect due to POC [progestin-only contraceptive]useÓ (World Health Organization, 1996:54). Onceagain, however, the benefits of the method are seento outweigh the risks, and young women are notmedically barred from its use. In the national proto-cols, these methods are remarkably unrestricted onthe basis of age. Only Senegal has a provision thatinjectable users must have been menstruating for 2years, making the minimum age roughly 15. Withthis small exception, the national norms for injecta-bles and NORPLANT¨ implants are in accordancewith the WHO guidelines in all countries. As forsterilization, although there are no medical reasonsto deny tubal ligation to young women, the WHO
guidelines do recommend thorough counseling.This is reflected in the protocols of Kenya andZanzibar. Only Burkina Faso places an absoluteminimum age of 35 on sterilization.
The WHO guidelines state there are no maxi-mum ages beyond which it is medically requiredthat condoms, IUDs, injectables, NORPLANT¨
implants, or sterilization not be provided. Theseguidelines are reflected in the protocols for all fivecountries, none of which imposes maximum ageson any of these methods. The maximum age limi-tations for COCs are a bit more complex. After age40, the risk of cardiovascular disease is increasedand is exacerbated with COC use. However, thebenefits of COC use still outweigh the risks, soWHO applies no blanket maximum age for COCs.Among women who smoke, however, WHO rec-ommends against use of COCs after age 35, forboth heavy and light smokers. For present purpos-es, this is the only case in which the WHO guide-lines restrict a method based, at least partially, onthe eligibility criteria presented here.
Table 8-1 shows that Burkina Faso, Kenya, andZanzibar all apply maximum ages to COC use,regardless of smoking status. Because these limita-tions are independent of smoking status, they aremore restrictive than the WHO guidelines. Thecountry guidelines do reflect the smoking restric-tion as well, although not always related to age. TheBotswana protocols place a Òrelative contraindica-tionÓ on heavy smoking for COC users over 35, andthe Burkina Faso guidelines call this an ÒabsolutecontraindicationÓ for women who smoke 10 ormore cigarettes per day. KenyaÕs guidelines prohib-it COC use for women over 35 who Òare smokers,Óand ZanzibarÕs guidelines call smoking 10 or morecigarettes per day a Òrelative contraindicationÓ forCOC use, regardless of age. These country guide-lines do address the issue of smoking among olderCOC users, showing varying agreement with theWHO guidelines. However, since this combinationof eligibility criteria was not addressed in theprovider interviews, it cannot be evaluated here.The maximum ages reviewed in this chapter areindependent of smoking status.
Marital status and spousal consent are not men-tioned at all in the WHO guidelines and cannot beconstrued as medically necessary criteria. The
164 Clinic-Based Family Planning and Reproductive Health Services in Africa
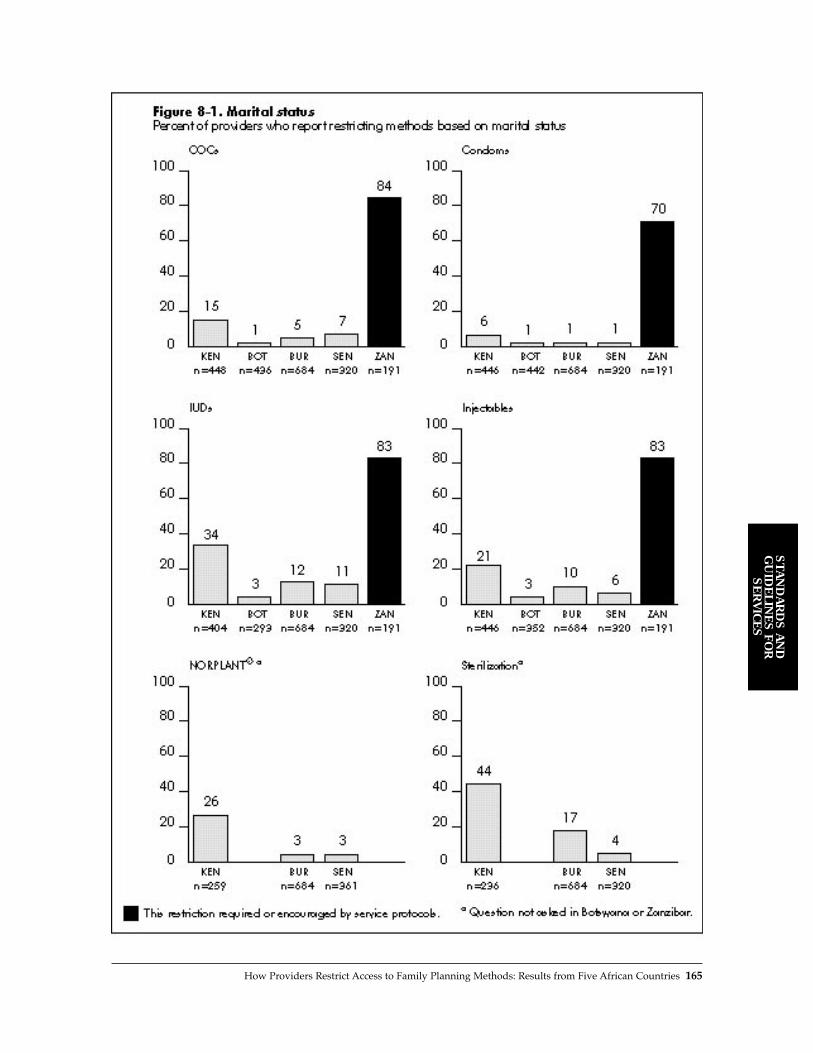
ST
AN
DA
RD
S A
ND
GU
IDE
LIN
ES
FO
RS
ER
VIC
ES
How Providers Restrict Access to Family Planning Methods: Results from Five African Countries 165
requirements for spousal consent with sterilizationand for marital status in Zanzibar are probablymotivated more by social concerns than medicalnecessity.
Overall, the national protocols do reflect legiti-mate medical concerns in many cases. However,for all cases in which the WHO guidelines statemedical cautions for a method, the benefits stilloutweigh the risks, and the method is not consid-ered absolutely contraindicated. For this reason,any criteria in the national protocols that areabsolute (such as one child required for an IUD inBurkina Faso) impose medical considerations morestrictly than WHO recommends. These nationalservice protocols appear to take local cultural fac-tors into account as well, which may generate addi-tional eligibility criteria motivated by social ratherthan medical concerns.
PROVIDER REPORTS OFRESTRICTIONS
Family planning service protocols set eligibility cri-teria for contraceptives, but providers interpret theprotocols. During the Situation Analysis interviews,providers reported that they impose a considerablydifferent and much more restrictive pattern of barri-ers on clients than that required by policy.
Marital Status
Figure 8-1 shows the percentage of providers thatimpose a marital status restriction on the variousmethods. Clearly, Zanzibar is the most restrictivecontext by far, as would be expected given its reli-gious context. Over 70% of providers in Zanzibarrequire that a woman be married in order to receiveCOCs, IUDs, injectables, or even condoms.10
Kenya is the next most restrictive context.Although marital status is not required by policy, athird of Kenyan providers require that IUD clientsbe married, and almost half impose this require-ment for sterilization. For the other methods, thepercentage of providers requiring marriage rangesfrom 6% to 26%.
Providers in Botswana, Burkina Faso, andSenegal are much less restrictive than those in
Zanzibar and Kenya for all methods, with theexception that 17% of Burkina Faso providersrequire that sterilization clients be married. Sincethe service protocols in these countries do notrequire married status for any method, theprovidersÕ actions are generally in concordancewith the protocols.
Spousal Consent
Figure 8-2 presents data on spousal consent restric-tions imposed by providers, by method. InBotswana, Burkina Faso, and Senegal, these resultsrange from 6% to 32% and are all higher than thosefor marital status restrictions. An unmarriedwoman in these countries might actually have aneasier time obtaining contraception than a marriedwoman who does not have her husbandÕs consent.With the exception of sterilization, none of thesecountries has spousal consent restrictions in its ser-vice protocols, so the providers are imposing thisbarrier of their own accord.
The pattern is markedly reversed in Zanzibar.Although ZanzibarÕs spousal consent restrictionsare the highest of the five countries (32% to 57%),they are much lower than its marital status restric-tions. Thus, a married woman without her hus-bandÕs consent might have an easier time than asingle woman obtaining contraceptives inZanzibar. Again, however, protocols in Zanzibardo not require spousal consent, so providers thatimpose this barrier are motivated by other, possi-bly social or religious considerations.
In Kenya, the pattern is not as clear. As com-pared with the marital status results, fewerproviders impose spousal consent requirements onCOCs, IUDs, and injectables, but more providersimpose these restrictions on condoms, NOR-PLANT¨ implants, and sterilization. Once again,Kenya seems to be more restrictive than Botswana,Burkina Faso, and Senegal, but less restrictive thanZanzibar. Spousal consent is not required byKenyan service protocols.
For all countries, the level of spousal consentrequirements for condoms is discouraging, particu-larly since many of these regions have a highprevalence of HIV and other STDs. The Kenyanresult is particularly troubling, since only 6% of
166 Clinic-Based Family Planning and Reproductive Health Services in Africa

ST
AN
DA
RD
S A
ND
GU
IDE
LIN
ES
FO
RS
ER
VIC
ES
How Providers Restrict Access to Family Planning Methods: Results from Five African Countries 167

168 Clinic-Based Family Planning and Reproductive Health Services in Africa
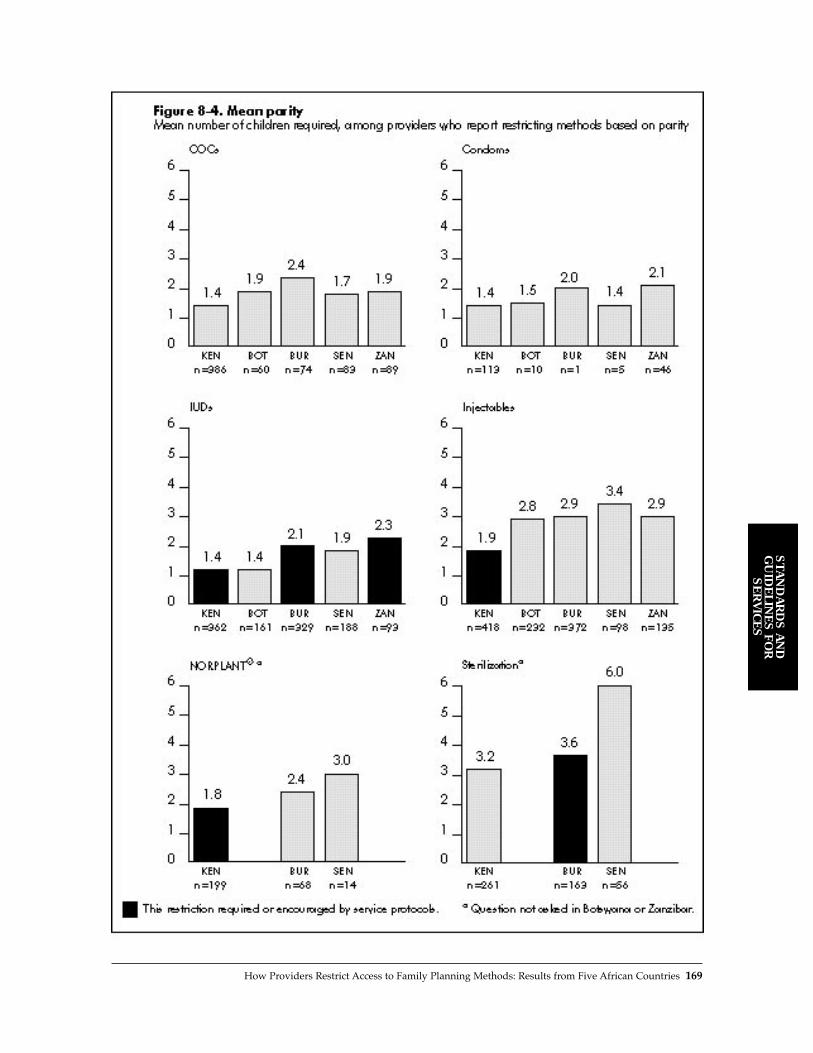
ST
AN
DA
RD
S A
ND
GU
IDE
LIN
ES
FO
RS
ER
VIC
ES
How Providers Restrict Access to Family Planning Methods: Results from Five African Countries 169

providers require that a woman be married toobtain condoms, but fully 41% require that marriedwomen have spousal consent to do so. These find-ings may suggest an unwillingness to recognize thefrequency of HIV transmission within marriedcouples or a fear that the women would use thecondoms in extramarital relationships.
The sterilization results vividly illustrate thatthe link between policy and practice is sometimesweak. Although spousal consent is required by pol-icy in Burkina Faso and Senegal, only 30% and 14%of providers, respectively, actually impose thisrequirement. By contrast, almost two-thirds ofproviders in Kenya require spousal consent,although this restriction is not required by policy.
It may seem intuitive that there would be a cor-relation between imposing barriers of marital sta-tus and spousal consent. If a provider imposes amarital status barrier, is she more likely to imposea spousal consent barrier as well? An investigationwith simple cross-tabulations by method did notshow a strong relationship. In other words, often aprovider does not require a client to be married inorder to receive family planning, but if she is mar-ried, does require spousal consent. This findingmay indicate providersÕ fear of reprisals fromspouses who are unaware of their wivesÕ contra-ceptive use.
Parity
In all five countries, a considerable proportion ofproviders impose parity requirements for the pro-vision of IUDs and injectables (see Figure 8-3). Asdiscussed above, the parity restriction for IUDs isactually required by policy in Burkina Faso, Kenya,and Zanzibar, and may be medically motivated. Infact, in Burkina Faso and Zanzibar, surprisinglyfew providers impose this restriction given that it isrequired.
The restriction on injectables may arise from acommon misconception that they cause sub- orinfertility. This concern may motivate providers torestrict use of the method, not only for the welfareof the client, but also to avoid blame or retributionfrom family members. The in-depth study ofprovider restrictions in Ghana showed that fully94% of providers who restrict injectables based on
parity do so because of concerns about infertilityand blame from relatives (Twum-Baah andStanback, 1995).
KenyaÕs providers are by far the most restrictivewith regard to parity. These restrictions may arisefrom the service protocols that impose parityrestrictions on IUDs, injectables, and NORPLANT¨
implants; within a generally restrictive context,providers may extend this criterion to COCs andfemale sterilization. Indeed, 28% of providers evenrequire that a woman have children before pre-scribing condoms, which carry no risk to fertilitywhatsoever.
Figure 8-4 shows the mean number of childrenrequired among those providers that impose a par-ity requirement. Considerable variation is apparentamong countries and methods. Moreover, where alarge proportion of providers impose a parityrequirement, it is not always for a large number ofchildren. For example, whereas 87% of providers inKenya impose a parity restriction for COCs, theseproviders require the least number of children (onaverage 1.4 children) before a client can receiveCOCs. Likewise, where a small proportion ofproviders impose a parity requirement, a largenumber of children may be required. In Senegal,for example, 27% of providers impose a parityrequirement for injectables, and that subset ofproviders is particularly restrictive, requiring 3.4children on average before a client can receive aninjectable. In short, the percentage of providerswho impose this requirement is not necessarilyrelated to the number of children they require tomeet it.
For sterilization, Burkina FasoÕs providers fol-low the protocols closely: 3 children are requiredby policy, and providers report requiring an aver-age of 3.6 children in practice. The next-highestparity is required for injectables and NORPLANT¨
implants (1.8 to 3.4 children), whereas COCs, con-doms, and IUDs require the lowest parity (1.4 to 2.4children).
These parity requirements appear to fall intotwo groups: those that require demonstrated fertilityand those that require completed fertility. For IUDs,for example, about 1 or 2 children are generallyrequired. This may be a result of the restriction onthis method for nulliparous women, so that
170 Clinic-Based Family Planning and Reproductive Health Services in Africa

ST
AN
DA
RD
S A
ND
GU
IDE
LIN
ES
FO
RS
ER
VIC
ES
How Providers Restrict Access to Family Planning Methods: Results from Five African Countries 171
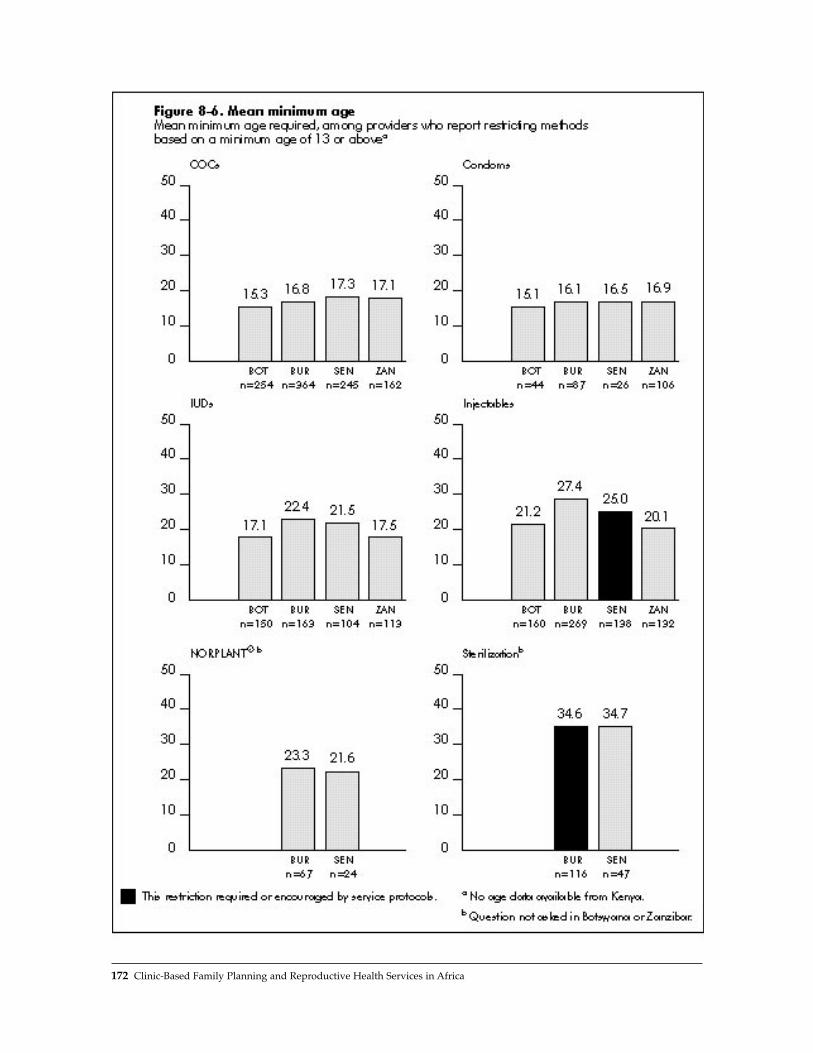
172 Clinic-Based Family Planning and Reproductive Health Services in Africa
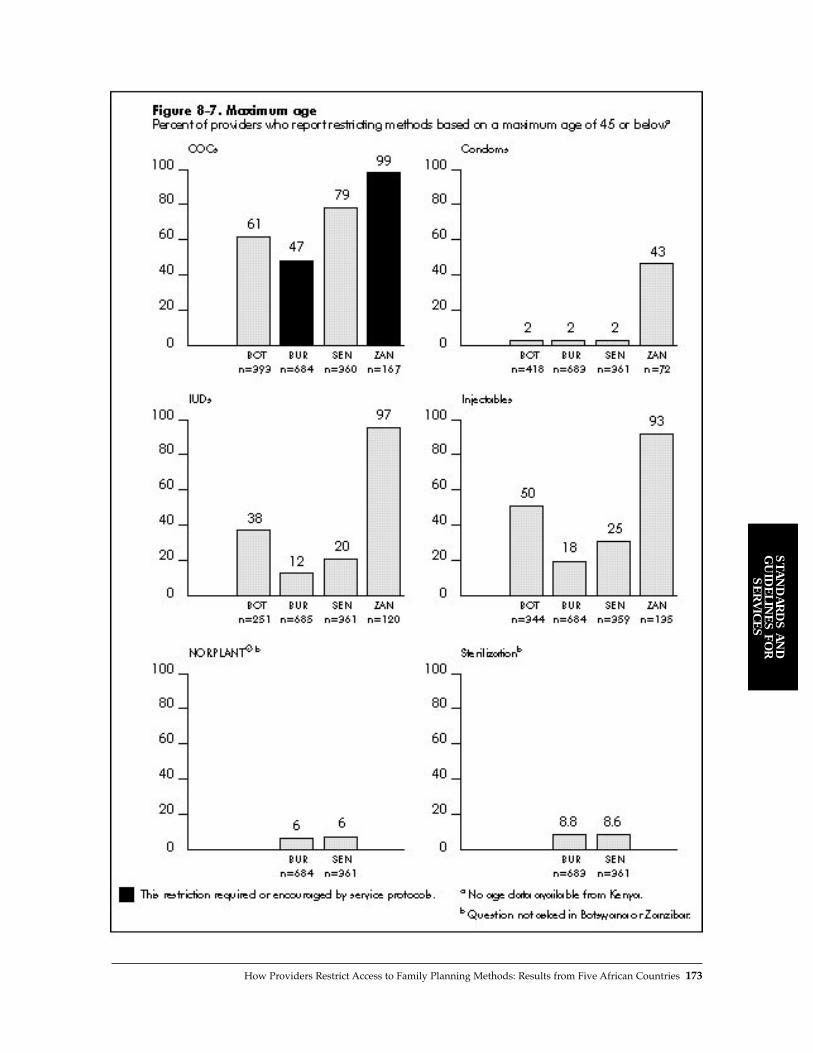
ST
AN
DA
RD
S A
ND
GU
IDE
LIN
ES
FO
RS
ER
VIC
ES
How Providers Restrict Access to Family Planning Methods: Results from Five African Countries 173
demonstrated fertility is required. For sterilization,however, providers appear to require completedfertility (range from 3.2 to 6.0 children), for obviousreasons. In Kenya, the protocols state specificallythat a woman must have proven fertility to receivean IUD, an injectable, or NORPLANT¨ implants;this requirement appears to be interpreted byproviders as requiring 2 children. The mean num-ber of children required for injectables suggeststhat providers are requiring completed fertility,particularly in Senegal (3.4 children), once againreflecting the notion that injectables cause infertili-ty. The requirement for demonstrated fertility of upto 2 children for condoms is surprising, but rela-tively few providers (0.1% to 28%) actually imposethis restriction.
Minimum Age
Providers apply minimum age barriers quite com-monly (see Figure 8-5).11 For COCs, IUDs, andinjectables, 24% to fully 94% of providers requirethat a client be at least 13 years old. None of theprotocols of the five countries requires a minimumage for these methods, so providers are imposingthese barriers for other reasons. The only exceptionis Senegal, where injectable clients are required tobe about age 15 (menstruating for at least 2 years).However, only 38% of the providers impose thisbarrier.
Condoms present an interesting case. InBotswana, Burkina Faso, and Senegal, fewproviders require that a client be at least 13 yearsold to receive a condom, which reflects the proto-cols in these countries. In Zanzibar, fully two-thirdsof providers impose this minimum age require-ment, probably reflecting once again the fact thatZanzibar is the most generally restrictive context ofthe five.
NORPLANT¨ implants and sterilization appearto be surprisingly unrestricted by minimum age.Data are available only for Burkina Faso andSenegal, but in both cases, only 7% to 17% ofproviders require that a client be at least 13 toreceive these methods. The protocols in BurkinaFaso stipulate that a woman must be at least 35 tobe sterilized, but only 17% of providers mentionedimposing this rule. One explanation for this finding
could be that age limitations for these methods,particularly sterilization, seem so obvious to theproviders that they did not think to mention themin the interview.
Figure 8-6 shows the mean minimum agerequirement among those that do impose this bar-rier. Here, the variation among countries is notlarge, but the variation among methods is clear.COCs and condoms have the lowest age require-ments, ranging from 15 to 17. Clients are requiredto be a bit older for IUDs, injectables, and NOR-PLANT¨ implants (17 to 27) and are generallyrequired to be 35 before they can receive a tubal lig-ation. In Burkina Faso, the stipulated minimum ageof 35 for sterilization appears to be upheld by theminority of providers that actually enforce thisrequirement.
Providers appear to consider different methodsappropriate for the various stages of a womanÕsreproductive career. They consider COCs and con-doms appropriate for younger women; IUDs,injectables, and NORPLANT¨ implants appropri-ate for women in their middle reproductive years;and sterilization appropriate for older women whohave completed their childbearing. Although thispattern is arguably appropriate from a social orcultural standpoint, the WHO guidelines do notplace any strict age restrictions on any of thesemethods. Based on age alone, then, clients arebeing restricted from various methods that are oth-erwise medically acceptable.
Maximum Age
The pattern of providers who impose a maximumage restriction (see Figure 8-7) is similar to that forminimum age barriers. COCs, IUDs, and injecta-bles are the most restricted methods, and Zanzibaris the most restrictive country. Once again, con-doms are restricted by very few providers inBotswana, Burkina Faso, and Senegal, but byalmost half of providers in Zanzibar. Also, verysmall percentages of providers in Burkina Faso andSenegal (6% to 9%) impose a maximum age onNORPLANT¨ implants or sterilization.
Maximum age limits are most commonlyapplied to COCs (47% to 99%). As mentionedabove, some medical risk is associated with COC
174 Clinic-Based Family Planning and Reproductive Health Services in Africa
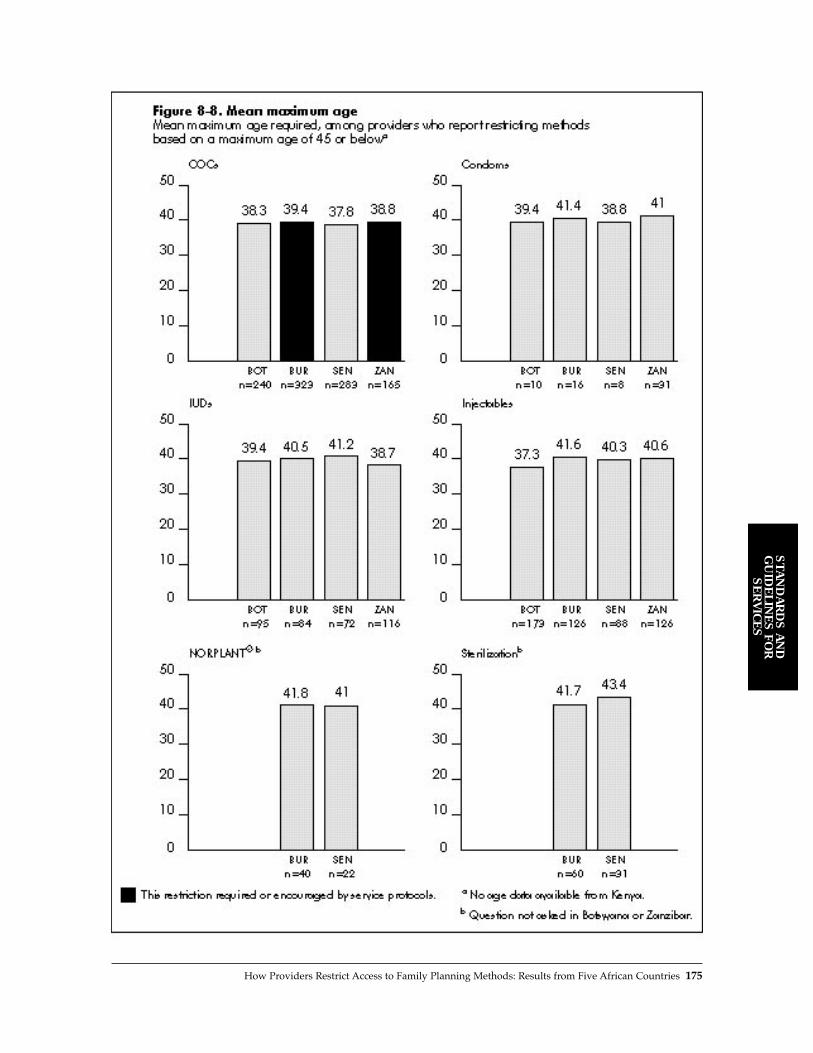
ST
AN
DA
RD
S A
ND
GU
IDE
LIN
ES
FO
RS
ER
VIC
ES
How Providers Restrict Access to Family Planning Methods: Results from Five African Countries 175
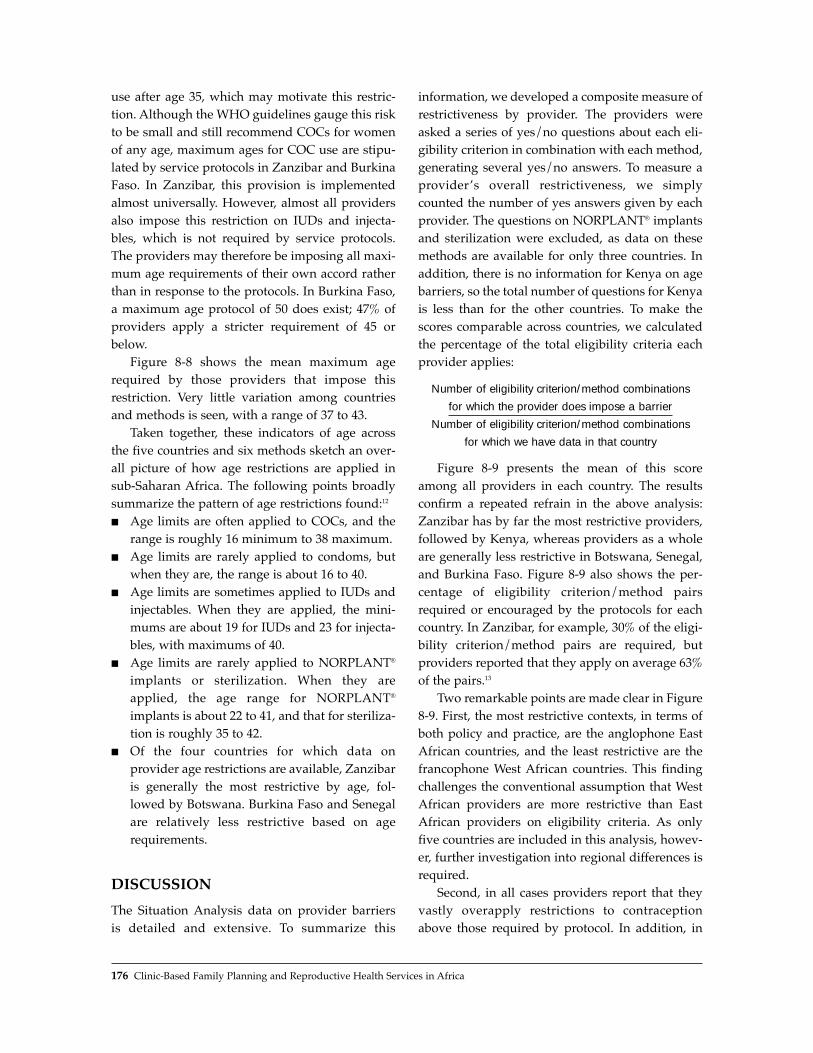
use after age 35, which may motivate this restric-tion. Although the WHO guidelines gauge this riskto be small and still recommend COCs for womenof any age, maximum ages for COC use are stipu-lated by service protocols in Zanzibar and BurkinaFaso. In Zanzibar, this provision is implementedalmost universally. However, almost all providersalso impose this restriction on IUDs and injecta-bles, which is not required by service protocols.The providers may therefore be imposing all maxi-mum age requirements of their own accord ratherthan in response to the protocols. In Burkina Faso,a maximum age protocol of 50 does exist; 47% ofproviders apply a stricter requirement of 45 orbelow.
Figure 8-8 shows the mean maximum agerequired by those providers that impose thisrestriction. Very little variation among countriesand methods is seen, with a range of 37 to 43.
Taken together, these indicators of age acrossthe five countries and six methods sketch an over-all picture of how age restrictions are applied insub-Saharan Africa. The following points broadlysummarize the pattern of age restrictions found:12
■ Age limits are often applied to COCs, and therange is roughly 16 minimum to 38 maximum.
■ Age limits are rarely applied to condoms, butwhen they are, the range is about 16 to 40.
■ Age limits are sometimes applied to IUDs andinjectables. When they are applied, the mini-mums are about 19 for IUDs and 23 for injecta-bles, with maximums of 40.
■ Age limits are rarely applied to NORPLANT¨
implants or sterilization. When they areapplied, the age range for NORPLANT¨
implants is about 22 to 41, and that for steriliza-tion is roughly 35 to 42.
■ Of the four countries for which data onprovider age restrictions are available, Zanzibaris generally the most restrictive by age, fol-lowed by Botswana. Burkina Faso and Senegalare relatively less restrictive based on agerequirements.
DISCUSSION
The Situation Analysis data on provider barriers is detailed and extensive. To summarize this
information, we developed a composite measure ofrestrictiveness by provider. The providers wereasked a series of yes/no questions about each eli-gibility criterion in combination with each method,generating several yes/no answers. To measure aproviderÕs overall restrictiveness, we simplycounted the number of yes answers given by eachprovider. The questions on NORPLANT¨ implantsand sterilization were excluded, as data on thesemethods are available for only three countries. Inaddition, there is no information for Kenya on agebarriers, so the total number of questions for Kenyais less than for the other countries. To make thescores comparable across countries, we calculatedthe percentage of the total eligibility criteria eachprovider applies:
Number of eligibility criterion/method combinations
for which the provider does impose a barrier
Number of eligibility criterion/method combinations
for which we have data in that country
Figure 8-9 presents the mean of this scoreamong all providers in each country. The resultsconfirm a repeated refrain in the above analysis:Zanzibar has by far the most restrictive providers,followed by Kenya, whereas providers as a wholeare generally less restrictive in Botswana, Senegal,and Burkina Faso. Figure 8-9 also shows the per-centage of eligibility criterion/method pairsrequired or encouraged by the protocols for eachcountry. In Zanzibar, for example, 30% of the eligi-bility criterion/method pairs are required, butproviders reported that they apply on average 63%of the pairs.13
Two remarkable points are made clear in Figure8-9. First, the most restrictive contexts, in terms ofboth policy and practice, are the anglophone EastAfrican countries, and the least restrictive are thefrancophone West African countries. This findingchallenges the conventional assumption that WestAfrican providers are more restrictive than EastAfrican providers on eligibility criteria. As onlyfive countries are included in this analysis, howev-er, further investigation into regional differences isrequired.
Second, in all cases providers report that theyvastly overapply restrictions to contraceptionabove those required by protocol. In addition, in
176 Clinic-Based Family Planning and Reproductive Health Services in Africa

many individual cases, providers seem unaffectedby the protocols and may even underapply them.Moreover, no information is available for thisstudy on how these reported eligibility criteria areactually applied to clients. This relationship amongprotocols, provider attitudes, and provider behav-ior is complex, but providers do report that theyapply more eligibility criteria than the serviceguidelines recommend.
In-depth interviews about barriers withproviders in Ghana revealed that Òprovidersimpose these restrictions with the best of inten-tions. Most feel that by doing so, they are protect-ing both the client and their societyÓ (Twum-Baahand Stanback, 1995). If providers are motivated byprotecting the health of their clients, revised ser-vice protocols and training programs should ame-liorate the situation. And indeed, medical aspectsof these concerns are being dealt with by suchorganizations as the United States Agency forInternational Development with training pro-grams on contraceptive updates, in which the epi-demiological evidence for restrictions on variousmethods is reviewed.
A providerÕs motivation for imposing limita-tions to protect her society, culture, or values is,
however, an equally serious issue, and perhaps oneless easily addressed. In this case, the resistance tochange is probably stronger, and determining theappropriate means of changing provider behavioris more difficult. The cultural and societal concernsexpressed by providers suggest that service proto-cols, although often medically based, are notapplied in a thoroughly medical fashion. The cul-tural attitudes of providers have an enormouseffect on how services are delivered and must bethoroughly addressed if training is to be successfulin lifting these restrictions. Further, althoughaccess is an issue of great concern, quality of caremust be addressed simultaneously if reproductivehealth services are to improve.
REFERENCES
Service Protocols in Effect at Time ofSituation Analysis Studies
Botswana: Botswana Family Planning General PolicyGuidelines and Service Standards. 1994. Maternal andChild Health/Family Planning Unit, Department ofPrimary Health Care, Ministry of Health, Botswana.
ST
AN
DA
RD
S A
ND
GU
IDE
LIN
ES
FO
RS
ER
VIC
ES
How Providers Restrict Access to Family Planning Methods: Results from Five African Countries 177

Burkina Faso: Politique et Standards des Services SMI/PFau Burkina Faso. 1992. Minist�r� de la Sant� delÕAction Sociale et de la Famille, Direction de laSant� de la Famille, INTRAH, United States Agencyfor International Development, Burkina Faso.
Kenya: Family Planning Policy Guidelines and Standardsfor Service Providers. 1991. Family PlanningProgramme, Division of Family Health, Ministry ofHealth, Kenya.
Senegal: Protocoles des Services de Planification Familialeau S�n�gal. 1996. Minist�re de la Sant� et de lÕActionSociale, Programme National de PlanificationFamiliale, R�publique du S�n�gal.
Zanzibar: MCH/FP/EPI Service Guidelines. 1993. Ministryof Health, MCH/FP Unit, Zanzibar/Tanzania.
Other References
Baakile, B., N. Maggwa, L. Maribe, and R. Miller. 1996.A Situation Analysis of the Maternal and ChildHealth/Family Planning (MCH/FP) Program inBotswana. Ministry of Health MCH/FP Unit andPopulation Council, Botswana.
Bertrand, J., K. Hardee, R. Magnani, and M. Angle.1995. ÒAccess, quality of care, and medical barriersin family planning programs.Ó International FamilyPlanning Perspectives, 21, 2:64Ð69.
Direction de la Sant� de la Famille and PopulationCouncil. 1996. Deuxi�me Analyse Situationnelle duProgramme de Planification Familiale au Burkina Faso.Minist�re de la Sant�, Burkina Faso.
Family Health International. 1994. Improving ProviderPractices: Highlights of the Workshop ÒReduction ofMedical Barriers to Contraception.Ó FHI, ResearchTriangle Park, North Carolina.
Ghana Statistical Service. 1994. A Situation AnalysisStudy of Family Planning Service Delivery Points inGhana. GSS, Accra, Ghana.
Herndon, N. 1993. ÒNext step for EgyptÑaccess tomore methods.Ó NETWORK, 13,3:18Ð21.
Jato, M.N., C.A. Vondrasek, and D.N. Awasum. 1995.ÒCommunication strategies to maximize access andimprove the quality of family planning and repro-ductive health care services.Ó Unpublished paperpresented at the Francophone Regional Conferenceon Maximizing Access and Improving the Quality ofFamily Planning and Reproductive Health Servicesin Francophone Sub-Saharan Africa, Burkina Faso.
Mapunda, P.S. 1996. The Zanzibar Family PlanningSituation Analysis Study. Zanzibar Family PlanningProgram, Zanzibar, Tanzania.
McDonald, O.P., K. Hardee, W. Bailey, M. Clyde, andM.T. Villinski. 1995. ÒQuality of care amongJamaican private physicians offering family planningservices.Ó Advances in Contraception, 11,3:245Ð254.
Omunde, A., L. Ndhlovu, J. Solo, R. Miller, and K. Miller. 1997. An Assessment of Clinic-Based FamilyPlanning Services in Kenya: Results from the 1995Situation Analysis. Ministry of Health, Division ofFamily Health, Kenya, and the Population Council,New York.
Programme National de Planification Familiale andPopulation Council. 1995. Analyse Situationnelle duSyst�me de Prestation de Services de PlanificationFamiliale au S�n�gal: Rapport Final. PopulationCouncil, New York.
Shelton, J.D., M.A. Angle, and R.A. Jacobstein. 1992.ÒMedical barriers to access to family planning.Ó TheLancet, 340,8831:1334Ð1335.
Twum-Baah, K.A. and J. Stanback. 1995. ProviderRationales for Restrictive Family Planning ServicePractices in Ghana. Ghana Statistical Services andFamily Health International, Ghana.
World Health Organization. 1996. Improving Access toQuality Care in Family Planning: Medical EligibilityCriteria for Contraceptive Use. WHO, Geneva,Switzerland.
NOTES
1 See Baakile et al. (1996), Direction de la Sant� de laFamille (1996), Omunde et al. (1997), ProgrammeNational de Planification Familiale (1995), andMapunda (1996).
2 While Zanzibar is politically a part of the UnitedRepublic of Tanzania, it has separate governmentstructures in all areas except foreign affairs, defense,communications, currency, and higher education(Mapunda, 1996). For simplicity, Zanzibar is referredto as a country in this analysis.
3 See Chapter 2 for basic information about these fivestudy contexts.
4 Each graph was tested for the significance of differ-ences among countries using a one-way analysis ofvariation (ANOVA) and a post hoc TukeyÔs HonestlySignificant Difference (HSD) test. The overall F testsfor most of the graphs were significant at p < .01,and the TukeyÕs test showed a range of significantdifferences among countries. One test, mean parityimposed on condoms, was significant at p < .05. ForNORPLANT¨ implants and sterilization, none of theindicators regarding age minimums and maximumsshowed a significant difference between any twocountries. For the mean number of children required,minimum age imposed, and maximum age imposed,the results among countries presented here are sig-nificantly different from each other. However, sincethe analysis is not concerned with making fine dis-tinctions among countries that differ only slightly,the details of statistical significance are not presentedin the graphs.
178 Clinic-Based Family Planning and Reproductive Health Services in Africa

5 In some cases, a provider may report unusuallyextreme age limits. These indicators thereforeimpose a minimum threshold of 13 and a maximumthreshold of 45. Thus if a provider reports that shehas a minimum age requirement of less than 13 for amethod, she is counted as not having a minimumage requirement. Likewise, if a provider reports thatshe has a maximum age requirement of more than45 for a method, she is counted as not having a max-imum age requirement.
6 For parity, minimum age, and maximum agerequirements, means are presented rather thanmedians. The medians were calculated, but they didnot substantially differ from the means for any ofthe results. This is to be expected for the age datasince all outliers were deliberately removed by the13/45 thresholds.
7 The WHO guidelines classify eligibility criteria intofour categories: no restriction necessary, advantagesgenerally outweigh risks, risks usually outweighadvantages, and health risk is unacceptable. The lasttwo categories require that the provider suggestalternative contraceptive methods. Many of thenational protocols studied use the same classifica-tion scheme.
8 The parity requirements for injectables and NOR-PLANT¨ implants have been removed in KenyaÕscurrent, revised service protocols (June 1997).
9 In fact, the WHO guidelines do identify a relativecontraindication for IUDs for women under 20because Òthere is concern about the risk of expul-sion in younger age groups due to nulliparity.Ó Ineffect, this is a parity restriction that is correlated
with younger age. However, the present analysisattempts to tease out each barrier individually.Thus, because WHO has not specified a medicalreason to restrict IUDs based on age alone, age isnot considered a medically necessary criterion forpresent purposes.
10 In fact, since the marriage requirement for contra-ceptive use is so strong in Zanzibar, it is remarkablethat so many providers are willing to contradict thatstandard. For example, 30% of providers are willingto give condoms to unmarried women, an extraordi-nary finding in that context.
11 Kenya has age restriction protocols, but data onactual restrictions imposed by providers are notavailable from the Situation Analysis study, so thatcountry is omitted from the discussion here and inthe next subsection.
12 A study done by McDonald et al. (1995) in Jamaicashows remarkably similar results for providerrestrictions based on age. All of the age ranges theyreport are fully comparable to those found here,with the exception that the mean minimum age forsterilization clients in Jamaica is about 27, muchyounger than our findings. In general, however, thesimilarity of the results suggests that the normativestructure of these restrictions may not be limited toAfrica alone.
13 This comparison must be interpreted with caution.In this graph, we do not know whether the barriersrequired by policy are the same as the ones beingapplied by staff. The comparison between the 30%and 63% in Zanzibar, for example, gives only arough idea of the overapplication of barriers.
ST
AN
DA
RD
S A
ND
GU
IDE
LIN
ES
FO
RS
ER
VIC
ES
How Providers Restrict Access to Family Planning Methods: Results from Five African Countries 179


While there is general agreement among the inter-national medical community that laboratory testsare not necessary for the safe provision of familyplanning services, there is less agreement aboutother medical procedures, such as pelvic exams.While some argue that such procedures are helpfulto women who may never otherwise have access tohealth care, others consider such procedures as bar-riers to contraceptive use. Historically, West Africanfamily planning programs were known for requir-ing numerous tests and procedures before provid-ing a woman with a contraceptive method.However, many countries in the region have modi-fied their service-delivery guidelines in response torecent studies demonstrating that laboratory tests,as well as other procedures, are in fact not necessaryfor safe contraceptive use.
A comparison of results from the SituationAnalysis studies conducted in Burkina Faso,Senegal, and Ghana against international standardsreveals the overapplication of several tests and pro-cedures by family planning providers. Moreover,while most providers require and perform thosetests and procedures considered essential for pro-viding pills, the IUD, and injectables, there is someevidence of underapplication of screening for sexu-ally transmitted infections by medical history inproviding the IUD. Laboratory tests are requiredand performed far less frequently than other proce-dures for the methods examined in this chapter.
The overapplication of several procedures isquite common, particularly pelvic exam for the pilland injectable, blood pressure reading for the IUDand injectable, and breast exam and weight takingfor all methods. The data indicates that blood pres-sure and weight are taken for most clients, regard-less of method or the reason for the visit to the ser-vice delivery point. As these are relatively simple
and noninvasive procedures, they may not in factpose barriers to the use of family planning methods.However, it is not clear from the data whether per-forming these procedures may cause unnecessarydelays in the provision of services.
In contrast, the high frequency of pelvic andbreast exams may in fact discourage some womenfrom using family planning. At the very least, theseprocedures are likely to take a substantial amount ofthe providersÕ time. In addition, breast exams andPap smears, if included in a pelvic exam, are of quitelimited usefulness in many West African contextsbecause treatment for breast and cervical cancer isgenerally not available. It is not possible to ascertainfrom the data whether women perceive these proce-dures as barriers to the use of family planning ser-vices. Women may welcome the procedures as theyrarely have access to medical services (although thisargument does not support the performance ofthese procedures for revisit clients).
The results presented in this chapter have impli-cations for improving service delivery at bothnational and clinic levels. At the national level, theoverapplication of several procedures suggests thatservice delivery guidelines may need to bereviewed in light of the international standards andthe needs of the community. At the clinic level, thediscrepancy between the tests that providers saythey require and the ones that they are observed torequire suggests that they may not always agreewith the guidelines currently in place. In revisingguidelines, national-level program managersshould consult with supervisors, providers, andclients; this inclusion may help motivate providersto follow the guidelines more closely. In addition,provider training, both formal and on-the-job, mayhelp ensure that providers implement nationalguidelines more accurately and effectively.
Tests and Procedures Required of Clients in Three Countries of West Africa 181
ST
AN
DA
RD
S A
ND
GU
IDE
LIN
ES
FO
RS
ER
VIC
ES
KEY POINTS AND CONCLUSIONS
Tests and Procedures Required of Clients in Three Countries of West Africa
9


Historically, West African family planning pro-grams were known for requiring numerous testsand procedures before providing a woman with acontraceptive method. In response to several recentstudies demonstrating that laboratory testing andother procedures are in fact not necessary for safecontraceptive use (World Health Organization,1996), several West African countries have modi-fied their service-delivery guidelines (Diadhiou etal., 1990). However, there is some evidence to sug-gest that many providers still require clients toundergo a series of tests and procedures (Twum-Baah and Stanback, 1995; Stanback et al., 1994).This chapter examines the tests and procedureswomen in West Africa must undergo prior toreceiving a contraceptive method.
While policies requiring laboratory tests andother medical procedures are generally motivatedby concern for womenÕs health and the safe use ofcontraceptives, they can actually pose barriers to use(see Chapter 8). In addition, many of these tests andprocedures are unnecessary. Laboratory tests, forexample, are conducted to screen for medical con-traindications such as diabetes, anemia, and highcholesterol. However, several studies have shownthat the prevalence of medical contraindications touse of contraception is very low, thus rendering theuniversal laboratory testing of all clients unneces-sary (Stanback et al., 1994; Buekens et al., 1990).
More important, requiring women to undergonumerous tests and procedures may discouragethem from adopting or continuing to use contra-ception, especially if they must have the tests per-formed at their own expense outside the familyplanning clinic (Stanback et al., 1994; Diadhiou et
al., 1993a). A study in Senegal, for example,showed that women seeking to use the pill wererequired to undergo numerous tests at a privatelaboratory at their own expense prior to receiving aprescription (Stanback et al., 1994); in some cases,women had to make up to nine visits (clinic andlaboratory). In addition to discouraging patients,such practices may affect the functioning of theclinic by limiting the number of patients that can beseen or the methods that can be provided.
Unnecessary laboratory tests and other proce-dures, such as pelvic exams and numerous revisits,fall into the category of Òprocess and schedulinghurdles,Ó one of seven types of medical barriers tocontraceptive use identified by Bertrand et al.(1995).1 More generally, medical barriers have beendefined by Shelton et al. (1992:334) as Òpractices,derived at least partly from a medical rationale,that result in a scientifically unjustifiable impedi-ment to, or denial of, contraception.Ó
While there is general agreement among theinternational medical community that laboratorytests are not necessary for the safe provision of fam-ily planning services, there is less agreement aboutother medical procedures, such as pelvic exams.Some argue that such procedures are helpful towomen who may never otherwise have access tohealth care (Kenya Ministry of Health andPopulation Council, 1995). Providers interviewed inGhana, for example, stated that they conduct fullphysical and pelvic exams not only to identify con-traindications, but also because Ghanaian womenhave limited opportunities for such medical care(Twum-Baah and Stanback, 1995).2 Others, however,regard such procedures as barriers to contraceptive
Tests and Procedures Required of Clients in Three Countries of West Africa 183
ST
AN
DA
RD
S A
ND
GU
IDE
LIN
ES
FO
RS
ER
VIC
ES
Tests and Procedures Required of Clients in Three Countries of West AfricaLisanne F. Brown and Gwendolyn T. Morgan
9

use (Bertrand et al., 1995). As with laboratory tests,some women may not use family planning servicesif they know they must undergo a physical and/orpelvic exam.
Additional support for offering (not requiring)at least some basic tests and procedures came outof the International Conference on Population andDevelopment (ICPD), which emphasized a broaderview of family planning as a component of repro-ductive health. In this context, offering a variety oftests and procedures may respond to the healthneeds of women in developing countries.
METHODOLOGY
This chapter examines data on tests and proceduresfrom Situation Analysis studies conducted in threecountries of West Africa: Burkina Faso (1995),Senegal (1994), and Ghana (1993).3 Data from theprovider interview and observation instruments(see Chapter 1) were examined to determine the fre-quency with which providers reported they requiretests and procedures for hypothetical clients, andthe actual tests and procedures clients underwent inorder to receive a method. As part of the providerinterview instrument, providers were asked whichprocedures and tests they consider necessary beforeproviding contraceptive methods (responses aremethod specific).4 The actual tests and proceduresclients underwent during clinic visits were assessedthrough the observation instrument.
The reported and actual tests and proceduresthus determined were then compared with interna-tional guidelines that classify each test and proce-dure according to whether it is essential or unnec-essary for safe use of each contraceptive method (asdescribed below). Tests and procedures required forthe pill,5 injectable, and IUD are included in the pre-sent analysis.6 NORPLANT¨7 and sterilization areexcluded because of an insufficient number ofclients and providers for these methods in the threecountries at the time the Situation Analysis studieswere conducted. Tests and procedures are analyzedseparately for new/switching clients and revisitclients, as one would expect a difference in the testsand procedures required for these groups. The fol-lowing tests and procedures were examined:
■ Laboratory tests¥ Pap smear ¥ Urine test¥ Blood test¥ STI screening (by history or laboratory test)
■ Procedures¥ Medical history¥ Blood pressure reading¥ Weight taking¥ Pelvic exam¥ Breast exam
Classification of Tests and Procedures
A standard classification for all three countries wasadopted in order to permit the comparative analy-sis, although we recognize that each country mayhave its own clinical guidelines. The classificationused for this analysis is based on internationalstandards developed by the Technical Guidance/Competence Working Group (1997).
Table 9-1 shows the classification of the testsand procedures used in this analysis. The fourclasses are defined as follows: ■ Class AÑessential and mandatory or otherwise
important in all circumstances for safe andeffective use of the contraceptive method.
■ Class BÑmedically/epidemiologically rationalin some circumstances to optimize the safe andeffective use of the contraceptive method, butmay not be appropriate for all clients in all settings.
■ Class CÑmay be appropriate for good preven-tive health care, but not materially related tosafe and effective use of the contraceptivemethod.
■ Class DÑnot materially related to either goodroutine preventive health care or safe and effec-tive use of the contraceptive method.Medical history taking is considered Class A
(essential) for all methods, as this is the recom-mended means of identifying existing conditionsthat may contraindicate the use of a contraceptivemethod. It is the only procedure considered essen-tial for safe use of the pill and injectable. For safeuse of the IUD, a pelvic exam and STI screening arealso considered essential. Class B tests and proce-dures include blood pressure reading and breast
184 Clinic-Based Family Planning and Reproductive Health Services in Africa
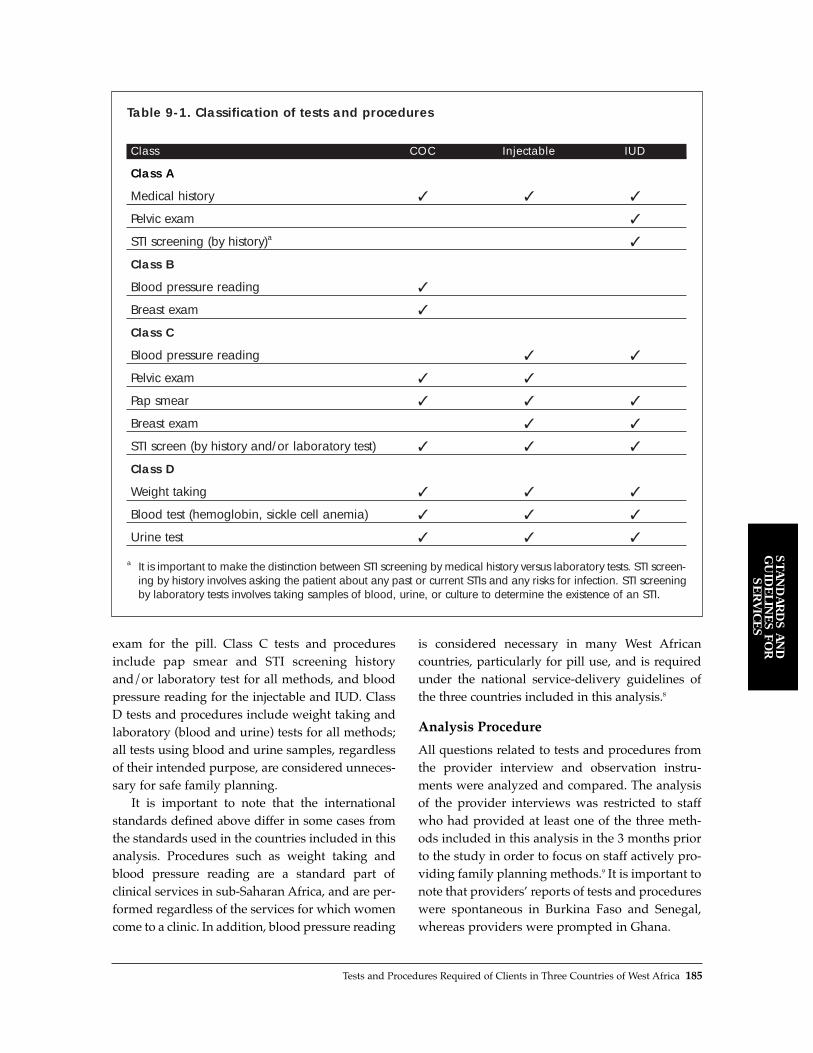
exam for the pill. Class C tests and proceduresinclude pap smear and STI screening historyand/or laboratory test for all methods, and bloodpressure reading for the injectable and IUD. ClassD tests and procedures include weight taking andlaboratory (blood and urine) tests for all methods;all tests using blood and urine samples, regardlessof their intended purpose, are considered unneces-sary for safe family planning.
It is important to note that the internationalstandards defined above differ in some cases fromthe standards used in the countries included in thisanalysis. Procedures such as weight taking andblood pressure reading are a standard part of clinical services in sub-Saharan Africa, and are per-formed regardless of the services for which womencome to a clinic. In addition, blood pressure reading
is considered necessary in many West Africancountries, particularly for pill use, and is requiredunder the national service-delivery guidelines ofthe three countries included in this analysis.8
Analysis Procedure
All questions related to tests and procedures fromthe provider interview and observation instru-ments were analyzed and compared. The analysisof the provider interviews was restricted to staffwho had provided at least one of the three meth-ods included in this analysis in the 3 months priorto the study in order to focus on staff actively pro-viding family planning methods.9 It is important tonote that providersÕ reports of tests and procedureswere spontaneous in Burkina Faso and Senegal,whereas providers were prompted in Ghana.
Tests and Procedures Required of Clients in Three Countries of West Africa 185
ST
AN
DA
RD
S A
ND
GU
IDE
LIN
ES
FO
RS
ER
VIC
ES
Table 9-1. Classification of tests and procedures
Class COC Injectable IUD
Class A
Medical history ✓ ✓ ✓
Pelvic exam ✓
STI screening (by history)a ✓
Class B
Blood pressure reading ✓
Breast exam ✓
Class C
Blood pressure reading ✓ ✓
Pelvic exam ✓ ✓
Pap smear ✓ ✓ ✓
Breast exam ✓ ✓
STI screen (by history and/or laboratory test) ✓ ✓ ✓
Class D
Weight taking ✓ ✓ ✓
Blood test (hemoglobin, sickle cell anemia) ✓ ✓ ✓
Urine test ✓ ✓ ✓
a It is important to make the distinction between STI screening by medical history versus laboratory tests. STI screen-ing by history involves asking the patient about any past or current STIs and any risks for infection. STI screeningby laboratory tests involves taking samples of blood, urine, or culture to determine the existence of an STI.

The observation instrument included two typesof clients. ÒNew and switching clientsÓ compriseall clients accepting a new method, including first-time users of the family planning services andclients who have decided to change methods.ÒRevisit clientsÓ include those obtaining a resupplyof their method, and those having problems withtheir method and choosing to either continue orterminate its use.
The unit of analysis for the comparison of theprovider interview and observation instruments isthe provider. Therefore, we compared the tests andprocedures providers said they require with thosethe providers actually performed on new/switch-ing clients. This comparison was carried out onlyfor new/switching clients because the questions inthe provider interview referred to proceduresrequired before prescribing a method for the firsttime, i.e., for clients new to the method.
Since in some cases the same provider wasobserved with several different clients, it was nec-essary to aggregate the observations by provider. Ifa provider was observed to have ordered a proce-dure with half or more of his/her clients, he/shewas counted as performing the procedure in gen-eral. Missing cases were excluded.
When examining the results of the providerinterview/observation comparison, it is also impor-tant to note the differences in sample sizes. The sam-ple sizes for the observation instrument are muchsmaller than those for the provider interviews, asonly those providers who were observed with a newclient for each method are included in the analysis.In contrast, all providers who had provided a con-traceptive method in the last 3 months were askedabout the tests and procedures they would requirebefore providing a method to a new client.
Procedures performed on revisit clients werealso examined. These data are presented for infor-mational purposes only, and were not comparedwith data from the provider interview or interna-tional standards, as there are no universal stan-dards for revisit clients.
Analysis Limitations
This analysis has several limitations that should benoted. First, the initial analysis plan called for a
matched analysis of the provider responses and theobserved staff-client interactionsÑcomparingwhat an individual provider said he/she requiredwith what he/she was observed doing for eachclient. Although we did attempt to matchproviders and clients, the severely reduced samplesizes rendered such an approach impractical.
Second, the data do not permit a determinationof whether tests are offered at the clinics included inthis analysis, or clients are referred to a laboratoryor other SDP with laboratory facilities. The onlyexception is the availability of Pap smears inSenegal (at 2% of clinics) and Ghana (at 9% of clin-ics). Thus a low frequency of a given test may indi-cate a lack of equipment or referral protocol, ratherthan a test not being required. Therefore, the esti-mates obtained in this analysis may understate thetests actually required. Discussions with clinicalstaff in Burkina Faso indicated that few clinics,apart from some in urban areas, have the varioustests available. Therefore, most women are referredoutside the clinic (generally to laboratories in town)if tests are deemed necessary. An exception is albu-mine tests, which are available in most urban andrural clinics because they are instantaneous.
Third, when providers say they require STIscreening, we do not know whether they requirelaboratory tests or verbal diagnostic screening.This is an important distinction since the two areclassified very differently by the internationalguidelines: STI screening by history is consideredessential for the IUD, whereas STI screening by lab-oratory test is unnecessary for all methods.
Finally, results of the clientsÕ medical historiesare not available. It is not possible to determinewhether clients were required to undergo specifictests because their medical histories indicated apossible contraindication to a method, or theprovider ordered the tests indiscriminately.
RESULTS
Comparison of Tests and ProceduresRequired and Performed by Providers
This section presents results of the comparison ofprovider-related requirements, observed interactionswith new/switching clients, and international
186 Clinic-Based Family Planning and Reproductive Health Services in Africa
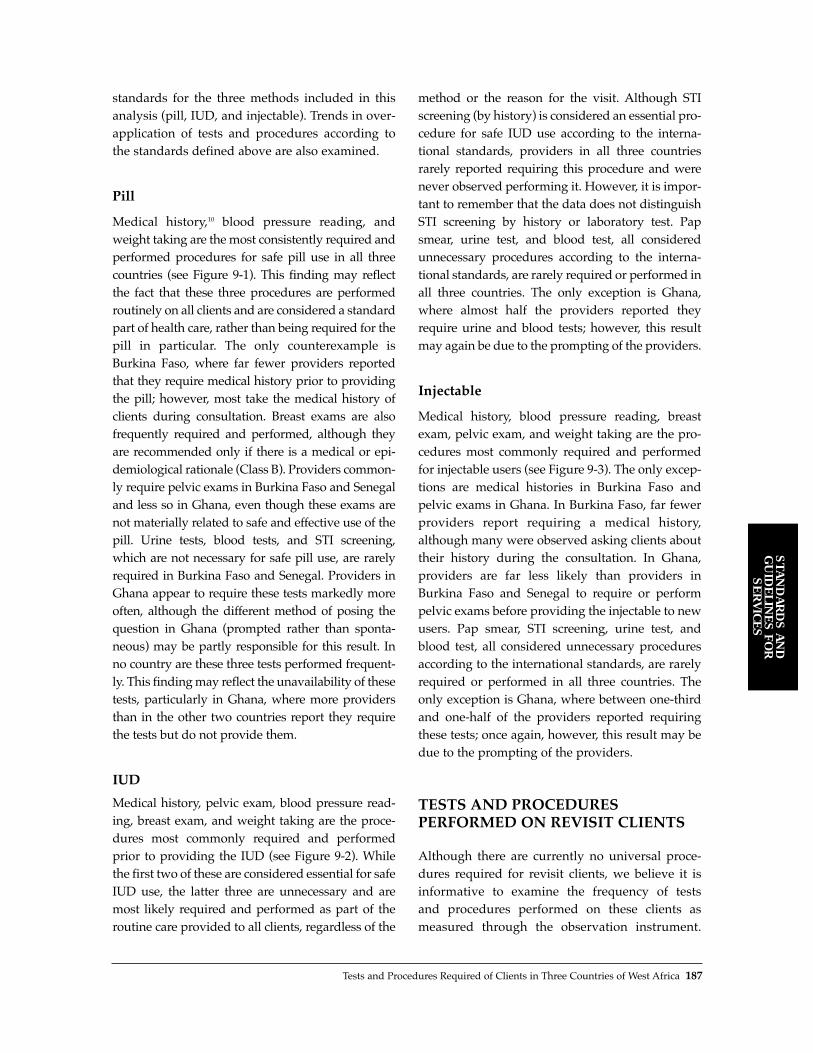
standards for the three methods included in thisanalysis (pill, IUD, and injectable). Trends in over-application of tests and procedures according tothe standards defined above are also examined.
Pill
Medical history,10 blood pressure reading, andweight taking are the most consistently required andperformed procedures for safe pill use in all threecountries (see Figure 9-1). This finding may reflectthe fact that these three procedures are performedroutinely on all clients and are considered a standardpart of health care, rather than being required for thepill in particular. The only counterexample isBurkina Faso, where far fewer providers reportedthat they require medical history prior to providingthe pill; however, most take the medical history ofclients during consultation. Breast exams are alsofrequently required and performed, although theyare recommended only if there is a medical or epi-demiological rationale (Class B). Providers common-ly require pelvic exams in Burkina Faso and Senegaland less so in Ghana, even though these exams arenot materially related to safe and effective use of thepill. Urine tests, blood tests, and STI screening,which are not necessary for safe pill use, are rarelyrequired in Burkina Faso and Senegal. Providers inGhana appear to require these tests markedly moreoften, although the different method of posing thequestion in Ghana (prompted rather than sponta-neous) may be partly responsible for this result. Inno country are these three tests performed frequent-ly. This finding may reflect the unavailability of thesetests, particularly in Ghana, where more providersthan in the other two countries report they requirethe tests but do not provide them.
IUD
Medical history, pelvic exam, blood pressure read-ing, breast exam, and weight taking are the proce-dures most commonly required and performedprior to providing the IUD (see Figure 9-2). Whilethe first two of these are considered essential for safeIUD use, the latter three are unnecessary and aremost likely required and performed as part of theroutine care provided to all clients, regardless of the
method or the reason for the visit. Although STIscreening (by history) is considered an essential pro-cedure for safe IUD use according to the interna-tional standards, providers in all three countriesrarely reported requiring this procedure and werenever observed performing it. However, it is impor-tant to remember that the data does not distinguishSTI screening by history or laboratory test. Papsmear, urine test, and blood test, all consideredunnecessary procedures according to the interna-tional standards, are rarely required or performed inall three countries. The only exception is Ghana,where almost half the providers reported theyrequire urine and blood tests; however, this resultmay again be due to the prompting of the providers.
Injectable
Medical history, blood pressure reading, breastexam, pelvic exam, and weight taking are the pro-cedures most commonly required and performedfor injectable users (see Figure 9-3). The only excep-tions are medical histories in Burkina Faso andpelvic exams in Ghana. In Burkina Faso, far fewerproviders report requiring a medical history,although many were observed asking clients abouttheir history during the consultation. In Ghana,providers are far less likely than providers inBurkina Faso and Senegal to require or performpelvic exams before providing the injectable to newusers. Pap smear, STI screening, urine test, andblood test, all considered unnecessary proceduresaccording to the international standards, are rarelyrequired or performed in all three countries. Theonly exception is Ghana, where between one-thirdand one-half of the providers reported requiringthese tests; once again, however, this result may bedue to the prompting of the providers.
TESTS AND PROCEDURESPERFORMED ON REVISIT CLIENTS
Although there are currently no universal proce-dures required for revisit clients, we believe it isinformative to examine the frequency of tests and procedures performed on these clients as measured through the observation instrument.
Tests and Procedures Required of Clients in Three Countries of West Africa 187
ST
AN
DA
RD
S A
ND
GU
IDE
LIN
ES
FO
RS
ER
VIC
ES

188 Clinic-Based Family Planning and Reproductive Health Services in Africa

Tests and Procedures Required of Clients in Three Countries of West Africa 189
ST
AN
DA
RD
S A
ND
GU
IDE
LIN
ES
FO
RS
ER
VIC
ES

190 Clinic-Based Family Planning and Reproductive Health Services in Africa

However, we offer no conclusions about whetherthe tests and procedures performed were appro-priate or not. More important, the data do notallow us to assess accurately why a client returnedto the SDP; thus it is not possible to determinewhat percentage of clients returned because ofproblems with their method or their health.
Pill
Blood pressure reading and weight taking are theprocedures most commonly performed on revisitpill users. Again, this finding may reflect the factthat these procedures are routinely performed onall clients. Pelvic and breast exams were performedon 5% to 40% of revisit pill users. Revisit pill usersin Burkina Faso and Senegal underwent pelvic andbreast exams most frequently (25Ð40%), while only5% of revisit users in Ghana had a pelvic exam and25% a breast exam. Laboratory tests were requiredof fewer than 5% of revisit pill users.
IUD
A pelvic exam is the most common procedure per-formed on revisit IUD users in Burkina Faso andSenegal; only half of revisit IUD users in Ghanaunderwent a pelvic exam. Blood pressure readingand weight taking were also commonly observedamong revisit IUD users, particularly in Senegaland Ghana; just one-third of revisit IUD users inBurkina Faso underwent these procedures.Laboratory tests and STI screening were requiredof very few revisit IUD users, with the exception ofPap smears in Senegal (observed for 10% of revisitclients).
Injectable
As with the other methods, blood pressure readingand weight taking are the most commonly per-formed procedures for revisit injectable users, par-ticularly in Senegal. Pelvic and breast exams wereperformed on between 10% and 45% of revisitinjectable users across the three countries, againmost frequently in Senegal. As with the pill and theIUD, very few revisit clients were required toundergo laboratory tests or STI screening.
CONCLUSIONS
A comparison of the results from the SituationAnalysis studies in Burkina Faso, Senegal, andGhana with the international standards reveals theoverapplication of several tests and procedures. Onthe other hand, while most providers require andperform those tests and procedures consideredessential (Class A) for providing the pill, IUD, andinjectable, there is some evidence of underapplicationof STI screening by history in providing the IUD.
The overapplication of several procedures isquite common, particularly pelvic exam for the pilland injectable, blood pressure reading for the IUDand injectable, and breast exam and weight takingfor all methods. The data suggest that blood pres-sure and weight are taken for most clients regard-less of the method or the reason for visiting theSDP. As these are relatively simple and noninva-sive procedures, they may not in fact pose barriersto the use of family planning methods. However, itis not clear from the data whether performingthese procedures may cause unnecessary delays inthe provision of services.
In contrast, the high frequency of pelvic andbreast exams revealed by the data may in fact dis-courage some women from using family planning.At the very least, these procedures are likely totake a substantial amount of the providersÕ time. Inaddition, the usefulness of breast exams and Papsmears, if included in a pelvic exam, is quite limit-ed in many West African contexts because treat-ment for breast and cervical cancer is not generallyavailable (Anim, 1993; Jain and Barone, 1996).
Interestingly, laboratory tests (urine and bloodtests and STI screening) are required and per-formed far less frequently than other proceduresfor the three methods examined in this chapter.While 10% and 20% of providers in Burkina Fasoand Senegal, respectively, and up to 60% ofproviders in Ghana reported that they require labo-ratory tests for the three methods examined in thisanalysis, far fewer clients were observed to haveundergone these tests (fewer than 20% and gener-ally 1Ð5%). One possible explanation for this dis-crepancy is that clients are in fact required to under-go the tests, but must go outside the SDP for thepurpose, and this is not recorded in the observation
Tests and Procedures Required of Clients in Three Countries of West Africa 191
ST
AN
DA
RD
S A
ND
GU
IDE
LIN
ES
FO
RS
ER
VIC
ES

instrument. Otherwise it appears that women are infact rarely required to undergo laboratory testing inorder to receive the pill, IUD, or injectable.Therefore, laboratory tests may not be a barrier tofamily planning use in the three West African coun-tries included in this analysis.
While laboratory testing does not appear topose barriers to use of family planning methods,certain proceduresÑpelvic and breast examsÑmay do so. However, it is not possible to ascertainfrom the data whether women perceive these pro-cedures as barriers. It is possible that they welcomethese procedures since they recognize that theyrarely have access to medical services (KenyaMinistry of Health and Population Council, 1995).However, this argument does not support the per-formance of these procedures for revisit clients.
The results presented in this chapter have impli-cations for improving service delivery at bothnational and clinic levels. At the national level, theoverapplication of several procedures suggests thatservice delivery guidelines may need to bereviewed in light of the international standards andthe needs of the community. At the clinic level, thediscrepancy between the tests that providers saythey require and the ones that they are observed torequire suggests that they may not always agreewith the guidelines currently in place. In revisingguidelines, national-level program managersshould consult with supervisors, providers, andclients; this inclusion may help motivate providersto follow the guidelines more closely. In addition,provider training, both formal and on-the-job, mayhelp ensure that providers implement nationalguidelines more accurately and effectively.
REFERENCES
Anim, J.T. 1993. ÒBreast cancer in sub-Saharan Africanwomen.Ó African Journal of Medicine and MedicalSciences, 22,1:5Ð10.
Bertrand, J.T., K. Hardee, R.J. Magnani, and M.A. Angle.1995. ÒAccess, quality of care and medical barriers infamily planning programs.Ó International FamilyPlanning Perspectives, 21,2:64-69 and 74.
Buekens, P., M. Vekemans, B. Dujardin, M. Boutsen, andE. Wollast. 1990. ÒIs blood testing necessary beforeOC prescription in Africa?Ó Studies in FamilyPlanning, 213:178Ð180.
Diadhiou, F., M. Sangare, J. Stanback, T. Petrick, R. deBuysscher, and B. Gentile. 1990. Rapport Final,Symposium International sur le Bilan ParacliniquePr�liminaire � la Contraception. Universit� CheikhAnta Diop, Dakar, Senegal.
Diadhiou, F., C. Nare, E.O. Faye, C.T. Cisse, M. BaGueye, B. Jones, P.L. Bolton, D. Huntington, P.Tapsoba, and K. White. 1993a. Facteurs affectant lad�cision dÕune femme de subir une ligature de trompes oudÕutiliser le NORPLANT¨. Rapport Final. H�pitalAristide le Dantec Clinique Gyn�co-Obst�trique andAVSC International.
Diadhiou, F., C. Nare, E.O. Faye, M. Sangare, M. BaGueye, K. Katz, and C. Morrison. 1993b. Etude de laperspective de la cliente sur lÕintroduction duNORPLANT ¨ au S�n�gal. H�pital Aristide le DantecClinique Gyn�co-Obst�trique and Family HealthInternational.
Jain, A. and M. Barone. 1996. ÒPreventing cervical can-cer.Ó AVSC News 34,3:2.
Janowitz, B., D. Hubacher, T. Petrick, and NootanDighe. 1994. ÒShould the recommended number ofIUD revisits be reduced?Ó Studies in Family Planning,25,6:362Ð367.
Kenya Ministry of Health, Division of Family Healthand The Population Council. 1995. Quality of Care inFamily Planning Service Delivery in Kenya: ClientsÕ andProvidersÕ Perspectives: Final Report.
Shelton, J.D., M.A. Angle, and R.A. Jacobstein. 1992.ÒMedical barriers to access to family planning.Ó TheLancet, 340:1334Ð1335.
Stanback, J., J.B. Smith, B. Janowitz, and F. Diadhiou.1994. ÒSafe provision of oral contraceptives: Theeffectiveness of systematic laboratory testing inSenegal.Ó International Family Planning Perspectives,20,4:147Ð149.
Technical Guidance/Competence Working Group andWorld Health Organization/Family Planning andPopulation Unit. 1996. ÒFamily planning methods:New guidance.Ó Population Reports Series J, 44:34.
Technical Guidance/Competence Working Group. 1997.Recommendations for Updating Selected Practices inContraceptive Use. Volume II.
Twum-Baah, K.A. and J. Stanback. 1995. ProviderRationales for Restrictive Family Planning ServicePractices in Ghana. Final Report. Ghana StatisticalService and Family Health International.
World Health Organization. 1996. Improving Access toQuality Care in Family Planning: Medical EligibilityCriteria for Contraceptive Use.
NOTES
1 The other six categories are: outdated contraindica-tions; eligibility criteria (e.g., age or parity); serviceprovider qualifications (i.e., restrictions on the type
192 Clinic-Based Family Planning and Reproductive Health Services in Africa

of healthcare provider that can offer family plan-ning services); provider bias in recommending orpresenting various methods to clients; governmentregulations, which may restrict or impede thedevelopment, approval, or promotion of certaincontraceptives; and inappropriate management ofside effects.
2 Unfortunately, this study does not include informa-tion from clients regarding their opinion of theseprocedures.
3 See Chapter 2 for the references for these studies.While more recent studies were conducted inSenegal and Ghana, they did not collect informationon blood and urine tests, although they did collectinformation on the percent of SDPs offering screen-ing and testing for a variety of sexually transmittedinfections (STIs).
4 The exact question asked of providers was as fol-lows (translated from the Burkina Faso and Senegalquestionnaires): ÒAs a professional, which proce-dures [clinical exams and complementary informa-tion] and tests do you consider necessary before youcan offer the following methods?Ó In Ghana thequestion asked was: ÒFor the following contracep-tive methods, what, if any, examinations or tests doyou conduct before you can offer the method?Ó
5 Combined oral contraceptives (COCs) and
progestin-only pills (POPs) are both included in theanalysis of the pill as they are not distinguished inthe staff interviews of any of the Situation Analysisstudies; in addition, there is an insufficient numberof POP users for a separate analysis.
6 Hormonal methods are by far the most widely avail-able across the three countries, whereas IUDs areless available. However, method availability varieswith the type of service delivery point (SDP) (seeChapter 3 for more details).
7 NORPLANT¨ had been introduced only recently inthese countries and was thus still experimental inmost places at the time of the studies.
8 Blood pressure reading is considered a Class B pro-cedure for the pill and a Class C procedure for mostother methods.
9 In addition, the provider interview instrument foreach study specified to interviewers that onlyproviders who had provided a particular method inthe last 3 months should answer the questions onrequired tests and procedures for that method. Inpractice, however, all staff who had provided anymethod during the period responded to these questions.
10 Medical history is taken only for new clients; thusthis variable is not included for clients who changemethods.
Tests and Procedures Required of Clients in Three Countries of West Africa 193
ST
AN
DA
RD
S A
ND
GU
IDE
LIN
ES
FO
RS
ER
VIC
ES


V. CURRENT AND FUTUREPROGRAM DIRECTIONS
10
Integrating STI andHIV/AIDS Services at MCH/FamilyPlanning Clinicsreviews the extent to which sexually transmitted infection(STI) and HIV/AIDS serviceshave been integrated withmaternal and child health/family planning services, andexamines the feasibility ofexpanding integration of services.
11
Changes in Quality of Services Over Timecompares the findings of successive studies conducted in four of the study countries to determine how these familyplanning and reproductivehealth programs havechanged in the interim.


Since the Cairo International Conference on Popu-lation and Development in 1994, and based on thehigh prevalence of sexually transmitted infections(STIs) (especially HIV) found in sub-SaharanAfrica, many countries in the region have begunintegrating STI/HIV prevention and managementservices into their clinic-based maternal and childhealth (MCH)/family planning programs.Integration is seen as a potentially cost-effectivemeans of reaching a large proportion of sexuallyactive women, and indirectly their partners, withinformation and services that can help preventinfection and lead to the diagnosis and manage-ment of existing infections. Analysis of data fromSituation Analysis studies completed in five coun-tries (Botswana, Ghana, Kenya, Zambia, andZimbabwe) shortly after service integration wasinitiated yields the following conclusions:
■ At the time of the studies, less than one-third ofstaff had received refresher or post-basic train-ing in STIs and/or HIV/AIDS, although overhalf claimed to be providing STI or HIV/AIDSinformation and services.
■ Observations of client-provider interactionsindicate that about one-quarter of clients arereceiving some information about STIs and/orHIV/AIDS during their MCH or family plan-ning consultation.
■ ClientsÕ ability to name STI symptoms is gener-ally poor, their knowledge of means ofHIV/AIDS transmission other than sex is limit-ed primarily to needles and sharp implements,and personal fidelity is the most well-knownmeans of transmission prevention.
■ Apart from posters, other means of communi-cating information about STIs or HIV/AIDS
(e.g., flip charts, brochures, group health talks)are lacking in most clinics.
■ Condoms are available at virtually all clinics,and stockouts are rare. With marked variationsamong countries, however, condoms appear tobe promoted primarily for family planningpurposes, with less than one-fifth of clientshearing a dual-protection message.
■ Virtually no family planning clients undergoany STI case detection procedures orHIV/AIDS management services.
■ Evidence from at least one country (Zimbabwe)suggests that a well-supported and -organizedSTI drug supply program can ensure the avail-ability of basic medication needed to treat STIsat most clinics; however, this situation appearsto be the exception rather than the rule in mostsub-Saharan African countries.
In general, the analysis shows that the commu-nication of information to family planning clientsabout recognition of STI symptoms, modes oftransmission, and protective behavior is feasible,and could be strengthened within clinics fairly eas-ily. Moreover, in theory at least, such communica-tion is more likely to reduce levels of infection bypreventing transmission within the general popu-lation. The impact of such behavior-change com-munication strategies in transmission prevention,however, is not well understood.
STI case finding and management is clearly anessential component of a woman-centeredapproach that seeks to reduce the immediate suf-fering caused by such infections. This analysisreveals, however, that it has proved difficult forclinic-based programs to ensure that these proce-dures are effectively implemented. A more com-
CU
RR
EN
T A
ND
FU
TU
RE
PR
OG
RA
M D
IRE
CT
ION
S
Integrating STI and HIV/AIDS Services at MCH/Family Planning Clinics 197
KEY POINTS AND CONCLUSIONS
Integrating STI and HIV/AIDS Servicesat MCH/Family Planning Clinics
10

prehensive approach to introducing and support-ing these activities is essential if they are to be suc-cessful. At the same time, however, it is question-able whether STI case finding and managementamong family planning clients in sub-Saharan
Africa has much effect on reducing the transmis-sion of infection within the general population, asthese clients are primarily monogamous womenwho are more likely to receive an infection fromtheir regular partner than to transmit it to others.
198 Clinic-Based Family Planning and Reproductive Health Services in Africa

INTRODUCTION
In recent years, considerable attention has beenpaid to the feasibility and effectiveness of integrat-ing information and services for the managementof sexually transmitted infections (STIs),1 includingHIV/AIDS, into the existing services provided forwomen at maternal and child health (MCH)/fami-ly planning clinics. These efforts have comple-mented the broader range of STI and HIV/AIDSprevention and management activities that arebeing developed and tested, such as strategies forcommunicating behavior change among both thegeneral and specific populations, promotion andsocial marketing of condoms, and targeting of menand commercial sex workers.
Within the overall strategy for preventing andmanaging STIs and HIV/AIDS at MCH/familyplanning clinics, the greatest attention is beingfocused on integrating these services into consulta-tions with women attending for family planningservices. Antenatal clients, however, are also consid-ered an important audience for these services, giventhe seriousness of perinatal transmission of certainSTIs, especially HIV, syphilis, and gonorrhea (Tsui etal., 1997; Howson et al., 1996; Bryson, 1996).
The rationale for the integration of STI andHIV/AIDS services at MCH/family planning clin-ics appears to revolve around three main assump-tions (Askew et al., 1998):■ A substantial proportion of women attending
MCH/family planning clinics in sub-SaharanAfrica are likely to have an infection of thereproductive tract (including those that arenon-sexually transmitted), and this condition isserious enough, and the proportion of women
suffering is large enough, to justify finding,diagnosing, and managing such cases.
■ Informing and educating women about the trans-mission of these infections and ways to reducethe likelihood of becoming infected will lead to areduction in the spread of such infections,notably HIV, among the general population.
■ Providing STI information and case manage-ment services in the context of family planningand antenatal services is a cost-effectiveapproach to increasing access to STI services,and will not adversely affect the provision ofMCH/family planning services.The above rationale was developed during and
promoted following the Cairo InternationalConference on Population and Development(ICPD) in 1994. Since then, a consensus appears tohave developed that such integration of services isessential, particularly in sub-Saharan Africa, whereSTI levels are the highest in the world and HIVinfection is of pandemic proportions. This consen-sus reflects the need to find strategies not only foraddressing reproductive health problems of indi-vidual women, but also for reducing the transmis-sion of STIs, including HIV, within the general pop-ulation (see Tsui et al. [1997] for a discussion ofthese two perspectives). As a consequence, mostnational MCH/family planning programs in theregion are now actively revising their policy guide-lines and procedures to advocate an integratedapproach to serving family planning clients (and,albeit to a lesser extent, antenatal clients) (Mayhew,1996). They are also seeking technical assistanceand financial resources from donors so they canupgrade the capabilities of facility staff and assem-ble the infrastructure, equipment, and supplies
CU
RR
EN
T A
ND
FU
TU
RE
PR
OG
RA
M D
IRE
CT
ION
S
Integrating STI and HIV/AIDS Services at MCH/Family Planning Clinics 199
Integrating STI and HIV/AIDS Servicesat MCH/Family Planning ClinicsIan Askew, Goli Fassihian, and Ndugga Maggwa
10

needed to offer STI information and services in anMCH/family planning setting.
Recent evidence from case studies of clinic-based programs that have actively implemented anintegrated approach (Maggwa and Askew, 1997a)suggests that such programs include, or seek toinclude, four component interventions:■ STI case finding, diagnosis, and treatment
among family planning and, to a lesser extent,antenatal clients attending MCH/family plan-ning clinics
■ Communication of messages to clients aboutprevention of STI and HIV/AIDS transmission
■ Screening and treatment for syphilis amongantenatal clients
■ Voluntary counseling and testing for clientssuspected to have HIV/AIDSThe findings from case studies demonstrate,
however, that it is not easy for programs to inte-grate these services, even when sufficient humanand technical resources are available (e.g., Maggwaand Askew, 1997a; Iskander et al., 1998). Moreover,the assumptions stated earlier are now being ques-tioned. Those assumptions were formulated whenlittle empirical evidence was available on thenature and extent of STIs among the population ofMCH/family planning clinic attendees, and littlewas known about the effectiveness of the compo-nent interventions, including STI case finding andmanagement among family planning and antena-tal clients, and behavior change communicationthrough facility-based interactions.
Efforts to integrate services within MCH/fami-ly planning clinics appear, therefore, to be at acrossroads at this point in time. Before future direc-tions can be mapped out with confidence, far moreresearch is needed to gain a better understandingof both the nature and extent of the problem of STIsamong women attending MCH/family planningclinics, and the effectiveness (and cost-effective-ness) of alternative solutions. Investigation is alsoneeded of the role integration of services can playwithin the broader range of strategies to reduce theincidence of STIs among broader populations.
The purpose of this chapter is to contribute tothe needed empirical evidence through an analysisof the current and potential integration of servicesat facilities within five national MCH/family
planning programs in sub-Saharan Africa:Botswana (data collected in 1995), Ghana (1996),Kenya (1995), Zambia (1996), and Zimbabwe(1996). (See the Chapter 2 references for the rele-vant Situation Analysis studies.) These programsare represented here because when the SituationAnalysis studies in these countries were beingplanned, the program managers expressed a needfor such information. Given the current region-wide interest in integration, this information isnow collected routinely for all national SituationAnalysis studies undertaken in Africa.
The information presented on these five pro-grams represents their situation shortly after theICPD and Beijing conferences and immediatelybefore the programs had undertaken substantialefforts to integrate STI and HIV/AIDS manage-ment with MCH/family planning services. Forexample, in Zimbabwe, the Ministry of Health(MOH) had just begun to reorient its primaryhealthcare programs to the provision of STI servicesusing an integrated approach. With financial andtechnical support from external donors, this reori-entation involved training all nurses in the primaryhealthcare facilities in STI management and estab-lishing logistic supply systems for the procurementand distribution of drugs and condoms. In Kenya,some programs (implemented by nongovernmentalorganizations [NGOs], the Nairobi City Commission,and the Nakuru Municipal Council) had been receiv-ing limited support from donors to facilitate the inte-gration of STI and HIV/AIDS services into theirprimary healthcare facilities since 1992. When fur-ther funding became available in 1996, the MOHembarked on a national program to integrate STImanagement into all its primary healthcare facili-ties, starting with 10 districts. This effort (whichstarted after the Situation Analysis study) hastrained nurses in STI management; established theprocurement and distribution of STI drugs; devel-oped a reproductive health strategy; and revisedthe national family planning guidelines to includeother reproductive health issues, especially STI andHIV/AIDS management.
The objective of this chapter is to provide pro-gram managers, donors, and technical assistanceorganizations with information on the prepared-ness of facilities to implement an integrated service-
200 Clinic-Based Family Planning and Reproductive Health Services in Africa

delivery approach. The discussion also includessome indication of the type and magnitude of sup-port and resources needed if an integratedapproach is to become the standard operating pro-cedure for MCH/family planning programs in sub-Saharan Africa. The results of this analysis are pre-sented in five sections, addressing (1) the extent towhich services are currently integrated at clinicalfacilities, (2) whether clinic staff are prepared tooffer an integrated approach to family planningand STI services, (3) the extent to which STI/HIV/AIDS messages are being communicated tofamily planning clients, (4) the feasibility of provid-ing STI/HIV/AIDS services to MCH/family plan-ning clients, and (5) the awareness of STIs andHIV/AIDS among clients attending facilities.2 Thefinal section presents conclusions and recommen-dations as to future directions these programscould take and the role of facility-based surveys inevaluating integrated programs.
It should be emphasized that the data collectioninstruments used, although broadly comparable,evolved over time and were modified to meet thespecific information needs of each country.Consequently, more data were collected than ispresented, and only those data for which general-izations can be derived across all five countries areincluded. It is believed that these are likely to bethe most important indicators and the ones mostwidely applicable to other countries in the region.
ARE SERVICES CURRENTLYINTEGRATED?
The person Òin chargeÓ at each MCH/family plan-ning facility (usually a senior nurse) was askedwhether any STI or HIV management services areusually offered. The question was deliberatelyphrased in general terms so an overview could begained of whether those working in the facilitiesconsider STI/HIV management to be part of theroutine services they are expected to provide.Across all five programs, more than two-thirds offacilities claimed to offer STI management services,and over half said they are currently offering HIVmanagement services. Table 10-1 shows that forSTI management services, these proportions are
fairly consistent across the type of facility. Giventhe higher level of training required, the propor-tions offering HIV management services decreaseat lower facility levels. There is considerable varia-tion by country, with facilities in the Kenya andZambia programs less likely to offer these services.
Because the data collection instrumentsevolved over time, the specific types of STI andHIV/AIDS management activities were clarifiedfor three countries only (Ghana, Zambia, andZimbabwe). As might be expected (see Table 10-2),counseling for both STIs and HIV/AIDS is themain service offered.
Overall, there is no difference in the likelihoodof a facility offering STI services between facilitiesin urban and rural locations, or among the public,private, and NGO/Mission sectors.
However, there are such differences forHIV/AIDS services: the proportion of facilitiesoffering these services is higher in urban (54%) thanin rural areas (45%), and facilities in theNGO/Mission sector (62%) are more likely thanthose in the public and private sectors (46%) to offersome form of HIV management services. Thesefindings may suggest that resources for strengthen-ing HIV/AIDS prevention and control serviceshave been focused more on NGO programs and on
CU
RR
EN
T A
ND
FU
TU
RE
PR
OG
RA
M D
IRE
CT
ION
S
Integrating STI and HIV/AIDS Services at MCH/Family Planning Clinics 201
Table 10-1. Percent of facilities atwhich STI and HIV management services are routinely offered
Facilities Offer STI Offer HIVManagement Management
Services Services
All facilities 69 49
Hospitals 72 62
Health centers 71 51
Health posts 69 46
Botswana 90 65
Ghana 73 68
Kenya 55 21
Zambia 44 25
Zimbabwe 99 74

facilities in urban areas than on public-sector pro-grams and facilities in rural areas. (See Chapter 7for more discussion of urban/rural differences.)
The frequency with which these services arecurrently provided to MCH/family planningclients is cause for concern among advocates of anintegrated approach. Although attempts weremade during the Situation Analysis studies toabstract the service statistics for STI andHIV/AIDS services from the MCH/family plan-ning unit records, the notoriously poor quality ofrecordkeeping in these facilities (e.g., Ndhlovu,1998) made it impossible to measure accurately theproportion of clients receiving such services on anannual basis. Nevertheless, valid data on the num-ber of STI clients seen over a 12-month period wascollected from 281 clinics in Ghana, Zambia, andZimbabwe. The median number of clients seen was203 (i.e., less than 1 per working day), with a rangeof 1 to 5,189. Valid data on the number of clientsreceiving HIV/AIDS services were collected from86 clinics in these three countries and revealed amedian of 12 clients (i.e., 1 per month), with arange of 1 to 3,082. Furthermore, among the 3,297family planning clients and 6,797 MCH clientsinterviewed in these five studies, fewer than 0.5%reported having received an STI or HIV service(broadly defined) during their visit.3 Thus althoughstaff are claiming to provide these services, they areclearly doing so infrequently.
More seriously, there would appear to be anunderutilized capacity if the services are availablebut are not being provided or used on a regularbasis. (See Chapter 6 for further discussion of thispoint.) This may be because staff are not routinely
offering integrated services, and/or becauseMCH/family planning clients needing STI andHIV/AIDS services do not know they are avail-able. Alternatively, it may be that the need for suchservices within the MCH/family planning popula-tion is low because the prevalence of STIs and HIVis low. This is a controversial yet crucial issue as itunderlies one of the main assumptions supportingthe need for integration, and it is an area in whichmore research is clearly needed.
ARE STAFF PREPARED TO OFFERINTEGRATED SERVICES?
Whether staff are adequately prepared to offer inte-grated services at an acceptable level of quality isan essential issue for all program managers (seealso indicator R.6-6 in Chapter 3). Clearly, the mostbasic requirement is that staff be adequatelytrained. Table 10-3 shows the proportion of staffwho said they had received post-basic or refreshertraining in STIs and/or HIV/AIDS. Post-basic orrefresher training is the appropriate indicatorbecause program managers believe that nursesÕpreservice training in STIs was inadequate and wasusually completed too long ago to qualify them toprovide these services competently. The data sug-gest that country programs are at different stagesin training their staff in these services, and thatoverall, more than two-thirds of facility staffthroughout the five countries had not been trainedin STIs or HIV/AIDS at the time of the SituationAnalysis studies.
202 Clinic-Based Family Planning and Reproductive Health Services in Africa
Table 10-2. Percent of facilities offering different types of STI and HIV/AIDS management services in Ghana, Zambia, and Zimbabwe
Country STI IEC STI STI HIV/AIDS HIV/AIDSCounseling Diagnosis Treatment Counseling Testing
Ghana 66 36 46 66 20
Zambia 36 29 28 26 2
Zimbabwe 70 * 74 56 17
* Question asked in terms of both laboratory diagnosis (95%) and syndromic diagnosis (20%).

Training in these services is necessary but notsufficient for staff to implement an integratedapproach to serving family planning clients. Someof the studies also collected data on the prepared-ness of staff to think in terms of offering integratedservices to family planning clients. For example,staff in Botswana and Kenya were asked what pro-cedures and tests new clients choosing the pill,IUD, or injectable must have before they can beoffered the method. STI screening was mentionedby very few staffÑranging from a high of 23% ofstaff for IUD clients in Botswana to a low of 3% forinjectable clients in Kenya. (See also Chapter 9.)Moreover, when staff were asked which methodsthey would not recommend for a client with anSTI, only three-quarters (with a range from 57% inZambia to 91% in Kenya) mentioned the IUD,despite the fact that the IUD is normally con-traindicated for women presenting with an STI.
The preparedness of staff to offer an integratedapproach is also dependent on their experiencewith providing these services. Staff were askedwhich STI and HIV/AIDS services they them-selves had offered over the last 3 months.4 Table10-4 shows that, with the exception of Kenya, wellover half of the staff interviewed indicated thatthey had counseled MCH/family planning clientson STIs, and a significant proportion had provid-ed counseling on HIV/AIDS. Diagnosis and treat-ment of STIs appear to be provided more fre-quently by staff in Zambia and Zimbabwe.Caution is needed, however, in interpreting thefrequency with which staff have provided suchservices. Because the timeframe for the questionwas within the last 3 months, the results couldinclude both those staff who have provided theservice only once and those who provide it on adaily basis.
CU
RR
EN
T A
ND
FU
TU
RE
PR
OG
RA
M D
IRE
CT
ION
S
Integrating STI and HIV/AIDS Services at MCH/Family Planning Clinics 203
Table 10-3. Percent of staff with post-basic or refresher training in STIs and/orHIV/AIDS
Country Training in Training in Training in STIHIV/AIDS STIs Syndromic Management
Botswana 67 54 31
Ghana 27 29 7
Kenya 7 8 8
Zambia 17 28 15
Zimbabwe 31 44 34
Table 10-4. Percent of staff indicating that they had provided STI and HIV/AIDS services in previous 3 months
Country STI STI STI HIV/AIDS HIV/AIDSCounseling Diagnosis Treatment Counseling Testing
Ghana 57 13 17 52 3
Kenya 43 24a 40 14 2
Zambia 71 57 82 35 4
Zimbabwe 87 85b 87 60 4
a Kenya includes 19% syndromic diagnosis, 10% laboratory diagnosis.b Zimbabwe includes 84% syndromic diagnosis, 15% laboratory diagnosis.
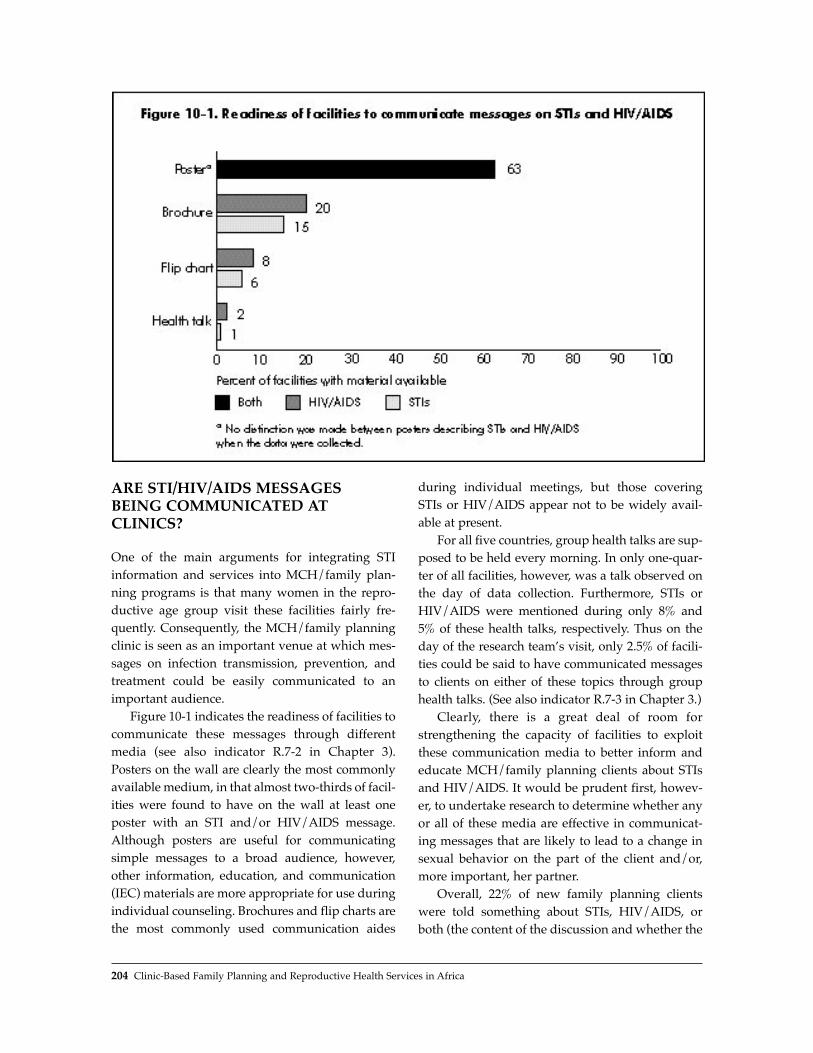
ARE STI/HIV/AIDS MESSAGESBEING COMMUNICATED ATCLINICS?
One of the main arguments for integrating STIinformation and services into MCH/family plan-ning programs is that many women in the repro-ductive age group visit these facilities fairly fre-quently. Consequently, the MCH/family planningclinic is seen as an important venue at which mes-sages on infection transmission, prevention, andtreatment could be easily communicated to animportant audience.
Figure 10-1 indicates the readiness of facilities tocommunicate these messages through differentmedia (see also indicator R.7-2 in Chapter 3).Posters on the wall are clearly the most commonlyavailable medium, in that almost two-thirds of facil-ities were found to have on the wall at least oneposter with an STI and/or HIV/AIDS message.Although posters are useful for communicatingsimple messages to a broad audience, however,other information, education, and communication(IEC) materials are more appropriate for use duringindividual counseling. Brochures and flip charts arethe most commonly used communication aides
during individual meetings, but those coveringSTIs or HIV/AIDS appear not to be widely avail-able at present.
For all five countries, group health talks are sup-posed to be held every morning. In only one-quar-ter of all facilities, however, was a talk observed onthe day of data collection. Furthermore, STIs orHIV/AIDS were mentioned during only 8% and5% of these health talks, respectively. Thus on theday of the research teamÕs visit, only 2.5% of facili-ties could be said to have communicated messagesto clients on either of these topics through grouphealth talks. (See also indicator R.7-3 in Chapter 3.)
Clearly, there is a great deal of room forstrengthening the capacity of facilities to exploitthese communication media to better inform andeducate MCH/family planning clients about STIsand HIV/AIDS. It would be prudent first, howev-er, to undertake research to determine whether anyor all of these media are effective in communicat-ing messages that are likely to lead to a change insexual behavior on the part of the client and/or,more important, her partner.
Overall, 22% of new family planning clientswere told something about STIs, HIV/AIDS, orboth (the content of the discussion and whether the
204 Clinic-Based Family Planning and Reproductive Health Services in Africa

provider or client initiated it are not known).Virtually all of these women were told about STIs,and about half also were told about HIV/AIDS.Figure 10-2 shows the proportions by country.Although the proportions are not especially high,the findings (from Zambia and Botswana especial-ly) suggest that it is possible for providers to incor-porate such messages into their family planningconsultations. Consequently, efforts could be madeto increase the likelihood that a provider will dis-cuss these issues.
The one message that would appear to be thesimplest for MCH/family planning facilities tocommunicate to their clients is the role of condomsin protecting against both pregnancy and infection.Moreover, there is no problem in supplying con-doms to clients. Virtually all MCH/family plan-ning clinics offer condoms as a contraceptivemethod (over 95% of facilities in these five coun-tries), and stockouts are not generally a problem,although about one-quarter of facilities inBotswana and Zimbabwe reported a condomstockout in the 6 months preceding the study (seealso indicator R.4-1 in Chapter 3).
The willingness of providers to mention con-doms to family planning clients appears to vary
somewhat, as shown in Figure 10-3. For four of thecountries, between half and three-quarters of newfamily planning clients were told about condomsduring counseling about family planning, the oneexception being Zimbabwe.5 Conversely, far fewerclients were explicitly told that condoms can beused to protect against contracting an STI. Thusalthough many staff appear to have little problemwith mentioning condoms as a family planningmethod, the fact that condoms can also be used toprotect against STIs is not always part of the mes-sage communicated to new family planning clients.
The data presented in Figure 10-3 describe theproportion of all new family planning clients whowere told about the protection offered by condomsagainst either pregnancy or STIs.6 One componentof an integrated approach that is currently receiv-ing a great deal of attention is promotion of themale condom as the most effective contraceptivemethod, offering dual protection against both con-ception and infection.7 Figure 10-4 shows the pro-portion of new family planning clients whoreceived a Òdual-protectionÓ message, that is, whowere told about the condom as part of familyplanning counseling and were also told about itsability to protect against STIs (see also indicator
CU
RR
EN
T A
ND
FU
TU
RE
PR
OG
RA
M D
IRE
CT
ION
S
Integrating STI and HIV/AIDS Services at MCH/Family Planning Clinics 205

R.3-2 in Chapter 3). Overall, the proportion is lowat 16% for all new clients observed, but it shouldbe remembered that these studies generally pre-ceded the current emphasis on dual-protectionmessages. There is clearly scope for strengtheningthis component of an integrated approach, asshown by the higher levels of communication ofthis message in Botswana, Zambia, and, to a lesserextent, Ghana.
Of all new family planning clients interviewedin the studies, 9% had ever used condoms, and 7%adopted the method during the observed visit.Given the low level of condom use among couplesgenerally, and women specifically, in sub-SaharanAfrica, this proportion is not surprising, and mayeven be seen as encouraging. It highlights again,however, the need to strengthen the role played byclinics as sources of information about condoms.
206 Clinic-Based Family Planning and Reproductive Health Services in Africa

CAN STI/HIV MANAGEMENTSERVICES BE PROVIDED TOMCH/FAMILY PLANNING CLIENTS?
STI Case Finding
The most contentious issue associated with an inte-grated approach is whether MCH/family planningclinics are an appropriate venue for finding andmanaging STIs, given that the STI prevalenceamong their clients is likely to be relatively low.Finding cases of STI among women who are notpresenting specifically for this problem is notori-ously difficult, partly because many infectedwomen are asymptomatic, and partly becausemany symptomatic women do not always recog-nize potential STI symptoms. At the time of thesestudies, however, STI case finding and manage-ment were being strongly promoted for womenattending MCH/family planning clinics, and datawere therefore collected on the preparedness of thefacilities and their staff to undertake these services.
Case-finding procedures for STIs amongMCH/family planning clients generally incorpo-rate several activities to help the provider detectinfections, including taking a medical history andperforming a general physical examination; askingthe woman risk assessment questions8; and, when-ever possible, performing a pelvic examination. Apelvic exam with a speculum is believed to be use-ful in enabling the provider to distinguish betweencervical and vaginal infections; this distinction can
be important as the former are generally more seri-ous than the latter, and are more likely to be sexu-ally transmitted than due to endogenous over-growths. For these studies, certain items related tothese procedures were observed during the client-provider interactions, so it is possible to gain someinsight into the frequency with which these proce-dures are currently followed.
Table 10-5 shows the proportion of new familyplanning clients whose medical history was takenand who had a general physical examination. Thevariation observed suggests that the expectationsof staff about routinely performing these proce-dures for all new family planning clients differacross the five countries. Further analysis would
CU
RR
EN
T A
ND
FU
TU
RE
PR
OG
RA
M D
IRE
CT
ION
S
Integrating STI and HIV/AIDS Services at MCH/Family Planning Clinics 207
Table 10-5. Percent of new familyplanning clients having a medical history taken and receiving a generalphysical examination
Country Medical GeneralHistory PhysicalTaken Examination
Botswana 70 62
Ghana 60 31
Kenya 77 64
Zambia 69 46
Zimbabwe 51 41

be needed to determine whether these differencesare associated with specific characteristics of eitherthe type of staff observed or the facilities visited.(See Chapter 9 on tests/procedures in West Africa.)
As part of an integrated approach, providersneed to ascertain during history taking whether theclient has any of the common STI symptoms; thisinformation can then be used as a starting point forsyndromic management. Figure 10-5 shows theproportion of new family planning clients whowere observed to be asked by the provider about,or who themselves mentioned during the consulta-tion, the presence of up to four common STI symp-toms.9 Of the four symptoms considered (abnormalbleeding, abnormal discharge, abdominal pain,genital itching), genital itching was the symptom
least discussed overall (in 11% of interactions),with the other three each being discussed in about25% of interactions. The most commonly discussedsymptom in Botswana, Kenya, and Zimbabwe wasabnormal bleeding; in Ghana it was abnormal dis-charge; and in Zambia it was lower abdominalpain. Again, although there is room for improve-ment, the evidence (from Zambia in particular)suggests it is not necessarily problematic forproviders to gather this information as part of rou-tine counseling for new family planning clients.(Also see indicator Q.2-8 in Chapter 3.)
Risk assessment has been recommended as ameans to increase the likelihood of finding poten-tial STI cases among family planning clients and to improve the predictive value of syndromic
208 Clinic-Based Family Planning and Reproductive Health Services in Africa
Table 10-6. Percent of new family planning clients asked risk assessment questions
Country Number ofMarital New Partners Concerns Sexual History ofStatus in Last Year About STIs Relations STIs
Botswana 52 9 18 n/a 20
Ghana 75 21 12 30 13
Kenya n/a 14 6 36 12
Zambia 74 5 19 34 n/a
Zimbabwe 68 16 13 5 15

management (see, e.g., Latif, 1996). Thoroughcounseling for a new family planning client shouldnormally include such questions anyway, becauseknowing about a clientÕs sexual behavior is impor-tant when deciding on the most appropriate typeof contraceptive to use (see indicator Q.2-7 inChapter 3). Table 10-6 shows the proportions ofnew family planning clients asked those questionsthat could also form part of an STI risk assessmentprocedure (programs vary in the information aprovider is required to obtain from a new familyplanning client).
Marital status was the question most common-ly asked. It is clearly the least difficult question toask, as it does not require a discussion about sexu-al behavior or STIs. The other four questions(number of new partners in the last year, concernsabout STIs, sexual relations, and history of STIs)were asked of smaller proportions of clients. Thisprobably reflects either a perception by theprovider that the client is not at risk and so neednot be asked such questions, or the providerÕsembarrassment about discussing sexuality andSTIs with family planning clients.
If staff are to effectively offer STI andHIV/AIDS information and services, they mustfeel comfortable discussing these subjects withtheir clients. Figure 10-6 indicates that on average,almost one-quarter of the staff interviewed feltvery or somewhat uncomfortable when discussingthese topics with their clients (see Maggwa et al.,1997b, for a discussion of this issue). This findingindicates the need to ensure that staff training
includes how to discuss sexuality and STIs withclients.
To enable providers to undertake pelvic examseasily and in aseptic conditions, a facility musthave available certain infrastructure, equipment,and supplies. A scale was created to measure thereadiness of facilities to offer pelvic exams basedon the availability of four essential items: adirectable light source (either an angle poise lampor flashlight), gloves (disposable or nondispos-able), sterilizing lotion, and at least one speculum(see indicator R.5-2 in Chapter 3).10 The proportionof clinics that appear to be ready to offer a pelvicexam is shown in Figure 10-7. Overall, only 41% ofclinics visited had all four essential items, and socould be judged fully ready to undertake a pelvicexam effectively and under safe conditions. A fur-ther 35% of clinics had three of the four items. Theitem most likely to be missing (in 40% of clinics)was the directable light source, and the item leastlikely to be missing (in 6% of clinics) was gloves;overall, only 17% of clinics were missing specula(although one-third of clinics in Ghana and one-fifth of clinics in Zambia lacked this item).
Whether all new family planning clients shouldreceive a pelvic exam, or only those accepting cer-tain types of contraceptives (i.e., the IUD and ster-ilization), is a controversial issue. From the per-spective of offering a client an integrated repro-ductive health consultation, a pelvic examinationwith a speculum would seem to be essential. Suchan exam improves the likelihood of detecting aninfection and, with rapid advances in simple
CU
RR
EN
T A
ND
FU
TU
RE
PR
OG
RA
M D
IRE
CT
ION
S
Integrating STI and HIV/AIDS Services at MCH/Family Planning Clinics 209

screening techniques, may increase the likelihoodof early detection and management of cervical can-cer (e.g., Chipato et al., 1995). However, unlessinfection prevention can be guaranteed, conduct ofa pelvic exam for all but essential reasons is nor-mally discouraged among family planning clients(Hatcher et al., 1997). (See also indicator Q.5-2 inChapter 3.)
Figure 10-8 shows the proportion of clients whoreceived a pelvic examination with a speculum.Explaining the variation across countries wouldrequire further analysis of factors such as nationalpolicies, clinic readiness to offer such exams, themethods accepted by clients, and staff training. Thedata do suggest, however, that all programs needto strengthen this procedure if it is to become a rou-tine component of an integrated reproductivehealth service.
Case Diagnosis and Treatment
It is of little use to find potential STI cases amongfamily planning and antenatal clients if these casescannot then be correctly diagnosed and treated atthe facility.11 Data given earlier in Tables 10-2, -3,and -4 show variability across the five countries inthe readiness of their clinics and staff to offer STIdiagnosis and treatment services. In recognition ofthe impossibility of equipping all health facilities tooffer laboratory tests for specific STIs, syndromicmanagement has been promoted as an alternative.Although the validity of this approach is currentlybeing questioned (specifically for diagnosing andtreating cervicitis through the vaginal dischargesyndrome), all five countries had endorsed syn-dromic management at the time of these SituationAnalysis studies. Staff training efforts were clearly
210 Clinic-Based Family Planning and Reproductive Health Services in Africa
Table 10-7. Percent of facilities with on-site tests for specific infections
Facilities HIV Syphilis Gonorrhea Candidiasis Chlamydia
All facilities 9 21 18 15 9
Hospitals 47 60 63 51 36
Health centers 3 25 18 15 8
Health posts 1 7 4 3 2
Botswana 7 16 11 10 7
Ghana 12 10 18 13 8
Kenya 10 23 24 20 6
Zambia 12 37 26 22 18
Zimbabwe 0.5 22 7 7 16

at an early stage, with a maximum of one-third ofstaff indicating that they had received post-basic orrefresher training in syndromic management.However, a larger proportion of staff (85% inZimbabwe) claimed to have carried out STI diag-nosis in the previous 3 months.
This is not to say that laboratory tests for STIsare not available at all. Table 10-7 indicates thatalmost one-fifth of facilities at all levels can offersyphilis and gonorrhea testing on site, althoughfewer than 10% offer HIV testing. As would beexpected, the availability of tests varies by typeand location of facility. For example, almost two-thirds of hospitals offer on-site tests for syphilisand gonorrhea, about half offer HIV and candidia-sis testing, and one-third offer chlamydia testing.On-site syphilis tests are available at only one-quarter of the health centers and 7% of the healthposts. As would be expected, private-sector facili-ties are the best equipped, and NGO facilities arebetter equipped than are public-sector facilities.Also, facilities in urban locations have more testsavailable than those in rural areas. The facilities inZambia are the best equipped for all types of on-site tests, whereas those in Zimbabwe score verylow for HIV tests (only 1% of all facilities visited),as well as for gonorrhea and candidiasis testing.
Treating a client who has a reproductive tractinfection can be problematic in many African coun-tries because on-site drug supplies are often notavailable. As a result, providers frequently mustuse alternative medications, often of a quality infe-rior to that of the recommended regimens, or sendclients elsewhere to obtain the correct medication.Data from the Situation Analysis studies show thatmany health facilities often do not have availablethe first-line drugs recommended in their serviceprovider guidelines for the management of vaginaldischarge.
In Kenya, for example, a combination ofAmoxycillin, Augmentin, and Erythromicin is rec-ommended as the first-line treatment for cervicitisin pregnant women, yet Amoxycillin andErythromicin were available at just 11% and 12% ofhealth facilities, respectively. In Botswana, a countryoften cited as having few drug supply problems,Doxycycline and Ceftriaxime (both of which are rec-ommended as first-line drugs for the treatment of
cervicitis) were available at only 37% and 45% offacilities, respectively. The situation in Zimbabwewas better than that in the other countries, probablybecause of that countryÕs ongoing STI program(supported by the World Bank and the Departmentfor International Development), which providesdrugs and supports the logistics of their distribu-tion. The service provider guidelines in Zimbabwe(revised in 1997) recommend the use of Kanamycin,Cotrimoxazole, and Doxycycline as first-line drugsfor the treatment of vaginal discharge, and thesedrugs were available at 92%, 87%, and 64% of healthfacilities, respectively. These findings show, there-fore, that the availability of STI drugs at health facil-ities varies from country to country, and is influ-enced by the availability of resources needed to pur-chase the drugs and the logistics required to ensureappropriate distribution.
WHAT DO CLIENTS KNOW ABOUT STI AND HIV/AIDSSYMPTOMS, TRANSMISSION, AND PROTECTION?12
Knowledge that diseases can be transmittedthrough sexual intercourse is high (91% of all MCHclients and 93% of family planning clients).However, when asked whether they knew of anysymptoms of diseases that can be transmitted sex-ually, 39% of all MCH clients and 35% of familyplanning clients could not name any symptoms atall. The situation was particularly poor in Ghana,where only 41% of MCH clients and 50% of familyplanning clients could name at least one symptom.Of those clients who did know of any symptoms,most could cite only one or two. Figure 10-9 indi-cates that overall, the most common symptomcited as known was lesions/sores, followed byabnormal discharge and painful urination.
There are major differences among countries.For example, although the most cited symptomwas lesions/sores in the three Southern Africancountries (Botswana, Zambia, and Zimbabwe), itwas painful urination in Ghana and abnormal dis-charge in Kenya. Whether this variation reflects dif-ferences among countries in the prevalence of dis-eases and their symptoms or different perceptions
CU
RR
EN
T A
ND
FU
TU
RE
PR
OG
RA
M D
IRE
CT
ION
S
Integrating STI and HIV/AIDS Services at MCH/Family Planning Clinics 211

of what constitutes a symptom of an STI is not clear.This finding indicates the need for program man-agers to have greater knowledge of local percep-tions, terminology, and experiences with STI symp-toms so they can better train their staff in counsel-ing and in case finding and diagnosis.
Knowledge of HIV/AIDS was found to be virtu-ally universal among MCH/family planning clients.When asked whether they knew ways of contractingHIV/AIDS other than through sex, half of theMCH/family planning clients indicated that theyknew of at least one other way (Figure 10-10). By farthe most commonly mentioned mode of transmis-sion was sharing needles, which probably reflectsthe messages being communicated by the nationalAIDS control programs in these countries. It issomewhat troubling, however, that so few womenattending MCH/family planning clinics are awareof the possibility of perinatal HIV transmission.
Ways of protecting oneself against contractingan STI, including HIV/AIDS, were found to be
well known: 86% of all MCH clients and 90% offamily planning clients could mention at least one.Figure 10-11 shows the frequency with which thefour main means were mentioned. There was somevariation across countries in which means of pro-tection were most frequently cited. In Ghana,Zambia, and Zimbabwe, 70% to 90% of clientsmentioned being faithful to their partners. Whilethis behavior is to be encouraged, given that formost MCH/family planning clients (who arealmost exclusively women) it is their male partnerwho is the most likely source of infection, personalfidelity is probably less important than partnerfidelity. Yet encouraging partner fidelity was men-tioned by only one-quarter of respondents, per-haps reflecting womenÕs perception that this is notan easy option to exercise in most relationships.Rather troubling is the fact that only one-half ofrespondents mentioned using condoms, althoughthe proportion varied from over 90% in Botswana(where it was the most mentioned means) to about
212 Clinic-Based Family Planning and Reproductive Health Services in Africa
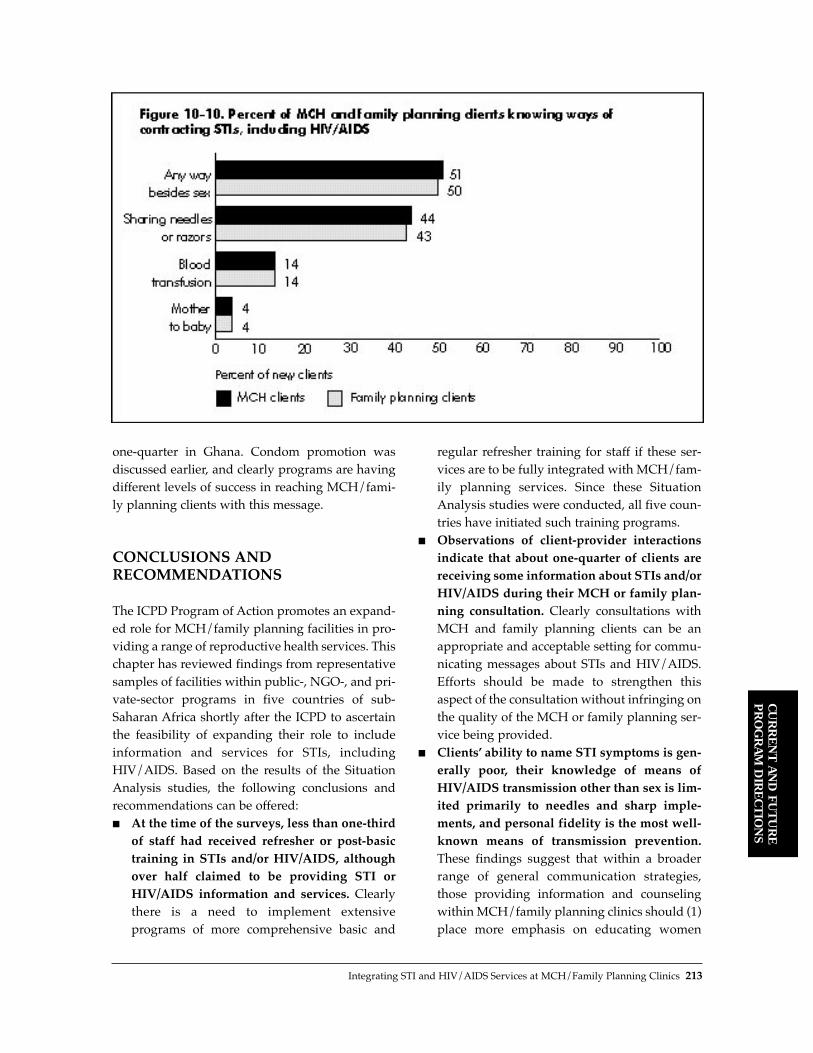
one-quarter in Ghana. Condom promotion wasdiscussed earlier, and clearly programs are havingdifferent levels of success in reaching MCH/fami-ly planning clients with this message.
CONCLUSIONS ANDRECOMMENDATIONS
The ICPD Program of Action promotes an expand-ed role for MCH/family planning facilities in pro-viding a range of reproductive health services. Thischapter has reviewed findings from representativesamples of facilities within public-, NGO-, and pri-vate-sector programs in five countries of sub-Saharan Africa shortly after the ICPD to ascertainthe feasibility of expanding their role to includeinformation and services for STIs, includingHIV/AIDS. Based on the results of the SituationAnalysis studies, the following conclusions andrecommendations can be offered:■ At the time of the surveys, less than one-third
of staff had received refresher or post-basictraining in STIs and/or HIV/AIDS, althoughover half claimed to be providing STI orHIV/AIDS information and services. Clearlythere is a need to implement extensive programs of more comprehensive basic and
regular refresher training for staff if these ser-vices are to be fully integrated with MCH/fam-ily planning services. Since these SituationAnalysis studies were conducted, all five coun-tries have initiated such training programs.
■ Observations of client-provider interactionsindicate that about one-quarter of clients arereceiving some information about STIs and/orHIV/AIDS during their MCH or family plan-ning consultation. Clearly consultations withMCH and family planning clients can be anappropriate and acceptable setting for commu-nicating messages about STIs and HIV/AIDS.Efforts should be made to strengthen thisaspect of the consultation without infringing onthe quality of the MCH or family planning ser-vice being provided.
■ ClientsÕ ability to name STI symptoms is gen-erally poor, their knowledge of means ofHIV/AIDS transmission other than sex is lim-ited primarily to needles and sharp imple-ments, and personal fidelity is the most well-known means of transmission prevention.These findings suggest that within a broaderrange of general communication strategies,those providing information and counselingwithin MCH/family planning clinics should (1)place more emphasis on educating women
CU
RR
EN
T A
ND
FU
TU
RE
PR
OG
RA
M D
IRE
CT
ION
S
Integrating STI and HIV/AIDS Services at MCH/Family Planning Clinics 213
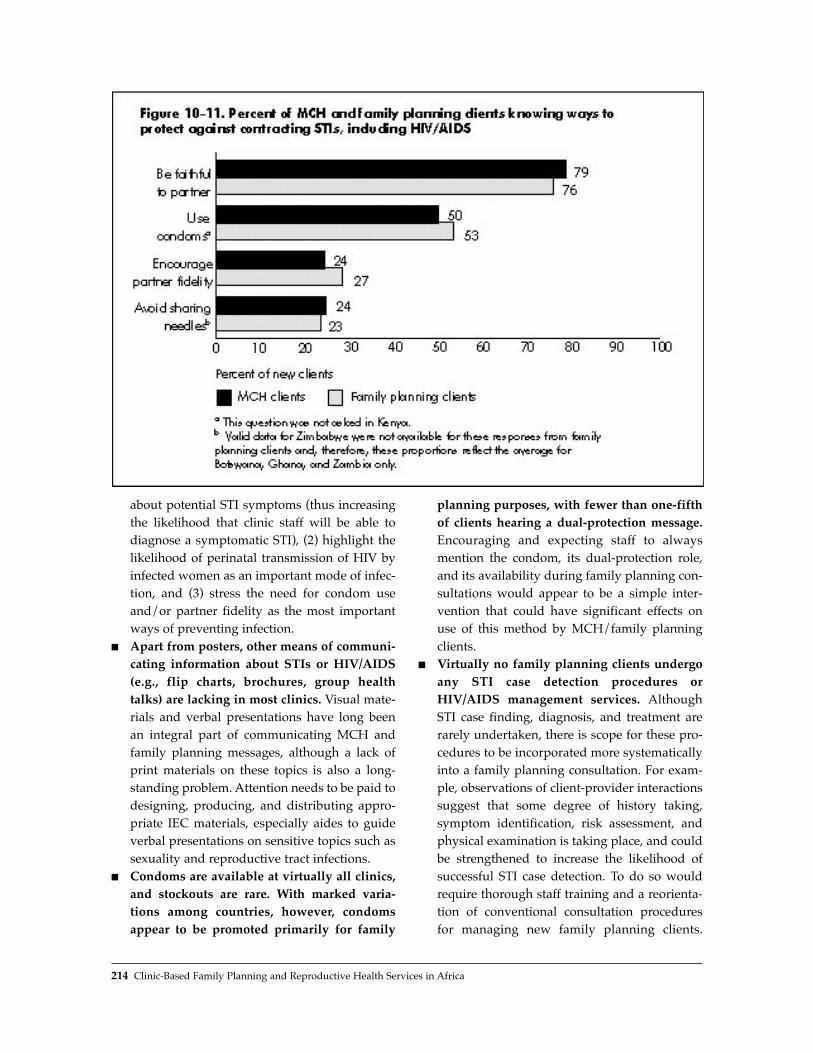
about potential STI symptoms (thus increasingthe likelihood that clinic staff will be able todiagnose a symptomatic STI), (2) highlight thelikelihood of perinatal transmission of HIV byinfected women as an important mode of infec-tion, and (3) stress the need for condom useand/or partner fidelity as the most importantways of preventing infection.
■ Apart from posters, other means of communi-cating information about STIs or HIV/AIDS(e.g., flip charts, brochures, group healthtalks) are lacking in most clinics. Visual mate-rials and verbal presentations have long beenan integral part of communicating MCH andfamily planning messages, although a lack ofprint materials on these topics is also a long-standing problem. Attention needs to be paid todesigning, producing, and distributing appro-priate IEC materials, especially aides to guideverbal presentations on sensitive topics such assexuality and reproductive tract infections.
■ Condoms are available at virtually all clinics,and stockouts are rare. With marked varia-tions among countries, however, condomsappear to be promoted primarily for family
planning purposes, with fewer than one-fifthof clients hearing a dual-protection message.Encouraging and expecting staff to alwaysmention the condom, its dual-protection role,and its availability during family planning con-sultations would appear to be a simple inter-vention that could have significant effects onuse of this method by MCH/family planningclients.
■ Virtually no family planning clients undergoany STI case detection procedures orHIV/AIDS management services. AlthoughSTI case finding, diagnosis, and treatment arerarely undertaken, there is scope for these pro-cedures to be incorporated more systematicallyinto a family planning consultation. For exam-ple, observations of client-provider interactionssuggest that some degree of history taking,symptom identification, risk assessment, andphysical examination is taking place, and couldbe strengthened to increase the likelihood ofsuccessful STI case detection. To do so wouldrequire thorough staff training and a reorienta-tion of conventional consultation proceduresfor managing new family planning clients.
214 Clinic-Based Family Planning and Reproductive Health Services in Africa

Evidence from case studies that have tried thisapproach (Maggwa and Askew, 1997a), howev-er, suggests that any such effort would need tobe implemented very systematically and withsubstantial supervision.
■ Evidence from at least one country(Zimbabwe) suggests that a well-supportedand -organized STI drug supply program canensure the availability of basic medicationsneeded to treat STIs at most clinics; however,this situation appears to be the exceptionrather than the rule in most sub-SaharanAfrican countries. Easy access to affordableand effective treatment for those found to beinfected is crucial to ensure that complicationsare minimized, and the likelihood of furthertransmission is reduced. How such drug sup-ply programs can be implemented and sus-tained is not well known, however.These results need to be considered in the con-
text of the current debates on the objectives andassumptions underlying the promotion of integra-tion (as stated in the introduction). Currently, thereappears to be agreement that communicating infor-mation to women about symptom recognition,modes of transmission, and protective behaviors isfeasible within MCH/family planning clinics, andefforts to this end should be strengthened.Moreover, in theory at least, this strategy for chang-ing behavior is expected to help prevent transmis-sion of STIs/HIV, thereby reducing levels ofSTI/HIV infection in the general population,although such a behavior-change strategy urgentlyneeds evaluation. The major question is whetherSTI case finding and management should alwaysbe a component of an integrated approach to ser-vice delivery at MCH/family planning clinics.Clearly, it is an essential component of a client-cen-tered approach that seeks to alleviate immediatesuffering and to prevent complications caused bysuch infections in individual women and theirinfants. However, the syndromic approach, whichis currently used to detect and manage STI cases bymost programs in sub-Saharan Africa, has beenshown to have poor sensitivity and positive predic-tive values when used to manage vaginal discharge(a common syndrome in women), especially whenthe discharge is due to cervicitis. Therefore, for STI
case finding and management to have the desiredimpact, there is need for improvements in the syn-dromic approach and/or development of morecost-effective alternative approaches. It is also ques-tionable whether STI case finding and managementin MCH/family planning clinics has much if anyeffect on reducing the transmission of infection inthe general population. This is because most clientsare primarily monogamous and are more likely toreceive an infection from their regular partner thanto transmit it to others. Moreover, unless the part-ner is also treated, the likelihood of the womanbecoming reinfected is high.
In summary, operations research is needed toexplore the effectiveness and cost-effectiveness ofdifferent approaches to integrating the communi-cation of information on STIs and HIV/AIDS aswell as STI case finding and management intoMCH/family planning clinic procedures.Moreover, research must be undertaken into theimpact of such approaches on sexual behavior andon infection transmission and incidence, in boththe population of women attending MCH/familyplanning clinics and the population resident in theclinic catchment areas. Without this information,policy makers do not have a sufficiently clear basison which to promote clinic-based integration as ameans of reducing STI and HIV transmission.
REFERENCES
Askew, I., N. Maggwa, and L. Kangas. 1998.ÒIntegrating STI and HIV/AIDS services intoMCH/FP programs in East and Southern Africa.ÓPaper presented at the Annual Meeting of thePopulation Association of America, Chicago.
Bryson, Y. 1996. ÒPerinatal HIV-1 transmission: Recentadvances and therapeutic interventions.Ó AIDS, 10(Supplement):S33ÐS42.
Chipato, T., M. Chirenje, P. Blumenthal, L. Gaffikin, andH. Sanghvi. 1995. ÒCervical cancer screening pilotstudy in Zimbabwe.Ó Unpublished report,JHPIEGO, Johns Hopkins University, Baltimore.
Hatcher, R., W. Rinehart, R. Blackburn, and J. Geller.1997. The Essentials of Contraceptive Technology. JohnsHopkins School of Public Health, PopulationInformation Program, Baltimore.
Howson, C., P. Harrison, D. Hotra, and M. Law, Eds.1996. In Her Lifetime: Female Morbidity and Mortality
CU
RR
EN
T A
ND
FU
TU
RE
PR
OG
RA
M D
IRE
CT
ION
S
Integrating STI and HIV/AIDS Services at MCH/Family Planning Clinics 215

in Sub-Saharan Africa. National Academy Press,Washington, D.C.
Iskander, M., J. Patten, S. Qomariyah, C. Vickers, and S.Molyneaux. 1998. Improved Reproductive Health andSTI Services for Women Presenting to Family PlanningServices in North Jakarta. Asia and Near EastOperations Research and Technical AssistanceProject and Indonesian Ministry of Health,Population Council, Jakarta, Indonesia.
Latif, M. 1996. A Report on a Study to Determine theAetiology and Patterns of STDs amongst Men andWomen Presenting to Health Centres in Harare,Zimbabwe and to Determine Risk Factors for Cervicitisamong Symptomatic and Asymptomatic Women.University of Zimbabwe, Harare, Zimbabwe.
Maggwa, N. and I. Askew. 1997a. Integrating STI/HIVManagement Strategies into Existing MCH/FPPrograms: Lessons from Case Studies in East andSouthern Africa. Africa Operations Research andTechnical Assistance Project II, Population Council,Nairobi, Kenya.
Maggwa, N., N. Rutenberg, and I. Askew. 1997b. ÒAchallenge to integrating STI/HIV managementstrategies into existing MCH/FP programs in Eastand Southern Africa: Talking about sex and sexuallytransmitted diseases.Ó Paper presented at the AnnualMeeting of the American Public Health Association,Indianapolis, Indiana.
Mayhew, S. 1996. ÒIntegrating MCH/FP and STI/HIVservices: Current debates and future directions.ÓHealth Policy and Planning, 11,4:339Ð353.
Ndhlovu, L. 1998. ÒLessons learned from SituationAnalysis studies in Africa.Ó Paper presented at theAnnual Meeting of the Population Association ofAmerica, Chicago.
Tsui, A., J. Wasserheit, and J. Haaga, Eds. 1997.Reproductive Health in Developing Countries: ExpandingDimensions, Building Solutions. National AcademyPress, Washington, D.C.
NOTES
1 The term Òsexually transmitted infectionÓ is usedhere instead of Òsexually transmitted diseaseÓ toreflect the need for healthcare programs not only todiagnose and treat the symptoms of sexually trans-mitted diseases, but also to prevent transmission ofinfection.
2 All results presented are for the times of data collec-tion cited above.
3 It should be noted that this information was collect-ed as part of a nonspecific question in which the
family planning or MCH client was asked whethershe had received any other services during her visit.It is also likely that some clients interpreted this tomean receiving treatment rather than information orcounseling.
4 This question was not asked in Botswana.5 There have been two Situation Analysis studies in
Zimbabwe, in 1991 and 1996, and there has actuallybeen a decrease in this proportion over time (theproportion in 1991 was 39%). Paradoxically,Zimbabwe appears to have one of the highest percapita rates in the world for condom distributionthrough the public sector. Thus although MCH/fam-ily planning clinic staff do not appear to be dis-cussing condoms with their clients, the clinic seemsto be an acceptable and effective source for thismethod.
6 Only 3.5% of clients who were told that condomsprotect against STIs were not told about them as acontraceptive method.
7 Cervical caps, female condoms, and, to a lesserextent, spermicides also provide dual protection, butare not widely available in African family planningprograms.
8 Risk assessment involves asking the client about hersexual behavior and that of her partner(s).
9 The observation guide does not distinguish how theinformation was obtained, nor does it recordwhether the woman actually had the symptom; theintention is to measure whether these symptomswere discussed.
10 A slightly different approach to measuring readinessfor undertaking a pelvic exam is presented inChapter 3, which includes the presence of a couch asan essential item.
11 While referral of potential cases to other facilities fordiagnosis and treatment is an important and neces-sary option when these services are not available onsite, such an action is not within the spirit of offeringwomen integrated services.
12 All data presented in this section are drawn from aseries of open-ended questions to clients, and thusthe responses were spontaneous. This approachprobably led to some underreporting of knowledge.
The analysis in this chapter was jointly supported bythe Population CouncilÕs HORIZONS Project and thePopulation CouncilÕs Africa Operations Research andTechnical Assistance Project II. HORIZONS is fundedby the United States Agency for International Develop-ment (USAID), Cooperative Agreement No. HRN-A-00-97-00012-00. The Africa Operations Research andTechnical Assistance Project II is also funded byUSAID, Contract No. CCP-3030-C-00-3008-00.
216 Clinic-Based Family Planning and Reproductive Health Services in Africa

In several sub-Saharan African countries, two ormore Situation Analysis studies have been carriedout several years apart. Comparison of the resultsof these studies reveals the changes in service qual-ity that have occurred in the interval, and thus canbe used to evaluate program interventions thathave taken place. Such comparisons in BurkinaFaso, Ghana, Kenya, and Zambia lead to severaloverall conclusions about how family planningand reproductive health services are changing:
■ Choice of methods shows slight or partialimprovements in all four countries. Theseimprovements take the form of availability ofan expanded range of methods, increased num-ber of methods mentioned to clients, or largernumbers of clients being asked about methodpreference.
■ All four countries are making some progress inincreasing the availability of IUDs, NORPLANT¨,and/or permanent methods. At service deliverypoints that offer these methods, not all ele-mentsÑtraining, equipment, technical compe-tence, and counselingÑrequired to offer themethods are fully in place in any of the coun-tries, but efforts are driving in that direction.
■ The quality of family planning counseling isgenerally low and is declining or stagnant in all
four countries. This particular element of qual-ity is suffering markedly more than technicalcompetence or mechanisms to ensure continu-ity, and does not appear to be directly related totraining interventions.
■ The few indicators that address sexually trans-mitted disease (STD)/HIV integration issueseither declined or remained constant over time.The prevalence of STDs/HIV in these contextslends an extra urgency to these findings.
■ These studies testify to the complexitiesinvolved in achieving real increases in qualityof care. Improvements in the readiness of a pro-gram do not necessarily translate to improve-ments in the quality of care delivered, even ifthe changes are in the form of increased train-ing or supervision.
These studies are limited in their ability to sup-port evaluation of program interventions becausethey lack an experimental design in which theeffect of one or more specific interventions is test-ed and the pathways between interventions andservice quality improvements are clarified. Asadditional Situation Analysis studies are undertak-en on a more regular basis in the future, the oppor-tunity presents itself to design these evaluationsmore productively in this regard.
Changes in Quality of Services Over Time 217
CU
RR
EN
T A
ND
FU
TU
RE
PR
OG
RA
M D
IRE
CT
ION
S
KEY POINTS AND CONCLUSIONS
Changes in Quality ofServices Over Time
11

218 Clinic-Based Family Planning and Reproductive Health Services in Africa

In several sub-Saharan African countries, two ormore Situation Analysis studies have been carriedout several years apart. Whereas each study standson its own as a description of the readiness andquality of services at a particular point in time,comparison of the results can also reveal thechanges in service quality that have occurred overthe interval. This chapter summarizes the results offour such comparisons over time in Burkina Faso,Ghana, Kenya, and Zimbabwe.2
Each of these comparisons had certain specificobjectives, but they all shared two common goals: ■ To describe the changes in service quality over
time■ To use that information to evaluate the activi-
ties that took place between the two studiesThe first of these goals was achieved by all the
studies included here. In each case, program man-agers selected a subset of indicators for the compari-son. The selection of these indicators was affected inpart by changes to the Situation Analysis methodol-ogy over the interval: in some cases, the study instru-ments had evolved significantly, and some indicatorswere not measured at both time periods. Also, thevarious program managers defined their indicatorsof interest based on their own service standards andresearch needs. For this reason, the indicator lists aredifferent for each of the four countries.
The second goal represents a more powerfuluse of the comparative data, because it allows pro-gram managers to identify the most effective inter-ventions and redesign those that are not effective.For example, if a large training program on familyplanning counseling had taken place between thetwo studies, the results would show whether thequality of counseling had improved, remainedsteady, or declined during the interval. All else
being equal, if the quality of counseling amongtrained providers had improved, one could con-clude that the training curriculum had probablyhad a positive effect. If the quality of counselinghad remained steady or declined, however, onecould conclude that the training curriculum mightnot have been effective and should be furtherinvestigated. Because resources are scarce for manyprograms, identifying the most effective interven-tions is particularly critical. (See Chapter 4 for morediscussion on using this type of information.)
The study designs for these comparisons great-ly affect their ability to assist in evaluating inter-ventions. Under the best design, the first SituationAnalysis would be carried out as a baseline study.An intervention to improve some aspect of serviceswould then be carried out among a randomlyselected group of service delivery points (SDPs)(the experimental group). All other SDPs (the con-trol group) would carry out normal program activ-ities. The second Situation Analysis would thenmeasure the quality of service among the experi-mental and control groups, showing with somerigor whether the intervention had been effectivein improving services.
This design is often difficult to carry out in thefield, however, because of budgetary, methodologi-cal, and logistical difficulties.3 Most commonly, pro-gram managers would prefer to carry out interven-tions on predefined groups, such as large hospitals,clinics in particular geographic regions, or clinicstargeted for improvements by donors, rather thanon a randomly selected group of SDPs. In the for-mer case, however, the observed changes in qualitymay be due to some factor other than the interven-tion, and it becomes much more difficult to achievethe goal of attributing increases or decreases in
Changes in Quality of Services Over Time 219
CU
RR
EN
T A
ND
FU
TU
RE
PR
OG
RA
M D
IRE
CT
ION
S
Changes in Quality ofServices Over TimeKate Miller1
11

quality to the intervention alone. In all four casesdescribed here, the Situation Analysis studies wereundertaken as two separate activities, so their com-parability rests largely on their sampling plans,which are described in Annex 11-1, and their instru-ments. Three of the four pairs of studies were usedto evaluate interventions as responsibly as possiblegiven the study design.
In this chapter, each of the four countries isaddressed in turn. Background to the studies, pro-gram activities between the studies, results, and dis-cussion are provided for each. The concluding sec-tion summarizes the results for the four countries.
BURKINA FASO
Background
Burkina FasoÕs family planning program wasestablished in 1985, but by 1993 the contraceptive
prevalence rate (CPR) for modern methods amongall women was still only 4%, and the total fertilityrate (TFR) was above 6, although declining. In1991, an ambitious population policy was adopted,with the objectives of raising the CPR to 60% by theyear 2000 and lowering fertility by 10% every 5years after 2005, while respecting the fundamentalrights of couples and individuals to decide the sizeof their families. The family planning strategyinvolved initiation of services at a small number ofSDPs around the country, followed by expansion toother existing SDPs. In 1992, there were about 100to 150 SDPs offering family planning services. The1992 Situation Analysis study was carried out bythe Ministry of Health (MOH) to provide informa-tion about the actual functioning of the programbefore the expansion and program improvementstook place.
Until 1993, by far the largest funding source forinterventions and improvements to the Burkina
220 Clinic-Based Family Planning and Reproductive Health Services in Africa
Table 11-1. Changes in readiness indicators in Burkina Faso
Readiness Indicators 1992 1995 Significant?
Infrastructure/FacilitiesB-R.1 % of SDPs with a comfortable waiting room 89 89B-R.2 % of SDPs with a toilet for clients 81 83B-R.3 % of SDPs with a satisfactory examining area 60 21 ⇓
Methods OfferedB-R.4 % of SDPs that offer the complete range of methods 24 21
Contraceptive Supplies and LogisticsB-R.5 % of SDPs with appropriate stocking areas 83 79
EquipmentB-R.6 % of SDPs with the minimum necessary equipment for family planning services 9 19
StaffingB-R.7 % of providers who have received training in clinical family planning and IEC skills 43 11 ⇓
IEC Materials and ActivitiesB-R.8 % of SDPs with at least one poster and one brochure on MCH/family planning 28 18 ⇓
Recordkeeping and SupervisionB-R.9 % of SDPs that have received at least one supervisory visit in the last 6 months 57 25 ⇓
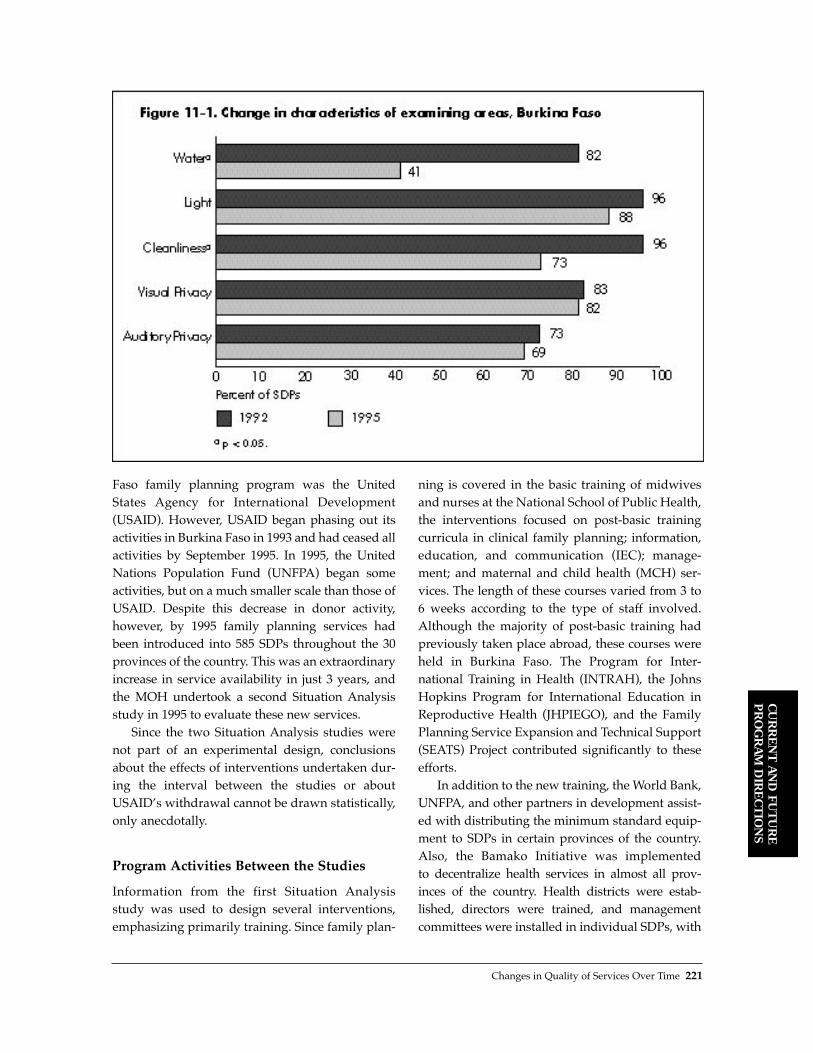
Faso family planning program was the UnitedStates Agency for International Development(USAID). However, USAID began phasing out itsactivities in Burkina Faso in 1993 and had ceased allactivities by September 1995. In 1995, the UnitedNations Population Fund (UNFPA) began someactivities, but on a much smaller scale than those ofUSAID. Despite this decrease in donor activity,however, by 1995 family planning services hadbeen introduced into 585 SDPs throughout the 30provinces of the country. This was an extraordinaryincrease in service availability in just 3 years, andthe MOH undertook a second Situation Analysisstudy in 1995 to evaluate these new services.
Since the two Situation Analysis studies werenot part of an experimental design, conclusionsabout the effects of interventions undertaken dur-ing the interval between the studies or aboutUSAIDÕs withdrawal cannot be drawn statistically,only anecdotally.
Program Activities Between the Studies
Information from the first Situation Analysis study was used to design several interventions,emphasizing primarily training. Since family plan-
ning is covered in the basic training of midwivesand nurses at the National School of Public Health,the interventions focused on post-basic trainingcurricula in clinical family planning; information,education, and communication (IEC); manage-ment; and maternal and child health (MCH) ser-vices. The length of these courses varied from 3 to6 weeks according to the type of staff involved.Although the majority of post-basic training hadpreviously taken place abroad, these courses wereheld in Burkina Faso. The Program for Inter-national Training in Health (INTRAH), the JohnsHopkins Program for International Education inReproductive Health (JHPIEGO), and the FamilyPlanning Service Expansion and Technical Support(SEATS) Project contributed significantly to theseefforts.
In addition to the new training, the World Bank,UNFPA, and other partners in development assist-ed with distributing the minimum standard equip-ment to SDPs in certain provinces of the country.Also, the Bamako Initiative was implemented to decentralize health services in almost all prov-inces of the country. Health districts were estab-lished, directors were trained, and managementcommittees were installed in individual SDPs, with
Changes in Quality of Services Over Time 221
CU
RR
EN
T A
ND
FU
TU
RE
PR
OG
RA
M D
IRE
CT
ION
S
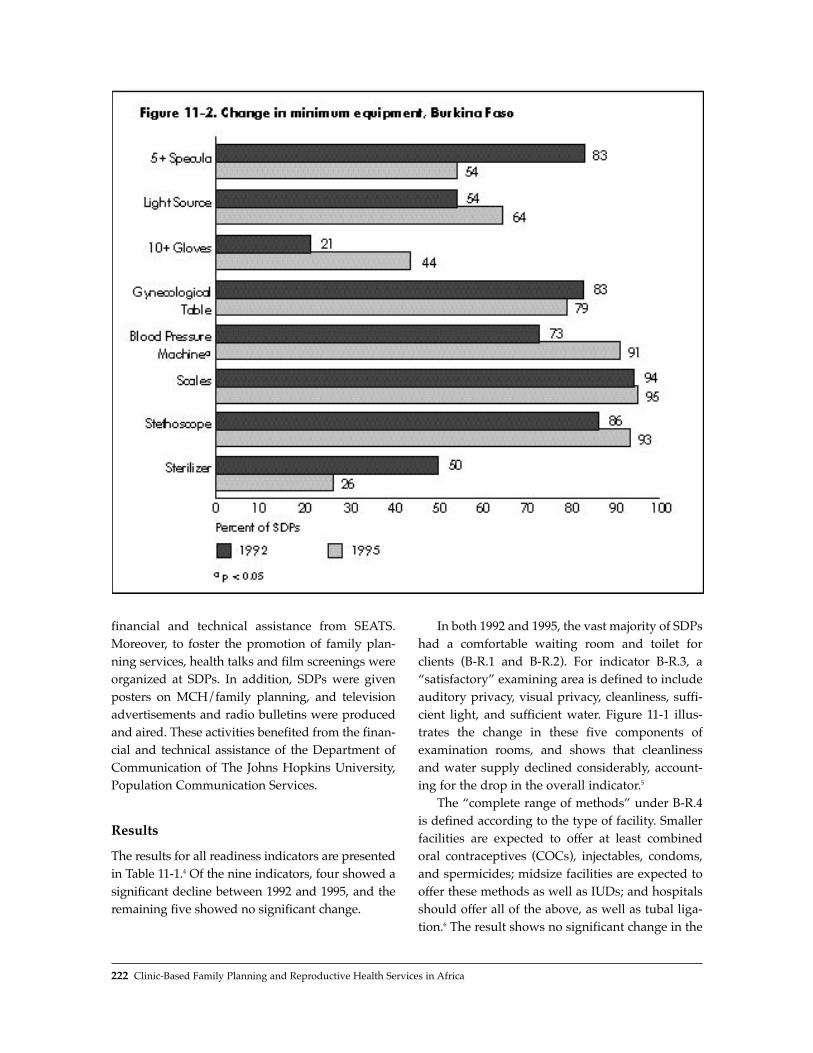
financial and technical assistance from SEATS.Moreover, to foster the promotion of family plan-ning services, health talks and film screenings wereorganized at SDPs. In addition, SDPs were givenposters on MCH/family planning, and televisionadvertisements and radio bulletins were producedand aired. These activities benefited from the finan-cial and technical assistance of the Department ofCommunication of The Johns Hopkins University,Population Communication Services.
Results
The results for all readiness indicators are presentedin Table 11-1.4 Of the nine indicators, four showed asignificant decline between 1992 and 1995, and theremaining five showed no significant change.
In both 1992 and 1995, the vast majority of SDPshad a comfortable waiting room and toilet forclients (B-R.1 and B-R.2). For indicator B-R.3, aÒsatisfactoryÓ examining area is defined to includeauditory privacy, visual privacy, cleanliness, suffi-cient light, and sufficient water. Figure 11-1 illus-trates the change in these five components ofexamination rooms, and shows that cleanlinessand water supply declined considerably, account-ing for the drop in the overall indicator.5
The Òcomplete range of methodsÓ under B-R.4is defined according to the type of facility. Smallerfacilities are expected to offer at least combinedoral contraceptives (COCs), injectables, condoms,and spermicides; midsize facilities are expected tooffer these methods as well as IUDs; and hospitalsshould offer all of the above, as well as tubal liga-tion.6 The result shows no significant change in the
222 Clinic-Based Family Planning and Reproductive Health Services in Africa

percentage of SDPs offering the complete range ofmethods. However, this blunt result masks somelarge changes in the availability of individualmethods. The availability of condoms and spermi-cides dropped precipitously, but injectablesbecame far more widely available. COCs were con-sistently offered by virtually all SDPs. IUDs wereconsistently available at over 90% of the hospitalsand midsize SDPs, but both studies found that IUDservices were also being offered at some smallerSDPs. The change in availability of tubal ligationservices cannot be documented with this data.
Under B-R.6, the Òminimum necessary equip-mentÓ was defined as sterilizer, stethoscope,weighing scale, blood pressure machine, gyneco-logical table, angle poise lamp/torch, gloves (10 or
more pairs), and specula (5 or more). AlthoughTable 11-1 shows an increase in the proportion ofSDPs with all minimum equipment, this resultmust be interpreted with extreme care. First, thechange is not statistically significant, so it may beattributable to sampling error. Second, countingthe number of SDPs that have all the equipmentconceals some details regarding individual items,as presented in Figure 11-2. Blood pressuremachines and gloves became more commonbetween the studies, but supplies of sterilizers andspecula decreased. The availability of other itemsremained generally steady.
The percentage of providers reporting that theyhad been trained in both clinical family planningand IEC (B-R.7) declined sharply from 43% to 11%
Changes in Quality of Services Over Time 223
CU
RR
EN
T A
ND
FU
TU
RE
PR
OG
RA
M D
IRE
CT
ION
S
Table 11-2. Changes in quality indicators in Burkina Faso
Quality Indicators 1992 1995 Significant?
Interpersonal RelationsB-Q.1 % of new clients who received a friendly greeting 71 100 ⇑
Information Taken from ClientsB-Q.2 % of new clients who were asked about their reproductive intentions 53 54B-Q.3 % of new clients who were asked about previous experience with contraceptive methods 72 25 ⇓
Choice of MethodsB-Q.4 % of new clients informed about at least one method other than the method chosen 45 66 ⇑
Information Given to ClientsB-Q.5 % of new clients properly informed about their chosen method 36 19 ⇓B-Q.6 % of new clients with whom IEC materials were used during the consultation, among SDPs with materials 11 3
Technical CompetenceB-Q.7 % of new clients who were assessed using standard medical procedures 56 68B-Q.8 % of pelvic exams during which aseptic procedures were followed 67 64
Mechanisms to Encourage ContinuityB-Q.9 % of new clients informed about the possibility of changing methods 43 18 ⇓B-Q.10 % of new clients who received a revisit date 97 98

between the two studies. Most of this decrease isdue to lower levels of IEC training: training in clin-ical family planning declined from 84% to 72%, buttraining in IEC skills dropped from 47% to 14%.
The result for indicator B-R.8 shows a decline inSDPs with both posters and brochures on familyplanning, caused mainly by a decrease in suppliesof brochures. Between 1992 and 1995, the propor-tion of SDPs with posters increased from 75% to92%, whereas the proportion with brochuresdeclined from 36% to 20%.
The proportion of SDPs having received at leastone supervisory visit in the 6 months preceding thestudy (indicator B-R.9) declined sharply, from 57%to only 25%. This decline was also observed amongthe 45 individual SDPs visited for both situations.
The 10 indicators of service quality listed inTable 11-2 exhibit both increases and declinesbetween 1992 and 1995. B-Q.1 measures interper-sonal relations, and exhibits an increase betweenthe studies. However, this indicator may not befully valid because the arriving person is tradition-ally responsible for a greeting in Burkina Faso.
Indicators B-Q.2 and B-Q.3 address informationtaken from the client. About half of new clientswere asked about their reproductive intentions (B-Q.2), a percentage that did not change between1992 and 1995. However, the proportion of newclients who were asked about previous experiencewith family planning (B-Q.3) fell precipitouslyfrom 72% to 25%. B-Q.4 shows an increase in thepercentage of clients informed about at least onemethod other than their selected method.
As for information given to clients, indicator B-Q.5 shows a decrease in the proportion of clientswho were properly informed about their chosenmethod, from 36% to 19%. For this indicator, Òprop-erly informedÓ is defined as being told about how touse the method, as well as its side effects. The resultfor indicator B-Q.6 shows that very few clients werecounseled with IEC materials, even among SDPswith IEC materials on hand, a result that did notchange significantly between 1992 and 1995.
Technical competence is measured by indicatorsB-Q.7 and B-Q.8, neither of which exhibited a signif-icant change between 1992 and 1995. Indicator B-Q.7addresses the physical assessment of new clients.For this indicator, Òstandard medical proceduresÓ
are defined as taking a medical history, weight, andblood pressure.
As for mechanisms to encourage continuity,over 95% of clients received revisit dates (B-Q.10), a figure that did not change between 1992and 1995. However, the percentage of new clientsinformed about the possibility of changing meth-ods (B-Q.9) dropped from 43% to 18%.
Discussion
Overall, the readiness of the system to providefamily planning services in Burkina Faso appearsto have remained constant or deteriorated. Themore permanent physical aspects of SDPs, such aswaiting areas, toilets, and appropriate stockingareas, remained constant. But declines in readinesswere associated with activities that can vary andsupplies that need to be replenished, such assupervisory visits, IEC materials, and providertraining. The decline in satisfactory examiningareas is attributable not to the physical aspects ofauditory and visual privacy, but to cleaning andensuring water supplies.
The availability of basic equipment showed arange of improvements and declines in individualitems, resulting in no significant change in theoverall result. Moreover, the number of methodsoffered, which certainly depends on supplies andactivities that can vary, did not change significant-ly overall. However, there was a range of changesin individual method availability, chiefly a drop forcondoms and spermicide and a rise for injectables.These changes may simply reflect changes inmethod mix between the studies.
How do these changes reflect the interventionsthat took place between the studies? The decline insystems associated with activities that vary andsupplies that need to be replenished is entirely con-sistent with the above-noted decline in donor activ-ity. Most important, the loss of the SEATS Projecton decentralization of services and managementprobably contributed to the decline in supervisoryactivities. Thus, the enormous increase in SDPsoffering family planning services between 1992and 1995 was not accompanied by an increase inresources for supervision, and supervisors maywell have been overloaded. Moreover, training
224 Clinic-Based Family Planning and Reproductive Health Services in Africa

activities between the studies focused on refreshercourses in clinical family planning and IEC, amongothers; the percentage of providers trained in fam-ily planning remained steady, and that of thosetrained in IEC dropped. Again, these results mayreflect the cessation of USAID activity.
Other projects on very specific issues eitherincreased readiness or perhaps halted a decline.For example, a large decline in the availability ofequipment was probably avoided because of aWorld Bank project on supplying SDPs with basicequipment. The intervention on IEC materialsdealt with items not measured by SituationAnalysis, except posters on family planning, whichdid indeed increase. That supplies of brochuresdeclined may reflect the fact that these particularitems were not part of the intervention.
The quality of family planning services gener-ally remained steady between the two studies,with a few improvements and declines. Oneimprovement was found in interpersonal relations,but questions about the validity of indicator B-Q.1prohibit any strong conclusions on this element ofquality. The other improvement concerns the num-ber of methods mentioned to clients (indicator B-Q.4). However, other aspects of counseling appearto have declined. Indicators of informationexchange (B-Q.2, B-Q.3, B-Q.5, and B-Q.6) eitherremained constant or declined, and the percentageof new clients who were asked about previousfamily planning experience (B-Q.3) declined by 47percentage points, more than any other item in theanalysis. The percentage of clients informed aboutchanging methods (B-Q.9), which can be viewed asa counseling issue, also declined sharply.Moreover, by 1995 the levels of these indicatorswere quite low, many below 25%.
It is fair to assume that the quality of counsel-ing might improve with increased provider train-ing and supervision. Although the training inter-ventions focused on IEC, the actual proportion ofproviders trained in IEC fell (B-R.7 in Table 11-1),and supervision rates also fell precipitously (B-R.9). These circumstances can reasonably beassumed to have contributed to the decline incounseling quality.
Technical competence, as measured by two indi-cators (B-Q.7 and B-Q.8), generally remained steady.
The intervention on clinical training might havebeen expected to affect this indicator, but as shownin Table 11-1, the proportion of providers trained inclinical family planning (B-R.7) did not change sig-nificantly, probably reflecting the USAID pullout.Moreover, the technical competence of providersprobably also responds to supervision, which, asnoted, declined sharply. In fact, given the circum-stances, it is encouraging that these indicators didnot show a significant decline. However, the factthat the overall levels of these indicators were stillabout 65% suggests that training could be strength-ened to improve technical competence further.
GHANA
Background
The first population policy in Ghana was launchedin 1969, but it did not at first succeed in significant-ly raising contraceptive prevalence or decreasingthe TFR. In the early 1990s, however, the GhanaFamily Planning and Health Program (GFPHP),funded by USAID, was established to combat sexu-ally transmitted diseases (STDs)/HIV and improveaccess to family planning services. In 1993, aSituation Analysis study was conducted in con-junction with a Demographic and Health Survey(DHS), and information from these sources wasused to revise the national population policy in1994. The revised policy includes a goal of a TFR of5.0 by 2000, down from 5.5 in 1993. The GFPHP hassince been revised to form the new USAID/GhanaPopulation and AIDS Project (GHANAPA), whichwill carry out activities through 2000. The secondSituation Analysis study was undertaken in 1996 aspart of this project. Its purpose was to evaluate theprogram changes made by the MOH and otheragencies based on the 1993 Situation Analysisresults. The instruments used in the two SituationAnalysis studies in Ghana were quite similar, gen-erating a wealth of comparable items.
Program Activities Between the Studies
Several program activities were carried outbetween 1993 and 1996 by the MOH, the Planned
Changes in Quality of Services Over Time 225
CU
RR
EN
T A
ND
FU
TU
RE
PR
OG
RA
M D
IRE
CT
ION
S

Parenthood Association of Ghana (PPAG), theGhana Registered Midwives Association (GRMA),and USAID/GHANAPA. In particular, multisec-toral, nationwide emphasis was placed on a post-basic course on IUD insertion, which also includedbasic family planning counseling skills and generalreproductive health care. All organizations reportedvarious numbers of staff who received this training.The MOH also instituted some separate traininginitiatives in general family planning clinical andcounseling skills, as well as specific contraceptivetechnology updates. The PPAG and GRMA also ranvarious training programs for their own staffs.
AVSC International and USAID were involvedin a vigorous program to increase the capacity ofthe system to provide long-term methods. Between1992 and 1994, 35 doctor/nurse teams were trainedin mini-laparotomy and vasectomy, and 15 hospi-tals were equipped with operating theaters. PPAGalso established one center for mini-laparo-tomy/vasectomy, but found uptake quite low.Several NORPLANT¨ training courses wereplanned. The Catholic Church also carried out acampaign to increase the availability of naturalfamily planning (NFP), particularly at mission hos-pitals. In addition, the popularity of injectablessoared between the two studies.
Problems with contraceptive supplies were firstaddressed through policy. In 1992, oral contracep-tives were no longer classified as a dangerousdrug; they were later added to the essential druglist in an effort in improve the reliability of sup-plies. USAID took over this effort by trying toreduce the length of the national pipeline for con-traceptive commodities. Injectable supplies werefirst provided at a national level by USAID, andsubsequently by UNFPA. Because of logisticalproblems with this transition, there was a nationalstockout period of about 3 months.
Although an effort was made at broad-based IECcampaigns, these interventions were not very success-ful. The ÒWe CareÓ campaign, launched by the MOHin 1990, had some success in the first few years, butwas slowed in 1994 because of funding problems. Amass-market television campaign by the Ghana SocialMarketing Foundation ran for 2 months, but was latercanceled because the family planning message wasseen by some groups as promoting promiscuity.
Results
The program managers in Ghana decided to pre-sent the results in detail, rather than combiningindicators into a smaller number of summary indi-cators, as in the Burkina Faso analysis. Table 11-3shows the results for readiness indicators includedin the comparison report,7 which reveal a variety ofimprovements and declines. The infrastructure (G-R.1 through G-R.4) has remained largely the samebetween 1993 and 1996, with no significant changesexcept an increase in light and water in examinationrooms. Serious deficiencies in electricity and run-ning water that persisted across the two studieswere determined largely by urban/rural location.
Two of three indicators on the accessibility ofSDPs declined significantly. The percentage ofSDPs with signs announcing services (G-R.5)declined, probably because a major MOH project tosupply signs to SDPs had taken place just beforethe first study, and by the second study many ofthose signs had fallen into disrepair. No specialattention had been given the issue in the interim.About the same proportion of SDPs were open ontime in the two studies (G-R.6), but significantlyfewer SDPs were offering family planning services5 days per week (G-R.7) in 1996 than in 1993.8
The results for methods offered (G-R.8) show adramatic increase in the proportion of SDPs offeringtubal ligation and vasectomy, as well as NFP.Although availability of COCs, condoms, andinjectables declined slightly, these three methodscontinued to be offered by the vast majority of SDPs.IUD availability remained steady, and progestin-only pill (POP) availability increased somewhat.
The proportion of SDPs experiencing stockoutsof COCs, IUDs, and condoms (G-R.9) did notchange between 1993 and 1996, and these rates arefairly low. The large increase in injectable stockoutsis expected because of the above-noted nationwideshortage during the switch from USAID to UNFPAas the major provider, coupled with the increasingpopularity of the method. The decrease in POPstockouts is probably related to the rise in demandfor injectables, which may have reduced thedemand for POPs.
The two indicators of commodity management(G-R.10 and G-R.11) both dropped, although the
226 Clinic-Based Family Planning and Reproductive Health Services in Africa
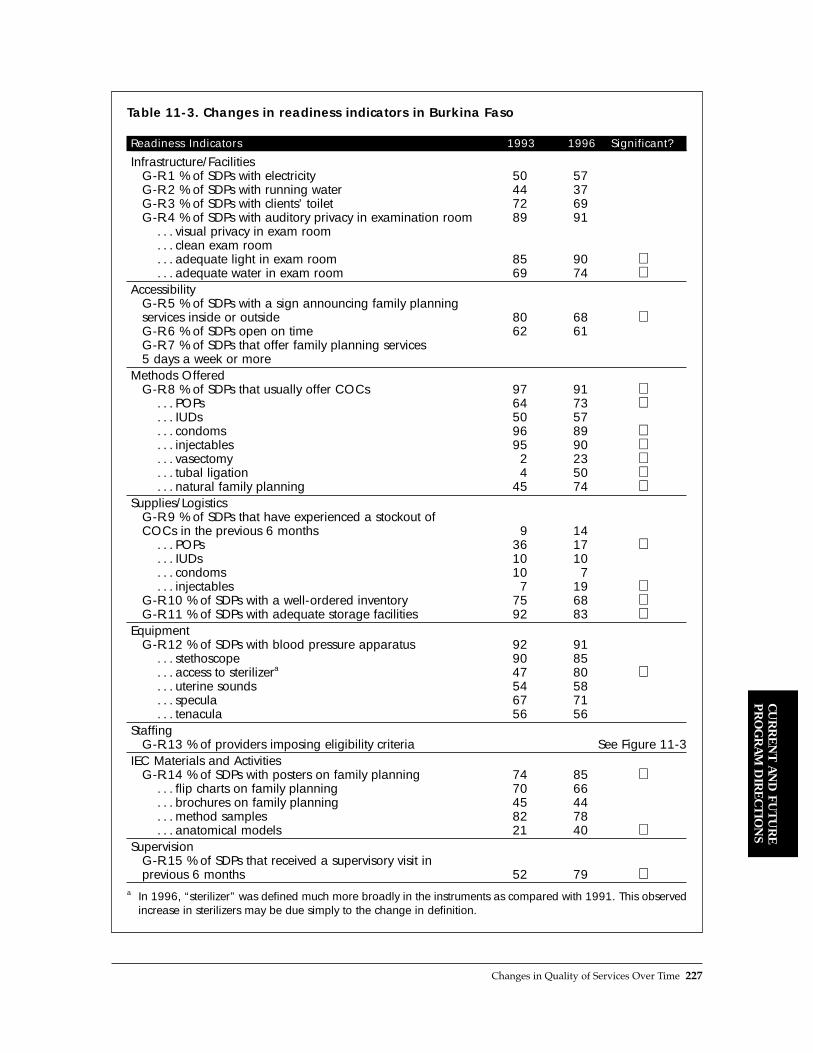
Changes in Quality of Services Over Time 227
CU
RR
EN
T A
ND
FU
TU
RE
PR
OG
RA
M D
IRE
CT
ION
S
Table 11-3. Changes in readiness indicators in Burkina Faso
Readiness Indicators 1993 1996 Significant?
Infrastructure/FacilitiesG-R.1 % of SDPs with electricity 50 57G-R.2 % of SDPs with running water 44 37G-R.3 % of SDPs with clients’ toilet 72 69G-R.4 % of SDPs with auditory privacy in examination room 89 91
. . . visual privacy in exam room
. . . clean exam room
. . . adequate light in exam room 85 90 ⇑
. . . adequate water in exam room 69 74 ⇑Accessibility
G-R.5 % of SDPs with a sign announcing family planning services inside or outside 80 68 ⇓G-R.6 % of SDPs open on time 62 61G-R.7 % of SDPs that offer family planning services 5 days a week or more
Methods OfferedG-R.8 % of SDPs that usually offer COCs 97 91 ⇓
. . . POPs 64 73 ⇑
. . . IUDs 50 57
. . . condoms 96 89 ⇓
. . . injectables 95 90 ⇓
. . . vasectomy 2 23 ⇑
. . . tubal ligation 4 50 ⇑
. . . natural family planning 45 74 ⇑Supplies/Logistics
G-R.9 % of SDPs that have experienced a stockout of COCs in the previous 6 months 9 14
. . . POPs 36 17 ⇓
. . . IUDs 10 10
. . . condoms 10 7
. . . injectables 7 19 ⇑G-R.10 % of SDPs with a well-ordered inventory 75 68 ⇓G-R.11 % of SDPs with adequate storage facilities 92 83 ⇓
EquipmentG-R.12 % of SDPs with blood pressure apparatus 92 91
. . . stethoscope 90 85
. . . access to sterilizera 47 80 ⇑
. . . uterine sounds 54 58
. . . specula 67 71
. . . tenacula 56 56Staffing
G-R.13 % of providers imposing eligibility criteria See Figure 11-3IEC Materials and Activities
G-R.14 % of SDPs with posters on family planning 74 85 ⇑. . . flip charts on family planning 70 66. . . brochures on family planning 45 44. . . method samples 82 78. . . anatomical models 21 40 ⇑
SupervisionG-R.15 % of SDPs that received a supervisory visit in previous 6 months 52 79 ⇑
a In 1996, “sterilizer” was defined much more broadly in the instruments as compared with 1991. This observedincrease in sterilizers may be due simply to the change in definition.

overall results remained fairly encouraging. Thepercentage of SDPs with a well-ordered inventoryfell from 75% to 68%, and the proportion of SDPswith adequate storage facilities dropped from 92%to 83%.
The only item of equipment (G-R.12) thatshowed a change in availability between the twostudies was access to a sterilizer, which increaseddramatically. However, this increase is probablyattributable to a change in the definition of Òsteril-
izerÓ in the 1996 instrument to be much more inclu-sive than that in 1993.
Figure 11-3 shows the change in the percentageof providers who imposed eligibility criteria onfour methods (G-R.13). The results show that inmost cases, providers became considerably morerestrictive during the interval. The increase in alleligibility criteria applied to IUDs is particularlynotable. Program managers also note that theincrease in spousal consent requirements for all
228 Clinic-Based Family Planning and Reproductive Health Services in Africa
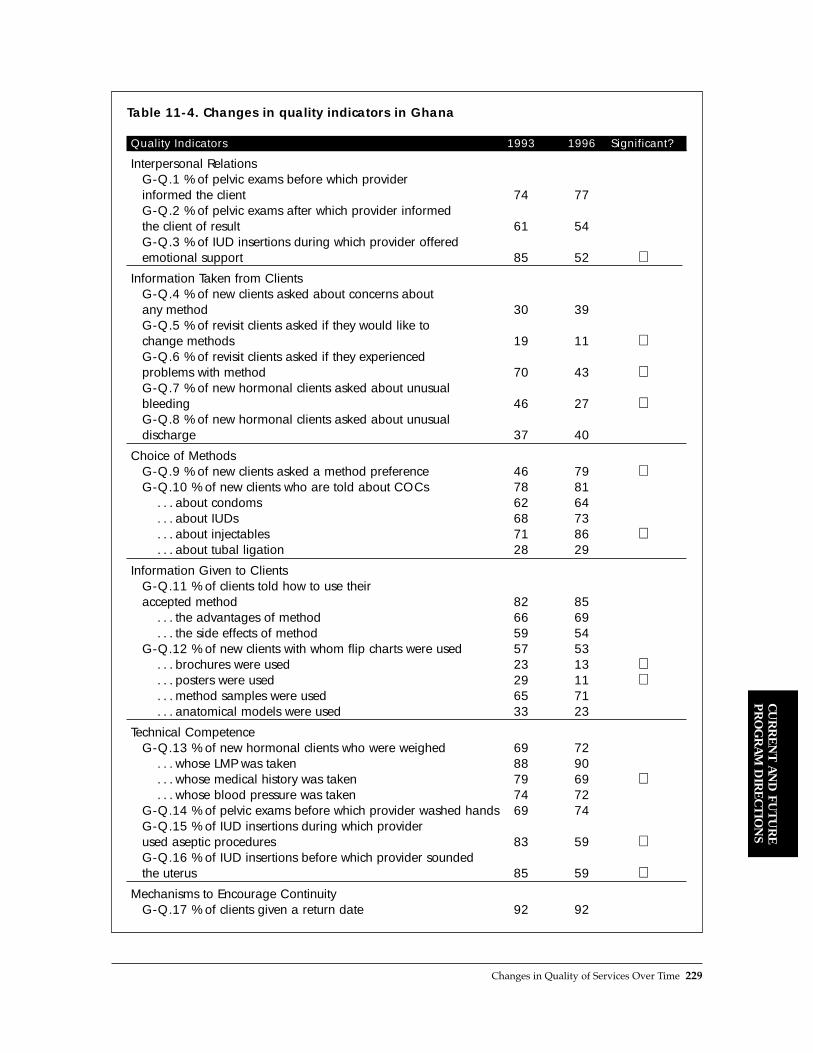
Changes in Quality of Services Over Time 229
CU
RR
EN
T A
ND
FU
TU
RE
PR
OG
RA
M D
IRE
CT
ION
S
Table 11-4. Changes in quality indicators in Ghana
Quality Indicators 1993 1996 Significant?
Interpersonal RelationsG-Q.1 % of pelvic exams before which provider informed the client 74 77G-Q.2 % of pelvic exams after which provider informed the client of result 61 54G-Q.3 % of IUD insertions during which provider offered emotional support 85 52 ⇓
Information Taken from ClientsG-Q.4 % of new clients asked about concerns about any method 30 39G-Q.5 % of revisit clients asked if they would like to change methods 19 11 ⇓G-Q.6 % of revisit clients asked if they experienced problems with method 70 43 ⇓G-Q.7 % of new hormonal clients asked about unusual bleeding 46 27 ⇓G-Q.8 % of new hormonal clients asked about unusual discharge 37 40
Choice of MethodsG-Q.9 % of new clients asked a method preference 46 79 ⇑G-Q.10 % of new clients who are told about COCs 78 81
. . . about condoms 62 64
. . . about IUDs 68 73
. . . about injectables 71 86 ⇑
. . . about tubal ligation 28 29
Information Given to ClientsG-Q.11 % of clients told how to use their accepted method 82 85
. . . the advantages of method 66 69
. . . the side effects of method 59 54G-Q.12 % of new clients with whom flip charts were used 57 53
. . . brochures were used 23 13 ⇓
. . . posters were used 29 11 ⇓
. . . method samples were used 65 71
. . . anatomical models were used 33 23
Technical CompetenceG-Q.13 % of new hormonal clients who were weighed 69 72
. . . whose LMP was taken 88 90
. . . whose medical history was taken 79 69 ⇓
. . . whose blood pressure was taken 74 72G-Q.14 % of pelvic exams before which provider washed hands 69 74G-Q.15 % of IUD insertions during which provider used aseptic procedures 83 59 ⇓G-Q.16 % of IUD insertions before which provider sounded the uterus 85 59 ⇓
Mechanisms to Encourage ContinuityG-Q.17 % of clients given a return date 92 92

methods is probably attributable to providersÕ con-cern about possible reprisals from spousesunaware of their partnerÕs use of family planning.
The availability of IEC materials (G-R.14)remained constant between the studies, except fora moderate increase in posters and a dramaticincrease in the availability of anatomical models.The proportion of SDPs that received a superviso-ry visit in the 6 months preceding the study (G-R.15) increased sharply, from 52% to 79%, a majoraccomplishment for the program.
Table 11-4 shows that most indicators of servicequality showed no significant change between 1993and 1996, but most of those that did exhibiteddeclines. The element of interpersonal relationswas unchanged with regard to informing clientsbefore and after pelvic exams (G-Q.1 and G-Q.2),but the proportion of clients given emotional sup-port during IUD insertions (G-Q.3) dropped. Thiscan also be seen as part of an overall decline in IUDinsertion quality, discussed below.
Of the five indicators of information taken fromclients (G-Q.4 through G-Q.8), three declined andtwo remained constant. By 1995, none of theseresults exceeded 50%, indicating a serious difficul-ty with the quality of client counseling.
Under choice of methods, there was an encour-aging increase in the percentage of new clientsasked about their method preference (G-Q.9),which rose from 46% to 79%. The percentage ofclients hearing about various methods (G-Q.10)did not change significantly; the exception wasinjectables, which showed a moderate increase,probably reflecting the growing popularity of thismethod. Notably, the proportion of clients toldabout tubal ligation remained about 28%.
As for information given to clients, most weretold how to use their accepted method and itsadvantages (G-Q.11), but only just over half weretold about its possible side effects. None of theseproportions changed significantly between 1993and 1996. Moreover, the proportion of clients withwhom IEC materials were used (G-Q.12) eitherremained constant or dropped, as in the case ofposters and brochures.9 With the exception ofmethod samples, overall use of IEC materials wasquite infrequent. Again, these results indicate seri-ous deficiencies in client counseling.
The most significant finding on technical com-petence is the dramatic drop in the quality of IUDinsertions, both for using aseptic procedures (G-Q.14 and G-Q.15) and sounding the uterus (G-Q.16). This is in addition to the decline in offeringmoral support during IUD insertions reportedabove (G-Q.3). The physical assessment of newclients (G-Q.13) did not change greatly between1993 and 1996, except for a moderate drop in theproportion of new hormonal clients whose medicalhistory was taken. Otherwise, the majority of newhormonal clients were assessed through weight,blood pressure, and last menstrual period.Moreover, the percentage of pelvic exams beforewhich the provider washed his/her handsremained largely unchanged between the studies.
Discussion
In Ghana, there were some notable improvementsin readiness indicators between the two studies.For example, the increase in availability of long-term methods is a strong accomplishment of theprogram, as are the dramatic increases in supervi-sory activities and in availability of certain IECmaterials. Moreover, the effort expended on train-ing in the interval between the studies leads to thereasonable conclusion that many staff weretrained. In the 1996 study results, 69% of all staffreport that they had attended family planningrefresher training; 47% had attended a post-basiccourse in general clinical family planning skills;54% in family planning counseling; and 29% inIUD insertion/removal. The training data from1993 is not comparable, so we cannot measure theincrease in training, but only recognize that theconsiderable effort put into training is reflected inthese 1996 levels.
Many of the readiness indicators remainedsteady, suggesting that the programÕs efforts toimprove readiness generally did not translate tohigher-quality services. There were also declines inreadiness, related to accessibility and commoditymanagement. The effort to improve commoditysupplies may have appreciably affected only POPs.As noted earlier, the increase in injectable stockoutsprobably resulted from a nationwide 3-monthstockout due to a switch in suppliers. These are
230 Clinic-Based Family Planning and Reproductive Health Services in Africa
important program issues, but are not as central toservice delivery as the above readiness indicatorsthat improved considerably.
The quality of services, however, largely showsa decline. In particular, the quality of IUD servicesdecreased sharply, in terms of both technical com-petence and the enforcement of eligibility criteriafor the method. By 1996, 26% of providers hadbeen trained in IUD insertion/removal, but we donot know whether the particular providersobserved to be inserting IUDs had been trained ornot.10 Two possible conclusions can be drawn: thatthe observed providers had been trained andexhibited lower quality, or that IUDs were beinginserted by untrained providers, in itself a com-pelling program issue. Either way, the emphasis onthe IUD training between the studies did not haveits intended effect of improving IUD services. Inaddition, the quality of information exchangeappears to have remained steady or declined, eventhough the training also focused on counselingskills. However, counseling on choice of methodsappears to have improved somewhat, which mayreflect a success of the training.
Similarly, the impressive increase in SDPs offer-ing sterilization services was not accompanied byan increase in clients being told about the method.Also, the improved availability of posters andanatomical models did not lead to increased use ofthese materials with clients. In fact, use of posterswith clients dropped to only 11% at SDPs withposters available. In both cases, an increase inreadiness to provide services did not appear totranslate to the quality of services offered clients.And all of the declines in quality of care givenclients took place in an environment of sharplyincreased supervisionÑa puzzling result.
KENYA
Background
In the 1970s and 1980s, KenyaÕs TFR was about 8,one of the highest in the world, but by 1993 it hadfallen to 5.8. Although family planning serviceswere first introduced in 1967, the program was notvery effective until the late 1980s. The MOHÕs
family planning program, with overall programand policy coordination by the National Councilfor Population and Development (NCPD), is cred-ited with having contributed to the fertilitydecline.
The first Situation Analysis study carried out inKenya in 1989 (see Chapter 1) was the first study ofits kind, and was undertaken by the MOH and thePopulation Council to identify the strengths andweaknesses of the program. By the time the MOHdecided to carry out its second Situation Analysisstudy in 1995, the methodology had evolved con-siderably. Although the new study gave a detailedpicture of the state of services, there was not a largenumber of questions comparable with those of thefirst study.
Moreover, the activities undertaken betweenthe studies took place over a long period of time,involved a variety of agencies, and affected vari-ous groups of SDPs. The resulting complexity ofteasing out individual interventions reduces theability to evaluate them. For these reasons, evalu-ating the effectiveness of program interventions isnot possible with the Kenyan data. However, thedata can still meet the goal of describing changes inprogram functioning.
Program Activities Between the Studies
The results of the first Situation Analysis studywere used by a variety of organizations to improveKenyaÕs family planning program. For example,program managers were brought together to dis-cuss the results and develop administrative plansfor addressing some of the identified problems.The NCPD, the MOH, Nairobi University, and thePopulation Council collaborated on the develop-ment and implementation of operations research(OR) studies to experiment with possible solutionsfor some of the quality-of-care issues raised by thestudy. The Nairobi City Commission (NCC) imme-diately supplied clinical equipment stored in itswarehouse to clinics where it was lacking, and alsotransferred personnel to better reflect the actualcase loads of each of its clinics. The NCC alsoworked collaboratively to reorient the technicalassistance program being planned with Pathfinder
Changes in Quality of Services Over Time 231
CU
RR
EN
T A
ND
FU
TU
RE
PR
OG
RA
M D
IRE
CT
ION
S

International to better reflect the needs revealed bythe study.
Results
The results of the comparison of the two SituationAnalysis studies are shown in Tables 11-5 and 11-6.In Kenya, methods offered (K-R.1) refers to themethods physically in stock on the day of the studyvisit.11 The results show an increase in injectable
stocks. The vast majority of SDPs had COCs andcondoms in both 1989 and 1995, and about half hadIUDs in both studies. NORPLANT¨ was offered inonly one SDP in 1989, and in 6% of SDPs in 1995.These results suggest a moderate increase in therange of methods available.
Methodological differences between the twostudies make information on staff training difficultto compare. Nonetheless, a qualitative assessmentof the data shows that there was probably an
232 Clinic-Based Family Planning and Reproductive Health Services in Africa
Table 11-5. Changes in readiness indicators in Kenya
Readiness Indicators 1989 1995 Significant?
Methods OfferedK-R.1 % of SDPs with COC stock on hand 99 98
. . . condoms on hand 85 91
. . . injectables on hand 80 91 ⇑
. . . IUDs on hand 60 51
StaffingSee text
IEC Materials and ActivitiesK-R.2 % of SDPs with posters on family planning on the walls 53 75 ⇑
. . . pamphlets or other IEC material available 38 74 ⇑K-R.3 % of SDPs that gave a health talk 32 21K-R.4 % of health talks that included family planning 17 9
Recordkeeping and SupervisionK-R.5 % of SDPs that had at least one supervisory visit in the previous 6 months 78 78
Table 11-6. Changes in quality indicators in Kenya
Quality Indicators 1989 1995 Significant?
Choice of MethodsK-Q.1 % of new clients who are told about COCs 90 85
. . . condoms 77 72
. . . injectables 90 83
. . . IUDs 83 87
. . . tubal ligation 17 34 ⇑
. . . vasectomy 4 12 ⇑Information Given to Clients
See Figure 11-4

increase in the proportion of nurses who receivedin-service training, from about 32% in 1989 toabout 60% in 1995.
IEC materials in the form of posters and pam-phlets or other materials (K-R.2) became increas-ingly available between the studies. However, nochange was observed in health talks held (K-R.3)or in the proportion of health talks that includedinformation on family planning (K-R.4). The fre-quency of supervision (K-R.5) was also notobserved to change between the studies.
The only directly comparable indicator of ser-vice quality from the two studies is methods men-tioned to clients (K-Q.1). Most clients were toldabout COCs, condoms, injectables, and IUDs, andthese levels did not change significantly between1989 and 1995. However, a significantly higherproportion of clients was told about long-term andpermanent methods in 1995. NORPLANT¨ wasintroduced in Kenya in about 1989, but was notincluded in the first Situation Analysis study. By1995, however, 35% of clients were being toldabout this method. Overall, there was an increasein the mean number of methods mentioned toclients from about 3.8 to 4.2.12
The data on information given to clients cannotbe directly compared between the two studies, butit can hint at some changes in the quality of coun-seling. In the 1995 study, observers noted whetherclients were told various information about theirchosen method, such as how it works and its side
effects, whereas in 1989, observers recorded whatclients were told about any method, not the partic-ular one they had chosen. Moreover, the categoriesof information changed between the studies.Nonetheless, a review of the training programs forobservers suggests the comparability of four items(see Figure 11-4): how to use, benefits/advantages,complications/side effects, and how to managecomplications/what to do if problems. Because the1989 data relate to any method, percentages areprobably inflated relative to the 1995 data. Givenall these caveats, however, it may be fair to con-clude that more clients were being told about sideeffects and their management in 1995 than in 1989,although conclusions about information on how touse the method and its benefits are more difficultto draw.
Discussion
Again, the circumstances of these SituationAnalysis studies do not permit an evaluation of theprogram interventions. However, some servicechanges can be described. In general, most of theindicators remained constant between the studies,but all those that exhibited a change improved.Stocks of injectables and NORPLANT¨ rose, indi-cating a possible modest increase in method avail-ability. IEC materials also showed an increase,although health talks declined in frequency andfamily planning content. Supervisory rates were
Changes in Quality of Services Over Time 233
CU
RR
EN
T A
ND
FU
TU
RE
PR
OG
RA
M D
IRE
CT
ION
S

unchanged. As for quality of services, the choice ofmethods appears to have improved, with increaseddiscussion of long-term and permanent methods,and information given to clients on side effects andtheir management may have improved as well.
ZIMBABWE
Background
In 1985, the Zimbabwe National Family PlanningCouncil (ZNFPC) was established to coordinate thefamily planning activities that had increasinglybeen taking place in the country since the 1950s.The resulting family planning program is generallyregarded as one of the most successful in Africa.The TFR in 1997 was under 5, and the CPR for mod-ern methods among all women of reproductive agewas fully 31% in 1994. Much of the credit for thisCPR belongs to the active community-based distri-bution (CBD) program run by the ZNFPC, whichserves up to 30% of users in the country.13 Themajority of other users attend state clinics, most ofwhich are run by the Ministry of Health and ChildWelfare (MOH&CW). Aside from the CBD pro-gram, the ZNFPC also runs some clinics, but it ismainly a policy-making and coordinating body.
The ZNFPC follows a 5-year planning cycle,and the first 5-year cycle came to an end in 1996.The first Situation Analysis study was undertakenin 1991 as a baseline study, and the second was car-ried out at the end of the planning cycle for com-parison purposes.
Program Activities Between the Studies
In June 1992, as part of a project to increase therange of family planning methods available, theMOH&CW lifted a ban on providing injectables.The ZNFPC subsequently conducted a number ofworkshops to refresh providers on all contracep-tive methods, with particular attention to theinjectable. Similar workshops were held through-out the country to disseminate new guidelines thatremoved eligibility criteria based on age, maritalstatus, spousal consent, and parity, as well as otherbarriers to services.
In response to the 1991 Situation Analysis studyfinding that some facilities did not have the neces-sary equipment for family planning service deliv-ery, the ZNFPC began a project to distribute equip-ment to SDPs. The establishment of a logistics unitwithin the ZNFPC in 1993 also helped facilitate thesystematic procurement, storage, and distributionof contraceptive supplies and equipment.
Results from the 1991 Situation Analysis studywere also used to revise the family planning train-ing curriculum. The 1991 study showed that coun-seling skills were weak, as revealed by the limitedinformation exchange that was observed.Unfortunately, the production of materials for usein training providers in counseling and interper-sonal communication modules was delayed, andthe result was a limited number of providers beingtrained between 1991 and 1996,
However, general training in family planningwas enhanced by decentralizing training atMCH/family planning schools in selected districtsand in-service training at city health departments,as well as including a family planning module inbasic training for nurses. In particular, the ZNFPCresponded to the finding that the provision of IUDswas limited and that providers hardly discussed orprovided STD services by developing a modulethat integrated the diagnosis and management ofgenital and urinary tract infections. Furthermore,the ZNFPC piloted an on-the-job training programin IUDs and STD screening, as well as a private-sector program to train doctor/nurse teams intubal ligation and NORPLANT¨.
IEC activities revolved around increasing thedemand for long-term and permanent methods andtraining providers in selected sites on counselingskills for these methods. High-quality IEC materialswere developed and produced for trainers, serviceproviders, clients, and the general public.
Results
Table 11-7 shows that over half of the observedreadiness indicators increased significantly, andthe rest remained steadyÑan extraordinaryachievement.
The infrastructure and facilities of the systemdid not change, as measured by availability of
234 Clinic-Based Family Planning and Reproductive Health Services in Africa

adequate water and seating space (Z-R.1 and Z-R.2, respectively). As for methods offered, the dataare largely not comparable on this point. However,information on supplies of IUDs, as well as otherprogram information, leads to the conclusion thatthe availability of the IUD did not show a largeincrease between the studies.
There was a marked increase in the percentageof SDPs with proper stock keeping (Z-R.3), whichis defined as keeping an up-to-date, legible inven-tory. Changes in equipment availability (Z-R.4)were all positive. By 1996, over 90% of SDPs hadcouches, scales, and specula, up from 86% or less.The percentage of SDPs with uterine sounds andtenacula did not change significantly, but these
items are found only in SDPs that offer IUDs.Among these SDPs, 90% or more had a uterinesound and speculum in 1996. Sterilizers remainedavailable at about 60% of SDPs in both studies.
Increases in staff training were considerable.The percentage of providers who had been to afamily planning refresher course (Z-R.5) rose from6% to 60%, and the percentage who had been to anIUD insertion/removal course (Z-R.6) rose from9% to 34%. Similarly, the availability of IEC mate-rials, in the form of health talks and posters (Z-R.7and Z-R.8, respectively), rose significantly. Thepercentage of SDPs that had received at least onesupervisory visit in the preceding 6 months (Z-R.9)increased from 58% to fully 99%.
Changes in Quality of Services Over Time 235
CU
RR
EN
T A
ND
FU
TU
RE
PR
OG
RA
M D
IRE
CT
ION
S
Table 11-7. Changes in readiness indicators in Zimbabwe
Readiness Indicators 1991 1996 Significant?
Infrastructure/FacilitiesZ-R.1 % of SDPs with adequate water available 71 71Z-R.2 % of SDPs with enough seating space 74 71
Methods OfferedSee text
Contraceptive Supplies and LogisticsZ-R.3 % of SDPs with proper stock keeping 62 93 ⇑
EquipmentZ-R.4 % of SDPs with blood pressure machine 93 94
. . . sterilizing equipment 64 60
. . . examination couch 72 94 ⇑
. . . adult weighing scale 86 98 ⇑
. . . uterine sounds 17 16
. . . specula 78 94 ⇑
. . . tenacula 16 15
StaffingZ-R.5 % of providers who attended a family planning refresher course 6 60 ⇑Z-R.6 % of providers who attended IUD insertion/removal training 9 34 ⇑
IEC Materials and ActivitiesZ-R.7 % of SDPs that held a health talk 15 25 ⇑Z-R.8 % of SDPs with posters on family planning on the walls 55 85 ⇑
Recordkeeping and SupervisionZ-R.9 % of SDPs with at least one supervisory visit in previous 6 months 58 99 ⇑
The results for the quality indicators are moreequivocal, as shown in Table 11-8. For example,both indicators of information taken from clients(Z-Q.1 and Z-Q.2) declined significantly, as did twoof the three indicators of information given toclients (Z-Q.4).14 These results suggest a decline inthe quality of counseling, although an increase wasobserved in the percentage of new clients told howtheir chosen method works.
The range of methods offered to clients (Z-Q.3)appears to have improved somewhat. Significantlymore clients were told about POPs, injectables, andIUDs in 1996 than in 1991. The only decline inmethods mentioned was in condoms, a finding thatis of serious concern given the role of condoms inHIV prevention. Similar numbers of clients weretold about COCs and permanent methods acrossthe two studies. Also, in 1996 15% of clients weretold about NORPLANT¨, which was not availablein 1991.
The only available indicators for technical com-petence relate to the assessment of clients (Z-Q.5). Although the vast majority of clients wereassessed with weight and blood pressure in bothstudies, there was a drop in the proportion ofclients whose medical history was taken. Similarly,the number of clients who received pelvic examsdeclined.
Discussion
The sizable increases in ZimbabweÕs readinessindicators are unique among the four studiesincluded here, and all seem to relate directly to pro-gram interventions. The training programs appearto have achieved considerable coverage, greatlyincreasing the percentage of staff with refresherfamily planning and IUD training. In addition, theefforts to equip SDPs properly were probably relat-ed to observed increases in several items of equip-ment, and the formation of a logistics unit appearsto have led to increases in the percentage of SDPswith proper stock keeping. Although no interven-tion appears to have been directly focused onsupervision, the rise in supervisory visits is anoth-er strong program achievement.
Efforts to increase the range of contraceptivesavailable appear to have had more mixed results.
The number of SDPs offering IUD services did notincrease between the studies, but the percentage oftrained providers did. The lifting of the ban oninjectables and the introduction of NORPLANT¨
certainly increased the range of methods available. These changes in the readiness of the system
were not strongly reflected in increases in quality ofservices, although some elements of quality didshow improvement. With regard to the range ofmethods available, more clients were being toldabout several methods, including the injectable,which was mentioned to only 2% of clients in 1991.On the other hand, fewer clients were being toldabout condoms, a particularly important method forcombating HIV, and although there was some focuson increasing demand for permanent methods,there was no significant increase in the percentage ofclients told about these methods. The quality ofcounseling appears to have declined, even thoughmany providers had been trained in counseling, andsupervision had increased dramatically. The onlyincrease in counseling quality was in the percentageof clients told how their chosen method works.
As for technical competence, results for weightand blood pressure taking remained constant,whereas the percentage of clients whose medical his-tory was taken declined. The decline in pelvic examsis seen by program managers as an achievement ofthe new protocols to reduce barriers to services.
Conclusion
The first goal of these comparisons was to describechanges in service quality, and the results of thesestudies do reveal some similar patterns. First, thequality of counseling is generally low (see Chapter3 for more detail), and is declining or stagnant in allthe countries included here. This particular ele-ment of quality is suffering markedly more thantechnical competence or mechanisms to encouragecontinuity, for example, and does not appear to bedirectly related to training interventions.
Second, choice of methods shows slight or par-tial improvements in all four countries. Theseimprovements take the form of an expanded rangeof methods available, increased number of methodsmentioned to clients, or larger numbers of clientsbeing asked about method preference.
236 Clinic-Based Family Planning and Reproductive Health Services in Africa
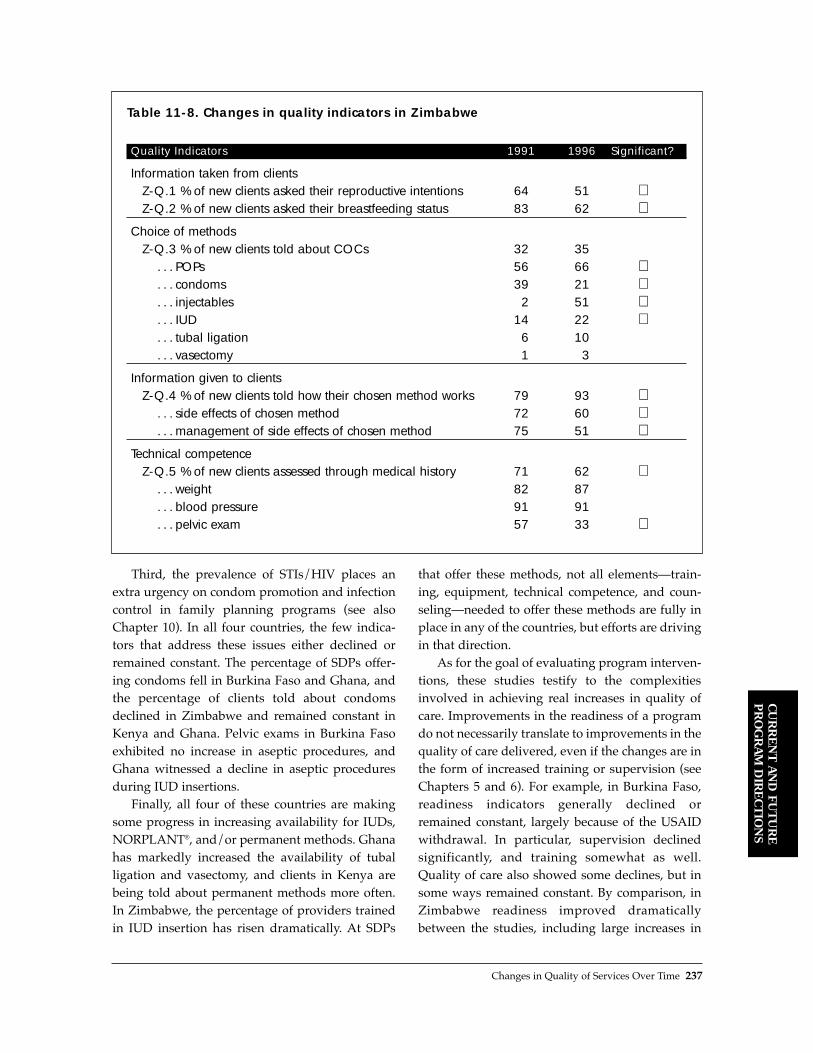
Third, the prevalence of STIs/HIV places anextra urgency on condom promotion and infectioncontrol in family planning programs (see alsoChapter 10). In all four countries, the few indica-tors that address these issues either declined orremained constant. The percentage of SDPs offer-ing condoms fell in Burkina Faso and Ghana, andthe percentage of clients told about condomsdeclined in Zimbabwe and remained constant inKenya and Ghana. Pelvic exams in Burkina Fasoexhibited no increase in aseptic procedures, andGhana witnessed a decline in aseptic proceduresduring IUD insertions.
Finally, all four of these countries are makingsome progress in increasing availability for IUDs,NORPLANT¨, and/or permanent methods. Ghanahas markedly increased the availability of tuballigation and vasectomy, and clients in Kenya arebeing told about permanent methods more often.In Zimbabwe, the percentage of providers trainedin IUD insertion has risen dramatically. At SDPs
that offer these methods, not all elementsÑtrain-ing, equipment, technical competence, and coun-selingÑneeded to offer these methods are fully inplace in any of the countries, but efforts are drivingin that direction.
As for the goal of evaluating program interven-tions, these studies testify to the complexitiesinvolved in achieving real increases in quality ofcare. Improvements in the readiness of a programdo not necessarily translate to improvements in thequality of care delivered, even if the changes are inthe form of increased training or supervision (seeChapters 5 and 6). For example, in Burkina Faso,readiness indicators generally declined orremained constant, largely because of the USAIDwithdrawal. In particular, supervision declinedsignificantly, and training somewhat as well.Quality of care also showed some declines, but insome ways remained constant. By comparison, inZimbabwe readiness improved dramaticallybetween the studies, including large increases in
Changes in Quality of Services Over Time 237
CU
RR
EN
T A
ND
FU
TU
RE
PR
OG
RA
M D
IRE
CT
ION
S
Table 11-8. Changes in quality indicators in Zimbabwe
Quality Indicators 1991 1996 Significant?
Information taken from clientsZ-Q.1 % of new clients asked their reproductive intentions 64 51 ⇓Z-Q.2 % of new clients asked their breastfeeding status 83 62 ⇓
Choice of methodsZ-Q.3 % of new clients told about COCs 32 35
. . . POPs 56 66 ⇑
. . . condoms 39 21 ⇓
. . . injectables 2 51 ⇑
. . . IUD 14 22 ⇑
. . . tubal ligation 6 10
. . . vasectomy 1 3
Information given to clientsZ-Q.4 % of new clients told how their chosen method works 79 93 ⇑
. . . side effects of chosen method 72 60 ⇓
. . . management of side effects of chosen method 75 51 ⇓Technical competence
Z-Q.5 % of new clients assessed through medical history 71 62 ⇓. . . weight 82 87. . . blood pressure 91 91. . . pelvic exam 57 33 ⇓
training and supervision. Yet the quality of careshowed only modest increases, and some aspectsof counseling declined considerably. In Ghana, theMOH emphasized a course on IUD insertion, andmany providers were trained, but the quality ofIUD insertions plummeted, and providers beganimposing markedly more eligibility criteria on themethod. The role of supervision, which is oftenseen as one of the most important program ele-ments, is also questionable based on this data.Supervision declined drastically in Burkina Fasoand increased dramatically in Zimbabwe andGhana, but its effect on quality is not clear in anycountry.15
Based on these comparisons, then, the relation-ship between interventions and improvements inquality is tenuous. Nonetheless, two generallessons can be drawn from this exercise. First,improving service quality requires attention to sev-eral aspects of readiness at once. Increasing theavailability of a method, for example, involvestraining providers both clinically and in counsel-ing, ensuring effective logistical systems for com-modities, establishing equipment and facilities at
SDPs, and generating relevant IEC materials. Noneof these elements alone will complete the task. Forexample, Ghana achieved a significant increase inthe percentage of SDPs offering long-term meth-ods, but providers were found not to be counselingclients about the methods any more than before theincrease. In Zimbabwe, many providers weretrained in IUD insertion, but the method was notbeing offered at a larger proportion of SDPs.Interventions that address all of the subsystemssupporting a method may have more chance ofactually improving the quality of services deliv-ered to clients.
Second, these studies are limited in their abilityto describe the effectiveness of program interven-tions. To meet this objective, the study designs needto be experimental, testing the effects of one or morespecific interventions, as in the Senegal studydesign discussed earlier. In this way, the pathwaysbetween interventions and service quality improve-ments can become much clearer. As SituationAnalysis studies are undertaken on a more regularbasis in the future, the opportunity presents itself todesign these evaluations more productively.
238 Clinic-Based Family Planning and Reproductive Health Services in Africa

Burkina Faso (1992, 1995)
In the 1992 Situation Analysis study, 10 of the 30provinces were randomly selected for inclusion inthe study, and all SDPs offering family planning ser-vices in those provinces were visited. The countryÕstwo main cities, Ouagadougou and Bobo-Diolasso,were also purposively included. The resulting totalsample was 53 clinics. The observations of servicedelivery took place with new clients only.
By 1995, the universe of SDPs offering familyplanning services had increased dramatically, and anew sample was drawn. That sample included acensus of 8 provinces and a stratified sample of theremaining 22 provinces. In addition, all hospitalsand larger clinics were purposively included, for atotal sample of 337. Because the chance of inclusionin the sample varies for each SDP, the 1995 data areweighted on a national level. Both new and revisitclients were observed with service providers.
For purposes of comparison, the 1995 data werereduced to the 12 geographical areas included in1992 (10 provinces and 2 cities). Also, the 1995observation data were reduced to new clients only.Thus, the 53 SDPs from 1992 are compared with117 SDPs in the weighted sample from the sameregions in 1995. Both of these samples include 45individual SDPs that were visited in both studies.The Situation Analysis instruments changedbetween the studies, but not significantly.
Ghana (1993, 1996)
The samples for both Situation Analysis studies inGhana were stratified by type of SDP. In 1993, allhospitals and PPAG clinics were purposivelyincluded, as well as half of MOH clinics and mater-nities, resulting in a stratified random sample of399 SDPs. By 1996, the universe of SDPs had
increased considerably, so the same sampling planwould have resulted in a sample too large for thebudget of the study. Instead, the 1996 sample wasreduced to half of hospitals, a quarter of MOH clin-ics and maternities, and all PPAG clinics (44 SDPs).This new sample was randomly drawn, resultingin a total sample size of 313.
In the results for both Ghana studies, the dataare weighted to account for the varying chance ofinclusion for each SDP. Since each sample is repre-sentative of the country overall, the samples arecomparable with each other on a national level.Although the samples were drawn separately, 109SDPs were visited by chance in both studies. TheSituation Analysis instruments did not change sig-nificantly between the studies.
Kenya (1989, 1995)
The interval between the two Situation Analysisstudies in Kenya was the longest among the com-parisons included here, and the samples differ con-siderably. Moreover, as noted in the main text, the1989 study was the very first Situation Analysis, andthe methodology had evolved considerably by 1995,greatly reducing the number of comparable ques-tions. For these reasons, this comparison has lessdescriptive and evaluative power than the others.
The 1989 sample included a random sample ofMOH clinics, stratified by province. Several dis-tricts were excluded because of logistical problemswith the fieldwork and the sparse population ofSDPs. The final sample included 99 SDPs and wasself-weighting. Observations were carried out onlyon new family planning clients.
The 1995 random sample was stratified threeways: by type of SDP (hospital, health center, dis-pensary), by sector (government vs. nongovern-mental organization [NGO]), and by province.
Changes in Quality of Services Over Time 239
CU
RR
EN
T A
ND
FU
TU
RE
PR
OG
RA
M D
IRE
CT
ION
S
Annex 11-1: Comparability of Samples

This stratification scheme was self-weighting, butsome additional facilities of certain NGOs werealso purposively included. The final sampleincluded 254 SDPs.16 Although the purposivelyincluded SDPs are not weighted, the sample istaken to be sufficiently nationally representative.
Thus, two sampling considerations must bekept in mind when interpreting the comparison ofthe Kenya studies. First, only MOH clinics wereincluded in 1989, whereas MOH and NGO clinicswere included in 1995. Second, the 1989 sampleexcluded five districts.
Zimbabwe (1991, 1996)
The 1991 sample of facilities in Zimbabwe wasstratified by type among MOH/municipal clinicsand private facilities, such as mission hospitals andindustrial clinics. This stratification scheme wasself-weighting. In addition, all ZNFPC clinics werepurposively included, but difficulties with the datamake weighting impossible. Although the totalnumber of ZNFPC clinics is small, the sample isnonetheless considered to be nationally representa-tive. To allow for the comparison, the same SDPswere visited for the 1996 study. The universe ofSDPs had changed a bit during the interval, but notsignificantly.17 Neither data set is weighted in thiscomparison.
REFERENCES
Burkina Faso
Bakouan, D., P. Sebgo, I. Askew, Y. Ouedraogo, P.Tapsoba, C. Viadro, and S. Kanon. 1992. AnalyseSituationnelle du Programme de PlanificationFamiliale au Burkina Faso. Minist�re de la Sant�, delÕAction Sociale et de la Famille, Direction de laSant� de la Famille, and Population Council, BurkinaFaso.
Bamba, A., B. Millogo, J. Nougtara, Y. Ouedraogo, P.Tapsoba, and I. Kabore. 1996. Rapport Final:Deuxi�me Analyse Situationnelle du Programme dePlanification Familiale au Burkina Faso. Minist�re dela Sant�, Direction de la Sant� de la Famille, andPopulation Council, Burkina Faso.
Miller, K., I. Kabore, N. Diop, P. Nebie, A. Bamba, Y.Ouedraogo, P. NÕDiaye, and P. Tapsoba. 1997.
ÒChange in family planning service quality inBurkina Faso, 1992 to 1995.Ó Unpublished.
Ghana
Ghana Statistical Service. Forthcoming. ÒFamily plan-ning service delivery in Ghana: Marching forward ormarking time?Ó Ghana Statistical Service. Accra,Ghana.
Twum-Baah, K., P. Wolf, P. Nyarko, and H. Odai. 1994.A Situation Analysis Study of Family PlanningService Delivery Points in Ghana. Ghana StatisticalService, USAID, and Population Council, Accra,Ghana.
Twum-Baah, K., E. Ameka, E. Okrah, and A. Ohene-Okai. 1997. Second Round Situation Analysis Studyof Family Planning Service Delivery Points inGhana. Ghana Statistical Service, Accra, Ghana
Kenya
Miller, R., L. Ndhlovu, and M. Gachara. 1989. ASituation Analysis of the Family Planning Programof Kenya: The Availability, Functioning, and Qualityof MOH Services. Population Council, New York.
Miller, R., L. Ndhlovu, M. Gachara, and A. Fisher. 1992.ÒSituation Analysis study of KenyaÕs family plan-ning program.Ó In Jain, A., Ed., Managing Quality ofCare in Population Programs. Kumarian Press,Connecticut.
Ndhlovu, L., J. Solo, R. Miller, K. Miller, and A.Omunde. 1997. An Assessment of Clinic-BasedFamily Planning Services in Kenya: Results from the1995 Situation Analysis. Ministry of Health, Divisionof Family Health, Nairobi, Kenya, and thePopulation Council, New York.
Zimbabwe
Dube, H., C. Marangwanda, and L. Ndhlovu. 1998. AnAssessment of the Zimbabwe Family PlanningProgramme: Results from the 1996 Situation AnalysisStudy. Evaluation and Research Unit, ZNFPC, andthe Population Council, Harare, Zimbabwe andNairobi, Kenya.
Zimbabwe National Family Planning Council,Population Council, and SEATS. 1992. Zimbabwe: ASituation Analysis of the Family PlanningProgramme. Population Council, Harare, Zimbabwe.
NOTES
1 This chapter is based on work done by manyresearchers in four countries. In Burkina Faso:
240 Clinic-Based Family Planning and Reproductive Health Services in Africa

I. Kabore, N. Diop, P. Nebie, A. Bamba, Y.Ouedraogo, P. NÕDiaye, and P. Tapsoba. In Kenya: L.Ndhlovu, J. Solo, R. Miller, and O. Achola. In Ghana:K. Twum-Baah, E. Ameka, E. Okrah, and A. Ohene-Okai. In Zimbabwe: H. Dube, C. Marangwanda, andL. Ndhlovu.
2 The four reports are K. Miller et al., 1997 (BurkinaFaso); Ghana Statistical Service, forthcoming(Ghana); Ndhlovu et al., 1997 (Kenya); and Dube etal., 1998 (Zimbabwe).
3 In Senegal, a quasi-experimental study with a strongevaluative function is currently under way, and cer-tain other countries are planning similar studies. SeeChapter 4 for further discussion.
4 For ease of reference within the text, the indicatorsin this chapter are numbered consecutively by coun-try. Thus, for example, K-R.1 is the first readinessindicator discussed for Kenya, while G-Q.3 is thethird quality indicator discussed for Ghana.
5 A similar decline in examining room quality wasobserved among the 45 individual SDPs that werevisited in both studies.
6 These are not requirements of the MOH, but levelsof method availability that take into account thecurrent state of each type of facility and what canreasonably be expected. Burkina FasoÕs nationalnorms and standards establish more stringentrequirements for method availability (Bakouan etal., 1992), but applying those standards yielded 0%for this indicator, which is not a useful or informa-tive result.
7 Not all the indicators included in the Ghana reportare reproduced here, mainly because of space con-straints. The indicators shown in Tables 11-3 and 11-4 were chosen based on their rough comparabilitywith indicators from the other three studies summa-rized here.
8 No decline in this statistic was recorded among the109 revisited SDPs. Therefore, this result may beattributable to the inclusion in 1996 of more SDPs
that did not offer family planning services 5 daysper week, rather than some SDPs reducing the num-ber of days they offered services.
9 These results were calculated among clients at SDPswith each type of IEC material available.
10 There were 47 IUD insertions observed in 1993 and44 in 1996.
11 As compared with measuring the methods usuallyoffered, regardless of whether stocks were availableon the day of the visit, as in the other three studiesincluded here.
12 The difference in these means cannot be tested forstatistical significance because of difficulties with thedata.
13 The comparison of the 1991 and 1996 ZimbabweSituation Analysis studies includes a section on CBDquality, but these results are not presented in thischapter, whose focus is clinic-based services.
14 Changes in these three indicators of informationgiven to clients must be interpreted with cautionbecause they were collected with different methodsin the two studies. In 1996, the data were taken fromthe observation, whereas in 1991, data were avail-able only from the exit interview, in an unpromptedquestion to clients.
15 This finding could be due to the crudeness of theSituation Analysis measurement of supervision.With more information on what supervisors actuallydo during visits, the effects of supervision mightbecome clearer.
16 In Chapter 3, the total sample for Kenya is some-what smaller because several NCC clinics wereremoved to increase the sampleÕs national represen-tativeness. These clinics were not removed for thecomparison summarized here.
17 In Chapter 3, small weights are applied to the 1996Zimbabwe data to account for the slight skewednessresulting from the change in universe. Thus, the1996 results presented here will differ slightly fromthose presented in Chapter 3.
Changes in Quality of Services Over Time 241
CU
RR
EN
T A
ND
FU
TU
RE
PR
OG
RA
M D
IRE
CT
ION
S


VI. SUMMARY, CONCLUSIONS, FUTURE DIRECTIONS, AND
RECOMMENDATIONS
12
Clinic-Based FamilyPlanning andReproductive Health Programs inSub-Saharan Africasummarizes the conclusionsdrawn from Parts II through Vand offers recommendationsfor improving family planningand reproductive health programs.

Summary, Conclusions, Future Directions, and Recommendations 245
SU
MM
AR
Y, CO
NC
LUS
ION
S,
FU
TU
RE
DIR
EC
TIO
NS
,R
EC
OM
ME
ND
AT
ION
S
SUMMARY
Context
Sub-Saharan Africa faces monumental reproduc-tive health challenges, including the highest mater-nal mortality, population growth, and total fertilityrates in the world; much unmet need for familyplanning; and substantial health problems result-ing from unsafe abortions (see Chapter 1 in thisvolume and Rosen and Conly, 1998). The regionalso is the hardest hit by the worldÕs HIV/AIDSpandemic, experiencing the highest rate ofHIV/AIDS infection and 83% of global AIDSdeaths (UNAIDS and World Health Organization,1998). In an effort to address these extraordinarychallenges, many national governments, withdonor support, have established integrated familyplanning and maternal and child health programsthat deliver services to women in thousands ofpublic health facilities (as well as separate nationalAIDS programs that emphasize mass media-ori-ented information, education, and communication[IEC] and national surveillance). These public-sec-tor clinic-based programs usually serve the majori-ty of women using modern methods of contracep-tion (up to 95% in Botswana).
This volume presents the results of a synthesisof basic findings from 12 Situation Analysis stud-ies of these family planning and reproductivehealth programs. These studies were undertaken over the last decade in Botswana, BurkinaFaso, C�te dÕIvoire, Ghana, Kenya, Madagascar,
Nigeria, Senegal, Tanzania, Zambia, Zanzibar,1
and Zimbabwe.When interpreting the findings presented in
this volume, it is important to keep in mind thecontext for the programs examined, including theextent of the reproductive health problems theseprograms face and the economic conditions thatcharacterize the region. Sub-Saharan Africa is thepoorest region of the world, with economies thatare deteriorating as the world experiences the glob-al financial crisis of the late 1990sÑa region whereit is difficult to implement any public-sector pro-gram. Nevertheless, despite these caveats, theregionÕs family planning and health programs areprobably the best of its public-sector programs.
The Situation Analysis Approach
The Situation Analysis approach utilized for thesestudies is a process-oriented assessment methodol-ogy that for the first time provides a field-based,quantitative, large-scale framework for assessingnational family planning programs. The methodol-ogy includes visits to a national, representativesample of family planning service delivery points(SDPs), where field researchersÑmost often nurs-esÑconduct interviews with service providers andfamily planning and maternal and child health(MCH) clients and observe the actual delivery ofservices to family planning clients (see Chapter 1 inthis volume and Miller et al., 1997).
The underlying model guiding data collectionemphasizes two elements: (1) the readiness of the
Clinic-Based Family Planning andReproductive Health Programs in Sub-Saharan AfricaRobert Miller, Ian Askew, Marjorie C. Horn, and Kate Miller
12

service-delivery system to provide services, and (2)the actual quality of care delivered by providersand received by clients, following the Bruce-Jainquality framework (Bruce, 1990). Quality of care isconsidered important for its own sake. Althoughthis assumption has not yet been convincinglydemonstrated by research, quality of family plan-ning services is considered a precursor to bothimportant health-related individual outcomesÑsuch as satisfaction with services, family planninguse and continuation, and achievement of repro-ductive goalsÑand related societal demographicmeasures, such as population growth rates (seeFigure 1-1 in Chapter 1).
Developed in 1988 in Kenya and rapidly dis-seminated around the world, the SituationAnalysis methodology complements the olderresearch tradition focused more on population-based measures of family planning knowledge,attitudes, and practices than on those factors within the service-delivery system over whichmanagers have more direct control (Fisher et al.,1991). Situation Analysis, for the first time, pro-vides an appropriate framework for assessingnational programs.
The 12 studies included in this volume werecarried out in sub-Saharan countries where localinterest was expressed and where the UnitedStates Agency for International Development(USAID) has been most active over the last 10years. The national family planning programsstudied include those considered the most effec-tive in the region apart from South Africa, such asBotswana, Kenya, and Zimbabwe (NationalResearch Council, 1993).
At the time of the studies, half the family plan-ning programs were in the relatively earlyÒlaunchÓ program phase; that is, the countriesÕcontraceptive prevalence rates (CPRs) werebetween 8% and 15% (see Chapter 2). One-quarterof the programs were in the ÒemergentÓ phase,with CPRs below 8%, and only one-quarter were inthe more advanced ÒgrowthÓ phase, with CPRs of16% to 34% (Destler et al., 1990). Countries in Eastand Southern Africa were experiencing especiallyhigh rates of HIV/AIDS and other sexually trans-mitted infections (STIs) relative to other parts of thecontinent.
Smaller countries without USAID support andcountries where political and factional fightinghave been endemic are underrepresented in thesestudies. Thus, the volume is biased toward sub-Saharan countries with higher levels of resourcesand donor assistance and with functioning pro-grams of higher quality relative to the region as awhole. Despite these limitations, however, theinformation presented here comprises the mostcomprehensive assessment of clinic-based service-delivery practices yet undertaken in Africa, andmost likely in any region of the world.
These studies represent a substantial collabora-tion among ministries of health, the PopulationCouncilÕs Africa Operations Research andTechnical Assistance Projects, USAID, and numer-ous other agencies. Data for the basic findings werecollected from approximately 2,500 SDPs; throughobservations of 7,000 client-provider interactions;and through interviews with 4,700 staff, 7,200 fam-ily planning clients, and 12,000 MCH clients. (Anadditional four studies are used for comparisons ofprograms over time in Chapter 11.) The volumedescribes the readiness of clinics to offer familyplanning and other reproductive health servicesand the quality of care received by clients. It alsopresents several comparative analyses that focuson different components of reproductive health-care programs.
Situation Analysis studies are used primarilyby program managers, policy makers, and donorsto assess the strengths and weaknesses of repro-ductive health programs and to plan related activi-ties designed to strengthen services. Many exam-ples of how program managers have utilizedSituation Analysis data are provided in this vol-ume (see Chapter 4). These include modifyingtraining curricula, redeploying personnel andequipment, changing management informationsystems, reorienting technical assistance plans, andplanning follow-up research studies to test solu-tions to program problems.
In light of the vast amount of data examinedhere, what conclusions can be reached to aid thevarious groups involved in improving reproduc-tive health policies and service delivery? The nextsection summarizes the key conclusions thatemerge from the findings presented in Parts II
246 Clinic-Based Family Planning and Reproductive Health Services in Africa

through V of this volume with respect to availabil-ity of and access to services, SDP readiness, urbanvs. rural services, quality of care, and changes inprograms over time. This is followed by a discus-sion of future directions, as well as recommenda-tions toward the development of improved qualityof family planning and reproductive health ser-vices in the region.
CONCLUSIONS
Availability of and Access to Services
All countries represented in these studies haveintegrated family planning services within theirbroader primary healthcare structures, includingthe lowest levelÑthe health post (see Chapter 1).Consequently, if a woman has access to a public-sector healthcare facility (which can itself be a lim-iting factor in many parts of Africa), she usuallywill also have access to family planning informa-tion and services. (Since the Situation Analysisapproach is clinic-based, it cannot provide overallinformation on general access to services, which isinstead found in population-based Demographicand Health Surveys.)
For the most part, clinic facilities are open dailyMonday through Friday (and frequently onSaturdays). They usually open on or nearly ontime. Providers generally stated that they offerfamily planning services at any time of the day(data not shown), although field researchersreported that providers were frequently found toencourage women to come in the mornings and todiscourage afternoon attendance.
Providers were found to introduce, often oftheir own accord, a large number of eligibility cri-teria and other restrictions on access, such as min-imum age, marital status, spousal consent, andminimum parity for different methods (seeChapter 8). Laboratory tests and procedures werealso found to present barriers to access (seeChapter 9). These restrictive criteria based on clientcharacteristics or laboratory testing, although notrecommended by international standards, some-times appear in national guidelines, which is itselfa matter for concern. More important, the criteria
are vastly overapplied by providers. In each of thefive countries examined in Chapter 8, providersapplied at least twice as many eligibility criteria aswere required by national guidelines. This wasespecially the case in Kenya, Botswana, andZanzibar, where from one-quarter to two-thirds ofall eligibility criteria examined were applied byproviders at their own discretion (see Figure 8-9 inChapter 8).
Service Delivery Point Readiness
Readiness relates to the availability and function-ing of infrastructure or subsystems that comprisethe foundation for the service system, such asequipment, logistics and supplies, IEC activities,and management and supervision (see Chapter 1).
Overall, the majority of accessible public healthfacilities in the countries studied are ready to deliv-er a basic level of family planning information andservices. They usually have trained nurses, select-ed basic equipment, and contraceptive supplies. Amore complete review of the indicators summa-rized in Annex 3.1 to Chapter 3, however, revealssignificant problems in a number of areas, includ-ing refresher training of staff and availability ofIEC materials, running water, electricity, and vari-ous equipment. For example, among the 12 stud-ies, the median percentage of SDPs with runningwater was 70%. Gloves and systems for sterilizinginstruments are also problematic in several coun-tries, especially Burkina Faso, Nigeria, andTanzania, where from one-third to one-half ofSDPs reported that such equipment is not availablein sufficient quantity. As a result, services aresometimes delivered without appropriate atten-tion to the maintenance of cleanliness and/or asep-tic conditions to prevent infections. This can be aproblem when a pelvic exam is deemed necessary,and thus is a particular concern for staff expectedto provide IUD and STI screening services. (Whenthe indicators of washing hands before providingservice, using gloves during service, and washinghands after providing service are examined together,under the assumption that any one of the threerepresents an effort to follow clean/aseptic proce-dures, this problem appears somewhat lesssevere.)
Summary, Conclusions, Future Directions, and Recommendations 247
SU
MM
AR
Y, CO
NC
LUS
ION
S,
FU
TU
RE
DIR
EC
TIO
NS
,R
EC
OM
ME
ND
AT
ION
S
Staffing and TrainingSDPs are staffed mainly by nurses (and not byphysicians, except in C�te dÕIvoire). In every studysite except Zanzibar (where only 38% of SDPs arestaffed by nurses), more than 70% of the SDPs vis-ited had at least one nurse on duty, and 6 of the 12sites had more than 90% of SDPs staffed by nurses.In 5 of the 6 countries where data on basic orrefresher training in family planning are available,at least 85% of the staff interviewed had receivedsuch training. (Training content is discussed fur-ther in the section below on the technical compe-tence element of quality.)
Equipment, Methods Offered, and SuppliesOne somewhat surprising but encouraging findingwas that most SDPs do have the basic equipment,facilities, and commodities needed to deliver at leastthree or four types of family planning methods. Inevery country except Nigeria, scales, stethoscopes,equipment for sterilizing instruments, and bloodpressure machines are generally available in morethan two-thirds of SDPs. As would be expected, hos-pitals and some health clinics offer a more completerange of methods than do health posts, and are morelikely to offer tubal ligation, vasectomy, or implants.Hospitals also have laboratories and are often capa-ble of conducting various STI tests.
Contraceptive supplies are normally in stock atSDPs and are stored reasonably well. Among the 12study sites, the median percentage of SDPs foundto have experienced a stockout in the previous 6months was 24% for injectables, 16% for combinedoral contraceptives, 14% for condoms, and 14% forIUDs. Nigeria, Zimbabwe, Zambia, and Kenya hadthe highest stockout rates for offered methods inthe previous 6 months, with about half or more ofthe SDPs reporting a stockout of at least onemethod. Zanzibar, Senegal, and Madagascar hadfewer than 10% of SDPs reporting any stockouts inthe previous 6 months.
Urban vs. Rural Services
The study findings reveal that SDPs in rural areastend to be somewhat less ready to offer family plan-ning services than those in urban areas, which aremore advantaged with regard to the availability of
water, electricity, staff, equipment and supplies,and many other factors (see Chapter 7). As can beseen in Figure 7-5, for each of 6 countries includedin the analysis, an urban advantage was found forapproximately one-quarter to one-half of the indi-cators examined, while a rural advantage appearedfor only 4% to 16% of the indicators. Perhaps mostsurprising, little difference was found betweenurban and rural services on our measures of quali-ty (see Figure 7-6).
Quality of Care
As noted earlier, the quality of care delivered toand received by clients is examined according tothe Bruce-Jain model (Bruce, 1990) in SituationAnalysis studies (see Chapter 1). Several elementsof quality (choice of methods, mechanisms toencourage continuity, provider-client relations, andtechnical competence) show some strength in the12 studies included here. However, our analysesreveal serious shortcomings in the informationexchanged during counseling and in provision ofthe appropriate constellation of services (particu-larly the integration of STI/HIV/AIDS services).
Choice of MethodsOn the positive side, more than 60% of clients aretold about at least two family planning methods,except in C�te dÕIvoire and Zimbabwe. (It is possi-ble that many clients who do not receive informa-tion on two or more methods come to the SDP witha choice already made. In such cases, providers maybe discouraged from discussing other methodsÑapractice that has both supporters and detractors[see Pariani et al., 1987]). Many women do not,however, receive sufficient information about eachmethodÕs possible side effects, its benefits anddrawbacks, and its relationship to HIV/AIDS pre-vention (see Chapter 6 and the discussion of infor-mation exchange below).
Mechanisms to Encourage Continuity of CareThe most basic mechanisms to encourage continuityof use and follow-up are generally in place. Nearlyall women are asked to come back for follow-up.Other data show that most are provided with writ-ten reminders, which is standard practice in all of
248 Clinic-Based Family Planning and Reproductive Health Services in Africa

the programs examined. However, the proportionof new clients told about possible side effectsranged from 68% to only 24% in our studies, witha median of 55%. Problems with continuity arecertainly exacerbated when women experienceunexpected side effects with their method andtherefore stop using it. Lack of discussion aboutthe possibility of switching methods may alsoinhibit continuity.2
Provider-Client RelationsThe vast majority of providers were observed torelate reasonably well with their clients, and fewreports of poor social relations between providersand clients were documented. For example, morethan 80% of clients were observed to receive a friend-ly greeting in all countries except C�te dÕIvoire.More than 95% of women interviewed in all 12 stud-ies reported that the provider was easy to under-stand. It may be noted, however, that client satisfac-tion with services is notoriously difficult to measurethrough Situation Analysis or any survey approachbecause of Òcourtesy bias,Ó whereby clients do notwish to appear rude or ungrateful in giving respons-es to such questions (Simmons and Elias, 1993).
Moreover, while provider-client relations scorewell on these direct measures, Situation Analysisindicators are somewhat superficial gauges of thenature of the provider-client relationship. Overall(as discussed under information exchange below),most providers appear reluctant to discuss inti-mate topics. It is unclear what factors underlie thisreluctance. Possibilities include social normsagainst embarrassing or intimate discussions,social distance between a professionally trainednurse and a less-educated client, and lack offocused training to improve attitudes and skills insuch matters.
Technical CompetenceThe technical competence of providers appears tobe reasonably good with regard to certain specifictasks, such as using sterile needles for injections(observed in more than 95% of the cases in all 9countries where this indicator was studied).Similarly, in 9 of 11 countries, a clean or sterilespeculum was used during pelvic exams in morethan 80% of the observed cases.
One of the most obvious problems, however, isthat some staff offer technical and invasive ser-vices, such as IUD insertion, pelvic examination,and STI/HIV screening and management, withouthaving had appropriate or sufficient training. Inthe 3 countries where clinical training in familyplanning was specifically investigated, only 40% to68% of staff reported having received such train-ing. Nurses who were working prior to the estab-lishment of the family planning program are lesslikely to have had family planning training.Similar gaps appear in STI/HIV/AIDS training.Lack of training in the proper use of less invasivemethods, such as pills and condoms, though prob-lematic, may not be quite as serious as is the casewith more invasive methods since there is lesschance of iatrogenic infections.
Information ExchangeIn our view, the most serious limitation to the qual-ity of care provided is the information exchangedduring counseling. Providers usually do not ask forthe background necessary to provide the full rangeof information, counseling, and contraceptivemethods. For example, the median percentage ofclients asked their reproductive intentions in the 12studies was only 56%, with a range of 28% inTanzania to 90% in Senegal. The median proportionof provider-client interactions observed in whichproviders asked about the nature of the clientsÕ sex-ual relations was 14%. Information such as whetherthe womanÕs partner was included in the decisionto seek family planning, the number of sexual part-ners over the past year, or whether the womanthinks she might be at risk of STIs as a result of herpartnerÕs behavior is rarely sought. Such informa-tion is central to the selection of an appropriatemethod and to the offering of other reproductivehealth information and services, such as STI/HIV/AIDS prevention (see Chapters 6 and 10).Moreover, providers did not inquire about clientsÕbreastfeeding status in 40% to 50% of the interac-tions observed, despite the fact that most programshave access to progestin-only contraceptives and insome countries many providers have been trainedin lactational amenorrhea method (LAM).
Not only do providers not obtain full informa-tion on the clientÕs individual situation, but they
Summary, Conclusions, Future Directions, and Recommendations 249
SU
MM
AR
Y, CO
NC
LUS
ION
S,
FU
TU
RE
DIR
EC
TIO
NS
,R
EC
OM
ME
ND
AT
ION
S

frequently do not provide all the information theclient needs. While in 9 of 11 study sites almost 80%or more of new clients were told how to use theirmethod, the results were less encouraging on suchimportant dimensions as possible side effects ofdifferent methods (most notably the methodaccepted for use) and how to manage side effects,including the possibility of switching methods ifdesired.
In addition to a possible lack of skills, prevail-ing social norms, and/or social distance, failure toprovide information may be due in part to thepoor availability of printed and other materials toassist providers in communicating information.For example, brochures were available in less thanhalf the SDPs in the majority of the 12 study sites.Additionally, those educational materials that areavailable are used very infrequently (with 11% ofclients or fewer, except in Zambia, where availablematerials are used with 22% of clients) (seeChapter 6).
Appropriate Constellation of ServicesThe promotion of an integrated approach to repro-ductive health services, most notably by integrat-ing STI/HIV/AIDS management and preventioninto family planning services, has major implica-tions for service delivery in sub-Saharan Africa (seeChapter 10). Unfortunately, use of the signs andsymptoms of potential infectionÑthe syndromicapproachÑis proving to be unreliable as an STIdiagnostic and management tool for females.Moreover, inexpensive and easily administeredlaboratory testing is not now available in clinicsand health posts in the region. Thus the view thatSTI detection and management could or should beroutinely included as part of family planning con-sultation in African SDPs is being actively debated,with support waning in some circles as discussionof even the best examples of attempts at integrationreveals severe problems with implementation(Maggwa and Askew, 1997).
In addition to the fact that laboratory testing forSTI diagnosis and treatment is not now a viableoption in most SDPs (except perhaps for syphilistesting), providers are not actively pursuing thoseoptions that are available to them for preventing orat least reducing the transmission of STI/HIV/
AIDS among their family planning clients, namelycommunicating messages about safer sexual prac-tices, especially condom use. Because clientsÕ sexu-al behavior is not usually discussed, an importantopportunity to ascertain their risk of infection andto provide education on preventing infection is lost.Further, although condoms are mentioned to abouthalf of clients (although there is significant varia-tion across countries), this is almost always done inthe context of contraception only; dual protectionfrom both pregnancy and STI/HIV/AIDS is rarelymentioned to clients. The range of clients who weretold specifically that condoms protect againstSTIs/HIV/AIDS varied from a low of 2% inSenegal to a high of only 36% in Zambia (see Annex3.1 in Chapter 3).
Clients are also not told that methods other thancondoms do not offer STI/HIV/AIDS protection. In3 of the 4 countries in which this indicator was stud-ied, fewer than 10% of clients were provided thisinformation. Given the lack of availability ofSTI/HIV/AIDS testing and providersÕ limited atten-tion to clientsÕ sexual practices, partnership issues,and social context, it is difficult not to conclude thatthe existing reproductive health service system, withits emphasis on family planning alone, is makingvery little contribution to ameliorating theHIV/AIDS pandemic in the worst-affected region ofthe world.
In addition to this neglect of the STI/HIV/AIDS issue, observations of client-provider interac-tions suggest that there is relatively little attentionto health issues other than STIs/HIV/AIDS (suchas nutrition, immunization, or baby care) whenfamily planning services are being provided.Indeed, in several programs, family planning andother MCH services appear to be provided almostas vertical programs that happen to be offeredunder the same roof.
Changes Over Time
In several countries in the regionÑBurkina Faso,Ghana, Kenya, and ZimbabweÑtwo or moreSituation Analysis studies were carried out a fewyears apart (see Chapter 11). Some similar patternsemerged. For example, the choice of methodsoffered to clients has improved, usually as a result
250 Clinic-Based Family Planning and Reproductive Health Services in Africa

of more reliable supplies of pills and condoms andthe increased availability of injectables, IUDs,implants, and sterilization in the intervening years.At the same time, and requiring serious attention,the information offered to clients appears to be asignificant and continuing problem in all four loca-tions. This review, using Situation Analysis of ser-vice quality, draws attention to the complexities ofachieving real increases in the quality of care, andyields two general lessons. First, improving servicequality requires attention to several aspects ofreadiness at once. Secondly, while the situationanalysis methodology can measure overall changesin various aspects of service quality, it cannotascribe these changes to any particular interven-tion. The latter would require studies based onquasi-experimental design.
FUTURE DIRECTIONS
Considering the relatively short period of timeduring which many governments in Africa havebeen providing family planning and reproductivehealth services, the recency of the paradigm shifttoward reproductive health and quality, and thelarge number of competing demands for health-care resources, the achievements made in estab-lishing the levels of program readiness and qualitydocumented in this volume are substantial. In allcases, the development of these services has beenassisted by external donor agencies. Both programmanagers and international donor agenciesdeserve considerable credit for introducing a majornew health service rapidly and on a broad scale.Recall, however, that our 12 studies exclude manyof the smaller countries with less-stable politicalsystems and less external assistance, such asLiberia, Sierra Leone, and Somalia. It is quite like-ly, then, that the reproductive health programs ofsub-Saharan Africa as a whole are less ready toprovide services and have poorer-quality servicesthan is suggested by the 12 studies included here.Thus the regional needs are probably far greaterthan is represented in this volume.
What should be done to improve the quality offamily planning and reproductive health servicesin sub-Saharan Africa? Should efforts be made to
increase the readiness of clinics, with the expecta-tion that doing so will lead to improved quality?The analyses presented in Chapters 5 and 6 of thisvolume reveal that many of the components mea-sured in Situation Analysis studies that contributeto clinic readiness to offer basic services do notappear to be associated directly with improvedquality of care as defined by the Bruce-Jain model.An apparent exception to this general finding isthat the provision of in-depth training programsspecifically focused on family planning counselingand on the use of IEC materials with clientsÑsuchas those provided in courses on natural familyplanning (NFP) and LAM, methods that dependon quality counselingÑdoes improve the qualityof the provider-client information exchange (seeChapter 5).3 In contrast, general family planningtraining and technical updates alone have had lit-tle impact on counseling. Studies with more rigor-ous experimental or quasi-experimental researchdesigns are required, however, to test efficient andeffective means of delivering focused training onquality counseling.
In many African countries, considerable atten-tion has recently been directed toward developingimproved guidelines for policies and proceduresand disseminating these widely and in creativewaysÑfor example, through USAIDÕs initiative toMaximize Access and Quality [MAQ] of familyplanning services. As noted earlier, the results fromour Situation Analysis studies, which predate thisUSAID effort, show that program guidelines arefrequently not followed by providers in imposingrestrictions on and requiring tests and proceduresfor family planning methods. In deciding who iseligible for each method, providers appear to beguided more by social norms and personal beliefsabout who should use which method than by existing national standards and guidelines (Twum-Baah and Stanback, 1995). Thus USAIDÕs MAQ ini-tiative will require careful assessment to determinewhether the increased attention to the develop-ment of new standards and guidelines and moreaggressive dissemination activities improve actualprovider behavior.
Although most infrastructure elementsrequired for service delivery are in place, these ele-ments are frequently not used by providers (see
Summary, Conclusions, Future Directions, and Recommendations 251
SU
MM
AR
Y, CO
NC
LUS
ION
S,
FU
TU
RE
DIR
EC
TIO
NS
,R
EC
OM
ME
ND
AT
ION
S

Chapter 6). One major challenge, then, is to bringthe actual quality of care more in line with thepotential that exists, given the current state ofreadiness. While it may be unlikely that all clinicswill have running water and educational materialsin the near future, providers must be encouragedto wash their hands before examining clients, andbe trained to use IEC materials consistently, effec-tively, and with broader reproductive health objec-tives when such materials are available. Wherenational policy guidelines have been revised togive more complete and effective guidance,providers need to be encouraged to refer to thoseguidelines often and to use them, rather thandevising their own rules and procedures.
In the future, new STI/HIV/AIDS testing tech-nology can be expected to influence the ongoingdebate on this subject. However, even with suchimproved technology, the situation can be expectedto remain problematic. Frerichs (1994) has arguedthat there has been too much hesitation to useavailable public health technologies, therebyaccepting nondetection of HIV as the norm. InAfrica, as in other regions, there is considerablereluctance to perform HIV testing in the absence ofcareful AIDS counseling, which many providershave not been trained to offer (in 5 countries, themean percentage of staff who had received anyrefresher training in STIs/HIV/AIDS was 48%,with Botswana having the highest level). Also, asnoted earlier, providers appear to avoid complex,intimate issues in discussions with clients.
Improving quality of services to take fulladvantage of current levels of readiness will clear-ly necessitate progress at two levels: the SDP andthe national-level program manager. At the SDPlevel, AVSC InternationalÕs Client Oriented andProvider Efficient (COPE) quality assuranceapproach (AVSC, 1995), which encourages thedevelopment of internal systems for identifyingproblems, causes, and solutions at an individualSDP, is one of the most effective approaches identi-fied to date. AVSC is developing a guide for COPEthat covers broad reproductive health issues and isexpected to help providers understand integrationand quality issues (AVSC, forthcoming). Severalother tools have proven useful, including theÒABCÓ decision aide to guide providers through
the counseling and decision-making process (Leon,1995). Sloan and colleagues (1998) have recentlydeveloped a computer-based aid, somewhat analo-gous to a combination of a supervisory checklistand a limited Situation Analysis, to assist supervi-sors in improving quality of care in family plan-ning programs. Overall, Shelton (1998) has recom-mended a synergy of components of MAQ promo-tion, which, at the SDP level, include problem solv-ing; job aids; improved indicators and evaluation;and creation of a more supportive environment,particularly with regard to supervision.
In addition to quality assurance activities at theindividual SDP level, the Situation Analysisapproach is based on the assumption that there area number of activities that can be undertaken onlyby national-level program managers, and thatthese national-level interventions may have broad-er impact than quality assurance efforts alone onthe several thousand SDPs in the region that havenot yet benefited from individual SDP efforts.SheltonÕs (1998) synergy of components of MAQpromotion also includes elements at this level:development of guidelines, improved programleadership, community promotion, and improve-ments to the organizational culture. Clearly, man-agement decisions to give more attention toSTI/HIV/AIDS prevention will need to begin andbe supported at the national level.
Thus far, in the 4 countries in which twoSituation Analysis studies have been conducted(see Chapter 11), it has not proved possible to mea-sure the impact of the numerous managerial deci-sions and interventions adopted during the inter-val between the studies on the major quality prob-lems noted earlierÑcounseling of clients and integration of STI/HIV/AIDS prevention. We sus-pect that this situation has several causes: (1) themanagerial decisions and other interventionsresulting from Situation Analysis studies wereinsufficiently focused on the specific quality prob-lems found throughout the region; (2) the scope ofvarious interventions was probably insufficient; (3)the relationship between interventions andimprovements in quality is tenuous (see Chapter11); and (4) the research designs of our time com-parisons may not have been appropriate for assess-ing the impact of particular interventions.
252 Clinic-Based Family Planning and Reproductive Health Services in Africa

RECOMMENDATIONS
A large number of recommendations resulted inresponse to the myriad of problems revealed byeach of the individual Situation Analysis studiesincluded in this volume. Clearly there is substan-tial room for developing and evaluating new andcreative approaches to improving national familyplanning and reproductive health programs inAfrica. However, one of the benefits of reviewingthe 12 studies together is to highlight certain wide-spread regional patterns, such as problems withcounseling of clients and prevention of STI/HIV/AIDS. Overall, then, we offer the following recom-mendations to program managers, providers, anddonors who are interested in improving servicequality in the region.1. Use existing resources more efficiently. Some
problems of service quality are not the result ofa lack of resources, but can be alleviatedthrough more efficient use of existing resources.Examples include using IEC materials that arepresent; using clean water that is available inthe examination room; and taking the time todiscuss clientsÕ context, particularly at SDPswhere few clients are seen per day by eachprovider. Using existing resources efficientlyalso means posting providers who are trained inspecific methods at SDPs that offer those meth-ods (see Chapters 3 and 6). Condoms are wide-ly available, but they need to be recommendedfor protection against both unwanted pregnan-cy and the dangers of STIs/HIV/AIDS.
2. Recognize that improved readiness does not necessarily lead to improved quality of services. Interventions to improve services fre-quently focus on elements of readiness, such asstaff training, equipment availability, or com-modity management. However, these individ-ual readiness improvements may not lead tochanges in the quality of care delivered toclients. Thus interventions to improve readi-ness must also address how that improvedreadiness will be translated into improvedquality (see Chapters 5, 7, and 11).
3. Train staff on specific issues, particularly onbroader reproductive health counseling. Allprograms covered in our studies train their
staff through basic, post-basic, and refreshertraining. The study results suggest, however,that training has a stronger impact on the qual-ity of services if it is focused specifically oncounseling; IEC; or family planning methods,such as LAM or NFP, for which the role of cor-rect client counseling is crucial. Less-focusedtraining is unlikely to affect the importantdimensions of quality highlighted here (seeChapters 3 and 5).
4. Bridge the gap between protocols andprovider behavior. The development ofimproved service protocols is critically impor-tant to improving services, but it may not leadimmediately to changes in provider behavior.To be effective, protocols must be reinforcedwith training and supervision, and their intro-duction requires continued monitoring andassessment of their impact on provider behav-ior (see Chapters 8 and 9).
5. Strengthen supervisor training, and broadenthe introduction of new supervisory tools. Atpresent, Situation Analysis studies do not showa relationship between the quantity of supervi-sion and the quality of services provided (seeChapter 11). This may be because the SituationAnalysis data on supervision needs to betterdescribe specific behaviors of supervisors,and/or because there may be no relationshipbetween supervision as presently conductedand quality as we define it. Supervisors need guidance on what to observe, discuss, andevaluate on a consistent, ongoing basis.Improved supervision may support training inclient counseling, STI/HIV/AIDS preventionthrough increased use of dual protection, andthe provision of safe services.
6. Conduct Operations Research to test interven-tions on quality. To better understand howprogram goals can be reached, OR studies areneeded to test whether interventions are effec-tive, and how they can be scaled up to nationaland region-wide improvements in servicedelivery. Since the major problems identifiedare region wide, coordinated OR programsshould be developed. Potential productiveareas for OR include delivery of effective train-ing to accomplish behavioral and attitudinal
Summary, Conclusions, Future Directions, and Recommendations 253
SU
MM
AR
Y, CO
NC
LUS
ION
S,
FU
TU
RE
DIR
EC
TIO
NS
,R
EC
OM
ME
ND
AT
ION
S
change, coordination of training and superviso-ry efforts to strengthen providersÕ counselingskills on family planning and the prevention ofSTI/HIV/AIDS, and means of making betteruse of existing resources. Experimental orquasi-experimental designs, including controlgroups, should be used to test interventions.
7. Conduct research to improve understandingof factors supporting the present pattern ofservice delivery, as well as client perspectiveson quality. Further explanation may berequired for providersÕ apparent reluctance toengage in certain types of intimate discussionwith clients (see Chapters 3 and 5). While theBruce-Jain conceptualization of quality hasbeen enormously productive over the lastdecade, alternative perspectives on qualityÑperhaps ones that better integrate both theclient and provider perspectivesÑneed contin-uing investigation.
8. Strengthen the Situation Analysis methodolo-gy, and continue its use with a primary focuson assisting program managers. The SituationAnalysis approach has become a standard tool,and the existing conceptual guidance for themethodology (see Chapter 1) has been relative-ly productive. Numerous interventions haveresulted from Situation Analysis findings (seeChapter 4). Clearly, however, there is room forsubstantial improvements to this studymethodology. The definition and selection ofvariables and the construction of indicators canbe improved, and the number of variablesincluded can probably be reduced. The logicallinks among readiness, quality, and impactneed to be explored further with additionalresearch, which can be used to strengthen theunderlying model. The reliability and validityof the data require additional investigation aswell. The primary objective of SituationAnalysis studies to date has been to assist pro-gram managers in identifying and solvingproblems with readiness and quality; the sec-ondary goal has been to advance research onthese subjects. In our view, this order of priori-ties should continue. The African Situation Analysis study results
compiled over the last decade have made it possible
to identify important program achievements inreadiness and quality, as well as crucial region-wideshortcomings. The research findings presented inthis volume also suggest potentially productiveinterventions to strengthen program quality. Takentogether, the existing programs and the researchfindings represent both a solid foundation on whichto build and a substantial challenge. It is our hopethat program managers, providers, and donors willuse these findings in their efforts to develop morecomprehensive, higher-quality services that bettermeet the needs of African families.
REFERENCES
AVSC International. 1995. COPE: Client-Oriented,Provider-Efficient Services. AVSC International, New York.
AVSC International. Forthcoming. COPE Self-AssessmentGuidelines for Reproductive Health Services. AVSCInternational, New York.
Bruce, J. 1990. ÒFundamental elements of the quality ofcare: A simple framework.Ó Studies in FamilyPlanning, 21,2:61Ð91.
Destler, H., D. Liberi, J. Smith, and J. Stover. 1990.Family Planning: Preparing for the 21st Century. UnitedStates Agency for International Development,Washington, D.C.
Fisher, A., J. Laing, J. Stoeckel, and J. Townsend. 1991.Handbook for Family Planning Operations ResearchDesign, Second Edition. Population Council, NewYork.
Frerichs, R. 1994. ÒPersonal screening for HIV in devel-oping countries.Ó Lancet, 343,8903:960Ð962.
Leon, F. 1995. El ABC de la Atenci�n B�sica dePlanificaci�n Familiar, 4ta Edici�n. PopulationCouncil, Mexico.
Maggwa, N. and I. Askew. 1997. Integrating STI/HIVManagement Strategies into Existing MCH/FPPrograms: Lessons from Case Studies in East andSouthern Africa. Population Council, Nairobi, Kenya.
Miller, R., A. Fisher, K. Miller, L. Ndhlovu, N. Maggwa,I. Askew, D. Sanogo, and P. Tapsoba. 1997. The Situation Analysis Approach to Assessing FamilyPlanning and Reproductive Health Services: A Handbook.Population Council, New York.
National Research Council. 1993. Factors AffectingContraceptive Use in Sub-Saharan Africa. NationalAcademy Press, Washington, D.C.
254 Clinic-Based Family Planning and Reproductive Health Services in Africa

Summary, Conclusions, Future Directions, and Recommendations 255
SU
MM
AR
Y, CO
NC
LUS
ION
S,
FU
TU
RE
DIR
EC
TIO
NS
,R
EC
OM
ME
ND
AT
ION
S
Pariani, S., D. Heer, and M. Van Arsdol. 1987.ÒContinued contraceptive use in five family planning clinics in Surabaya, Indonesia.Ó Studies inFamily Planning, 22,6:384Ð390.
Ross, J. and E. Frankenberg. 1993. Findings from TwoDecades of Family Planning Research. PopulationCouncil, New York.
Rosen, J. and S. Conly. 1998. AfricaÕs PopulationChallenge: Accelerating Progress in Reproductive Health.Population Action International, Washington, D.C.
Shelton, James. 1998. Keynote Presentation. In MAQ:From Guidelines to Action; Report of a USAIDConference, May 12Ð13, 1998. PRIME, Chapel Hill,North Carolina.
Simmons, R. and C. Elias. 1993. The Study of Client-Provider Interactions: A Review of Methodological Issues.Programs Division Working Paper No. 7, PopulationCouncil, New York.
Sloan, N. 1998. ÒComputer-based assistance for super-visors to improve quality of care in family planningprograms.Ó Unpublished paper. Population Council,New York.
Twum-Baah, K.A. and J. Stanback. 1995. ProviderRationales for Restrictive Family Planning Service
Practices in Ghana. Ghana Statistical Services andFamily Health International, Ghana.
UNAIDS and World Health Organization. 1998. Reporton the Global HIV/AIDS Epidemic: June 1998. UNAIDSand WHO.
NOTES
1 Zanzibar consists of several islands lying off thecoast of Tanzania, and although it shares certainmajor government structures with Tanzania, it isseparate and independent in several respects,including its health system. Zanzibar is thereforeincluded in this report as a separate study.
2 The Population Council is currently undertaking astudy in Senegal to test whether strengthening thequality of care offered does, in fact, reduce prema-ture discontinuation (Ross and Frankenberg, 1993).
3 Similarly, the very specific and high-quality trainingprograms that have been implemented on postabor-tion care have been shown to have a substantialimpact on provider behavior.