Climatology of coastal wind regimes in Benin
17
B Meteorol. Z. (Contrib. Atm. Sci.), Vol. 28, No. 1, 23–39 (published online January 21, 2019) Climatology © 2019 The authors Climatology of coastal wind regimes in Benin François K. Guedje 1∗ , Arnaud V.V. Houeto 1 , Etienne B. Houngninou 1 , Andreas H. Fink 2 and Peter Knippertz 2 1 Laboratoire de Physique de l’Atmosphère, Université d’Abomey–Calavi, Bénin. 2 Karlsruhe Institute of Technology, Institute of Meteorology and Climate Research, Germany. (Manuscript received June 6, 2018; in revised form December 13, 2018; accepted December 14, 2018) Abstract Using surface and lower-tropospheric wind observations at Cotonou (Benin), a comprehensive ten-year (2006–2015) climatology of coastal wind regimes at the West African Guinea Coast is presented for the first time. Four wind regimes are objectively identified: the monsoon and Harmattan winds, the nocturnal low- level jet (NLLJ) and the land-sea breeze (LSB) system. Amongst other things, these regimes are important for the occurrence of coastal squall line systems and for the redistribution of pollutants emitted from coastal cities. The seasonal cycle is split into the long (December–February) and short (July–September) dry seasons, the long (May–June) and short rainy (October–November) seasons, and the beginning of the long rainy season (March–April). In terms of the LSB, the lack of a diurnal reversal in wind direction obscures sea breeze activity at the height of the southwesterly monsoon flow in boreal summer and during a period of stronger winds in March-April related to large land-sea thermal contrasts. During these periods, the sea breeze manifests itself in a relative increase of the monsoon background flow during daytime, while early morning land breezes are infrequent. The latter expectedly, peak during the long dry season in December with a secondary peak during the long rainy season in May–June. The large–scale monsoon and Harmattan flows, mutually exclusive by definition, occur respectively, 88.2–98.4 % and 1.6–11.8 % per year with Harmattan days restricted to the long dry season and deepest monsoon flows of about 2.5 km confined to the long rainy season. The NLLJ is most prominent during the little dry season with, however, a similar and hitherto less documented peak in occurrence frequency during the beginning of the long rainy season. At this time of the year, the African Easterly Jet passes northward over Cotonou, causing the largest 3000–600 m vertical wind shear. Keywords: monsoon, Harmattan, nocturnal low-level jet, land-sea breeze 1 Introduction The West African Guinea Coast stretches from Cape Palmas at the border between Liberia and Ivory Coast to Cape Lopez in Gabon. The seasonal cycle of its weather and climate is influenced by the West African Mon- soon (WAM, Fink et al., 2017). The area is currently experiencing considerable economic growth associated with a major population increase and strong urbaniza- tion (Knippertz et al., 2015). Due to rain-fed subsis- tence farming and several large hydropower installa- tions, rainfall variability has immediate socio-economic ramifications. Going back to 1886, Nicholson et al. (2018) analyze the longest rain gauge series for the Guinea Coast ever and conclude that the dry conditions prevailing since about 1968 are unprecedented within this period. On the other hand, the frequency of ex- treme rainfall events appears to have increased in the region (Sanogo et al., 2015) and flashflood events have recently been reported (Maranan et al., 2018). In this context, Maranan et al. (2018) have shown the im- portance of low-level wind shear for the occurrence of strong mesoscale convective systems along the Guinea ∗ Corresponding author: F.K. Guedje, Laboratoire de Physique de l’Atmosphère, Université d’Abomey–Calavi, Bénin, e-mail: guedjefranco@ yahoo.com Coast, a relationship that has been demonstrated for the Sahel by Taylor et al. (2017). Moreover, Fink et al. (2010) note that due to land-sea breeze (LSB) related af- ternoon convective systems, rainfall after the long boreal winter dry season starts earlier in the hinterland than di- rectly at the coast. Maranan et al. (2018) suggest that a mid-day peak in moderate to strong convective sys- tems along the Guinea Coast is related to LSB convec- tion. Apart from rainfall, wind regimes at the Guinea Coast also play an important role for the redistribution of pollutants emitted from megacities, as has recently been outlined by Knippertz et al. (2017) and Flamant et al. (2018a). Despite the importance of wind regimes for rainfall and air pollution at the Guinea Coast, very few studies have hitherto addressed this topic. Thus, the overall aim of the present study is to advance our under- standing of the types and climatological characteristics of coastal wind systems. Low-level monsoonal southwesterlies are the dom- inant large-scale, near year-round wind regime along the Guinea Coast. They are strongest and deepest dur- ing the peak monsoon period from July to September (JAS) with near-surface wind speeds on the order of 4 ms −1 . In this three-month period, the rainfall in the Sahel attains its seasonal peak, while large parts of the Guinea Coast experience the little dry season (e.g. © 2019 The authors DOI 10.1127/metz/2019/0930 Gebrüder Borntraeger Science Publishers, Stuttgart, www.borntraeger-cramer.com
Transcript of Climatology of coastal wind regimes in Benin
BMeteorol. Z. (Contrib. Atm. Sci.), Vol. 28, No. 1, 23–39 (published online January 21, 2019) Climatology© 2019 The authors
Climatology of coastal wind regimes in Benin
François K. Guedje1∗, Arnaud V.V. Houeto1, Etienne B. Houngninou1, Andreas H. Fink2 andPeter Knippertz2
1Laboratoire de Physique de l’Atmosphère, Université d’Abomey–Calavi, Bénin.2Karlsruhe Institute of Technology, Institute of Meteorology and Climate Research, Germany.
(Manuscript received June 6, 2018; in revised form December 13, 2018; accepted December 14, 2018)
AbstractUsing surface and lower-tropospheric wind observations at Cotonou (Benin), a comprehensive ten-year(2006–2015) climatology of coastal wind regimes at the West African Guinea Coast is presented for the firsttime. Four wind regimes are objectively identified: the monsoon and Harmattan winds, the nocturnal low-level jet (NLLJ) and the land-sea breeze (LSB) system. Amongst other things, these regimes are importantfor the occurrence of coastal squall line systems and for the redistribution of pollutants emitted from coastalcities. The seasonal cycle is split into the long (December–February) and short (July–September) dry seasons,the long (May–June) and short rainy (October–November) seasons, and the beginning of the long rainyseason (March–April). In terms of the LSB, the lack of a diurnal reversal in wind direction obscures seabreeze activity at the height of the southwesterly monsoon flow in boreal summer and during a period ofstronger winds in March-April related to large land-sea thermal contrasts. During these periods, the seabreeze manifests itself in a relative increase of the monsoon background flow during daytime, while earlymorning land breezes are infrequent. The latter expectedly, peak during the long dry season in December witha secondary peak during the long rainy season in May–June. The large–scale monsoon and Harmattan flows,mutually exclusive by definition, occur respectively, 88.2–98.4 % and 1.6–11.8 % per year with Harmattandays restricted to the long dry season and deepest monsoon flows of about 2.5 km confined to the long rainyseason. The NLLJ is most prominent during the little dry season with, however, a similar and hitherto lessdocumented peak in occurrence frequency during the beginning of the long rainy season. At this time of theyear, the African Easterly Jet passes northward over Cotonou, causing the largest 3000–600 m vertical windshear.
Keywords: monsoon, Harmattan, nocturnal low-level jet, land-sea breeze
1 Introduction
The West African Guinea Coast stretches from CapePalmas at the border between Liberia and Ivory Coast toCape Lopez in Gabon. The seasonal cycle of its weatherand climate is influenced by the West African Mon-soon (WAM, Fink et al., 2017). The area is currentlyexperiencing considerable economic growth associatedwith a major population increase and strong urbaniza-tion (Knippertz et al., 2015). Due to rain-fed subsis-tence farming and several large hydropower installa-tions, rainfall variability has immediate socio-economicramifications. Going back to 1886, Nicholson et al.(2018) analyze the longest rain gauge series for theGuinea Coast ever and conclude that the dry conditionsprevailing since about 1968 are unprecedented withinthis period. On the other hand, the frequency of ex-treme rainfall events appears to have increased in theregion (Sanogo et al., 2015) and flashflood events haverecently been reported (Maranan et al., 2018). In thiscontext, Maranan et al. (2018) have shown the im-portance of low-level wind shear for the occurrence ofstrong mesoscale convective systems along the Guinea
∗Corresponding author: F.K. Guedje, Laboratoire de Physique del’Atmosphère, Université d’Abomey–Calavi, Bénin, e-mail: [email protected]
Coast, a relationship that has been demonstrated for theSahel by Taylor et al. (2017). Moreover, Fink et al.(2010) note that due to land-sea breeze (LSB) related af-ternoon convective systems, rainfall after the long borealwinter dry season starts earlier in the hinterland than di-rectly at the coast. Maranan et al. (2018) suggest thata mid-day peak in moderate to strong convective sys-tems along the Guinea Coast is related to LSB convec-tion. Apart from rainfall, wind regimes at the GuineaCoast also play an important role for the redistributionof pollutants emitted from megacities, as has recentlybeen outlined by Knippertz et al. (2017) and Flamantet al. (2018a). Despite the importance of wind regimesfor rainfall and air pollution at the Guinea Coast, veryfew studies have hitherto addressed this topic. Thus, theoverall aim of the present study is to advance our under-standing of the types and climatological characteristicsof coastal wind systems.
Low-level monsoonal southwesterlies are the dom-inant large-scale, near year-round wind regime alongthe Guinea Coast. They are strongest and deepest dur-ing the peak monsoon period from July to September(JAS) with near-surface wind speeds on the order of4 ms−1. In this three-month period, the rainfall in theSahel attains its seasonal peak, while large parts ofthe Guinea Coast experience the little dry season (e.g.
© 2019 The authorsDOI 10.1127/metz/2019/0930 Gebrüder Borntraeger Science Publishers, Stuttgart, www.borntraeger-cramer.com
24 F.K. Guedje et al.: Climatology of coastal wind regimes in Benin Meteorol. Z. (Contrib. Atm. Sci.)28, 2019
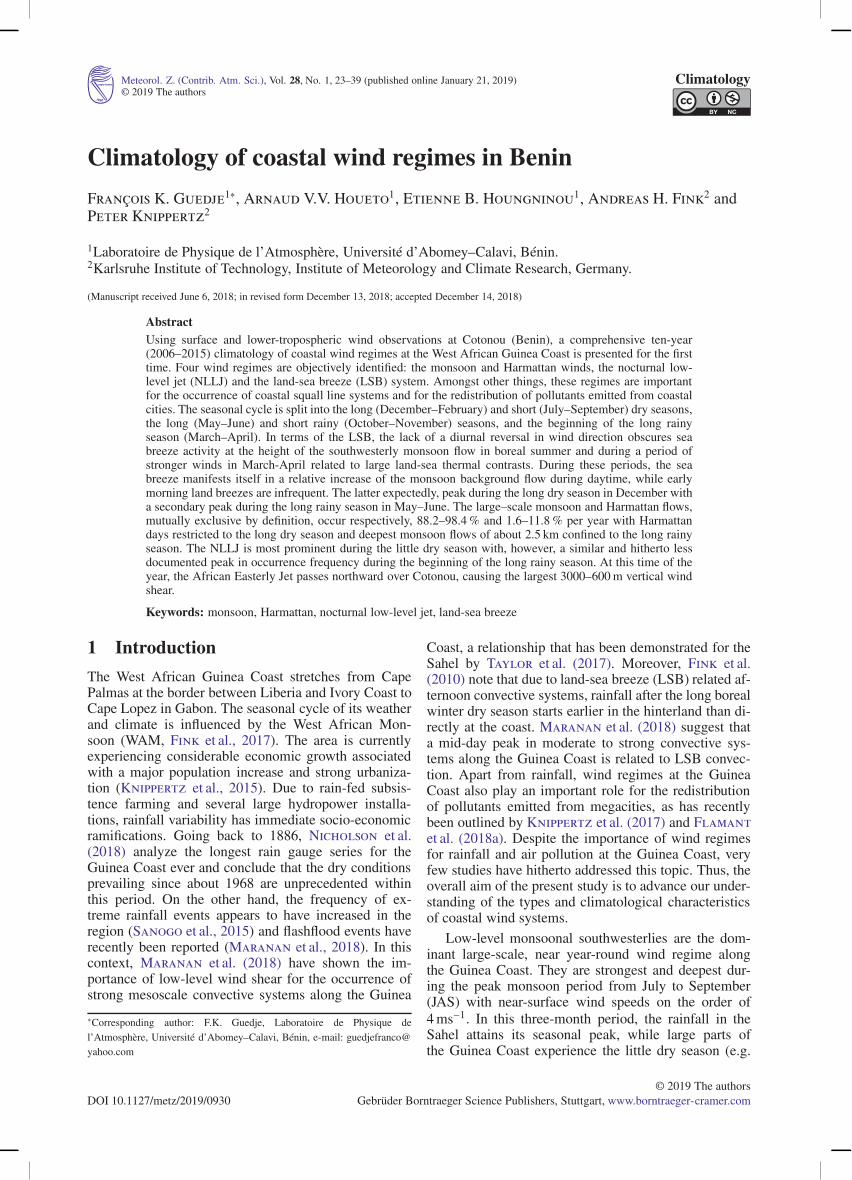
Figure 1: Visible image of the Guinea Coast from Meteosat Second Generation 2 for 18 September 2016 at 1500 UTC. Country names,ocean areas and names of surface stations used are indicated.
Fink et al., 2017). The top of the southwesterly mon-soon flow, often also termed the monsoon layer, variesbetween 850 and 700 hPa, though deeper flows with awesterly wind component occur during certain synopticweather situations (Knippertz et al., 2017; Flamantet al., 2018b). During this time of the year, the develop-ment of a southwesterly nocturnal low-level jet (NLLJ)is a widespread phenomenon and has been documentedfor coastal, Soudanian, and Sahelian stations (Lothonet al., 2008; Abdou et al., 2010; Schrage and Fink,2012; Schuster et al., 2013; Kalthoff et al., 2018).In boreal winter, the Intertropical Discontinuity (ITD),the confluence zone between the moist and cool mon-soonal southwesterlies and the dry Harmattan winds, islocated just north of the Guinea Coast at 8° N (Finket al., 2010). During periods from a few days up to twoweeks, the dry and dusty Harmattan winds push south-ward across the Guinea Coast onto the Gulf of Guineawaters (Hamilton and Archbold, 1945; Fink et al.,2010). During these periods, coastal stations experiencenortherly to northeasterly 10 m winds throughout mostof the day with unusually low humidities. From De-cember to mid-February, 2 m temperatures are some-what cooler, especially at night. However, Knippertzand Fink (2006) documented an early March Harmattancase that brought about a heat wave along the GuineaCoast. In Cotonou, this was partly related to the factthat the daytime sea breeze (SB) with cooler air from theocean did not set in until 15 UTC (16 LT) allowing the2 m temperature to reach 37 °C. While monsoon, Har-mattan and NLLJ are usually larger-scale features, thefourth wind regime, the LSB circulation at the GuineaCoast is a local feature forced by the diurnal cycle ofland-sea thermal contrasts. Despite its above-mentionedimportance for coastal thunderstorms and atmosphericpollution, surprisingly few studies have investigated theclimatology of the LSB regime in southern West Africa.Some studies used visible satellite imagery to documentthe daytime inland propagation of clear skies behind theSB front (Cautenet and Rosset, 1989; Schrage andFink, 2012; van der Linden et al., 2015). The visi-
ble Meteosat image for 18 September 2016 at 15 UTCshows clear skies over the ocean and immediate coastalstrip with a line of convective cloud likely demarcatingthe SB front convergence (Fig. 1). Due to the clearingof skies after the passage of the SB front in JAS, coastalstations show a much higher incoming solar radiationwhen compared to inland stations where irradiation issubstantially reduced due to an extensive morning low-level cloud deck (Knippertz et al., 2011). This suggestsan important role of the LSB for the distribution of po-tential solar power yield from photovoltaic installations.Bajamgnigni Gbambie and Steyn (2013) and Abay-omi et al. (2007) used surface wind observations fromBeninese and Nigerian stations, respectively, to infer cli-matologies of the LSB. The former authors found a peakin SB occurrence at Cotonou (Benin) in December andMay with a minimum in August during the little dryseason. However, while the coastal land-sea temperaturecontrast was large in December, it was smaller in Maythan in August. Land-sea breeze climatologies are ofcourse dependent on their definition and BajamgnigniGbambie and Steyn (2013) imposed a wind directionreversal criterion. This might not be appropriate in casesof too strong background winds and/or to weak night-time cooling (Azorin-Molina, 2007; Azorin-Molinaet al., 2011), when the local LSB impact on the windfield is a morning increase and afternoon decrease ofwind speed rather than a directional changes.
In this study, seasonal and diurnal climatologies offour coastal wind regimes, the monsoon and Harmat-tan winds, the NLLJ, and the LSB will be compiledfor the station of Cotonou (Benin, 6° 21′ N, 2° 23′ E) for2006–2015. A flexible definition will allow for the de-tection of LB and SB days without a wind reversal. Inthis context, attention will be paid to periods when astrong coastal land-sea temperature contrast (i.e. a driverof a classical LSB) or known diurnal variations in thelarge-scale monsoon systems drive diurnal variations inlow-level coastal winds. In a first study of this kind,we take advantage of the rare availability of four-timesdaily, low-level wind profiles from a combination of PI-

Meteorol. Z. (Contrib. Atm. Sci.)28, 2019
F.K. Guedje et al.: Climatology of coastal wind regimes in Benin 25
Table 1: Percentage of missing values at Cotonou station from 10 m to 3000 m height during the period 2008–2015.
Height (m) 10 600 900 1500 2100 3000Missing values (%) 3 31 34 42 52 62
LOT balloon and radiosonde data to extend previous cli-matologies from the surface to the lowest 3 km of the at-mosphere. In their discussion of the LSB at the GuineaCoast, Parker et al. (2017) note that the nighttime landbreeze (LB) is shallower than the daytime SB. Thus wewill study the vertical structure, but also discuss the fre-quency of days when certain regimes occur simultane-ously.
The data and methods used in this study are describedin Section 2. Section 3 presents the climatology of low-level wind regimes at Cotonou during the seasonal scale.The fourth section summarizes and concludes the study.
2 Data and Methods
2.1 Data set
The observational data set used in this work includessurface and upper-air data from Cotonou meteorologicalstation. Surface data consist of 10-years (2006–2015) of3-hourly parameters (10 m wind, 2 m temperature andrelative humidity) and the daily rainfall amount, all pro-vided in hard copy by the Beninese National Meteoro-logical Agency. Hourly sea surface temperature (SST)data measured at the station of Cotonou Port by “In-stitut de Recherches Halieutiques et Océanologiquesdu Bénin” (IRHOB) are also used to analyze theLSB. Upper-air data include 8-years (2008–2015) ofwind observations extracted from Cotonou PILOT andTEMP reports. These reports are provided by theOGIMET website (http://www.ogimet.com) that col-lects and processes freely available data, mainly fromthe National Oceanic and Atmospheric Administration(NOAA). Cotonou upper-air station provides four obser-vations per day (00, 06, 12 and 18 UTC) that are all fedinto the Global Telecommunication System as PILOTand TEMP reports. The latter started in September 2012for the 12 UTC reporting time only. The reports includewind data for standard isobaric surfaces and for fixed ad-ditional levels, the altitudes of which are given in metricunits. As this work focuses on low-level wind regimes,the standard isobaric surfaces used here are 850 hPa and700 hPa, approximately 1500 m and 3000 m above sealevel, respectively. In addition to the 10 m surface winds,the other levels with fixed metric heights selected fromthe reports are 600 m, 900 m and 2100 m, giving six lev-els in total. Regarding the quality of PILOT winds, itis known that optical tracking of PILOT balloons yieldmeaningful wind speeds though some levels for fewsoundings might be erroneous (e.g. Rider and Armen-dariz, 1968). However, we consider the 8-year averagePILOT balloon winds as accurate enough to study thedetails of the four wind regimes.
At the Guinea Coast, due to logistic issues, severalupper-air stations do not usually provide four soundingsper day. For example, PILOT reports in Lomé and La-gos stopped several years ago. Even at Cotonou station,because of issues related to the optical tracking used forthe PILOT balloon soundings, bad weather conditionsand cloud cover, missing values are numerous in the dataset, especially at 2100 m and 3000 m heights. Wind mea-surements at Cotonou before 2008 are very infrequenton the OGIMET website and the frequency of observa-tions decreases from the surface to 3000 m height (notshown). For the 2008–2015 period, missing data repre-sent 3 % of the total number of observations for 10 msurface winds and can reach 62 % for winds at 3000 mheight (Table 1). For this period, only 70 % of the PILOTand TEMP reports expected are in fact obtained.
2.2 Methods
Over the last few decades, different methods for iden-tifying LSB episodes were tested and helped to con-struct databases for many parts of the world. In coastalregions of West Africa, however, few descriptions ofLSB systems are found in the literature and no databasesare available. Usually the first criterion to detect LSBepisodes is the distinctive wind behaviour with the rapidshift in wind direction from onshore to offshore at SBonset. A review of criteria used for both automated andmanual identifications of sea or lake breezes was re-cently given by Azorin-Molina et al. (2011). The chal-lenge is to ensure that the changes measured in meteoro-logical variables are in fact produced by SB frontal pas-sages (Ryznar and Touma, 1981). Based on Steyn andFaulkner (1986), Bajamgnigni Gbambie and Steyn(2013) described the SB phenomenon at Cotonou usingsurface observational data over the period 2006–2010.Their first criterion, the most important one, was relatedto the reversal of wind direction. Because a land–seatemperature difference is necessary to drive the SB cir-culation (Gustavsson et al., 1995), the second filter wasbased on the land–sea thermal gradient. The third cri-terion is related to the daily sunshine duration, as oneexpects that SB, a thermally driven local circulation, oc-curs only on days when the sun shines for a significantfraction of the day (Steyn and Faulkner, 1986). Forthe Bay of Alicante Azorin-Molina et al. (2011) utilizea steady increase in the 30 minute wind speed and maxi-mum wind speed after sunrise until noon, followed by agradual decrease from afternoon until sunset as a detec-tion criterion. Nocturnal offshore winds are rare in sum-mer months over the Bay of Alicante, probably becausethe cooling is not strong enough (Azorin-Molina,2007). Thus, SB passages are not associated with a re-versal in wind direction, but rather with a typical in-

26 F.K. Guedje et al.: Climatology of coastal wind regimes in Benin Meteorol. Z. (Contrib. Atm. Sci.)28, 2019
Figure 2: Example of LSB situation at Cotonou: (a) Diurnal cycle of low-level winds and (b) vertical profile of the zonal and meridionalwind components at 06 UTC, both averaged for November 2015.
crease in wind speed as a function of positive tempera-ture difference between land and sea (Azorin-Molinaet al., 2011).
Specifically for Cotonou, this paper will expand pastwork through the use of upper-air data and by plac-ing the LSB into the context of other low-level windregimes, i.e. the Harmattan winds, the NLLJ and themonsoon flow. We use a set of criteria to assign a givenday to one (or sometimes several) wind regimes or toclassify it as “unspecified”. The definitions of the fourwind regimes are given below.
2.2.1 LB and SB detection
In the coastal region of Benin, where the shoreline is al-most zonal, slight northwesterly or westerly winds arethe main characteristic of the LB system in the earlymorning, which is expected to be most frequent in bo-real winter. This is evident from the average offshorewind at the surface at 06 UTC in Figure 2a that exem-plarily shows the example of November 2015. The LBflow is rather shallow, as already at 600 m the merid-ional component has shifted to southerlies (blue line inFig. 2b). In absence of higher resolution measurementsit is difficult to delineate the return flow. The change insurface wind direction from westnorthwest at 06 UTCto southwest at 12 UTC (Fig. 2a) is therefore the mostdistinctive feature of the SB in Benin we can detect withour data.
In this study LB and SB occurrence at Cotonou sta-tion are detected separately using specific criteria. LBoccurrence is detected by offshore 10 m winds by night-time and in the early morning (i.e. 00–06 UTC). Thefollowing flexible filters, derived from Azorin-Molinaet al. (2011), are used to detect SB events without ex-plicitly requesting a wind reversal:
• Filter 1: The 3-hourly wind speed at 10 m showsa steady increase from 06 UTC to 12 UTC and agradual decrease from afternoon until 21 UTC. Thethreshold for the increase or decrease in speed isarbitrarily fixed here at 2 ms−1.
• Filter 2: The 3-hourly wind direction at 10 m rangesfrom 100° to 260°, i.e. onshore flow, after sunrise(09, 12 and 15 UTC).
• Filter 3: The daily average daytime 2 m air temper-ature between sunrise and sunset (06–18 UTC) overland is greater than the daily average sea surface tem-perature between sunrise and sunset.
In the results section we will discuss the differencesto the study by Bajamgnigni Gbambie and Steyn(2013), who require a reversal of wind direction and aminimum number of sunshine hours in addition.
2.2.2 Harmattan detection
At Cotonou station, the Harmattan is represented bylow-level northeasterly winds as shown exemplarily inFigure 3a for December 2015. Except at 18 UTC, whenthe SB phenomenon occurs, and at 00 UTC at 600 mheight, when the NLLJ starts to set in, northeasterly Har-mattan winds prevail at lower levels. While the merid-ional component decreases from surface to 3000 m, thezonal component increases (Fig. 3b), indicating a grad-ual shift from the Harmattan winds to mid-level easterlywinds.
To detect the infrequent Harmattan bursts at Cotonou,which mainly occur in winter months, the following twofilters are employed, using surface observations:
• Filter 1: The 3-hourly winds are northerly (340° to80° clockwise) between 09 and 15 UTC.

Meteorol. Z. (Contrib. Atm. Sci.)28, 2019
F.K. Guedje et al.: Climatology of coastal wind regimes in Benin 27
Figure 3: Example of Harmattan situation at Cotonou: (a) Diurnal cycle of low-level winds and (b) vertical profile of the zonal andmeridional wind components at 12 UTC, both averaged for December 2015.
• Filter 2: The relative humidity reaches values of lessthan 60 % in the afternoon (between 12 UTC and15 UTC).
2.2.3 NLLJ detection
The detection of the NLLJ is mainly based on the re-sults of previous studies in West Africa. Many authors(e.g. Parker et al., 2005; Lothon et al., 2008) revealedthat higher wind speeds occur over several locations inWest Africa during the night and in the early morningthan during other times. The observed wind speeds areoften greater than 10 ms−1 and centered around 400 mheight (Lothon et al., 2008) with high values also foundat 600 m height in PILOT observations. During daytime,convective turbulent mixing is large and limits horizon-tal transport of air masses. In the late afternoon, the heatflux decreases, and the circulation responds to the sur-face pressure gradient force imposed by the heat lowwithout being slowed down by friction. The winds areaccelerated towards the low pressure during the night,reaching their maximum speed in the morning hours.Due to the proximity to the equator, the influence of theCoriolis force is small. Exemplarily Figures 4a and bshow the average speed of the zonal and the merid-ional components of the NLLJ at Cotonou in September2015 at 06 UTC. The nocturnal peak observed at 600 mheight in PILOT soundings is clearly visible. The av-erage wind is much stronger during nighttime and canreach up to 10 ms−1 on individual days. To detect theNLLJ, upper-air winds at 600 m height are used, whichis mainly southwesterly at Cotonou station. The thresh-old is fixed to 10 ms−1 and days with wind speeds (at00 UTC or 06 UTC) greater than this threshold are clas-sified as NLLJ days.
2.2.4 Monsoon flow detection
The monsoon flow, characterized by southwesterlywinds from the ocean, is observed in coastal regionsnearly the whole year except for the short period whenthe northerly Harmattan winds reach the coast. So thesetwo regimes are mutually exclusive. It has been the sub-ject of several studies during the last 10 years, mainlythrough the African Monsoon Multidisciplinary Analy-sis (AMMA, see Redelsperger et al., 2006) project.
The depth of the monsoon layer is closely linked tothe vertical structure of the ITD, the sloped boundarybetween the southerly and northerly winds over WestAfrica, and its seasonal migration. The monsoon sea-son in West Africa starts with the propagation of theITD from the Guinea Coast towards the north duringthe months of March and April. This defines the be-ginning of the first rainy season south of 10° N (Sul-tan and Janicot, 2003), when the vertical extent ofthe monsoon flow commences to increase. At this time,the average monsoon layer depth, identified by WestAfrican operational meteorologists as the height of zeromeridional wind, is generally less than 1500 m. Figure 5shows an example for April 2015 clearly demonstratingthe marked shift from southerlies in the lowest three lev-els to easterlies at 2100 and 3000 m at all times of day.
Statistics on the monsoon depth at Cotonou stationare presented here using available winds from PILOTsounding observations. A given day is either assignedto a shallow monsoon flow, when the vertical extent ofsoutherly (i.e. positive) meridional wind direction is lessthan 1500 m height, or deep monsoon flow, when it isgreater than 1500 m height. It shall be stressed that sev-eral authors use the depth of a positive zonal (i.e. west-erly) component as an indicator of the depth of the mon-

28 F.K. Guedje et al.: Climatology of coastal wind regimes in Benin Meteorol. Z. (Contrib. Atm. Sci.)28, 2019
Figure 4: Example of NLLJ situation at Cotonou: (a) Diurnal cycle of low-level winds and (b) vertical profile of the zonal and meridionalwind components at 06 UTC, both averaged for September 2015.
Figure 5: Example of monsoon situation at Cotonou: (a) Diurnal cycle of low-level winds and (b) vertical profile of the zonal and meridionalwind components at 12 UTC, both averaged for April 2015.
soon flow. As can be seen in Figure 5 for the exam-ple of 12 UTC in April 2015, our definition based onthe meridional wind is better suited to characterize theorigin of air from the tropical Atlantic below 1500 mand from the continent above this height. However, for18 UTC in September 2015 (Fig. 4), the difference isnot as clear-cut. In the layer where winds turn from low-level monsoonal southwesterlies to mid-level easterlies,weak wind velocities and thus variable directions areobserved, rendering both definitions somewhat uncer-tain in this layer. However, over larger periods a reli-
able assessment of the monsoon layer depth is possible.All non-monsoon days are Harmattan days by definition(see above).
3 Results
This section will present the results of the objectiveanalysis of wind regimes in Cotonou. The first sub-section contains a general climatology followed bya detailed discussion of the four individual regime
Meteorol. Z. (Contrib. Atm. Sci.)28, 2019
F.K. Guedje et al.: Climatology of coastal wind regimes in Benin 29
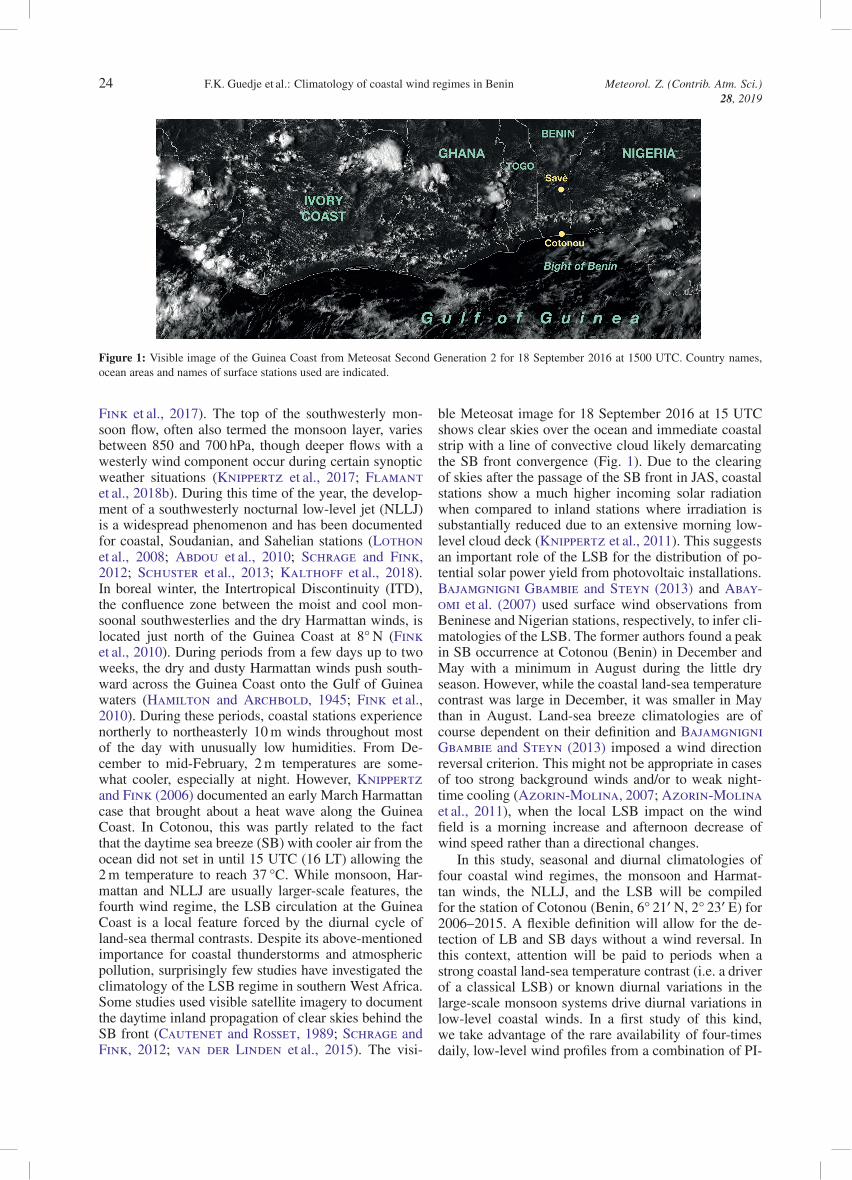
Figure 6: Diurnal cycle of 10 m wind roses at Cotonou for the five main seasons averaged over the period 2008–2015.
types in Section 3.2. The analysis is based on monthlymeans and considers the following five seasons inthe Guinea coastal region: (1) the long dry season inDecember–February (DJF), (2) the beginning of the longrainy season in March-April (MA) when precipitationamounts are relatively low, (3) the long rainy seasonin May–June (MJ), (4) the little dry season in JAS and(5) the short rainy season in October-November (ON).Depending on data availability either the period from2006 or from 2008 to 2015 is analysed.
3.1 Climatology of low-level wind regimes
Figure 6 shows the diurnal cycle of 10 m wind speedand direction at Cotonou for the five main seasons us-
ing wind roses. The LB is clearly observable at 06 UTCwhen light northwesterly to northerly winds occur. It ismost pronounced in DJF but is also detectable in MJand ON. It vanishes in MA and JAS when the monsoonflow is strong. The situation in MA will be discussed inmore detail below. In DJF, northerly winds are also ob-served at 12 UTC but these are more likely related toHarmattan episodes. It is unlikely that the LB persistsuntil that time of day when the difference between theland and sea temperatures should be positive. With re-gard to the vertical extent of the LB system, Figure 8shows that it does not reach 600 m, and in the absenceof wind observations with higher vertical resolution, theexact determination of its depth is impossible. At 12 and18 UTC, winds are dominated by southwesterly direc-

30 F.K. Guedje et al.: Climatology of coastal wind regimes in Benin Meteorol. Z. (Contrib. Atm. Sci.)28, 2019
Figure 7: Vertical profile of wind roses for 12 UTC at Cotonou for the five main seasons averaged over the period 2008–2015.
tions throughout the year (right columns in Fig. 6). Thisis a combination of the large-scale monsoon flow withthe more local SB circulation. Wind speeds peak at theheight of the WAM in JAS and show similar magnitudesduring the rest of the year. Winds at 00 UTC (left col-umn in Fig. 6) largely resemble those at 18 UTC with avery slight shift to more westerly directions.
Figure 7 shows the vertical structure of the wind dis-tribution for all seasons for the 12 UTC launches. Asdiscussed above, the occasional presence of northeast-erly winds at the surface suggests the occurrence of Har-mattan winds at the coast in DJF (left column), whenthe ITD reaches its most equatorward latitudinal posi-tion. These synoptic-scale winds are also present (andstronger) at higher levels up to 1500 or even 2100 mheight. Southwesterly winds indicating a monsoon orSB-type flow are restricted to the levels below 900 m,
indicating a shallow monsoon layer. MA (second col-umn from left in Fig. 7) shows a stronger concentrationto the southerly and southwesterly sector at low levels,most evident at 900 m, above which the flow is dom-inated by easterlies. This signifies a first deepening ofthe monsoon layer. MJ (middle column in Fig. 7) showsrather moderate changes in direction and speed relativeto MA. More marked changes occur towards JAS (sec-ond column from right in Fig. 7) when the three low-est layers are clearly dominated by strong and stablesouthwesterlies. The three top levels show very vari-able wind directions and a slow tendency to increasinglyeasterly flow with height, reflecting the day-to-day vari-ations in monsoon layer depth. Finally, ON (right col-umn in Fig. 7) shows wind structures resembling MJ butwith a slight shift to more easterly flow, particularly at1500 m.
Meteorol. Z. (Contrib. Atm. Sci.)28, 2019
F.K. Guedje et al.: Climatology of coastal wind regimes in Benin 31
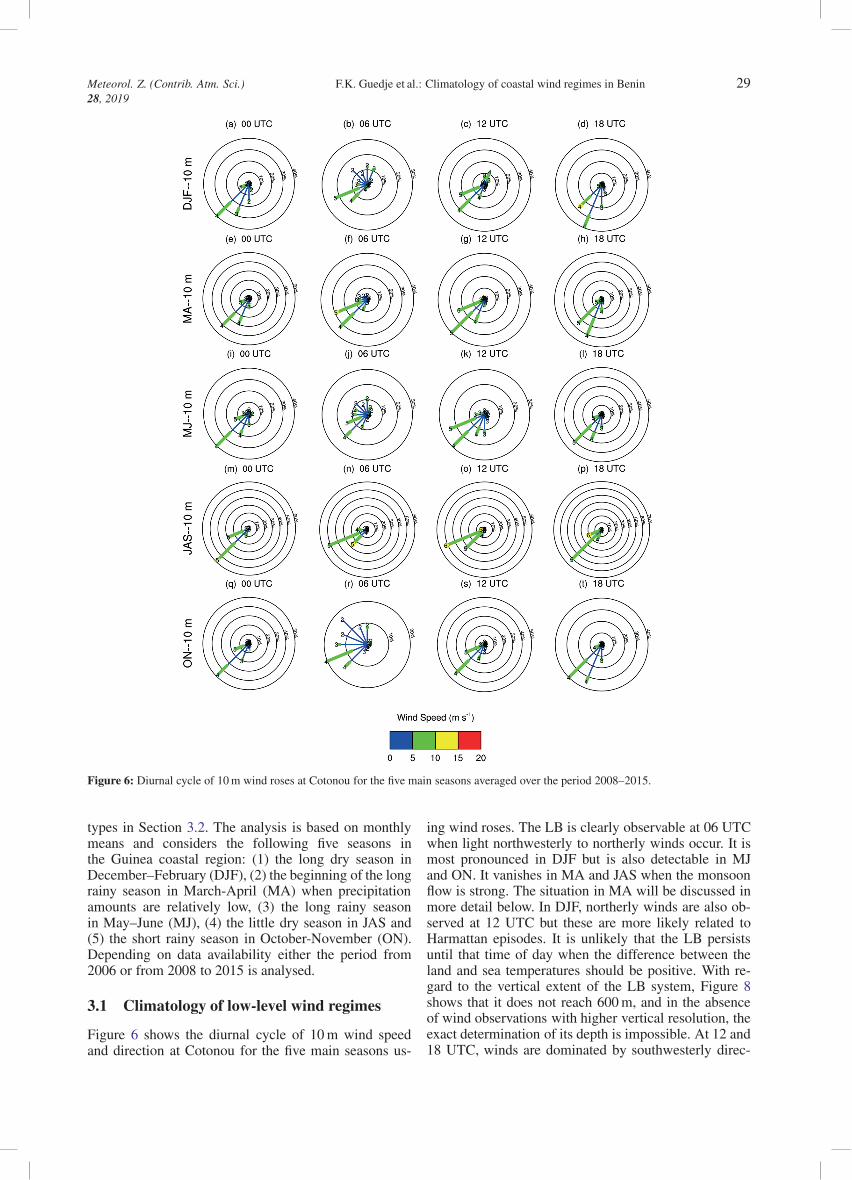
Figure 8: Seasonal cycle of 600 m wind roses for 06 UTC at Cotonou averaged over the period 2008–2015.
Another feature of the low-level wind regime is theformation of NLLJs. This is best illustrated by the windvelocity at 600 m in the morning hours (i.e. at 06 UTC,Fig. 8). In Cotonou, the average velocity of the NLLJat 600 m exceeds 7 ms−1 in many seasons except in ONwhen it remains relatively weak. Highest wind speedsare observed in MA and JAS. The dominant direction issouthwesterly in all seasons but JAS when the maximumshifts to west-southwesterly.
3.2 Objectively identified statistics
Using the detection criteria defined in Section 2, here weinvestigate the characteristics of the four main low-levelwind regimes in the coastal areas of Benin with regardto their seasonal fluctuations and the physical processeswhich influence their activity.
3.2.1 LB and SB
Using the detection criteria outlined in Section 2,996 SB and 1291 LB events are identified over the pe-riod 2006–2015. This difference shows that the two donot always coincide. Figures 9a and b show the relativefrequency distribution of LB and SB winds at 06 UTCand 15 UTC, respectively, at Cotonou. LB winds occurbetween 270° and 40° with low speeds (up to 5 ms−1).SB winds preferably blow from 180° to 240° with amaximum frequency at 220° (45 %) with velocities thatcan reach 10 ms−1 or more.
The monthly variations of LB, SB and combinedLSB occurrences are presented in Figure 9c. SB eventsshow a rather unimodal behaviour with a peak inNovember-December (more than 50 %) and a markedminimum in MJ around 15 %. In sharp contrast, LBevents have a bimodal distribution with maxima duringOctober–January and during the long rainy season MJ.December stands out with frequencies well above 70 %.The minimum with less than 10 % is reached at theheight of the WAM in August. Particularly in MJand JAS, LB and SB frequencies differ to a great amountsuggesting that they do not regularly coincide. In factthe frequency of joint occurrence (green line in Fig. 9c)has a clear minimum in boreal spring and summer. Themaximum occurs during the long dry season with a peakin December (up to 37 %). Apart from August, the fre-quency of joint occurrence is always well below the min-imum of either of the two curves, revealing that in al-most all seasons there are many days with either SB orLB occurrence.
The monthly variation of SB described by Bajam-gnigni Gbambie and Steyn (2013, their Fig. 3) is rathersimilar to the monthly behaviour of LB shown in Fig-ure 9 (the blue curve). Since the detection of SB eventsby the authors is based on the reversal of the wind di-rection, a SB day is detected only if it is a LB day. Thustheir SB frequency curve nearly coincides with the LBfrequency curve that we obtained. It is well known thatthe LSB systems are often influenced by large-scale syn-optic flows. In order to identify SB passages, the require-ment of offshore winds in the early morning, usually

32 F.K. Guedje et al.: Climatology of coastal wind regimes in Benin Meteorol. Z. (Contrib. Atm. Sci.)28, 2019
Figure 9: LB and SB climatology at Cotonou during 2006–2015. Wind roses of all detected (a) LB and (b) SB events. (c) Monthly averagefrequency of occurrences of LB, SB and combined LSB events. (d) Monthly mean 10 m wind direction and speed. The five main seasonsare marked by vertical lines.
Figure 10: Monthly average (a) precipitation, (b) 2 m air temperature (AT) and sea surface temperature (SST) at Cotonou station over theperiod 2006–2015.

Meteorol. Z. (Contrib. Atm. Sci.)28, 2019
F.K. Guedje et al.: Climatology of coastal wind regimes in Benin 33
employed by many authors, is not appropriate in coastalregions of Benin.
Figure 9d shows the seasonal cycle of 10 m windspeed and direction at Cotonou. It shows a clear anti-correlation between wind speed and LB frequency, mostevident in JAS when mean winds reach 5 ms−1. As themean direction varies by less than 15 degrees, this fig-ure suggests that the stronger the southwesterlies the lesslikely is a LB detection. Such a straightforward interpre-tation does not exist for SB events.
Figure 10 shows seasonal cycles of precipitationand the differences between 2 m air temperature overland (maximum, minimum and daytime mean) and SST.From November–January, mean land-sea temperaturedifferences are small but positive. These months arecharacterized by small precipitation amounts (Fig. 10a)and moderate SSTs. Despite the insolation minimum,daytime temperature maxima are fairly high but night-time minima are low during dry conditions. Mean windspeeds are low (Fig. 9d) and LB, SB and joint LSBevents are frequent (Fig. 9c). On these “classical” LSBdays, winds turn clockwise during nighttime to reachthe LB northwesterly direction in the morning and thenturn counterclockwise to take the characteristic south-westerly SB direction in the afternoon (not shown). In-frequent Harmattan bursts that often occur in the morn-ing could contribute to increasing the frequency of LBevents, as no filter was used to differentiate Harmattanwinds from the LB system.
Responding to the increase in insolation, Februaryand March show the highest daytime maxima, warmerSSTs and much warmer nights, the latter probably re-lated to a moister atmosphere with more clouds and pre-cipitation (Fig. 10). This leads to a large land-sea tem-perature contrast, overall strong winds (Fig. 9d), a sharpdrop in LB occurrence and still relatively frequent SBs(Fig. 9c). After a transition in April, the MJ rainy sea-son is characterized by a sharp drop in daytime temper-ature maxima, partly related to cloudy skies and landsurface cooling through precipitation and evaporation,while the ocean remains relatively warm (Fig. 10). Theassociated reversal of land-sea temperature differencesleads to overall weak winds, a sharp increase in LBevents and a drop in SB events (Fig. 9c and d). In thefollowing little dry season (JAS), SSTs drop to their an-nual minimum due to coastal upwelling along the Bightof Benin, leading to a strongly positive thermal forcingdespite the relatively low daytime 2 m air temperatureover land (Fig. 10b). This explains, in combination withthe peak monsoon wind strength, the very strong meanwinds associated with the overall LB minimum and fre-quent SBs (Fig 9c). Finally, October marks a transitionto the dry-season conditions described above.
Another important feature of the LSB system is theinland penetration of the SB front that can lead to thedevelopment of convective systems. It depends on sev-eral factors including the pressure gradient and the dif-ference in temperature between the coast and the inland.To analyse this aspect, Figure 11 shows the diurnal cycle
of monthly averaged air temperature and mean sea-levelpressure (MSLP) between the stations of Cotonou andSavè (located at 8° 02′ N) that are 185 km apart. It showsthat the temperature difference between the inland andthe coast is negative during nighttime (Fig. 11a and c)and positive during daytime, except in JAS at 12 UTC(Fig. 11e and g). The absolute value of this differencein temperature is greater between December and Aprilthan during the other months of the year. During DJF itis likely amplified by the occurrence of Harmattan cooland dry air, while in MA it is rather linked to the strongwarming at the surface away from the coast. During MJ,JAS and ON, Cotonou is affected by the relatively coldSSTs, while inland areas tend to be cloudier in the after-noon.
The right column of Figure 11 shows the impact onMSLP. At 00 and 06 UTC, MSLP at Savè is slightlyhigher than at Cotonou during the entire year. At 12 and18 UTC, a striking feature is the large daytime drop inMSLP at Savè during February to April, when the sur-face pressure trough is located just north of the coastat 8° N (Fink et al., 2010). This results in a tighter pres-sure gradient and suggests a potentially deep penetrationof the SB. After the monsoon jump in June, when thepressure trough moves over the Sahel, the MSLP gra-dient between the coast and the inland decreases, dueto the strong activity of the St. Helena High, whichstrengthens the southwesterly flow. It shall be stressed,however, that some caution is necessary in the interpre-tation of small pressure differences since barographs inWest Africa are often not well calibrated and systematicerrors in the reduction of station pressure to MSLP mayoccur.
3.2.2 Harmattan
In Cotonou, Harmattan synoptic winds are preferablyfrom northerly to northeasterly direction (between 0°and 45°) and their average speed is about 4 ms−1
(Fig. 12a). Their occurrence is generally preceded bya rapid increase in MSLP over the Sahel (not shown).The phenomenon only appears in DJF (Fig. 12b) withabout 30 % frequency in January followed by just un-der 20 % in December and about 7 % in February. Dur-ing this periods the air temperature is low in the earlymorning and high in the afternoon (Fig. 10b), lead-ing to a significant diurnal thermal amplitude in an of-ten cloudless sky, which, however is often covered byaerosol, e.g. dust from the Sahara and local pollution.
3.2.3 Monsoon flow
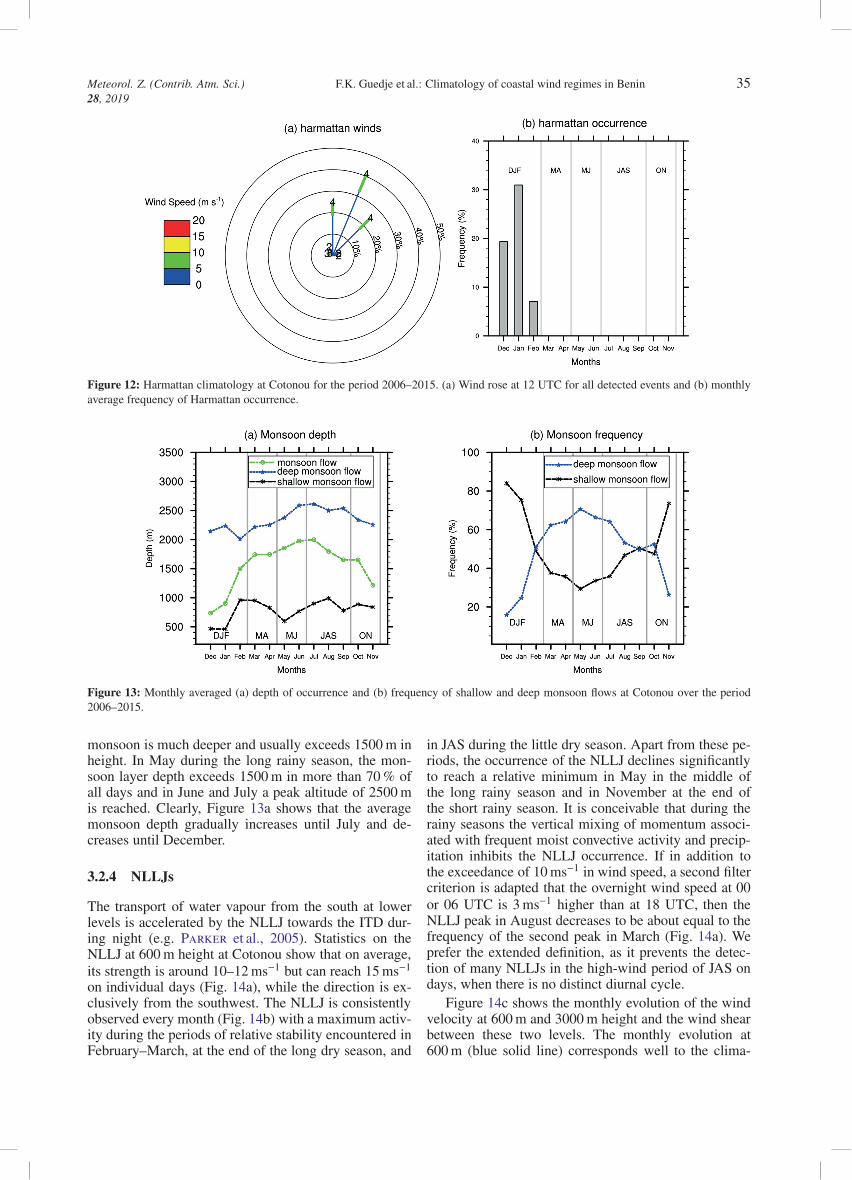
The depth of the monsoon flow is crucial, as the asso-ciated moisture transport from the ocean contributes tomodulating the diurnal variation of temperature, cloudi-ness and rainfall at the coast. The classification of themonsoon flow shown in Figure 13 confirms the expectedstrong contrast between the dry season with a shallowmonsoon (85 % frequency in December) with values aslow as to 500 m height and the rest of the year, when the

34 F.K. Guedje et al.: Climatology of coastal wind regimes in Benin Meteorol. Z. (Contrib. Atm. Sci.)28, 2019
Figure 11: Diurnal cycle of monthly averaged 2 m air temperature and MSLP at Cotonou and Savè stations over the period 2006–2015.
Meteorol. Z. (Contrib. Atm. Sci.)28, 2019
F.K. Guedje et al.: Climatology of coastal wind regimes in Benin 35
Figure 12: Harmattan climatology at Cotonou for the period 2006–2015. (a) Wind rose at 12 UTC for all detected events and (b) monthlyaverage frequency of Harmattan occurrence.
Figure 13: Monthly averaged (a) depth of occurrence and (b) frequency of shallow and deep monsoon flows at Cotonou over the period2006–2015.
monsoon is much deeper and usually exceeds 1500 m inheight. In May during the long rainy season, the mon-soon layer depth exceeds 1500 m in more than 70 % ofall days and in June and July a peak altitude of 2500 mis reached. Clearly, Figure 13a shows that the averagemonsoon depth gradually increases until July and de-creases until December.
3.2.4 NLLJs
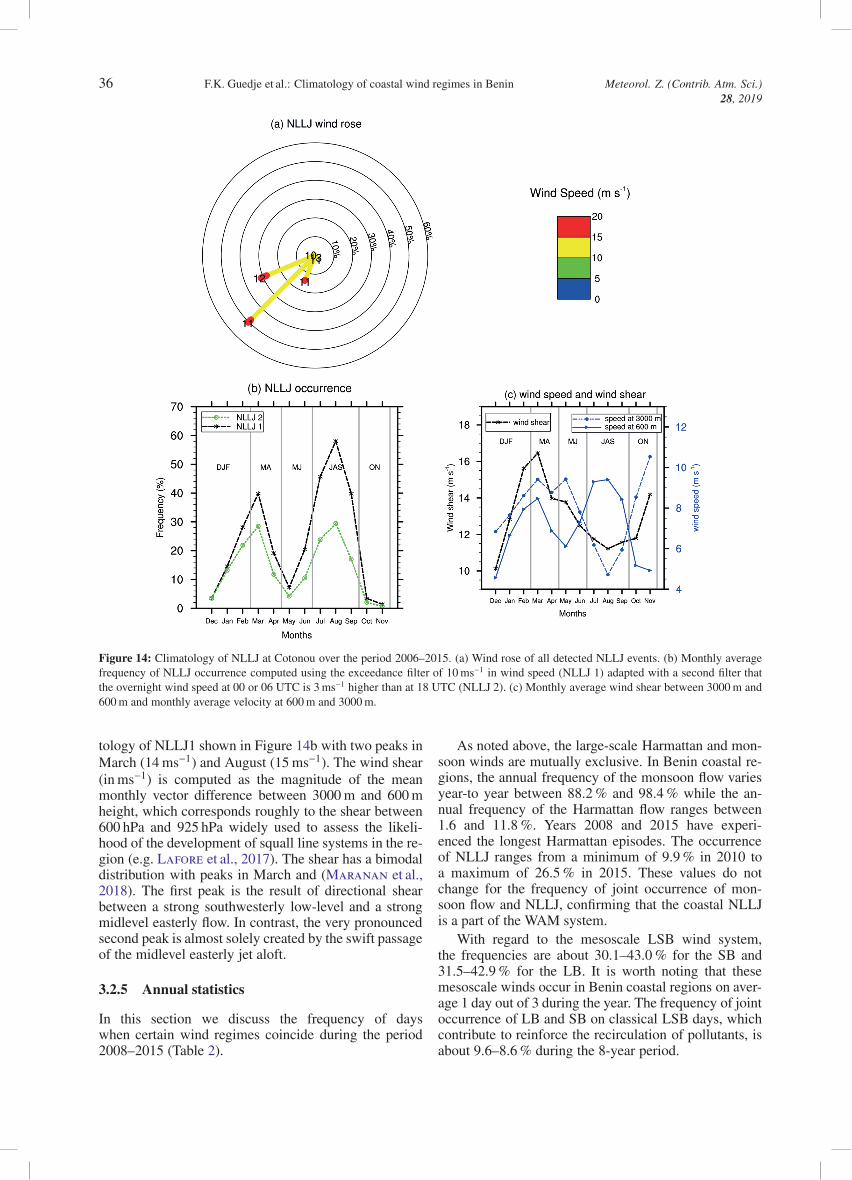
The transport of water vapour from the south at lowerlevels is accelerated by the NLLJ towards the ITD dur-ing night (e.g. Parker et al., 2005). Statistics on theNLLJ at 600 m height at Cotonou show that on average,its strength is around 10–12 ms−1 but can reach 15 ms−1
on individual days (Fig. 14a), while the direction is ex-clusively from the southwest. The NLLJ is consistentlyobserved every month (Fig. 14b) with a maximum activ-ity during the periods of relative stability encountered inFebruary–March, at the end of the long dry season, and
in JAS during the little dry season. Apart from these pe-riods, the occurrence of the NLLJ declines significantlyto reach a relative minimum in May in the middle ofthe long rainy season and in November at the end ofthe short rainy season. It is conceivable that during therainy seasons the vertical mixing of momentum associ-ated with frequent moist convective activity and precip-itation inhibits the NLLJ occurrence. If in addition tothe exceedance of 10 ms−1 in wind speed, a second filtercriterion is adapted that the overnight wind speed at 00or 06 UTC is 3 ms−1 higher than at 18 UTC, then theNLLJ peak in August decreases to be about equal to thefrequency of the second peak in March (Fig. 14a). Weprefer the extended definition, as it prevents the detec-tion of many NLLJs in the high-wind period of JAS ondays, when there is no distinct diurnal cycle.
Figure 14c shows the monthly evolution of the windvelocity at 600 m and 3000 m height and the wind shearbetween these two levels. The monthly evolution at600 m (blue solid line) corresponds well to the clima-
36 F.K. Guedje et al.: Climatology of coastal wind regimes in Benin Meteorol. Z. (Contrib. Atm. Sci.)28, 2019
Figure 14: Climatology of NLLJ at Cotonou over the period 2006–2015. (a) Wind rose of all detected NLLJ events. (b) Monthly averagefrequency of NLLJ occurrence computed using the exceedance filter of 10 ms−1 in wind speed (NLLJ 1) adapted with a second filter thatthe overnight wind speed at 00 or 06 UTC is 3 ms−1 higher than at 18 UTC (NLLJ 2). (c) Monthly average wind shear between 3000 m and600 m and monthly average velocity at 600 m and 3000 m.
tology of NLLJ1 shown in Figure 14b with two peaks inMarch (14 ms−1) and August (15 ms−1). The wind shear(in ms−1) is computed as the magnitude of the meanmonthly vector difference between 3000 m and 600 mheight, which corresponds roughly to the shear between600 hPa and 925 hPa widely used to assess the likeli-hood of the development of squall line systems in the re-gion (e.g. Lafore et al., 2017). The shear has a bimodaldistribution with peaks in March and (Maranan et al.,2018). The first peak is the result of directional shearbetween a strong southwesterly low-level and a strongmidlevel easterly flow. In contrast, the very pronouncedsecond peak is almost solely created by the swift passageof the midlevel easterly jet aloft.
3.2.5 Annual statistics
In this section we discuss the frequency of dayswhen certain wind regimes coincide during the period2008–2015 (Table 2).
As noted above, the large-scale Harmattan and mon-soon winds are mutually exclusive. In Benin coastal re-gions, the annual frequency of the monsoon flow variesyear-to year between 88.2 % and 98.4 % while the an-nual frequency of the Harmattan flow ranges between1.6 and 11.8 %. Years 2008 and 2015 have experi-enced the longest Harmattan episodes. The occurrenceof NLLJ ranges from a minimum of 9.9 % in 2010 toa maximum of 26.5 % in 2015. These values do notchange for the frequency of joint occurrence of mon-soon flow and NLLJ, confirming that the coastal NLLJis a part of the WAM system.
With regard to the mesoscale LSB wind system,the frequencies are about 30.1–43.0 % for the SB and31.5–42.9 % for the LB. It is worth noting that thesemesoscale winds occur in Benin coastal regions on aver-age 1 day out of 3 during the year. The frequency of jointoccurrence of LB and SB on classical LSB days, whichcontribute to reinforce the recirculation of pollutants, isabout 9.6–8.6 % during the 8-year period.

Meteorol. Z. (Contrib. Atm. Sci.)28, 2019
F.K. Guedje et al.: Climatology of coastal wind regimes in Benin 37
Table 2: Annual frequency and joint frequency of occurrence of wind regimes over the period 2008–2015.
Year Monsoon Harmattan NLLJ NLLJ andMonsoon
SB LB LB and SB LB andHarmattan
SB andMonsoon
LB andMonsoon
2008 91.8 8.2 20.0 20.0 39.3 42.9 18.6 6.6 35.8 36.32009 96.4 3.6 15.3 15.3 43.0 32.1 14.0 2.7 40.3 29.32010 98.4 1.6 9.9 9.9 36.2 38.4 15.9 1.6 35.6 36.72011 94.5 5.5 25.1 25.1 41.4 37.5 17.0 5.2 39.5 32.32012 96.4 3.6 24.8 24.8 42.1 31.7 11.2 3.6 40.7 28.12013 95.3 4.7 20.3 20.3 36.7 31.5 10.4 4.7 35.3 26.82014 96.2 3.8 17.9 17.9 30.1 37.5 10.7 3.8 29.0 33.72015 88.2 11.8 26.5 26.5 36.7 31.5 9.6 11.0 35.1 20.5
Figure 15: Bar chart schematic representation of the frequency of occurrence of the different low-level wind regimes in Benin coastal areas.
Another interesting feature is the daily joint occur-rence of large-scale and mesoscale winds, both of thesame direction. In the case of Harmattan and LB, theirjoint frequency ranges between 1.6 % (2010) and 11.0 %(2015), indicating that from morning until early after-noon, the coastal regions remain under the influenceof northerlies in an often cloudless sky. With regard tomonsoon and SB flows, their joint occurrence increasesthe speed of southwesterly winds and fluctuate between29.0 and 40.7 %. In contrast, the occurrence of LB inthe early morning can be followed by the reversal of thewind direction. When the southwesterly winds that oc-cur following this change of direction do not fulfill theSB filters set above, they are classified as monsoon flow.In this case, the joint occurrence of monsoon flow andLB is estimated between 20.5 and 36.7 % during the pe-riod 2008–2015.
4 Summary and conclusionSeasonal and diurnal climatologies of four coastal windregimes (the monsoon and Harmattan winds, the NLLJand the LSB systems) were presented for the station ofCotonou over the period 2006–2015.
For the seasonal climatology, wind roses were uti-lized to describe the diurnal cycle and the vertical struc-ture of the low-level wind regimes using winds fromPILOT and TEMP reports for 2008–2015. The south-westerly monsoon flow is observed in the coastal re-gion throughout the year, except during short periods in
DJF when the northerly Harmattan winds occur. Withinthe monsoon flow, the NLLJ is best represented at600 m a.g.l with a seasonal average velocity of 7 ms−1.These large-scale flows are often reinforced in Cotonouby the occurrence of mesoscale LB and SB winds and itis difficult to clearly separate them in case of joint oc-currence. The LB offshore wind is sharply observableat 06 UTC with speeds of less than 5 ms−1, while thesouthwesterly SB flow during the afternoon reinforcesthe large-scale monsoon flow by up to 5 ms−1.
The climatology is based on detection methods us-ing a set of filters to assign a given day to one (or sev-eral) wind regimes or to classify it as “unspecified”. Onthe basis of these statistics, the bar chart presented inFigure 15 shows a summary of the frequency of occur-rence of these different low-level wind regimes in Benincoastal areas. A visual analysis of this figure confirmsthat the monsoon flow, the LB and the SB are the mostfrequent wind regimes encountered throughout the year,in contrast to the Harmattan winds and the NLLJ2. How-ever, it is worth noting that the joint occurrence of LBand SB (LSB) systems is relatively low, especially dur-ing the rainy seasons. The study has demonstrated that:
• LB and SB days do not always coincide: in almostall seasons there are many days with either SB or LBoccurrence (Fig. 15);
• The monthly variation of the frequency of SBevents shows a unimodal behaviour with a peak in
38 F.K. Guedje et al.: Climatology of coastal wind regimes in Benin Meteorol. Z. (Contrib. Atm. Sci.)28, 2019
November-December (more than 50 %) and a mini-mum in MJ around 15 %, while the LB curve showsa rather bimodal distribution;
• When southwesterly winds strengthen, the LB is lesslikely detected, since the surface wind speed andthe LB frequency show a clear anti-correlation, mostevident in JAS, when mean winds are 5 ms−1;
• Many processes such as insolation, the tighteningof the pressure gradient between the coast and theinland trough (8° N) in MA, the precipitations in MJand coastal upwelling in JAS contribute to modulateor disrupt the occurrence of the LSB systems.
The LB system is also disrupted by the Harmattanwinds in DJF mainly in the early morning but no distinc-tion has been made between the LB and the Harmattanwinds at this time of day. The occurrence of Harmat-tan winds in DJF is followed by an increase in the diur-nal amplitude of temperature and a decrease in humidityat the coast. Apart from these Harmattan episodes, highhumidity is almost permanent, as is the monsoon flowthat transports it. The humidity contents in the lower at-mosphere depends in part on the depth of the monsoonflow and the classification made in this study has shownthat during periods of heavy rainfall the monsoon depthexceeds 1500 m on average. Within this monsoon flow,the activity of the NLLJ increases during periods of rel-ative stability in the dry seasons when turbulent mix-ing is lower. At the daily scale, the NLLJ consistentlyshows speeds up to 15 ms−1, and even above on individ-ual days. These values of speed are much higher thanthe peak velocities (6–8 ms−1) between 400 and 500 mabove ground level (a.g.l.) showed by Schuster et al.(2013, their Fig. 4) using mean low-level wind profilesfrom radiosondes for JAS 2006.
Annual statistics on the occurrence and joint occur-rence of certain wind regimes have shown that the fre-quencies of mutually exclusive large-scale flows fluc-tuate year-to-year from 88.2–98.4 % for monsoon and1.6–11.8 % for Harmattan winds. On average, LSB sys-tems occur 1 day out of 3 during the year. While Har-mattan and LB winds imply offshore flows with a jointfrequency of 1.6–11.8 %, the potential joint occurrenceof monsoon and SB winds fluctuated between 29.0 and40.7 % during investigation period. Overall, this studyhelps to improve the understanding of low-level windat the Guinea Coast. It has demonstrated that the re-versal criterion in surface winds to define LSB days,as used in Bajamgnigni Gbambie and Steyn (2013),may obscure SB occurrence during periods of strongbackground winds as for example at the peak of theWest African monsoon region season. Changes in thestrength, or even the absence of the coastal upwellingin boreal summer along the Guinea Coast might changethe seasonal cycle of the LSB system, as indicated inAbayomi et al. (2007). Future studies shall look at otherlocations along the Guinea Coast with the limitationof lacking upper-air observations. Lower-troposphericwind shear that is known to be relevant for the oc-
currence of linear convective systems, i.e. squall lines(Lafore et al., 2017), is largest during March-April dueto strong NLLJ and AEJ winds. Consistent with this,Maranan et al. (2018) found the strongest and most or-ganized systems at the Guinea Coast at this time of theyear. Thus, the seasonal cycle of the low-level wind sys-tem impacts on organization of convection at the coast.In addition, afternoon convection gets triggered at theSB front. The present study provides a foundation formore comprehensive study of these aspects and otherphenomena associated with coastal wind systems, suchas the dispersion of air pollution.
Acknowledgement
The research leading to these results has receivedfunding from the European Union 7th FrameworkProgramme (FP7/2007-2013) under Grant Agreementno. 603502 (EU project DACCIWA: Dynamics-aerosol-chemistry-cloud interactions in West Africa). The au-thors would like to thank Cornelia Reimann for herhelp to organize two research visits of F.K.G to KIT. Wethank the Beninese institutions who provided us data:IRHOB (for SST), Meteo-Benin (for 3-hourly surfaceobservation from Cotonou meteorological station) andMESRS for the financial support of the second stay ofF.K. Guedje. We would also like to thank RichardJohnson and Paul Ciesielski for the discussion on theaccuracy of PILOT balloon measurements.
References
Abayomi, A.A., B.J. Abiodun, B.J. Omotosho, 2007: An Ob-servational Study of Sea Breeze ocer Nigerian Coastal Re-gion. – Res. J. Appl. Sci. 2, 745–751.
Abdou, K., D.J. Parker, B. Brooks, N. Kalthoff, T. Lebel,2010: The diurnal cycle of lower boundary-layer wind in theWest African monsoon. – Quart. J. Roy. Meteor. Soc. 136,66–76.
Azorin-Molina, C., 2007: A climatological study of seabreezes in Alicante. Sea breeze fronts over the IberianMediterranean area and the isle of Mallorca. – Ph.D. thesis,University Institute of Geography, University of Alicante, Al-icante.
Azorin-Molina, C., D. Chen, S. Tijm, M. Baldi, 2011: Amulti-year study of sea breezes in a mediterranean coastal site:Alicante (Spain). – Int. J. Climatol. 31, 468–486.
Bajamgnigni Gbambie, A.S., D.G. Steyn, 2013: Sea breezesat Cotonou and their interaction with the West African Mon-soon. – Int. J. Climatol. 33, 2889–2899.
Cautenet, S., R. Rosset, 1989: Numerical simulation of SeaBreezes with Vertical Wind Shear during Dry Season at Capeof Three Points, West Africa. – Mon. Wea. Rev. 117, 329–339.
Fink, A.H., H. Paeth, V. Ermert, S. Pohle, M. Diederich,2010: Meteorological processes influencing the weatherand climate of Benin. – In: P. Speth, Christoph, M.,Diekkrüger, D. (Eds.): Impacts of Global Change on theHydrological Cycle in West and Northwest Africa. Springer,chapter I-5.1, 135–149.

Meteorol. Z. (Contrib. Atm. Sci.)28, 2019
F.K. Guedje et al.: Climatology of coastal wind regimes in Benin 39
Fink, A., T. Engel, V. Ermert, R. van der Linden,M. Schneidewind, R. Redl, E. Afiesimama, W.M. Thiaw,C. Yorke, M. Evans, S. Janicot, 2017: Mean Climate andSeasonal Cycle. – In: D.J. Parker and M. Diop-Kane (Eds.),Meteorology of Tropical West Africa: The Forecasters’ Hand-book, John Wiley & Sons, Ltd, chapter 1, 1–39, DOI: 10.1002/9781118391297.ch1.
Flamant, C., A. Deroubaix, P. Chazette, J. Brito, M. Gae-tani, P. Knippertz, A.H. Fink, G. de Coetlogon,L. Menut, A. Colomb, C. Denjean, R. Meynadier,P. Rosenberg, A. Schwarzenboeck, J. Totems, 2018a:Aerosol distribution in the northern Gulf of Guinea: lo-cal anthropogenic sources, long-range transport and the roleof coastal shallow circulations. – Atmos. Chem. Phys. 18,12363–12389, DOI: 10.5194/acp-18-12363-2018.
Flamant, C., P. Knippertz, A.H. Fink, A. Akpo, B. Brooks,C.J. Chiu, H. Coe, S. Danuor, M. Evans, O. Jegede,N. Kalthoff, A. Konaré, C. Liousse, F. Lohou,C. Mari, H. Schlager, A. Schwarzenboeck, B. Adler,L. Amekudzi, J. Aryee, M. Ayoola, A.M. Batenburg,G. Bessardon, S. Borrmann, J. Brito, K. Bower, F. Bur-net, v. Catoire, A. Colomb, C. Denjean, K. Fosu-Amankwah, P.G. Hill, J. Lee, M. Lothon, M. Maranan,J. Marsham, R. Meynadier, J.B. Ngamini, P. Rosenberg,D. Sauer, V. Smith, G. Stratmann, J.W. Taylor, C. Voigt,V. Yoboué, 2018b: The Dynamics-Aerosol-Chemistry-CloudInteractions in West Africa field campaign: Overview and re-search highlights. – Bull. Amer. Met Soc. 99, 83–104.
Gustavsson, T., S. Lindqvist, K. Borne, J. Bogren, 1995: Astudy of sea and land breezes in an archipelago on the westcoast of Sweden. – Int. J. Climatol. 15, 785–800.
Hamilton, R.A., J.W. Archbold, 1945: Meteorology of Nige-ria and adjacent territory. – Quart. J. Roy. Meteor. Soc. 71,231–264.
Kalthoff, N., F. Lohou, B. Brooks, O. Jegede, B. Adler,K. Babic, C. Dione, A. Ajao, L. Amekudzi, J. Aryee,M. Ayoola, G. Bessardon, S. Danuor, J. Handw-erker, M. Kohler, M. Lothon, X. Pedruzo-Bagazgoitia,V. Smith, L. Sunmonu, A. Wieser, A.H. Fink, P. Knip-pertz, 2018: An overview of the diurnal cycle of the atmo-spheric boundary layer during the West African monsoon sea-son: results from the 2016 observational campaign. – Atmos.Chem. Phys. 18, 2913–2928.
Knippertz, P., A.H. Fink, 2006: Synoptic and dynamic aspectsof an extreme springtime Saharan dust outbreak. – Quart.J. Roy. Meteor. Soc. 132, 1153–1177.
Knippertz, P., A.H. Fink, R. Schuster, J. Trentmann,C. Yorke, 2011: Ultra-Low Clouds over the Southern WestAfrican Monsoon Region. – Geophys. Res. Lett. 38, publishedonline. https://doi.org/10.1029/2011GL049278.
Knippertz, P., H. Coe, C. Chiu, M.J. Evans, A.H. Fink,N. Kalthoff, C. Liousse, C. Mari, R. Allan, B. Brooks,S. Danour, C. Flamant, O.O. Jegede, F. Lohou,J.H. Marsham, 2015: The DACCIWA project: Dynamics-aerosol-chemistry-cloud interactions in West Africa. –Bull. Amer. Met. Soc. 96, 1451–1460, DOI: 10.1175/BAMS-D-14-00108.1.
Knippertz, P., A.H. Fink, A. Deroubaix, E. Morris, F. Toc-quer, M.J. Evans, C. Flamant, M. Gaetani, C. Lavaysse,C. Mari, J.H. Marsham, R. Meynadier, A. Affo-Dogo,T. Bahaga, F. Brosse, K. Deetz, R. Guebsi, I. Latifou,M. Maranan, P.D. Rosenberg, A. Schlueter, 2017: A me-teorological and chemical overview of the DACCIWA fieldcampaign in West Africa in June-July 2016. – Atmos. Chem.Phys. 17, 10893–10918, DOI: 10.5194/acp-17-10893-2017.
Lafore, J.P., N. Chapelon, M. Diop, B. Gueye, Y. Larg-eron, S. Lepape, O. Ndiaye, D.J. Parker, E. Poan, R. Roca,
R. Roehrig, C. Taylor, M. Moncrieff, 2017: Deep Con-vection. – In: D.J. Parker, Diop-Kane, M. (Eds.): Mete-orology of Tropical West Africa: The Forecasters’ Hand-book. – John Wiley & Sons, Ltd, chapter 3, 90–129, DOI:10.1002/9781118391297.ch3.
Lothon, M., F. Said, F. Lohou, B. Campistron, 2008: Obser-vation of the diurnal cycle in the low troposphere over WestAfrica. – Mon. Wea. Rev. 136, 3477–3500.
Maranan, M., A.H. Fink, P. Knippertz, 2018: Rainfall typesover southern West Africa: Objective identification, climatol-ogy and synoptic environment. – Quart. J. Roy. Meteor. Soc.144, 1628–1648, DOI: 10.1002/qj.3345.
Nicholson, S.E.T., A.H. Fink, C. Funk, 2018: Assessing Re-covery and Change in West Africa’s Rainfall Regime froma 161-year record. – Int. J. of Climatol., published online.https://doi.org/10.1002/joc.5530.
Parker, D.G., R.R. Burton, A. Diongue-Niang, R.J. El-lis, M. Felton, C.M. Taylor, C.D. Thorncroft, P. Besse-moulin, A.M. Tompkins, 2005: The diurnal cycle of the WestAfrican Monsoon circulation. – Quart. J. Roy. Meteor. Soc.131, 2839–2860.
Parker, D.J., A. Kassimou, B.N. Orji, D.P. Osika, I. Hamza,M. Diop-Kane, A.H. Fink, J. Galvin, F. Guichard,B.L. Lamptey, H. Hamidou, R. van der Linden, R. Redl,T. Lebel, C. Tubbs, 2017: Local Weather. – In: D.J. Parker,Diop-Kane, M. (Eds.): Meteorology of Tropical West Africa:The Forecasters’ Handbook. – John Wiley & Sons, Ltd, chap-ter 4, 130–174, DOI: 10.1002/9781118391297.ch4.
Redelsperger, J.L., C.D. Thorncroft, A. Diedhiou,T. Lebel, D.J. Parker, J. Polcher, 2006: African Mon-soon Multidisciplinary Analysis: An International ResearchProject and Field Campaign. – Bull. Amer. Meteor. Soc. 87,1739–1746, DOI: 10.1175/BAMS-87-12-1739.
Rider, L.J., M. Armendariz, 1968: A Comparison of Simul-taneous Wind Profiles Derived from Smooth and Rough-ened Spheres. – J. Appl. Meteor. 7, 293–296, DOI: 10.1175/1520-0450(1968)007<0293:ACOSWP>2.0.CO;2.
Ryznar, E., J.S. Touma, 1981: Characteristics of true lakebreezes along the eastern shore of Lake Michigan. – Atmos.Env. 15, 1201–1205.
Sanogo, S., A.H. Fink, J.B. Omotosho, A. Ba, R. Redl, V. Er-mert, 2015: Spatio-temporal characteristics of the recent rain-fall recovery in West Africa. – Int. J. Climatol. 35, 4589–4605,DOI: 10.1002/joc.4309.
Schrage, J.M., A.H. Fink, 2012: Nocturnal continental low-level stratus over Tropical West Africa: Observations and pos-sible mechanisms controlling its onset. – Mon. Wea. Rev. 140,1794–1809.
Schuster, R., A.H. Fink, P. Knippertz, 2013: Formation andmaintenance of nocturnal low-level stratus over the southernWest African monsoon region during AMMA 2006. – J. At-mos. Sci. 70, 2337–2355.
Steyn, D.G., D.A. Faulkner, 1986: The climatology of sea-breezes in the Lower Fraser Valley. – B.C. Climatol. Bull. 20,21–39.
Sultan, B., S. Janicot, 2003: The West African Monsoondynamics. Part II: The “preonset” and “onset” of the summermonsoon. – J. Climate 16, 3407–3427.
Taylor, C.M., D. Belušic, F. Guichard, D.J. Parker, T. Vis-chel, O. Bock, P.P. Harris, S. Janicot, C. Klein, G. Pan-thou, 2017: Frequency of extreme Sahelian storms tripledsince 1982 in satellite observations. – Nature 544, 475–478.
van der Linden, R., A.H. Fink, R. Redl, 2015: Satellite-basedclimatology of low-level continental clouds in southern WestAfrica during the summermonsoon season. – J. Geophys. Res.Atmos. 120, 1186–1201.