
CLIMATES OF NEPAL AND THEIR IMPLICATIONSawsassets.panda.org/downloads/climates_of_nepal.pdf ·...
176
CLIMATES OF NEPAL AND THEIR IMPLICATIONS WWW.WWFNEPAL.ORG - Janak Lal Nayava Shrestha NP 2012 REPORT NP CLIMATES OF NEPAL AND THEIR IMPLICATIONS...
Transcript of CLIMATES OF NEPAL AND THEIR IMPLICATIONSawsassets.panda.org/downloads/climates_of_nepal.pdf ·...

CLIMATES OF NEPAL AND THEIR IMPLICATIONSWWW.WWFNEPAL.ORG
- Janak Lal Nayava Shrestha
NP
© 1986 Panda Symbol WWF-World Wide Fund For Nature(also known as World Wildlife Fund)® “WWF” is a WWF Registered TrademarkWWF Nepal, P. O. Box: 7660, Baluwatar, Kathmandu, NepalT: +977 1 4434820, F: +977 1 4438458, E: [email protected]
Why we are here
www.wwfnepal.org
To stop the degradation of the planet’s natural environment andto build a future in which humans live in harmony with nature.
WWF is in over 100 countries, on 5 continents
WWF was founded in 1961
WWF has over 5,000 staff worldwideWWF has over 5 million
supporters
+100
+5,000+5M
1961 2012
REPORT
NP
CLIMATES OF NEPALAND THEIR IMPLICATIONS...


Pages Forword I Preface II About the book and author IV Acknowledgements VI. Acronyms VII1. Heavy monsoon rainfall in Nepal, Weather, 1974 12. Climates of Nepal, The Himalayan review, 1975 93. Topoclimatology of the Kathmandu Valley, Proceedings ANZAAS, 49th Congress, New Zealand, 1979 134. A Topoclimatological investigation of solar radiation in the Kathmandu valley, Nepal, Australian Meteorological Magazine, 1980 245. Estimation of Temperature over Nepal, The Himalayan Review, 1980 376. Areal rainfall in the Kathmandu valley, Mausam, 1981 447. Rainfall in Nepal, The Himalayan review, 1982 518. Environmental impacts on agricultural development, Collected papers, Nepal's Nature Paradise By T.C.Majupuria, 1984/85 619. Monitoring and evaluation of crop yield and production in Nepal, Proceedings, RONAST, 3rd Congress, 1999 7010. Probable maximum precipitation, Proceeding of the 2nd Intl symposium on control Beijing 2002 8211. Temporal variation of rainfall in Nepal since 1971-2000, Journal of Hydrology and Meteorology, 2004 9112. The estimation of potential evapo-transpiration by climate model for Western Nepal, Journal of Hydrology and Meteorology, 2005 10213. The analysis of wind for Western Nepal, Journal of Hydrology and Meteorology, 2006 11214. Variations of rice yield with rainfall in Nepal during 1971-2000, Journal of Hydrology and Meteorology, 2008 12115. Impact of climate, climate change and modern technology on Wheat production in Nepal: a case study at Bhairahawa, Journal of Hydrology and Meteorology, 2009 13116. Impact of climate change on production and productivity in Nepal: a case study of maize research and development in Nepal, Journal of Agriculture and Environment, 2010 14517. SOHAM - Nepal’s Chairman Dr. Janak Lal Nayava’s speech on WMO day-2005 15618. Further works and references on Climates of Nepal 16119. Dendrogram 164
Table of Contents
Collected Published Papers on Climates of Nepal and their implications ........
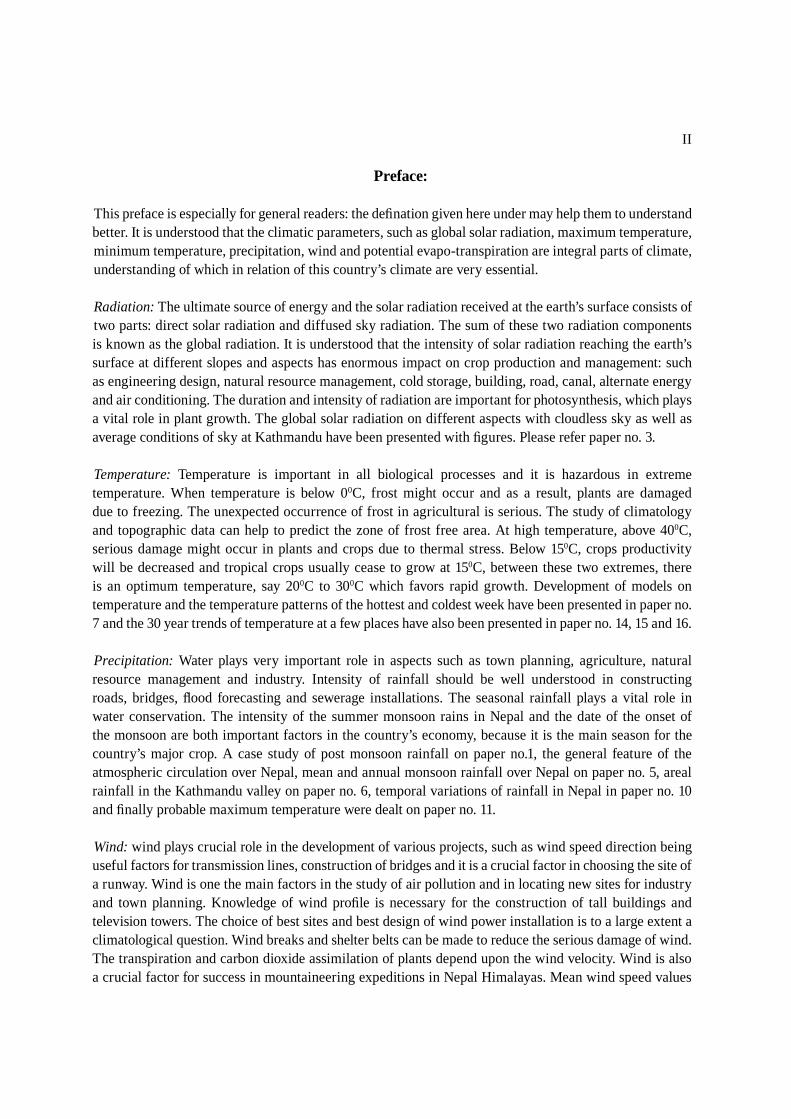
Preface:
This preface is especially for general readers: the defi nation given here under may help them to understand better. It is understood that the climatic parameters, such as global solar radiation, maximum temperature,minimum temperature, precipitation, wind and potential evapo-transpiration are integral parts of climate,understanding of which in relation of this country’s climate are very essential.
Radiation: The ultimate source of energy and the solar radiation received at the earth’s surface consists oftwo parts: direct solar radiation and diffused sky radiation. The sum of these two radiation components is known as the global radiation. It is understood that the intensity of solar radiation reaching the earth’s surface at different slopes and aspects has enormous impact on crop production and management: such as engineering design, natural resource management, cold storage, building, road, canal, alternate energy and air conditioning. The duration and intensity of radiation are important for photosynthesis, which plays a vital role in plant growth. The global solar radiation on different aspects with cloudless sky as well as average conditions of sky at Kathmandu have been presented with fi gures. Please refer paper no. 3.
Temperature: Temperature is important in all biological processes and it is hazardous in extreme temperature. When temperature is below 00C, frost might occur and as a result, plants are damaged due to freezing. The unexpected occurrence of frost in agricultural is serious. The study of climatology and topographic data can help to predict the zone of frost free area. At high temperature, above 400C,serious damage might occur in plants and crops due to thermal stress. Below 150C, crops productivity will be decreased and tropical crops usually cease to grow at 150C, between these two extremes, there is an optimum temperature, say 200C to 300C which favors rapid growth. Development of models on temperature and the temperature patterns of the hottest and coldest week have been presented in paper no. 7 and the 30 year trends of temperature at a few places have also been presented in paper no. 14, 15 and 16.
Precipitation: Water plays very important role in aspects such as town planning, agriculture, natural resource management and industry. Intensity of rainfall should be well understood in constructing roads, bridges, fl ood forecasting and sewerage installations. The seasonal rainfall plays a vital role in water conservation. The intensity of the summer monsoon rains in Nepal and the date of the onset of the monsoon are both important factors in the country’s economy, because it is the main season for the country’s major crop. A case study of post monsoon rainfall on paper no.1, the general feature of the atmospheric circulation over Nepal, mean and annual monsoon rainfall over Nepal on paper no. 5, areal rainfall in the Kathmandu valley on paper no. 6, temporal variations of rainfall in Nepal in paper no. 10 and fi nally probable maximum temperature were dealt on paper no. 11.
Wind: wind plays crucial role in the development of various projects, such as wind speed direction being useful factors for transmission lines, construction of bridges and it is a crucial factor in choosing the site of a runway. Wind is one the main factors in the study of air pollution and in locating new sites for industry and town planning. Knowledge of wind profi le is necessary for the construction of tall buildings and television towers. The choice of best sites and best design of wind power installation is to a large extent a climatological question. Wind breaks and shelter belts can be made to reduce the serious damage of wind.The transpiration and carbon dioxide assimilation of plants depend upon the wind velocity. Wind is also a crucial factor for success in mountaineering expeditions in Nepal Himalayas. Mean wind speed values
II

the Western Nepal have been studied and the spatial variations of wind at each month have been tested. These mean maps of wind speeds will give the general pattern of wind at the study area. Refer to paper no. 13
Humidity: Humidity will indicate whether climate is dry or moist which will help to suitable to suitable crops according to humidity index. Humidity is used to measure the comfort of the human index and humidity is measured in many sophisticated factories to avoid the corrosion and damping effect.
Evaporation: Evaporation from soil and plant surface is a phenomenon of cance in agrometeorology. As a matter of fact, evapo-transpiration is one of the main parameters in water balance and energy balance studies. These studies are very necessary for irrigation planning and practices, water conservation, water supply and agricultural planning. The estimation of evapo-transpiration by climate models for western Nepal is presented in paper no. 12.
Others: Certain extreme meteorological conditions bring severe hazards such as drought, cold waves, heat waves, storms and hurricanes, which directly affect our daily lives and loss of property and lives. Timing of occurrence and duration of fog are both important factors to aviation for better planning of their schedule. The best location and routing of motorways can be determined from climatological data on the frequency of fog, frost, high winds and drifting snow. Climatological investigations can provide information on their likely frequency, magnitude and duration. Thus topoclimatology, monitoring and evaluation of crop yield and production and climate change and its impact on economic perspective are also dealt. Now the study of applied climatology is related to many (refer paper no. 3, 8, 9, 14, 15 and 16). These types of studies involving close cooperation between climatologists, engineers, agronomists, economists and planners help to obtain the maximum from the weather and climatic factors related to their projects.
These studies are of course tips of the iceberg. To out the information of work accomplished is very important for researcher to begin their work. Any comments and suggestions are most welcome for the further development. Thank you.
Janak Lal Nayava [email protected]
III
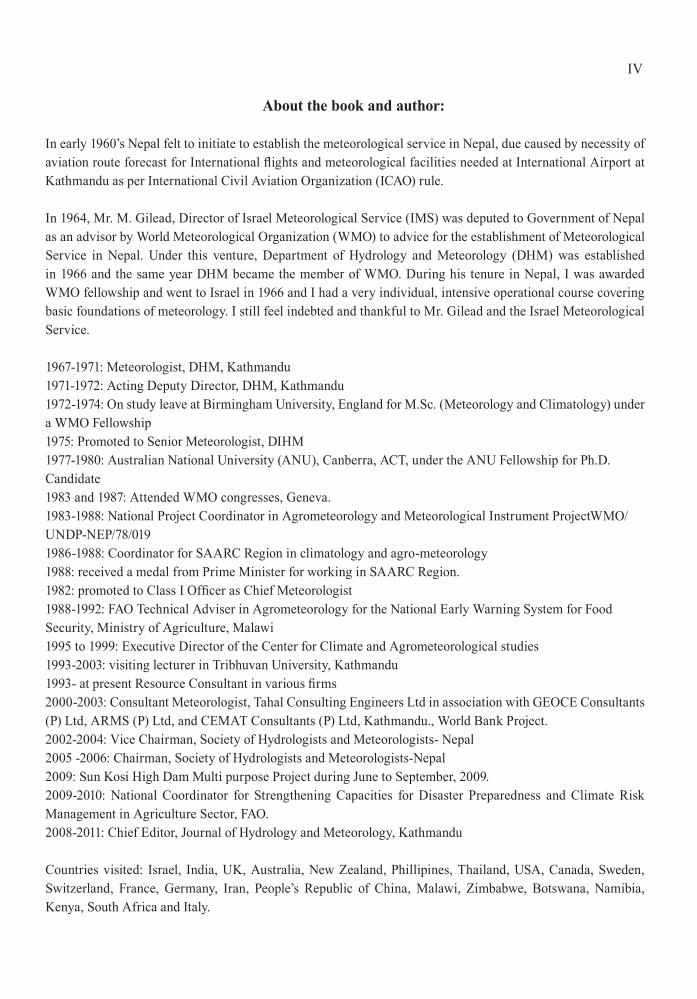
About the book and author:
In early 1960’s Nepal felt to initiate to establish the meteorological service in Nepal, due caused by necessity of aviation route forecast for International and meteorological facilities needed at International Airport at Kathmandu as per International Civil Aviation Organization (ICAO) rule.
In 1964, Mr. M. Gilead, Director of Israel Meteorological Service (IMS) was deputed to Government of Nepal as an advisor by World Meteorological Organization (WMO) to advice for the establishment of Meteorological Service in Nepal. Under this venture, Department of Hydrology and Meteorology (DHM) was established in 1966 and the same year DHM became the member of WMO. During his tenure in Nepal, I was awarded WMO fellowship and went to Israel in 1966 and I had a very individual, intensive operational course covering basic foundations of meteorology. I still feel indebted and thankful to Mr. Gilead and the Israel Meteorological Service.
1967-1971: Meteorologist, DHM, Kathmandu1971-1972: Acting Deputy Director, DHM, Kathmandu1972-1974: On study leave at Birmingham University, England for M.Sc. (Meteorology and Climatology) under a WMO Fellowship1975: Promoted to Senior Meteorologist, DIHM1977-1980: Australian National University (ANU), Canberra, ACT, under the ANU Fellowship for Ph.D.Candidate1983 and 1987: Attended WMO congresses, Geneva.1983-1988: National Project Coordinator in Agrometeorology and Meteorological Instrument ProjectWMO/UNDP-NEP/78/0191986-1988: Coordinator for SAARC Region in climatology and agro-meteorology1988: received a medal from Prime Minister for working in SAARC Region.1982: promoted to Class I as Chief Meteorologist1988-1992: FAO Technical Adviser in Agrometeorology for the National Early Warning System for FoodSecurity, Ministry of Agriculture, Malawi1995 to 1999: Executive Director of the Center for Climate and Agrometeorological studies1993-2003: visiting lecturer in Tribhuvan University, Kathmandu1993- at present Resource Consultant in various 2000-2003: Consultant Meteorologist, Tahal Consulting Engineers Ltd in association with GEOCE Consultants(P) Ltd, ARMS (P) Ltd, and CEMAT Consultants (P) Ltd, Kathmandu., World Bank Project.2002-2004: Vice Chairman, Society of Hydrologists and Meteorologists- Nepal2005 -2006: Chairman, Society of Hydrologists and Meteorologists-Nepal2009: Sun Kosi High Dam Multi purpose Project during June to September, 2009.2009-2010: National Coordinator for Strengthening Capacities for Disaster Preparedness and Climate Risk Management in Agriculture Sector, FAO.2008-2011: Chief Editor, Journal of Hydrology and Meteorology, Kathmandu
Countries visited: Israel, India, UK, Australia, New Zealand, Phillipines, Thailand, USA, Canada, Sweden, Switzerland, France, Germany, Iran, People’s Republic of China, Malawi, Zimbabwe, Botswana, Namibia, Kenya, South Africa and Italy.
IV

Working experience with WMO experts: Mr. G. Steinitz, (1967-69), Dr. Venho, (1967-69), Dr. V. Zirovsky (1969-73), Mr. R.Rannaleet (1969-73), Mr. G. Shak (1974-1978) and many more.
When I joined the DHM on 2nd day of my return from Israel in 1967, I had an opportunity to work closely with Mr. G. Stenitz. Since Nepal had to start meteorology from foundations, we had to perform different actions in the steady balance. Installations of meteorological net-work, spot training, designing, preparing form, quality control, computing data, preparing, processing and publishing climatological records. In this connection, I had visited more than 50 districts of Nepal for site selection and installation of meteorological stations.
Since India Meteorological Department (IMD) had established 104 hydro-met stations during 1940’s and 1950’s in Nepal and IMD had a supplementary meteorological at Kathmandu airport. For continuity of data, DHM installed meteorological stations very close to all IMD hydromet stations within 1971/72. At the same time DHM started Main Meteorological at Kathmandu Airport. This was one of the challenging tasks in the beginning of our professional career in meteorology. In this way I was one of the active founding members of meteorological service in Nepal.
When I became Chairman of Society of Hydrologists and Meteorologists-Nepal in 2005/2006, I had delivered a several talk programs on Challenges facing Nepalese Agriculture, based on cereal crops in the following places: Department of Statistics, Department of Agriculture, Department of Irrigation and National Planning Commission (NPC). The talk lasted nearly 2 hours in each places. In the NPC, the then Vice Chairman Dr. Shanker Sharma was present and very co-ordial discussions were taken place.
I have a quite a passion of going through the meteorological data and wrote several articles and now presented as a book from my collected papers for readers. This book contains collected papers of mine, mine and et al in chronological order based on climates of Nepal and their implications to various development issues, written in different time and space and published in the different national and international Journals as well as the papers submitted in International Congress and workshop, which were also published. Though some of the papers were published in late 1970’s and early 1980’s, but it seemed that their importance and audiences are increasing more and more in the recent time in Nepal due to global warming. I hope that this book on collected published papers on Climates of Nepal and their implications might be useful for diverse users, decision makers and planners. In addition to those articles, which were published earlier, a few updates with recent activities and references have been added for further information.
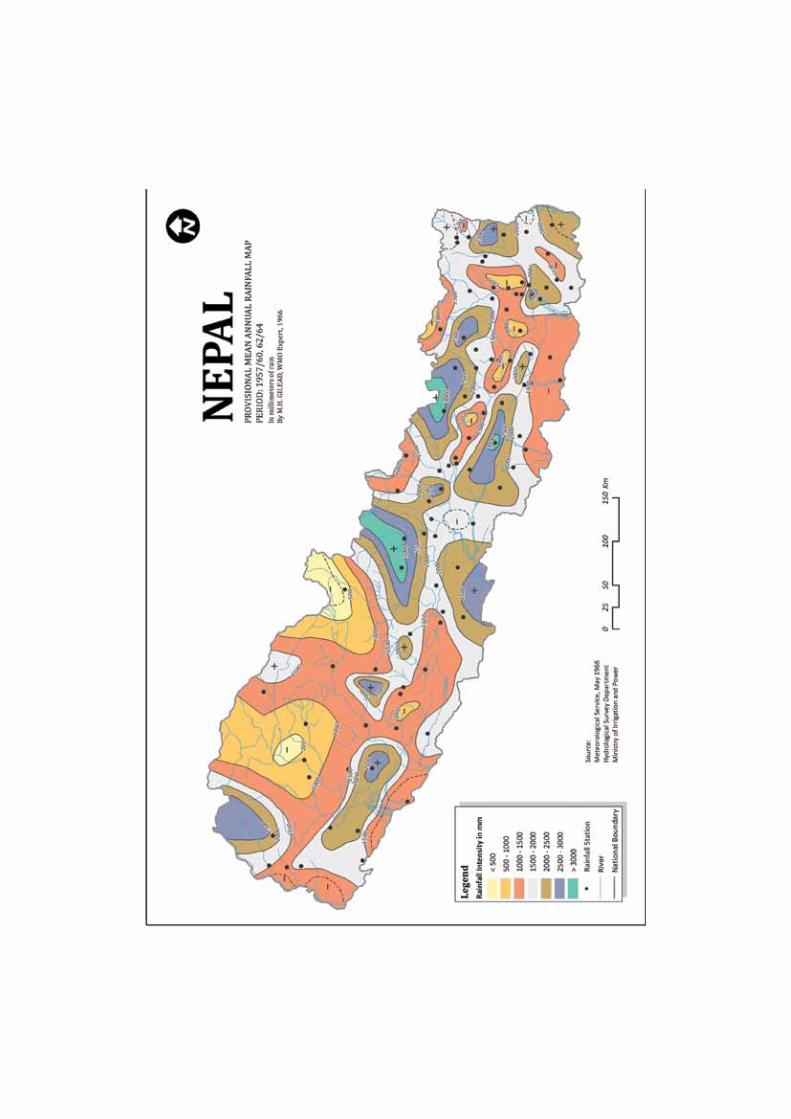
In the begining of this book, the rainfall map of Nepal which was hand drawn in 1966 by Mr. M. Gilead, WMO expert in Nepal. This map was especially digitized using GIS for this publications.
I sincerely once more thanked to the Australian National University, Canberra for their support in my research.Finally, I would like to express my humble and sincere thank to my late parents Mr Ratna lal Shrestha and Mrs Dhana Laxmi Shrestha and my family for bringing me in this world and led light of education as far as they could. I thank to my wife Mrs Ganga Devi Shrestha for her as an in Nepal Industrial Development Cooperation to be hand with me in Australia.
Janak Lal Nayava Shrestha
V

I am grateful to all my previous publishers who have given me their kind permissions to print all my articles compiled in a book form. I take this opportunity to thank Mr. Samir Ojha for organizing the layout of the book. I also sincerely wish to thank Mr. Anil Manandhar, Country Representative, Mr. Ugan Manandhar, Program Manager-Climate Change, Energy & Freshwater and Mr. Akash Shrestha, Communications & Marketing Manager at WWF Nepal for their support in publishing this book. Finally I thank Mr. Krishna Gyawali, Secretary and Mr. Batu Krishna Uprety, Joint Secretary, Ministry of Environment, Government of Nepal for their kind cooperation and encouragement to publish this book.
VI
Acknowledgements

ACRONYMS
ANU Australian National UniversityAPROSC Agricultural Projects Services CenterARMS ARMS (P) LtdCEMAT CEMAT Consultants (P) LtdCBS Central Bureau of StatistacsDHM Department of Hydrology and MeteorologyDFID Department for International DevelopmentDFAMS Department of Food and Marketing ServicesDIHM Department of Irrigation, Hydrology and MeteorologyDoA Department of AgricultureDoI Department of IrrigationGEOCE GEOCE Consultants (P) LtdHMG His Majesty’s GovernmentIMD India Meteorological DepartmentICAO International Civil Aviation OrganizationFAO Food and Agriculture Organization of the United Nations MoAC Ministry of Agriculture and CooperativesMoE Ministry of EnvironmentNAPA National Adaptation Program of ActionNARC Nepal Agriculture Research CouncilNPC National Planning CommissionSAARC South Asian Association for Regional CommitteeSMRC South Asian Meteorological Regional CommitteeTU Tribhuwan University UK United KingdomUN United NationsUNFCC United Nations First Communications report on Climate changeUNDP United Nations Development ProgramWMO World Meteorological Organization
VII
1
Department of Irrigation and Meteorology, Kathmandu
Heavy Monsoon Rainfall In Nepal*
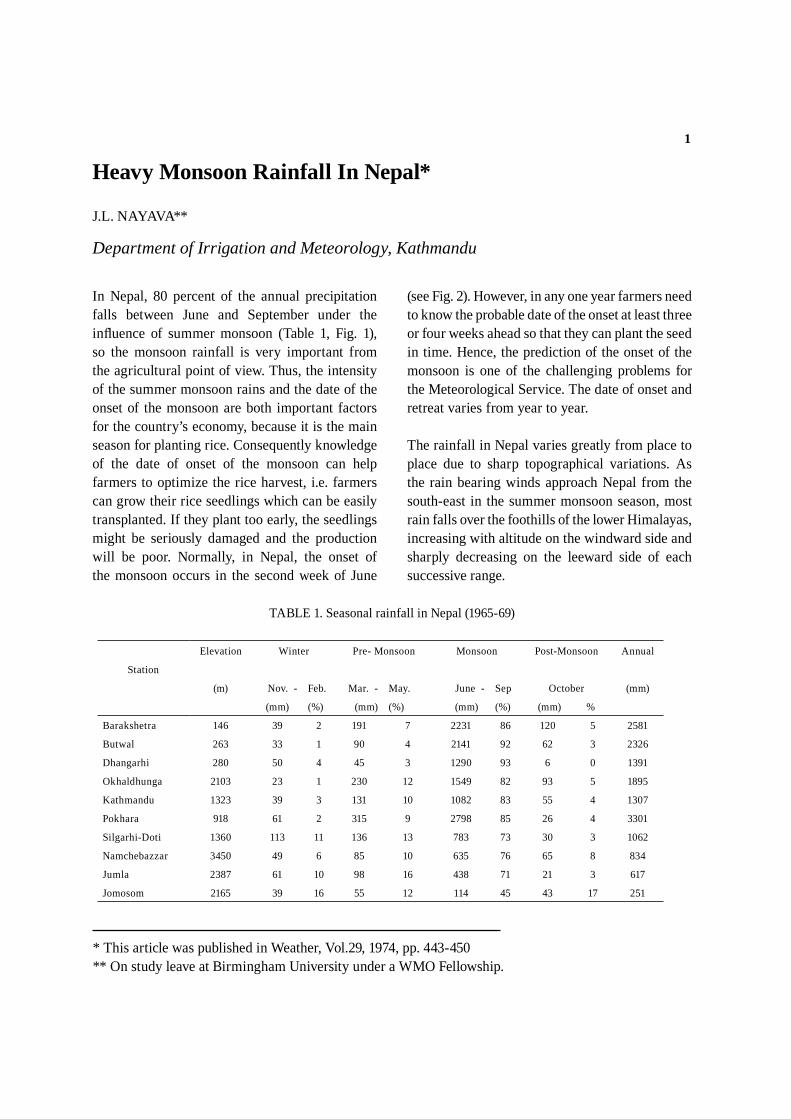
In Nepal, 80 percent of the annual precipitation falls between June and September under the in uence of summer monsoon (Table 1, Fig. 1), so the monsoon rainfall is very important from the agricultural point of view. Thus, the intensity of the summer monsoon rains and the date of the onset of the monsoon are both important factors for the country’s economy, because it is the main season for planting rice. Consequently knowledge of the date of onset of the monsoon can help farmers to optimize the rice harvest, i.e. farmers can grow their rice seedlings which can be easily transplanted. If they plant too early, the seedlings might be seriously damaged and the production will be poor. Normally, in Nepal, the onset of the monsoon occurs in the second week of June
(see Fig. 2). However, in any one year farmers need to know the probable date of the onset at least three or four weeks ahead so that they can plant the seed in time. Hence, the prediction of the onset of the monsoon is one of the challenging problems for the Meteorological Service. The date of onset and retreat varies from year to year.
The rainfall in Nepal varies greatly from place to place due to sharp topographical variations. As the rain bearing winds approach Nepal from the south-east in the summer monsoon season, most rain falls over the foothills of the lower Himalayas, increasing with altitude on the windward side and sharply decreasing on the leeward side of each successive range.
J.L. NAYAVA**
TABLE 1. Seasonal rainfall in Nepal (1965-69)
Station
Elevation Winter Pre- Monsoon Monsoon Post-Monsoon Annual
(m) Nov. -
(mm)
Feb.
(%)
Mar. -
(mm)
May.
(%)
June -
(mm)
Sep
(%)
October
(mm) %
(mm)
Barakshetra 146 39 2 191 7 2231 86 120 5 2581
Butwal 263 33 1 90 4 2141 92 62 3 2326
Dhangarhi 280 50 4 45 3 1290 93 6 0 1391
Okhaldhunga 2103 23 1 230 12 1549 82 93 5 1895
Kathmandu 1323 39 3 131 10 1082 83 55 4 1307
Pokhara 918 61 2 315 9 2798 85 26 4 3301
Silgarhi-Doti 1360 113 11 136 13 783 73 30 3 1062
Namchebazzar 3450 49 6 85 10 635 76 65 8 834
Jumla 2387 61 10 98 16 438 71 21 3 617
Jomosom 2165 39 16 55 12 114 45 43 17 251
** On study leave at Birmingham University under a WMO Fellowship.* This article was published in Weather, Vol.29, 1974, pp. 443-450

2
Summertime rainfall varies diurnal and the mountains are usually covered by low clouds for much of the day. Rainfall over Kathmandu shows a marked peak in the late night between 2310 and 0310 local time and low in the late morning between 0910 and 1210 local time (Dhar 1960). At Barakshetra, two maxima and two minima were observed during the study period. Marked maxima occurred between 1310 and 1410 (local time) and between 2310 and
0410. Two minima occurred between 0810 and 1010 hours and between 1910 and 2210 hours (Dhar 1960). Intensity of rainfall is very important for constructing bridges and sewage installations and for ood forecasting. Maximum rainfall in 24 hours, date and number of rainy days are given in Table 2. During the period 1965-69, Gumthang (Fig. 1) recorded the highest daily rainfall in Nepal 505.2 mm on 25 August 1968.
TABLE 2. Maximum rainfall in 24 hours during the period 1965-69 in Nepal
Fig. 1. Key map for rainfall at selected stations in Nepal - see Table 1
Station
Maximum rainfall in 24 hours and date
where known
Average number of
rainy days per year
(over 1 mm)Amount (mm) Percentage of mean
annual total
Date
Barakshetra 313 12 21 July 1967 110
Butwal 402 17 Aug. 1968 93
Dhangarhi 168 12 17 Sep. 1968 55
Okhaldhunga 130 7 July 1965 119
Kathmandu 134 10 9 July 1967 106
Pokhara 261 8 July 1965 136
Silgarhi-Doti 135 13 6 June 1967 72
Namchebazzar 115 14 4 Oct. 1968 116
Jumla 91 15 15 July 1969 64
Jomosom 72 28 4 Oct. 1968 32
3
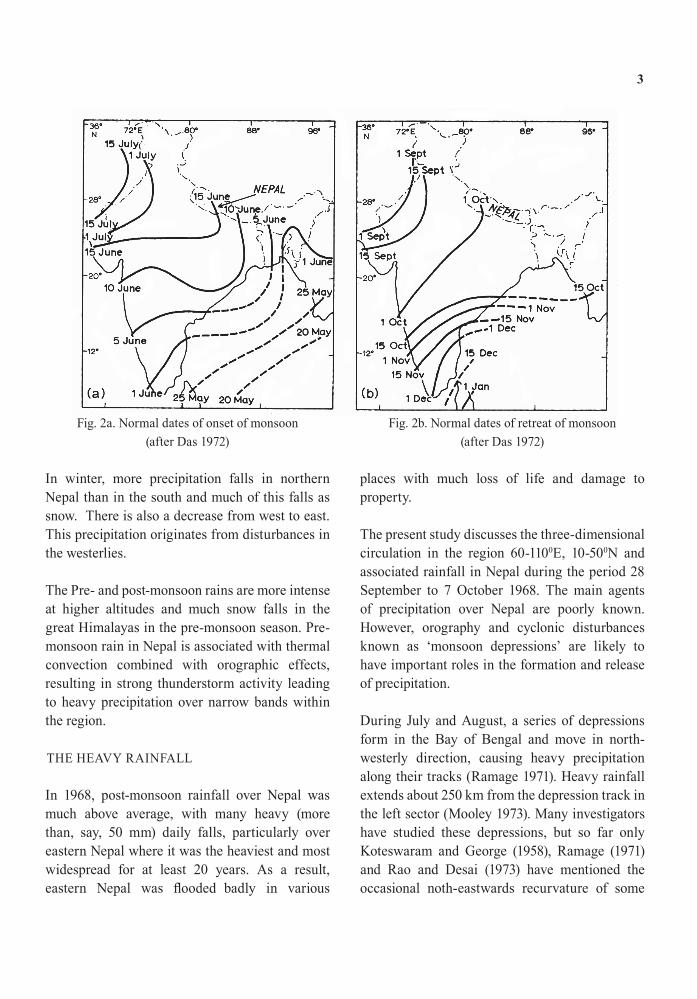
In winter, more precipitation falls in northern Nepal than in the south and much of this falls as snow. There is also a decrease from west to east. This precipitation originates from disturbances in the westerlies.
The Pre- and post-monsoon rains are more intense at higher altitudes and much snow falls in the great Himalayas in the pre-monsoon season. Pre-monsoon rain in Nepal is associated with thermal convection combined with orographic effects, resulting in strong thunderstorm activity leading to heavy precipitation over narrow bands within the region.
THE HEAVY RAINFALL
In 1968, post-monsoon rainfall over Nepal was much above average, with many heavy (more than, say, 50 mm) daily falls, particularly over eastern Nepal where it was the heaviest and most widespread for at least 20 years. As a result,
places with much loss of life and damage to property.
The present study discusses the three-dimensional circulation in the region 60-1100E, 10-500 dna Nassociated rainfall in Nepal during the period 28 September to 7 October 1968. The main agents of precipitation over Nepal are poorly known. However, orography and cyclonic disturbances known as ‘monsoon depressions’ are likely to have important roles in the formation and release of precipitation. During July and August, a series of depressions form in the Bay of Bengal and move in north-westerly direction, causing heavy precipitation along their tracks (Ramage 1971). Heavy rainfall extends about 250 km from the depression track in the left sector (Mooley 1973). Many investigators have studied these depressions, but so far only Koteswaram and George (1958), Ramage (1971) and Rao and Desai (1973) have mentioned the occasional noth-eastwards recurvature of some
Fig. 2a. Normal dates of onset of monsoon (after Das 1972)
Fig. 2b. Normal dates of retreat of monsoon (after Das 1972)
4
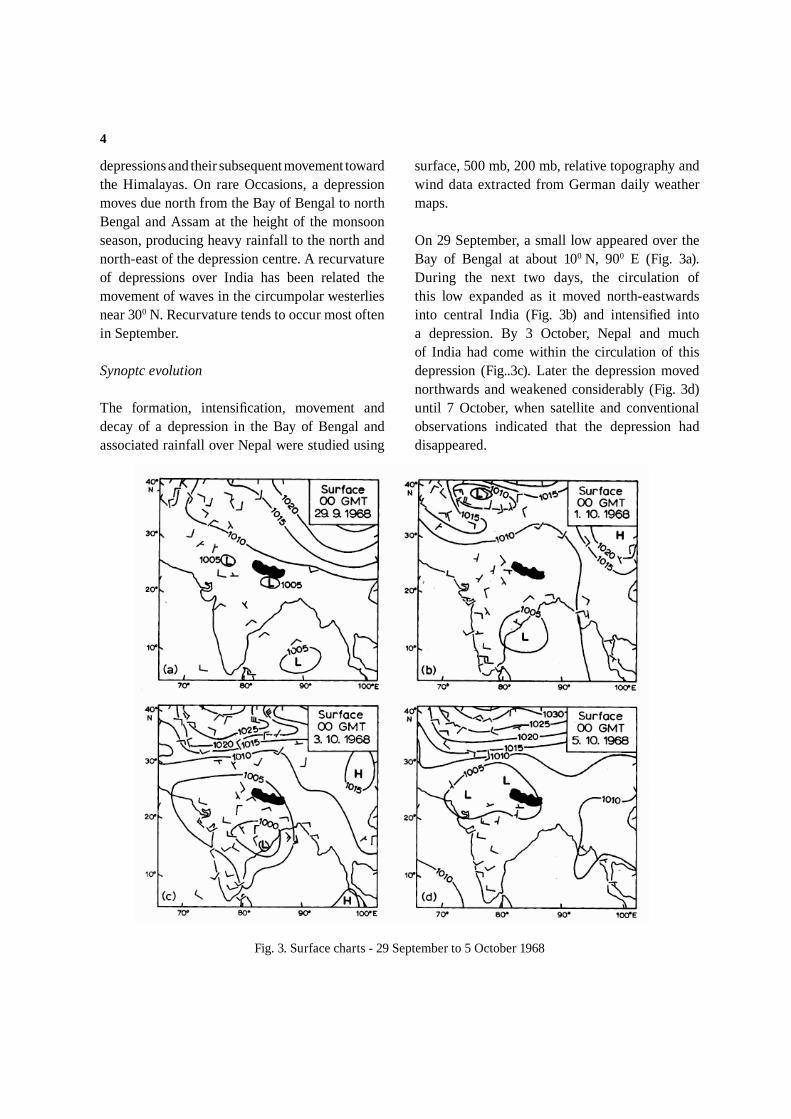
depressions and their subsequent movement toward the Himalayas. On rare Occasions, a depression moves due north from the Bay of Bengal to north Bengal and Assam at the height of the monsoon season, producing heavy rainfall to the north and north-east of the depression centre. A recurvature of depressions over India has been related the movement of waves in the circumpolar westerlies near 300 N. Recurvature tends to occur most often in September.
Synoptc evolution
The formation, intensi cation, movement and decay of a depression in the Bay of Bengal and associated rainfall over Nepal were studied using
surface, 500 mb, 200 mb, relative topography and wind data extracted from German daily weather maps.
On 29 September, a small low appeared over the Bay of Bengal at about 100 N, 900 E (Fig. 3a). During the next two days, the circulation of this low expanded as it moved north-eastwards into central India (Fig. 3b) and intensi ed into a depression. By 3 October, Nepal and much of India had come within the circulation of this depression (Fig..3c). Later the depression moved northwards and weakened considerably (Fig. 3d) until 7 October, when satellite and conventional observations indicated that the depression had disappeared.
Fig. 3. Surface charts - 29 September to 5 October 1968
5
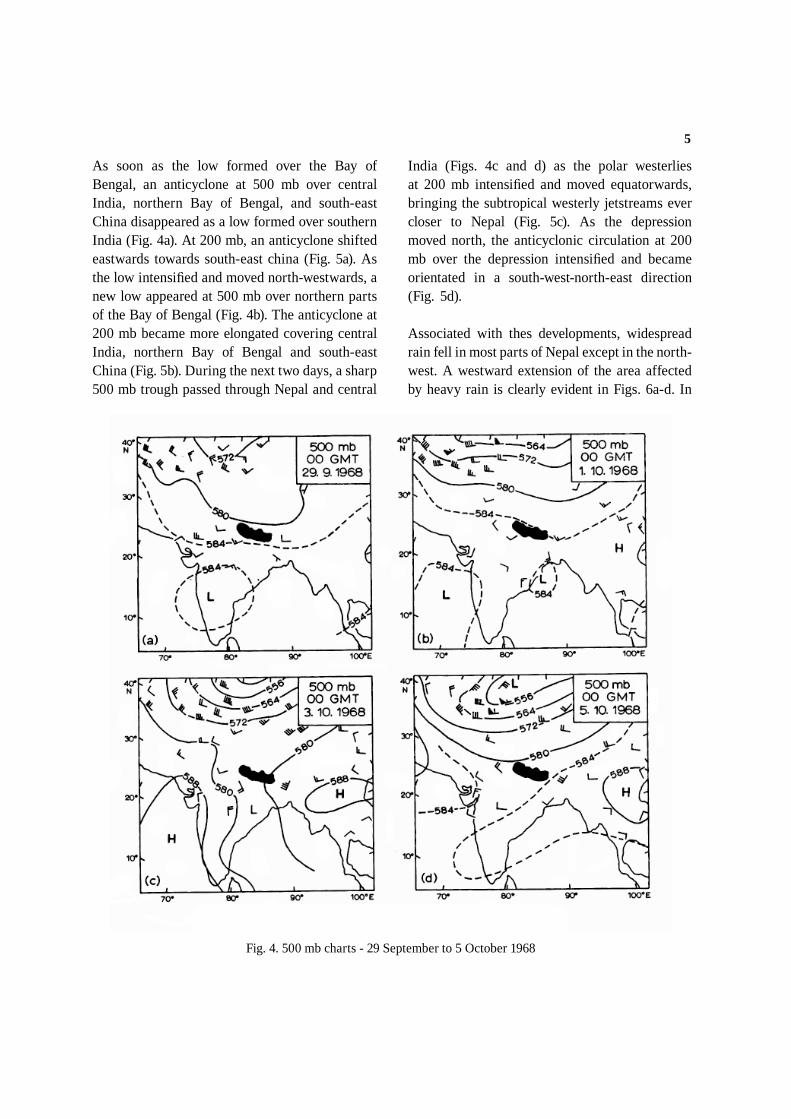
As soon as the low formed over the Bay of Bengal, an anticyclone at 500 mb over central India, northern Bay of Bengal, and south-east China disappeared as a low formed over southern India (Fig. 4a). At 200 mb, an anticyclone shifted eastwards towards south-east china (Fig. 5a). As the low intensi ed and moved north-westwards, a new low appeared at 500 mb over northern parts of the Bay of Bengal (Fig. 4b). The anticyclone at 200 mb became more elongated covering central India, northern Bay of Bengal and south-east China (Fig. 5b). During the next two days, a sharp 500 mb trough passed through Nepal and central
India (Figs. 4c and d) as the polar westerlies at 200 mb intensi ed and moved equatorwards, bringing the subtropical westerly jetstreams ever closer to Nepal (Fig. 5c). As the depression moved north, the anticyclonic circulation at 200 mb over the depression intensi ed and became orientated in a south-west-north-east direction (Fig. 5d).
Associated with thes developments, widespread rain fell in most parts of Nepal except in the north-west. A westward extension of the area affected by heavy rain is clearly evident in Figs. 6a-d. In
Fig. 4. 500 mb charts - 29 September to 5 October 1968

6
Fig. 5. 200 mb charts - 29 September to 5 October 1968
Fig. 6. Rain areas in Nepal - 29 September to 5 October 1968

7
TABLE 3. Daily rainfall at selected stations in Nepal on 4 October 1968
Station Rainfall (mm) % of 1968
rainfall
Station Rainfall (mm) % of 1968 rainfall
Taplejung 134 6 Kurleghat 83 9
Pangthandoma 160 9 Dhulikhel 221 12
Wallunchungola 159 8 Namchebazzar 115 11
Nepalthok 125 14 Pakarnas 135 6
Dhankuta 166 17 Kathmandu 80 6
Bhojpur 140 9 Jomosom 72 21
TABLE 4. Total rainfall at selected Nepalese stations during the period 1-7 October 1968
Station Rainfall (mm) % of 1968
rainfall
Station Rainfall (mm) % of 1968 rainfall
Taplejung 263 12 Kurleghat 188 20
Pangthandoma 307 17 Dhulikhel 240 13
Wallunchungola 313 16 Namchebazzar 219 20
Nepalthok 306 35 Pakarnas 281 14
Dhankuta 369 37 Kathmandu 132 9
Bhojpur 284 18 Jomosom 200 58
particular, rain fell heavily over eastern Nepal, because of strong orographic lifting of moist warm air. Table 3 shows that 10-20 percent of 1968 total rainfall fell at several stations on 4 October 1968. Rain also fell heavily in central northern parts of Nepal. For example, at Jomosom (28047 N,830 43 E) which is situated in the driest (under 250 yr-1) area of Nepal, a record 200mm (58 percent of the annual rainfall for 1968) fell during the period 1-7 October 1968. Over 300 mm were recorded at a number of places (Table 4).
This widespread rain, which caused serious ooding and loss of life in eastern Nepal, produced one of the wettest post-monsoon weeks ever recorded in Nepal. The total rainfall recorded at some stations during the rst week of October is listed in Table 4.
DISCUSSION
Some tentative conclusions may be made from this study:
(1) The exceptionally heavy rain recorded in Nepal during the post-monsoon season of 1968 was caused by a depression moving north-westwards and then northwards from the Bay of Bengal. Troughs at 500 mb over and near the country also appear to have an important effect on intensity of rainfall.
(2) Findings by other workers are supported in this study. Synoptic features which are most marked below about 500 mb seem to have the most direct effect upon distribution of rainfall (cf. Raghavan (1973)). Although

8
here data are few, convergence below 500 mb superposed by divergence at 200 mb would appear to be the main mechanism by the heavy rains, The circulation in the upper troposphere contributes to the generation and intensi cation of the depression as well as to its movement (Koteswaram and George 1958); the life times of major rainfall- producing features are of the order of four to ve days and their horizontal scale is about 1000-3000 km (Murakami 1974). Orography and local convection are also important determinants of rainfall (Ramage 1971).
(3) Precipitation release by depressions is more marked over eastern and central Nepal than in western parts of the country. The paucity of rainfall over western Nepal during this study period is dif cult to explain because of a lack of data.
ACKNOWLEDGEMENTS
The author wishes to express his thanks to the Department of Irrigation and Meteorology, Kathmandu, for supplying the necessary rainfall data, and special thanks go to Dr. E.T. Stringer and Dr. M.G. Hamilton, University of Birmingham, for offering their useful comments and suggestions.
REFERENCES
Das,P.K 1968 The monsoons, Edward Arnold Ltd, London, 162 pp.
Dhar. O.N. 1960 The diurnal variation of rainfall at Barakshetra and Kathmandu during monsoon months. Ind. J. Meteor. Geophys., 11, pp. 153-56
Koteswaram, P. and George, C.A.1958 A case study of monsoon depression in the Bay of Bengal. Monsoons of the World, New Delhi, pp. 145-56
Mooley, D.A. 1973 Some aspects of Indian monsoon depressions and the associated rainfall. Mon. Wea. Rev., 101, pp. 271-80
Murakami, T. 1974 Steady and transient waves excited by diabatic heat sources during the summer monsoon. J. Atmos.Sci., 31, pp. 340-57
Raghavan, K. 1973 Break-monsoon over India. Mon. Wea. Rev., 101, pp. 33-43
Ramage, C.S. 1971 Monsoon meteorology.
Academic Press, London, 296 pp.
Rao, Y.P and Desai,B.N. 1973 The Indian summer monsoon. Meteor. Geophys. Rev., No.4, pp. 1-18

9
Climates of Nepal*
Introduction
This is an attempt to classify the climate of Nepal on the basis of Thornthwaite's classi cation of climates. Among the various climatic elements, temperature and precipitation are of prime importance in classifying the world into climatic zones. Many writers have classi ed the world into different climatic zones using various climate elements. Among these Koppen's and Thornthwaite's classi cation have been widely accepted. Broadly their classi cations are both based on average values of temperature and precipitation, but Koppen's classi cation leaves undecided the problem of when the mountain climate exists. As Nepal is predominantly a mountainous country (Fig.1), Thornthwaite's rst classi cation is used to delimit climatic zones in Nepal. Temperature and precipitation data for Nepal for the period 1965-1969 have been used to produce a series of different climates zone. A longer period of data is not available.
Theoretically, Thornthwaite's rst classi cation of Climates is based on the following principles.1
(a) Thermal ef ciency ratio: T/E ratio = 4
32T
when T is the average temperature for a particular month. (0F.)
(b) Thermal ef ciency T/E index = Sum of the twelve monthly T/E ratios.
(c) Determination of P/E index for stations without evaporation data
P/E index = when T is the temperature in 0F and P is precipitation in inches.
These two ratios give a series of climatic zones as shown in the following Tables 1 and 2.
Table 1. Temperature Province and the ratio of thermal ef ciency index.
Temperature Province T/E index
A' (Tropical) 128 and above
B' (Mesothhermal) 64-127
C' (Microthermal) 32-63
D' (Taiga) 16-31
E' (Tundra) 1-15
F' (Frost) 0
Janak L. Nayava **
* This article was published in the Himalayan Review, Vol. VII, 1975** The author wishes to thank Dr. E. T. Stringer of the University of Birmingham for going through
the manuscript & offering his friendly advice. Thanks to Act. Director General, Mr. B. K Pradhan, Department of Irrigation, Hydrology and Meteorology for giving me a permission to publish this article.
1. C.W. Thornthwaite, "The climates of North America according to new classi cation," Geogr. Review, vol, XXXI (1931), pp 633-655.
The Himalayan ReviewNepal Geographical Society
12
1
910
10TP115
10
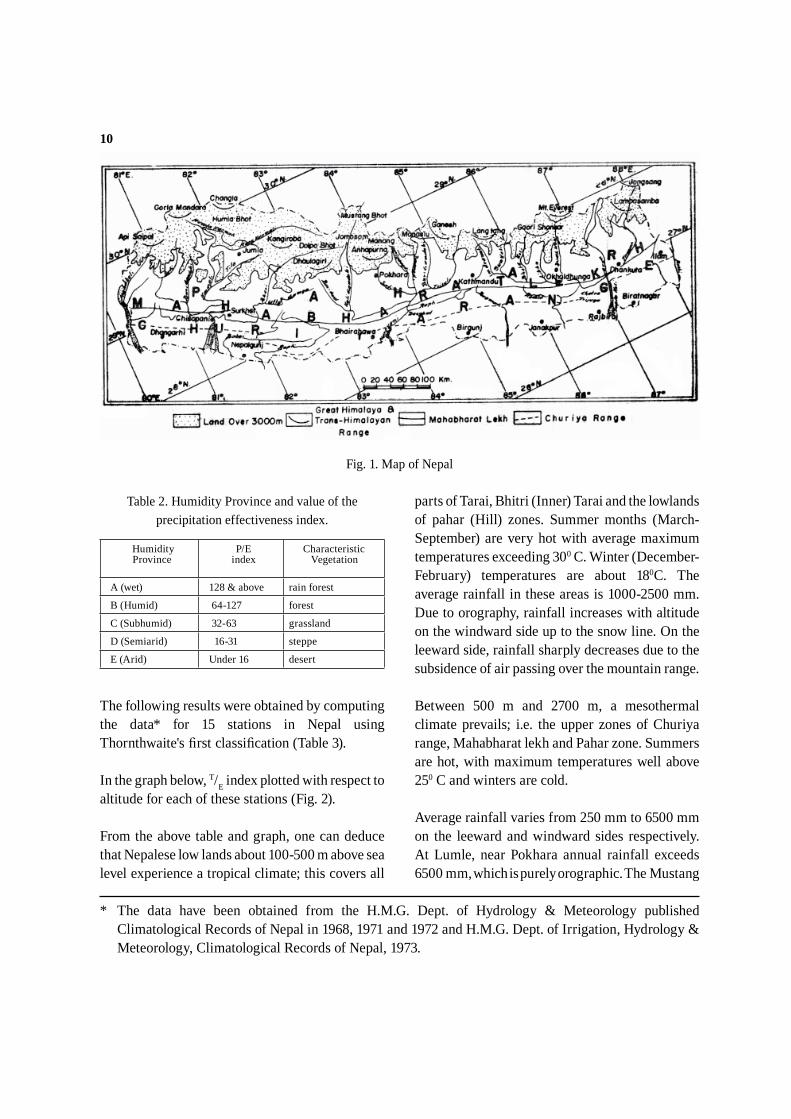
Fig. 1. Map of Nepal
Table 2. Humidity Province and value of the precipitation effectiveness index.
Humidity Province
P/E index
Characteristic Vegetation
A (wet) 128 & above rain forest
B (Humid) 64-127 forest
C (Subhumid) 32-63 grassland
D (Semiarid) 16-31 steppe
E (Arid) Under 16 desert
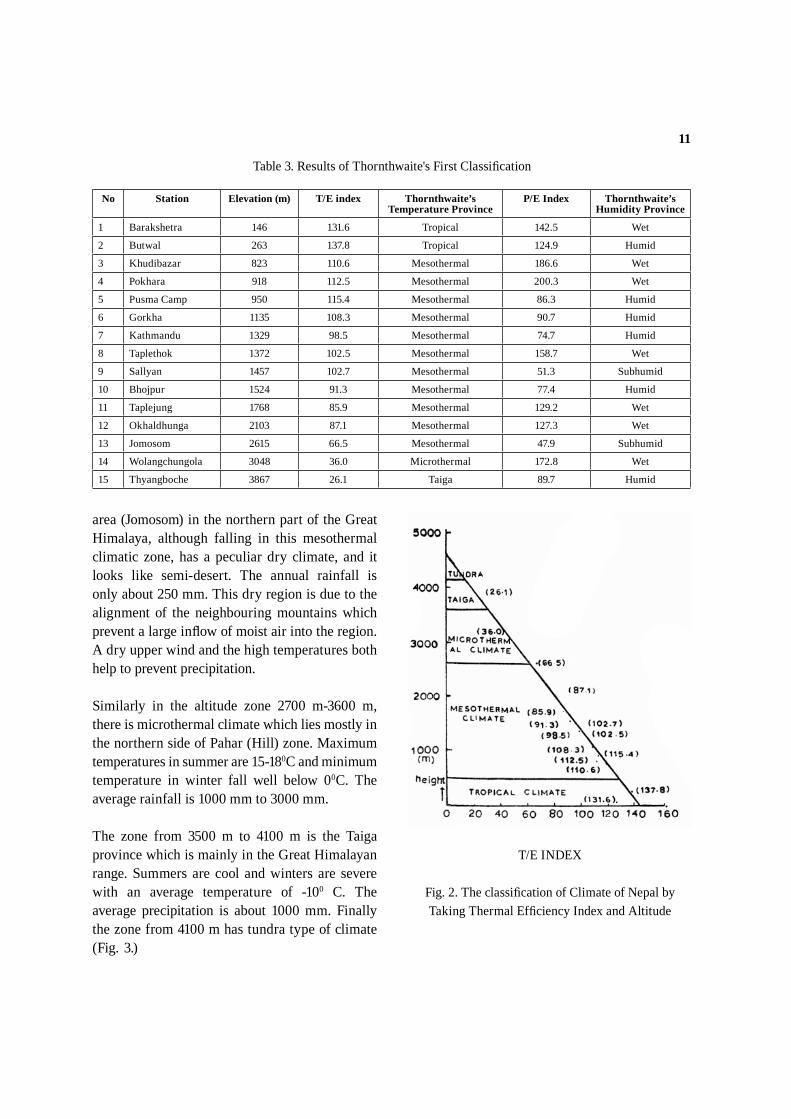
The following results were obtained by computing the data* for 15 stations in Nepal using Thornthwaite's rst classi cation (Table 3).
In the graph below, T/E index plotted with respect to altitude for each of these stations (Fig. 2).
From the above table and graph, one can deduce that Nepalese low lands about 100-500 m above sea level experience a tropical climate; this covers all
parts of Tarai, Bhitri (Inner) Tarai and the lowlands of pahar (Hill) zones. Summer months (March-September) are very hot with average maximum temperatures exceeding 300 C. Winter (December-February) temperatures are about 180C. The average rainfall in these areas is 1000-2500 mm. Due to orography, rainfall increases with altitude on the windward side up to the snow line. On the leeward side, rainfall sharply decreases due to the subsidence of air passing over the mountain range.
Between 500 m and 2700 m, a mesothermal climate prevails; i.e. the upper zones of Churiya range, Mahabharat lekh and Pahar zone. Summers are hot, with maximum temperatures well above 250 C and winters are cold.
Average rainfall varies from 250 mm to 6500 mm on the leeward and windward sides respectively. At Lumle, near Pokhara annual rainfall exceeds 6500 mm, which is purely orographic. The Mustang
* The data have been obtained from the H.M.G. Dept. of Hydrology & Meteorology published Climatological Records of Nepal in 1968, 1971 and 1972 and H.M.G. Dept. of Irrigation, Hydrology & Meteorology, Climatological Records of Nepal, 1973.
11
Table 3. Results of Thornthwaite's First Classi cation
No Station Elevation (m) T/E index Thornthwaite’s Temperature Province
P/E Index Thornthwaite’s Humidity Province
1 Barakshetra 146 131.6 Tropical 142.5 Wet
2 Butwal 263 137.8 Tropical 124.9 Humid
3 Khudibazar 823 110.6 Mesothermal 186.6 Wet
4 Pokhara 918 112.5 Mesothermal 200.3 Wet
5 Pusma Camp 950 115.4 Mesothermal 86.3 Humid
6 Gorkha 1135 108.3 Mesothermal 90.7 Humid
7 Kathmandu 1329 98.5 Mesothermal 74.7 Humid
8 Taplethok 1372 102.5 Mesothermal 158.7 Wet
9 Sallyan 1457 102.7 Mesothermal 51.3 Subhumid
10 Bhojpur 1524 91.3 Mesothermal 77.4 Humid
11 Taplejung 1768 85.9 Mesothermal 129.2 Wet
12 Okhaldhunga 2103 87.1 Mesothermal 127.3 Wet
13 Jomosom 2615 66.5 Mesothermal 47.9 Subhumid
14 Wolangchungola 3048 36.0 Microthermal 172.8 Wet
15 Thyangboche 3867 26.1 Taiga 89.7 Humid
area (Jomosom) in the northern part of the Great Himalaya, although falling in this mesothermal climatic zone, has a peculiar dry climate, and it looks like semi-desert. The annual rainfall is only about 250 mm. This dry region is due to the alignment of the neighbouring mountains which prevent a large in ow of moist air into the region. A dry upper wind and the high temperatures both help to prevent precipitation.
Similarly in the altitude zone 2700 m-3600 m, there is microthermal climate which lies mostly in the northern side of Pahar (Hill) zone. Maximum temperatures in summer are 15-180C and minimum temperature in winter fall well below 00C. The average rainfall is 1000 mm to 3000 mm.
The zone from 3500 m to 4100 m is the Taiga province which is mainly in the Great Himalayan range. Summers are cool and winters are severe with an average temperature of -100 C. The average precipitation is about 1000 mm. Finally the zone from 4100 m has tundra type of climate (Fig. 3.)
T/E INDEX
Fig. 2. The classi cation of Climate of Nepal by Taking Thermal Ef ciency Index and Altitude

12
2. C.W. Thonthwaite, "Problems in the classi cation of climates," Geogr, Rev., XXXIII pp.233-255.3. C.W. Thornthwaite. "An approach toward rational classi cation of climate, Geogr. Rev., XXXVIII
(1948), pp.55-94.
The above mentioned heights for the climatic boundaries are very tentative. The practice of locating the boundaries of commonly recognized climatic types by referring to distribution of vegetation, soils and other natural features in no way argues against the reality of the types or of boundaries. If the classi cation is to extend to the microclimatic scale, as it must be of practical value in agriculture and biological problems, it must also take into consideration of the variation with height, diurnal march of temperature and frequency of precipitation of varying intensity and amount, evaporation from soil, atmospheric moisture
Fig. 3. Classi cation of the Climate of Nepal
and wind velocity in the zone where the plant actually live.2 Additionally, Thornthwaite (1948) emphasized that evapotranspiration is an important climatic factor for the classi cation of climatic zones.3
Conclusion
This paper shows that it is possible to derive a classi cation of the climate of Nepal using. Thornthwaite's model. This result so obtained suggests that further research along these lines could be of economic value for the execution of Nepalese ve-years plans.
13
* This article was published in Proceedings of Tenth New Zealand Geography Conference and Forty-Ninth Anzaas Congress, 1979, pp 33-38.
This study of topoclimate is concerned mainly with the Kathmandu valley. The region was selected because
agroclimatological stations, six rainfall stations and one radiosonde station. The location, elevation and date of establishment of the meteorological stations are shown in Table I. In addition to the existing stations, there were a few meteorological stations operating for short periods from which the data has been published (Department of Irrigation, Hydrology and Meteorology 1977 b.) The climate of Kathmandu Valley has been studied by Malla (1968), Department of Housing and Physical Planning (1968) and Binnie and partners (1973).
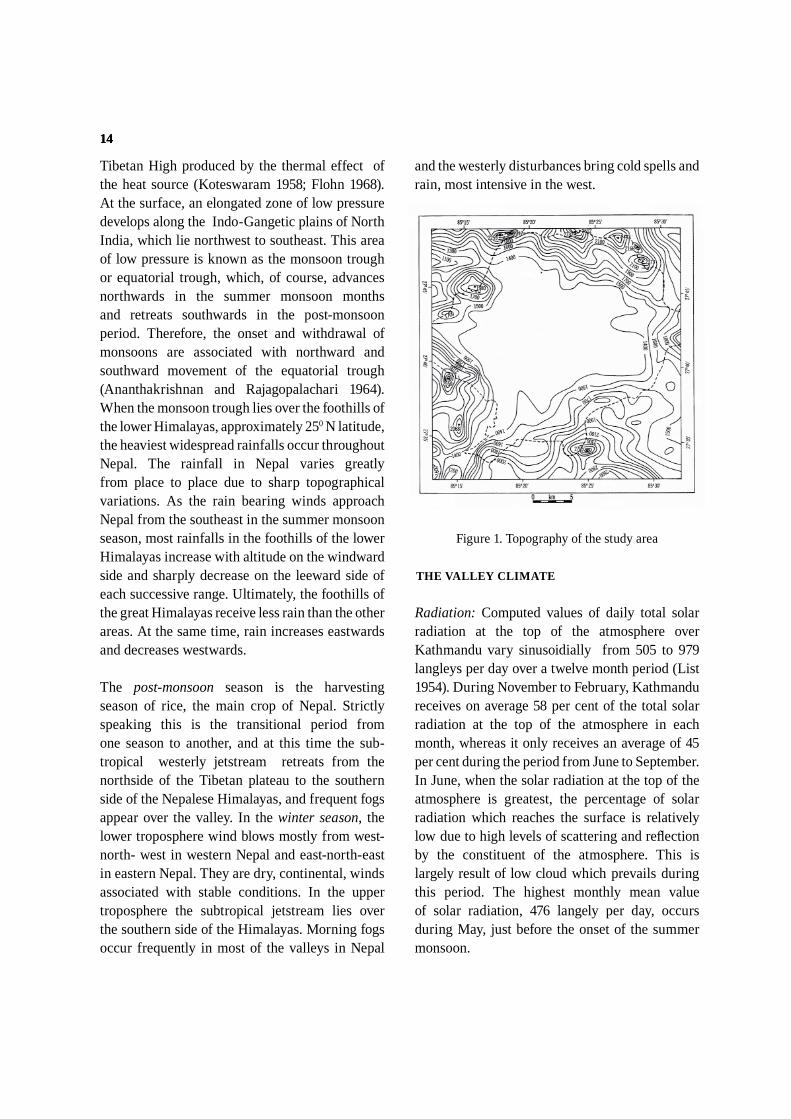
The topographic relief of the study area (Figure 1) is based on 35×35 grid points, extracted from the Nepal 1: 63360 scale map published by the Surveyor General of India, 1957. The grid points which are separated by 900 m, were analyzed by the computer programme CONOMAP to produce a weighted second degree polynomial surface. The program was written by Ingram for the CDC 6400 and Benson Lehner plotting system at Mc Master University. Canada and was converted to the Univac 1108 and Calcomp 565 plotting system by Bryant at Australian National University (Ingram and Bryant 1974). The boundary line of the catchment area of Kathmandu valley was determined from the 1:63 360 scale map with a contour interval of 100 feet (30.48 m). The catchment drains the valley through a small gorge (Chobhar) in the south west. Use of the map based on 35×35 grid points has resulted in the exclusion of a small area in the west. Most of the results of this topoclimatological study are mapped using the grid line intersections.
Topoclimatology of the Kathmandu Valley*
GENERAL FEATURES OF THE ATMOSPHERIC CIRCULATION OVER NEPAL
Studies of lower and upper tropospheric atmospheric circulation in Nepal suggests that rain falls within four distinct seasons (Nayava 1974) ; pre-monsoon (March to May); Summer monsoon (June to September); post monsoon (October); and winter (November to February). In the pre-monsoon season, moderate to strong westerly winds prevail throughout Nepal. Scattered rainfall occurs during this period and there is a marked increase in temperature of about 3-40 C in the month of March. Due to outbreaks of warm air and
atmospheric instability, the sub-tropical jetstream weakens over Nepal. As summer approaches fogs become less frequent in the valley and haze predominates from the southern to the middle regions of Nepal. The summer monsoon is the most important season in Nepal for agriculture with nearly 80 to 90 per cent of the annual precipitation falling between June and September. During the summer monsoon, the easterly wave dominates the upper level of the atmosphere and the subtropical westerly jetstream shifts to the northern side of the Tibetan plateau, around an anticyclone called the
JANAK L. NAYAVA − Department of Geography, Australian National University, Canberra, ACT.
14 14
Tibetan High produced by the thermal effect of the heat source (Koteswaram 1958; Flohn 1968). At the surface, an elongated zone of low pressure develops along the Indo-Gangetic plains of North India, which lie northwest to southeast. This area of low pressure is known as the monsoon trough or equatorial trough, which, of course, advances northwards in the summer monsoon months and retreats southwards in the post-monsoon period. Therefore, the onset and withdrawal of monsoons are associated with northward and southward movement of the equatorial trough (Ananthakrishnan and Rajagopalachari 1964). When the monsoon trough lies over the foothills of the lower Himalayas, approximately 250 N latitude, the heaviest widespread rainfalls occur throughout Nepal. The rainfall in Nepal varies greatly from place to place due to sharp topographical variations. As the rain bearing winds approach Nepal from the southeast in the summer monsoon season, most rainfalls in the foothills of the lower Himalayas increase with altitude on the windward side and sharply decrease on the leeward side of each successive range. Ultimately, the foothills of the great Himalayas receive less rain than the other areas. At the same time, rain increases eastwards and decreases westwards.
The post-monsoon season is the harvesting season of rice, the main crop of Nepal. Strictly speaking this is the transitional period from one season to another, and at this time the sub-tropical westerly jetstream retreats from the northside of the Tibetan plateau to the southern side of the Nepalese Himalayas, and frequent fogs appear over the valley. In the winter season, the lower troposphere wind blows mostly from west-north- west in western Nepal and east-north-east in eastern Nepal. They are dry, continental, winds associated with stable conditions. In the upper troposphere the subtropical jetstream lies over the southern side of the Himalayas. Morning fogs occur frequently in most of the valleys in Nepal
and the westerly disturbances bring cold spells and rain, most intensive in the west.
Figure 1. Topography of the study area
THE VALLEY CLIMATE
Radiation: Computed values of daily total solar radiation at the top of the atmosphere over Kathmandu vary sinusoidially from 505 to 979 langleys per day over a twelve month period (List 1954). During November to February, Kathmandu receives on average 58 per cent of the total solar radiation at the top of the atmosphere in each month, whereas it only receives an average of 45 per cent during the period from June to September. In June, when the solar radiation at the top of the atmosphere is greatest, the percentage of solar radiation which reaches the surface is relatively low due to high levels of scattering and re ection by the constituent of the atmosphere. This is largely result of low cloud which prevails during this period. The highest monthly mean value of solar radiation, 476 langely per day, occurs during May, just before the onset of the summer monsoon.

15
Insolation: Solar radiation is estimated for 394 selected gird points by using the computer programme developed by Fleming (1971). The programme is designed to use the district average data for variables such as sunshine hours, precipitable moisture, latitude and longitude. The necessary average data are used from a single representative site, Tribhuwan International Airport, Kathmandu. At each selected grid point, the slope, aspect, and azimuth are determined and used in the programme. Fleming (1971) estimated solar radiation by adopting Monteith (1962) and Idso (1969, 1970) models combined wih Goodspeed's (1970) solar position programme. Goodspeed's de nes solar position as a vector and Fleming de nes slopes in terms of the normal incidence vector. The combined programme of Fleming (1971) estimates mean monthly value of both clear day and average solar radiation for the horizontal and inclined surfaces. The value of solar radiation is calculated for the middle of each month which is considered as the mean value for a particular month.
Table 1Current Meteorological Stations Operating In Kathmandu Valley
No. Elev. m
Lat. Long Deg. Min
Date Est.
Type of Stations
1052 Bhaktapur 1330 2740-8526 May 1971 Rainfall
1022 Godavari 1400 2736-8523 May 1952 A/C*
1030 Tribhuwan Int’l Airport Kathmandu 1336 2742-8522 Sep 1967 Synoptic
1014 Indian Embassy (Kathmandu) 1324 2743-8519 Oct 1879 A/C*
1039 Pani Pokhari (Kathmandu) 1335 2744-8520 Apr 1971 A/C*
1029 Khumaltar 1350 2739-8520 May 1967 A/C*
1043 Nagarkot 2150 2742-8531 May 1971 A/C*
1035 Saankhu 1463 2745-8525 Sep 1970 Rainfall
1012 Sundarijal Power House 1364 2745-8525 May 1940 Rainfall
1013 Sundarijal Reservoir 1576 2745-8525 May 1940 Rainfall
1015 Thankot 1630 2742-8513 Sep 1966 Rainfall
1056 Tokha 1790 2747-8521 Dec 1972 Rainfall
Calculation of clear day radiation follows the model of Idso (1969, 1970). The transmittance of an atmosphere which plays an important role in solar radiation calculation, is caused by scattering by water vapor, scattering by dust free atmosphere, absorption by water vapour and
Figure 2. Clear day global solar radiation (ly/day) January.
* Agroclimatological station.

16 16
absorption by dust. The cumulative transmittance is made up form separate calculations for each of the above components. The principal effects are derived from water vapour and dust. There are at present no precipitabler water data for Kathmandu, since regular radiosonde ascents only commenced in 1977. The annual cycle of precipitable water was estimated by linear relationship proposed by Spencer (1965) for Australia as follows:
u = pe (1)
Where u is precipitable water content in mm; e is surface vapour pressure in mb: p is a local constant. Spencer suggests that p=1.0 for Australian data and in this programme p=1.0 is used although p and e can be evaluated by further experimental evidence.
Atmospheric dust factors can be derived from atmospheric turbidity measurements which also were not available. However, the monthly dust factor was estimated by comparison with the observed and estimated global solar radiation at Kathmandu.
Figure 3. Clear day global solar radiation (ly/day) July.
Month J F M A M J J A S
Dust factor 1.0 1.5 2.5 3.0 2.5 1.5 1.0 1.0 1.0
Month 0 N D
Dust factor 1.0 1.0 1.0
Nn)'b1('a
0
(2)
Where, Q = total global solar radiation received at
the earth's surface, Qo = total global solar radiation on a clear
day at the surface,n = actual duration of sunshine,N = Maximum possible duration of
sunshine,a' = constant (=ratio Q/Qo on overcast
day)b' = constant (= ratio 1-a', since Q=Qo on
a cloudless day)
The values of estimated global solar radiation for horizontal and inclined surfaces for 394 grids points on clear days over Kathmandu Valley in January and July are shown in Figures 2 and 3. Insolation on a clear day in January varies from 200 to 550 langleys per day depending on slope, aspect and elevation. In July, it varies only from 600 to 694 langleys per day on a clear day, whereas average estimated insolation during these two months in Tribhuwan International Airport, Kathmandu are about 324 and 446 langleys per day.
Temperature: At Kathmandu, summers are hot with the temperature occasionally rising above 300C. Winter are cold with early morning temperatures
Because of the necessity to combine the direct and diffuse radiation receipt on inclined surfaces, modi cation of the Angström formula is used, based on the work of Hounam (1963) expressed as:

17
frequently falling below freezing point. Mean temperatures range from 9.40C in January to 23.40C in July, with a mean annual temperature of 17.50C which varied between 17.40C to 17.90C during the nine years of records from 1968-1976 at Tribhuwan International Airport, Kathmandu. The diurnal range during the period from November to May is greater than the annual range. Mean daily maxima vary between 15.40C in January and 29.30C in May. Similarly, mean daily minima range from 1.90C in December and 20.20C in July. The extreme maximum temperature during the period of record was 33.00C which occurred on 12 June, 1972 and the extreme minimum temperature was -2.30C on 15 January 1969 and 13 January 1970. During the summer monsoon, the mean maximum and mean minimum temperatures are almost uniform, between 26.00C to 27.50C and 18.00C to 20.00C (Figure 4).
Figure 4. Mean monthly temperature and precipitation at Kathmandu 1968-1976.
Comparing the above temperatures with the Kathmandu Indian Embassy where data is available for a longer period (1901-1975) mean daily maxima are 3.20C higher in January and
0.20C higher in May for the same period and the mean daily minima 1.90C falls in January instead of December. However, comparing the nine year data with the 75 year data at the same station, mean daily maxima are 0.40C higher in January and 1.00C lower in May. Mean daily minima are approximately the same. The extreme maximum temperature during 1901-1975 was 37.80C on 2 June, 1958 and the extreme minimum temperature was -3.90C on 16 January 1964.
Thirsty-six meteorological stations, recording temperature throughout Nepal were used to develop equations to predict maximum and minimum temperature at the gird intersections in the Kathmandu valley. The period 1970-1975 was chosen to maximise the number of available temperature records. Multiple regression was used to determine the best equations to represent the mean monthly maximum and minimum temperatures. The dependent variables considered were latitude, longitude, elevation and cloudiness index. Three models were developed, all giving satisfactory results. One model accounts for latitude, longitude, elevation and rain as the cloudiness index, the second model considers latitude, longitude and elevation and the last model, elevation is the sole dependent variable. The percentage of variance expressed by the regression are not signi cantly different among the three models except in the case of the regression between elevation and minimum temperature in the winter months, where the variance explained is slightly lower. Since the latitude and longitude are not very different in the Kathmandu valley, the last model was adopted for further study of temperature distribution in Kathmandu valley.
Annual mean temperature decreases by about 50C per kilometer with increasing elevation in the Kathmandu valley. It is well known that temperature varies not only with altitude, but also with many mesoscale factor such as slope, aspect,
18 18
exposure and wind. Though the temperature distribution for the valley is estimated from a linear regression model based on elevation, the estimated temperatures are in good agreement with most of the observed data with the exception of the valley oor where estimated minimum temperatures 1-20C higher than the observed values.
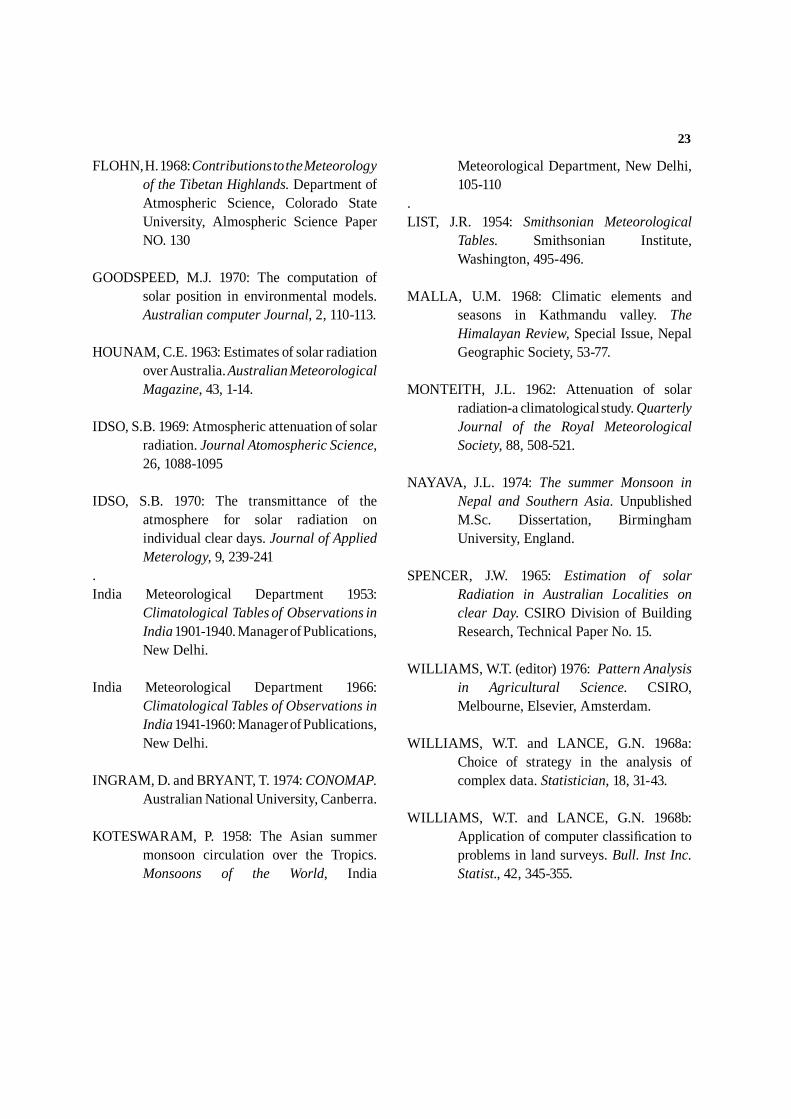
Table 2Per Cent of Seasonal Rainfall In Kahtmadu (T.A)
Year Pre-monsoon
rainfall
Monsoon
Rainfall
Post-monsoon
rainfall
Winter
rainfall
Total
1968 180.4 1000.3 160.4 38.6 1379.7
1969 161.9 965.0 40.3 12.0 1179.0
1970 154.6 1081.6 56.2 67.9 1362.3
1971 318.9 1101.7 81.2 9.5 1511.3
1972 160.8 968.0 86.1 46.5 1261.4
1973 154.9 1454.0 119.3 71.6 1799.8
1974 162.2 983.2 45.6 34.0 1225.0
1975 119.2 1221.1 34.2 56.0 1430.5
1976 222.0 1199.0 24.3 44.7 1490.6
181.7 1108.3 72.2 42.3 1404.4
(13%) (79%) (5%) (3%)
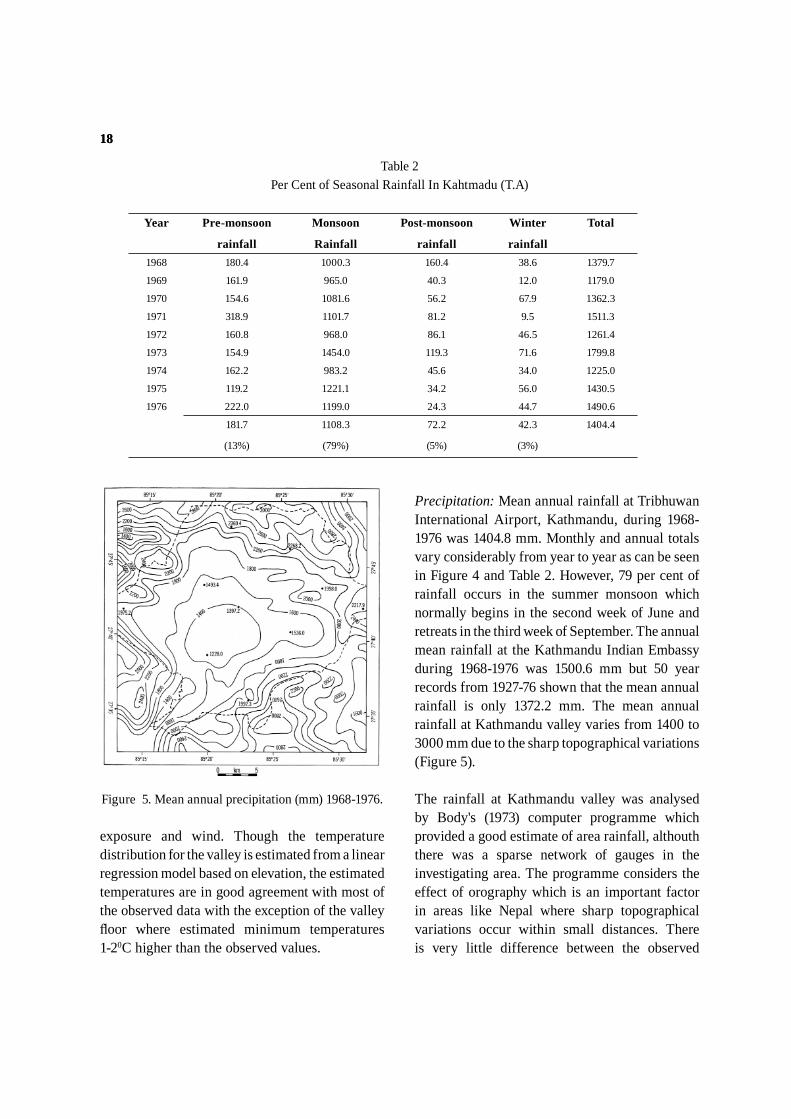
Precipitation: Mean annual rainfall at Tribhuwan International Airport, Kathmandu, during 1968-1976 was 1404.8 mm. Monthly and annual totals vary considerably from year to year as can be seen in Figure 4 and Table 2. However, 79 per cent of rainfall occurs in the summer monsoon which normally begins in the second week of June and retreats in the third week of September. The annual mean rainfall at the Kathmandu Indian Embassy during 1968-1976 was 1500.6 mm but 50 year records from 1927-76 shown that the mean annual rainfall is only 1372.2 mm. The mean annual rainfall at Kathmandu valley varies from 1400 to 3000 mm due to the sharp topographical variations (Figure 5).
The rainfall at Kathmandu valley was analysed by Body's (1973) computer programme which provided a good estimate of area rainfall, althouth there was a sparse network of gauges in the investigating area. The programme considers the effect of orography which is an important factor in areas like Nepal where sharp topographical variations occur within small distances. There is very little difference between the observed
Figure 5. Mean annual precipitation (mm) 1968-1976.
19
station rainfall and the rainfall interpolated from the computer produced isohyets, with the one exception of the rainfall station at Tokha, althouth the quality of the observed rainfall data here is poor. The highest daily rainfall recorded during the last 56 years was 173.2 mm on 27th July, 1954. Snow has been observed only on the surrounding peaks of the Kathmandu Valley. The average mean snow line in Nepal is about 6000 m above sea level.
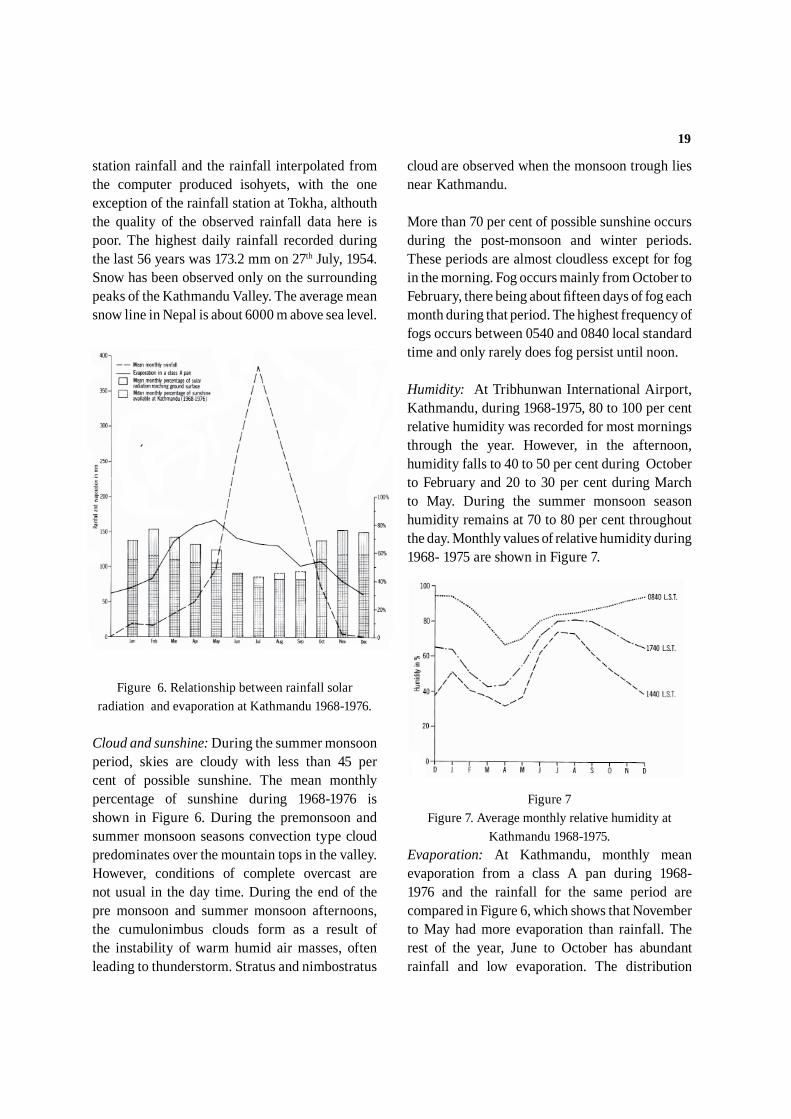
Figure 6. Relationship between rainfall solar radiation and evaporation at Kathmandu 1968-1976.
Cloud and sunshine: During the summer monsoon period, skies are cloudy with less than 45 per cent of possible sunshine. The mean monthly percentage of sunshine during 1968-1976 is shown in Figure 6. During the premonsoon and summer monsoon seasons convection type cloud predominates over the mountain tops in the valley. However, conditions of complete overcast are not usual in the day time. During the end of the pre monsoon and summer monsoon afternoons, the cumulonimbus clouds form as a result of the instability of warm humid air masses, often leading to thunderstorm. Stratus and nimbostratus
cloud are observed when the monsoon trough lies near Kathmandu.
More than 70 per cent of possible sunshine occurs during the post-monsoon and winter periods. These periods are almost cloudless except for fog in the morning. Fog occurs mainly from October to February, there being about fteen days of fog each month during that period. The highest frequency of fogs occurs between 0540 and 0840 local standard time and only rarely does fog persist until noon.
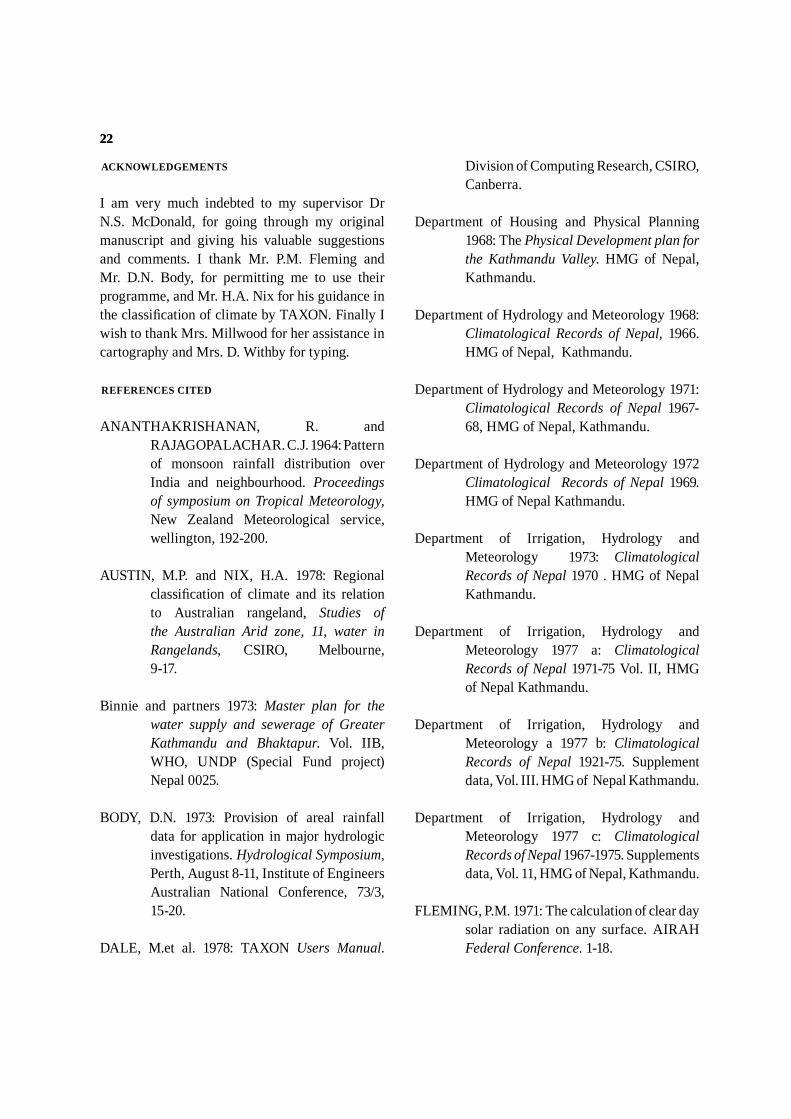
Humidity: At Tribhunwan International Airport, Kathmandu, during 1968-1975, 80 to 100 per cent relative humidity was recorded for most mornings through the year. However, in the afternoon, humidity falls to 40 to 50 per cent during October to February and 20 to 30 per cent during March to May. During the summer monsoon season humidity remains at 70 to 80 per cent throughout the day. Monthly values of relative humidity during 1968- 1975 are shown in Figure 7.
Figure 7Figure 7. Average monthly relative humidity at
Kathmandu 1968-1975.Evaporation: At Kathmandu, monthly mean evaporation from a class A pan during 1968-1976 and the rainfall for the same period are compared in Figure 6, which shows that November to May had more evaporation than rainfall. The rest of the year, June to October has abundant rainfall and low evaporation. The distribution

20 20
of potential evapotranspiration is also studied using a single representative site, Tribhuwan International Airport, Kathmandu, which has fully equipped meteorological station. Potential evapotranspiration for 1975 was calculated by Penman's method. The linear regression model between calculated potential evapotranspiration and calculated global solar radiation is derived for the representative site and gave a correlation coef cient for the regression of 0.91. The derived model is used to obtain the variation of potential evapotranspiration using calculated global solar radiation for 394 grid points in the Kathmandu Valley, assuming wind speed to be constant at all the points.
The computed distribution and variation of average potential evapotranspiration over Kathmandu Valley in January and July are shown in Figures 8 and 9. The potential evapotrnspiration in January varies from 0.0 to 90.0 mm depending upon slope, aspect and elevation. In July, potential evapotranspiration is relatively constant over the whole valley with values in the range from 80.0 to 96.0 mm per month.
Figure 8. Potential evapotranspiration (mm) January.
CLASSIFICATION OF CLIMATE
The major climate elements of monthly average global solar radiation, precipitation and maximum and minimum temperature were selected for the same 394 sampled grid points to provide the basis for a topoclimatological study of the valley and adjacent slopes by the computer programme TAXON. The classi cation program MULCLAS was used to sort out the most similar points in group to produce a dendogram showing the relative degree of similarity between individual points and groups of individual points. Detailed information on these techniques can be found in Williams and Lance (1968 a,b), Williams (1976), Austin and Nix (1978) and Dale et al. (1978).
A dendogram of 15 groups, as shown in Figure 10, is developed using the MULCLAS classi cation of 394 grid points with 48 attributes (12 attributes each from mean monthly insolation, precipitation, maximum and minimum temperature). Four major groups can be separated from the dendogram to classify the climates of the Kathmandu valley (Figure 11). The valley oor and mountain top, the south facing slopes , the north facing slopes, and the north facing steep slopes can be classi ed as humid, subhumid, wet or wettest zones of the Kathmandu valley. It is interesting to note that global solar radiation plays a dominant role in the classi cation of the climates of Kathmandu valley.
CONCLUSION
The monthly mean insolation, precipitation, and maximum and minimum temperature were estimated for a grid net using a large number of grid points, (394 in most cases) to study the topoclimatology of Kathmandu Valley. Each grid point, therefore, is representative of approximately 1.5 km2, whereas the of cial stations cover larger areas. The estimation procedures used regression methods and theoretical models as described earlier,

21
and took into account all available data. The main source of observed data was from the Department of Hydrology and Meteorology (Department of Irrigation, Hydrology and Meteorology 1968, 1971, 1972; Department of Irrigation, Hydrology and meteorology 1977 a,b,c).
Figure. 9. Potential evapotranspiration (mm) July.
Considering global solar radiation to be the primary factor, the climate of the slopes can be studied by an examination of radiation distribution on slopes of varying aspect. Wind is also an important factor because it affects the distribution of rainfall as well as temperature. Basically, the valley is calm and less windy than the surrounding peaks and ridges, where with an increased wind speed, a greater proportion of the available radiant energy is used for evaporation and heating of the air.
This mesoscale classi cation of climate and the grid point data will be used further in crop model studies in the Kathmandu valley. On a broad scale, these analyses will assist in understanding climate and crop relations, so that better agricultural planning and implementation can be achieved in Nepal.
Figure 10. Dendogram
Figure 11. Classi cation of climates in mesoscale.
22 22
ACKNOWLEDGEMENTS
I am very much indebted to my supervisor Dr N.S. McDonald, for going through my original manuscript and giving his valuable suggestions and comments. I thank Mr. P.M. Fleming and Mr. D.N. Body, for permitting me to use their programme, and Mr. H.A. Nix for his guidance in the classi cation of climate by TAXON. Finally I wish to thank Mrs. Millwood for her assistance in cartography and Mrs. D. Withby for typing.
REFERENCES CITED
ANANTHAKRISHANAN, R. and RAJAGOPALACHAR. C.J. 1964: Pattern of monsoon rainfall distribution over India and neighbourhood. Proceedings of symposium on Tropical Meteorology, New Zealand Meteorological service, wellington, 192-200.
AUSTIN, M.P. and NIX, H.A. 1978: Regional classi cation of climate and its relation to Australian rangeland, Studies of the Australian Arid zone, 11, water in Rangelands, CSIRO, Melbourne, 9-17.
Binnie and partners 1973: Master plan for the water supply and sewerage of Greater Kathmandu and Bhaktapur. Vol. IIB, WHO, UNDP (Special Fund project) Nepal 0025.
BODY, D.N. 1973: Provision of areal rainfall
data for application in major hydrologic investigations. Hydrological Symposium, Perth, August 8-11, Institute of Engineers Australian National Conference, 73/3, 15-20.
DALE, M.et al. 1978: TAXON Users Manual.
Division of Computing Research, CSIRO, Canberra.
Department of Housing and Physical Planning 1968: The Physical Development plan for the Kathmandu Valley. HMG of Nepal, Kathmandu.
Department of Hydrology and Meteorology 1968: Climatological Records of Nepal, 1966. HMG of Nepal, Kathmandu.
Department of Hydrology and Meteorology 1971: Climatological Records of Nepal 1967-68, HMG of Nepal, Kathmandu.
Department of Hydrology and Meteorology 1972 Climatological Records of Nepal 1969. HMG of Nepal Kathmandu.
Department of Irrigation, Hydrology and Meteorology 1973: Climatological Records of Nepal 1970 . HMG of Nepal Kathmandu.
Department of Irrigation, Hydrology and Meteorology 1977 a: Climatological Records of Nepal 1971-75 Vol. II, HMG of Nepal Kathmandu.
Department of Irrigation, Hydrology and Meteorology a 1977 b: Climatological Records of Nepal 1921-75. Supplement data, Vol. III. HMG of Nepal Kathmandu.
Department of Irrigation, Hydrology and Meteorology 1977 c: Climatological Records of Nepal 1967-1975. Supplements data, Vol. 11, HMG of Nepal, Kathmandu.
FLEMING, P.M. 1971: The calculation of clear day solar radiation on any surface. AIRAH Federal Conference. 1-18.
23
FLOHN, H. 1968: Contributions to the Meteorology of the Tibetan Highlands. Department of Atmospheric Science, Colorado State University, Almospheric Science Paper NO. 130
GOODSPEED, M.J. 1970: The computation of solar position in environmental models. Australian computer Journal, 2, 110-113.
HOUNAM, C.E. 1963: Estimates of solar radiation over Australia. Australian Meteorological Magazine, 43, 1-14.
IDSO, S.B. 1969: Atmospheric attenuation of solar radiation. Journal Atomospheric Science, 26, 1088-1095
IDSO, S.B. 1970: The transmittance of the atmosphere for solar radiation on individual clear days. Journal of Applied Meterology, 9, 239-241
.India Meteorological Department 1953:
Climatological Tables of Observations in India 1901-1940. Manager of Publications, New Delhi.
India Meteorological Department 1966: Climatological Tables of Observations in India 1941-1960: Manager of Publications, New Delhi.
INGRAM, D. and BRYANT, T. 1974: CONOMAP. Australian National University, Canberra.
KOTESWARAM, P. 1958: The Asian summer monsoon circulation over the Tropics. Monsoons of the World, India
Meteorological Department, New Delhi, 105-110
.LIST, J.R. 1954: Smithsonian Meteorological
Tables. Smithsonian Institute, Washington, 495-496.
MALLA, U.M. 1968: Climatic elements and seasons in Kathmandu valley. The Himalayan Review, Special Issue, Nepal Geographic Society, 53-77.
MONTEITH, J.L. 1962: Attenuation of solar radiation-a climatological study. Quarterly Journal of the Royal Meteorological Society, 88, 508-521.
NAYAVA, J.L. 1974: The summer Monsoon in Nepal and Southern Asia. Unpublished M.Sc. Dissertation, Birmingham University, England.
SPENCER, J.W. 1965: Estimation of solar Radiation in Australian Localities on clear Day. CSIRO Division of Building Research, Technical Paper No. 15.
WILLIAMS, W.T. (editor) 1976: Pattern Analysis in Agricultural Science. CSIRO, Melbourne, Elsevier, Amsterdam.
WILLIAMS, W.T. and LANCE, G.N. 1968a: Choice of strategy in the analysis of complex data. Statistician, 18, 31-43.
WILLIAMS, W.T. and LANCE, G.N. 1968b: Application of computer classi cation to problems in land surveys. Bull. Inst Inc. Statist., 42, 345-355.
24
Geography Department, The Australian National University, Canberra** (Manuscript received March 1980; revised June 1980)
ABSTRACT
A limited set of observations of total global radiation at Tribhuwan International Airport has been used to estimate the parameters in a computer model of radiation input to sloping surfaces. The computer model separates direct, diffuse and circumsolar diffuse components, and derives clear day radiation estimates for horizontal and
data to estimate average or mean monthly insolation on horizontal and sloping surfaces. The relative merits of extraterrestrial clear day, and average day radiation indices are discussed. Topographic data for the Kathmandu valley were used to estimate average slope and azimuth at a grid of 394 points. These slope data were input to the computer model and mean monthly isopleths of clear day and average day insolation plotted and discussed.
A TOPOCLIMATOLOGICAL INVESTIGATION OF SOLAR RADIATION IN THE KATHMANDU VALLEY, NEPAL*
INTRODUCTION
The global solar radiation received at any surface is the primary factor entering the heat budget of that
or the whole earth. The radiation received varies with latitude, time of day, aspect, slope, and time
in the transmissivity of the atmosphere. As solar radiation is measured over only a limited network world wide, and usually only on a horizontal surface, there are many techniques used to extrapolate radiation data. In Nepal there are only limited global solar radiation data for one site, Tribhuwan International Airport.
The spatial distribution of mean monthly total global solar radiation over Nepal has been estimated using correlation with sunshine hours, cloudiness and precipitation (Nayava, unpublished paper). At the mesoscale, local differences in solar radiation due to slope and aspect become important. There
are no observations of solar radiation input on inclined surfaces available in Nepal, however, and so methods of extrapolating the single horizontal surface observations are required.
This paper reports the results of applying a simple computer model of the atmosphere coupled with variants on the Angström equation to derive monthly indices of radiation on slopes relative to total global solar radiation on a horizontal surface. The indices are then used to transfer the single set of horizontal observations to a grid of points in the Kathmandu valley.
RADIATION ON INCLINED SURFACES RELATIVE TO HORIZONTAL SURFACES
The ratio of radiation input on an inclined surface to that on a horizontal surface, integrated over 24 hours, is termed the radiation index. The simplest index to derive is that from simple slope geometry
* This article was published in the Australian Meteorological Magazine Vol. 28, No. 2, June 1980, pp. 79-95** Currently at the Department of Irrigation, Hydrology and Meteorology, Kathmandu, Nepal
J.L. NAYAVA **
NAYAVA: SOLAR RADIATION IN THE KATHMANDU VALLEY, NEPAL 25 25
in the absence of an atmosphere. Calculations for such simple indices were discussed by Kondratyev and Manolova (1960) and Lee (1963).
Position on the globe does in uence the attenuation of the direct solar beam so that the intensity of the direct beam varies relatively over the day. Ohmura (1968) and Garnier and Ohmura (1968 a, b) proposed a method using observe atmospheric attenuation coef cients and integration of the direct component only to derive radiation indices. These indices were then applied to actual total global solar radiation observations on a horizontal surface to map variation in solar input. There are, however, problems of systematic bias if simple clear day transmission factors are used, particularly if the diffuse component is ignored, as was pointed out by Basnayake (1968). Schulze (1975) took a further step and derived empirical formulae under cloudless conditions that took into account both the direct and diffuse components.
Fleming (1971) has developed a computer program, which will be described in greater detail in the next section, aimed at overcoming most of these objections, for clear day conditions. A simple atmospheric model based on the work of Monteith (1962) and Idso (1969, 1970) is used to derive instantaneous values of direct, circumsolar diffuse, and uniform diffuse radiation on clear days and integrates them for horizontal and inclined surfaces. Later developments of the program then further modify the clear day data for average conditions using a variant of the Angström equation and assumptions as to the relative proportions of direct and diffuse radiation. The program can also account for horizon cut-off effects, and foreground albedo. The Fleming technique is believed to represent a practical limit in realistic modelling of the differences in input to inclined and horizontal surfaces at mesoscale. Certainly, more detailed atmospheric attenuation models are available, e.g. Dave (1977) and Klucher (1979) and the non-uniform distribution of diffuse radiation has been
described in more detail, e.g. Steven (1977) and Steven and Unsworth (1979, 1980).
In this paper clear day values of radiation input and index were calculated for the middle of each month and considered to be the mean for that month. Average values for the month were then estimated from mean monthly values of sunshine hours.
THE BASIC COMPUTER MODEL
As the computer model has not been formally reported in the literature, and in particular the adaptations to estimate average radiation input, a detailed description will be set out. The computer program uses the vector methods for the description of solar position described by Goodspeed (1970), together with vector de nition of any inclined surface in terms of a vector, normal to its face.
The clear day atmospheric model
The atmospheric attenuation model of Idso (1969, 1970) is used to calculate the direct and diffuse components at the surface, and recognises four component processes that are set out below with their equations.
(i) absorption bv water vapour:
a(u*) = 0.77u*0.3 ... 1
where a (u*) is the absorption in the water vapour column u*, and u* = u. m;
where m is the relative geometrical air mass and has value 1.0 for a solar elevation of 900, u is the precipitable water content of the atmosphere in mm of water.
(ii) scattering by water vapour:
ts (u*) = 0.975u* … 2

26 AUSTRALIAN METEOROLOGICAL MAGAZINE 28:2 JUNE 1980
Where ts (u*) is the transmissibility of the atmospheric column, taking water vapour into account.
(iii) Rayleigh scattering of dry air:
ts (A) = 0.9m* + 0.026(m* -1) … 3
Where m* is the equivalent dry air mass and is a function of m, local atmospheric pressure p, and the standard atmospheric pressure, po, i.e. 1013 mb;
thus m*= m.p/po
ts (A) is the transmissibility due to molecular processes.
(iv) Scattering by dust:
ts(D) = 0.95mD … 4
Where D is a normalised dust factor that is extensively discussed by Idso (1970), who shows that in arid and semi-arid areas it is a function of mean daily wind speed. Fleming (1971) showed that by matching attenuation rates with the data of Rao and Seshadri (1960), D = 2.0 can be equated with a dust concentration of 300 ppm;
ts (D) is the transmissibility due to dust particles.
The attenuated direct beam component, Idir is then calculated as Eqn 5
Idir=Io(1-a(u*)).ts(u*).ts(A).ts(D) ...5
Where Io is the extraterrestrial direct beam intensity, i.e.
Ic.Rc2/Ro
2 where Ic is the solar constant, 1353 Wm-2,
Rc is the mean sun-earth distance and Ro is
the sun-earth distance on the day in question.
The clear day diffuse radiation associated with the three scattering effects is assumed to be produced by a 50 per cent forward scattering modi ed by a solar altitude factor so that for a horizontal surface Eqn 6 holds
Idif. hor = 0.5(Io (1-a(u*))-Idir). sin alt … 6
Where alt is the solar altitude.
The direct component is, of course, Idir.hor = Idir.sin alt.
In the case of an inclined surface it is assumed that a proportion of the factor (Io(1-a(u*)) -Idir) is to be considered 'circumsolar' and so is associated with the direct component for slope effects. The circumsolar percentage in this paper is taken to be 0.25. For the inclined surface the appropriate equations are 7 and 8 for the direct and diffuse components.
Idir .inc= (Idir+0.25 (Idif..hor)).(n..r) …. 7
where n is the normal vector to the surface; r is the solar position vector;
and (n.r) is the vector dot product.
Idif.inc = 0.75 Idif .hor cos2 (θ/2) … 8
Where θ is the angle of inclination of the inclined plane.
The program also allows for foreground re ection to be taken into account for steep slopes using a simple re ectivity and view factor calculation. Horizon cut-off the direct solar component can also be taken into account but was not used in this study. Daily totals, Qo and Qoinc are determined by summation of values calculated in zone mean
NAYAVA: SOLAR RADIATION IN THE KATHMANDU VALLEY, NEPAL 27
time at 12- minute or 0.2-hour steps, commencing at midnight.
The estimation of average radiation
Average or mean monthly radiation is calculated from the mid-month clear day radiation estimate using a correlation with sunshine hours.
(i) for horizontal surface:
the basic equation is that of Angström (1924) and Hounam (1963)
Q/Qo = (α+(1-α) . n/ N) …. 9
Where Q is estimated mean monthly total daily global solar radiation,
Qo is estimated mid- monthly clear day
total global solar radiation on a horizontal surface;
n is the mean monthly observed sunshine hours;
N is the maximum daily sunshine hours, i.e. total theoretical duration the sun is visible above the horizon plane;
and α is a local parameter related to the average diffuse radiation level when the sun is obscured by clouds. Values in the literature range between 0.3 and 0.5.
(ii) for inclined surfaces:
from Eqn 9 it is apparent that when n/N equals zero all radiation must be diffuse and slope correction factor in Eqn 8 should apply, i.e. for n = o,
Qinc = α.Qocos2 (θ/2). In the case of n/N = 1.0 we
have a clear day and the previously calculated clear day value, Qoinc obtains. By analogy with Eqn 9 a factor 'β' equivalent to 'α' but applying to the inclined surface, can be de ned.
Qinc = (β+(1-β)n/N)Qoinc ... 10
From the limiting cases show above, therefore, we can de ne β as equal to α. cos2 (θ/2).Qo/Qoinc.
In the case of steep slopes, or where there are signi cant horizon cut- off effects, the value of β becomes large and may even exceed 1.0, and Eqn 10 becomes of doubtful validity. An alternative method of calculation is available in the program. The diffuse component on the average on a horizontal surface Qdif.hor is assumed to be Q-Q odir.hor. n/N, where Q is calculated from Eqn 9 and Q odir.hor is the direct component on a horizontal surface on a clear day. Thus Eqn 11 is derived.
Qinc = Qodir.inc n/ N + Qdif.hor cos2 (θ/2) ... 11
Where Qodir. inc is the direct component on the inclined surface on a clear day;
Qdif. hor is the diffuse component on the average day on a horizontal surface as de ned above.
For steep slopes a component for foreground re ection is also usually calculated.
PARAMETER DERIVATION
To apply the computer program to the Kathmandu valley it is necessary to derive or justify the adoption of appropriate monthly values of the model parameters u, p, D and α. Unfortunately there is only limited total global solar radiation at Tribhuwan International Airport, and no data on the direct component at normal incidence or the diffuse component.

28 AUSTRALIAN METEOROLOGICAL MAGAZINE 28:2 JUNE 1980
u, the precipitable water content
Regular radiosonde ascents at Kathmandu only commenced in 1977 and no reliable estimates of precipitable water are available. Spencer (1965) showed that a simple linear relationship to surface vapour pressure was valid in Australia and this was adopted here.
u = k.e
Where u is precipitable water in mm;
k is a local constant, perhaps varying seasonally;
and e is surface vapour pressure in mb.
Spencer's value of k = 1.0 was used.
p, atmospheric pressure
Altitude is the overriding determinant with respect to atmospheric pressure and simple scaling based on altitude and the standard atmosphere was used.
D, the normalized dust factor
There are no turbidity measurements in Nepal and no direct observations even of surrogate factors. The existing daily records of solar radiation at Tribhuwan International Airport, however, were examined and estimates of clear day radiation for the fteenth day of each month made. The computer model was then run for the same dates using the adopted values of precipitable water, u, and values of D= 1.0, 2.0 and 3.0 and compared with the previous estimates. From the comparison an annual pattern of values of D was adopted, and used in all further calculations (see Table 1).
Qualitatively, the values in Table 1 seem reasonable with values of 1.0 adopted through the monsoon season and rising to a value of 3.0 at the end of the dry season of the Indian sub-continent, when simple observations con rm greatly increased amount of smoke and dust haze. Mani, Chacko and Iyer (1971) have con rmed that atmospheric particle concentrations increase in pre-monsoon months to three of four times the winter values.
Table 1 Mean monthly climatic parameters and average radiation data (1976)
Month Dust factor
Vapour pressure
(mb)
Sunshine hours
(n)
Day length (N)
(hours)
Observed Q
jm-2 (104)
Observed Q
jm-2 (104)
January 1.0 8.3 6.8 10.33 1356.5 1303.3
February 1.5 7.9 8.2 11.11 1747.2 2031.8
March 2.5 7.0 8.7 11.58 2081.5 1825.5
April 3.0 11.8 8.6 12.49 2232.6 1930.5
May 2.5 17.1 8.1 13.31 2215.0 1992.0
June 1.5 21.1 5.6 13.53 1923.4 1769.0
July 1.0 23.6 5.1 13.44 1865.6 1849.3
August 1.0 22.9 3.4 13.08 1611.3 1665.7
September 1.0 22.0 5.2 12.21 1675.3 1700.8
October 1.0 15.3 8.6 11.32 1860.2 1794.1
November 1.0 13.9 7.4 10.48 1431.8 1499.1
December 1.0 8.2 8.0 10.24 1375.7 1418.4

NAYAVA: SOLAR RADIATION IN THE KATHMANDU VALLEY, NEPAL 29
α = the Angström coef cient
While direct estimates from the observational data of Q0 were made and already used in the derivation of the dust factor D, and computer model estimates of Q0 were also available, a semi-independent estimate of α was sought through the extraterrestrial radiation version of the Angström equation.
Q = (a + bn/N) QA
Where a and b are constants; n and N are as previously de ned;
and QA is the extraterrestrial daily total of radiation on a horizontal surface.
QA is also calculated by the computer program but is also available in many tabulations such as McCullough (1968). All available data at Kathmandu were processed to derive values of a = 0.31 and b = 0.40. Brooks and Brooks (1947) examined sunshine hour recorders and showed that the Campbell- Stokes recorder ceased burning at a solar elevation of less than 50 so that even wholly clear days show a maximum sunshine hours ratio of 0.95. Thus QO may be considered to equate to 0.68QA. The value of Q at n/N = 0 is 0.30QA, and the substitution of these two values in Eqn 9 gives a derived value of α of 0.44.
Table 1 sets out observed mean values of vapour pressure (mb), sunshine hours, the adopted values of dust factor D, and observed values of mean monthly radiation and the computed value using the full atmospheric model and α equal to 0.44. Overall, the value of α = 0.44 is con rmed.
APPLICATION OF THE MODEL TO SLOPING SITES
The computer model was rst applied to graded set of slopes and azimuths for each month, and the
patterns of interaction of atmospheric factors, slope and azimuth investigated for both clear days and for average, or mean monthly values of sunshine hours. Then the average slope and azimuth for a grid of locations over the Kathmandu valley were determined form a topographic map and the model used to derive the spatial variation in radiation.
The graded set on clear days
Table 2 set out the clear day results form January and July with azimuth and angle of slope advancing by 100. From the full set of monthly data, Fig. 1 was derived and shows the annual variation for ve azimuths, N, NE/NW, E/W, S, and SE/SW, and six slope angles 00, 100, 200, 300, 400, and 500. There is a slight annual asymmetry derived from the variation in atmospheric factors altering the direct and diffuse components and their combined total. It is obvious, however, that monthly radiation indices would not be very different from those derived by Lee from extraterrestrial radiation alone.
The data in Table 2 for January (i.e. winter) show most markedly the effect of slope and azimuth. Steep slopes close to zero azimuth receive no direct radiation at all and as the slope angle increases the contribution of the foreground re ection exceeds that of the diffuse radiation from the clear sky obscured and so the received total increases to a secondary maximum.
In the Table 2 data for July, even north-facing vertical surfaces receive some direct radiation component in the morning and evening and so the effect of foreground diffuse radiation is concealed.
The graded set under average conditions
Figure 2 shows the equivalent plots to Fig. 1, but taking into account the actual sunshine hours, and so the altered proportion of direct and diffuse radiation. The patterns are, of course, dominated by the very asymmetrical annual curve for a

30 AUSTRALIAN METEOROLOGICAL MAGAZINE 28:2 JUNE 1980 Ta
ble
2 C
lear
day
tota
ls of
glo
bal s
olar
rad
iatio
n (J
m-2 (1
04 ), K
athm
andu
, 270 4
2' N
, co
nsid
erin
g su
rfac
e re e
ctio
n re e
cted
at h
ighe
r slo
pes.
Ang
le
of sl
ope
Azi
mut
h in
deg
rees
010
2030
4050
6070
8090
100
110
120
130
140
150
160
170
180
JAN
UA
RY
017
0317
0317
0317
0317
0317
0317
0317
0317
0317
0317
0317
0317
0317
0317
0317
0317
0317
0317
03
1013
2613
3113
4713
7713
7214
5615
1015
6516
2316
8617
4518
0318
5819
0819
5019
8720
1320
3520
33
2092
093
399
210
3311
1312
0513
0514
1415
2716
4017
5718
6619
7120
6321
4622
1322
6422
9723
05
3051
954
461
571
583
396
711
1312
6414
2315
7717
3618
8720
2921
6322
8023
7724
5224
9825
10
4020
923
432
245
260
276
694
111
2513
1014
9816
8618
7020
4222
0523
5124
3325
6926
2826
44
5018
818
818
828
243
560
779
599
211
9714
0216
1118
1220
0421
8823
5624
9826
1126
7826
99
6010
510
510
513
825
941
860
780
310
1312
2614
3916
5318
5420
4622
2623
8925
1525
9026
15
7013
813
813
815
524
337
754
874
194
111
5513
6415
7317
7419
7121
5123
2224
5624
5025
65
8017
617
617
618
424
736
051
068
687
410
7112
7214
6916
5718
4520
2121
8823
3024
1824
48
9021
321
321
321
626
435
648
163
680
398
311
6313
3915
1016
7818
4120
0021
4222
3022
59
July
029
0829
0829
0829
0829
0829
0829
0829
0829
0829
0829
0829
0829
0829
0829
0829
0829
0829
0829
08
1028
8728
8728
8728
8728
8328
8328
7928
7928
7428
5328
6628
6628
6228
5828
5328
4929
4928
4528
45
2027
7827
7427
8727
8227
8227
7827
7827
7427
7427
7027
6627
5727
4927
4127
3227
2027
1527
0727
07
3026
1126
1126
0726
0226
0226
0726
1126
1526
1926
1926
1126
0225
8625
6925
4825
2725
1024
9824
94
4023
6023
6023
5623
5123
6023
7223
9324
1024
2324
2724
2324
0623
8123
4723
1422
8022
4722
2622
18
5020
4220
4220
3820
3820
6321
0021
4221
7622
0122
0521
9721
7621
3820
9220
3819
8719
3719
0018
87
6015
3115
3115
3115
4016
0216
7417
4117
8718
1618
2818
1617
8217
3216
6915
9815
1914
4813
9313
77
7012
0512
0912
0512
7613
8114
8115
6116
1916
5316
5716
4816
0715
4414
6413
6812
6811
6710
9210
67
8086
286
292
510
6711
9713
1013
9714
6014
9415
0214
8114
3113
5612
5911
4610
2189
579
575
7
9062
366
578
292
510
5411
6312
4713
1013
3913
4313
1812
6411
8010
7595
080
865
753
649
0

NAYAVA: SOLAR RADIATION IN THE KATHMANDU VALLEY, NEPAL 31
Fig. 1 Global solar radiation on different aspects with cloudless sky in 1y/dav (Jm-2) at latitude 27042'N (Kathmandu).
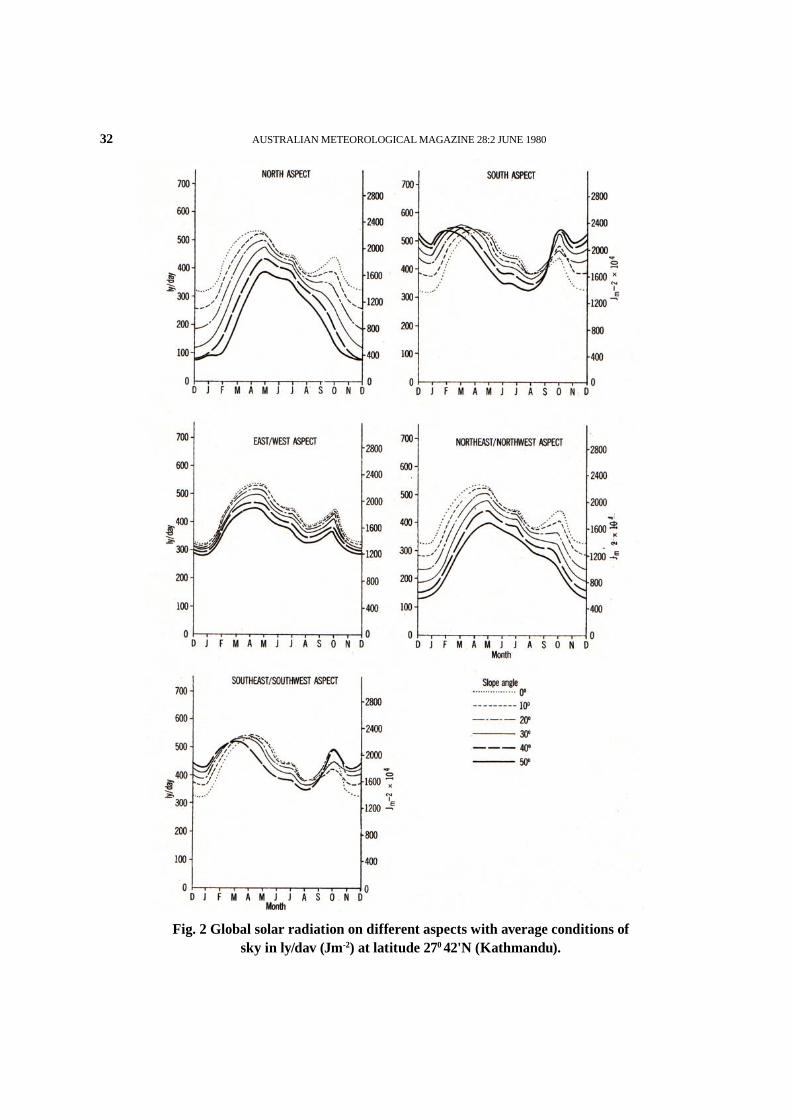
32 AUSTRALIAN METEOROLOGICAL MAGAZINE 28:2 JUNE 1980
Fig. 2 Global solar radiation on different aspects with average conditions of sky in ly/dav (Jm-2) at latitude 270 42'N (Kathmandu).

NAYAVA: SOLAR RADIATION IN THE KATHMANDU VALLEY, NEPAL 33
horizontal surface. Increased cloudiness during the monsoon period increases the diffuse radiation relative to direct radiation and so the differences between slope and aspect are greatly reduced. In the south and southeast/southwest, patterns that exhibit crossing curves on the clear day gure still do so but the time of year at which cross-over occurs is signi cantly altered.
The monthly radiation index values are obviously very different from those derived for clear days, and so the application of indices derived from extraterrestrial or clear day data to mean monthly observations are obviously subject to considerable bias.
SPATIAL DISTRIBUTION OF RADIATIONIN THE KATHMANDU VALLEY
A topographic map of the Kathmandu valley at scale 1:63 360 was available with a contour interval of 100 feet. The valley has a at oor and is surrounded on all sides by steep ranges. A grid of interval 300 m was placed over the valley and 394 gird intersection points de ned within the region of agricultural and human signi cance. This region is bounded by the dashed line in Figs 3 to 6. At each grid intersection average values of slope and azimuth were determined and the point allocated to a classi cation matrix. For each combination of slope and azimuth occupied in the matrix the computer model was run using the parameters set out in Table 1 and elsewhere in this paper. Values are therefore available of mean monthly radiation and clear day radiation for each of the grid intersections. These were analysed, and are shown in Figs. 3 to 6.
Figures 3 and 4 are plots of clear day radiation for January and July and Figs 5 and 6 the corresponding plots for mean monthly radiation. Signi cant spatial differences in insolation occur particular in the two plots for the winter month of January. South facing slopes, i.e. equatorwards facing,
show values as high as 550 langleys per day, 23 MJ m-2, while the at oor of the valley receives 400 langleys per day, 16 MJ m-2, on a clear day or 320 langleys, 13 MJ m-2, on an average January day. Conversely northward-facing slopes receive as little as 150 langleys, 6 MJ m-2. In the summer and monsoon month of July the whole valley shows remarkable uniformity under average conditions with a range of 410 to 450 langleys per day, 17 to19 MJ m-2, and even under clear sky conditions the range is only 600 to 700 langleys, 25 to 30 MJ m-2.
CONCLUSIONS
It has been shown that a simple computer model of atmospheric attenuation processes can be developed to separate the signi cant components of the radiation input, direct, diffuse and circumsolar diffuse radiation. When these components are integrated for horizontal and sloping conditions, and the ratio expressed as a radiation index, the results are signi cantly different from simple geometrical indices.
The computer model requires the estimation of parameters related to precitpitable water, dust content and air mass, but the results of application of the model in Nepal suggests that even limited data on total global radiation and vapour pressure can be used to arrive at a reasonable array of parameter values. Having determined a reasonable array of parameter values the model was applied to a graded set of slopes and azimuths and also a grid of actual average slope characteristics for the Kathmandu valley.
The results from the graded set of slopes and azimuths, taking into account actual sunshine hours, showed a much more limited range of daily totals than the extraterrestrial or clear day models. This was con rmed on a topoclimatological basis when isopleths of radiation were plotted for the Kathmandu valley. The maximum range of insolation differences exists on clear days in

34 AUSTRALIAN METEOROLOGICAL MAGAZINE 28:2 JUNE 1980
Fig. 3 January: clear day global solar radiation, Kathmandu Valley
Fig. 5 January: average day global solar radiation, Kathmandu Valley
Fig. 6 July: average day global solar radiation, Kathmandu Valley
Fig. 4 July: clear day global solar radiation, Kathmandu Valley
ly/day Jm-2 (104)
630 2635.5
660 2761.4
690 2887.0
Isohel interval 50 ly/day
1 ly/day = 4.184 x 10⁴ jm-2
Isohel interval 30 ly/day
1 ly/day = 4.184 x 10⁴ jm-2

NAYAVA: SOLAR RADIATION IN THE KATHMANDU VALLEY, NEPAL 35
winter when equatorwards facing slopes in the Kathmandu valley received up to 50 per cent extra insolation.
ACKNOWLEDGMENTS
I am deeply indebted to Mr. P.M. Fleming for permitting me to use his program and also his critical suggestions and comments on my manuscript. I sincerely acknowledge Dr N.S. Mc Donald for his suggestions and remarks on this paper. Finally, I offer my sincere thanks to Mr. K. Cowan for his assistance in cartography and Gennesse Winch for her typing of the original manuscript.
REFERENCES
Angström, A. 1924. Solar and terrestrial radiation. Q. Jl R. Met. Soc., 50, 121-5.
Basnayake, B.k. 1968. Two maps of direct short wave radiations in Barbados. Climat. Bulletin 4, McGill University, Dept Geography, 21-30.
Brooks, C.F. and Brooks, E.S. 1947. Sunshine recorder - a comparative study of the burning glass and thermometric systems. J. Met., 4, 105-15.
Dava, J.V. 1977. Validity of the isotropic-distribution approximation in solar energy estimations. Sol. Energy, 9, 331-3
Fleming, P.M. 1971. The calculation of clear day solar radiation on any surface. Paper presented at Aust. Inst. Refrig. and Heating conference, Perth, May. Mimeo 24 pp.
Garnier, B.J. and 0hmura, A. 1968a. A method of calculating the direct short wave radiation income of slope. Jnl app1. Met., 796-800.
Garnier, B.J. and Ohmura, A. 1968b. Estimating the topographic variation of direct solar radiation: a contribution to geographical microclimatology. Can. Geogr. 12, 241-8.
Goodspeed, M.J. 1970. The computation of solar positing in environmental models. Aust. Comp. J., 2, 110-3.
Honuam, C.E. 1963. Estimates of solar radiation over Australia. Aust. Met. Mag., 43, 1-14.
Idso, S.B. 1969. Atmospheric Attenuation of solar radiation. J.Atmos. Sci., 26, 1088-95.
Idso, S.B. 1970. The transmittance of the atmosphere for solar radiation on individual clear days. Jnl appl. Met., 9, 239-41.
Klucher, T.M. 1979. Evaluation of models to predict insolation on tilted surfaces. Sol. Energy, 23, 111-4.
Kondratyev, k. Ya. and Manolova, M.P. 1960. The radiation balance of slopes. Sol. Energy, 4, 14-9
Lee, R. 1963. Evaluation of solar beam irradiation as a climatic parameter of mountain watersheds. Colo. State Univ. Hydrol. Paper 2.
List, J.R. 1954. Smithsonian Meteorological Tables. Smithsonian Institute, Washington.
Mani, A., Chacko, O. and Iyer, N.V. 1971. Atmospheric turbidity over India from solar radiation measurements. Sol. Energy, 14, 185-95.
McCullough, E.C. 1968. Total daily radiant energy available extra-terrestrially as a harmonic

36 AUSTRALIAN METEOROLOGICAL MAGAZINE 28:2 JUNE 1980
series in the day of the year. Arch. Met. Geophys. Bioklim., B, 16, 129-43.
Monteith, J.L.1962. Attenuation of solar radiation- A climatological study. Q. Jl R. met. Soc., 88, 508-21.
Ohmura, A. 1968. The computation of direct insolation on a slope. Climat. Bulletin 3, McGill Univ., 42-53.
Rao, K.R. and Seshadri, T.N . 1960. Solar insolation curves. Indian J. Met. Geophys., 12, 267-72.
Schulze, R.A. 1975. Incoming radiation uxes on sloping terrain-A general model for use in southern Africa. Agrochemophysica, 7, 55-60.
Spencer, J.N. 1965. Estimation of solar radiation in Australian localities on clear days. Tech. Paper 15. CSIRO Div. of Building Res., Australia.
Steven, M.D. 1977. Standard distribution of clear
day radiance. Q. Jl R. met. soc., 103, 457-65.
Steven, M.D. and Unsworth, M.H. 1979. The diffuse solar irradiance of slope under cloudless skies. Q. Jl R. met. soc. 105, 593-602.
Steven, M.D. and Unsworth, M.H., 1980. The angular distribution and interception of diffuse solar radiation below overcast skies. Q. Jl R. met. Soc., 106, 57-61.

37
Temperature is a signi cant factor limiting plant growth. Knowledge of the characteristics of the seasonal distribution of temperature and the extreme occurrence of high and low temperatures are important factors for agricultural planning.
Estimation of Temperature over Nepal*
REVIEW OF EXTRAPOLATION METHODS
Nepal has only a few temperature recording stations1 with a long period of data. The variation of temperature over a region, given a few point observations is often achieved by multiple regression methods. Hopkins studied least square regression of mean monthly air temperatures in central and southern Alberta and Saskatchewan with latitudes, longitude and elevation from 44 stations as independent variables2. Later Hopkins used 206 climatological stations to further investigate the spatial variation of temperature3. He remarked that linear equation could be used to interpolate
acceptable estimates of climatological averages for points between stations. Based on 22 years climate data, Hopkins Jr. estimated mean monthly maximum and minimum temperatures in New England and New York with elevation and latitude as independent prameters4. In Newfoundland and Labrador, Solomon et al estimated mean monthly temperatures using latitude, elevation and distance from the coast as the independent variables5. Lee estimated mean monthly and mean annual temperatures from elevation and latitude within a uniformly humid temperate climates in northeastern USA, based on 30 years monthly and annual means of temperature6. Thompson revealed
JANAK L. NAYAVA**
** Mr. Nayava is the Chief Meteorologist, Department of Irrigation, Hydrology and Meteorology.* This article was published in the Himalayan Review, Vol. XIV, 1982, pp. 12-24. 1. Department of Hydrology and Meteorology, Climatological Records of Nepal, 1968, 1971, 1972, 1973,
1977, Vol. I, Vol. II, HMG, Nepal.2. J.W. Hopkins, Agricultural Meteorology: Correlation of air temperatures in central and southern Alberta
and Saskatchewan with latitude, longitude and altitude, Can. J. Res.,Vol. 16 (1938), pp. 16-26.3. J.W. Hopkins, Correlation of air temperature normals for the Canadian Great Plains with latitude,
longitude and altitude. Can. J. Earth Science, Vol. 5 (1968) pp. 199-210.4. C.D. Hopkins, A method of estimating basin temperatures in New England and New York. J. Geophys.
Res., Vol. 65 (1960), pp. 367-377.5. S.I. Solomon, and et al, The use of square grid system for computer estimation of precipitation,
temperature and runoff, Water Resources Res., Vol. 4 (1968), pp. 919-929.6. R.Lee, Latitude, elevation and mean temperature in the North East. Prof. Geogr., 21, (1969). Pp. 227-
231.
The Himalayan ReviewNepal Geographical Society

38 The Himalayan Review
that maximum and minimum temperature distribution over the tableland stations around 1000 m elevation in northeastern New South Wales, Australia, was primarily controlled by the relief variation and slope orientation7. Thompson used mesoscale classi cation of air ow to study the mesoscale variation of temperature and rainfall in the same area8. Johnson, Kalma and Caprio estimated mean air temperatures from elevation, latitude and distance from the coast from the 22 stations network for south eastern New South Wales9.
DERIVATION OF EXTRAPOLATION MODELS
Thirty ve meteorological stations recording temperature throughout Nepal have been used to develop an equation to predict maximum ant minimum temperatures at different places. The period 1970-75 was chosen to maximize the number of available temperature stations as shown in Fig.1, but still gap is occurred in the north west of Nepal, due to the non existence of temperature stations on that area. Maximum and minimum temperatures from the six year period together with and 55 year mean (1921-75) from Kathmandu (Indian Embassy), 15 year mean from Butwal and 19 year mean from Pokhara were compared (Fig. 2). On average, the annual march of temperature of the six year period and the long term 15, 19, and 55 year means have a difference of less than 10C for the maximum and minimum temperature. Hence the network of recent six year mean temperatures of Nepal is acceptable as the base
for the estimation of the average mean monthly maximum and minimum temperatures for the 168 station network.
Three models have been developed, all of which give satisfactory results with regression coef cients usually greater than 0.9.
(a) One model takes account of latitude, longitude, elevation and rain as the independent variable; the latter is considered to be a measure of the mean cloudiness.
(b) a second model considers latitude, longitude and elevation, and
(c) in the last model, elevation is the sole dependent variable.
The coef cient of coreelation explained by the regression is not signi cantly different between these three models as shown in Table 1, except that correlation shows a lower value in winter months, particularly in model III and with mean temperature as the dependent variable.
These three models have been run to select the most suitable variables for the different months for predicting the best mean monthly maximum and minimum temperatures for the 168 stations. Model predicted temperatures were veri ed with the observed temperatures in order that suitable variables might be chosen. Finally, the rst model was chosen for January to November to predict mean monthly maximum temperatures. When the rst model was used for December to predict the monthly maximum temperatures, the predicted value was much higher in a few
7. R.D. Thompson, The in uence of relief on local temperatures: Data from New South Wales, Australia, Weather, Vol. 28, (1973), pp.377-382.
8. R.D.Thomson, Some aspects of the synoptic mesoclimatology of the Armidale district, New South Wales, Australia, J. App. Meteorology, Vol. 12 (1973), pp. 578-588.
9. Johnson, J.D. Kalma and J. Caprio, The spatial distribution of mean air temperature in southeastern New South Wales, Aust. Met. Mag., 24, (1976), pp. 73-84.
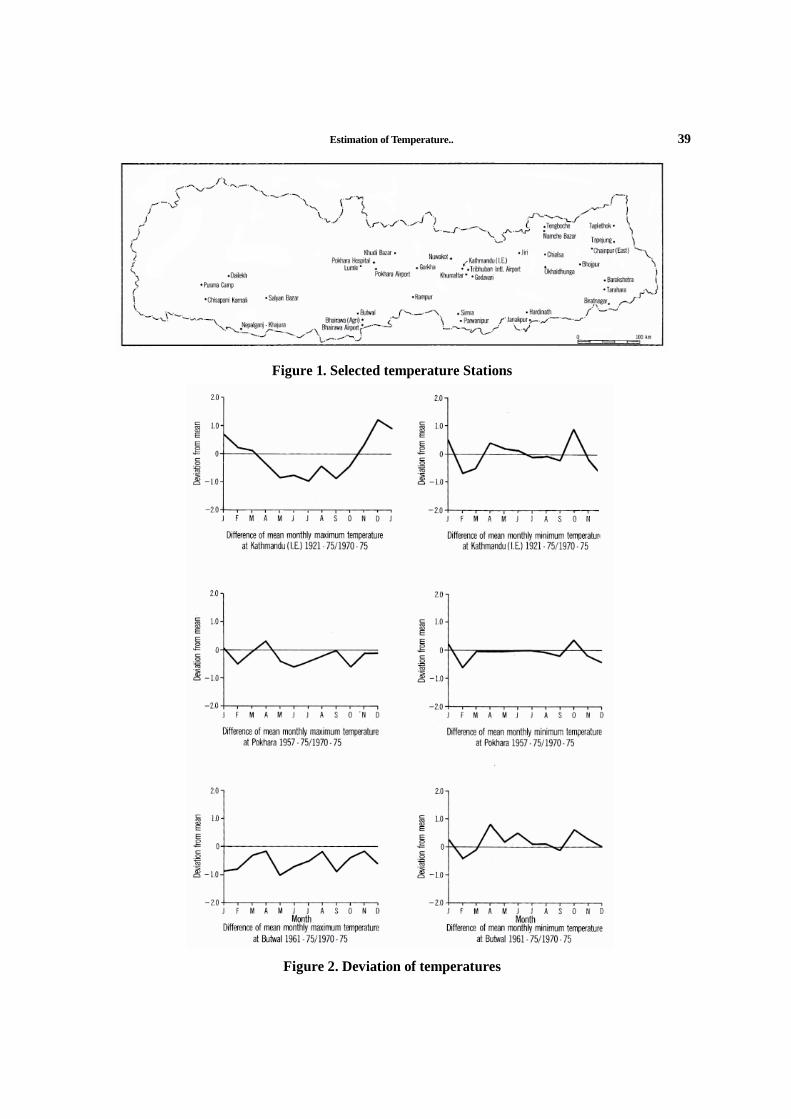
Estimation of Temperature.. 39
Figure 1. Selected temperature Stations
Figure 2. Deviation of temperatures

40 The Himalayan Review
places. Therefore, the second model being closer to reality was chosen to predict mean monthly maximum temperatures for December.
Similarly, the rst model was chosen for March to October to predict mean monthly minimum temperatures. The second model was considered a most appropriate for November to February to predict mean monthly minimum temperatures. The coef cients used to predict temperatures are shown in Tables 2 and 3.
Finally, after having established a set of estimated mean monthly maximum and minimum temperatures for the station net work, the estimated temperature was replaced by the observed temperature records of the 35 stations. The combined observed and estimated mean monthly maximum temperatures are shown in author’s thesis10. This broad picture of variation of mean monthly maximum and minimum
temperatures and extremes are shown in a few selected places (Fig. 3).
For comparision, predicted and observed mean monthly maximum and minimum temperatures for January and July for 35 stations have been studied which shows that there is no xed pattern nor trend which can identify positive or negative increments of temperature either in Tarai, the Hill or the Mountain Regions of Nepal.
Generally, either the four months January, April, July and October or the two months January and July are the months selected to describe the spatial variation of temperature elements, but in this study, mean maximum temperature of the hottest weeks and men temperature of the coldest week have been chosen. This represents the range of temperature during the year and this is the most useful information for the selection of different species of crops.
Model Jan. Feb. Mar. Apr. May Jun. July. Aug. Sept. Oct. Nov. Dec.
IT Max: Lat. Long.Elev. & RainT Min: Lat, Long, Eiev, & Rain
0.96
0.89
0.97
0.84
0.98
0.83
0.97
0.90
0.97
0.96
0.98
0.98
0.97
0.97
0.97
0.97
0.98
0.97
0.97
0.96
0.95
0.85
0.95
0.79
IIT Max: Lat. Long.Elev.T Min: Lat, Long, Eiev
0.96
0.85
0.97
0.84
0.98
0.83
0.97
0.90
0.96
0.96
0.96
0.98
0.97
0.97
0.97
0.97
0.97
0.97
0.96
0.96
0.95
0.84
0.95
0.75
III T Max: Elev.T Min: Elev
0.950.80
0.960.81
0.980.79
0.950.89
0.920.96
0.940.98
0.970.97
0.970.97
0.970.97
0.960.96
0.940.82
0.940.75
Table 1: Coef cient Correlation of Temperature Model
10. J.L. Nayava, The climates of Nepal and their implications for agricultural development Ph.D. thesis submitted to Australian National University, 1980, Canberra.
11. M. Hutchison, Interp 5 and Interp 3, Division of Land Use Research, CSIRO, 1979, Canberra (Private communication)

Estimation of Temperature.. 41
Table 2: The selected Regression Coef cients used to predict Minimum Temperature
Regress Coefficients for minimum temperature (C)
Month b c -d×10-3 e a R2
January 3.40 1.45 5.94 0.95×10⁻¹ -207.70 0.86
February 3.33 1.12 5.71 0.13×10⁻² -174.35 0.84
March 4.35 1.26 5.26 -0.93×10⁻² -209.84 0.83
April 0.37 -4.11×10² 5.98 1.60×10⁻² 14.00 0.90
May -0.52 -0.28 5.86 8.15×10⁻⁴ 62.25 0.96
June 0.37 8.48×10⁻² 5.64 -1.14 ×10⁻³ 8.73 0.98
July 0.31 9.16×10⁻² 5.32 5.94×10⁻⁴ 9.87 0.97
August 0.62 0.14 5.44 0.94×10⁻³ -2.82 0.97
September 0.53 0.17 5.50 -2.02×10⁻⁴ -4.71 0.97
October -5.15×10⁻² 9.01×10⁻² 5.78 2.12×10⁻² 15.59 0.96
November 0.50 0.25 5.31 5.46×10⁻² 20.26 0.84
December 4.03 1.25 5.55 -0.15 -193.59 0.75
N.B. Each equation is of the form T=a+ b (X 1) + c(X 2) +d (X3) + e (X4)Where T is the mean monthly minimum temperature; X1 is the latitude; X2 is the longitude; X3 is the elevation (m); X4 is the rainfall (mm); and b to e are the appropriate regression coef cients for the month and a is the appropriate constants for the month.
Regress Coefficients for minimum temperature (C)
Month b c -d×10-3 -e -a R2
January 1.14 0.40 5.60 1.76×10⁻² 41.45 0.96
February 2.05 0.57 6.43 3.77×10⁻² 77.69 0.97
March 2.18 0.60 6.92 5.03×10⁻² 77.87 0.98
April 2.47 0.41 7.36 2.91×10⁻² 64.93 0.97
May 2.54 0.21 6.99 1.34×10⁻² 49.30 0.97
June 2.20 0.21 6.31 0.60×10⁻² 41.21 0.98
July 1.39 0.31 5.61 0.19×10⁻² 29.81 0.97
August 1.25 0.31 5.40 0.10×10⁻² 26.81 0.97
September 1.60 0.37 5.75 0.33×10⁻² 41.54 0.98
October 1.48 0.49 6.01 0.86×10⁻² 49.24 0.97
November -0.19 0.22 5.79 -15.62 0.95
December -0.29 0.28 5.26 -0.17 -12.49 0.95
Table 3: The Selected Regression Coef cients used to predit Maximum Temperature
N.B. Each equation is of the form T=a+ b (X 1) + c(X 2) +d (X3) + e (X4)Where T is the mean monthly maximum temperature; X1 is the latitude; X2 is the longitude; X3 is the elevation(m); X4 is the rainfall (mm); and b to e are the appropriate regression coef cients for the month and a is the appropriate constants for the month.

42 The Himalayan Review
INTERPOLATION OF WEEKLY DATA AND DERIVATION OF EXTREME MEAN VALUES
In the coldest month, January, monthly mean minimum and maximum temperatures over Nepal range from -9.70C and to 10.80C and from 3.80C to 23.40C respectively. The lowest monthly minimum temperature was recorded in Tengboche, 3857 m above mean sea level. Generally above that elevation, the monthly mean minimum temperature will be much lower than -9.70C.
In the hottest month, mean monthly minimum and maximum temperatures range from 0.90C to 23.90C and from 11.90C to 39.30C. The records show that the hottest month generally lies in the month of May in the Tarai, the Inner Tarai and the river valleys of the Hill Region, slowly the warm air from the low land affects the Hill and Mountain regions in the following months and ultimately the hottest month lies in June or July in the Hill and Mountain Regions. The extreme maximum temperature was recorded 46.00C, which occurred on 9th June 1966 at Karnali, in Far western Nepal, and the extreme minimum temperature was -17.90C on 15th January, 1974 at Tengboche.
Mean maximum temperatures for the hottest week and mean minimum temperatures for the coldest week are derived from the six year (1970-1975) monthly mean values using Interp 511. Generally estimated weekly values were derived using fourier techniques but the opportunity was taken to use a more recently developed technique, which further reduced bias and error.
These derived values of mean maximum temperature of the hottest week and mean minimum temperature of the coldest week analyzed. The spatial variation of isotherms for the highest weekly maximum temperatures and the lowest weekly mean minimum temperatures are shown in Figs. 4 and 5. The highest weekly maximum temperature varies from 16.00c to 38.00C. In the Eastern Tarai, the temperature is 4.00C lower than the Far Western Tarai. The distribution of temperature is complex due to the complexity of landscapes. The coldest weekly minimum temperature varies from -10.00C to 10.00C respectively (Fig. 5). In contrast to the hottest month, the minimum temperature is highest in the Eastern Tarai exceeding that in the western Tarai by 2.00C.
Figure 3. Variation of temperatures

Estimation of Temperature.. 43
Figure. 4. Mean maximum temperature, hottest week
Figure 5. Mean minimum temperature, coldest week
By analyzing highest and lowest temperatures, extreme temperatures, which are hazardous for certain crops for maximum production can be determined. In other words, it helps to classify the temperature regimes in Nepal. Fig. 5 demonstrates that even in the coldest week, the mean minimum temperature is generally 80C in the Tarai Regions. From this observation, it seems that that the Tarai could be a frost free zone, this is a vitally important consideration for many crops, especially tropical crops, which are frost sensitive.
DISCUSSION
The mean monthly temperature values for 168 locations in Nepal will be further used to
investigate the temperature regimes and crop growth studies. In addition, mean monthly maximum and minimum temperatures for 168 locations can be used individually to discuss the temperature pattern at each location. Furthermore, if its geographical coordinates are known, mean monthly maximum and minimum temperatures can be predicted in any place in Nepal, but caution should be taken in extrapolating data, because, for example, the minimum temperature on the valley oor could be higher than the ridges due to valley air drainage. This error is due in part to the omissions of temperature inversions, slope aspects, cloud incidence and vegetation. However the major factors are inversions which are common in the winter months, resulting in nocturnal air drainage and radiation fog.
44 Mausam, (1981)
* This work has been done in the Australian National University, Canberra.
Department of I rrigation, H ydrology a nd M eteorology, K athmandu. (Received 26 April 1980)
ABSTRACT: The mesoscale variation of rainfall in the Kathmandu valley and surrounding regions have been estimated for 1225 grid points by computer program, which considers the effect of orography, an important factor in areas like the Kathmandu valley where sharp topographical variations occur within small distances.
Areal rainfall in the Kathmandu valley*
1. Introduction
The Kathmandu valley lies in the hilly region of Nepal where a number of mountain ranges extend generally east-west parallel to the Great Himalayas. The east-west and north-south axis of this valley are about 30 and 20 kilometers respectively. The catchment area is approximately 607 square km. The valley oor which lies at between 1280 and 1400 m, is surrounded by hills and mountain ranges rising steeply on all sides completely enclosing the valley. The most prominent peaks rising from the valley are Sheopuri (2689 m) in the north and Phulchowki (3132 m) in the south. The Kathmandu valley is situated at Lat. 270 32'-2749' N and Long. 850 12'-850 32' E.
The mesoscale study of rainfall in Kathmandu valley and surrounding regions has been undertaken. Rainfall is the primary data for hydrological, agricultural, forestry and water management studies. Generally, areal rainfall data are required rather than single point observations. It is mainly done by drawing isohyets in the data eld, considering terrain features. Here, the mathematical approach has been taken to generate the areal rainfall data and analyse the patterns.
2. Methods for areal rainfall analysis
The variation of rainfall over a region that has few observation sites can be estimated by computer analysis. Cressman (1959) introduced the technique for determining a regular scalar eld of grid values for an irregular eld of observation to analyse the pressure in the atmosphere at various levels. Since then, this technique has been widely developed and extensively used in the numerical prediction in synoptic meteorology and in climatological studies. Gandin (1963) modi ed the above technique by the direct use of the distance autocorrelation function and elds of mean and standard deviation of the element being nanalysed. Maine and Gauntlett (1968) presented the application of this procedure to the determination of grid point eld for monthly rainfall. The ideal behind these techniques is to successively adjust a rst guess eld, so that the grid point values are consistent with the station observations in their vicinity. The error which is determined between the rst guess eld and observed rainfall, is applied at the grid point in accordance with the following in uence function. I = (r2 - l2) / (r2 + l2) (1)
** This article was published in Mausam, 1981. 32, 4, p.p. 343-348
JANAK L. NAYAVA**

AREAL RAINFALL IN KATHMANDU VALLEY 45
Where, r is the radius of in uence adopted to grid scale units and l is the distance of the subject grid point from the station in grid scale units.
Body (1973) developed an approach to estimating areal rainfall distribution, considering the orographic in uence on rainfall. A regression relationship is determined between the rainfall observed at a station and two parameters related to the station's cartesian coordinates. Initially eight possible terms are supplied namely x, y, z, x2, x/z, y/z, x/z2, and y/z2. The terms proved to be the most appropriate set for a study of monthly rainfall conducted by Body (1978) for the South Coast region of New South Wales. Their transposition to the Kathmandu valley was not tested but would appear reasonable as rainfall is affected by orography normal to generally east-west air ow in each case. For each station, two relevant parameters are selected automatically by the program as those which provide the smallest deviation from the individual station value. Within two parameters, the rst plays the primary role and second as secondary. This is noted here as an order of preference. The number of terms in the equation is limited to two because at higher orders, the eld is distorted to t individual stations and, therefore, contains spurious relations which give incorrect estimates in regions away from observations or in orographic conditions outside these encountered in the data eld. Then Body's (1973) program was used to study the rainfall in the Kathmandu valley. The data required by the program was rst, an estimated elevation at points in grid net. In this case, the grid net contained 35× 35 points (1225), each separated by 900 metres. The others were the observed rainfall data and the location of the stations according to the adopted grid net. The elevations of all grid points have been extracted from Nepal, 1: 63,360 scale map, published by Surveyor General of India, 1957. The main procedures of programs are as follows.
The program estimates from the multiple regression equation using elevation (z), x and y values, the rainfall at each grid point, thus giving eld A. Therefore, eld A gives preliminary rainfall values for each grid point, which are further adjusted to get the best t value in grid pints by series of selected radii 25.0, 11.0, 5.5 and 2.0 which are chosen for subsequent passes. The program computes interpolated value for rainfall at each of the observation points from eld A on rst pass current value at all subsequent passes. For each observation point, the program determines the error, E, between the interpolated and the observed value and for each grid point (x, y). The program determines the correction factor:
m
1i
m
1iiiiy,x W/WEC (2)
Where, Wi = (l-di /p)2
Where di is the distance between the point (x,y) and ith observation station within radius p.
The program computes a new value at each grid point, i.e.
New rainfall(x, y) = old rainfall value(x,y) +(1-Mv1) Cx,y
Where Mvi is the multiple regression value determined in regression analysis.
This whole procedure is repeated for the number of passes selected and adjusts the value at each grid point and nally the program draws isohyets of given intervals, which are supplied by the program user.
3. Data and constructing the isohyets maps
The basic rainfall data has been computed and checked and missing values have been estimated

46 JANAK L. NAYAVA
Fig. 1. Operating meteorological stations in Kathmandu Valley
Maps of mean monthly, mean monsoon and mean annual precipitation for the Kathmandu valley and surrounding regions have been studied based on the grid point values as calculated from the computer program (Body 1973).
Fig. 2 Topography of the study area (Kathmandu Valley)
by linear regression based on the nearest Station. A complete mean monthly rainfall records for 11 stations for 1971-76 has been standardized. The basic data, the rainfall stations are shown in Table 1 and 2 and their locations are shown in Fig. 1. The analysis was based for the six year period (1971-76) rather than the conventional 30 year period. The hydro-meteorological observation network in Nepal was expanded in the beginning of 1970, providing eleven stations representative of the different altitude and aspects in the Kathmandu valley and surrounding regions. In comparison with the longer period data for 56 years (1921-76) the recent six-year data, for Kathmandu (Indian Embassy) shows 13 per cent higher rainfall. The contour map of Kathmandu valley based on their grid points is shown in Fig. 2.
During the analysis of preparing the prelimiminary eld A, the multiple regression value determined in regression analysis and selected two relevant parameters out of eight possible terms in each month are also produced, which is shown in Table 3. The table shows that the percentage of variance accounted for is very high during the summer months compared with the winter months. It is also interesting to note that the two terms considered in the analysis mostly differ from month to month (see Table 3). The rainfall in winter months (December, January, February), and rainfall in the transition season (October), does not relate with the elevation factor. On the other hand, the rainfall from March to August is strongly related with elevation. There is very little difference between the observed station rainfall and rainfall interpolated from the computer produced isohyets with the one exception of the rainfall station at Tokha, although the quality of the observed rainfall data here is poor. The rainfall values in independent data, namely Sundarijal power house has been compared with the interpolated values, which are in a good agreement with actual
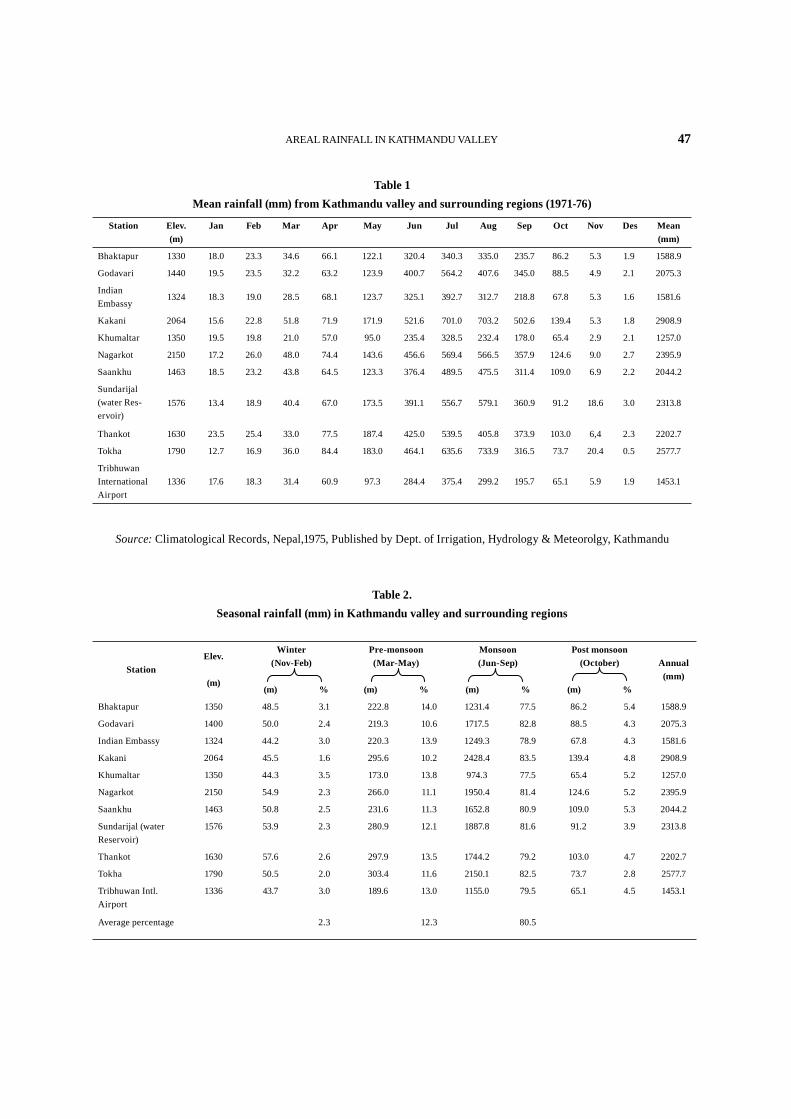
AREAL RAINFALL IN KATHMANDU VALLEY 47
Table 1Mean rainfall (mm) from Kathmandu valley and surrounding regions (1971-76)
Station Elev. (m)
Jan Feb Mar Apr May Jun Jul Aug Sep Oct Nov Des Mean (mm)
Bhaktapur 1330 18.0 23.3 34.6 66.1 122.1 320.4 340.3 335.0 235.7 86.2 5.3 1.9 1588.9
Godavari 1440 19.5 23.5 32.2 63.2 123.9 400.7 564.2 407.6 345.0 88.5 4.9 2.1 2075.3
Indian Embassy
1324 18.3 19.0 28.5 68.1 123.7 325.1 392.7 312.7 218.8 67.8 5.3 1.6 1581.6
Kakani 2064 15.6 22.8 51.8 71.9 171.9 521.6 701.0 703.2 502.6 139.4 5.3 1.8 2908.9
Khumaltar 1350 19.5 19.8 21.0 57.0 95.0 235.4 328.5 232.4 178.0 65.4 2.9 2.1 1257.0
Nagarkot 2150 17.2 26.0 48.0 74.4 143.6 456.6 569.4 566.5 357.9 124.6 9.0 2.7 2395.9
Saankhu 1463 18.5 23.2 43.8 64.5 123.3 376.4 489.5 475.5 311.4 109.0 6.9 2.2 2044.2
Sundarijal (water Res-ervoir)
1576 13.4 18.9 40.4 67.0 173.5 391.1 556.7 579.1 360.9 91.2 18.6 3.0 2313.8
Thankot 1630 23.5 25.4 33.0 77.5 187.4 425.0 539.5 405.8 373.9 103.0 6,4 2.3 2202.7
Tokha 1790 12.7 16.9 36.0 84.4 183.0 464.1 635.6 733.9 316.5 73.7 20.4 0.5 2577.7
Tribhuwan International Airport
1336 17.6 18.3 31.4 60.9 97.3 284.4 375.4 299.2 195.7 65.1 5.9 1.9 1453.1
Source: Climatological Records, Nepal,1975, Published by Dept. of Irrigation, Hydrology & Meteorolgy, Kathmandu
Table 2. Seasonal rainfall (mm) in Kathmandu valley and surrounding regions
StationElev.
(m)
Winter (Nov-Feb)
(m) %
Pre-monsoon (Mar-May)
(m) %
Monsoon (Jun-Sep)
(m) %
Post monsoon (October)
(m) %
Annual (mm)
Bhaktapur 1350 48.5 3.1 222.8 14.0 1231.4 77.5 86.2 5.4 1588.9
Godavari 1400 50.0 2.4 219.3 10.6 1717.5 82.8 88.5 4.3 2075.3
Indian Embassy 1324 44.2 3.0 220.3 13.9 1249.3 78.9 67.8 4.3 1581.6
Kakani 2064 45.5 1.6 295.6 10.2 2428.4 83.5 139.4 4.8 2908.9
Khumaltar 1350 44.3 3.5 173.0 13.8 974.3 77.5 65.4 5.2 1257.0
Nagarkot 2150 54.9 2.3 266.0 11.1 1950.4 81.4 124.6 5.2 2395.9
Saankhu 1463 50.8 2.5 231.6 11.3 1652.8 80.9 109.0 5.3 2044.2
Sundarijal (water Reservoir)
1576 53.9 2.3 280.9 12.1 1887.8 81.6 91.2 3.9 2313.8
Thankot 1630 57.6 2.6 297.9 13.5 1744.2 79.2 103.0 4.7 2202.7
Tokha 1790 50.5 2.0 303.4 11.6 2150.1 82.5 73.7 2.8 2577.7
Tribhuwan Intl. Airport
1336 43.7 3.0 189.6 13.0 1155.0 79.5 65.1 4.5 1453.1
Average percentage 2.3 12.3 80.5

48 JANAK L. NAYAVA
Fig. 3. Mean monsoon precipitation (mm) 1971-1976
4. Distribution of rainfall in the Kathmandu valley
Generally there are four distinct rainfall seasons in the Kathmandu valley. Pre-and post-monsoon rains in Kathmandu are associated with thermal convection combined with orographic uplift and the seasonal shift of the large circulation over Nepal. In winter, precipitation falls as snow on higher peaks of Kathmandu valley. This precipitation originates from disturbances in westerlies. In the summer monsoon, as the rain-bearing winds approach Kathmandu from the southeast, most rainfalls on the windward side, increasing with altitude and decreasing on the leeward side.
4.1 pre-monsoon
Rainfall during this period, March to May, is only 12 per cent of the annual total in the Kathmandu valley. Most of this is due to scattered thunderstorm activity in the afternoon and late evening. Due to the outbreaks of warm air and atmospheric instability, the sup-tropical westerly jet-stream is weakening over Nepal.
4.2 Summer monsoon
In Kathmandu, 81 per cent of the annual precipitation falls between June and September under the in uence of summer monsoon. Fig. 3 shows the mean monsoon rainfall in the Kathmandu valley. The rainfall in Kathmandu valley varies greatly from place to place due to sharp topographical variations. In the summer monsoon period, generally, Sundarijal is the windward side of the Kathmandu valley. The intensity of the summer monsoon uctuates year by year. A delay in the arrival of the summer monsoon and any weakness in its circulation has a signi cant effect on agriculture. Generally, the average dates on the onset and retreat of the
Month Multiple regression value (Mv1)
Two relevant terms
Jan .59 X2, YFeb .61 X2, XMar .71 X2, Y/Z2
Apr .53 X/Z2, Y/ZMay .73 Y/Z2, XJun .78 X/Z2, Y/Z2
Jul .83 Y/ Y/Z2
Aug .93 X2, Y/Z2
Sep .68 X2, ZOct .47 X2, XNov .46 X2, Y/ZDec .30 X2, XAnnual rainfall .86 X2, Y/Z2
Monsoon rainfall
.86 X, Y/Z2
Table 3. The relevant terms for the rainfall analysis
observation occurs. Similar studies of monthly and annual rainfall for the period 1968-76 for the Kathmandu valley have been studied and these also gave a similar pattern (Nayava 1979). For a matter of convenience, the observed rainfall of the 11 stations in the Kathmandu valley is given in bold number in rainfall maps.

AREAL RAINFALL IN KATHMANDU VALLEY 49
monsoon for the period 1948-1975 are 12 June and 21 September respectively (Dep. Of Irrig., Hydrol.& Met. 1977)
4.3 Post monsoon Rainfall during October is only 5 per cent of the annual total and is due to the scattered thunderstorm activity in this transitional season from summer monsoon to winter.
4.4 Winter
The period from November to February is almost dry. Western disturbances account for only 2 per cent of the annual rainfall total.
4.5 Mean annual rainfall
Mean annual rainfall (Fig. 4) has similar patterns of distribution to that of the mean monsoon rainfall. Mean annual precipitation varies from 1300-2800 mm as shown in Fig. 4. The observed rainfall data and computer produced isohyetal lines based on rainfall interpolated are as expected in good agreement. The percentage of seasonal rainfall
Fig. 4. Mean annual precipitation (mm) 1971-1976
in Kathmandu Tribhuwan Airport (T.A) is also shown in Table 4.
Year Pre-mon-soon
Monsoon Post monsoon
Winter Total (mm)
1968 180.4 1000.3 160.4 38.6 1379.7
1969 161.9 965.0 40.3 12.0 1179.2
1970 154.6 1081.6 58.2 67.9 1362.3
1971 318.9 1101.7 81.2 9.5 1511.3
1972 60.8 968.0 86.1 46.5 1261.4
1973 154.9 1454.0 119.3 71.6 1799.8
1974 162.2 983.2 45.6 34.0 1225.0
1975 119.2 1221.1 34.2 56.0 1430.5
1976 222.0 1199.6 24.3 44.7 1490.6
181.7 1108.3 72.2 42.3 1404.4
13% 79% 5% 3%
Table 4. Variation of seasonal rainfall (mm) in Kathmandu
(Tribhuban International Airport)
5. Conclusion
Each gird point is representative of about 0.81sq. km which contrasts with the distribution of of cial stations which may be separated by many kilometers. The monthly mean precipitation is estimated for a large number of grid points in a grid net for studying the mesoscale variation and distribution of rainfall in the 936 km area of Kathmandu valley and its surrounding regions. The advantages achieved from examination of rainfall on the close grid net are clearly seen in the diagram in which sharp variations in the topography of Nepal are associated with a large rainfall.
Acknowledgements
I sincerely acknowledge Dr. N.S. Mc Donald for his suggestions and comments on this paper. I am indebted to Mr. D. N. Body for permitting me to use his program and his remarks on this paper. I offer sincere thanks to Miss M. Johnson for her assistance and helpful discussion on programming.
50 JANAK L. NAYAVA50
I would also like to thank Mrs. P. Millwood for her assistance in cartography and Gennesse Winch for the typing.
References
Body, D.N., 1973, Provision of areal rainfall data for application in major hydrologic investigations, Hydrology Symposium, Perth, Aug 8-11, The Institute of Engineers, Australian National Conference publication No. 73/3, pp. 15-20.
Body, D.N., 1978 , Land use on the South Coast of New South Wales, 2 , Bio-Physical Background studies, CSIRO, pp. 3-4.
Cressman, G.P., 1959, An operational objective analysis system, Mon. Weath. Rev., 87, pp. 367-374.
Department of Irrigation Hydrology and Meteorology 1977, Climatological Records of Nepal, 1971-75, Vol.I, HMG of Nepal, Kathmandu.
Department of Irrigation, Hydrology and Meteorology, 1977, Climatological Records of Nepal, 1921-75, Vol.II, HMG of Nepal, Kathmandu.
Gandin, L.S., 1963, Objective analysis of meteorological elds, Gidrometeoizdat, Leningrad.
Main, R and Gauntlett, D.J., 1968, Modi catios to an operational numerical weather analysis system and application to rainfall, J. appl. Met., 7, 1, pp. 18-28.
Nayava, J.L., 1979, Topoclimatology of the Kathmandu Valley, Proc. Tenth New Zealand Geography Conference and Forty ninth ANZAAS Congress, Geographical Sciences, Auckland, pp. 33-38
51
Rainfall In Nepal*
Rainfall is a most important climatic element for agricultural development. Conventional 30 year rainfall data are available at only a few places in Nepal. Therefore, a study has been undertaken to nd the average normal rainfall period compared to a 30 year normal rainfall in Nepal, and the available rainfall data has been standardized for a large number of places. The nature of the rainfall–its amount, seasonal distribution, intensity, frequency of occurrence, variability and areal variation is a major factor affecting agricultural potential. To understand the nature of the rainfall, it is essential to have an understanding of its general causes.
GENERAL FEATURES OF THE ATMOSPHERIC
CIRCULATION OVER NEPAL
Studies of lower and upper tropospheric atmospheric circulation in Nepal suggest that the rainfall distribution can be analysed with four distinct seasons1 pre-monsoon (March to May); summer monsoon (June to September); post-monsoon (October); and winter (November to February).
In the pre-monsoon season, moderate to strong westerly winds prevail throughout Nepal.
Scattered rainfall occurs during this period and there is marked increase in temperature of about 3-40 C in the month of March. Due to the outbreak of the warm air and the atmospheric instability, the subtropical westerly jet-stream weakens over Nepal. As summer approaches, fogs become less frequent in the Valley and haze predominates from the southern to the Hill Regions of Nepal.
The summer monsoon is the most important season in Nepal for agriculture with nearly 60 to 90 percent of annual precipitation falling between June and September (Fig. 1). The author, in an earlier study of the summer monsoon in Nepal and South Asia was able to detect the basic types of monsoonal circulation patterns which allows to the summer monsoon to be generally classi ed according to (a) active or normal (b) very active and (c) weak.
a) During the summer monsoon, the easterly wave dominates the upper level of the atmosphere and the subtropical westerly jet–stream shifts to the northern side of the Tibetan plateau, around an anticyclone called the Tibetan High produced by the thermal effect of this heat source.2 At
- Janak L. Nayava**
* This paper is based upon the author's unpublished doctoral thesis entitled "Climates of Nepal and their implications for Agricultural Development" submitted to the Australian National University, Canberra in 1980.
** Janak L. Nayava is a Senior Meteorologist in the Department of Irrigation, Hydrology and Meteorology, Babar Mahal, Kathmandu.
1 J.L Nayava, "The summer monsoon in Nepal and Southern Asia" Unpublished M.Sc. dissertation, Birmingham University, U. K., 1974.
* This paper was published in the Himalayan Review, Vol. 12, 1980
The Himalayan ReviewNepal Geographical Society

52 The Himalayan Review
the surface, an elongated zone of low pressure develops along the Indogangetic plains of North India, which lies northwest to southeast. This area of low pressure is known as the monsoon trough or equatorial trough, which, of course, advances northwards in the summer monsoon months and retreats southwards in the post-monsoon period.Therefore the onset and withdrawal of monsoons are associated with northward and southward movement of the equatorial trough.3
Generally, depressions form in the Bay of Bengal twice per month, during the summer monsoon season, corresponding to a period of about 17 days.4 Depressions usually move WNW and cease activity as they move over the Indogangetic plain.On rare occasions, a depression may move due north from the Bay of Bengal and Assam at the height of the monsoon season bringing heavy rainfall to the north and northeast of the monsoon depression. The recurvature of such a depression is often found to be due to the effect of a westerly wave moving east, north of latitude 300N. Recurvatures of monsoon depressions are common towards the end of the summer monsoon.5
b) During the period of very active monsoon, the westerlies occasionally move south to the
Tibetan plateau and even as far as Delhi and the easterly jetstream often shifts northwards. The easterlies are very strong up to 200N. During that time, Paci c anticyclone circulation extends up to the northwest of Burma and the mid-latitude Saudi Arabian Subtropical high extends a ridge eastwards even to the northwest of India. Hence, Nepal nds itself in the col position (Fig. 2). If the Saudi Arabian ridge pushes more towards the east, i.e WNW (200mbs) wind dominates western Nepal, then rainfalls are heavy towards the central and the eastern part of Nepal. If the Paci c ridge pushes more towards the west higher intensity of rainfall occurs all over Nepal. At that time, the monsoon trough lies over 250N latitude. Examples of three dimensional circulation over Nepal are shown in Figs. 2 and 3. During such periods less rain falls in central India, being instead concentrated either in part or the whole of Nepal depending upon the mid-latitude anticyclones. Under these conditions, one part of Nepal could be drier and the other part may be much wetter. Actually, such a period is known as a "break in the monsoon" in India.
c) During a weak monsoon over Nepal, easterlies are weak and lie over 150N in the Indian
2 P.Koteswarm "The Asian Summer Monsoon Circulation over the Tropics " Monsoons of the world (New Delhi:India Met .Dept.,1958), pp.105-110; H Flohn, "Contributions to the meteorology of the Tibetan Highlands" Atmos Sci. Paper No.130, Dept.of Atmos Sci., Colorado State Uni., 1968.
3 R. Ananthakrishnan and C .J. Rajagopalachari " Patterns of Monsoon Rainfall Distribution over India and Neighbourhood ". Proc of Symposium on Trop . Meteor . (Wellington: New Zealand Met.Service 1964), pp.192-200.
4 F. R. Miller and R.N. Keshavmaurthy, "Structures of an Arabian sea summer monsoon system" East west centre, Honolulu, Intl. Indian Ocean Exp. Meterol ,Monogr., 1965.
5 K. Parathasarathy, "Some aspects of the rainfall in India during southwest monsoon season", Monsoons of the world (New Delhi; India Met. Dept. 1958), pp. 185-194; C.S. Ramage, "Monsoon Meteorology" Int'l Geophy, Series, 15 (London Academic Press, 1971), pp. 296; Y. P. Rao and B.W. Desai, "The Indian summer Monsoon" Met. Geophys. Rev, Vol. 4, (1973), pp. 1-18; J.L. Nayava, "Heavy monsoon rainfall in Nepal", Weather, Vol. 29 (1974), pp. 443-450.

Rainfall In Nepal 53
Fig. 1. Monsoon rainfall as a percentage of annual rainfall.
Fig. 2. Three dimensional atmospheric circulation over Nepal and adjacent countries on 30th June 1975, 00 GMT
Fig. 3. Three dimensional atmospheric circulation over Nepal and adjacent countries on 22nd June 1975, 00 GMT
subcontinent. The uctuation and intensity of the monsoon are very much related to variations in the easterly current. The post-monsoon season is the harvesting season of the main crop, paddy. Strictly speaking, this is the transitional period from one season to another and at this time the subtropical westerly jetstream retreats from the northside of the Tibetan Plateau
to the southern side of the Nepalese Himalayas. Frequent fogs again appear over the valleys.
In the winter season, the lower tropospheric wind blows mostly from the west-north-west in the western Nepal and east-north-east in the eastern Nepal. They are continental, dry and the wind is calm and brings settled and dry periods in Nepal. On the other hand, in the upper troposphere,

54 The Himalayan Review
Fig. 4. Percentage deviations from the available long term mean against time.
6 Department of Hydrology and Meterology; "Climatological Records of Nepal, 1966" (Kathmandu: HMG of Nepal 1968) ; "Climatological records of Nepal 1967-68" (Kathmandu: HMG of Nepal, 1974); "Climatological Records of Nepal, 1969" (Kathmandu: HMG of Nepal, 1972); Department of Irrigation, Hydrology & Meteorology, "Climatological Records of Nepal 1970" (Kathmandu: HMG of Nepal 1973): "Climatological Records of Nepal, 1921-75", Vol. II (Kathmandu: HMG of Nepal, 1977).
7. Mean monthly and annual rainfall standardized to 1956-1965 for 168 stations and their locations are under publication (see key Fig. 5 for 168 meteorologial station network).
the subtropical westerly jetstream lies over the southern side of the Himalayas. Almost daily morning fogs appear in most of the valleys in Nepal. Occasionally, the westerly disturbances bring cold spells and rain, particularly to the north- west corner of Nepal.
RAINFALL DATA
Conventional 30 year mean rainfall data are available at only a few places in Nepal. There are, however, 68 stations covering the different regions with a minimum of twenty years of records.6 To establish whether any bias is introduced by using 20 years averaged data instead of the normal 30 years, the mean rainfall at Kathmandu for 5, 10, 15 …… years starting from 1921 were calculated. The percentages deviations of these means from the long term mean are plotted against time as shown in Fig. 4. This information indicates that 20 years average rainfall is close to the 30 years normal rainfall. Therefore, the years 1956-1975 inclusive
were chosen as the period to investigate the mean monthly and annual rainfall in Nepal. In addition, there are a hundred stations whose records cover only part of this period and the missing data for 100 stations have been estimated by linear regression based on the nearest station which has a longer period of record to develop a complete record for the 168 stations for 1956-19757. The standardized mean monthly values have been used to study the macroscale variation and distribution of rainfall over Nepal. At the same time, the seasonal rainfall at selected places (Table 1) has been shown for better illustration of seasonal rainfall over Nepal. This shows that the percentage of seasonal rainfall is broady similar except in the far western Mountain Regions, where the percentage of rainfall differs greatly from other places, for example, Jumla receives 69 percent of its rainfall from the summer monsoon, whereas the other regions receive 80 to 90 percent from the summer monsoon rainfall. Mean monthly rainfall at the selected places has also been presented to show the pattern of rainfall

Rainfall In Nepal 55
8 C.G. Simpson, "The south west Monsoon" Quart. J. Roy. Meteor. Soc., Vol. 47, (1921), PP. 151-172.
by Fig. 6. This demonstrates that the rainfall falls mostly in the summer monsoon season and this varies greatly from place to place within a small distance. In other words, Nepal has distinct wet and dry seasons.
ANALYSIS
Mean monsoon and Annual Rainfall
Mean monsoon rainfall and mean annual rainfall are shown in Figs. 7 and 8. The rainfall in Nepal varies greatly from place to place due to sharp topographical variations. As the rain bearing winds approach Nepal from the southeast in the summer monsoon season, heavier rainfall falls in the foothills of the Churiya range increasing with altitude on the windward side and sharply decreasing on the leeward side. The heaviest rainfall falls on the Hill Regions, especially in the Pokhara region, Ultimately, the foothills of the Great Himalayas receive less rain than the other areas (Fig.7).
There are a few isolated rainfall maxima exceeding 2500 mm i.e. Dharan. Barakshetra, Num, Harihapur-Gadhi, Gumthang, Butwal, Pokhara, Lumle, Rukumkot and Chispani Karnali. In particular, Lumle near Pokhara receives about 5180 mm rain, whereas Pokhara Hospital in the valley oor, receives an annual total of only 3584 mm-a re ection of sharp topographical differences over short distances. In similar situations of heavy rainfall at Cherapungi, Assam, simpson (1921)8 remarks that heavy fainfall is due to the rapid rise of warm saturated air blowing with a great velocity so heavy precipitation falls on the top of the hills.
On the other hand, in contrast to the heavy rainfall, there exist very low rainfall areas, such as Jomosom, 273 mm, annual total on the northern side of the great Himalaya in a rain shadow area. This lower rainfall is due to the alignment of the neighboring mountains which prevent a large in ow of moist air into the region.
Fig. 5. 168 Meteorological Station Net-work.

56
Fig. 6. Variations of mean monthly rainfall at selected places
Fig. 7. Mean monsoon rainfall (mm) June-September, 1956-1975, Nepal
Fig. 8. Mean annual precipitation (mm), 1956-1975, Nepal
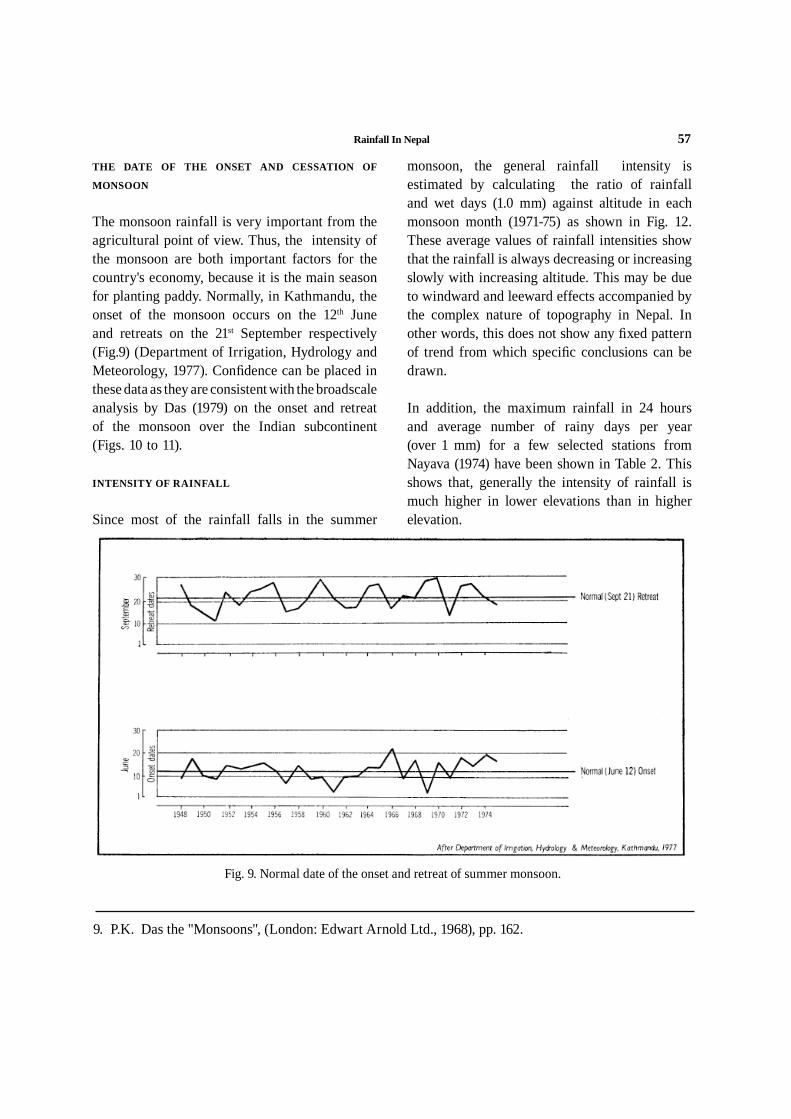
Rainfall In Nepal 57
THE DATE OF THE ONSET AND CESSATION OF
MONSOON
The monsoon rainfall is very important from the agricultural point of view. Thus, the intensity of the monsoon are both important factors for the country's economy, because it is the main season for planting paddy. Normally, in Kathmandu, the onset of the monsoon occurs on the 12th June and retreats on the 21st September respectively (Fig.9) (Department of Irrigation, Hydrology and Meteorology, 1977). Con dence can be placed in these data as they are consistent with the broadscale analysis by Das (1979) on the onset and retreat of the monsoon over the Indian subcontinent (Figs. 10 to 11).
INTENSITY OF RAINFALL
Since most of the rainfall falls in the summer
monsoon, the general rainfall intensity is estimated by calculating the ratio of rainfall and wet days (1.0 mm) against altitude in each monsoon month (1971-75) as shown in Fig. 12. These average values of rainfall intensities show that the rainfall is always decreasing or increasing slowly with increasing altitude. This may be due to windward and leeward effects accompanied by the complex nature of topography in Nepal. In other words, this does not show any xed pattern of trend from which speci c conclusions can be drawn.
In addition, the maximum rainfall in 24 hours and average number of rainy days per year (over 1 mm) for a few selected stations from Nayava (1974) have been shown in Table 2. This shows that, generally the intensity of rainfall is much higher in lower elevations than in higher elevation.
Fig. 9. Normal date of the onset and retreat of summer monsoon.
9. P.K. Das the "Monsoons", (London: Edwart Arnold Ltd., 1968), pp. 162.

58
Fig 10. Normal dates of onset of monsoon.
Fig. 11. Normal dates of retreat of monsoon.Fig. 12. The ratio of rainfall and wet day710 mm,
against altitude, 1871-1975.
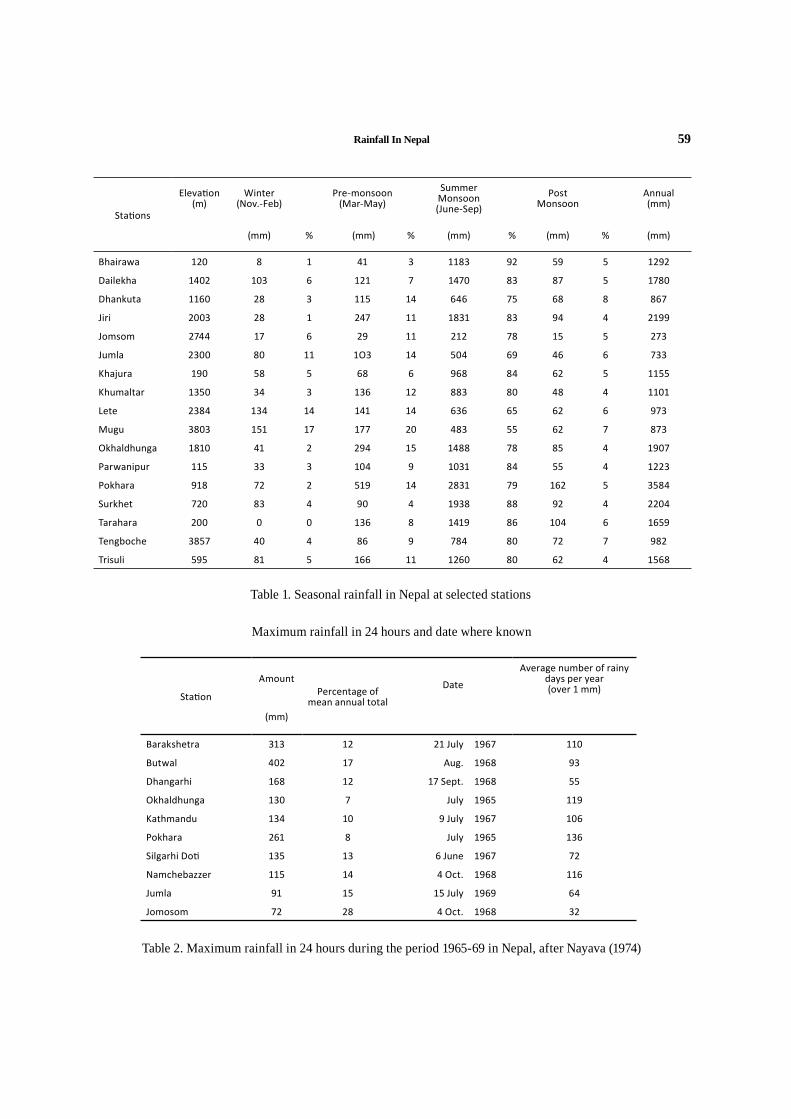
Rainfall In Nepal 59
Table 1. Seasonal rainfall in Nepal at selected stations
Sta ons
Eleva on (m)
Winter(Nov.-Feb)
Pre-monsoon(Mar-May)
Summer Monsoon(June-Sep)
Post Monsoon
Annual (mm)
(mm) % (mm) % (mm) % (mm) % (mm)
Bhairawa 120 8 1 41 3 1183 92 59 5 1292
Dailekha 1402 103 6 121 7 1470 83 87 5 1780
Dhankuta 1160 28 3 115 14 646 75 68 8 867
Jiri 2003 28 1 247 11 1831 83 94 4 2199
Jomsom 2744 17 6 29 11 212 78 15 5 273
Jumla 2300 80 11 1O3 14 504 69 46 6 733
Khajura 190 58 5 68 6 968 84 62 5 1155
Khumaltar 1350 34 3 136 12 883 80 48 4 1101
Lete 2384 134 14 141 14 636 65 62 6 973
Mugu 3803 151 17 177 20 483 55 62 7 873
Okhaldhunga 1810 41 2 294 15 1488 78 85 4 1907
Parwanipur 115 33 3 104 9 1031 84 55 4 1223
Pokhara 918 72 2 519 14 2831 79 162 5 3584
Surkhet 720 83 4 90 4 1938 88 92 4 2204
Tarahara 200 0 0 136 8 1419 86 104 6 1659
Tengboche 3857 40 4 86 9 784 80 72 7 982
Trisuli 595 81 5 166 11 1260 80 62 4 1568
Table 2. Maximum rainfall in 24 hours during the period 1965-69 in Nepal, after Nayava (1974)
Sta on
Amount Percentage of
mean annual total
DateAverage number of rainy
days per year(over 1 mm)
(mm)
Barakshetra 313 12 21 July 1967 110
Butwal 402 17 Aug. 1968 93
Dhangarhi 168 12 17 Sept. 1968 55
Okhaldhunga 130 7 July 1965 119
Kathmandu 134 10 9 July 1967 106
Pokhara 261 8 July 1965 136
Silgarhi Do 135 13 6 June 1967 72
Namchebazzer 115 14 4 Oct. 1968 116
Jumla 91 15 15 July 1969 64
Jomosom 72 28 4 Oct. 1968 32
Maximum rainfall in 24 hours and date where known

60 The Himalayan Review
DISCUSSION
These mean monthly rainfall data, standardized for 168 places in Nepal, will be further used to investigate the distinctive feature of rainfall regimes and soil moisture studies which are one of the basic data to nd out the potentiality of agriculture
in different regions with respect to availability of weekly rainfall amount. These standardized mean monthly rainfall data are one of my contributions to climatic analysis and agro-climatology. This makes possible a more detailed description on the macroscale variation and distribution of rainfall over Nepal.

61
Environmental Impacts on Agricultural Development*
Background and Approach
For the past fteen years, the Nepal Meteorological Service has put most of its efforts in providing basic day to day information for the aviation industry as prescribed by the World Meteorological Organization and the International Civil aviation Organization. Along with this service, general public weather forecasts for twenty four hours are issued for Kathmandu and other regions. Recently, special weather forecasts for mountaineering expeditions are also issued. In addition to these existing facilities, there is need to encourage the applications of meteorology and climatology to other elds, among the most essential being engineering and agricultural science as they appertain to the economic development of the country. Since Nepal’s economy is based on agricultural productivity, it is essential to study the role of climate in relation to crop production. Research should allow a more informed judgment to be made when selecting different crops, appropriate to meeting the demand for food of the increasing population. Furthermore, when a new crop is being introduced to developed areas or a developed crop on new areas, one has to explore the weather and climate of those areas in order to maximize productivity. Climatological analysis can save years of easily trial and error.
Recognizing that climate and weather play a dominant role in the crop strategies, a study for Nepal has been attempted to demonstrate how using a model approach, much climatic based
information relevant to regional agricultural planning can be generated (Nayava, 1980). Due to the mountainous nature of the country, a study of topo-climatology (Nayava, 1979) has also been considered in order to obtain a more detailed understanding of climate as a basis for assessing the potential for agricultural development at the meso or regional scale.
Climate
Although Nepal is a small country, it has a great variety of topography which plays an important role in creating a diversity of weather and climate. Nepal experiences tropical, mesothermal, microthermal, taiga and tundra climate (Nayava, 1975). The highest mean maximum temperature of 39.30C was recorded in far western Nepal and the lowest mean minimum temperature was -9.70C at Tengboche meteorological station at 3857 m. The extreme minimum temperature was -17.90C at Tengboche. The highest mean annual rainfall during 1956-1975 was 5180 mm at Lumle and the lowest 273 mm at Jomosom.
In Nepal, 60-90% of the annual precipitation falls between June and September under the in uence of the summer monsoon. The rainfall varies greatly from place to place due to sharp topographical variations (Nayava, 1974, 1980). As the rain bearing winds approach from the southeast in the summer monsoon season, more rainfall occurs over the foothills of the Churia Hills, increasing with altitude on the windward side and sharply
Janak lal Nayava**
* This article was published in Nepal Nature's Paradies, Edited by T.C.Majupuria, 1984-85** Dr. Janak Lal Nayava, M.Sc., Ph.D., Dept. of Irrigation, Hydrology & Meteorology, H.M.G., Kathmandu
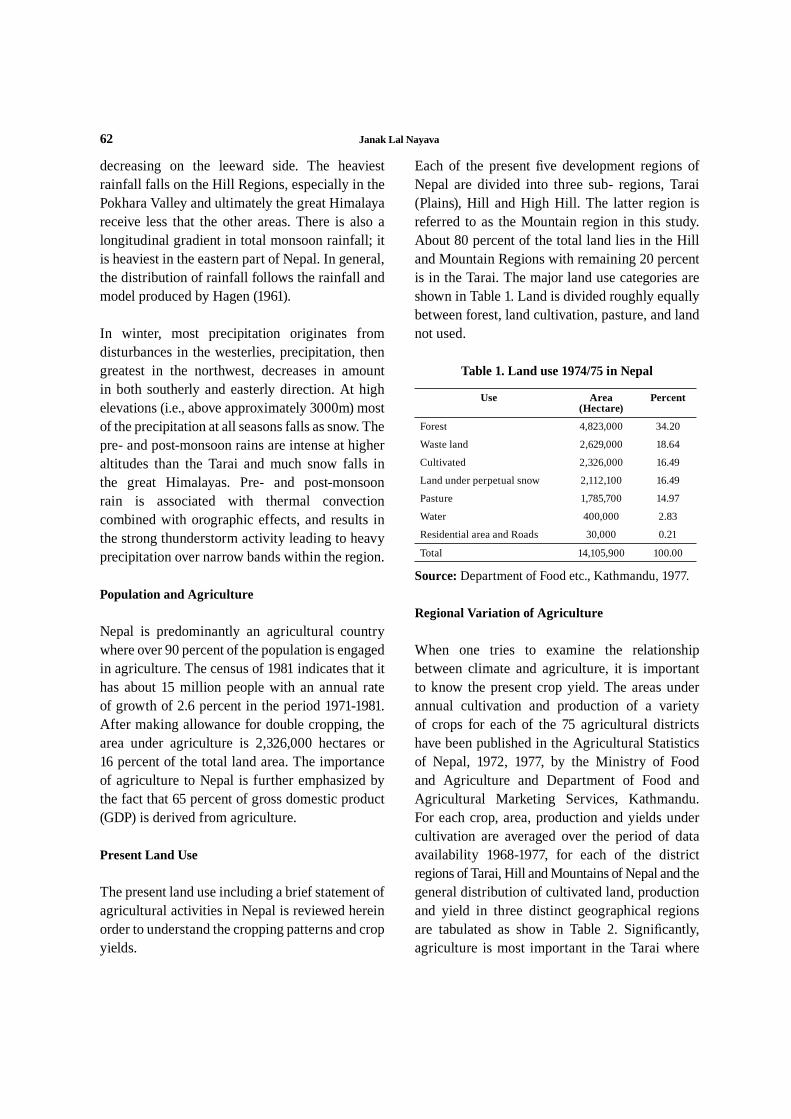
62 Janak Lal Nayava
decreasing on the leeward side. The heaviest rainfall falls on the Hill Regions, especially in the Pokhara Valley and ultimately the great Himalaya receive less that the other areas. There is also a longitudinal gradient in total monsoon rainfall; it is heaviest in the eastern part of Nepal. In general, the distribution of rainfall follows the rainfall and model produced by Hagen (1961).
In winter, most precipitation originates from disturbances in the westerlies, precipitation, then greatest in the northwest, decreases in amount in both southerly and easterly direction. At high elevations (i.e., above approximately 3000m) most of the precipitation at all seasons falls as snow. The pre- and post-monsoon rains are intense at higher altitudes than the Tarai and much snow falls in the great Himalayas. Pre- and post-monsoon rain is associated with thermal convection combined with orographic effects, and results in the strong thunderstorm activity leading to heavy precipitation over narrow bands within the region.
Population and Agriculture
Nepal is predominantly an agricultural country where over 90 percent of the population is engaged in agriculture. The census of 1981 indicates that it has about 15 million people with an annual rate of growth of 2.6 percent in the period 1971-1981. After making allowance for double cropping, the area under agriculture is 2,326,000 hectares or 16 percent of the total land area. The importance of agriculture to Nepal is further emphasized by the fact that 65 percent of gross domestic product (GDP) is derived from agriculture.
Present Land Use
The present land use including a brief statement of agricultural activities in Nepal is reviewed herein order to understand the cropping patterns and crop yields.
Each of the present ve development regions of Nepal are divided into three sub- regions, Tarai (Plains), Hill and High Hill. The latter region is referred to as the Mountain region in this study. About 80 percent of the total land lies in the Hill and Mountain Regions with remaining 20 percent is in the Tarai. The major land use categories are shown in Table 1. Land is divided roughly equally between forest, land cultivation, pasture, and land not used.
Use Area (Hectare)
Percent
Forest 4,823,000 34.20
Waste land 2,629,000 18.64
Cultivated 2,326,000 16.49
Land under perpetual snow 2,112,100 16.49
Pasture 1,785,700 14.97
Water 400,000 2.83
Residential area and Roads 30,000 0.21
Total 14,105,900 100.00
Regional Variation of Agriculture
When one tries to examine the relationship between climate and agriculture, it is important to know the present crop yield. The areas under annual cultivation and production of a variety of crops for each of the 75 agricultural districts have been published in the Agricultural Statistics of Nepal, 1972, 1977, by the Ministry of Food and Agriculture and Department of Food and Agricultural Marketing Services, Kathmandu. For each crop, area, production and yields under cultivation are averaged over the period of data availability 1968-1977, for each of the district regions of Tarai, Hill and Mountains of Nepal and the general distribution of cultivated land, production and yield in three distinct geographical regions are tabulated as show in Table 2. Signi cantly, agriculture is most important in the Tarai where
Table 1. Land use 1974/75 in Nepal
Source: Department of Food etc., Kathmandu, 1977.

Janak Lal Nayava 63
two thirds of the available land is cultivated. In the other regions, a small percentage of land is cultivated e.g 30 percent in the Hill Region and 6 percent in the Mountain Region.
Paddy cultivation occupies over half of the agricultural land. Other major crops are maize (19%) and wheat (11%). Small areas of millet, barley, potato, mustard, sugarcane, jute and tobacco complete the main agricultural pattern. Besides these crops, tea, cardamom, pulses, varieties of vegetables and fruit are grown on a small scale.
As shown in Table 2, yield per hectare does not vary greatly from region to region, and one has to examine data at the district level to nd appreciable variations. The crops are grown over a wide range of environments varying in altitude from 100-4000 m. traditional crops are grown, no matter how small the yield.
Despite the importance of agriculture in Nepal, crop yields are per unit area have remained static during 1968-77 (Table3). However, Shahi (1976) claimed that a yield of 3-4 tonnes per hectare of paddy can be produced by improved HYV in the Tarai. Similarly, the annual report of the National Wheat Development Program, Nepal 1975-1976, mentions that technology for producing more than three tonnes per hectare in the Tarai is available, but has not been implemented.
Seasonal Cropping Patterns
There are two cropping seasons in Nepal. One is the wet season including the summer season which generally begins in April and ends in October, but the main intensive agriculture period lies only in July-September due to summer monsoon rainfall. The wet season crops are paddy, maize, millet and Jute. The other is the dry season crops which are wheat, barley, mustard, tobacco and potato. Potato
is considered here as a dry season crop in the Tarai Region and a wet season crop in the Hill and Mountain Region.
Figure 1 shows the seasonal cropping pattern in 1968-1977. This has been generalized from the available district-wise crop data. This study indicates that the Tarai Region is more cultivated than the other regions. The dominant features of the cropping pattern are wet season in agriculture in the whole of Nepal except in the far western Mountain regions of Nepal, where dry season agriculture is also dominant in the cropping pattern. This is mainly due to high altitude and lower rainfall in the far Western Mountain Region, where barley or wheat is cultivated which takes nearly ten months for maturity.
Land Tenure Characteristics of farming and Irrigation
Many owner farmers and tenants utilize an average of less than one hectare per family (Table 4). The annual crop production provides a major portion of the total farm family income. Over the ten year period from 1968-1977, there was a general increase of cultivated land due to the pressure of increasing population in all regions. The highest increment in agricultural land use has been achieved by forest clearing in the Tarai, an area previously regarded as unsuitable for settlement due to extremely high temperatures and the presence of malaria. The latter has now been controlled to a large degree. Only after the 1950’s more people began to settle in the Tarai. Hjort (1975) shows the population and land area in the main region of Nepal, noted as follows in Table 5.
Irrigated land area in Nepal accounts for only 7.7 percent. As most agriculture is rain-fed, this 7.7 percent seems to be made up of both canals and casual hill-side system. The percentage of irrigation is a crudely approximation
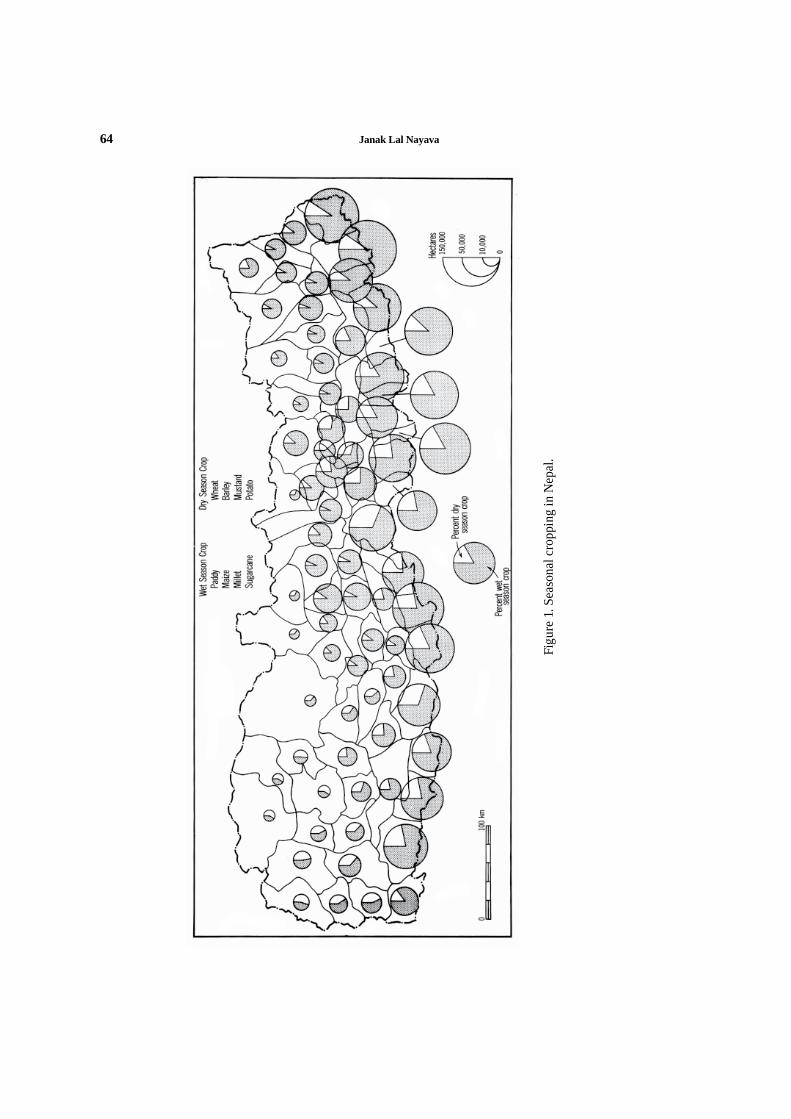
64 Janak Lal Nayava
Figu
re 1
. Sea
sona
l cro
ppin
g in
Nep
al.

Janak Lal Nayava 65
measurement. The authorities have been raising questions as to why the yield is low in Nepal and what can be done to improve the yields. Hagen (1976) discussed many constraints to achieve agricultural production goals in Nepal.
Regions Crop Area(Hectares)
Production(Tonnes) Yield (Tonnes/Hectares) % of land
cultivation
Tarai Paddy 996,110 1,802,991 1.81 43.89
Hill 184,037 457,881 2.44 8.12
Mountain 19,888 45,189 2.23 0.87
Grand Total 1,200,035 2,306,061 52.88
Tarai Maize 136,178 218,896 1.57 6.00
Hill 263,706 497,079 1.88 11.62
Mountain 40,572 75,351 1.82 1.79
Grand Total 440,456 791,326 19.41
Tarai Wheat 152,427 155,294 1.01 6.72
Hill 85,313 98,027 1.13 3.75
Mountain 24,609 26,482 1.05 1.08
Grand Total 262,349 279,803 0.90 11.55
Tarai Millet 18,992 16,961 0.90 0.84
Hill 83,073 96,874 1.16 3.66
Mountain 15,034 18,040 1.20 0.66
Grand Total 117,099 131,875 5.16
Tarai Sugarcane 12,292 207,928 16.38 0.54
Hill 2,130 28,778 13.53 0.10
Mountain 119 1,514 2.86 0.00
Grand Total 14,541 238,220 0.64
Tarai Barley 7,224 5,052 0.07 0.32
Hill 10,046 9,744 0.96 0.45
Mountain 9,263 9,445 1.00 0.41
Grand Total 26,533 24,241 1.18
Tarai Potato 11,889 77,414 6.62 0.52
Hill 26,730 150,401 5.56 1.18
Mountain 10,814 52,726 4.86 0.48
Grand Total 49,433 288,541 2.18
Tarai Mustard 78,832 45,662 0.57 3.47
Hill 25,608 12,730 0.49 1.12
Mountain 1,641 670 0.42 0.07
Grand Total 106,081 59,062 4.66
So, research has to be promoted to nd what can be done to maximize production. As far as the author can ascertain there has been no research in the ef ciency of irrigation in Nepal. Further studies should examine the optimal use
Table 2. The distribution of cultivated land, production and yield in three distinct geographical regions of Nepal, 1968-1977.

66 Janak Lal Nayava
Paddy Maize Wheat
Year Area Prod Yield Area Prod Yield Area Prod Yield
1967-68 1.15 2.12 1.84 0.41 0.75 1.83 0.19 0.20 1.05
1968-69 1.16 2.18 1.88 0.42 0.76 1.81 0.21 0.23 1.10
1969-70 1.17 2.24 1.91 0.43 0.79 1.84 0.23 0.26 1.13
1970-71 1.18 2.30 1.95 0.45 0.83 1.84 0.23 0.19 0.83
1971-72 1.20 2.34 1.95 0.44 0.76 1.73 0.24 0.22 0.92
1972-73 1.14 2.01 1.76 0.45 0.82 1.82 0.26 0.31 1.19
1973-74 1.23 2.42 1.97 0.45 0.81 1.80 0.27 0.30 1.11
1974-75 1.24 2.45 1.98 0.46 0.83 1.80 0.29 0.33 1.14
1975-76 1.26 2.60 2.06 0.45 0.75 1.67 0.33 0.39 1.18
1976-77 1.26 2.38 1.89 0.46 0.80 1.74 0.35 0.36 1.03
of water and the implications of irrigation with regard to yield. A doubt has been expressed about the ef cient use of irrigation facilities. The problem is not the scarcity of water in irrigated areas, but the lack of knowledge of its best utilization (Karmacharya and Pyakurel,
Region No. of districts Population percentage Total Land area
percentage
Cultivated area
percentage
Mountain 16 9.6 33.0 4.8
Hill 36 47.2 43.5 27.3
Tarai 20 38.0 23.0 65.6
Kathmandu valley 3 5.2 0.5 2.7
Table: 3. Variation of major crops in area (million hectare), production (million tonnes) and yield (tonnes/hectare) in 1967-68 to 1976-1977.
Table 4. Farm holding and distribution by size after land
Size of Holding Household in percentages Area in percentages
Less than 1 ha 63.5 10.5
1-3 ha 19.5 18.0
3-5 ha 7.1 12.0
3-10 ha 5.8 21.0
10-15 ha 2.1 11.0
15-20 ha 0.9 7.0
20-30 0.5 5.5
30 and above 0.6 15.0
Total 100.0 100.0
Source: M.A. Zaman, Evaluation of land Reform in Nepal, 1972.
Table 5. Distribution of population and cultivated area
1976). The researchers remark that this is mainly due to lack of irrigation experts at the eld level. The irrigation service should be extended beyond the construction of dams and canals for the supervision of the ef cient use of water in farm lands.
Janak Lal Nayava 67
Agricultural Extension Program
A number of reports have been published about the impact of the agricultural extension program on agricultural production in Nepal (Ministry of Food, Agriculture and Irrigation, 1974, 1975). Similarly, Nepal Rastra Bank (1972) has discussed at considerable length, in selected districts, the potential changes in cropping pattern and net farm income that might result from the availability of credit at existing levels of technology. However, the impact of climate on crop variety and production for the different regions was not mentioned.
Crop Weather Analysis
Recently, considerable attention throughout the world has been devoted to crop-weather relationships and in particular to exploiting the potentialities of the climate for food production. WMO and FAO in both the national and international arenas have considerably increased their studies of the meteorological role in global food production as part of their early warning system on possible food shortages (WMO, 1975). Modi ed Crop-Weather model (Fitzpatrick and Nix, 1980) suitable to Nepalese thermal regimes have been developed (Nayava, 1980). At Present, crop yields are uniformly low and do not re ect environmental gradients. This suggests that a considerable scope exists for greatly increased crop yields in the more favourable environment (Nayava, 1981).
A Detailed Study of Topo-Climatology of the Kathmandu Valley
Due to the mountainous nature of the country, topo-climatology of the Kathmandu Valley has been studied (Nayava, 1979). This valley of 585 km2 in area, is a basin the rims of which rise to as much as 2765 metres from a relatively at valley oor at 1300-1400 metres. Data for rainfall and maximum
and minimum temperature were estimated for 1225 points on a 900 m grid. Global solar radiation and potential evapo-transpiration were estimated for 394 points (Nayava, 1980). Finally the major climatic elements of solar radiation, rainfall, maximum and minimum temperature provided the basis of topo-climatological study of the valley. The varieties of climatic regions associated with the Kathmandu valley were identi ed as follows using numerical taxonomy. Broadly, the Kathmandu valley can be divided into four mesoscale climatic zones: (I) the humid valley oor and mountain top (II) the subhumid south facing slopes (III) the wet, gentler north facing slopes and (IV) Wettest of all, the steeper north facing slopes.
A study of the topo-climatology of a smaller area is made in order to obtain a more detailed understanding of climate as a basis for assessing the potential for agricultural development on the meso or regional scale. The Kathmandu Valley was selected because it contained a reasonable network of meteorological stations including one synoptic station, ve agro-climatological stations and six rainfall stations.
This case study has broadened the understanding of the natural climatic potentials prevailing within short distance due to the mountainous nature of the country. A similar sort of variation of meso-scale climate may be expected in other parts of the hilly regions of Nepal; this has to be taken into account in the selection of crops according to climatic potential for optimum production.
Due to unavailability of detailed agronomic data and vegetation map of Kathmandu valley, the yields for different aspects have not been worked out. However, a few examples of crop yields virsus aspects have been stated. Recent studies of agricultural development in Jumla indicate that the warmer condition of the south eastern aspect of Jumla causes earliness in crop maturity
68 Janak Lal Nayava
and good yields (Whiteman, 1980). He further remarked that Jumla received only 50 percent of the normal monsoon rainfall during 1979. In consequence of this low rainfall, the crops were virtually a complete failure on the south facing slopes and 90 percent of normal on the north facing slopes. Klenert (1974) remarks that if sun-loving plants such as the grape vines are cultivated in a shady location, the qualities of new vines and the quantities of grapes are badly affected. In this way, climatic environment has a greater role to play in Hill than the Tarai regions due to the complexity of topography within a short distance. In other words, ecological conditions vary widely from region to region due to complexity of weather and climate in the Hill and mountains of Nepal. Therefore, climate and weather data should play a vital role in
Clearly fundamental research and the impacts of weather and climate on agriculture must be attempted to facilitate successful planning. This type of research will have many years of trial and error.
Discussion
The greatest potential area for agricultural development is no doubt, Tarai, but so far the yield per hectare in the Tarai is poor compared to Hill and Mountain regions. During the last decade, Nepal has implemented various agricultural projects in Tarai to produce more yields per hectare in the Tarai, but so far the results are not satisfactory. It is probably due to environmental or suitable cultivars or management or some other factors. The questions is not fully answered under these circumstances, one has to be very careful in agricultural development due to the complexity of weather and climate in Nepal. If development is sought, the selection of suitable crops with respect to agro-climatic conditions in an area is vitally important for optimum production, otherwise, it would be impossible to make reliable
recommendations if the nature and extent of environmental variations in the hills are not understood (Whiteman, 1979). Therefore, clearly fundamental research on the impacts of weather and climate in agriculture must be attempted to facilitate successful planning. Whiteman (1979) makes the following remarks in Hill agriculture development project in Nepal.
It should be remembered that the farmers have been practicing arable agriculture for centuries in the Jumla district, and in order to survive in their marginal cropping environment they have fund of knowledge in managing their arable resources to a
cropping systems. Dramatic improvements are neither obvious nor easy. It is for this reason that a rather more fundamental approach has to be adopted by examining the environmental resource base for production as a necessary prerequisite to generating improvements. There is always the
set targets to push an innovation which is merely a novelty and not an improvement, and so jeopardize credibility with our client farmers.
References
Department of Agriculture, National Wheat fo .G.M.H ,lapeN ,margorP tnempoleveD
Nepal, 1977.
Department of Food and Agricultural Marketing Services, Agricultural Statistics of Nepal,
1977.
Hagen, R., The Agricultural Development of Nepal, analysis of the Agricultural Sector, Agricultural experiment station, university of Missouri, Columbia, Intl. Series, special report 189, 1976.
Hagen, T., Nepal: The Kingdom in the Himalayas,
Janak Lal Nayava 69
Kummely and Frn., Geographical publishers, Bern, 1961.
Hjort, W.H., Assisting agricultural development in Nepal, Development Divs., E.R.S., U.S.A..in cooperating with U.S.Aid June, 1973.
Karmacharya, B.N. and Pyakurel, K.N., Role of extension worker in irrigated agriculture, National seminar on water management of control at the farm level, Kathmandu 1-7, DIHM, H.M.G. of Nepal, 1976.
Klenert, M, Arti cial change of the meteorological conditions in grape vines and the effect on the fertility of grapes and the growth of the berries, Diss. Glessen University, 1972.
Ministry of Food and Agriculture, Agricultural Statistics of Nepal, H.M.G. of Nepal, 1974.
Nayava, J.L., The summer monsoon in Nepal and southern Asia, M.Sc. dissertation, Birmingham University, England, 1974.
Nayava, J.L., Climates of Nepal, The Himalayan review, VII, 14-20, 1975.
Nayava, J.L., Topoclimatology of the Kathmandu valley, Proc. Tenth Newzealand Geography Conference &49 th ANZAAS Congress, Newzealand Geographical Society Conference Series No 10, 33-38, 1979.
Nayava, J.L., Climates of Nepal and their implications for Agricultural Development, Ph.D. Thesis submitted to Australian National University, 1980.
Nayava, J.L., A topoclimatological investigation of Solar Radiation in the Kathmandu Valley, Aust. Met. Mag. Vol. 28, No 2, pp.79-95,1980.
Nayava, J.L., Rainfall in Nepal, The Himalayan Review, Vol. 12, pp.1-18, 1980.
Nayava, J.L., A brief notes on climates and their implications for Agricultural development in Nepal, Eight summer crop work shop, Rampur Agricultural station, Rampur, Nepal, Jan. 25-29, 1981.
Nepal Rastra Bank,. Agriculture credit survey, Nepal, The Survey Report, Vol.1., Kathmandu, 1972.
Nepal Rastra Bank,. Agriculture credit survey, Nepal, Summary and Recommendations, Vol. IV, Kathmandu, 1972.
Whiteman, P., A review of investigations, 1977/78, Annual Report for Jumla Agricultural Farm, H.M.G. of Nepal, 1979.
Whiteman, P., Jumla Agricultural Station, Annual Report for 1979, Hill Agriculture Development Project, Nep/73/004, H.M.G. of Nepal, 1980.
W.M.O, Seventh World Meteorological Congress, Abridged Report with resolutions WMO, No.416, 255pp., 1975.

70
Centre for Climate and Agro-meteorological Studies (CCAS), Kathmandu
Abstract
Since last more than three decades of (1961/62 to 1996/97) assessments of crop yield and production were mainly based on expansion of agricultural land through clearing of forest; unfortunately the expansion is almost saturated. Therefore, it is conceived that the introduction of modern agro-technological package is most essential to have the optimum yield from the same parcel of land; and at the same time monitoring of crop yield must be strengthened under proper agencies. During the past decades, evaluations seem to poor. It is esteemed that Crop Estimation should be conducted along with the monitoring and evaluation headed by the member of Planning Commission who should be the Chairman of Technical Committee.
Monitoring and Evaluation of Crop Yield and Production in Nepal*
Introduction
take care of all the 75 districts of Nepal to survey crop area, yield and production. Statistical heads
enumerators to conduct the crop and livestock survey. This survey will take place twice a year during November/December and April/May for summer and winter crops. The data collected
Central Bureau of Statistics (CBS, Katmandu), who is currently authority to estimate crop data. Ultimately, CBS publishes all crop data by district as well as national basis. It is interesting to point out that the Ministry of Agriculture still forecasts the crop area, yield and production as national basis during September/October. This forecast is mainly based on reports from District Agriculture
Agriculture and Marketing Services (DFMAS) used to estimate the area, yield and production, the DFMAS began a close collaboration with
Department of Irrigation, Hydrology and Meteorology to incorporate water balance studies during 1984/85. At that time DFAMS had operating Early Warning Project for food security which is funded by FAO. It seems now that it is rather not followed up after the termination of Early warning Project in DFMAS during 1987/88. FAO mission was here to revive the project during 1996/97 and so far it has not implemented yet.
Crop yield and production in the national level
priority given in agricultural development in
plan (1997 -2001). Do we think that the targets have been achieved? If it is so, which factors had not played a good role and what had been done during that time to solve the problem? Is that problem solved or partly solved or new problem
1998) the Government of Nepal has been running the 20 year’s plans and programs for agriculture
* This article was published in Royal Nepal Academy of Science and Technology, Proceedings Vol.1, 1988-1999, pp 720-734
Janak Lal Nayava Shrestha
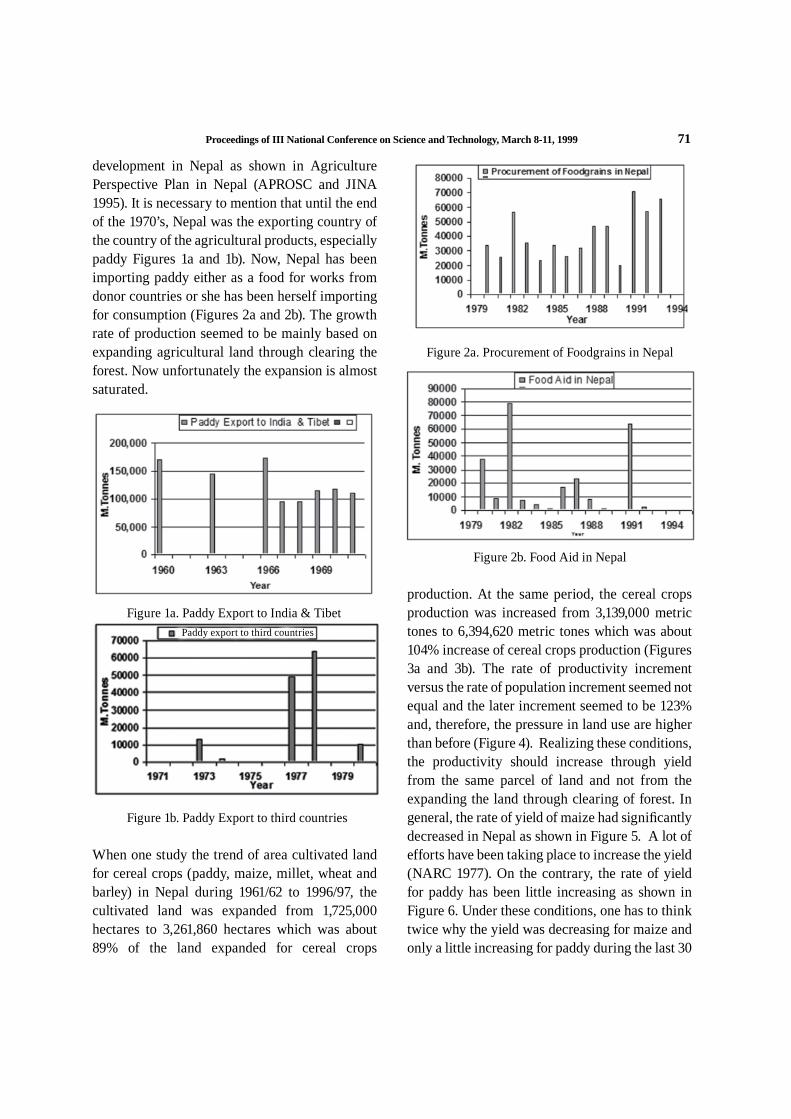
Proceedings of III National Conference on Science and Technology, March 8-11, 1999 71
development in Nepal as shown in Agriculture Perspective Plan in Nepal (APROSC and JINA 1995). It is necessary to mention that until the end of the 1970’s, Nepal was the exporting country of the country of the agricultural products, especially paddy Figures 1a and 1b). Now, Nepal has been importing paddy either as a food for works from donor countries or she has been herself importing for consumption (Figures 2a and 2b). The growth rate of production seemed to be mainly based on expanding agricultural land through clearing the forest. Now unfortunately the expansion is almost saturated.
When one study the trend of area cultivated land for cereal crops (paddy, maize, millet, wheat and barley) in Nepal during 1961/62 to 1996/97, the cultivated land was expanded from 1,725,000 hectares to 3,261,860 hectares which was about 89% of the land expanded for cereal crops
Figure 1a. Paddy Export to India & Tibet
Figure 1b. Paddy Export to third countries
Paddy export to third countries
Figure 2a. Procurement of Foodgrains in Nepal
Figure 2b. Food Aid in Nepal
production. At the same period, the cereal crops production was increased from 3,139,000 metric tones to 6,394,620 metric tones which was about 104% increase of cereal crops production (Figures 3a and 3b). The rate of productivity increment versus the rate of population increment seemed not equal and the later increment seemed to be 123% and, therefore, the pressure in land use are higher than before (Figure 4). Realizing these conditions, the productivity should increase through yield from the same parcel of land and not from the expanding the land through clearing of forest. In general, the rate of yield of maize had signi cantly decreased in Nepal as shown in Figure 5. A lot of efforts have been taking place to increase the yield (NARC 1977). On the contrary, the rate of yield for paddy has been little increasing as shown in Figure 6. Under these conditions, one has to think twice why the yield was decreasing for maize and only a little increasing for paddy during the last 30
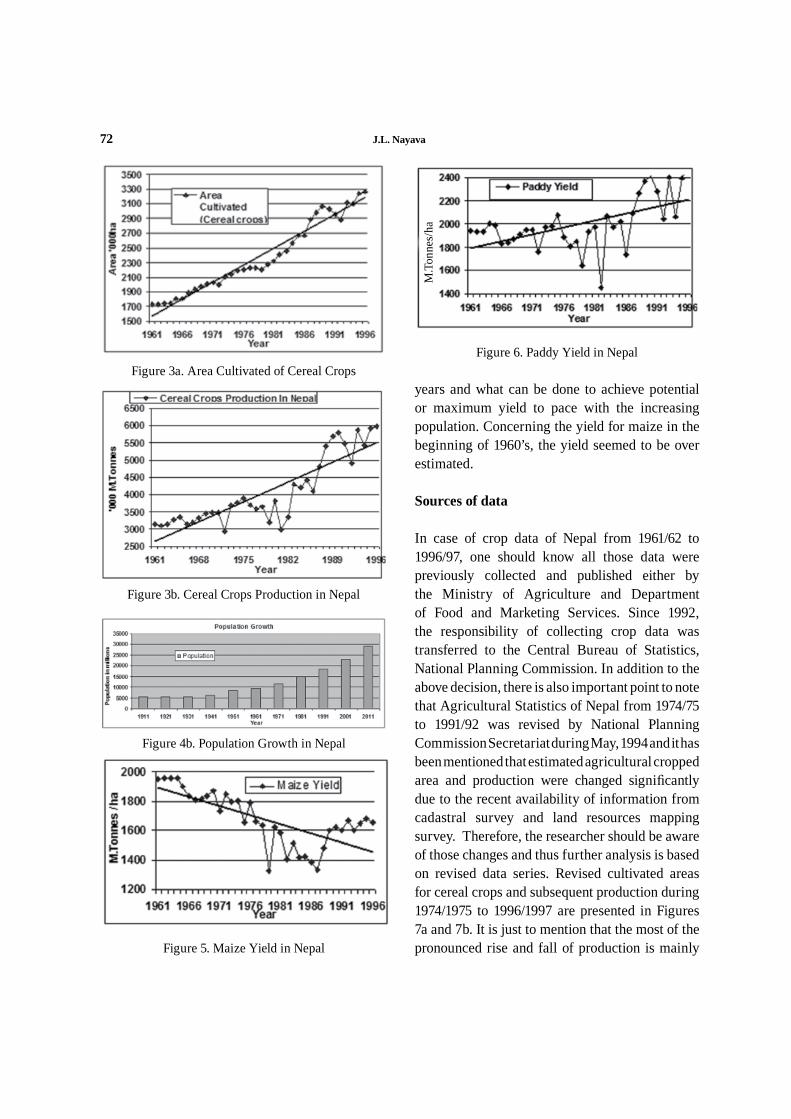
72 J.L. Nayava
Figure 3a. Area Cultivated of Cereal CropsFigure 6. Paddy Yield in Nepal
Figure 3b. Cereal Crops Production in Nepal
Figure 4b. Population Growth in Nepal
Figure 5. Maize Yield in Nepal
years and what can be done to achieve potential or maximum yield to pace with the increasing population. Concerning the yield for maize in the beginning of 1960’s, the yield seemed to be over estimated.
Sources of data
In case of crop data of Nepal from 1961/62 to 1996/97, one should know all those data were previously collected and published either by the Ministry of Agriculture and Department of Food and Marketing Services. Since 1992, the responsibility of collecting crop data was transferred to the Central Bureau of Statistics, National Planning Commission. In addition to the above decision, there is also important point to note that Agricultural Statistics of Nepal from 1974/75 to 1991/92 was revised by National Planning Commission Secretariat during May, 1994 and it has been mentioned that estimated agricultural cropped area and production were changed signi cantly due to the recent availability of information from cadastral survey and land resources mapping survey. Therefore, the researcher should be aware of those changes and thus further analysis is based on revised data series. Revised cultivated areas for cereal crops and subsequent production during 1974/1975 to 1996/1997 are presented in Figures 7a and 7b. It is just to mention that the most of the pronounced rise and fall of production is mainly
M.T
onne
s/ha

Proceedings of III National Conference on Science and Technology, March 8-11, 1999 73
Figure 7a. Revised Cultivated land for Cereal crops
Figure 7b. Revised Cereal Crops Production in Nepal
due to active and weak monsoon rainfall as shown in Figure 8a. Therefore, the relation between agro-meteorological data and crop estimation are very relevant to each other and crop yield assessment by agro-meteorological analysis should be considered for objective analysis for crop estimation.
Trends of Yields by eco-regional basis
When one study the development of agriculture in Nepal, it is better to study along with the three distinct ecological belts which are Mountain, Hill and Tarai. The land area and altitude range of three belts are shown in Table 1. The distribution of cultivated land, production and yield in three distinct geographical regions of Nepal during 1968-77 has also described by author (Nayava 1985).
Furthermore, the development in agriculture is also affected by the population pressure on land
and, therefore, the population in Mountain, Hill and Tarai Regions during the last three decades is shown in Table 2. At present, there are more than 20 million populations in Nepal. The Table shows that the population is decreasing in Mountain and Hill Regions and on the other hand the population is increasing in Tarai Region. When one tries to examine the trend of yield during 1974/75 to 1996/97 for paddy, maize and wheat separately in Mountain, Hill and Tarai Regions, the yield for paddy in Mountain and Hill Regions during 1974/75 to 1986/87 were decreasing and later the yield has been slowly recovering and however, the previously achieved yield have not yet regained. On the other hand, the Tarai had also decreasing tendency initially and after 1980/81 the yield has been increasing and now the yield is higher than the other Regions as shown in Figure 9. On the other hand, the yield for maize has been decreasing in the Mountain and Hill Regions and whereas the yield for maize in Tarai has been slowly increasing (Figure 10). At the same period, the wheat yield for Mountain, Hill and Tarai Regions have been increasing (Figure 11). The general tendency of decreasing yield in Mountain and Hill Regions are mainly due to soil erosion. In each and every year of the monsoon rain, the topsoil has been washing out and a very little fertilizer is used in Mountain and Hill Regions. In addition to that, the increasing yield for paddy in Tarai may be due to complex inter-relationship causes such as using new seed varieties, irrigation and fertilizer. The cultivated area of paddy, maize and wheat in Mountain, Hill and Tarai Regions during 1996/97 are shown in Table 3.
Fertilizer and irrigation facilities for crop production
The fertilizer in Mountain, Hill and Tarai Regions is used less than 20 kg per hectare and this is the
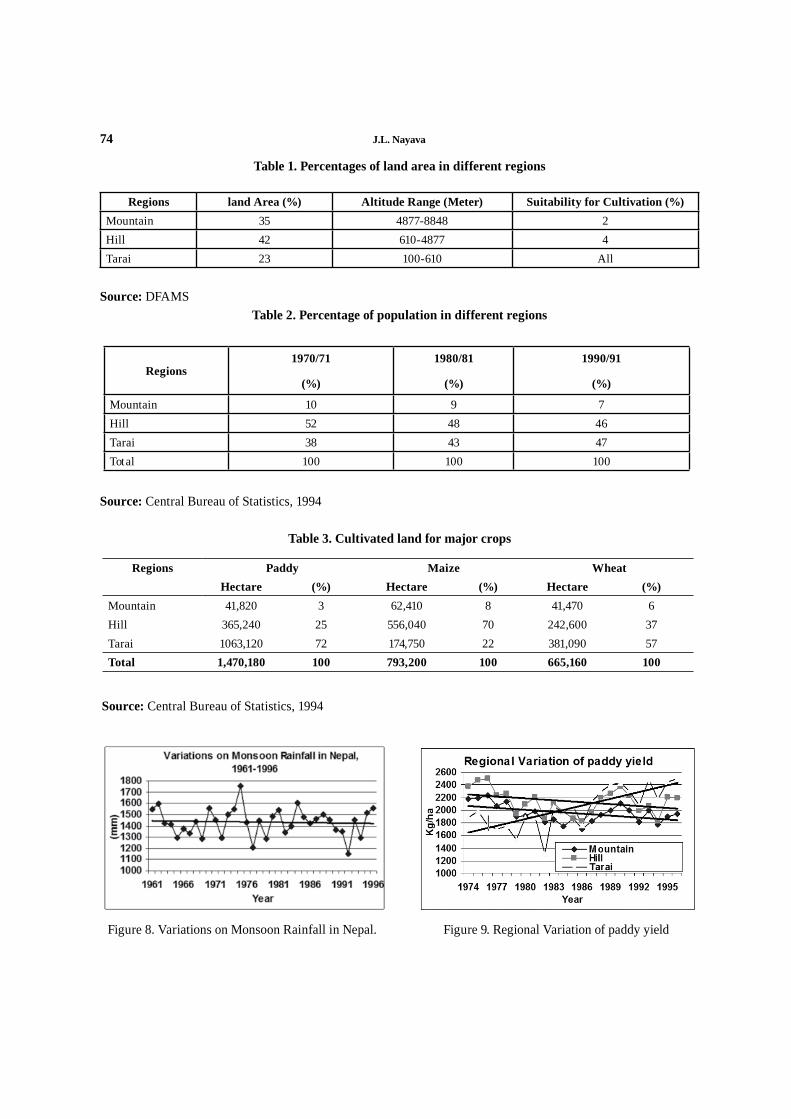
74 J.L. Nayava
Table 1. Percentages of land area in different regions
Source: DFAMS
Regions land Area (%) Altitude Range (Meter) Suitability for Cultivation (%)Mountain 35 4877-8848 2Hill 42 610-4877 4Tarai 23 100-610 All
Table 2. Percentage of population in different regions
Regions1970/71
(%)
1980/81
(%)
1990/91
(%)
Mountain 10 9 7Hill 52 48 46Tarai 38 43 47Total 100 100 100
Source: Central Bureau of Statistics, 1994
Table 3. Cultivated land for major crops
Regions Paddy Maize WheatHectare (%) Hectare (%) Hectare (%)
Mountain 41,820 3 62,410 8 41,470 6Hill 365,240 25 556,040 70 242,600 37Tarai 1063,120 72 174,750 22 381,090 57Total 1,470,180 100 793,200 100 665,160 100
Source: Central Bureau of Statistics, 1994
Figure 8. Variations on Monsoon Rainfall in Nepal. Figure 9. Regional Variation of paddy yield
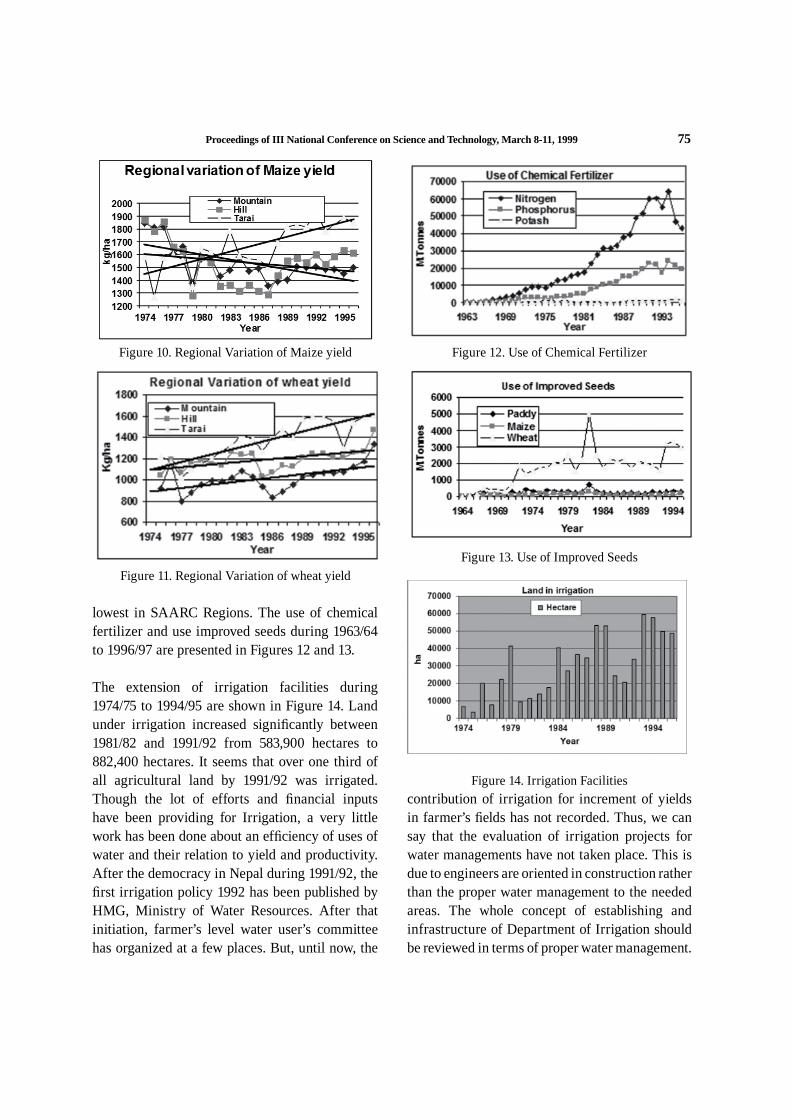
Proceedings of III National Conference on Science and Technology, March 8-11, 1999 75
lowest in SAARC Regions. The use of chemical fertilizer and use improved seeds during 1963/64 to 1996/97 are presented in Figures 12 and 13.
The extension of irrigation facilities during 1974/75 to 1994/95 are shown in Figure 14. Land under irrigation increased signi cantly between 1981/82 and 1991/92 from 583,900 hectares to 882,400 hectares. It seems that over one third of all agricultural land by 1991/92 was irrigated. Though the lot of efforts and nancial inputs have been providing for Irrigation, a very little work has been done about an ef ciency of uses of water and their relation to yield and productivity. After the democracy in Nepal during 1991/92, the rst irrigation policy 1992 has been published by HMG, Ministry of Water Resources. After that initiation, farmer’s level water user’s committee has organized at a few places. But, until now, the
Figure 10. Regional Variation of Maize yield Figure 12. Use of Chemical Fertilizer
Figure 11. Regional Variation of wheat yieldFigure 13. Use of Improved Seeds
Figure 14. Irrigation Facilitiescontribution of irrigation for increment of yields in farmer’s elds has not recorded. Thus, we can say that the evaluation of irrigation projects for water managements have not taken place. This is due to engineers are oriented in construction rather than the proper water management to the needed areas. The whole concept of establishing and infrastructure of Department of Irrigation should be reviewed in terms of proper water management.

76 J.L. Nayava
Similar remarks on irrigation were raised by author in 1985. So far, the progress in this direction is very little (Nayava 1985).
The number of area of farm holdings, farm size and land tenure are better described in National sample Census of Agriculture, Nepal 1991/92 (CBS 1994). Average land holding size is less than a hectare in Nepal. In 1991/92, 43 percent of all land holding were less than 0.5 hectare in size (CBS 1994). Small holdings are often disadvantages in terms of use of inputs and modern agricultural technology.
Main factors for an increment of yield
There are many complex factors to have the potential yield in parcel of land. These factors are as follows:
a) Soil fertility; b) Agronomical practices; c) seed development and availability; d) Good laboratory for Pathology and Entomology; e) Climate and weather role in agricultural activities in rain-fed and irrigated conditions; f) Management and training; g) Availability of fertilizer and distribution h) Availability of nancial resources; i) Pricing policy and market; and j) Road accessibility and storage facilities.
From the above mentioned components, one can easily feels the complexities involved in increase the yield. Therefore, one should try to understand all the components and should discuss among the professionals who directly involved in these endeavors. Since the writer of this article is an Agro-meteorologist, it is his duty to mention that the development of crop species should be tally with climatic factors to have the optimum production. Nepal is one of a unique country in the world where the agricultural practices have been doing even in high slopes, where the slope and azimuth play a very important role in receiving solar radiation in the different seasons due to
change of season. It is necessary to mention that the quantitative measurement of solar radiation may assist to predict the rate of photosynthesis, evapo-transpiration and potential growth of crops. Nayava (1980) has estimated the solar radiation in slopes and aspect in the Kathmandu valley. According to his studies, signi cant spatial differences in insolation occurred in the month of January. South facing slopes, show value as high as 550 langleys per day while the at oor of the valley receives 400 langleys per day. On the other hand, northward facing slopes receive as little as 150 langleys per day. Nayava (1980) has also studied mesoscale variation of rainfall in the Kathmandu valley. These types of mesoscale studies are very important tools for plant breeders and agronomist.
Realizing those factors, the Agronomist should develop the species or cultivars, which is suitable to proper agro-climatic condition in order to achieve optimum production in a given environment with modern technical facilities. In addition one should be aware of impact of El Nino event for crop production, global warming and their effects on climate change to develop the new cultivars in Nepal. It is also a quiet an important phenomenon to study the inter–relationship between agriculture impacts and the recent persistent of cold waves in Tarai Regions in the winter months of 1998 and 1999. Considering all those factors can we achieve the optimum production? Are we talking these optimum productions in the experimental farmland or farmer’s farmland? Are we talking these results in rain-fed or irrigated conditions? How much ordinary or high improved seeds are available? How much fertilizer is required for optimum production and how much we used in different species for different districts? How much yields one could expect in rain-fed or in an irrigated condition in different districts? Did it achieve the expected yield? If so why it could not achieve the goal and what are the reasons behind this?
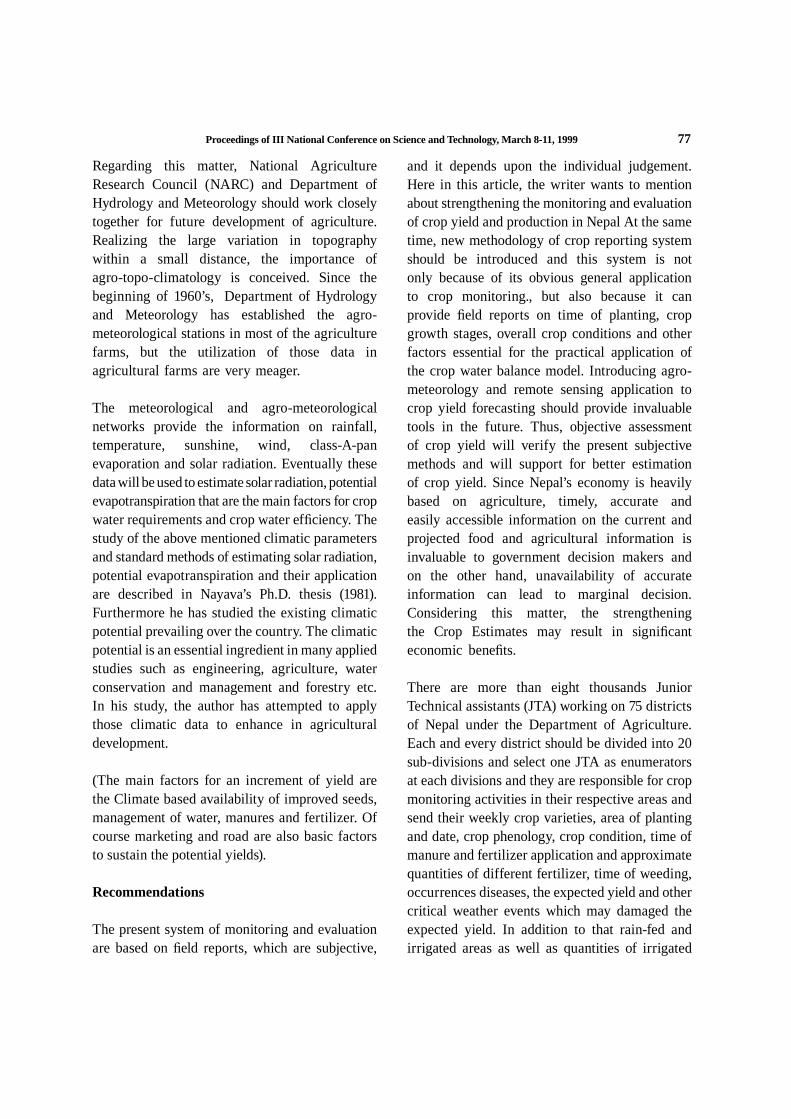
Proceedings of III National Conference on Science and Technology, March 8-11, 1999 77
Regarding this matter, National Agriculture Research Council (NARC) and Department of Hydrology and Meteorology should work closely together for future development of agriculture. Realizing the large variation in topography within a small distance, the importance of agro-topo-climatology is conceived. Since the beginning of 1960’s, Department of Hydrology and Meteorology has established the agro-meteorological stations in most of the agriculture farms, but the utilization of those data in agricultural farms are very meager.
The meteorological and agro-meteorological networks provide the information on rainfall, temperature, sunshine, wind, class-A-pan evaporation and solar radiation. Eventually these data will be used to estimate solar radiation, potential evapotranspiration that are the main factors for crop water requirements and crop water ef ciency. The study of the above mentioned climatic parameters and standard methods of estimating solar radiation, potential evapotranspiration and their application are described in Nayava’s Ph.D. thesis (1981). Furthermore he has studied the existing climatic potential prevailing over the country. The climatic potential is an essential ingredient in many applied studies such as engineering, agriculture, water conservation and management and forestry etc. In his study, the author has attempted to apply those climatic data to enhance in agricultural development.
(The main factors for an increment of yield are the Climate based availability of improved seeds, management of water, manures and fertilizer. Of course marketing and road are also basic factors to sustain the potential yields).
Recommendations The present system of monitoring and evaluation are based on eld reports, which are subjective,
and it depends upon the individual judgement. Here in this article, the writer wants to mention about strengthening the monitoring and evaluation of crop yield and production in Nepal At the same time, new methodology of crop reporting system should be introduced and this system is not only because of its obvious general application to crop monitoring., but also because it can provide eld reports on time of planting, crop growth stages, overall crop conditions and other factors essential for the practical application of the crop water balance model. Introducing agro-meteorology and remote sensing application to crop yield forecasting should provide invaluable tools in the future. Thus, objective assessment of crop yield will verify the present subjective methods and will support for better estimation of crop yield. Since Nepal’s economy is heavily based on agriculture, timely, accurate and easily accessible information on the current and projected food and agricultural information is invaluable to government decision makers and on the other hand, unavailability of accurate information can lead to marginal decision. Considering this matter, the strengthening the Crop Estimates may result in signi cant economic bene ts.
There are more than eight thousands Junior Technical assistants (JTA) working on 75 districts of Nepal under the Department of Agriculture. Each and every district should be divided into 20 sub-divisions and select one JTA as enumerators at each divisions and they are responsible for crop monitoring activities in their respective areas and send their weekly crop varieties, area of planting and date, crop phenology, crop condition, time of manure and fertilizer application and approximate quantities of different fertilizer, time of weeding, occurrences diseases, the expected yield and other critical weather events which may damaged the expected yield. In addition to that rain-fed and irrigated areas as well as quantities of irrigated
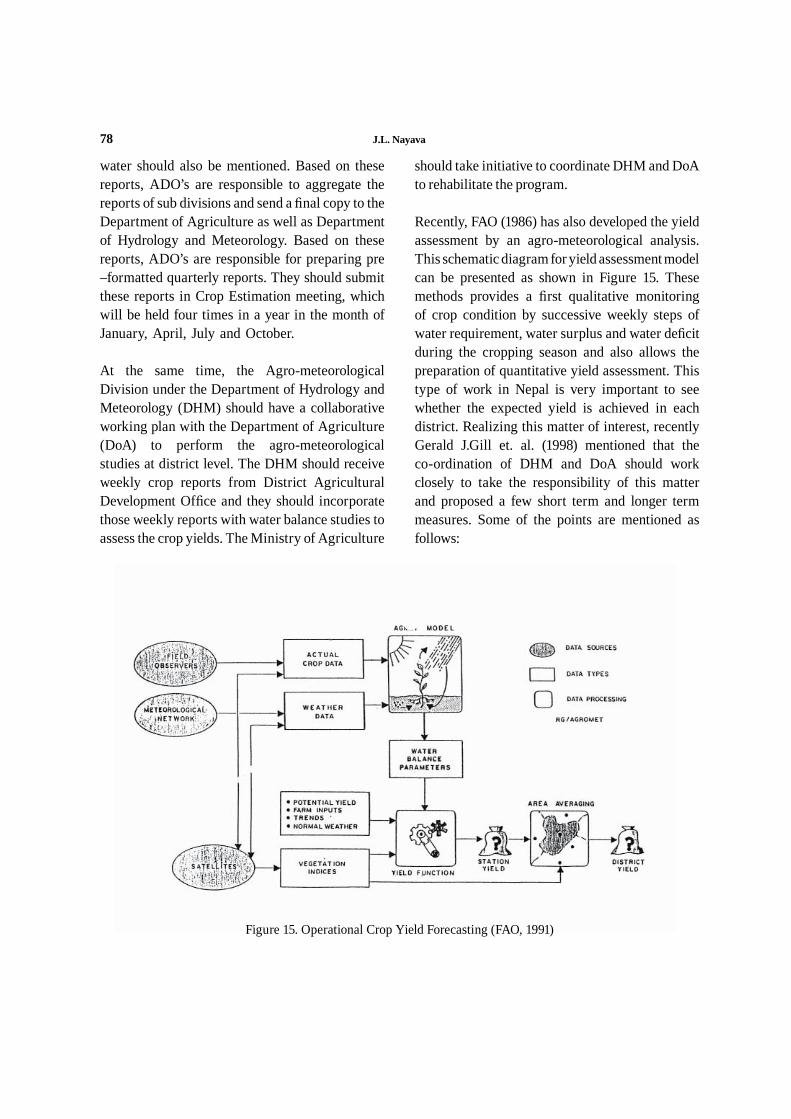
78 J.L. Nayava
water should also be mentioned. Based on these reports, ADO’s are responsible to aggregate the reports of sub divisions and send a nal copy to the Department of Agriculture as well as Department of Hydrology and Meteorology. Based on these reports, ADO’s are responsible for preparing pre –formatted quarterly reports. They should submit these reports in Crop Estimation meeting, which will be held four times in a year in the month of January, April, July and October.
At the same time, the Agro-meteorological Division under the Department of Hydrology and Meteorology (DHM) should have a collaborative working plan with the Department of Agriculture (DoA) to perform the agro-meteorological studies at district level. The DHM should receive weekly crop reports from District Agricultural Development Of ce and they should incorporate those weekly reports with water balance studies to assess the crop yields. The Ministry of Agriculture
should take initiative to coordinate DHM and DoA to rehabilitate the program.
Recently, FAO (1986) has also developed the yield assessment by an agro-meteorological analysis. This schematic diagram for yield assessment model can be presented as shown in Figure 15. These methods provides a rst qualitative monitoring of crop condition by successive weekly steps of water requirement, water surplus and water de cit during the cropping season and also allows the preparation of quantitative yield assessment. This type of work in Nepal is very important to see whether the expected yield is achieved in each district. Realizing this matter of interest, recently Gerald J.Gill et. al. (1998) mentioned that the co-ordination of DHM and DoA should work closely to take the responsibility of this matter and proposed a few short term and longer term measures. Some of the points are mentioned as follows:
Figure 15. Operational Crop Yield Forecasting (FAO, 1991)
Proceedings of III National Conference on Science and Technology, March 8-11, 1999 79
Short term measures
“The condition with respect to both the rainfall situation and the state of crop in the ground should be monitored very closely at the district level over the coming months, so as to give the earliest possible indication of looming problems. This requires close co-ordination of the work of the two HMG agencies responsible for collecting this data, namely the Department of Hydrology and Meteorology and Department of Agriculture”.
Longer Term measures
The monitoring situation with respect to agricultural meteorology must be improved with increased co-ordination and collaboration between DoA and DHM. The possibility of establishing an agro-meteorology Unit should be explored so as to institutionalize this collaboration….”.
Finally, the Ministry of Agriculture should held a meeting with all the seventy ve District Development Agriculture Of cer for the Crop Estimates meeting. The member of Planning Commission should chair these Crop Estimates meetings. All the other concerned Government agencies, such as Central Bureau of Statistics, Department of Hydrology and Meteorology should be invited to participate in these meetings.
Those meetings will highlight the following areas as follows:
a) expected or actual planted area in rain-fed or irrigated conditions;
b) expected or actual yield; c) expected or actual production; d) remarks on timely rainfall and its distribution,
presentation of effective rainfall on all selected sites, presentation of water balance studies on all selected sites;
e) availability of seeds; f) availability of fertilizer and utilization; g) incidence pest and diseases and control; and h) schedule and quantities of irrigated water and
any other problems.
Those district-wise data and discussion can help to provide for preparing the food balance sheet of the country. This balance sheet contains domestic production, total domestic availability, apparent consumption, carry over requirements, total requirements, surplus or de cit, exports for marketing year, imports for marketing year, stocks at the end of year, closing stocks. For Nepal, the food balance sheet for the district level is utmost importance, because most of the districts in the Hill and Mountain Regions have always been the food de cit area and the Tarai has always been a food surplus area. From these balance sheets, the government can plan how much the food can be bought in the different districts of Tarai and then subsequently transferred in nearby districts.
Those data can help the pricing policy for decision- makers and also plan for the agriculture policies in regional and district basis. We should not forget that agriculture is one of the most important areas to absorb the manpower of Nepal and without agricultural development in Nepal, poverty alleviation program will never be successful. Once you have all those data, one can easily nd out what are the government targets for crop production, how much so far we have been achieved. If there are any problems not achieving the goal, one can identify the causes and effects in district-wise and try to solve the problem immediately or the further work has to be identi ed, so that the goal of production can be achieved. These types of monitoring and evaluation of crop production will help the agriculture perspective plan. This will also help to evaluate all the activities of District Agriculture

80 J.L. Nayava
Of cer including seed and fertilizer availability and ef ciency of irrigation facilities.
Nothing is easy in this world. Therefore, one has to have a sound and viable planning for any kind of work whether it is small or big. Since the nature of the agriculture program is longer-term measures, the special attention should be taken whether this program is sustainable or not in the Nepalese context. Otherwise, a failure of the project may take place and consequently causes a nancial crisis. To avoid these problems, one should study well in advance in each and every angle of the project’s design for smooth and successful running of the project and care should be taken in advance for sustainability of the project after the termination. In addition to the planning, the success of the project depends upon the Government’s policy and decision and their staffs who take the responsibilities of to run the project.
Acknowledgements
I wish to express my sincere thanks to Mr. Ratna Prasad Nayaju, Senior Divisional Meteorologist, Department of Hydrology and Meteorology for his suggestions. I thank Mr. Rabi Singh, Deputy Director, Central Bureau of Statistics for his helpful discussion on present system of crop monitoring
References
APROSC and JINA 1995. Agriculture Perspective Plan, 1995/96-214/2015 AD, Agricultural Projects Services Center, Kathmandu and John Mellor Associates, Inc, Washington D.C. for National Planning Commission, Kathmandu and Asian Development Bank, Manila
CBS 1994. National Sample Census of Agriculture,
Nepal 91/92, Highlights, CBS, NPC, HMG of Nepal, Kathmandu
CBS 1994. Agricultural Statistics of Nepal 1993/94, CBS, NPC, HMG of Nepal, Kathmandu
CBS 1995. Agricultural Statistics of Nepal 1994/95, CBS, NPC, HMG of Nepal, Kathmandu
CBS 1996. Agricultural Statistics of Nepal 1995/96, CBS, NPC, HMG of Nepal, Kathmandu
CBS 1997. Agricultural Statistics of Nepal 1996/97, CBS, NPC, HMG of Nepal, Kathmandu
DFAMS 1977. Agricultural Statistics of Nepal, DFAMS, Ministry of Agriculture, HMG of Nepal, Kathmandu
DFAMS 1983. Agricultural Statistics of Nepal, DFAMS, Ministry of Agriculture, HMG of Nepal, Kathmandu
DFAMS 1990. Agricultural Statistics of Nepal, DFAMS, Ministry of Agriculture, HMG of Nepal, Kathmandu
DHM 1992. Precipitation records of Nepal 1986-90, DHM, Ministry of Water Resources, HMG of Nepal, Kathmandu
DIHM 1977. Climatological records of Nepal 1971-75, Vol. 1: DIHM, Ministry of Water Resources, HMG of Nepal, Kathmandu
DIHM 1982. Climatological records of Nepal 1976-80, Vol. 1: DIHM, Ministry of Water Resources, HMG of Nepal, Kathmandu
DIHM 1984. Climatological records of Nepal 1981-82, Vol. 1: DIHM, Ministry of Water Resources, HMG of Nepal, Kathmandu
DIHM 1986. Climatological records of Nepal

Proceedings of III National Conference on Science and Technology, March 8-11, 1999 81
1983-84, Vol. 1: DIHM, Ministry of Water Resources, HMG of Nepal, Kathmandu
DIHM 1988. Climatological records of Nepal 1985-86, Vol. 1: DIHM, Ministry of Water Resources, HMG of Nepal, Kathmandu
Gerald, J. Gill and et.al. 1998. Possible impact of the current EL Nino Event on Nepal, 1998 Paddy Crop; HMG Ministry of Agriculture/ Winrock International, Policy Analysis in Agriculture and Related Resource Management, series No. 1, July 1998, pp. 1-15
FAO 1986. early Agrometeorological Crop Yield Assessment, FAO Plant Production and Protection paper, 73, Rome.
NARC 1997. 25 years of Maize Research in Nepal (1972-1997), Silver Jubilee, National Maize Research Program, Nepal Agricilture research Council, Kathmandu.
Nayava, J.L., 1980. A topoclimatological investigation of Solar Radiation in the Kathmandu Valley, Aust. Met. Mag. Vol. 28, No 2, pp.79-95..
Nayava, J.L., 1981. Areal Rainfall in the Kathmandu Valley, Mausam, 32: 4, pp.343-348.
Nayava, J.L., 1980. Climates of Nepal and their implications for Agricultural Development, Ph.D. Thesis, Australian National University, Canberra, Australia.
Nayava, J.L., 1985. Environmental Impacts on Agricultural Development, Nepal- Nature’s paradise, pp.337-345.
NPC 1991. Nepal, Aspects of Population and Development. Population Division, NPC, HMG of Nepal, Kathmandu.
NPC 1994. Agricultural Statistics of Nepal, Revised Cropped Area Series, 1974/75-191/92, NPC, HMG of Nepal, Kathmandu.

82
TAHAL Consulting Engineers Ltd.Tel Aviv, Israel
In association with GEOCE Consultants (P) Ltd,ARMS (P) Ltd and CEMAT Consultants (P) Ltd.
Kathmandu, NepalE-mail: [email protected]
Abstract
The framework of the hydrological study for Western Nepal (part of the Nepal Irrigation Sector Project), prepared for the Institutional Development of Hydrology and Meteorology (DHM), Ministry of Science and Technology, includes the determination of the probable maximum precipitation (PMP) of 77 basins. The paper presents the study that was undertaken for the purpose of point and areal PMP determination in Western Nepal, including presentation of the Hersh eld Method (1961) adapted to point PMP having durations longer than 24 hours. The analysis is based on rainfall data available in 109 rainfall stations in that part of Nepal during the period 1956-1998. Based on the point PMP depth values thus obtained, a map of equal PMP depth values is presented for Western Nepal.
The Probable Maximum Precipitation for Western Nepal*
INTRODUCTION
The framework of the hydrological study for Western Nepal (a part of the NISP Project), prepared for the Institutional Development of Hydrology and Meteorology (DHM), Ministry of Science and Technology, includes the determination of the probable maximum precipitation (PMP) of 77 basins. WMO (1986) de nes the PMP as “the greatest depth of precipitation for a given duration meteorologically possible over a given size storm area at a particular location at a particular time of the year with no allowance made for long-term climatic trends.”
It also states “procedures for estimating PMP cannot be standardized as they vary with the amount and quality of data available, basin size and location, basin and regional topography, storm types producing extreme precipitation and climate.”
The preferable meteorological approach presented by WMO (1986) cannot be applied for Western Nepal because of the scarcity of the synoptic information that is required for the application of such a procedure. Therefore, having a suf cient network of daily rainfall recorders in the studied area, it was recommended to determine the required PMP depths by the application of the statistical method proposed by Hersh eld (1961).
Janak Lal Nayava and Ehud Simon
Keywords: PMP, point rainfall, areal rainfall
* This paper was published in Proceedings of the Second International symposium on Flood Control/Beizing/China/Sept. 10-13, 2002, Vol 1, pp 537-544

J.L. Nayava & E. Simon 83
Following is a brief presentation of the study that was undertaken for the purpose of PMP determination in Western Nepal.
DATA
There are a total of 148 daily rainfall stations in Western Nepal. Out of these, 109 stations with suf cient data were selected for the PMP study. Because it was required to establish
24-, 48- and 72-hour PMP depths in the region, the annual maximum rainfall for these durations was tabulated for the 109 selected stations from the time of their establishment up to the year 1998. The areal distribution of the selected rainfall stations is shown in Figure 1. Figure 2 presents the mean annual precipitation (1967-1996) in Western Nepal. Table 1 presents basic information on the selected rainfall stations.
Figure 1. Location of the Rainfall Stations for the PMP Study
Figure 2. Mean Annual Precipitation (mm) 1967 - 1996 in Western Nepal

84 J.L. Nayava & E. Simon
Table 1. Basic Information on the Selected Rainfall Stations
Number of Rainfall Stations with Data for Period More Than
Period of Available Data
40 years – 30 1956 – 199830 years – 25 1960 – 199825 years – 48 1970 – 199815 years – 6 1980 – 1998
DETERMINATION OF 24-HOUR POINT PMP DEPTH VALUES
As mentioned above the Hersh eld Method (1961) to determine the 24-hour PMP depths was applied in this study that following the procedure presented by WMO (1986).
The basic relationship used in this procedure is represented by Equation (1):
PMP = Xn + Km*Sn (1)
Where in Equation (1) Xn and Sn are the mean and standard deviation of a series of maximum annual rainfall depth of certain duration. Km is a factor that is dependant on the mean annual maximum rainfall and varies between 5 and 20 for durations between 5 minutes and 24 hours.
Application of the Hersh eld Method (1961) to the selected 109 rainfall stations in Western Nepal enabled the determination of the point PMP depths for these stations. The results of the computed point PMP depths were presented elsewhere (TAHAL, 2000-2002). The relationship between Point PMP Depth and Rainfall Station Elevation for Western Nepal is presented in Figure 3. The relationship is expressed by Equation (2):
PMP = 1077.3*exp (-4*10**-4*ELEV) (2)
Where in Equation (2), PMP is in mm and ELEV (rainfall station elevation) is in m. The correlation coef cient was found to be about 0.78. It should be pointed out those 7 points (presented in Figure 3 as series 2) being too far away from the relationship line was omitted from the correlation.
It should be mentioned that similar relationships and correlation coef cients which are not presented here, were established between the maximum 24-hour rainfall depth and rainfall station elevation, the mean 24-hour rainfall depth (Xn) and rainfall station elevation, and the standard deviation of the 24-hour depth series (Sn) and rainfall station elevation. The relationship between the Km values and rainfall station elevation showed an increase of Km with elevation. A linear regression was found in this case to represent this relationship, with a correlation coef cient of about 0.76. The different behavior of Km from the above-mentioned rainfall series patterns with elevation can be understood through its inverse relationship with Mean Annual Maximum Rainfall (RMAX), the latter having an inverse relationship with elevation. The isolines of the 24-hour point PMP depth values for the selected rainfall stations are graphically presented in Figure 4.
DETERMINATION OF 48- AND 72-HOUR POINT PMP DEPTH VALUES It was required to determine 48- and 72-hour PMP depths for the large size watersheds that had a

J.L. Nayava & E. Simon 85
relatively long time of concentration. Because the Hersh eld Method refers PMP with time duration of not more than 24 hours, it was necessary to develop in this study the Km – RMAX relationships (similar to Figure 4.1 in WMO, 1986) for the two new durations in this study. The procedure to determine the above-mentioned relationships was as follows:
1. Km values were read from Figure 4.1 in WMO, 1986 and then tabulated for an each PMP duration (1 hour, 6 hours and 24-hours).
2. A relationship was determined for each Km related to the same RMAX. All the relationships had the format of Equation (3):
Km = a*LN (T) + b (3)
Where in equation (3), Km is the coef cient for any RMAX and T is the PMP duration in hours. Table 2 gives the values of the ‘a’ and ‘b’ parameters of equation (3), the high correlation coef cient values obtained, and the results of equation (3) application for the new Km value determination.
Table 2. Equation (3) Parameters and the 48- and 72- Km Values
R M A X (mm) a b Correlation Coeff. - r Km
(48- hour)Km
(72- hour)
50 2.2473 10.644 0.9968 19.3 20.3
100 3.2296 5.2167 0.9965 17.7 19.0
150 3.5591 2.5374 0.9999 16.3 17.8
200 3.4559 0.9417 0.9998 14.3 15.7
250 2.9452 1.0210 0.9799 12.4 13.6
300 2.6868 0.4490 0.9687 10.9 11.9
350 2.3472 0.1782 0.9162 9.3 10.2
400 2.0642 0.1804 0.8958 8.2 9.0
Two linear relationships were separately developed between the values in Table 2 of Km (48-hour) and Km (72-hour) and the values RMAX in that table. These relationships are represented by Equations (4) and (5):
Km (48-hour) = 20.985 – 0.0330*RMAX r = 0.9982 (4) Km (72-hour) = 22.319 – 0.0339*RMAX r = 0.9972 (5)
The above two relationships expressed by Equations (4) and (5) are presented in Figure 5
and Figure 6, respectively, and may also be used for RMAX values beyond the presented range of these gures.
The above mentioned Hersh eld procedure was applied to determine the 48- and 72-hour point PMP depth values for the large size basins, using now the new Km – RMAX relationships in Figure 5 and Figure 6.
The 48- and 72-hour Point PMP depth values thus obtained where presented elsewhere (TAHAL, 2000-2002).

86 J.L. Nayava & E. Simon
Figure 3. 24 Hours Point PMP Depth – Rainfall Station Elevation Relationship in Western Nepal
Figure 4. Point PMP (mm) Values for 24 hours in Western Nepal

J.L. Nayava & E. Simon 87
Figure 5. Km – RMAX Relationship for 48 Hours Point PMP Depth
Figure 6. Km – RMAX Relationship for 72 Hours Point PMP Depth
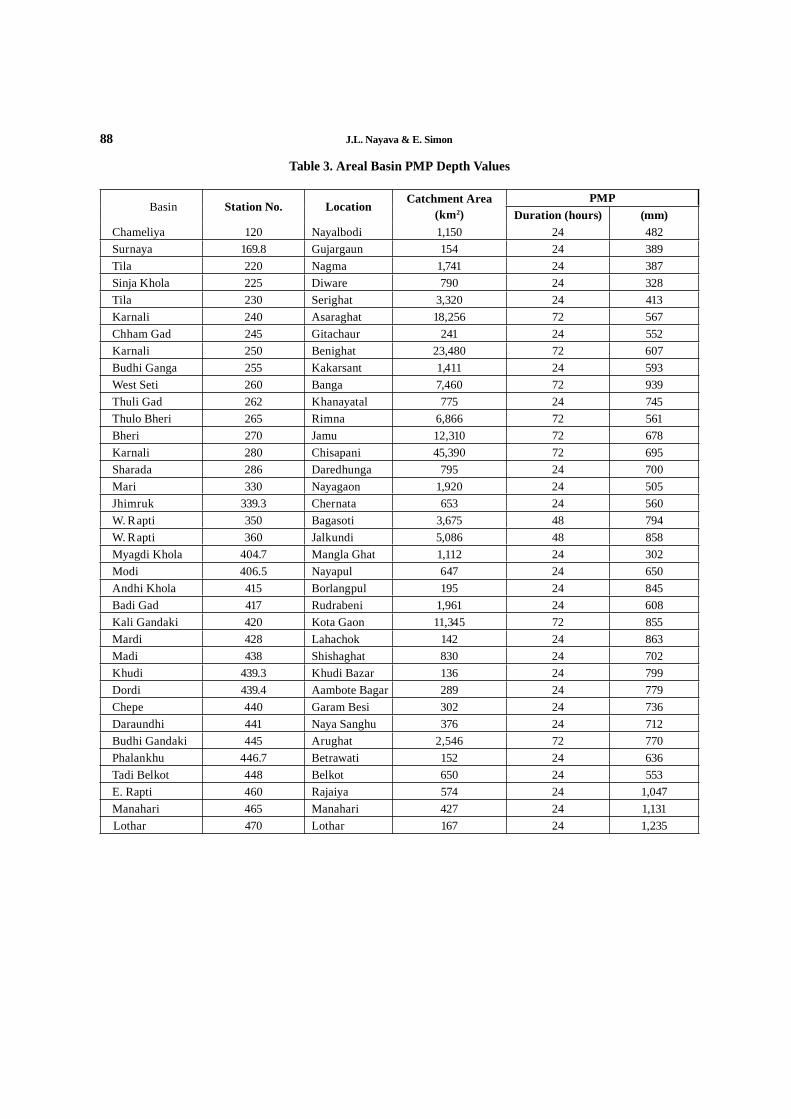
88 J.L. Nayava & E. Simon
Table 3. Areal Basin PMP Depth Values
Basin Station No. LocationCatchment Area
(km2)PMP
Duration (hours) (mm)Chameliya 120 Nayalbodi 1,150 24 482Surnaya 169.8 Gujargaun 154 24 389Tila 220 Nagma 1,741 24 387Sinja Khola 225 Diware 790 24 328Tila 230 Serighat 3,320 24 413Karnali 240 Asaraghat 18,256 72 567Chham Gad 245 Gitachaur 241 24 552Karnali 250 Benighat 23,480 72 607Budhi Ganga 255 Kakarsant 1,411 24 593West Seti 260 Banga 7,460 72 939Thuli Gad 262 Khanayatal 775 24 745Thulo Bheri 265 Rimna 6,866 72 561Bheri 270 Jamu 12,310 72 678Karnali 280 Chisapani 45,390 72 695Sharada 286 Daredhunga 795 24 700Mari 330 Nayagaon 1,920 24 505Jhimruk 339.3 Chernata 653 24 560W. Rapti 350 Bagasoti 3,675 48 794W. Rapti 360 Jalkundi 5,086 48 858Myagdi Khola 404.7 Mangla Ghat 1,112 24 302Modi 406.5 Nayapul 647 24 650Andhi Khola 415 Borlangpul 195 24 845Badi Gad 417 Rudrabeni 1,961 24 608Kali Gandaki 420 Kota Gaon 11,345 72 855Mardi 428 Lahachok 142 24 863Madi 438 Shishaghat 830 24 702Khudi 439.3 Khudi Bazar 136 24 799Dordi 439.4 Aambote Bagar 289 24 779Chepe 440 Garam Besi 302 24 736Daraundhi 441 Naya Sanghu 376 24 712Budhi Gandaki 445 Arughat 2,546 72 770Phalankhu 446.7 Betrawati 152 24 636Tadi Belkot 448 Belkot 650 24 553E. Rapti 460 Rajaiya 574 24 1,047Manahari 465 Manahari 427 24 1,131
Lothar 470 Lothar 167 24 1,235

J.L. Nayava & E. Simon 89
It should be pointed out that the 48-hour and 72-hour point PMP depth values had a similar relationship with the rainfall station elevation to the one demonstrated in Figure 3 for the 24-hour point PMP depth values.
DETERMINATION OF THE AREAL BASIN PMP DEPTH VALUES
The procedure to determine the areal basin PMP depth values was as follows:
1. In each basin the Thiessen polygons procedure was applied in order to establish the sub-basin area that was represented by any one of the basin rainfall stations.
2. Using the Depth-Area Curves presented in Figure 4.7 in WMO (1986) the point PMP depth value of each rainfall station was reduced accordingly.
3. The areal basin PMP depth value was nally determined based on the reduced step 2 values and the sub basin area fraction of the various participating rainfall stations determined in step 1 above. Table 3 gives the nal area basin PMP depth values.
CONCLUSIONS AND DISCUSSION
The above is a brief presentation of the study that was performed in order to determine the point and areal PMP depth values in Western Nepal. The procedure applied in the study to determine the 24-hour point PMP depth values was the Hersh eld Method (1961) as described in WMO (1986). For the longer 48- and 72-hour point PMP depth values, part of the above-mentioned procedure was updated to obtain new Km-RMAX relationships. The 24-hour point PMP depth reduction with rainfall station elevation may be clearly seen
from Figure 3. This conclusion may be justi ed although there is a relatively high scatter around the tted curve in Figure 3.
A possible explanation of this phenomenon is the general mean annual rainfall reduction with elevation (the elevation in Figure 2 increases from south to north), and the reduction with elevation of the rainfall series patterns: 24-hour maximum rainfall depth, mean rainfall depth (Xn) and standard deviation (Sn) values (the relationship between these three variables and elevation mentioned earlier). Bearing in mind that in Equation (1), Xn and Sn decrease with elevation, where Km increases, it may be concluded that the Km increase has a lesser effect on the nal computation results than the reduction effect of the Xn and Sn. Furthermore, in Western Nepal, 78 percent of the annual precipitation falls between June and September. The rainfall in Nepal varies greatly from place to place due to sharp topographical variations. As the rain-bearing winds approach Nepal from the southeast in the summer monsoon season, most of the rain falls over the foothills of the Churiya Range or the rst foothill slopes of the southern parts of Nepal. Similarly, the rainfall intensity and point PMP depth value have a tendency to increase in the foothills of the Churiya Range as well as at elevations of around 1,400 m in the southern slopes of the Mahabharat lekh, where the rainfall intensity and point PMP depth value are high relative to the regular decline of these variables with rainfall station elevation. Above the elevation of 1,500 m, the rainfall intensity and point PMP depth value decrease, as presented in Figure 3 showing PMP behavior with elevation. This shows that the moisture-bearing air is mostly concentrated within 850 to 1000 mbs (low level land of Nepal, i.e. in the elevation range between 100 m and 1,500 m).
It is interesting to note that there is a series of troughs located in Figure 4 that follow the patterns

90 J.L. Nayava & E. Simon
of the major river valleys of Kali Gandaki, Bheri, Karnali and West Seti. This phenomenon may be explained by the windward and leeward effects of rainfall together with topography. ACKNOWLEDGEMENTS
The authors wish to thank the Department of Hydrology and Meteorology (DHM) and TAHAL Consulting Engineers Ltd. for permission to publish this article.
REFERENCES
DHM, 1968, Climatological Records of Nepal upto 1966, Department of Hydrology and Meteorology, Kathmandu, Nepal.
DHM, 1971- 1999, Climatological Records of Nepal, Department of Hydrology and Meteorology, Kathmandu, Nepal (11 annual publications).
DHM,1997-1998 Climatological Records of Nepal, Department of Hydrology and Meteorology, Kathmandu, Nepal.
Hersh eld, D. M., 1961, Estimating the Probable Maximum Precipitation, Proceedings American Society of Civil Engineers, Journal Hydraulics Division, Vol. 87, pp. 99-106.
TAHAL Consulting Engineers Ltd; In association with GEOCE Consultants (P) Ltd, ARMS (P) Ltd & CEMAT Consultants (P) Ltd, 2000-2002, Quarterly Progress Report I, III, IV & V and Annual Progress Report I & II, Institutional Development of Hydrology and Meteorology, Kathmandu, Nepal.
WMO, 1986, Manual for Estimation of Probable Maximum Precipitation WMO No 332, Operational Hydrology Report No. 1.

Journal of Hydrology and Meteorology, Vol. 1, No. 1 SOHAM-Nepal
91
Society of Hydrologists and Meteorologists-Nepal
ABSTRACT
A preliminary study has been undertaken to nd the impact of the recent global warming on the rainfall patterns in Nepal. The study has been selected at a few rainfall stations in Nepal during 1971-2000. There seemed to be no xed trend in annual rainfall in Nepal except in the Far Western Nepal, where there seemed to be rather slightly decreasing trend in the annual rainfall. During the monsoon months, the rainy days seemed to be decreasing and the intensity of rainfall appeared to be increasing.
Temporal variations of rainfall in Nepal since 1971 to 2000*
1. INTRODUCTION
At present, there are four seasons in Nepal. These are Winter (November-February); Pre-monsoon (March-May); Summer monsoon (June to September) and Post monsoon (October). Among these seasons, 70 to 90 % of rainfall occurs under the in uence of summer monsoon (Nayava, 1980). At the same time, most important agriculture activities have been taking place during the summer monsoon. Therefore, the onset of the monsoon rainfall and its amount, frequency and distribution in time and space are all important factors. Therefore, the preliminary studies for a few rainfall stations have been attempted to see the annual variations of rainfall and their trends during 1971-2000. Similarly, the rainy days and the amount of rainfall during the monsoon months have also been studied to nd out whether these trends of annual and monsoon rainfall have been affected by the present climate change.
2. DATA
At present, there are more than 150 rainfall stations, which have the thirty years (1971-2000)
of rainfall records in Nepal (DHM, 1999, 2000, 2001). Among those stations, 17 rainfall stations have been selected representing the Mountains, Hills and Terai Regions (Figure 1). These physiographic regions fall in the Cool Temperate, Warm Temperate and Tropical Climates categories respectively (Nayava, 1982). The time series rainfall data for the 17 selected rainfall stations were tabulated for the period 1971-2000. Data were checked and veri ed. The long term mean rainfall for those thirty years were calculated. These selected rainfall stations and the mean monthly rainfall data were shown in Table 1. Similarly, the observed rainy days for the each and every month from 1971 to 2000 were computed for a few places.
3. METHOD
3.1 Analysis of annual rainfall in Nepal
The temporal variations of annual rainfall at each station were plotted during 1971-2000 and studied. At the same time, the trend analysis of annual rainfall has been performed for all those selected places. The rainy days and the mean monthly rainfall during the monsoon months were also analyzed. To do this statistical analysis of rainfall, ‘EXCEL’ from the Microsoft
* This paper was published in Journal of Hydrology and Meteorology, 2004, pp 24-33
Janak Lal Nayava
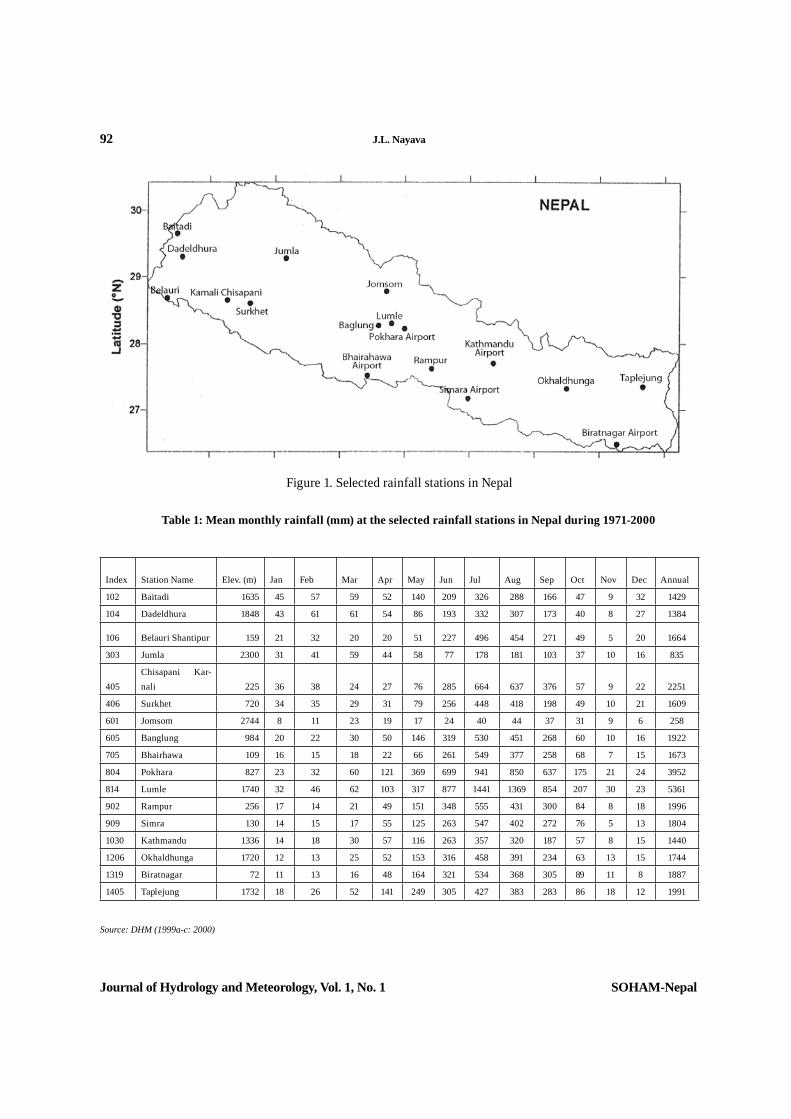
92 J.L. Nayava
Journal of Hydrology and Meteorology, Vol. 1, No. 1 SOHAM-Nepal
Table 1: Mean monthly rainfall (mm) at the selected rainfall stations in Nepal during 1971-2000
Index Station Name Elev. (m) Jan Feb Mar Apr May Jun Jul Aug Sep Oct Nov Dec Annual
102 Baitadi 1635 45 57 59 52 140 209 326 288 166 47 9 32 1429
104 Dadeldhura 1848 43 61 61 54 86 193 332 307 173 40 8 27 1384
106 Belauri Shantipur 159 21 32 20 20 51 227 496 454 271 49 5 20 1664
303 Jumla 2300 31 41 59 44 58 77 178 181 103 37 10 16 835
405Chisapani Kar-nali 225 36 38 24 27 76 285 664 637 376 57 9 22 2251
406 Surkhet 720 34 35 29 31 79 256 448 418 198 49 10 21 1609
601 Jomsom 2744 8 11 23 19 17 24 40 44 37 31 9 6 258
605 Banglung 984 20 22 30 50 146 319 530 451 268 60 10 16 1922
705 Bhairhawa 109 16 15 18 22 66 261 549 377 258 68 7 15 1673
804 Pokhara 827 23 32 60 121 369 699 941 850 637 175 21 24 3952
814 Lumle 1740 32 46 62 103 317 877 1441 1369 854 207 30 23 5361
902 Rampur 256 17 14 21 49 151 348 555 431 300 84 8 18 1996
909 Simra 130 14 15 17 55 125 263 547 402 272 76 5 13 1804
1030 Kathmandu 1336 14 18 30 57 116 263 357 320 187 57 8 15 1440
1206 Okhaldhunga 1720 12 13 25 52 153 316 458 391 234 63 13 15 1744
1319 Biratnagar 72 11 13 16 48 164 321 534 368 305 89 11 8 1887
1405 Taplejung 1732 18 26 52 141 249 305 427 383 283 86 18 12 1991
Source: DHM (1999a-c: 2000)
Figure 1. Selected rainfall stations in Nepal
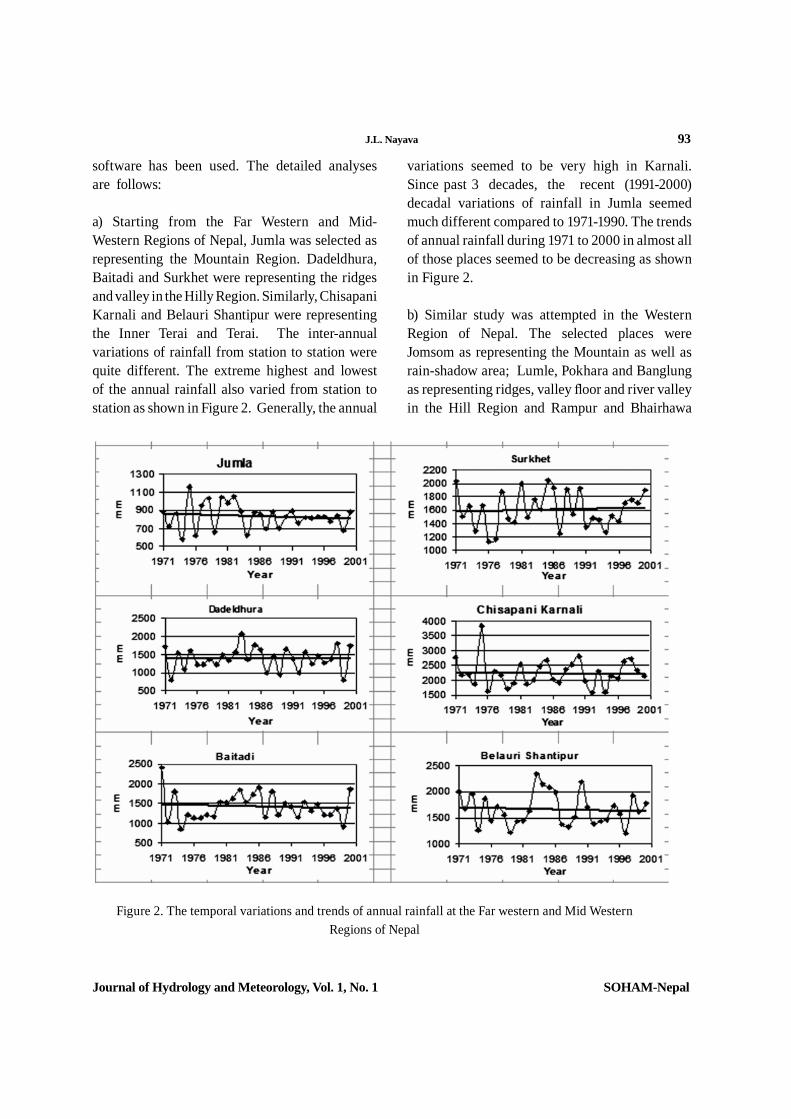
J.L. Nayava 93
Journal of Hydrology and Meteorology, Vol. 1, No. 1 SOHAM-Nepal
software has been used. The detailed analyses are follows:
a) Starting from the Far Western and Mid-Western Regions of Nepal, Jumla was selected as representing the Mountain Region. Dadeldhura, Baitadi and Surkhet were representing the ridges and valley in the Hilly Region. Similarly, Chisapani Karnali and Belauri Shantipur were representing the Inner Terai and Terai. The inter-annual variations of rainfall from station to station were quite different. The extreme highest and lowest of the annual rainfall also varied from station to station as shown in Figure 2. Generally, the annual
variations seemed to be very high in Karnali. Since past 3 decades, the recent (1991-2000) decadal variations of rainfall in Jumla seemed much different compared to 1971-1990. The trends of annual rainfall during 1971 to 2000 in almost all of those places seemed to be decreasing as shown in Figure 2.
b) Similar study was attempted in the Western Region of Nepal. The selected places were Jomsom as representing the Mountain as well as rain-shadow area; Lumle, Pokhara and Banglung as representing ridges, valley oor and river valley in the Hill Region and Rampur and Bhairhawa
Figure 2. The temporal variations and trends of annual rainfall at the Far western and Mid Western Regions of Nepal
94 J.L. Nayava
Journal of Hydrology and Meteorology, Vol. 1, No. 1 SOHAM-Nepal
as representing the Inner Terai and Terai region respectively.
The inter-annual variations of rainfall from station to station were also quite different in Western Region of Nepal. However, the inter annual variations of rainfall seemed to be higher at Pokhara compared to the other stations. Among the six selected stations in Western Region of Nepal as shown in Figure 3, the extreme highest annual rainfall seemed different from one place to other places and however the extreme lowest annual rainfall seemed to be in 1972 except two places at Jomsom and Lumle. Among those places, Jomsom and Rampur showed either increasing or decreasing trend of annual rainfall and rest of the places such as Lumle, Pokhara, Banglung and Bhairhawa showed the increasing trend of annual rainfall as shown in Figure 3. c) A similar study was done in the Central and Eastern Regions of Nepal. Taplejung, Okhaldhunga and Kathmandu were representing the ridges and valley oor in the Hill Region and Simra and Biratnagar as representing the Terai.
The inter-annual variations of rainfall seemed quite different in all those places. The extreme highest and lowest annual rainfall was also varied in all those places in the Central and Eastern Regions of Nepal as shown in Figure 4. The annual rainfall trends at Kathmandu, Okhaldhung, Simra and Biratnagar showed a slightly increasing trend where as the annual trend of rainfall at Taplejung showed slightly decreasing as shown in Figure 4. 3.2 Analysis of monthly rainfall, June-September
It seemed that the most of the researchers have analyzed the annual trend of rainfall in terms of either regional or national scale. Of course, it
depends upon the application in mind. This analysis of rainfall is made particularly for its application in agriculture activities in local scale. Therefore, the number of days of rainfall and distributions are equally important. Since, Nepal’s agricultural activities depends upon the monsoon rainfall which accounts for about 70 to 90% of annual rainfall, the monsoon months of June to September were selected for the trend analysis of rainfall for Jumla, Surkhet and Bhairhawa in Nepal. At the same time, the uses of rainfall and their implications in agriculture will be highlighted.
The monthly information of rainfall and agronomic data are not adequate for proper analysis to nd their relationship, say as monthly rainfall may be quite enough, in the contrary the rainfall occurred only either in the beginning or the end of the month and the prolonged dry spell may had occurred between those spells, the serious damage or loss of yields in crop may have happened and therefore, while studying the interaction between the weather and agriculture. Food and Agriculture Organizations of the United Nations (1986) has considered the ten days of weather data and ten days report of agronomic data. This period is most reasonable period for collecting the required information on weather and agronomic in national and international scale. Those data will be used in Water balance model developed by FAO (1986), which compared available water and water requirements of a given crop for each decade of the growing season. A shortfall or large excess of later in any decades will result in a reduction of “crop index”, which the model generate as a means of monitoring crop condition and forecasting yields.
3.2.1 Jumla
The number of rainy days (greater than 1.0mm) and the mean monthly rainfall for Jumla at each month from June to September during 1971 to

J.L. Nayava 95
Journal of Hydrology and Meteorology, Vol. 1, No. 1 SOHAM-Nepal
Figure 3. The temporal variations and annual trends of rainfall at the Western region of Nepal
Figure 4. The temporal variations and trends of annual rainfall at the Central and Eastern Regions of Nepal
96 J.L. Nayava
Journal of Hydrology and Meteorology, Vol. 1, No. 1 SOHAM-Nepal
2000 have been analyzed as shown in Figure 5. The trend of number of rainy days and the mean monthly rainfall in the month of June seemed no change, but the trend of rainy days in the month of July was very much decreased and to the contrary mean monthly rainfall at the same month seemed to be a little increase. It showed that the intensity of rainfall has increased during that month of July. The trend of rainy days as well as the mean monthly rainfall in August slightly decreased. At the end, the trend of rainy days in the month of September rather increased and the mean monthly rainfall in September also observed slightly increase.
3.2.2 Surkhet
The number of rainy days (greater than 1.0mm) and the mean monthly rainfall for Surkhet at each month from June to September during 1971 to 2000 were analyzed as shown in Figure 6. The trend of number of rainy days and the mean monthly rainfall in the month of June seemed to be a little increase as shown in Figure 6. On the contrary, the trend of number of rainy days in July increased and the mean monthly rainfall in the month of July seemed no change. Similar to Jumla, the intensity of rainfall has increased during the month of July. During the month of August, the trend of rainy days as well as mean monthly rainfall seemed increase. Similar to Jumla, the trend of rainy days and the mean monthly rainfall in the month of September seemed a little increase.
3.2.3 Bhairhawa
Similar to Jumla and Surkhet, the number of rainy days (greater than 1.0mm) and the mean monthly rainfall for Bhairhawa at each month from June to September during 1971 to 2000 were analyzed as shown in Figure 7. During the month of June, the trend of rainy days as well as mean monthly rainfall seemed a little increase. The trend of number of rainy days in the month of July seemed
no change and the trend of mean monthly rainfall seemed a little decrease. At the same time, the trend of rainy days in the month of August seemed to decrease, where as the trend of mean monthly rainfall seemed increase. At the end, the trend of rainy days in the month of September seemed to be quite decrease and it seemed that the last ten years the pattern of rainy days have shifted in a very much lower side. On the contrary, the trend of mean monthly rainfall also seemed to be a little decrease.
4. RESULTS
There were no xed trends of annual rainfall in the Mountain, Hill and Terai Regions of Nepal. However, it is quite interesting to note that the particular cross-section in the Far and Mid-Western Regions of Nepal, the annual rainfall in all the places such as Jumla, Dadeldhura, Baitadi, Surkhet, Chisapani Karnali and Belauri Shantipur showed decreasing trend.
The trend of number of rainy days decreased in the month of July at Jumla and the contrary mean monthly rainfall have increased during that month and this showed that the intensity of rainfall may have increased. The trend of rainy days as well as mean monthly rainfall have decreased during the month of August at Jumla.
Similarly, the number of rainy days seemed decreasing in the month of July in Surkhet and the number of rainy days seemed decreasing in the month of August in Bhairhawa.
During the month of September, the trend of rainy days have very much decreased and it showed that the last ten years the pattern of rainy days have shifted in a very much lower side.
During 1971-2000, the year 1973, 1975 and 1984 seemed to be generally much more rainfall than
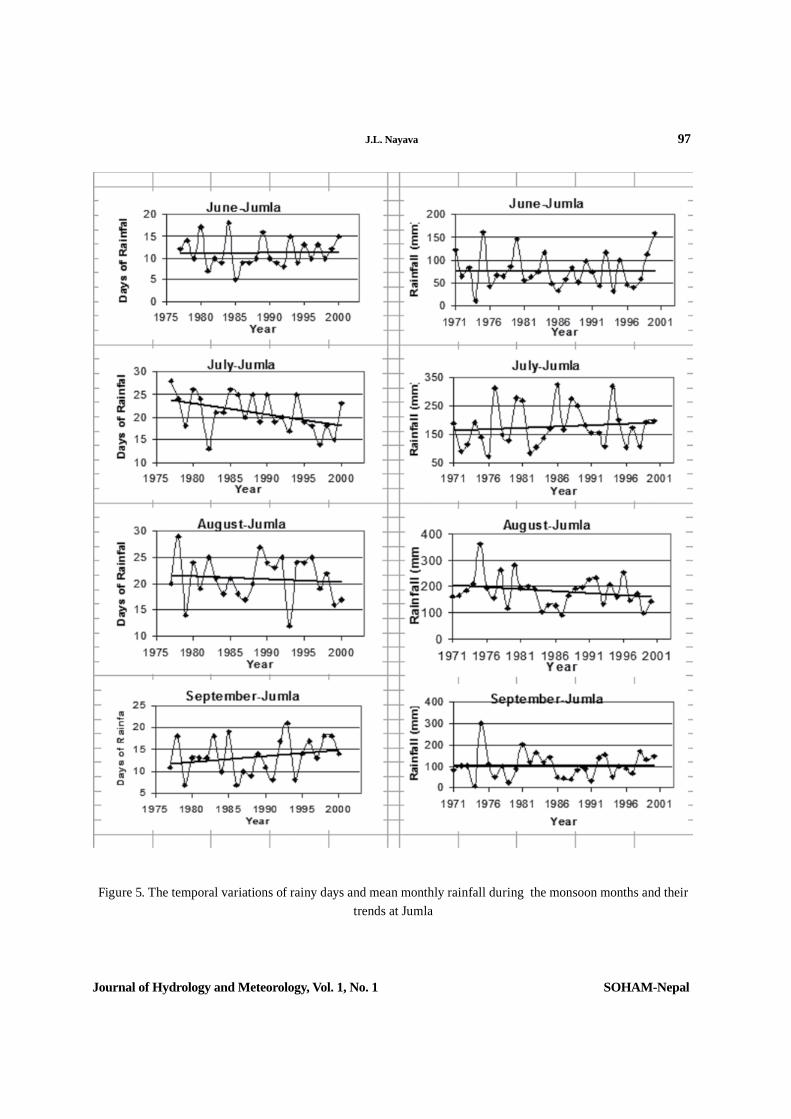
J.L. Nayava 97
Journal of Hydrology and Meteorology, Vol. 1, No. 1 SOHAM-Nepal
Figure 5. The temporal variations of rainy days and mean monthly rainfall during the monsoon months and their trends at Jumla

98 J.L. Nayava
Journal of Hydrology and Meteorology, Vol. 1, No. 1 SOHAM-Nepal
Figure 6. The temporal variations of rainy days and mean monthly rainfall during the monsoon months and their trends at Surkhet
normal throughout the country and on the contrary, at the same period, 1972, 1982 and 1992 seemed to be much lower rainfall than the normal throughout the country. Due to the
longitudinal difference of 80 from the east to west and 30 from the south to north in Nepal, the country had experienced not equal distribution of rainfall in the west or east in the same year. For
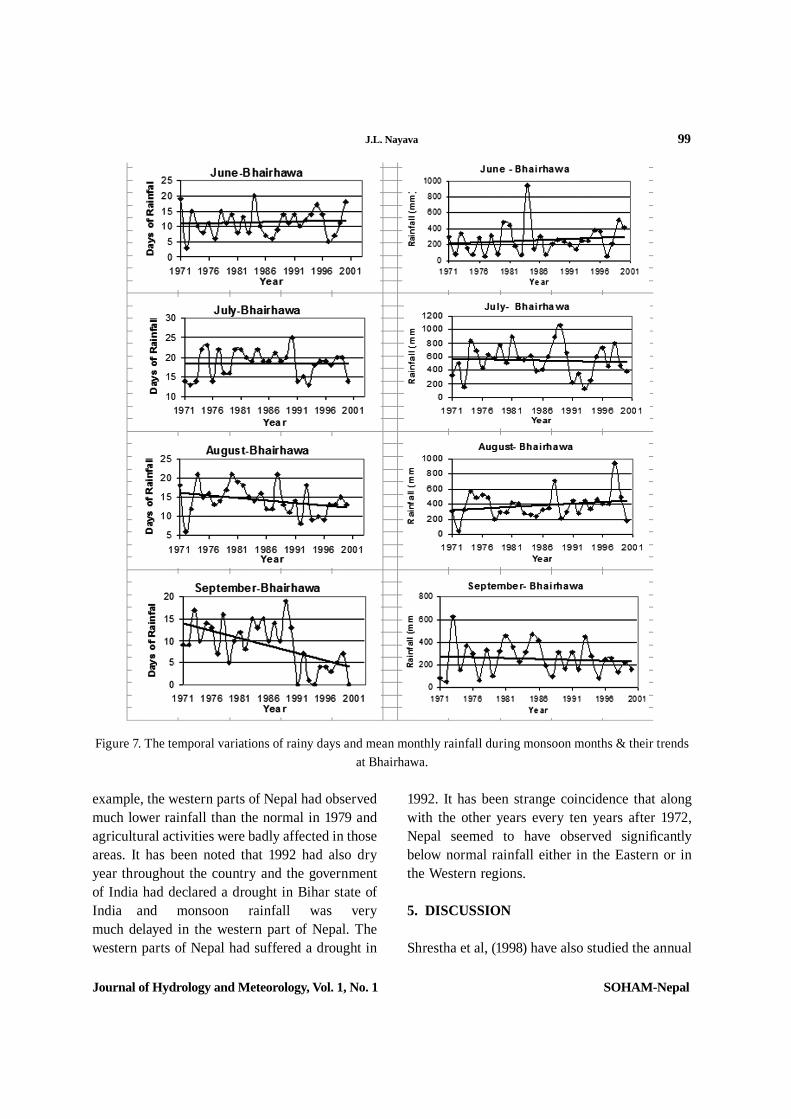
J.L. Nayava 99
Journal of Hydrology and Meteorology, Vol. 1, No. 1 SOHAM-Nepal
Figure 7. The temporal variations of rainy days and mean monthly rainfall during monsoon months & their trends at Bhairhawa.
example, the western parts of Nepal had observed much lower rainfall than the normal in 1979 and agricultural activities were badly affected in those areas. It has been noted that 1992 had also dry year throughout the country and the government of India had declared a drought in Bihar state of India and monsoon rainfall was very much delayed in the western part of Nepal. The western parts of Nepal had suffered a drought in
1992. It has been strange coincidence that along with the other years every ten years after 1972, Nepal seemed to have observed signi cantly below normal rainfall either in the Eastern or in the Western regions.
5. DISCUSSION
Shrestha et al, (1998) have also studied the annual
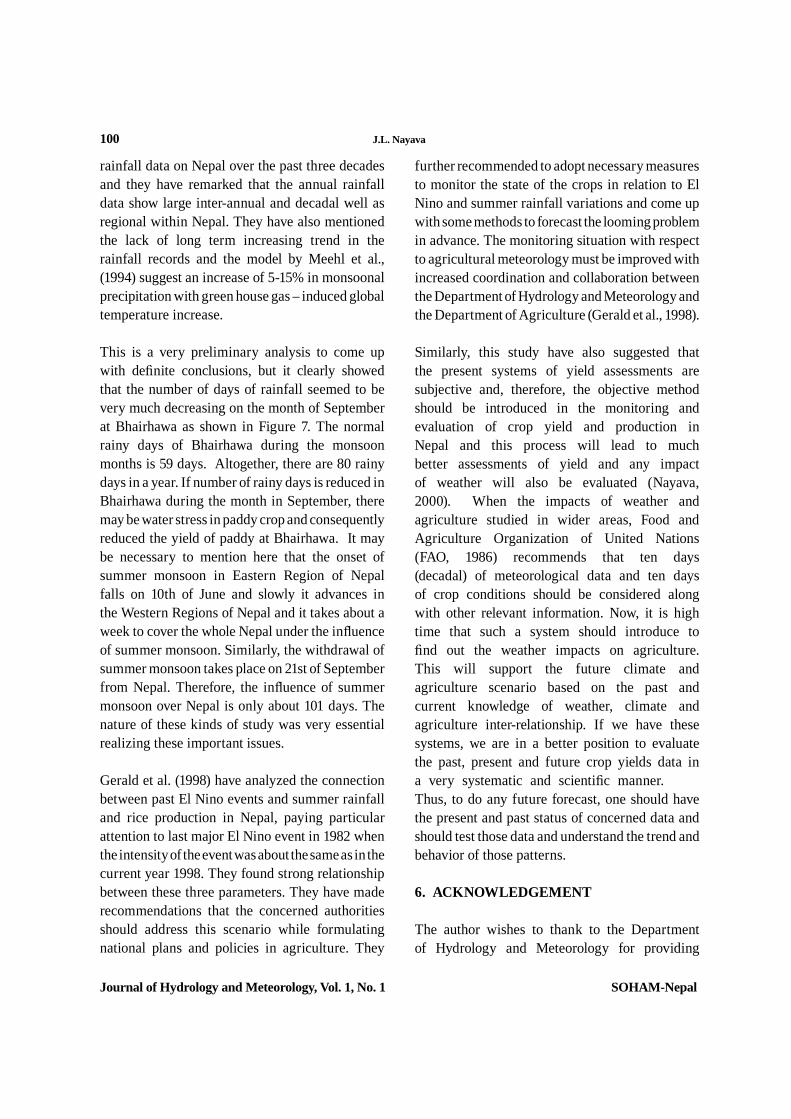
100 J.L. Nayava
Journal of Hydrology and Meteorology, Vol. 1, No. 1 SOHAM-Nepal
rainfall data on Nepal over the past three decades and they have remarked that the annual rainfall data show large inter-annual and decadal well as regional within Nepal. They have also mentioned the lack of long term increasing trend in the rainfall records and the model by Meehl et al., (1994) suggest an increase of 5-15% in monsoonal precipitation with green house gas – induced global temperature increase.
This is a very preliminary analysis to come up with de nite conclusions, but it clearly showed that the number of days of rainfall seemed to be very much decreasing on the month of September at Bhairhawa as shown in Figure 7. The normal rainy days of Bhairhawa during the monsoon months is 59 days. Altogether, there are 80 rainy days in a year. If number of rainy days is reduced in Bhairhawa during the month in September, there may be water stress in paddy crop and consequently reduced the yield of paddy at Bhairhawa. It may be necessary to mention here that the onset of summer monsoon in Eastern Region of Nepal falls on 10th of June and slowly it advances in the Western Regions of Nepal and it takes about a week to cover the whole Nepal under the in uence of summer monsoon. Similarly, the withdrawal of summer monsoon takes place on 21st of September from Nepal. Therefore, the in uence of summer monsoon over Nepal is only about 101 days. The nature of these kinds of study was very essential realizing these important issues.
Gerald et al. (1998) have analyzed the connection between past El Nino events and summer rainfall and rice production in Nepal, paying particular attention to last major El Nino event in 1982 when the intensity of the event was about the same as in the current year 1998. They found strong relationship between these three parameters. They have made recommendations that the concerned authorities should address this scenario while formulating national plans and policies in agriculture. They
further recommended to adopt necessary measures to monitor the state of the crops in relation to El Nino and summer rainfall variations and come up with some methods to forecast the looming problem in advance. The monitoring situation with respect to agricultural meteorology must be improved with increased coordination and collaboration between the Department of Hydrology and Meteorology and the Department of Agriculture (Gerald et al., 1998).
Similarly, this study have also suggested that the present systems of yield assessments are subjective and, therefore, the objective method should be introduced in the monitoring and evaluation of crop yield and production in Nepal and this process will lead to much better assessments of yield and any impact of weather will also be evaluated (Nayava, 2000). When the impacts of weather and agriculture studied in wider areas, Food and Agriculture Organization of United Nations (FAO, 1986) recommends that ten days (decadal) of meteorological data and ten days of crop conditions should be considered along with other relevant information. Now, it is high time that such a system should introduce to nd out the weather impacts on agriculture. This will support the future climate and agriculture scenario based on the past and current knowledge of weather, climate and agriculture inter-relationship. If we have these systems, we are in a better position to evaluate the past, present and future crop yields data in a very systematic and scienti c manner. Thus, to do any future forecast, one should have the present and past status of concerned data and should test those data and understand the trend and behavior of those patterns.
6. ACKNOWLEDGEMENT
The author wishes to thank to the Department of Hydrology and Meteorology for providing
J.L. Nayava 101
Journal of Hydrology and Meteorology, Vol. 1, No. 1 SOHAM-Nepal
the unpublished data of rainfall from 1999-2000.
7. REFERENCES
DHM, 1999a. Daily precipitation records of Gandaki and Narayani Zones through 1996, Department of Hydrology and Meteorology, Kathmandu, Nepal.
DHM, 1999b. Daily precipitation records of Lumbini Zone through 1996, Department of Hydrology and Meteorology, Kathmandu, Nepal.
DHM, 1999c. Daily precipitation records of Bagmati Zone through 1996, Department of Hydrology and Meteorology, Kathmandu, Nepal.
DHM, 2000. Daily precipitation records of Janakpur and Sagarmatha Zones through 1996, Department of Hydrology and Meteorology, Kathmandu, Nepal.
DHM, 2000. Daily precipitation records of Kosi and Mechi Zones through 1996, Department of Hydrology and Meteorology, Kathmandu, Nepal.
DHM, 2000. Daily precipitation records of Mahakali, Seti and Karnali Zones through 1996, Department of Hydrology and Meteorology, Kathmandu, Nepal.
DHM, 2000., Daily precipitation records of Bheri, Rapti and Dhaulagiri Zones through 1996, Department of Hydrology and Meteorology, Kathmandu, Nepal.
DHM, 2001. Daily precipitation records of Nepal,1997-1998, Department of Hydrology and Meteorology, Kathmandu, Nepal.
FAO, 1986. Early Agro meteorological crop yield assessment, FAO Plant Production and Protection paper, 73.
Gerald, J.G, Hobbs, P.R. and Shrestha, M.L, 1998. Possible impact of the current El Nino event on Nepal’s 1998 paddy crop, HMG Ministry of Agriculture/Winrock International, Policy analysis in agriculture and related resource management, Series No. 1 July 1998, pp.1-15.
Meehle, G.A., and Washington, W.M. 1993. South asian summer monsoon variability in a model with doubled atmospheric carbon dioxide concentration. Science, 260, 1101-1104.
Nayava, J.l., 1980. Rainfall in Nepal, The Himalayan Review, Vol. 12, 1-18.
Nayava, J.L. 1982. Climates of Nepal and their implications for Agricultural Development, Ph.D. thesis submitted to The Australian National University, Canberra, Australia.
Nayava, J.L, 1999. Monitoring and evaluation of crop yield and production in Nepal, Proceeding of the 3rd National Conference on Science and Technology, Proceedings Vol.1, Royal Nepal Academy of Science and Technology, Kathmandu, . 720-727.
Shrestha, A.B., Cameron, P.W, Jack, E.D and ayewski P.A, 2000. Precipitation
its vicinity and relationship with some large scale climatological parameters, International Journal of Climatology, 20, 217-327.
Journal of Hydrology and Meteorology, Vol. 2, No. 1 SOHAM-Nepal
102
Society of Hydrologists and Meteorologists
ABSTRACT
Evapotranspiration values are used in many agricultural and engineering applications. There are many empirical formulas to compute evapotranspiration. In Nepalese conditions, Penman and Monteith method is the best to estimate evapotranspiration. All the climatic parameters required to estimate evapotranspiration by Penman and Monteith method for all the rainfall points were not available. Therefore, various models were developed to expand the climatic parameters for all the rainfall points and thus evapotranspiration were nally calculated.
The estimation of evapotranspiration by climate models for Western Nepal*
1. INTRODUCTION
One of the important parameters in calculating the crop water requirement is evapotranspiration (ETo). Meteorological data are the main inputs to estimate evapotranspiration. The “CROPWAT” computer program developed by FAO (1998) based on the modi ed Penman and Monteith Method has been used in this project to estimate evapotranspiration. The project's objective was to strengthen the institutional development of Hydrology and Meteorology and to study the water availability of 77 basins of Western Regions of Nepal. The following data are necessary in calculating ETo: Minimum Temperature (0C); Maximum Temperature (0C); Relative Humidity (%); Wind speed (Km/day); and Sunshine (Hours).
In Western Nepal, the above parameters required to compute evapotranspiration have not been recorded in all the meteorological stations. For example, only 15 meteorological stations have recorded all these parameters to estimate evapotranspiration. This Project intends to estimate evapotranspiration for all the sites of the meteorological rainfall stations.
Therefore, regression programs have been used to extend climatic parameters to the places where observed data are not available.
2. DATA AND METHODOLOGY
Here, in this article, data, methodology, analysis and discussion of each above-mentioned climatic parameter have been separately described as follows:
2.1 TEMPERATURE
At present, there are 54 climatological stations at the Study Area in Western Nepal. The period of record varies from one station to another. All available mean monthly maximum and mean monthly minimum temperature values from 1982 to 1996 were compiled for all the 54 stations. Among them, only 38 climatological stations have complete temperature records from 1982 to 1996. The recorded mean monthly maximum and minimum temperatures used to develop the temperature models are shown in the Meteorology Technical Report No. 4 for the Institutional
J.L. NAYAVA
Keywords: Western Nepal, Penman and Monteith method, CROPWAT
* This paper was published in Journal of Hydrology and Meteorology, 2005, pp 16-23

J.L. Nayava 103
Journal of Hydrology and Meteorology, Vol. 2, No. 1 SOHAM-Nepal
Development of Hydrology and Meteorology (TAHAL, 2002).
Multiple regression analysis was performed in this study by considering the data of 38 stations for fteen years. The multiple regression equations considered latitude, longitude and elevation as independent variables and temperature as the dependent variable. Equation (1) is given below and the variables for each month and the coef cients of determination value (R2) are given in Tables 1 and 2. The multiple regression formula used for estimating the mean monthly maximum or mean monthly minimum temperature was as follows: Y= A + B * (X) + C * (X1) + D * (X2) ……(1)
Where Y = mean monthly maximum or mean monthly minimum temperature in oC;
X = latitude;X1 = longitude;X2 = elevation in meters; andA, B, C and D = monthly constants.
Latitudes and longitudes are given in degrees with minutes converted to decimals.
MONTH A B C D * 10-3 R2
January -90.95 1.77 0.78 -5.8 0.93
February -78.62 1.57 0.74 -6.7 0.96
March -27.08 0.82 0.44 -7.0 0.96
April 45.63 0.07 -0.13 -7.4 0.97
May 70.32 0.38 -0.52 -6.9 0.95
June -6.63 1.61 -0.02 -6.4 0.93
July -85.39 2.29 0.67 -5.8 0.90
August -86.21 2.04 0.77 -5.8 0.92
September -76.17 2.05 0.63 -5.9 0.93
October -39.44 1.31 0.43 -6.3 0.95
November -41.99 1.12 0.49 -6.3 0.95
December -52.17 1.18 0.53 -5.5 0.94
Table 1: Constants for the Maximum Temperature Model
Table 2: Constants for the Minimum Temperature Model
Month A B* 10-2 C * 10-2 D* 10-4 R2
January 40.20 -75.0 -11.3 -38.2 0.76
February 41.23 -68.1 -12.6 -41.1 0.78
March 63.94 -97.6 -25.2 -42.3 0.79
April 144.42 -209.1 -79.4 -44.4 0.82
May 141.49 -164.7 -86.0 -53.3 0.93
June 90.36 -77.8 -51.2 -51.8 0.98
July 35.29 -10.7 -14.4 -51.3 0.99
August 37.19 -2.8 -12.1 -51.1 0.98
September 45.90 -32.8 -13.9 -52.7 0.98
October 79.39 -130.9 -26.3 -51.0 0.93
November 77.99 -132.7 -31.2 -42.0 0.80
December 61.18 -114.4 -21.8 -38.0 0.76
Using those equations, the mean monthly maximum temperature and mean monthly minimum temperature values for all the 12 months have been calculated for all the sites of the 110 rainfall stations in the Project study area. The estimated mean monthly maximum and mean monthly minimum temperature values for all the 54 climatological stations were replaced by the recorded temperatures, where available. The recorded and estimated temperature data were also compared and studied.
The recorded maximum temperature was found to be generally 1°C lower than the estimated maximum temperature except in the valley area where an observed maximum temperature was generally 0.5 to 2°C higher than the estimated maximum temperature. On the other hand, the observed minimum temperature was found to be generally lower than the estimated mean minimum temperature in the hilly region as well as in the valley area. Specially, 3 to 4°C differences occurred in the winter months. This is purely due to inversion in the valley oor. These errors are due to the omission of slope aspect, cloud incidence, vegetation and inversion in the regression model.

104 J.L. Nayava
Journal of Hydrology and Meteorology, Vol. 2, No. 1 SOHAM-Nepal
The regression coef cient for the maximum temperature model was generally higher than 0.9. On the other hand, the regression coef cients for minimum temperature in the winter months were generally less than 0.8. This is mainly due to the omission of the inversion factor in the model. It should be pointed out that the estimated temperature values were not corrected further as the variations did not cause a major change in the nal computed ETo value, which was the purpose of this study.
Nayava(1981) has developed multiple regression equations to estimate mean maximum temperature and mean monthly minimum temperature considering 35 climatological stations in Nepal of which only 14 stations were in Western Nepal. Similar studies for extrapolating temperature data were done by Kenting Earth Science Ltd (1982). These studies have considered only elevation as an independent factor. ICIMOD and DHM (1996) have also used the multiple regression method to estimate the mean monthly maximum temperature and mean monthly minimum temperature and have used those data in preparing the Climatic and Hydrological Atlas Map of Nepal.
2.2 RELATIVE HUMIDITY
Average mean monthly relative humidity for 0845 and 1745 NST have been tabulated for the periods from 1985 to 1996 for all the 54 climatological stations. The daily average relative humidity for 0845 and 1745 and the daily average relative humidity for 0545,0845, 1145, 1445 and 1745 were compared at Jumla, Surkhet and Bhairhawa and the relative humidity of those two periods are very similar to each other. Therefore, relative humidity for 0845 and 1745 NST have computed for the above mentioned period for all the 54 climatological stations as shown in the Meteorology Technical Report No. 4 for the Institutional Development of Hydrology and Meteorology (TAHAL, 2002).
The average of the relative humidity taken at the above-mentioned hours is taken as the mean relative humidity. Several statistical methods have been tested to expand the relative humidity data for other points where recorded data are not available. None of the methods gave satisfactory results. Ultimately, mean monthly relative humidity were plotted and analyzed for each month in separate maps. The mean relative humidity for other sites are interpolated where actual observed data are not available. The interpolation was based on a set of preliminary monthly maps of equi-relative humidity lines prepared for this purpose.
2.3 WIND SPEED
During the end of 1970's, there were only 12 climatological stations, which observed wind data in Nepal. Out of these only 3 climatological stations fall in the study area. Due to the limited data, wind was classi ed in three groups as light, medium and strong winds (Nayava, 1981). McDonald (1982,1992) used similar three groups (Medium Irrigation Project, Design Manual, Hydrology and Manual in Irrigation Design and in Agrometeorology and Hydrology). Recently, WELINK (1998) has used only light wind in all the ETo calculations in the Gandaki Water Basin Study.
There were 24 meteorological stations in which wind data have been recording in the study area. The Department of Hydrology and Meteorology has published wind data only up to 1990 and almost wind data up to 1998 were obtained from the Department of Hydrology and Meteorology (DHM). The period of record varies from station to station. It is very dif cult to consider the same period of data for all the stations. All the available wind data from 1967 to 1990 are computed as shown in the Meteorology Technical Report No.4 for the Institutional Development of Hydrology and Meteorology (TAHAL, 2002). It
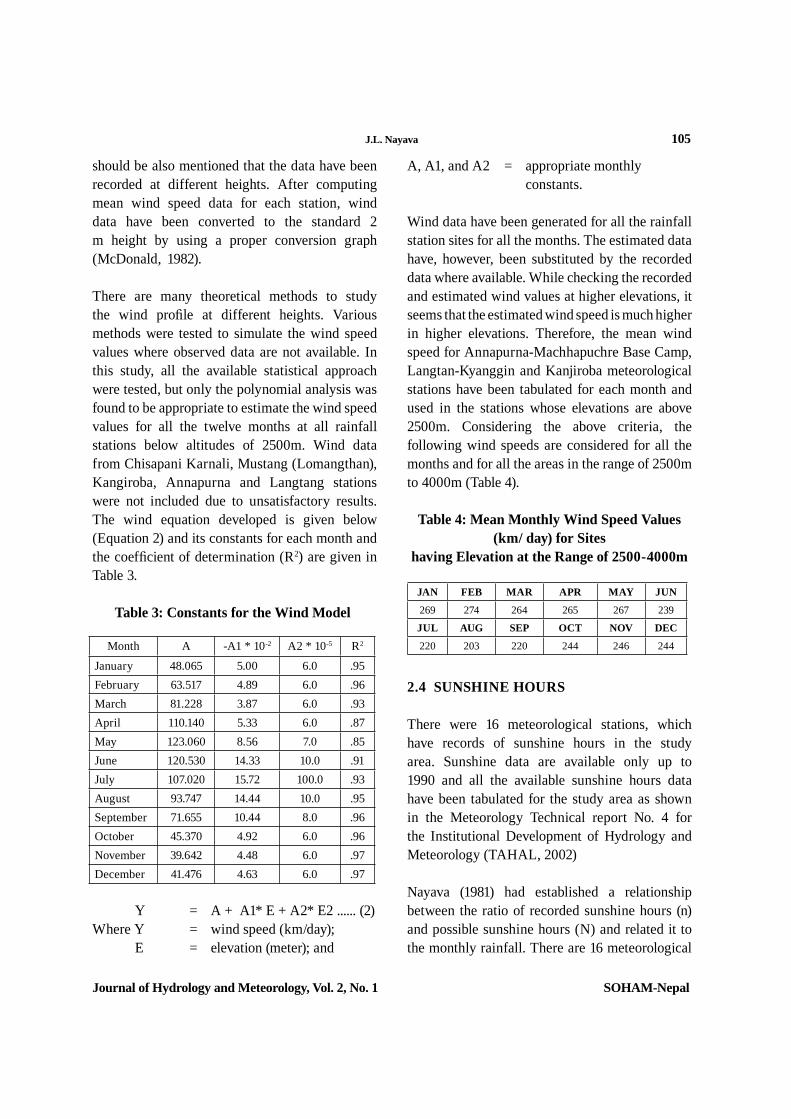
J.L. Nayava 105
Journal of Hydrology and Meteorology, Vol. 2, No. 1 SOHAM-Nepal
should be also mentioned that the data have been recorded at different heights. After computing mean wind speed data for each station, wind data have been converted to the standard 2 m height by using a proper conversion graph (McDonald, 1982).
There are many theoretical methods to study the wind pro le at different heights. Various methods were tested to simulate the wind speed values where observed data are not available. In this study, all the available statistical approach were tested, but only the polynomial analysis was found to be appropriate to estimate the wind speed values for all the twelve months at all rainfall stations below altitudes of 2500m. Wind data from Chisapani Karnali, Mustang (Lomangthan), Kangiroba, Annapurna and Langtang stations were not included due to unsatisfactory results. The wind equation developed is given below (Equation 2) and its constants for each month and the coef cient of determination (R2) are given in Table 3.
Table 3: Constants for the Wind Model
Month A -A1 * 10-2 A2 * 10-5 R2
January 48.065 5.00 6.0 .95February 63.517 4.89 6.0 .96March 81.228 3.87 6.0 .93April 110.140 5.33 6.0 .87May 123.060 8.56 7.0 .85June 120.530 14.33 10.0 .91July 107.020 15.72 100.0 .93August 93.747 14.44 10.0 .95September 71.655 10.44 8.0 .96October 45.370 4.92 6.0 .96November 39.642 4.48 6.0 .97December 41.476 4.63 6.0 .97
Y = A + A1* E + A2* E2 ...... (2) Where Y = wind speed (km/day); E = elevation (meter); and
Table 4: Mean Monthly Wind Speed Values (km/ day) for Sites
having Elevation at the Range of 2500-4000m
JAN FEB MAR APR MAY JUN
269 274 264 265 267 239
JUL AUG SEP OCT NOV DEC
220 203 220 244 246 244
2.4 SUNSHINE HOURS
There were 16 meteorological stations, which have records of sunshine hours in the study area. Sunshine data are available only up to 1990 and all the available sunshine hours data have been tabulated for the study area as shown in the Meteorology Technical report No. 4 for the Institutional Development of Hydrology and Meteorology (TAHAL, 2002)
Nayava (1981) had established a relationship between the ratio of recorded sunshine hours (n) and possible sunshine hours (N) and related it to the monthly rainfall. There are 16 meteorological
A, A1, and A2 = appropriate monthly constants.
Wind data have been generated for all the rainfall station sites for all the months. The estimated data have, however, been substituted by the recorded data where available. While checking the recorded and estimated wind values at higher elevations, it seems that the estimated wind speed is much higher in higher elevations. Therefore, the mean wind speed for Annapurna-Machhapuchre Base Camp, Langtan-Kyanggin and Kanjiroba meteorological stations have been tabulated for each month and used in the stations whose elevations are above 2500m. Considering the above criteria, the following wind speeds are considered for all the months and for all the areas in the range of 2500m to 4000m (Table 4).

106 J.L. Nayava
Journal of Hydrology and Meteorology, Vol. 2, No. 1 SOHAM-Nepal
stations. These data show that more sunshine hours are observed in the Terai. The amount of sunshine hours slowly decreases in the Hill and Mountain Regions due the greater frequency of clouds in those Regions. Empirical relationships have been tested considering the ratio of n/N and rainfall at each of the sixteen places. While doing so the data of Thakmarpha Station did not give satisfactory results and therefore it was omitted from further consideration. As a result only 15 stations have been considered for the determination of constants for Equation 3. This empirical method is suitable to derive sunshine hours in the absence of real data for the Western Nepal.
While looking at the sunshine patterns in Western Nepal, the whole region was tentatively divided into 10 sub-regions, each of which was characterized by different sunshine hours patterns (Fig. 1).
Thus ten separate polynomial equations have been developed for each sub-region. The polynomial equation is as follows (Equation 3) and the variables for each equation and coef cient of determination (R2) are given in Table 5.
Y = A + A1 *P + A2 * P2 …….………..(3)
Where Y = ratio of sunshine hours and day lengths (n/N) on a monthly basis;
P = rainfall (mm/month); andA, B, C = monthly constants.
Table 5: Constants for the Sunshine Model
Group A B * 10-3 C * 10-6 R2
1 0.63 - 0.5 100.0 0.85
2 0.74 -1.6 30.0 0.94
3 0.83 -4.6 0.1 0.91
4 0.48 -3.3 -’0.8 0.74
5 0.69 -0.9 30.0 0.90
6 0.79 -1.4 80.0 0.98
7 0.67 -0.5 10.0 0.94
8 0.66 -0.6 100.0 0.84
9 0.54 -5.0*10-3 -70.0 0.77
10 0.75 1.3 70.0 0.95
2.5 EVAPOTRANSPIRATION
There are many empirical formulas to estimate evapotranspiration, but for Nepalese Condition, it is considered that Penman method gives the best estimates. “A limitation to use of Penman method in Nepal is the scarcity of meteorological records required. However, this can be overcome by the use of extrapolation models based on the work of Nayava (1981). And the model derives the estimates of temperature, dew point and sunshine duration for sites where only rainfall record are available” (MacDonald, 1982).
Figure 1. Sunshine hour groups in Western Nepal
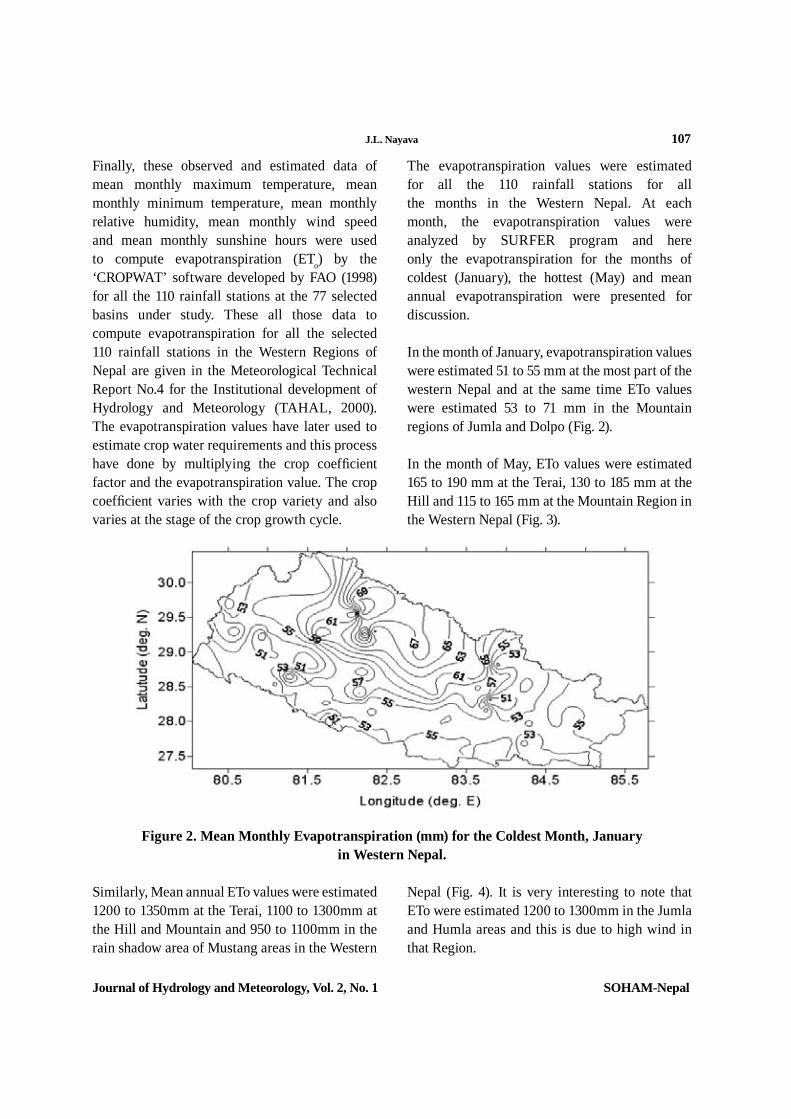
J.L. Nayava 107
Journal of Hydrology and Meteorology, Vol. 2, No. 1 SOHAM-Nepal
Finally, these observed and estimated data of mean monthly maximum temperature, mean monthly minimum temperature, mean monthly relative humidity, mean monthly wind speed and mean monthly sunshine hours were used to compute evapotranspiration (ETo) by the ‘CROPWAT’ software developed by FAO (1998) for all the 110 rainfall stations at the 77 selected basins under study. These all those data to compute evapotranspiration for all the selected 110 rainfall stations in the Western Regions of Nepal are given in the Meteorological Technical Report No.4 for the Institutional development of Hydrology and Meteorology (TAHAL, 2000). The evapotranspiration values have later used to estimate crop water requirements and this process have done by multiplying the crop coef cient factor and the evapotranspiration value. The crop coef cient varies with the crop variety and also varies at the stage of the crop growth cycle.
The evapotranspiration values were estimated for all the 110 rainfall stations for all the months in the Western Nepal. At each month, the evapotranspiration values were analyzed by SURFER program and here only the evapotranspiration for the months of coldest (January), the hottest (May) and mean annual evapotranspiration were presented for discussion.
In the month of January, evapotranspiration values were estimated 51 to 55 mm at the most part of the western Nepal and at the same time ETo values were estimated 53 to 71 mm in the Mountain regions of Jumla and Dolpo (Fig. 2).
In the month of May, ETo values were estimated 165 to 190 mm at the Terai, 130 to 185 mm at the Hill and 115 to 165 mm at the Mountain Region in the Western Nepal (Fig. 3).
Figure 2. Mean Monthly Evapotranspiration (mm) for the Coldest Month, January in Western Nepal.
Similarly, Mean annual ETo values were estimated 1200 to 1350mm at the Terai, 1100 to 1300mm at the Hill and Mountain and 950 to 1100mm in the rain shadow area of Mustang areas in the Western
Nepal (Fig. 4). It is very interesting to note that ETo were estimated 1200 to 1300mm in the Jumla and Humla areas and this is due to high wind in that Region.
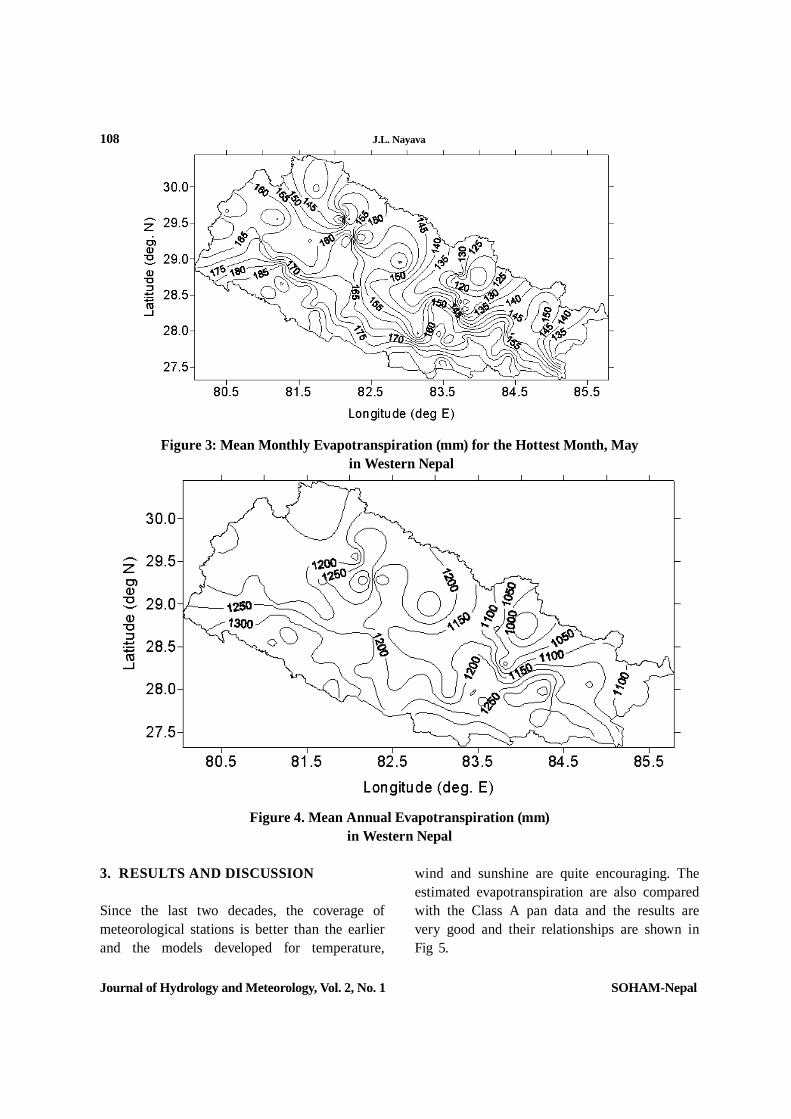
108 J.L. Nayava
Journal of Hydrology and Meteorology, Vol. 2, No. 1 SOHAM-Nepal
Figure 3: Mean Monthly Evapotranspiration (mm) for the Hottest Month, May in Western Nepal
Figure 4. Mean Annual Evapotranspiration (mm)in Western Nepal
3. RESULTS AND DISCUSSION
Since the last two decades, the coverage of meteorological stations is better than the earlier and the models developed for temperature,
wind and sunshine are quite encouraging. The estimated evapotranspiration are also compared with the Class A pan data and the results are very good and their relationships are shown in Fig 5.

J.L. Nayava 109
Journal of Hydrology and Meteorology, Vol. 2, No. 1 SOHAM-Nepal
Figure 5. Comparision of mean monthly Class A Pan values with ETo (Penman-Monteith) values at selected places in Western Nepal.
mm
/day
mm
/day
mm
/day
mm
/day
mm
/day
mm
/day
mm
/day
mm
/day
mm
/day
mm
/day

110 J.L. Nayava
Journal of Hydrology and Meteorology, Vol. 2, No. 1 SOHAM-Nepal
The Penman and Monteith equations are described in all the standard textbook of agricultural climatology and Cropwat, FAO publications. Therefore, the equations are not presented here.
The higher values of ETo as shown in Figures. 4 and 5 in Mountain Regions are due to aerodynamic effect. This phenomenon is better supported by the following explanation. It is known that the Penman equation consists of two terms, namely the energy term Qn and the aerodynamic term Ea. Stanhill (1962,B) explained the two terms are weighted according to mean air temperature as shown in Table 6.
It is to note that the sunshine duration data are very sparse and very irregular and hope that this will improve in coming years by the concerned authorities.
4. ACKNOWLEDGEMENT
The author wishes to thank Tahal Consulting Engineers Ltd. for allowing me to write this article. The author is grateful to the Department of Hydrology and Meteorology for providing the manuscript to copy the unpublished data of wind and sunshine from 1991 to 1998.
Table 6. Weighting factors for the energy and aerodynamic terms in Penman Formula
Mean air temperature
(OC)
Energy term Aerodynamic term
0 0.40 0.60
10 0.56 0.44
20 0.69 0.31
30 0.79 0.21
40 0.86 0.14
5. REFERENCES
DHM,1977-1999. Climatological Records of Nepal, Department of Hydrology and Meteorology, Kathmandu, Nepal.
DHM,1977. Climatological Records of Nepal (1967-1975), Supplement Data, Vol III, Department of Hydrology and Meteorology, Kathmandu, Nepal.
DHM,1986. Climatological Records of Nepal (1976-1984), Supplement Data, Vol II, Department of Hydrology and Meteorology, Kathmandu, Nepal.
DHM,1993-1998. Snow and Glacier Hydrology, Year Books, 1987-1992, 1993,1994,1995,1996 Department of Hydrology and Meteorology, Kathmandu.
FAO, 1992. Cropwat, A computer Program for Irrigation Planning and Management, FAO Irrigation and Drainage paper 46, Rome.
FAO, 1998. Crop Evapotranspiration, Guidelines for computing crop water requirements, FAO Irrigation and Drainage paper 56, Rome.
ICIMOD, 1996. Climatic and Hydrological Atlas of Nepal, International Center for Integrated Mountain Development, Kathmandu, Nepal.
Kenting, 1982. Climatological Report, Land Resources Mapping Project, Kenting Earth Science Ltd Kathmandu, Nepal.
McDonald; 1982. Medium Irrigation Project Design Manual , Prepared by McDonald
J.L. Nayava 111
Journal of Hydrology and Meteorology, Vol. 2, No. 1 SOHAM-Nepal
and Partners Ltd and Hunting Technical Services Limited Kathmandu, Nepal.
McDonald, 1990. Design Manuals for Irrigation Projects in Nepal M.3 Hydrology and agrometeorology Manual, Prepared by McDonald and Partners Ltd in association with MacDonald Agicultural Services Ltd and East Consult (P) Ltd, Kathmandu, Nepal.
Nayava, J.L. 1981. Climates of Nepal and their implications for Agricultural Development, The Australian National University, Canberra, Ph.D. Dissertation.
Stanhill, G, 1962c. The use of Piche evaporimeter in the calculation of evaporation, Quarterly
Journal Royal Meteorological Society, 88, 80-82.
Tahal, 2002. Meteorological Technical Report No.4, Institutional Development of Hydrology and Meteorology, Prepared by Tahal Consulting Engineers Ltd; In association with GEOCE Consultants (P) Ltd, ARMS (P) Ltd, CEMAT Consultants (P) Ltd, Kathmandu, Nepal.
WELINK, 1998. Gandaki Basin Study, Final Report, vol. I, II and III, Water and Energy Commission Secretariate (WECS), Ministry of Water Resources, Prepared by WELINK Consultants (P) Ltd Kathmandu, Nepal.

Journal of Hydrology and Meteorology, Vol. 3, No. 1 SOHAM-Nepal
112
Abstract: Wind speed is one of the most important parameter for estimating evapotranspiration(ETo). ETo is applied in various applications such as crop water requirements and water management studies. In Nepal, wind speeds required for such analysis are very scanty. However, wind speeds were measured at 24 meteorological stations in Western Nepal. Wind speed values were recorded at the different heights and these values were converted into standard 2 m height. When this study was undertaken, there were altogether 148 daily rainfall stations in Western Nepal. Out of that total 110 rainfall stations having suf cient data had selected for the hydrological studies. Thus, these values of wind speed at standard height are necessary parameters to estimate ETo for all the 110 rainfall stations.
All the available statistical approaches were tested for this study. Polynomial relation was found to be appropriate to estimate the wind speed values for all the twelve months at all rainfall stations below altitudes of 2566 m. At the higher altitude from 2567 to 3863 m, a tentative wind speed values were assumed for all the twelve months. At the same time, the observed and simulated wind values were used to prepare the spatial variations of wind at each month. These mean monthly maps of wind speeds will give the general pattern of wind at the study area.
The analysis of wind speed values for the Western Nepal*
1. INTRODUCTION:
Wind speed and direction are applied in many agricultural and engineering works. Wind is one of the main factors in the study of air pollution and in locating new sites for industry, aerodrome and town planning. Windbreaks and shelterbelts can be made to reduce the serious damage of crops by wind. The knowledge of wind pro le and the maximum speed of gust and direction are necessary for the construction of tall buildings, television towers and installation of high-tension wires from poles to poles. The choice of best site and best design of wind power installation is to large extent a climatological question. Similarly,
* This paper was published in Journal of Hydrology and Meteorology, 2006, pp 60-67
Janak Lal NayavaChairman, Society of Hydrologists and Meteorologists-Nepal
the wind speed values are one of the main parameters to estimate evapotranspiration (ETo) ,which is the basic parameter for estimating crop water requirements. In the past, water balance studies were conducted for Western Nepal. In those studies, wind data are one of the important parameters to estimate ETo. However, due to a very thin network of wind stations in western Nepal, the study was primarily conducted from the wind data collected at few stations. Under the present situation when wind data are quite sparse, it is important to devise some methodology for extending wind data from a particular station to other stations for which estimation of ETo is to be conducted.
Keywords: western Nepal, evapotranspiration, wind estimation

J.L. Nayava 113
Journal of Hydrology and Meteorology, Vol. 3, No. 1 SOHAM-Nepal
2. DATA USED:
During the end of 1970’s, only 12 climatological stations used to observe wind in the whole of Nepal. Out of these 3 climatological stations were observed wind in Western Nepal. Due to the limited data, wind values were classi ed in three groups such as light, medium and strong winds (Nayava, 1981). MacDonalds (1982, 1992)) used the same three groups in their documents in Medium Irrigation Project, Design Manual, Hydrology and Manual in Irrigation Design and In Agrometeorology and Hydrology. Recently, WELINK (1998) had used only light wind in all their ETo calculations in their Gandaki Water Basin Study.
There are 24 meteorological stations in the study area, where wind observations are made (Figure 1). Department of Hydrology and Meteorology (DHM) had published the wind data up-to 1998. The period of record varied from station to station. It was very dif cult to consider the same period of data for all the stations. All the available
wind data from 1967 to 1998 were computed. It should be mentioned that the data had recorded at different heights. The wind speed values for each station were converted to the standard 2 m height by using the proper conversion graph presented by MacDonald (1982). The converted wind speed values are presented in Table 1. The equation for conversion of wind from different height to the standard 2 m height is also given by Allen et al. (1998).
In addition to the observed data, the author conducted eld survey, which included discussion with eld staffs. Following information was collected during the survey. A strong wind prevails from midnight to late morning at Chisapani Karnali during October to March. At the same period, wind speed values are generally lighter in afternoon. During April to September, wind speed values are generally lighter except on a few occasions in April and May. It was also discovered that wind speeds are calm during the overcast days in Chisapani Karnali (see Wind data of Chisapani Karnali in Table 1).
Figure 1. Wind networks in the Western Nepal.

114 J.L. Nayava
Journal of Hydrology and Meteorology, Vol. 3, No. 1 SOHAM-Nepal
Index
Station
Name Lat. Long.
Elev.
(m) Jan Feb Mar Apr May Jun Jul Aug Sep Oct Nov Dec Period
(°N) (°E)
707 Bhairhawa
(Agri.)27.53 83.46 120 0.48 0.63 0.90 1.42 1.72 1.52 1.45 1.21 0.88 0.51 0.43 0.41 1986-98
728 Simari 27.53 83.75 154 0.58 0.70 0.96 1.47 1.48 1.31 1.23 1.00 0.88 0.53 0.39 0.45 1981-87
706 Dumkauli 27.68 84.21 154 0.20 0.50 0.80 1.00 0.70 0.50 0.30 0.20 0.10 0.10 0.20 0.1 1971-72
209 Dhanga-
dhi28.68 80.60 170 0.61 0.75 1.01 1.26 1.42 1.37 1.04 0.77 0.63 0.46 0.47 0.48 1989-98
105 Mahendra
Nagar29.04 80.22 176 0.48 0.61 0.74 0.95 0.96 0.79 0.77 0.64 0.52 0.42 0.40 0.43 1977-98
409 Khajura
(Nepal-
gunj)
28.10 81.66 190 0.50 0.84 1.08 1.46 1.82 1.85 1.45 1.19 0.84 0.53 0.43 0.54 1976-92
419 Sikta 28.03 81.78 195 0.46 0.56 0.84 1.08 1.22 0.85 0.48 0.32 0.44 0.50 0.33 0.39 1981-98
405 Chisapani
Karnali28.65 81.26 225 2.07 1.98 2.21 2.35 2.07 1.47 0.91 0.98 1.16 1.51 1.95 2.17 1968-98
902 Rampur 27.61 84.41 256 0.45 0.63 0.98 1.33 1.28 1.03 0.89 0.90 0.85 0.54 0.35 0.43 1978-98
815 Khairini
Tar28.03 84.10 500 0.42 0.54 0.70 0.81 0.76 0.72 0.58 0.53 0.50 0.41 0.36 0.34 1977-98
218 Dipayal
Doti29.25 80.95 617 0.26 0.44 0.57 0.82 0.94 0.94 0.70 0.47 0.49 0.54 0.41 0.24 1982-98
406 Surkhet 28.60 81.61 720 1.00 1.25 1.38 1.59 1.56 1.33 0.96 0.80 0.73 0.80 0.75 0.79 1975-98
804 Pokhara
Airport28.21 84.00 827 0.59 0.82 1.03 1.07 0.93 0.73 0.68 0.64 0.61 0.54 0.50 0.5 1987-98
401 Pusma
Camp28.88 81.25 950 1.05 1.37 1.86 2.29 2.30 1.42 0.74 0.66 0.78 0.95 0.92 0.88 1968-98
809 Gorkha 28.00 84.61 1097 0.72 0.88 1.08 1.10 0.99 0.66 0.52 0.68 0.67 0.69 0.65 0.72 1983-98
814 Lumle 28.30 83.80 1740 1.54 1.65 1.74 1.63 1.62 1.56 1.52 1.49 1.47 1.46 1.43 1.47 1970-98
715 Khan-
chikot27.93 83.15 1760 1.94 2.21 2.72 2.87 2.52 2.21 1.89 1.66 1.80 1.68 1.70 1.79 1977-98
104 Dadeld-
hura29.30 80.68 1848 1.99 2.19 2.42 2.44 2.54 2.12 1.88 1.75 1.76 1.99 1.82 1.9 1978-92
303 Jumla 29.28 82.16 2300 2.68 3.17 3.92 4.00 3.97 3.92 3.56 3.04 3.28 3.70 3.42 2.8 1978-84
604 Thakmar-
pha28.75 83.70 2566 4.25 4.60 4.32 4.03 4.34 4.76 4.68 4.39 4.06 3.69 3.79 3.89 1970-90
612 Mustang,
Lomang-
tan
29.19 83.96 3705 1.54 1.93 1.61 1.79 1.80 1.84 1.65 1.46 1.51 1.41 1.23 1.56 1984-90
An-
napurna
(MBC)
28.54 83.95 3470 3.40 3.20 3.10 3.10 3.20 2.70 2.50 2.10 2.20 2.70 2.90 3.20 1987-96
Langtang,
Kyangjing28.22 85.62 3920 2.80 3.10 3.10 3.10 3.00 2.80 2.60 2.60 2.50 2.90 2.80 2.10 1987-96
Kanjiroba,
Hurikot29.12 82.60 3770 3.00 3.40 3.50 2.00 2.20 1.40 2.70 2.50 2.70 3.00 2.50 5.00 1992-96
Table 1. Wind data at 2 m height (m s-1) in Western Nepal
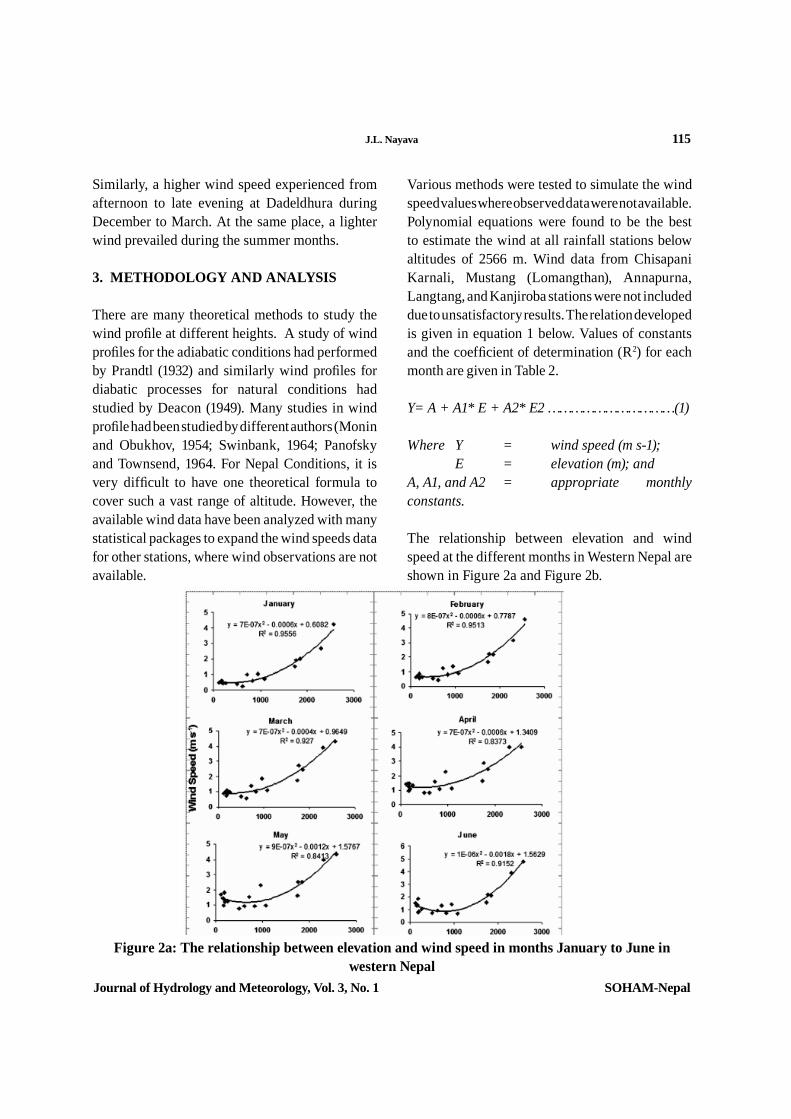
J.L. Nayava 115
Journal of Hydrology and Meteorology, Vol. 3, No. 1 SOHAM-Nepal
Similarly, a higher wind speed experienced from afternoon to late evening at Dadeldhura during December to March. At the same place, a lighter wind prevailed during the summer months.
3. METHODOLOGY AND ANALYSIS
There are many theoretical methods to study the wind pro le at different heights. A study of wind pro les for the adiabatic conditions had performed by Prandtl (1932) and similarly wind pro les for diabatic processes for natural conditions had studied by Deacon (1949). Many studies in wind pro le had been studied by different authors (Monin and Obukhov, 1954; Swinbank, 1964; Panofsky and Townsend, 1964. For Nepal Conditions, it is very dif cult to have one theoretical formula to cover such a vast range of altitude. However, the available wind data have been analyzed with many statistical packages to expand the wind speeds data for other stations, where wind observations are not available.
Various methods were tested to simulate the wind speed values where observed data were not available. Polynomial equations were found to be the best to estimate the wind at all rainfall stations below altitudes of 2566 m. Wind data from Chisapani Karnali, Mustang (Lomangthan), Annapurna, Langtang, and Kanjiroba stations were not included due to unsatisfactory results. The relation developed is given in equation 1 below. Values of constants and the coef cient of determination (R2) for each month are given in Table 2.
Y= A + A1* E + A2* E2 ……………………………(1)
Where Y = wind speed (m s-1); E = elevation (m); andA, A1, and A2 = appropriate monthly constants.
The relationship between elevation and wind speed at the different months in Western Nepal are shown in Figure 2a and Figure 2b.
Figure 2a: The relationship between elevation and wind speed in months January to June in western Nepal
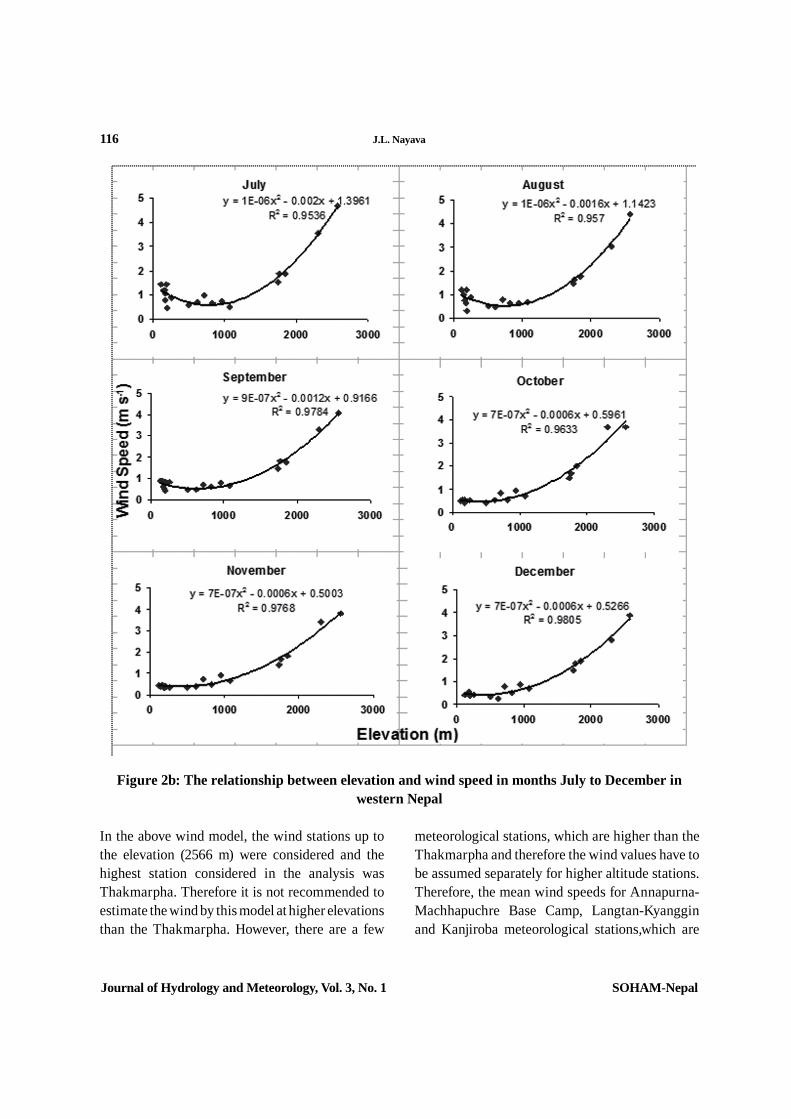
116 J.L. Nayava
Journal of Hydrology and Meteorology, Vol. 3, No. 1 SOHAM-Nepal
Figure 2b: The relationship between elevation and wind speed in months July to December in western Nepal
In the above wind model, the wind stations up to the elevation (2566 m) were considered and the highest station considered in the analysis was Thakmarpha. Therefore it is not recommended to estimate the wind by this model at higher elevations than the Thakmarpha. However, there are a few
meteorological stations, which are higher than the Thakmarpha and therefore the wind values have to be assumed separately for higher altitude stations. Therefore, the mean wind speeds for Annapurna-Machhapuchre Base Camp, Langtan-Kyanggin and Kanjiroba meteorological stations,which are

J.L. Nayava 117
Journal of Hydrology and Meteorology, Vol. 3, No. 1 SOHAM-Nepal
Month A -A1 * 10-3 A2 * 10-7 R2
Januar 0.6082 0.6 7 0.96Februa 0.7787 0.6 8 0.95March 0.9694 0.4 7 0.93April 1.3409 0.6 7 0.84May 1.5767 1.2 9 0.84June 1.5629 1.8 10 0.91July 1.3961 2 10 0.95August 1.1423 1.6 10 0.96Septe 0.9116 1.2 9 0.98Octobe 0.5961 0.6 7 0.96Novem 0.5003 0.6 7 0.99Decem 0.5266 0.6 7 0.98
Table 2. Constants of the wind model for Western Nepal
situated at much higher elevation, are estimated separately for each month and those mean monthly values were used in the stations, whose elevations are above 2566 m. These estimated values are given in Table 4, which represents the wind speed values used for all the months and for
all sites, whose elevation in the range of 2567 m to 3803 m, the latter being the elevation of the highest climatological station, Mugu.
The observed and simulated wind speed values for 110 rainfall stations in Western Nepal for all the months were prepared and analyzed by the SURFER graphical software. Here only the results of January and July are presented for discussion. .In January as shown in Figure 3, the wind speeds were generally more than 2.6 m s-1 at the High Mountain Regions in the Western Nepal and at the same time, it showed more than 4.25 m s-1 at Thakmarpha. During that month, a few pocket areas such as Dadeldhura, Chisapani Karnali, Khanchikot and Daman indicated 2.0 m s-1. In Terai area of Western Nepal, wind speed was less than 0.6 m s-1
Similarly, in July as shown in Figure 4, the wind speeds at the High Mountain Regions in
Table 3: Mean monthly wind speed values (m s-1) for sites Having elevation in the range of 2567-3803 m
Jan Feb Mar Apr May Jun Jul Aug Sep Oct Nov Dec3.08 3.23 3.19 2.71 2.77 2.31 2.59 2.40 2.59 2.86 2.71 2.82
Figure 3: Mean Monthly Wind Speed (m s-1) for the Coldest Month, January in western Nepal
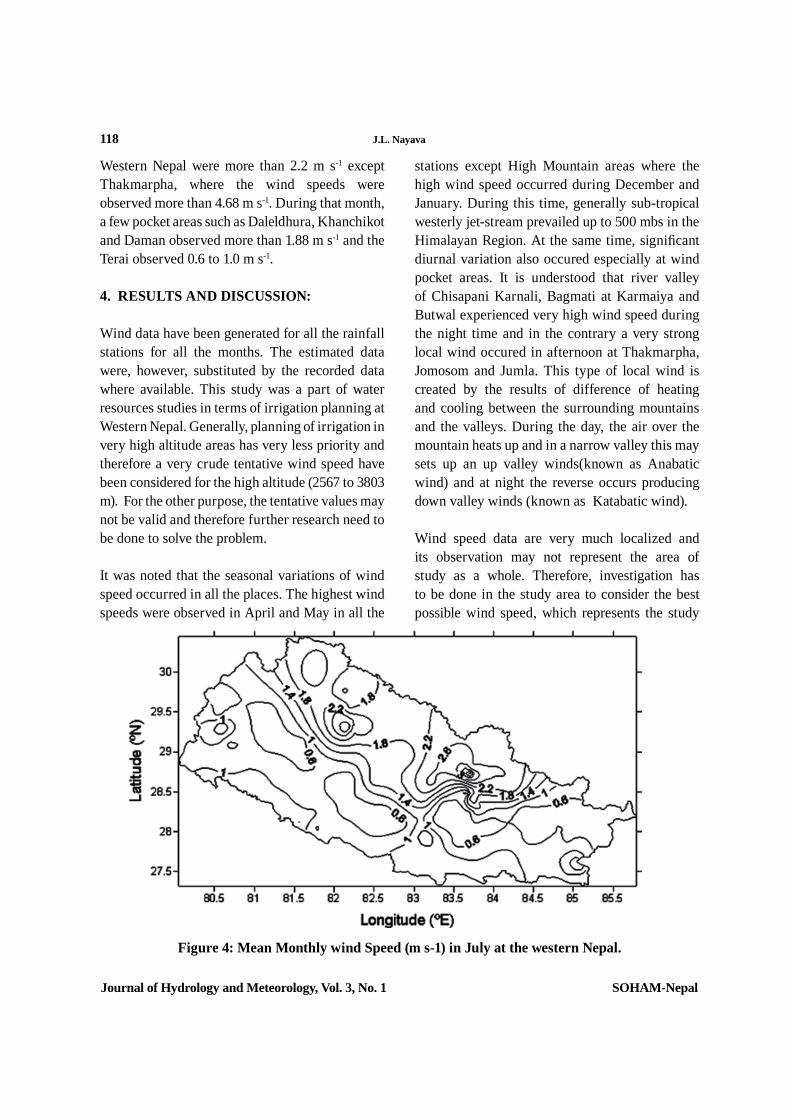
118 J.L. Nayava
Journal of Hydrology and Meteorology, Vol. 3, No. 1 SOHAM-Nepal
Western Nepal were more than 2.2 m s-1 except Thakmarpha, where the wind speeds were observed more than 4.68 m s-1. During that month, a few pocket areas such as Daleldhura, Khanchikot and Daman observed more than 1.88 m s-1 and the Terai observed 0.6 to 1.0 m s-1.
4. RESULTS AND DISCUSSION:
Wind data have been generated for all the rainfall stations for all the months. The estimated data were, however, substituted by the recorded data where available. This study was a part of water resources studies in terms of irrigation planning at Western Nepal. Generally, planning of irrigation in very high altitude areas has very less priority and therefore a very crude tentative wind speed have been considered for the high altitude (2567 to 3803 m). For the other purpose, the tentative values may not be valid and therefore further research need to be done to solve the problem.
It was noted that the seasonal variations of wind speed occurred in all the places. The highest wind speeds were observed in April and May in all the
stations except High Mountain areas where the high wind speed occurred during December and January. During this time, generally sub-tropical westerly jet-stream prevailed up to 500 mbs in the Himalayan Region. At the same time, signi cant diurnal variation also occured especially at wind pocket areas. It is understood that river valley of Chisapani Karnali, Bagmati at Karmaiya and Butwal experienced very high wind speed during the night time and in the contrary a very strong local wind occured in afternoon at Thakmarpha, Jomosom and Jumla. This type of local wind is created by the results of difference of heating and cooling between the surrounding mountains and the valleys. During the day, the air over the mountain heats up and in a narrow valley this may sets up an up valley winds(known as Anabatic wind) and at night the reverse occurs producing down valley winds (known as Katabatic wind).
Wind speed data are very much localized and its observation may not represent the area of study as a whole. Therefore, investigation has to be done in the study area to consider the best possible wind speed, which represents the study
Figure 4: Mean Monthly wind Speed (m s-1) in July at the western Nepal.

J.L. Nayava 119
Journal of Hydrology and Meteorology, Vol. 3, No. 1 SOHAM-Nepal
area. Also the wind speeds play a secondary role in the estimation of ETo by Penman and Monteith equation and therefore the estimated wind values are quite satisfactory for the present analysis.
5. USIONS AND SUGGESTIONS:
More wind stations (manual and automatic) are necessary for better analysis of wind data in Nepal due to extreme topographical differences within a short distance. Sincere advice to the Department of Hydrology and Meteorology, Nepal take necessary initiate to process and publish their data regularly within the subsequent year.
6. ACKNOWLEDGEMENTS:
The author had worked as a Consultant Meteorologist in Tahal Consulting Engineers Ltd In association with GEOCE Consultants (P) Ltd, ARMS (P) Ltd and CEMAT Consultants (P) Ltd. Kathmandu, Nepal. The author wishes to thank Tahal Consulting Engineers Ltd. for allowing me to write this article. I would like to thank the weather observers from the Far Western Region of Nepal: Mr Bhoj Raj Sharma, Mr Pant, Mr Arjun Bahadur Saud. I acknowledge Mr Sudan Raut for helping me analyze data by SURFER software. Sincere thanks due to Dr Arun Bahadur Shrestha for his valuable suggestions and help during surfer analysis.
7. REFERENCES:
Allen, R.G. et.al, 1998, Crop evapotranspiration, Guidelines for computing crop water requirements, FAO Irrigation and Drainage paper 56, Rome, pp. 300.
Deacon, E.L, 1949, Vertical diffusion in the lowest layers of the atmosphere, Quarterly Journal of Royal Meteorological Society; vol. 75, pp.89-103.
DHM, 1977, Climatological Records of Nepal (1967-1975), Supplement Data, Vol.III, Department of Hydrology and Meteorology, Kathmandu, Nepal.
DHM, 1986, Climatological Records of Nepal (1976-1984), Supplement Data, Vol.II, Department of Hydrology and Meteorology, Kathmandu, Nepal.
DHM, 1988, Climatological Records of Nepal (1985-1986), Department of Hydrology and Meteorology, Kathmandu, Nepal.
DHM, 1995, Climatological Records of Nepal (1987-1990), Department of Hydrology and Meteorology, Kathmandu, Nepal.
DHM, 2003, Climatological Records of Nepal, Supplemental- Agrometeorological Data (1991-1998). Department of Hydrology and Meteorology, Kathmandu, Nepal.
.DHM, 1993, Snow and Glacier Hydrology,
Year Book, 1987-1992, Department of Hydrology and Meteorology, Kathmandu.
DHM, 1995, Snow and Glacier Hydrology, Year Book, 1993, Supplement No.3, Department of Hydrology and Meteorology, Kathmandu.
DHM, 1996, Snow and Glacier Hydrology, Year Book, 1994, Supplement No.4, Department of Hydrology and Meteorology, Kathmandu.
DHM, 1997, Snow and Glacier Hydrology, Year Book, 1995, Supplement No.5, Department of Hydrology and Meteorology, Kathmandu.
DHM, 1998, Snow and Glacier Hydrology,
120 J.L. Nayava
Journal of Hydrology and Meteorology, Vol. 3, No. 1 SOHAM-Nepal
Year Book, 1996, Supplement No.6, Department of Hydrology and Meteorology, Kathmandu.
MacDonald and Partners Ltd and Hunting Technical Services Limited, 1982, Medium Irrigation Project Design Manual , Kathmandu.
MacDonald and Partners Ltd in association with MacDonald Agricultural Services Ltd and East Consult (P) Ltd, 1990 Design Manuals for Irrigation Projects in Nepal M.3 Hydrology and Agrometeorology Manual.
Monin, A.S. and Obukhov, A.M. 1954, Akademiia Nauk S.S.S.R; Trudy, No.24, pp.163.
Nayava, J.L. 1981, Climates of Nepal and their implications for Agricultural Development, The Australian National University, Canberra, Ph.D.Thesis.
Panofsky, H.A. and Townsend, A.A, 1964, Change of terrain roughness and the wind pro le, Quarterly Journal of Royal Meteorological Society, Vol. 90, pp.147-155.
Prandtl, L. 1932 , Ibid., 19, p188.
Swinkbank, W.C. 1964, The exponential wind pro le, Quarterly Journal of Royal Meteorological Society, Vol. 90, pp.119-135.
WELINK Consultants (P) Ltd., 1998, Gandaki Basin Study, Final Report, vol. I, II and III, Water and Energy Commission Secretariate (WECS), Ministry of Water Resources, Kathmandu.

J.L. Nayava 121
Journal of Hydrology and Meteorology, Vol. 5, No. 1 SOHAM-Nepal
ABSTRACT
This study attempts to show the relationship between rice yield and rainfall in Nepal during the period 1971-2000. During the period, there was a shortfall in rice production in almost 10 years showing the crucial relationship between rainfall and rice yield. The minimum de cit year accounts for 70,000 metric tons in 1997 compared to the previous year and maximum de cit accounts for more than 800,000 metric tons in 1982 compared to the previous year during the study period. In terms of monetary value, the de cit comes to US$ 13 million and US$ 120 million respectively during the minimum and maximum de cit years. Since rice occupies an important role in the national economy, a detailed study of rainfall and rice yield should be carried out.
Variations of Rice Yield with Rainfall in Nepal during 1971 – 2000*
1. INTRODUCTION
Water requirement of rice cultivation is greater than that of any other crops of a similar duration. It varies with the type of soil, climatic condition, cultural practices and the duration of the variety grown. On an average, the amount of water required for rice is 500–650mm depending upon the prevailing conditions such as solar radiation, temperature, growth duration, variety, location etc. Generally 4 to 5 mm of water per day is needed for evapotranspiration. Rice is grown in lowland as well as upland of Hills and Tarai region. According to the 2001 Census of Agriculture, the total cropped area under rice cultivation was 1.5446 million hectares. In percentage, it is 45.1% of the total cropped area under cereal grains. The land under irrigation is 1.1683 million hectares in 2001/2002, but how much the rice area under irrigation was not known. The rice is still the most popular cereal grain being cultivated by
Janak Lal NayavaFreelancer Consultant in AgrometeorologySociety of Hydrologists and Meteorologists- Nepal
more than three-fourths of the total holdings. The area under rice is still increasing.
The contribution of agriculture sector to GDP is approximately 38% of which the rice weighs 20.75%. The dependency on agriculture in the country’s economy is about 66% of the total population engaged in this sector (MoAC, 2006). Nepal, topographically divided into three ecological zones, namely, Tarai, Hills and Mountain, which has been further divided into Eastern, Central, Western, Mid Western and Far Western development regions.
Nepal is one of the unique places on the earth, where the land rises from 65 m to 8848 m, which is the highest place in the world. Therefore, Nepal experiences almost all types of climates owing to the topographical differences within a short distance. Generally 80 percent of rainfall occurs in the summer monsoon during June to September.
Keywords: Rice yield, Rainfall, Nepal
* This paper was published in Journal of Hydrology & Meteorology, 2008 pp.93-102

122 J.L. Nayava
Journal of Hydrology and Meteorology, Vol. 5, No. 1 SOHAM-Nepal
The low land Tarai extends up to 610 m covering inner Tarai and foothills of Churia range. It comprises 23 % of land area and accommodated 48.43% of population in 2001. The Hills extends from 610 m to 4877 m and covers 42% of land area and accommodated 44.28% of the total population. Similarly, the Mountain covers 35% of land and accommodated 7.29% population of the country as shown in Figure 1 (CBS, 2006). According to the National Census of Nepal, 2001, population in Nepal was 23,151,423 and the population and land distribution at different ecological zones of Nepal is shown in Figure 2.
Figure 3: Rice cultivated in the year 2000 at different regions in Nepal
2. RICE GROWING SEASON AND SUMMER MONSOON
The main rice growing season of Nepal falls during the months from June to October, which also coincides with the summer monsoon. Around
70 to 90 percent of annual rainfall occurs during the monsoon season from June to September. The summer monsoon starts from Eastern region of Nepal and after two to three days it reaches to the Kathmandu Valley (around 12 June), which lies in the Central region. Then onwards, and after a week or so, it covers whole Nepal. The timely onset of monsoon is very important as the transplanting of rice seedling depends upon the arrival of monsoon rain. The preparation of rice nurseries starts almost a month ahead of transplanting. If the monsoon is delayed or weak in nature, the seedling can be damaged. During the time of transplanting, the top soil should be submerged, otherwise transplanting will not take place. Generally 100-200 mm of water is required for puddling the wet soil. Therefore it is not only the onset of monsoon, the rainfall characteristics such as depth, frequency, intensity and distribution in time and space are all the important factors for the positive impact on growth of rice and for that matter entire agriculture. Taking into consideration the importance of monsoon rain, this study attempts to cover whole of Nepal both on regional and ecological basis with respect to variations of rice yield with rainfall during the period 1971-2000.
3. SCENARIOS
The rice cultivated area in different regions in Nepal is shown in Figure 3.
Figure 1: The distribution of land area and population in different
ecological zones in Nepal
Figure 2: Population distribution at different regions in Nepal
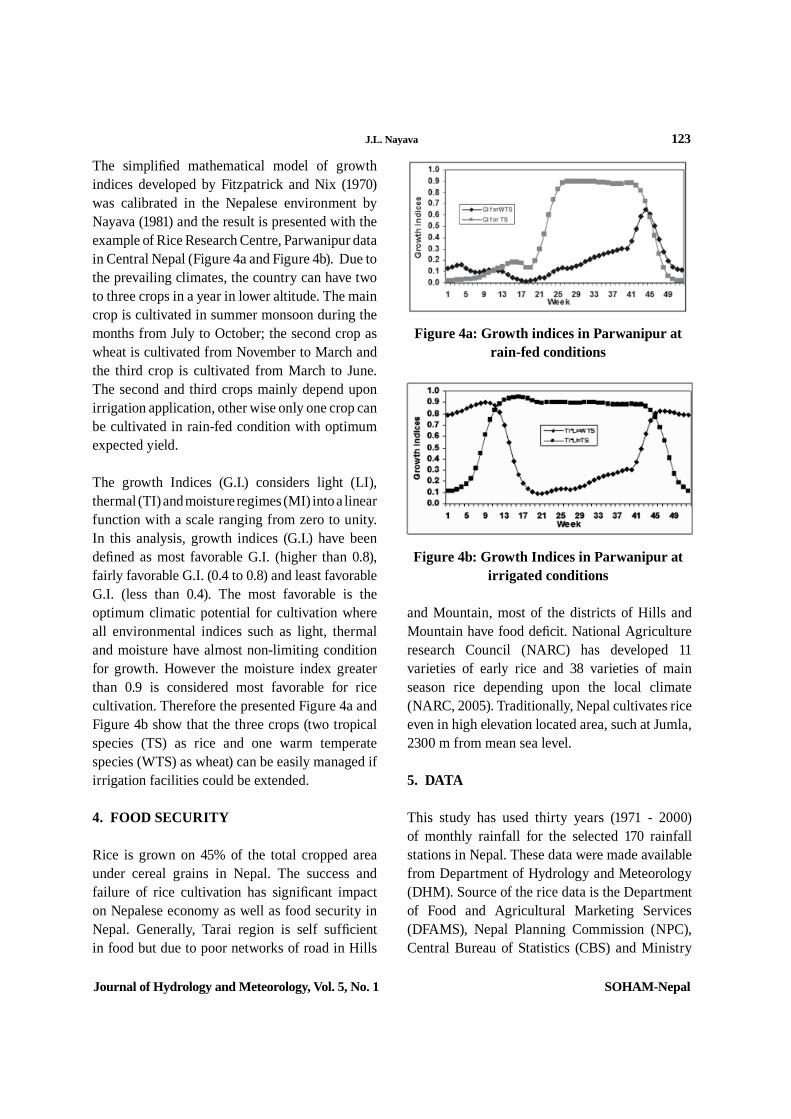
J.L. Nayava 123
Journal of Hydrology and Meteorology, Vol. 5, No. 1 SOHAM-Nepal
The simpli ed mathematical model of growth indices developed by Fitzpatrick and Nix (1970) was calibrated in the Nepalese environment by Nayava (1981) and the result is presented with the example of Rice Research Centre, Parwanipur data in Central Nepal (Figure 4a and Figure 4b). Due to the prevailing climates, the country can have two to three crops in a year in lower altitude. The main crop is cultivated in summer monsoon during the months from July to October; the second crop as wheat is cultivated from November to March and the third crop is cultivated from March to June. The second and third crops mainly depend upon irrigation application, other wise only one crop can be cultivated in rain-fed condition with optimum expected yield.
The growth Indices (G.I.) considers light (LI), thermal (TI) and moisture regimes (MI) into a linear function with a scale ranging from zero to unity. In this analysis, growth indices (G.I.) have been de ned as most favorable G.I. (higher than 0.8), fairly favorable G.I. (0.4 to 0.8) and least favorable G.I. (less than 0.4). The most favorable is the optimum climatic potential for cultivation where all environmental indices such as light, thermal and moisture have almost non-limiting condition for growth. However the moisture index greater than 0.9 is considered most favorable for rice cultivation. Therefore the presented Figure 4a and Figure 4b show that the three crops (two tropical species (TS) as rice and one warm temperate species (WTS) as wheat) can be easily managed if irrigation facilities could be extended.
4. FOOD SECURITY
Rice is grown on 45% of the total cropped area under cereal grains in Nepal. The success and failure of rice cultivation has signi cant impact on Nepalese economy as well as food security in Nepal. Generally, Tarai region is self suf cient in food but due to poor networks of road in Hills
Figure 4a: Growth indices in Parwanipur at rain-fed conditions
Figure 4b: Growth Indices in Parwanipur at irrigated conditions
and Mountain, most of the districts of Hills and Mountain have food de cit. National Agriculture research Council (NARC) has developed 11 varieties of early rice and 38 varieties of main season rice depending upon the local climate (NARC, 2005). Traditionally, Nepal cultivates rice even in high elevation located area, such at Jumla, 2300 m from mean sea level.
5. DATA
This study has used thirty years (1971 - 2000) of monthly rainfall for the selected 170 rainfall stations in Nepal. These data were made available from Department of Hydrology and Meteorology (DHM). Source of the rice data is the Department of Food and Agricultural Marketing Services (DFAMS), Nepal Planning Commission (NPC), Central Bureau of Statistics (CBS) and Ministry

124 J.L. Nayava
Journal of Hydrology and Meteorology, Vol. 5, No. 1 SOHAM-Nepal
of Agriculture and Cooperatives (MoAC). The analysis has been conducted at three levels: National, Development region and Ecological zones level. However, in order to save the repetition the analysis of Central development region and Western development region has been shown in one place and Mid-Western development region has been merged with the Far Western development region. In addition to consider the rainfall and rice yield for thirty years, the other available data has been considered up to the 2005/06. Initially, the thirty years of rainfall and crop data were used for the study. While the study was on progress, the crop data were available till 2005/06 and rainfall data were not published for that period and therefore the available data were used for the analysis.
6. ANALYSIS
6.1 NATIONAL LEVEL
While observing the rice yield in Nepal during 1971 to 2000, there is clear indication of sharp reduction of the rice yield in the years 1972, 1976, 1977, 1979, 1982, 1986, 1992, 1994, 1997 and 1999 as shown in Figure 5. At the same period, the de cit of monsoon rainfall from the normal rainfall (1450mm) was clearly shown in 1972, 1977, 1979, 1982, 1983, 1986, 1990, 1991, 1992, 1994 and 1997. This shows that there is a positive correlation between rainfall and rice yield. Whenever the rainfall is below normal, there is de cit of the rice yield in Nepal. This phenomenon was prevailed throughout the study period except in 1999, where the rice yield was increased despite the monsoon rainfall below the normal.
Similarly, the increment of yield is due to use of high yielding seeds, which occupy 71% of the cultivated area during 1999/2000 (MoAC, 2000). The area with improved seeds has gone up to 85% during 2005/2006 (MOAC, 2006). The higher yield is also due to the improved management practices
of cultivated land and smaller land holding size with increase in population. The following Figure shows a positive correlation between rainfall and rice yield (Figure 5).
It is not only the increase of rice yield after 1995, the area of rice cultivation has also increased after 1994/1995. During that period, the cultivated rice area was 1,42,0920 hectares. This cultivated area was gone up to 1,56,0044 hectares during 2000/2001. During those six years, the cultivated area of rice has been increased to 139,124 hectares. Recently, the rice area has been increasing, but the reasons of increasing the cultivated area of rice are not clear. During 1990/1991 the rice yield was about 2400 kg/hectare and the rice yield was more than 2700 kg/hectare during 2000/2001.
According to the Ministry of Agriculture and Cooperatives and the Central Bureau of Statistics, increased area of rice cultivation is due to double cropping of rice, but Agriculture Census 2001/2002 do not tally their argument. This sudden increase rice area is mentioned in Monograph, Agricultural Census, Nepal, 2001/02. The report mentioned that the increase of rice area may have come from non –agricultural land, some may have come from land under permanent pasture (CBS, 2006).
It is interesting to note that rainfall pattern and yield are very close to each other from the early 1970’s to 1986 as shown in the Figure 5. After 1986, the gap between rainfall and yield are far more than earlier
Figure 5: Rice Yield and Rainfall in Nepal
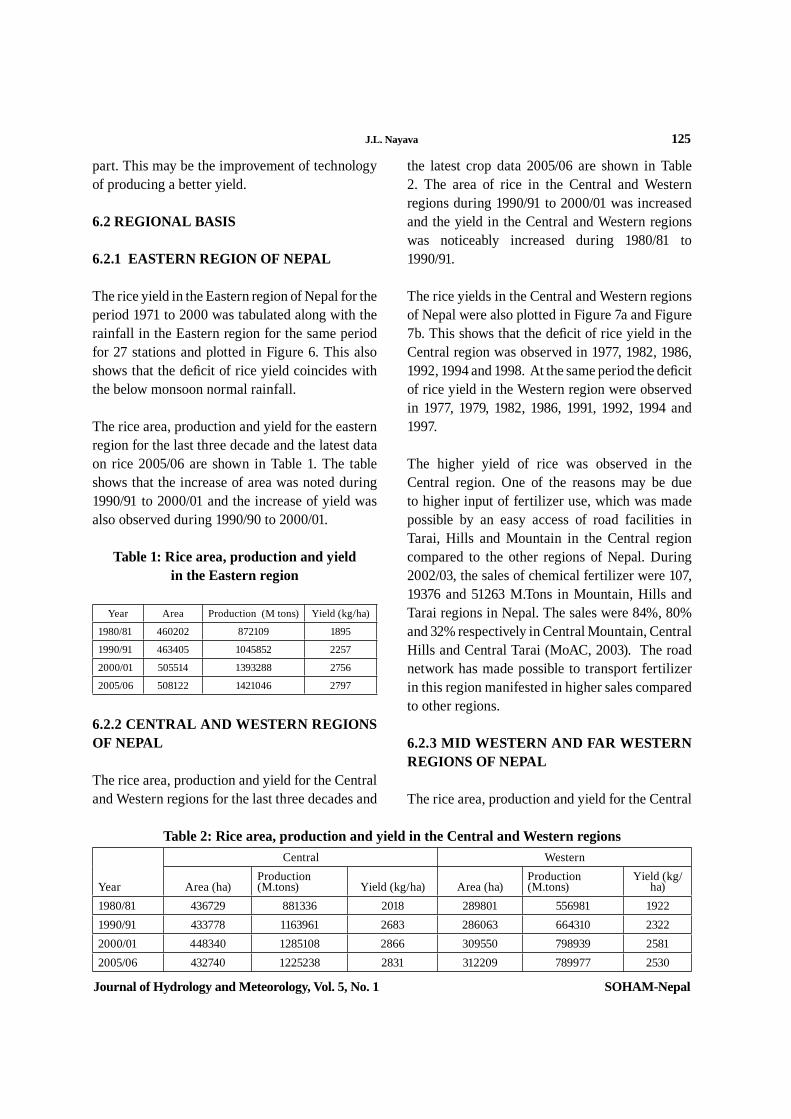
J.L. Nayava 125
Journal of Hydrology and Meteorology, Vol. 5, No. 1 SOHAM-Nepal
part. This may be the improvement of technology of producing a better yield.
6.2 REGIONAL BASIS
6.2.1 EASTERN REGION OF NEPAL
The rice yield in the Eastern region of Nepal for the period 1971 to 2000 was tabulated along with the rainfall in the Eastern region for the same period for 27 stations and plotted in Figure 6. This also shows that the de cit of rice yield coincides with the below monsoon normal rainfall.
The rice area, production and yield for the eastern region for the last three decade and the latest data on rice 2005/06 are shown in Table 1. The table shows that the increase of area was noted during 1990/91 to 2000/01 and the increase of yield was also observed during 1990/90 to 2000/01.
Table 1: Rice area, production and yield in the Eastern region
Year Area Production (M tons) Yield (kg/ha)
1980/81 460202 872109 1895
1990/91 463405 1045852 2257
2000/01 505514 1393288 2756
2005/06 508122 1421046 2797
6.2.2 CENTRAL AND WESTERN REGIONS OF NEPAL
The rice area, production and yield for the Central and Western regions for the last three decades and
the latest crop data 2005/06 are shown in Table 2. The area of rice in the Central and Western regions during 1990/91 to 2000/01 was increased and the yield in the Central and Western regions was noticeably increased during 1980/81 to 1990/91.
The rice yields in the Central and Western regions of Nepal were also plotted in Figure 7a and Figure 7b. This shows that the de cit of rice yield in the Central region was observed in 1977, 1982, 1986, 1992, 1994 and 1998. At the same period the de cit of rice yield in the Western region were observed in 1977, 1979, 1982, 1986, 1991, 1992, 1994 and 1997.
The higher yield of rice was observed in the Central region. One of the reasons may be due to higher input of fertilizer use, which was made possible by an easy access of road facilities in Tarai, Hills and Mountain in the Central region compared to the other regions of Nepal. During 2002/03, the sales of chemical fertilizer were 107, 19376 and 51263 M.Tons in Mountain, Hills and Tarai regions in Nepal. The sales were 84%, 80% and 32% respectively in Central Mountain, Central Hills and Central Tarai (MoAC, 2003). The road network has made possible to transport fertilizer in this region manifested in higher sales compared to other regions. 6.2.3 MID WESTERN AND FAR WESTERN REGIONS OF NEPAL
The rice area, production and yield for the Central
Table 2: Rice area, production and yield in the Central and Western regions
Year
Central Western
Area (ha) Production (M.tons) Yield (kg/ha) Area (ha)
Production (M.tons)
Yield (kg/ha)
1980/81 436729 881336 2018 289801 556981 19221990/91 433778 1163961 2683 286063 664310 23222000/01 448340 1285108 2866 309550 798939 25812005/06 432740 1225238 2831 312209 789977 2530
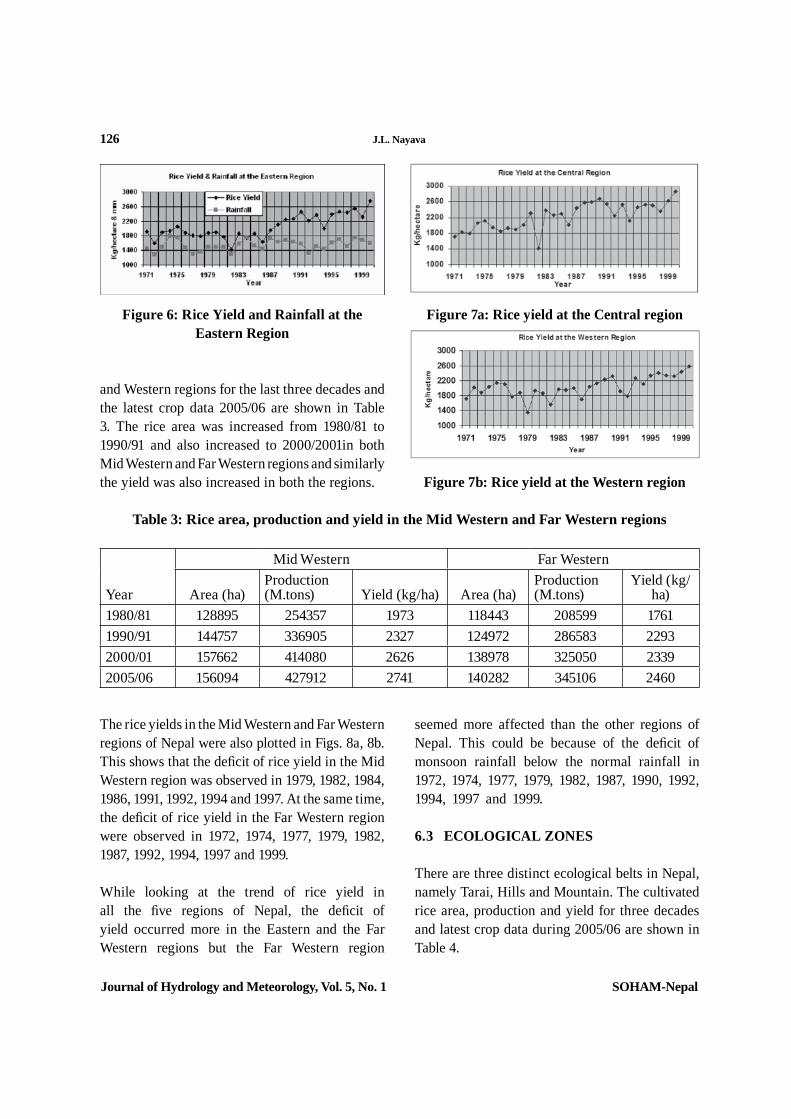
126 J.L. Nayava
Journal of Hydrology and Meteorology, Vol. 5, No. 1 SOHAM-Nepal
and Western regions for the last three decades and the latest crop data 2005/06 are shown in Table 3. The rice area was increased from 1980/81 to 1990/91 and also increased to 2000/2001in both Mid Western and Far Western regions and similarly the yield was also increased in both the regions.
Year
Mid Western Far Western
Area (ha)Production (M.tons) Yield (kg/ha) Area (ha)
Production (M.tons)
Yield (kg/ha)
1980/81 128895 254357 1973 118443 208599 17611990/91 144757 336905 2327 124972 286583 22932000/01 157662 414080 2626 138978 325050 23392005/06 156094 427912 2741 140282 345106 2460
The rice yields in the Mid Western and Far Western regions of Nepal were also plotted in Figs. 8a, 8b. This shows that the de cit of rice yield in the Mid Western region was observed in 1979, 1982, 1984, 1986, 1991, 1992, 1994 and 1997. At the same time, the de cit of rice yield in the Far Western region were observed in 1972, 1974, 1977, 1979, 1982, 1987, 1992, 1994, 1997 and 1999.
While looking at the trend of rice yield in all the ve regions of Nepal, the de cit of yield occurred more in the Eastern and the Far Western regions but the Far Western region
Figure 7a: Rice yield at the Central region
Figure 7b: Rice yield at the Western region
seemed more affected than the other regions of Nepal. This could be because of the de cit of monsoon rainfall below the normal rainfall in 1972, 1974, 1977, 1979, 1982, 1987, 1990, 1992, 1994, 1997 and 1999.
6.3 ECOLOGICAL ZONES
There are three distinct ecological belts in Nepal, namely Tarai, Hills and Mountain. The cultivated rice area, production and yield for three decades and latest crop data during 2005/06 are shown in Table 4.
Table 3: Rice area, production and yield in the Mid Western and Far Western regions
Figure 6: Rice Yield and Rainfall at the Eastern Region
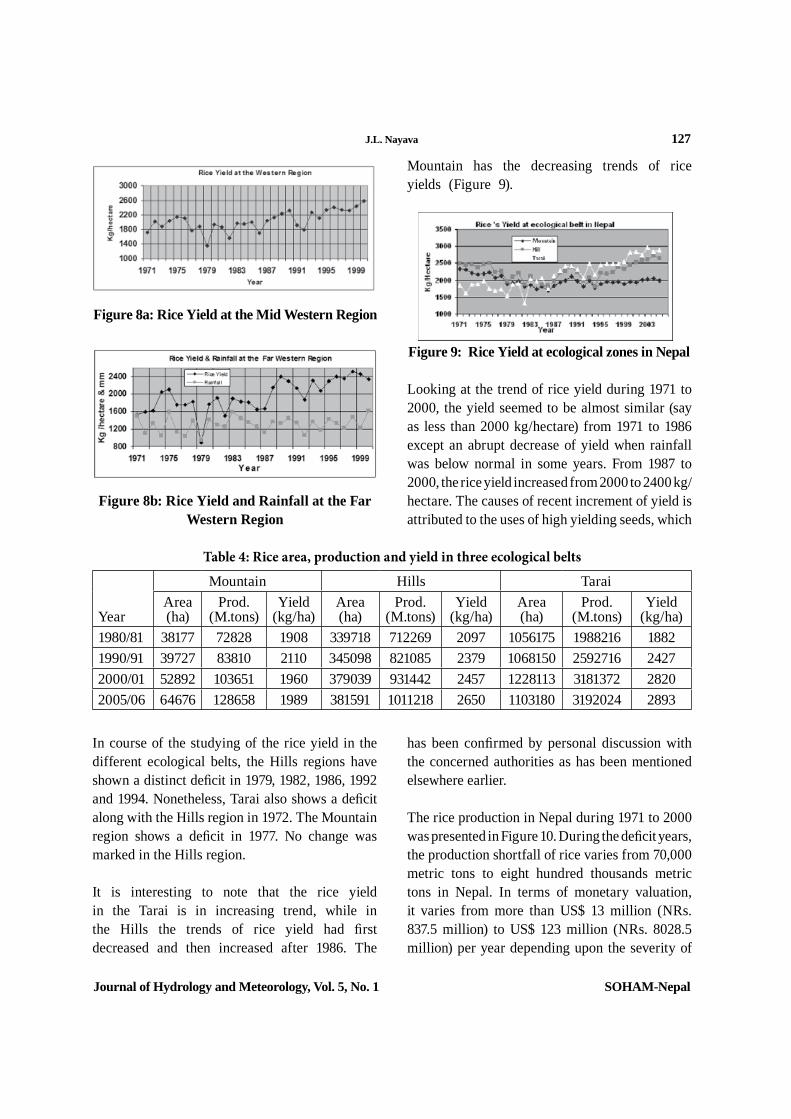
J.L. Nayava 127
Journal of Hydrology and Meteorology, Vol. 5, No. 1 SOHAM-Nepal
Year
Mountain Hills TaraiArea (ha)
Prod. (M.tons)
Yield (kg/ha)
Area (ha)
Prod. (M.tons)
Yield (kg/ha)
Area (ha)
Prod. (M.tons)
Yield (kg/ha)
1980/81 38177 72828 1908 339718 712269 2097 1056175 1988216 18821990/91 39727 83810 2110 345098 821085 2379 1068150 2592716 24272000/01 52892 103651 1960 379039 931442 2457 1228113 3181372 28202005/06 64676 128658 1989 381591 1011218 2650 1103180 3192024 2893
In course of the studying of the rice yield in the different ecological belts, the Hills regions have shown a distinct de cit in 1979, 1982, 1986, 1992 and 1994. Nonetheless, Tarai also shows a de cit along with the Hills region in 1972. The Mountain region shows a de cit in 1977. No change was marked in the Hills region.
It is interesting to note that the rice yield in the Tarai is in increasing trend, while in the Hills the trends of rice yield had rst decreased and then increased after 1986. The
Figure 8a: Rice Yield at the Mid Western Region
Figure 9: Rice Yield at ecological zones in Nepal
Figure 8b: Rice Yield and Rainfall at the Far Western Region
Mountain has the decreasing trends of rice yields (Figure 9).
Looking at the trend of rice yield during 1971 to 2000, the yield seemed to be almost similar (say as less than 2000 kg/hectare) from 1971 to 1986 except an abrupt decrease of yield when rainfall was below normal in some years. From 1987 to 2000, the rice yield increased from 2000 to 2400 kg/hectare. The causes of recent increment of yield is attributed to the uses of high yielding seeds, which
Table 4: Rice area, production and yield in three ecological belts
has been con rmed by personal discussion with the concerned authorities as has been mentioned elsewhere earlier.
The rice production in Nepal during 1971 to 2000 was presented in Figure 10. During the de cit years, the production shortfall of rice varies from 70,000 metric tons to eight hundred thousands metric tons in Nepal. In terms of monetary valuation, it varies from more than US$ 13 million (NRs. 837.5 million) to US$ 123 million (NRs. 8028.5 million) per year depending upon the severity of
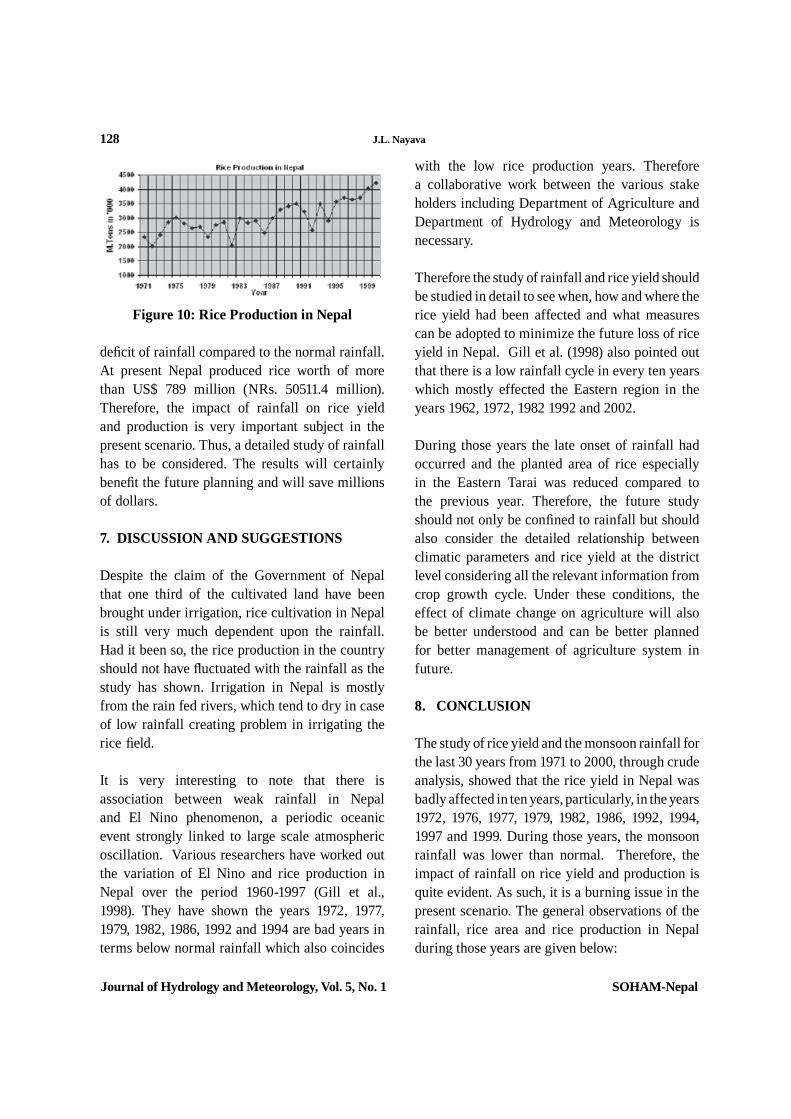
128 J.L. Nayava
Journal of Hydrology and Meteorology, Vol. 5, No. 1 SOHAM-Nepal
Figure 10: Rice Production in Nepal
de cit of rainfall compared to the normal rainfall. At present Nepal produced rice worth of more than US$ 789 million (NRs. 50511.4 million). Therefore, the impact of rainfall on rice yield and production is very important subject in the present scenario. Thus, a detailed study of rainfall has to be considered. The results will certainly bene t the future planning and will save millions of dollars.
7. DISCUSSION AND SUGGESTIONS
Despite the claim of the Government of Nepal that one third of the cultivated land have been brought under irrigation, rice cultivation in Nepal is still very much dependent upon the rainfall. Had it been so, the rice production in the country should not have uctuated with the rainfall as the study has shown. Irrigation in Nepal is mostly from the rain fed rivers, which tend to dry in case of low rainfall creating problem in irrigating the rice eld.
It is very interesting to note that there is association between weak rainfall in Nepal and El Nino phenomenon, a periodic oceanic event strongly linked to large scale atmospheric oscillation. Various researchers have worked out the variation of El Nino and rice production in Nepal over the period 1960-1997 (Gill et al., 1998). They have shown the years 1972, 1977, 1979, 1982, 1986, 1992 and 1994 are bad years in terms below normal rainfall which also coincides
with the low rice production years. Therefore a collaborative work between the various stake holders including Department of Agriculture and Department of Hydrology and Meteorology is necessary. Therefore the study of rainfall and rice yield should be studied in detail to see when, how and where the rice yield had been affected and what measures can be adopted to minimize the future loss of rice yield in Nepal. Gill et al. (1998) also pointed out that there is a low rainfall cycle in every ten years which mostly effected the Eastern region in the years 1962, 1972, 1982 1992 and 2002.
During those years the late onset of rainfall had occurred and the planted area of rice especially in the Eastern Tarai was reduced compared to the previous year. Therefore, the future study should not only be con ned to rainfall but should also consider the detailed relationship between climatic parameters and rice yield at the district level considering all the relevant information from crop growth cycle. Under these conditions, the effect of climate change on agriculture will also be better understood and can be better planned for better management of agriculture system in future.
8. CONCLUSION The study of rice yield and the monsoon rainfall for the last 30 years from 1971 to 2000, through crude analysis, showed that the rice yield in Nepal was badly affected in ten years, particularly, in the years 1972, 1976, 1977, 1979, 1982, 1986, 1992, 1994, 1997 and 1999. During those years, the monsoon rainfall was lower than normal. Therefore, the impact of rainfall on rice yield and production is quite evident. As such, it is a burning issue in the present scenario. The general observations of the rainfall, rice area and rice production in Nepal during those years are given below:
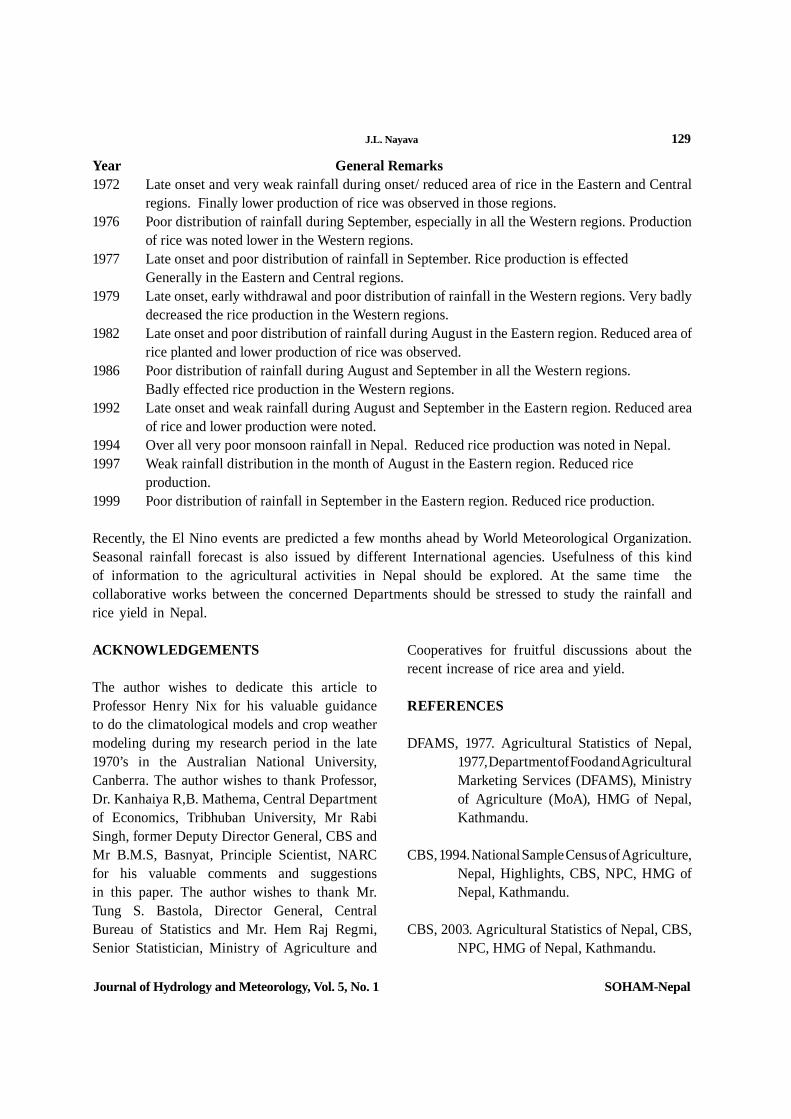
J.L. Nayava 129
Journal of Hydrology and Meteorology, Vol. 5, No. 1 SOHAM-Nepal
Year General Remarks1972 Late onset and very weak rainfall during onset/ reduced area of rice in the Eastern and Central
regions. Finally lower production of rice was observed in those regions.1976 Poor distribution of rainfall during September, especially in all the Western regions. Production
of rice was noted lower in the Western regions.1977 Late onset and poor distribution of rainfall in September. Rice production is effected Generally in the Eastern and Central regions.1979 Late onset, early withdrawal and poor distribution of rainfall in the Western regions. Very badly
decreased the rice production in the Western regions.1982 Late onset and poor distribution of rainfall during August in the Eastern region. Reduced area of
rice planted and lower production of rice was observed.1986 Poor distribution of rainfall during August and September in all the Western regions. Badly effected rice production in the Western regions.1992 Late onset and weak rainfall during August and September in the Eastern region. Reduced area
of rice and lower production were noted.1994 Over all very poor monsoon rainfall in Nepal. Reduced rice production was noted in Nepal.1997 Weak rainfall distribution in the month of August in the Eastern region. Reduced rice production.1999 Poor distribution of rainfall in September in the Eastern region. Reduced rice production. Recently, the El Nino events are predicted a few months ahead by World Meteorological Organization. Seasonal rainfall forecast is also issued by different International agencies. Usefulness of this kind of information to the agricultural activities in Nepal should be explored. At the same time the collaborative works between the concerned Departments should be stressed to study the rainfall and rice yield in Nepal.
ACKNOWLEDGEMENTS
The author wishes to dedicate this article to Professor Henry Nix for his valuable guidance to do the climatological models and crop weather modeling during my research period in the late 1970’s in the Australian National University, Canberra. The author wishes to thank Professor, Dr. Kanhaiya R,B. Mathema, Central Department of Economics, Tribhuban University, Mr Rabi Singh, former Deputy Director General, CBS and Mr B.M.S, Basnyat, Principle Scientist, NARC for his valuable comments and suggestions in this paper. The author wishes to thank Mr. Tung S. Bastola, Director General, Central Bureau of Statistics and Mr. Hem Raj Regmi, Senior Statistician, Ministry of Agriculture and
Cooperatives for fruitful discussions about the recent increase of rice area and yield. REFERENCES
DFAMS, 1977. Agricultural Statistics of Nepal, 1977, Department of Food and Agricultural Marketing Services (DFAMS), Ministry of Agriculture (MoA), HMG of Nepal, Kathmandu.
CBS, 1994. National Sample Census of Agriculture, Nepal, Highlights, CBS, NPC, HMG of Nepal, Kathmandu.
CBS, 2003. Agricultural Statistics of Nepal, CBS, NPC, HMG of Nepal, Kathmandu.

130 J.L. Nayava
Journal of Hydrology and Meteorology, Vol. 5, No. 1 SOHAM-Nepal
CBS, 2006. Monograph, Agriculture Census, Nepal, 2001/2002, CBS, NPC, Government of Nepal, Kathmandu.
DHM, 1997. Climatological Records of Nepal (1991-1994), DHM, Kathmandu, Nepal.
DHM, 1999. Climatological Records of Nepal (1995-96), DHM, Kathmandu, Nepal.
DHM, 2001. Climatological Records of Nepal (1997-98), DHM, Kathmandu, Nepal.
DHM, 2002. Climatological Records of Nepal (1999-2000), DHM, Kathmandu, Nepal.
Fitzpatrick, E.A. and H.A. Nix, 1970. The climatic factor in Australian grassland ecology, In ‘Australian Grassland’. (Ed. Moore, R.M.): The Australian National University Press, Canberra, Australia, pp.3-26.
Gill, G. J.; P.R. Hobbs and M.L. Shrestha, 1998. Possible Impact of the Current El Nino Event on Nepal 1998 Paddy Crop, HMG Ministry of Agriculture/ Winrock International, Policy Analysis in Agriculture and Related Resource Management, series No. 1, July 1998, pp. 1-15.
MoAC, 2000. Statistical Information on Nepalese Agriculture, 1999/2000, Ministry of Agriculture and Cooperatives, Kathmandu.
MoAC, 2002. Statistical Information on Nepalese Agriculture, 2001/2002, Ministry of Agriculture and Cooperatives, Kathmandu.
MoAC, 2004. Statistical Information on Nepalese Agriculture, 2002/2003, Ministry of Agriculture and Cooperatives, Kathmandu.
MoAC, 2004. Statistical Information on Nepalese Agriculture, 2003/2004, Ministry of Agriculture and Cooperatives, Kathmandu.
MoAC, 2005. Statistical Information on Nepalese Agriculture, 2004/2005, Ministry of Agriculture and Cooperatives, Kathmandu.
MoAC, 2006. Statistical Information on Nepalese Agriculture, 2005/2006, Ministry of Agriculture and Cooperatives, Kathmandu.
NARC, 1997. 25 Years of Rice Research in Nepal (1972-1997), Nepal Agricultural Research Council, Kathmandu.
NARC, 2005. Released and registered crop
varieties in Nepal, Nepal Agricultural Research Council, Kathmandu.
Nayava, J.L., 1981. Climates of Nepal and their implications for Agricultural Development, The Australian National University, Canberra, Australia, Ph.D. Thesis, pp 1-284.

Journal of Hydrology and Meteorology, Vol. 6, No. 1 SOHAM-Nepal
131
Keywords: climate change, plain low land (phant), global warming, trend
ABSTRACT
The relation between climate and wheat production in Nepal was studied for the period 1970/71-2007/08. Due to the topographical differences within short north-south span of the country, Nepal has wide variety of climatic condition. About 70 to 90% of the rainfall occurs during the summer monsoon months (June to September) in Nepal and the rest of the months are almost dry. Wheat is cultivated during the dry winter period and therefore, the supplementary irrigation plays a vital role in its cultivation. Varieties of wheat have been developed to suit the local climatic conditions. Due to the availability of improved seeds, modern cultivation practice and a supplementary irrigation; the wheat cultivation has increased substantially throughout Nepal. The national area and production of wheat has remarkably increased from 228,000 ha to 706,481 ha and 193360 mt to 1,572,065 mt during 1970/71 to 2007/2008 respectively. Future planning to increase the wheat production in Nepal should give due consideration to the effect of global warming also. The present rate of annual increase of temperature was 0.060C in Nepal. Trends of temperature rise were not uniform in Nepal. An increase of annual temperature at Bhairahawa during 1970-2008 was only 0.0180C. However, the wheat growing seasons at Bhairahawa, the trend of annual maximum temperature during November to April was -0.00680C during the study period. Though modern facilities such as irrigation, improved seeds and fertilizers are available to some extent, weather and climate still plays an important role in the increase of area and production of wheat in Nepal
Impact of climate, climate change and modern technology on Wheat production in Nepal: a case study at Bhairahawa*
1. INTRODUCTION
For any crop grown in an area, it is better to have description of physiographic, types of soils and their eld capacity and climates of the area. Due to the topographical differences at the shortest distance almost all types of climates prevail in Nepal. In Nepal wheat is grown in the temperate
Janak Lal Nayava1, 1Freelancer Consultant in Agro-meteorology, Email: [email protected] Singh2, Email: [email protected] Raj Bhatta3
3National Wheat Research Project, Bhairahawa Email: [email protected]
climate and subtropics. Wheat is the third largest cereal crop in Nepal. Now the country produces 1.57 million mt and exports wheat to the other countries.
It is desirable that the minimum and maximum temperature during the wheat growing period should be 30 C to 320 C respectively and the mean
* This paper was published in Journal of Hydrology & Meteorology, 2009 pp.1-14

132 J. L. Nayava, R. Singh & M. R. Bhatta
Journal of Hydrology and Meteorology, Vol. 6, No. 1 SOHAM-Nepal
daily temperature for optimum growth is between 200C and 250C(Briggle, 1980). Knowledge of genetic characteristics and particularly growth and development pattern of wheat varieties is essential for meeting the combination of various climatic requirements for growth development and yield formation. It is known that the upper limit of crop production is set by the climatic condition specially temperature regimes and the genetic potential of the variety grown. The extent to which this limit can be reached will always depend on how nely the engineering aspects of water supply are in tune with the biological needs for water in crop production (FAO, 1979). For higher yields, water requirements are 350-500 mm depending on climate and length of growing period in Nepal. There should be adequate water during the establishment period. Water de cit during the lling period results in reduced grain weight. However, during the ripening and drying–off period, rainfall or irrigation have negative impact on the yield. The area under wheat cultivation in different regions of Nepal is shown in Figure 1. For administrative purposes, the country is divided into ve Regions. Each Region has Tarai, Hills and Mountain.
Figure 1: Wheat cultivation in the different regions in Nepal
2. DATA
This study has used thirty eight years (1970/71 – 2007/08) of crop data in Nepal. Weather data
were made available by the Department of Hydrology and Meteorology (DHM). Source of the wheat data is the then Department of Food and Agricultural Marketing Services (DFAMS), Nepal Planning Commission (NPC), Central Bureau of Statistics (CBS) and Ministry of Agriculture and Cooperatives (MoAC).
Taking into consideration the winter rainfall and the growing season of wheat, this study attempts to cover whole of Nepal and three ecological belts and a case study at one National Wheat Research Centre at Bhairahawa in Tarai, where the irrigation facilities are available.
3. ANALYSIS
3.1. NATIONAL LEVEL
While observing the wheat yield and their production in Nepal during 1970/71 to 2007/08, the area was about 228,400 (Two hundred twenty eight thousands and four hundred) hectare during 1970/71 and in 2007/08, the area has increased to 706,481 (seven hundred and six thousand four hundred eighty one) hectare. There is clear indication that the area under wheat cultivation has increased more than three folds in 2007/2008 during the study period. The wheat production was 193,360 (one hundred ninety three thousand and three hundred sixty) mt in 1970/71 and now the production is 1,572,065 (on average 1.57 million) mt in 2007/08. The wheat production during the study period of 1970/71-2007/08 has increased more than eight fold. The wheat production during 2008/2009 will be much lower in Nepal compared to the previous year due to the long period of dry spell and warm period during this wheat season. Especially, wheat depended on rainfall would be badly affected in Hills and Mountain in Nepal.
National Agriculture Research Council (NARC, 1997) mentioned that performance in wheat

J. L. Nayava, R. Singh & M. R. Bhatta 133
Journal of Hydrology and Meteorology, Vol. 6, No. 1 SOHAM-Nepal
production in Nepal has increased remarkable due to wide spread cultivation of high yielding varieties since 1972. Although attempts on variety development were initiated since late fties, the systematic breeding works began only after the establishment of National Wheat Development Program in 1972. In fact Department of Agriculture had launched a “Grow More Wheat Campaign” in 1965/66 with the introduction of Mexican wheat varieties introduced via India. The new varieties of seed were launched since then and now occupy 96% in 2006/2007(MOAC, 2006). There are altogether 30 varieties developed for different environment in Nepal (NARC, 2007). The national wheat area and production from 1970/71 to 2007/08 are shown in Figure 2. Initially during the rst decade, the yield was almost constant and in the later part the yield increased to more than 2 mt per hectare as shown in Figure 2. This is clearly due to improved modern technology and adoption of high yielding varieties as well as supplementary irrigation.
The Department of Irrigation have claimed that there are more than one million hectares was irrigated in Nepal during 2007/08 (MOAC, 2008). Traditionally there are a hundreds of small temporary water channels managed by local farmers since long before. It is estimated that as of 2002 government agencies and farmers have developed irrigation infrastructure covering about 1,121,441 ha. Of this farmer managed but
Figure 2: The National wheat area and production
intervened by Department of Irrigation system cover about 59%, farmer managed system(not yet intervened) cover 27% and the rest 14% area is irrigated by those farmer managed irrigation systems supported by ADB/N (Sharma, 2004).
Recently available data reveals that net command area of government assisted farmer managed systems is 334,237 ha and area farmer developed and farmer managed systems is 276,219 ha. Furthermore, area under ground water projects (most of them managed by farmers) is reported to be 230,275 ha area irrigated by Agency Managed Irrigation Systems (AMIS) is 280,710 ha (DOI, 2004). It will be interesting to nd out that how much different irrigation systems had all year round facilities and how much irrigated systems had a capacity of serving irrigation in winter time.
There was the special program on Food Production in support of Food Security In Nepal (SPIN) implemented by the Departments of Agriculture and Irrigation and FAO in several irrigation systems of two hills (Syangja and Ilam) and two Tarai (Nawalparasi and Jhapa) districts during 1995 to 1998. The study showed that the wheat crop yield showed an increase of 110% over the base yield with the introduction of improved package of technology (Sharma 1998).
By the end of this century, the average increase of temperature is either to be between 1.50C to 4.50C in the world (IPCC, 2007). It is interesting to know that the annual warming in the Himalayan region between 1967 and 1994 was 0.060C. Trends of temperature rise were not uniform in Nepal, but the Himalayan region seemed to have much more increase of temperature than the lower elevation (Shrestha et al. 1999). Retreat of glaciers and forming the new lakes are a fresh example of global warming affect in Nepal. Bursting the glaciological lake means ooding followed the

134 J. L. Nayava, R. Singh & M. R. Bhatta
Journal of Hydrology and Meteorology, Vol. 6, No. 1 SOHAM-Nepal
disaster of that area. This is a really hot topic and understanding the holistic system of Himalayan water and their future role of water supplies for agriculture and hydro power and so and so for. There seemed to be no xed pattern of annual rainfall in Nepal except slightly decreasing trend in the Far Western Nepal and the intensity of rainfall appeared to increase (Nayava, 2004). The inter-annual variation of monsoon rainfall and their affect in rice yield and production are very interesting and the lesson can be learnt for those studies (Nayava, 2008).
3.2. ECOLOGICAL BELTS
The wheat area and production in three ecological belts are as follows:
MOUNTAIN
In course of studying wheat cultivation in three ecological belts, the Mountain region showed that the increase of area has almost doubled and the yield increased to the little above 50% during the last 38 years. The gap of the area and production showed a change after 1995 in the Mountain (Figure 3). This can be attributed to the improvement of technology of wheat farming as shown in Figure 3. The production of wheat in the Mountain region increased from 28,900 mt to 83,739 mt during the last 38 years from 1970/71 to 2007/08. During the wheat growing season (November to May) in the Mountain region, the rainfall is about 150 t0 250 mm, but the nature of rainfall was very erratic. The average annual temperature during the growing season in Mountain was 60C to 180C. The annual temperature trend in the Mountain region at selected place in Jumla, 2300 m was observed only 0.0350C during the 1977-2008. In fact Mountain region as de ned include only 7.6% of the total wheat area and contributes 5.3% of the total wheat production in the country.
HILLS
During the wheat growing season (November/December to April/May) in the Hills Region, the rainfall is about 100 to 200 mm with higher distributions in the Western Hills than the Eastern Hills. Therefore, the cultivation of wheat area is more in the Western Hills than the Eastern Hills as shown in Figure 2. Mean annual temperature during the growing period in the Hills ranged from 9o C to 24o C. The annual temperature trend in the Hills Region at selected places in Surkhet was observed only 0.028o C during the 1977-2008. The Hills region showed nearly three fold increase of area and the yield showed 100% increase during the same period from 1970/71 to 2007/08. The gap of the area and production showed a change after 1988 in the Hills (Figure 4). The production of wheat in the Hills region increased from 82,800 mt to 447,791 mt during the study period. In fact Hills region as de ned include only 34.57% of the total wheat area and contributes 28.5% of the total wheat production in the country.
In the mid Hills, there is signi cant area under wheat that is very similar to Tarai in terms of varieties grown. For example Tarai, Tars and many river basin areas of mid Hills, Tarai varieties are grown. If one sees wheat in the mid and Far-Westen Hills districts, all good production
Figure 3: The wheat area and production in Mountain

J. L. Nayava, R. Singh & M. R. Bhatta 135
Journal of Hydrology and Meteorology, Vol. 6, No. 1 SOHAM-Nepal
Figure 4: The wheat area and production in Hills
comes from river basins and plain areas in the foot hills (they call Phant such as Dipayal phant, Sakayal phant, Bandungrasain phant etc. in Doti, Dadeldhura districts). In general there are 57.8% the area of wheat which lies in the Tarai and similar environment contributes about 66.2% of the country’s total wheat production. Rest goes to Hills and Mountain.
TARAI
The wheat is grown during winter (November/December to March/April) in Tarai. During this period about 2 to 5 percent (less than 100 mm, more precisely 30-90 mm) of seasonal rainfall occur in the Tarai. These winter rains are very irregular and erratic in nature. In Nepal, 70 to 90% of rainfall occurs in the summer monsoon and the rest of the months are almost dry. Distribution of winter rainfall is more in the Western Tarai than in the Eastern Tarai. The winter rain caused by westerly disturbances originates from the Mediterranean Sea. Annual mean temperature during the growing period of wheat in Tarai is 150C to 300C. The annual temperature trend in the Tarai Region at the selected place in Bhairahawa was observed only 0.0050C during the 1977-2008. In fact Tarai region as de ned include only 57.82% of the total wheat area and contributes 66.2% of the total wheat production in the country.
Figure 5: The wheat area and production in Tarai
During the last 38 years period from 1970/71 to 2007/08 (Figure 5), the production of wheat in the Tarai region increased from 81,600 mt to 1,040,535 mt. It is interesting to note that the wheat yield in Tarai was initially lower. After the introduction of high yield varieties and irrigation facilities, the yield increased more than those of the Hills and Mountain. In Tarai alone area under wheat increased by 350% and its yield increased three fold. The harvesting of wheat is about a week earlier in Western Tarai than in the Eastern Tarai due to the temperature differences.
In terms of development of wheat at three different ecological belts, the productivity is measured by yield and therefore the yield at three ecological belts are presented in Figure 6, which shows that the yield is much higher in Tarai than in the Hills and the Mountain region. In cereal production, the progress in wheat has had remarkable achievement in Nepal. Especially wheat in Tarai had very much improved due to partial irrigation and use of high yielding varieties. Due to recent global warming, Tarai may be badly affected. The above discussions were the general studies of climate and wheat in three distinct Regions of Nepal. But one has to go very much detailed study at a place for the impact of climate constraints and their change and therefore Bhairahawa has been considered for a meso-scale study to nd the relationship between climate and wheat.

136 J. L. Nayava, R. Singh & M. R. Bhatta
Journal of Hydrology and Meteorology, Vol. 6, No. 1 SOHAM-Nepal
Figure 6: The wheat yield at three ecological belts
Figure 7a: Growth Indices at Bhairahawa, 109 m at rain-fed conditions
Figure 7b: Growth Indices at Bhairahawa, 109 m at Irrigated conditions
4. A CASE STUDY: NATIONAL WHEAT REASEARCH CENTRE, BHAIRHAWA IN TARAI
The simpli ed mathematical model as growth indices developed by Fitzpatrick and Nix (1970) was calibrated in the Nepalese environment by Nayava (1981) and is presented with data from the Wheat Research Centre, Bhairahawa, a district in Western Nepal (Figure 7a and Figure 7b). Bhairahawa is a low land in plain area and dominantly prevails with alluvial clay soil.
The growth Indices (G.I.) considers light (LI), thermal (TI) and moisture regimes (MI) into a linear function with a scale ranging from zero to unity. In this analysis, growth indices (G.I.) has been de ned as most favorable G.I. (higher than 0.8), fairly favorable G.I. (0.4 to 0.8) and least favorable G.I. (less than 0.4) are de ned. The most favorable is the optimum climatic potential for cultivation where all environmental indices such as light, thermal and moisture have almost non-limiting condition for growth, say as growth index higher than 0.8. The Figure 7a indicate that only one tropical species (TS) can be grown under optimum condition during the week 25 to 43 (June 18 - 24 to October 23 - 29) as rain-fed condition in summer season. Figure 7b show that the three crops (two tropical species during the week 11 to 44 (March
12 - 18 to October 30 - November 5) and one warm temperate species (WTS) as wheat during the week 44 to 12 (November 30 - December 5 to March 19 - 25) can be easily managed with proper irrigation facilities. Cold temperate species (CTS) can not be grown in rain-fed as well as irrigated condition.
Thus, only one crop as tropical species can be cultivated in the rain-fed condition for optimum yield during the summer monsoon as shown in Figure 7a. The second and third crop can be managed only by irrigation application as described earlier and is shown in Figure 7b. However, wheat sowing in Tarai can be delayed up to the second week of December without signi cant reduction in yield. Wheat seeds sown beyond these dates resulted yield reduction of 30 to 50 kg/day/ha (NARC, 1997). When weather and climate relate with agriculture, one has to study the diurnal
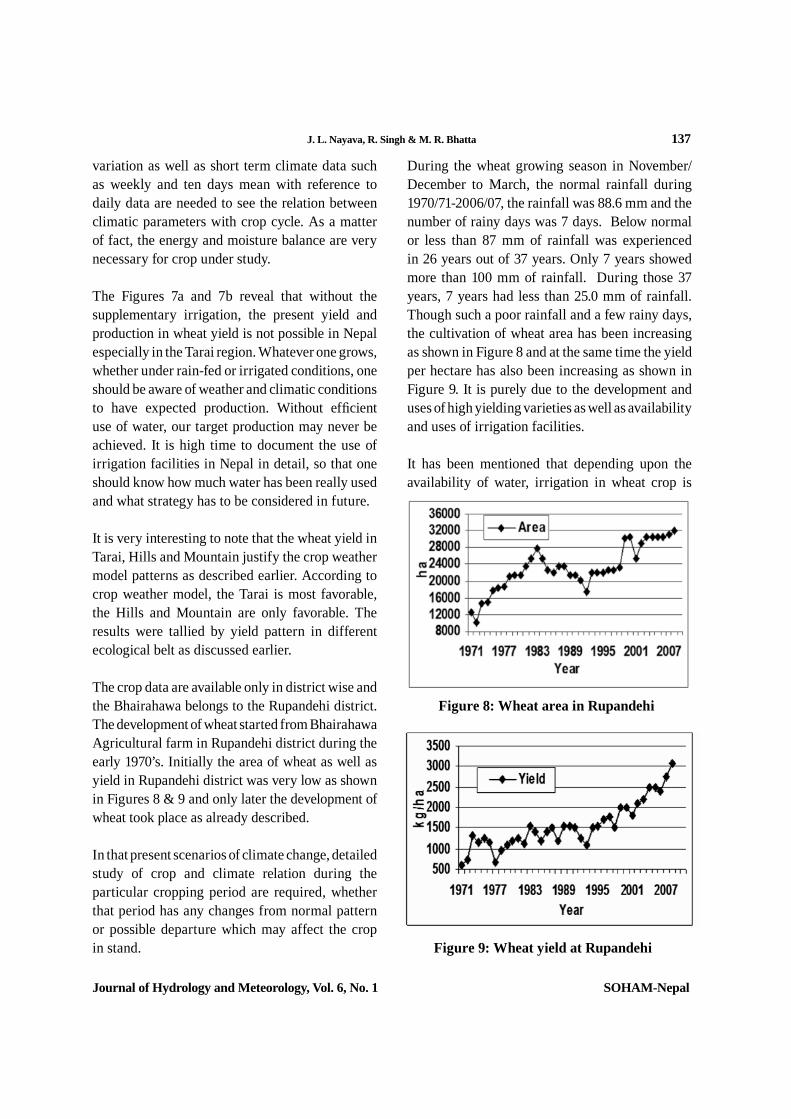
J. L. Nayava, R. Singh & M. R. Bhatta 137
Journal of Hydrology and Meteorology, Vol. 6, No. 1 SOHAM-Nepal
variation as well as short term climate data such as weekly and ten days mean with reference to daily data are needed to see the relation between climatic parameters with crop cycle. As a matter of fact, the energy and moisture balance are very necessary for crop under study.
The Figures 7a and 7b reveal that without the supplementary irrigation, the present yield and production in wheat yield is not possible in Nepal especially in the Tarai region. Whatever one grows, whether under rain-fed or irrigated conditions, one should be aware of weather and climatic conditions to have expected production. Without ef cient use of water, our target production may never be achieved. It is high time to document the use of irrigation facilities in Nepal in detail, so that one should know how much water has been really used and what strategy has to be considered in future.
It is very interesting to note that the wheat yield in Tarai, Hills and Mountain justify the crop weather model patterns as described earlier. According to crop weather model, the Tarai is most favorable, the Hills and Mountain are only favorable. The results were tallied by yield pattern in different ecological belt as discussed earlier.
The crop data are available only in district wise and the Bhairahawa belongs to the Rupandehi district. The development of wheat started from Bhairahawa Agricultural farm in Rupandehi district during the early 1970’s. Initially the area of wheat as well as yield in Rupandehi district was very low as shown in Figures 8 & 9 and only later the development of wheat took place as already described.
In that present scenarios of climate change, detailed study of crop and climate relation during the particular cropping period are required, whether that period has any changes from normal pattern or possible departure which may affect the crop in stand.
Figure 8: Wheat area in Rupandehi
Figure 9: Wheat yield at Rupandehi
During the wheat growing season in November/December to March, the normal rainfall during 1970/71-2006/07, the rainfall was 88.6 mm and the number of rainy days was 7 days. Below normal or less than 87 mm of rainfall was experienced in 26 years out of 37 years. Only 7 years showed more than 100 mm of rainfall. During those 37 years, 7 years had less than 25.0 mm of rainfall. Though such a poor rainfall and a few rainy days, the cultivation of wheat area has been increasing as shown in Figure 8 and at the same time the yield per hectare has also been increasing as shown in Figure 9. It is purely due to the development and uses of high yielding varieties as well as availability and uses of irrigation facilities.
It has been mentioned that depending upon the availability of water, irrigation in wheat crop is
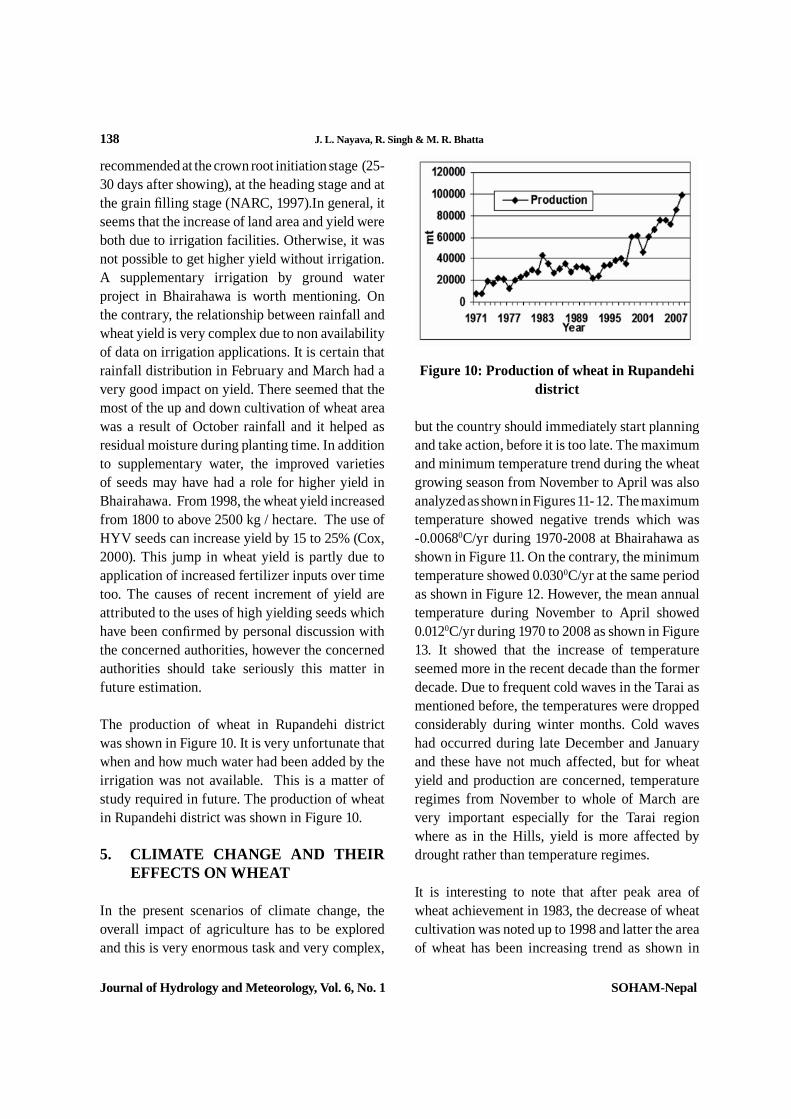
138 J. L. Nayava, R. Singh & M. R. Bhatta
Journal of Hydrology and Meteorology, Vol. 6, No. 1 SOHAM-Nepal
recommended at the crown root initiation stage (25- 30 days after showing), at the heading stage and at the grain lling stage (NARC, 1997).In general, it seems that the increase of land area and yield were both due to irrigation facilities. Otherwise, it was not possible to get higher yield without irrigation. A supplementary irrigation by ground water project in Bhairahawa is worth mentioning. On the contrary, the relationship between rainfall and wheat yield is very complex due to non availability of data on irrigation applications. It is certain that rainfall distribution in February and March had a very good impact on yield. There seemed that the most of the up and down cultivation of wheat area was a result of October rainfall and it helped as residual moisture during planting time. In addition to supplementary water, the improved varieties of seeds may have had a role for higher yield in Bhairahawa. From 1998, the wheat yield increased from 1800 to above 2500 kg / hectare. The use of HYV seeds can increase yield by 15 to 25% (Cox, 2000). This jump in wheat yield is partly due to application of increased fertilizer inputs over time too. The causes of recent increment of yield are attributed to the uses of high yielding seeds which have been con rmed by personal discussion with the concerned authorities, however the concerned authorities should take seriously this matter in future estimation.
The production of wheat in Rupandehi district was shown in Figure 10. It is very unfortunate that when and how much water had been added by the irrigation was not available. This is a matter of study required in future. The production of wheat in Rupandehi district was shown in Figure 10.
5. CLIMATE CHANGE AND THEIR EFFECTS ON WHEAT
In the present scenarios of climate change, the overall impact of agriculture has to be explored and this is very enormous task and very complex,
but the country should immediately start planning and take action, before it is too late. The maximum and minimum temperature trend during the wheat growing season from November to April was also analyzed as shown in Figures 11- 12. The maximum temperature showed negative trends which was -0.00680C/yr during 1970-2008 at Bhairahawa as shown in Figure 11. On the contrary, the minimum temperature showed 0.0300C/yr at the same period as shown in Figure 12. However, the mean annual temperature during November to April showed 0.0120C/yr during 1970 to 2008 as shown in Figure 13. It showed that the increase of temperature seemed more in the recent decade than the former decade. Due to frequent cold waves in the Tarai as mentioned before, the temperatures were dropped considerably during winter months. Cold waves had occurred during late December and January and these have not much affected, but for wheat yield and production are concerned, temperature regimes from November to whole of March are very important especially for the Tarai region where as in the Hills, yield is more affected by drought rather than temperature regimes.
It is interesting to note that after peak area of wheat achievement in 1983, the decrease of wheat cultivation was noted up to 1998 and latter the area of wheat has been increasing trend as shown in
Figure 10: Production of wheat in Rupandehi district
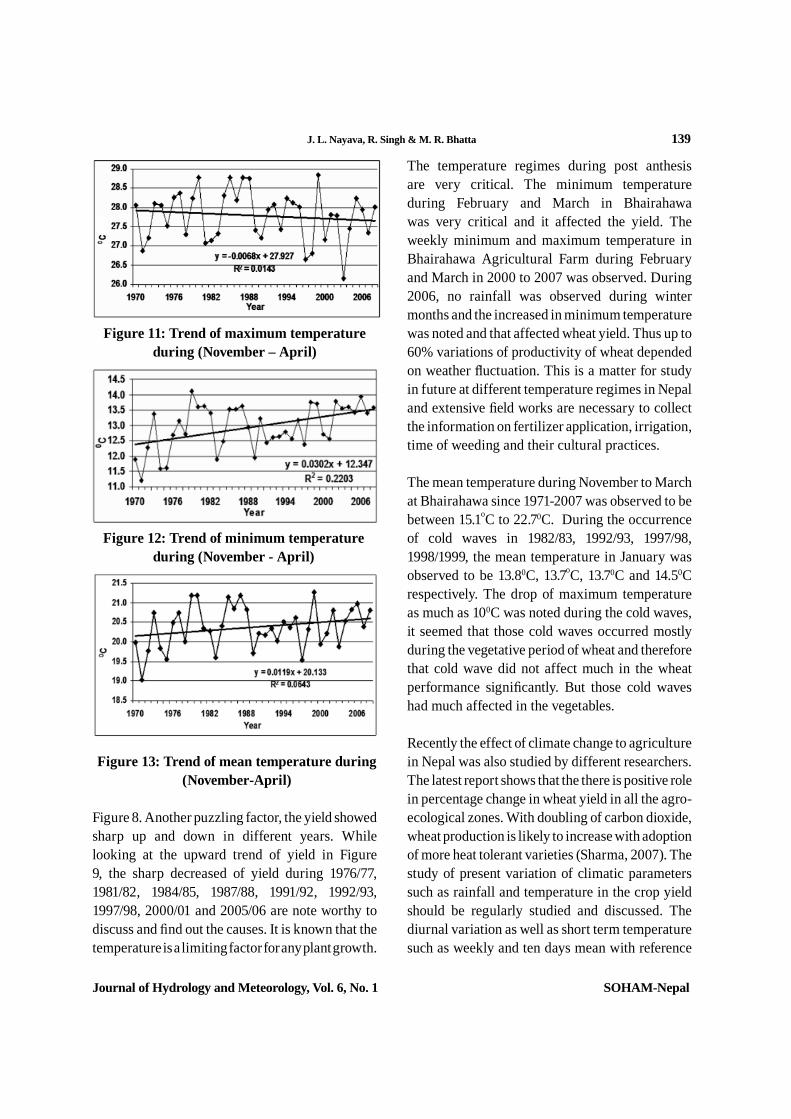
J. L. Nayava, R. Singh & M. R. Bhatta 139
Journal of Hydrology and Meteorology, Vol. 6, No. 1 SOHAM-Nepal
Figure 8. Another puzzling factor, the yield showed sharp up and down in different years. While looking at the upward trend of yield in Figure 9, the sharp decreased of yield during 1976/77, 1981/82, 1984/85, 1987/88, 1991/92, 1992/93, 1997/98, 2000/01 and 2005/06 are note worthy to discuss and nd out the causes. It is known that the temperature is a limiting factor for any plant growth.
Figure 11: Trend of maximum temperature during (November – April)
Figure 12: Trend of minimum temperature during (November - April)
Figure 13: Trend of mean temperature during (November-April)
The temperature regimes during post anthesis are very critical. The minimum temperature during February and March in Bhairahawa was very critical and it affected the yield. The weekly minimum and maximum temperature in Bhairahawa Agricultural Farm during February and March in 2000 to 2007 was observed. During 2006, no rainfall was observed during winter months and the increased in minimum temperature was noted and that affected wheat yield. Thus up to 60% variations of productivity of wheat depended on weather uctuation. This is a matter for study in future at different temperature regimes in Nepal and extensive eld works are necessary to collect the information on fertilizer application, irrigation, time of weeding and their cultural practices.
The mean temperature during November to March at Bhairahawa since 1971-2007 was observed to be between 15.1oC to 22.70C. During the occurrence of cold waves in 1982/83, 1992/93, 1997/98, 1998/1999, the mean temperature in January was observed to be 13.80C, 13.7oC, 13.70C and 14.50C respectively. The drop of maximum temperature as much as 100C was noted during the cold waves, it seemed that those cold waves occurred mostly during the vegetative period of wheat and therefore that cold wave did not affect much in the wheat performance signi cantly. But those cold waves had much affected in the vegetables.
Recently the effect of climate change to agriculture in Nepal was also studied by different researchers. The latest report shows that the there is positive role in percentage change in wheat yield in all the agro-ecological zones. With doubling of carbon dioxide, wheat production is likely to increase with adoption of more heat tolerant varieties (Sharma, 2007). The study of present variation of climatic parameters such as rainfall and temperature in the crop yield should be regularly studied and discussed. The diurnal variation as well as short term temperature such as weekly and ten days mean with reference
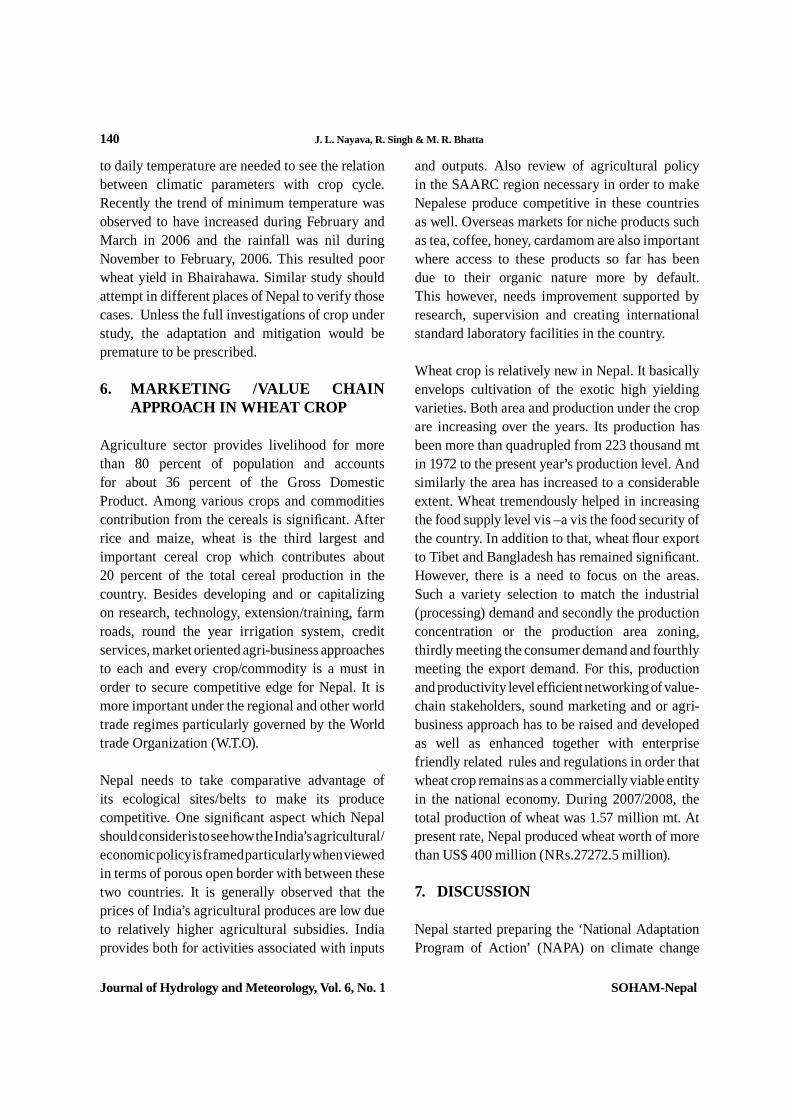
140 J. L. Nayava, R. Singh & M. R. Bhatta
Journal of Hydrology and Meteorology, Vol. 6, No. 1 SOHAM-Nepal
to daily temperature are needed to see the relation between climatic parameters with crop cycle. Recently the trend of minimum temperature was observed to have increased during February and March in 2006 and the rainfall was nil during November to February, 2006. This resulted poor wheat yield in Bhairahawa. Similar study should attempt in different places of Nepal to verify those cases. Unless the full investigations of crop under study, the adaptation and mitigation would be premature to be prescribed.
6. MARKETING /VALUE CHAIN APPROACH IN WHEAT CROP
Agriculture sector provides livelihood for more than 80 percent of population and accounts for about 36 percent of the Gross Domestic Product. Among various crops and commodities contribution from the cereals is signi cant. After rice and maize, wheat is the third largest and important cereal crop which contributes about 20 percent of the total cereal production in the country. Besides developing and or capitalizing on research, technology, extension/training, farm roads, round the year irrigation system, credit services, market oriented agri-business approaches to each and every crop/commodity is a must in order to secure competitive edge for Nepal. It is more important under the regional and other world trade regimes particularly governed by the World trade Organization (W.T.O).
Nepal needs to take comparative advantage of its ecological sites/belts to make its produce competitive. One signi cant aspect which Nepal should consider is to see how the India’s agricultural/economic policy is framed particularly when viewed in terms of porous open border with between these two countries. It is generally observed that the prices of India’s agricultural produces are low due to relatively higher agricultural subsidies. India provides both for activities associated with inputs
and outputs. Also review of agricultural policy in the SAARC region necessary in order to make Nepalese produce competitive in these countries as well. Overseas markets for niche products such as tea, coffee, honey, cardamom are also important where access to these products so far has been due to their organic nature more by default. This however, needs improvement supported by research, supervision and creating international standard laboratory facilities in the country.
Wheat crop is relatively new in Nepal. It basically envelops cultivation of the exotic high yielding varieties. Both area and production under the crop are increasing over the years. Its production has been more than quadrupled from 223 thousand mt in 1972 to the present year’s production level. And similarly the area has increased to a considerable extent. Wheat tremendously helped in increasing the food supply level vis –a vis the food security of the country. In addition to that, wheat our export to Tibet and Bangladesh has remained signi cant. However, there is a need to focus on the areas. Such a variety selection to match the industrial (processing) demand and secondly the production concentration or the production area zoning, thirdly meeting the consumer demand and fourthly meeting the export demand. For this, production and productivity level ef cient networking of value-chain stakeholders, sound marketing and or agri-business approach has to be raised and developed as well as enhanced together with enterprise friendly related rules and regulations in order that wheat crop remains as a commercially viable entity in the national economy. During 2007/2008, the total production of wheat was 1.57 million mt. At present rate, Nepal produced wheat worth of more than US$ 400 million (NRs.27272.5 million). 7. DISCUSSION
Nepal started preparing the ‘National Adaptation Program of Action’ (NAPA) on climate change

J. L. Nayava, R. Singh & M. R. Bhatta 141
Journal of Hydrology and Meteorology, Vol. 6, No. 1 SOHAM-Nepal
about six years ago. However, nothing substantial has been accomplished so far. The Nepal’s NAPA seems to be focusing more on the effects on tourism, biodiversity, abnormal rain, storm, rapid melting of snow and glacier formation. Though these aspects are important too, the most important effect of climate change would be on agriculture (food production). Therefore, the country should be more concerned on the negative impact of climate change on the agriculture. Shortening of winter season, summer season getting hotter and erratic rainfall patterns as a result of climate change could have serious adverse impact on agriculture.
The issues of development of wheat yield and production lie in the following main points.
I) one of the reasons for increase in wheat yield is the use of improved seeds. About 97% of seeds used in Nepal during 2007/2008 (MOAC, 2008) was improved. There are altogether 21 varieties of wheat developed for different environment in Nepal (NARC, 1997). In previous years there was general recommendation for seed rate of 100 kg/ha. Recent experiments have shown that additional seeds of 25 to 50 kg is required under late sown and under farmers broadcast system (NARC, 1997).
II) The other reason for improvement in wheat cultivation can be attributed to better irrigation facilities.
It seemed that the rst irrigation used to provide during the crown root stage, but how much water had been provided, the records were not available. As a second application, during the grain lling stage of the wheat, it seems that very few farmers used to apply, but this is the critical period for water de cits in wheat. At this time the weather is very dry and the rain-fed rivers are almost dry. Therefore the occurrence of rainfall during that period seemed to be very important for the wheat production in Nepal. But due to the non availability
of when and how much water had been added by the irrigation and at the same time the wheat yield and production data were just aggregated at district level. In that circumstance, how much rainfall affected in wheat production was a complex issue. Therefore, It is very necessary to stress that it is very important to have the data, when, where and how much water had been added. If the irrigation was available through out in Rupandehi, the uctuation of the cultivation of wheat as well as the yield may not have varied as shown in Figures 8 and 9. Thus the collection of eld observation of irrigation application is very much required, so that one can make the possible suggestions which can be laid down for the future planning and development.
It has been commonly observed that farmers put heavy irrigation in their wheat elds during rst irrigation, that creates anaerobic situation for wheat plants and wheat plants start yellowing. This happens due to poor knowledge of wheat agronomy among farmers and poor drainage in the Tarai. After yellowing the wheat crop shows a fatal illness for a period of at least one week which is very important for yield attributing components in wheat. Because just after rst irrigation (after 25 to 30 days of planting, the spike initiation starts and that decides the size and number of orets in the spike). This has to be taught to farmers to improve wheat yield and many farmers know this.
III) The third factor should be the fertilizer application and their quantities. Modern wheat varieties are very much responsive to fertilizer application and require 100:50:50 kg/ha NPK under irrigated conditions whereas in rain-fed wheat the addition of 25 kg/ha K in the previously recommended doses of 60:40 kg/ha NP is bene cial. Experiments show that irrigation provided a sizeable increase in yields (NARC, 1997). It is understood that Nepal uses least amount of fertilizer in this region.

142 J. L. Nayava, R. Singh & M. R. Bhatta
Journal of Hydrology and Meteorology, Vol. 6, No. 1 SOHAM-Nepal
IV) The fourth factor is land fragmentation, small land parcels and small landholdings scattered across many places have been the major causes for under utilization of ground water irrigation. Moreover, marketing of commercial crops is not organized so as to bene t small to medium farmers, and the current high cost of crop production makes the growers unable to compete with similar products imported from India. Winter crops only less than 30 % of projected command area of major irrigation projects get assured irrigation.
V) The fth factor should be the better management of the eld due to training and publicity given by extension workers from the Department of Agriculture. The farmers are not oriented towards maximizing the farm production, mainly due to lack of integrated water management and advanced agricultural technology and inputs. Irrigation and agriculture sector programs are not coordinated and theoretical ideas of crop intensi cation and diversi cation in areas where water is available for crops have not been put into practice by the agencies concerned (Shah & Singh, 2003). This is the serious comment which has to be tackle for the future development in agriculture.
8. CONCLUSION AND RECOMMENDATION
The area of wheat cultivation in Nepal has increased drastically, by three folds, especially at the Tarai region as described earlier. Previously area of cultivation was very limited and the yield was less than 1 mt/hectare in Tarai. Now, with availability of the high yielding varieties as well as improved irrigation facilities in Tarai, wheat yield has increased more than three times in the Tarai. However, during the same period wheat yield showed 100% increase in the Hills and only 50% increase in the mountains.
Weather still plays a prominent role in crop productivity, but the coordination with related Departments is very poor. On the other hand, Department of Hydrology and Meteorology was focused only in aviation weather forecasting since the establishment of their services in 1960’s. They should expand their boundaries for their services in agriculture. Department of Agriculture/ Ministry of Agriculture and Co-operatives need a better coordination with the different Department in future for their challenging role of Agriculture development in Nepal. The Ministry of Finance and Planning commission Secretariat should pay their attentions, if ever Department of Hydrology and Meteorology requests for the extra budget to play a supporting role for the development of Agriculture in Nepal.
The Ministry of Agriculture and Cooperatives in the Government of Nepal should be very serious and immediately establish a Monitoring and Evaluation Committee on climate change impact on agriculture. A country can not wait until the last minute and they have to fully prepare before any catastrophic consequences. Nepal has very few studies on weather, climate and crop relation studies. It is high time to study the variation and trend of past climate data and their relation to crop in detail. Any extreme occurrence of weather and climate event may damage the crop. Now it is known only that the global warming has been taking place since 1970’s and the global temperature may increase by 1.4 to 5.80 C during this century (Global Circulation Models projection). This information is not enough for agriculture and therefore one has to know, what is going on at the different places in the country and what can be done. The present study showed that the mean annual temperatures were increased 0.00510C, 0.02880C and 0.0350C in Bhairahawa, Surkhet and Jumla during 1977-2008, but the mean temperature during the wheat growing season in Bhairahawa, surkhet and jumla were 0.0120C, 0.03230C and 0.03680C during 1977-2008.
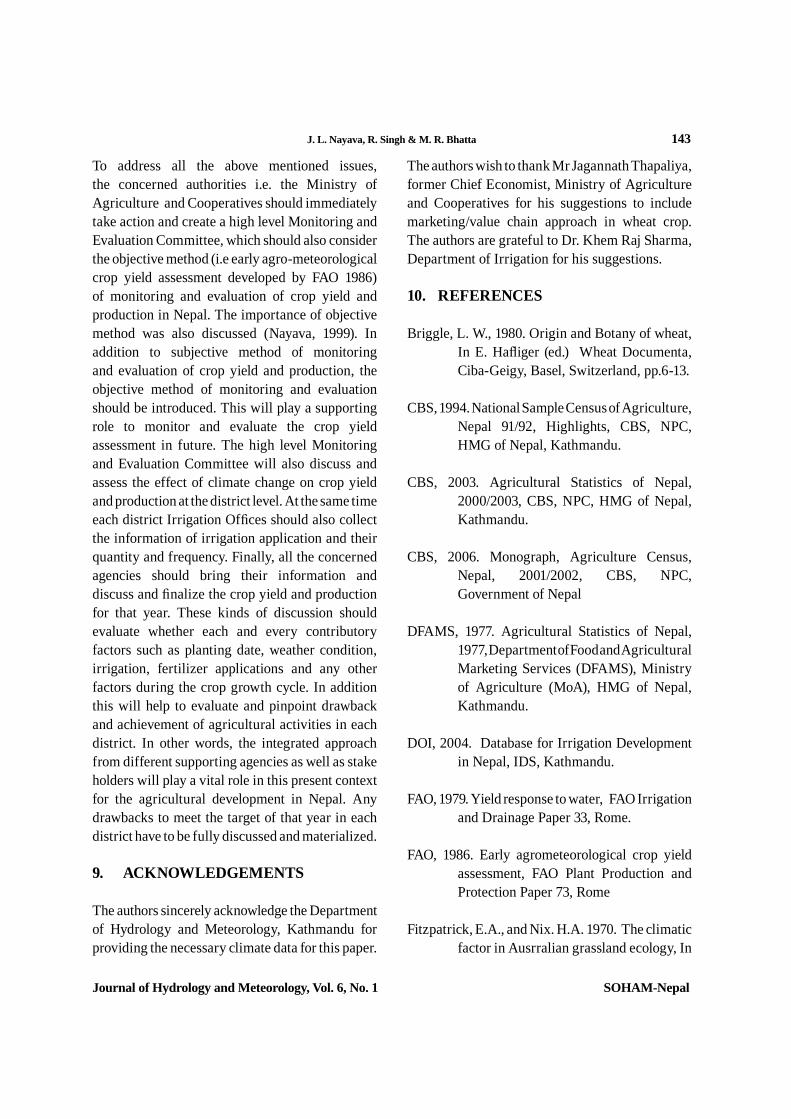
J. L. Nayava, R. Singh & M. R. Bhatta 143
Journal of Hydrology and Meteorology, Vol. 6, No. 1 SOHAM-Nepal
To address all the above mentioned issues, the concerned authorities i.e. the Ministry of Agriculture and Cooperatives should immediately take action and create a high level Monitoring and Evaluation Committee, which should also consider the objective method (i.e early agro-meteorological crop yield assessment developed by FAO 1986) of monitoring and evaluation of crop yield and production in Nepal. The importance of objective method was also discussed (Nayava, 1999). In addition to subjective method of monitoring and evaluation of crop yield and production, the objective method of monitoring and evaluation should be introduced. This will play a supporting role to monitor and evaluate the crop yield assessment in future. The high level Monitoring and Evaluation Committee will also discuss and assess the effect of climate change on crop yield and production at the district level. At the same time each district Irrigation Of ces should also collect the information of irrigation application and their quantity and frequency. Finally, all the concerned agencies should bring their information and discuss and nalize the crop yield and production for that year. These kinds of discussion should evaluate whether each and every contributory factors such as planting date, weather condition, irrigation, fertilizer applications and any other factors during the crop growth cycle. In addition this will help to evaluate and pinpoint drawback and achievement of agricultural activities in each district. In other words, the integrated approach from different supporting agencies as well as stake holders will play a vital role in this present context for the agricultural development in Nepal. Any drawbacks to meet the target of that year in each district have to be fully discussed and materialized.
9. ACKNOWLEDGEMENTS
The authors sincerely acknowledge the Department of Hydrology and Meteorology, Kathmandu for providing the necessary climate data for this paper.
The authors wish to thank Mr Jagannath Thapaliya, former Chief Economist, Ministry of Agriculture and Cooperatives for his suggestions to include marketing/value chain approach in wheat crop. The authors are grateful to Dr. Khem Raj Sharma, Department of Irrigation for his suggestions.
10. REFERENCES
Briggle, L. W., 1980. Origin and Botany of wheat, In E. Ha iger (ed.) Wheat Documenta, Ciba-Geigy, Basel, Switzerland, pp.6-13.
CBS, 1994. National Sample Census of Agriculture, Nepal 91/92, Highlights, CBS, NPC, HMG of Nepal, Kathmandu.
CBS, 2003. Agricultural Statistics of Nepal, 2000/2003, CBS, NPC, HMG of Nepal, Kathmandu.
CBS, 2006. Monograph, Agriculture Census, Nepal, 2001/2002, CBS, NPC, Government of Nepal
DFAMS, 1977. Agricultural Statistics of Nepal, 1977, Department of Food and Agricultural Marketing Services (DFAMS), Ministry of Agriculture (MoA), HMG of Nepal, Kathmandu.
DOI, 2004. Database for Irrigation Development in Nepal, IDS, Kathmandu.
FAO, 1979. Yield response to water, FAO Irrigation and Drainage Paper 33, Rome.
FAO, 1986. Early agrometeorological crop yield assessment, FAO Plant Production and Protection Paper 73, Rome
Fitzpatrick, E.A., and Nix. H.A. 1970. The climatic factor in Ausrralian grassland ecology, In
144 J. L. Nayava, R. Singh & M. R. Bhatta
Journal of Hydrology and Meteorology, Vol. 6, No. 1 SOHAM-Nepal
Australian Grassland”. (Ed.Moore): The Australian University Press, Camnberra, Australia, pp. 3-26.
IPCC, (2007). Climata Change 2007: The Physical Science Basis, In Summary for Policy Makers, IPCC:21, Geneva: IPCC.
MoAC, 2006. Statistical Information on Nepalese Agriculture, 2005/2006, Ministry of Agriculture and Coperatives, Kathmandu.
MoAC, 2007. Statistical Information on Nepalese Agriculture, 2006/2007, Ministry of Agriculture and Coperatives, Kathmandu.
MoAC, 2008. Statistical Information on Nepalese Agriculture, 2007/2008, Ministry of Agriculture and Coperatives, Kathmandu.
NARC, 1997. 25 Years of wheat Research in Nepal (1972-1997), Nepal Agricultural Research Council, Kathmandu.
NARC, 2007. Released and registered crop varieties in Nepal, Nepal Agricultural Research Council, Kathmandu.
Nayava, J.L., 1981. Climates of Nepal and their implications for Agricultural Development, The Australian National University, Canberra, Australia, Ph.D. Thesis, pp 1-284.
Nayava, J.L., 1999. Monitoring and evaluation of crop yield and production in Nepal; Proceedings of 3rd national conference on Science and Technology, Royal Nepal Academy of Science and Technology, Kathmandu. pp. 720-734.
Nayava, J.L., 2004. The temporal variations of rainfall in Nepal since 1971-2000, Journal of Hydrology and Meteorology, Volume 1, pp. 24-33.
Nayava, J.L., 2008. Variations of rice yield with rainfall in Nepal during 1971-2000, Journal of Hydrology and Meteorology, Volume 1. pp. 93-102.
Shah, S.G., & Singh G.N. (2001). Irrigation Development in Nepal Investment,
International, research Report Series No. 47.
Sharma, A., 2007. Personnel Communication, National Agricultural Research Council, Khumaltar, Nepal.
Sharma, K.R., 1998. Institutional and technological options in the development and management of small scale irrigation systems, FAO water series, vol.17.
Sharma, K.R., 2004. Modalities of irrigation development and technology: Results from agency and farmers managed system, Irrigation conditions, vision and the concept of integrated water resources management, Department of irrigation, pp.66-77.
Shrestha, A. B., Wake, C.P, Mayewski, P.A. & Dibb, J.E. (1999). Maximum temperature trends in the Himalaya and its vicinity: An analysis based on temperature records from Nepal for the period 1971-94, In Journal of Climate, 12: pp.2775-2767.
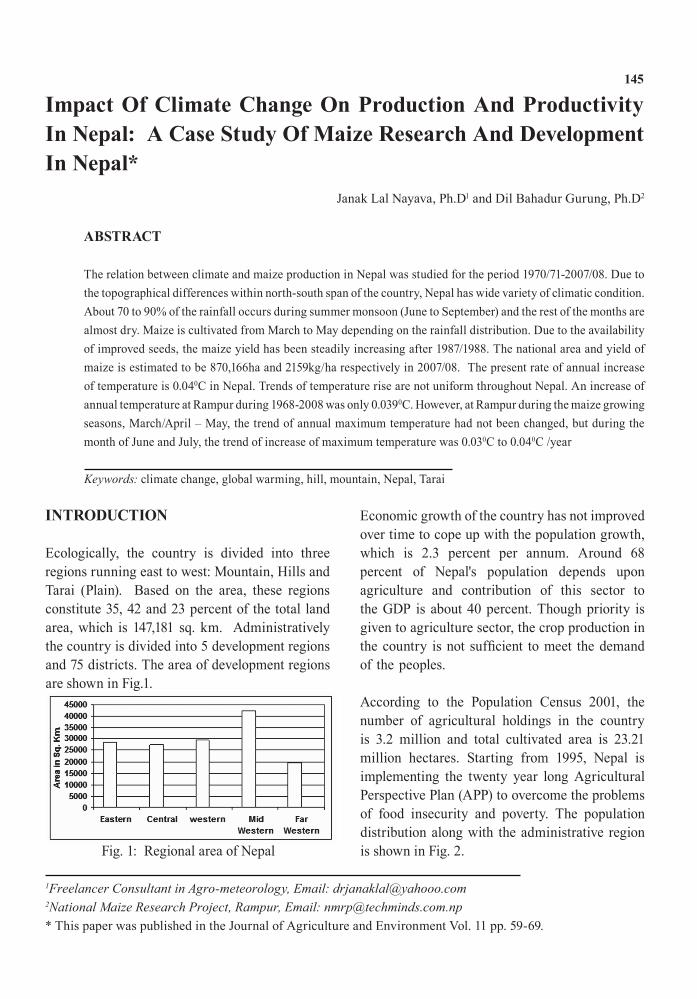
145
ABSTRACT
The relation between climate and maize production in Nepal was studied for the period 1970/71-2007/08. Due to .noitidnoc citamilc fo yteirav ediw sah lapeN ,yrtnuoc eht fo naps htuos-htron nihtiw secnereffid lacihpargopot eht
About 70 to 90% of the rainfall occurs during summer monsoon (June to September) and the rest of the months are almost dry. Maize is cultivated from March to May depending on the rainfall distribution. Due to the availability of improved seeds, the maize yield has been steadily increasing after 1987/1988. The national area and yield of maize is estimated to be 870,166ha and 2159kg/ha respectively in 2007/08. The present rate of annual increase of temperature is 0.040C in Nepal. Trends of temperature rise are not uniform throughout Nepal. An increase of annual temperature at Rampur during 1968-2008 was only 0.0390C. However, at Rampur during the maize growing seasons, March/April – May, the trend of annual maximum temperature had not been changed, but during the month of June and July, the trend of increase of maximum temperature was 0.030C to 0.040C /year
Impact Of Climate Change On Production And Productivity In Nepal: A Case Study Of Maize Research And Development In Nepal*
INTRODUCTION
Ecologically, the country is divided into three regions running east to west: Mountain, Hills and Tarai (Plain). Based on the area, these regions constitute 35, 42 and 23 percent of the total land area, which is 147,181 sq. km. Administratively the country is divided into 5 development regions and 75 districts. The area of development regions are shown in Fig.1.
Janak Lal Nayava, Ph.D1 and Dil Bahadur Gurung, Ph.D2
Economic growth of the country has not improved over time to cope up with the population growth, which is 2.3 percent per annum. Around 68 percent of Nepal's population depends upon agriculture and contribution of this sector to the GDP is about 40 percent. Though priority is given to agriculture sector, the crop production in
of the peoples.
According to the Population Census 2001, the number of agricultural holdings in the country is 3.2 million and total cultivated area is 23.21 million hectares. Starting from 1995, Nepal is implementing the twenty year long Agricultural Perspective Plan (APP) to overcome the problems of food insecurity and poverty. The population distribution along with the administrative region is shown in Fig. 2.
Keywords: climate change, global warming, hill, mountain, Nepal, Tarai
* This paper was published in the Journal of Agriculture and Environment Vol. 11 pp. 59-69.
1Freelancer Consultant in Agro-meteorology, Email: [email protected] Maize Research Project, Rampur, Email: [email protected]
Fig. 1: Regional area of Nepal

146 The Journal of Agriculture and Environment Vol: 11, Jun. 2010 Technical Paper
In Nepal maize is grown in the sub tropical to cool temperate climates. For higher yields, crop water requirement is 500-600mm depending upon the climate and duration of the crop, there should be adequate water during the crop establishment period. Water de cit during the grain lling period results in reduced grain weight. However, during the maturity and harvesting period, rainfall has negative impact on maintaining grain quality.
Knowledge of genetic characteristics and particularly growth and development pattern of maize varieties is essential for meeting the combination of various climatic requirements for growth development and yield formation. It is known that the upper limit of crop production is set by the climatic condition specially temperature regimes and the genetic potential of the variety grown. The extent to which this limit can be reached will always depend on how nely the engineering aspects of water supply are in tune with the biological needs for water in crop production (FAO, 1979). The area under maize cultivation in different regions of Nepal is shown in Fig. 3.
Fig. 2: Population distribution in administrative region
Fig. 3: Maize cultivation in the different regions in Nepal
DATA
This study is based on data of thirty six years (1970/71 – 2007/08). Climate data were provided by the Department of Hydrology and Meteorology (DHM, 1999a, 2001, 2002, 2005, 2007 and 2009). Source of the maize data is the then Department of Food and Agricultural Marketing Services (DFAMS, 1977), National Planning Commission (NPCS, 1994), Central Bureau of Statistics (CBS, 1999, 2003, 2006) and Ministry of Agriculture and Cooperatives (MoAC, 2002, 2004, 2005, 2006, 2007 and 2008).
Taking into consideration the growing season of summer maize, this study attempts to analyze relationship between rainfall and maize production for whole of Nepal and three ecological belts with a case study at the National Maize Research program in Rampur, which lies in inner Tarai of central Nepal.
ANALYSIS
NATIONAL LEVEL
Maize is the second most important cereal crop in Nepal and is also staple food for Hills people. Area under this crop is approximately 870,166ha with an average productivity of 2159 kg/ha in 2007/08. About 70% maize area is in the Hills. Maize occupies 34% of total cultivated cereal crops and contributes 30% as a total edible food in Nepal. Maize is generally grown under rain-fed condition in Nepal. Maize is an important crop for making edible oil and is also signi cant source of bio-fuel production in the world. Maize is very sensitive to frost. The favorable condition of growing maize is light to medium textured, deep well drained soils free from water-logging. The cool temperature delays maturity in the crop. Cold stress occurs when temperature is below 10°C and development of plant growth ceases. Similarly, heat stress occurs when temperature is higher than 35°C.
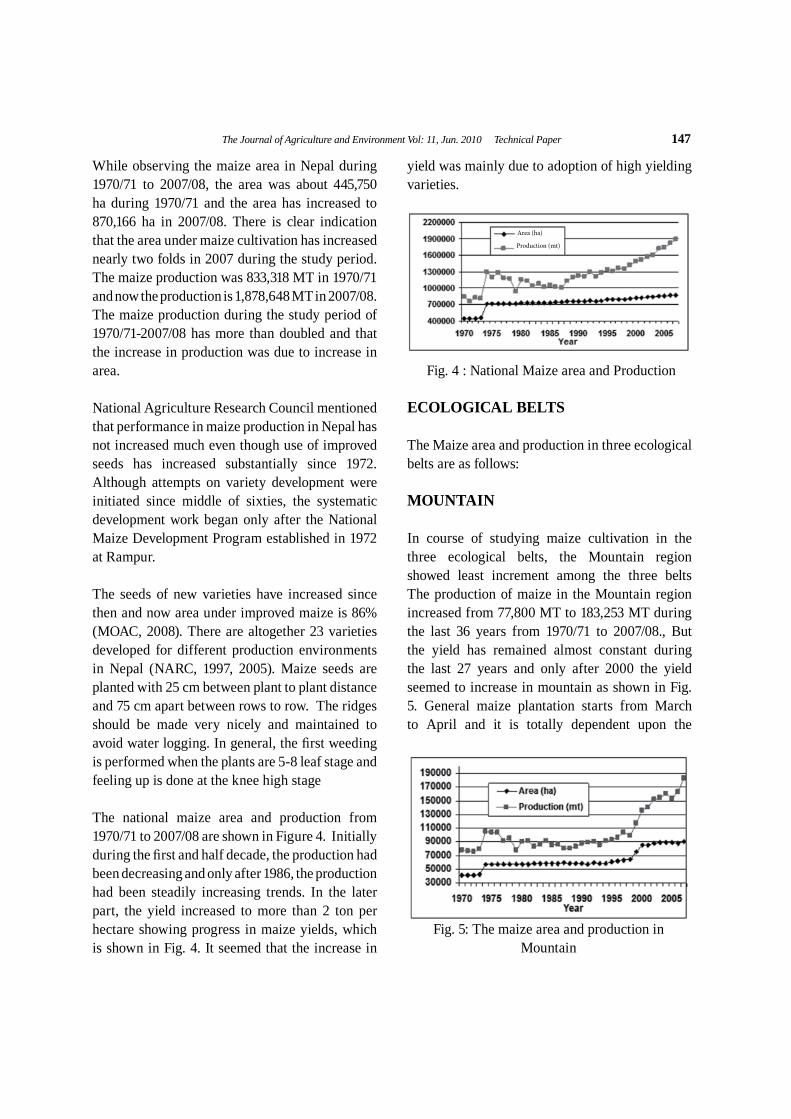
The Journal of Agriculture and Environment Vol: 11, Jun. 2010 Technical Paper 147
While observing the maize area in Nepal during 1970/71 to 2007/08, the area was about 445,750 ha during 1970/71 and the area has increased to 870,166 ha in 2007/08. There is clear indication that the area under maize cultivation has increased nearly two folds in 2007 during the study period. The maize production was 833,318 MT in 1970/71 and now the production is 1,878,648 MT in 2007/08. The maize production during the study period of 1970/71-2007/08 has more than doubled and that the increase in production was due to increase in area.
National Agriculture Research Council mentioned that performance in maize production in Nepal has not increased much even though use of improved seeds has increased substantially since 1972. Although attempts on variety development were initiated since middle of sixties, the systematic development work began only after the National Maize Development Program established in 1972 at Rampur.
The seeds of new varieties have increased since then and now area under improved maize is 86% (MOAC, 2008). There are altogether 23 varieties developed for different production environments in Nepal (NARC, 1997, 2005). Maize seeds are planted with 25 cm between plant to plant distance and 75 cm apart between rows to row. The ridges should be made very nicely and maintained to avoid water logging. In general, the rst weeding is performed when the plants are 5-8 leaf stage and feeling up is done at the knee high stage
The national maize area and production from 1970/71 to 2007/08 are shown in Figure 4. Initially during the rst and half decade, the production had been decreasing and only after 1986, the production had been steadily increasing trends. In the later part, the yield increased to more than 2 ton per hectare showing progress in maize yields, which is shown in Fig. 4. It seemed that the increase in
yield was mainly due to adoption of high yielding varieties.
Fig. 4 : National Maize area and Production
ECOLOGICAL BELTS
The Maize area and production in three ecological belts are as follows:
MOUNTAIN
In course of studying maize cultivation in the three ecological belts, the Mountain region showed least increment among the three belts The production of maize in the Mountain region increased from 77,800 MT to 183,253 MT during the last 36 years from 1970/71 to 2007/08., But the yield has remained almost constant during the last 27 years and only after 2000 the yield seemed to increase in mountain as shown in Fig. 5. General maize plantation starts from March to April and it is totally dependent upon the
Fig. 5: The maize area and production in Mountain
Area (ha)
Production (mt)

148 The Journal of Agriculture and Environment Vol: 11, Jun. 2010 Technical Paper
rainfall. The average annual temperature during the growing season in Mountain was from 18oC to 21oC. In fact, area under maize in mountain was 9.6% of the total maize area and contributed 10.3% of the total maize production in the country. In mountain regions, maize matured in around 180 days.
HILLS
The maize growing season in the Hills Region is from March/April to July/August. Maize is planted in rain-fed condition in the Hills and depends upon the rainfall distribution. The land preparation starts with rainfall. Maize is generally planted from mid February to the end of April. Maize area is more in the Western Hills compared to the other Hills in Nepal as shown in Fig. 6. The maturity period of maize in the hills ranged from 140 to 150 days.
Mean annual temperature during the growing period in the Hills ranged from 21oC to 27oC. Hills regions showed nearly three fold increases in area during the period from 1970/71 to 2007/08. The gap in area and production showed a progressive change after 1988 in the Hills (Fig. 6). The production of maize in the Hills increased from 524,700 MT to 1312,254 MT during the study period. In fact Hills region has about 70.4% of the total maize area and contributes 69.7% of the total maize production in the country.
Fig. 6: The maize area and production in Hills
TARAI
Maize is grown during April- July in Tarai. During this period, about 500 to 800mm rainfall occur in the Tarai. Annual mean temperature during the growing period of maize in Tarai is 21oC to 33oC. In fact Tarai region has only 9.1% of the total maize area and contributes 20.4% of the total maize production in the country.
During the last 36 years period from 1970/71 to 2007/08 (Fig. 7), the production of maize in the Tarai region increased from 230,700 MT to 383,141 MT. It is interesting to note that the maize yield in Tarai was initially low. In Tarai, area under maize increased by 60% and its yield increased only 71%.
Maize is planted in all three seasons (summer, winter and spring) in the Tarai Region. The planting of summer maize starts from April to May and harvests on August to September. The growing season of winter maize covers from November/ December to March/ April. Similarly, the growing season of spring maize is in March/April and harvests on June to early July. For the summer and winter crops, farmers prefer to grow long duration varieties, where as for the spring maize short duration varieties are preferred. Winter and spring maize is planted, wherever the irrigation facilities are available.
Fig. 7: The maize area and production in Tarai
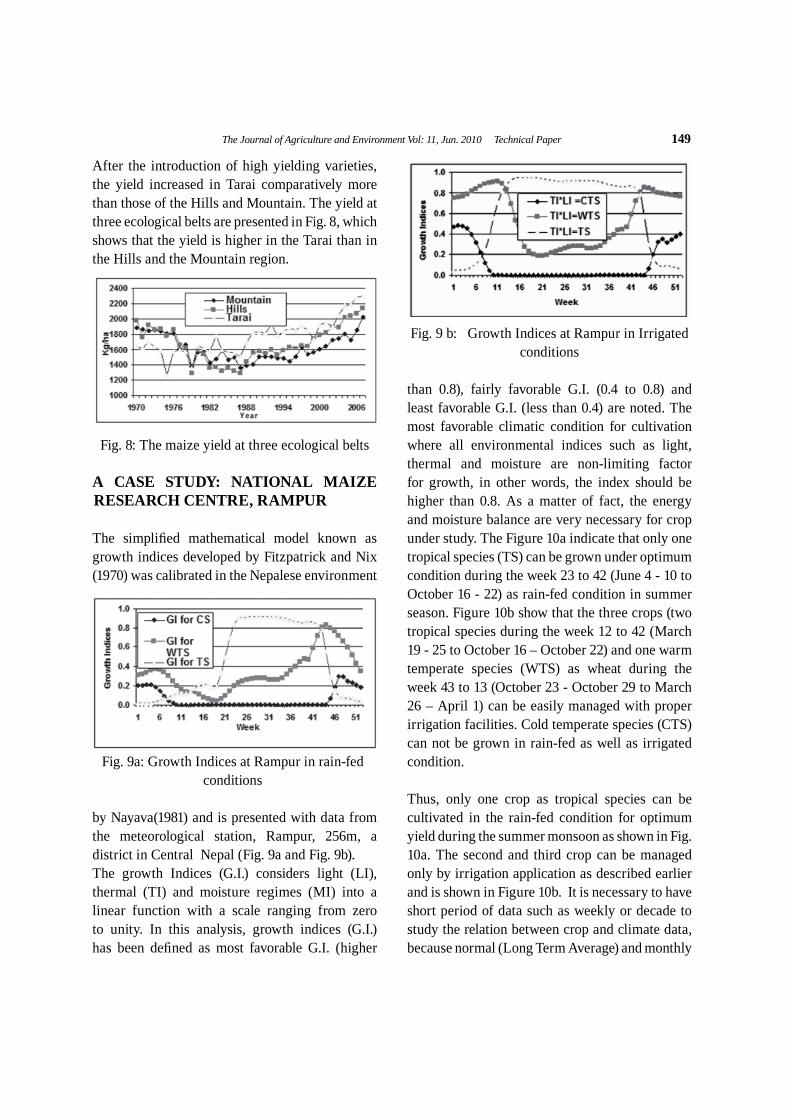
The Journal of Agriculture and Environment Vol: 11, Jun. 2010 Technical Paper 149
After the introduction of high yielding varieties, the yield increased in Tarai comparatively more than those of the Hills and Mountain. The yield at three ecological belts are presented in Fig. 8, which shows that the yield is higher in the Tarai than in the Hills and the Mountain region.
A CASE STUDY: NATIONAL MAIZE RESEARCH CENTRE, RAMPUR
The simpli ed mathematical model known as growth indices developed by Fitzpatrick and Nix (1970) was calibrated in the Nepalese environment
by Nayava(1981) and is presented with data from the meteorological station, Rampur, 256m, a district in Central Nepal (Fig. 9a and Fig. 9b).The growth Indices (G.I.) considers light (LI), thermal (TI) and moisture regimes (MI) into a linear function with a scale ranging from zero to unity. In this analysis, growth indices (G.I.) has been de ned as most favorable G.I. (higher
Fig. 8: The maize yield at three ecological belts
Fig. 9a: Growth Indices at Rampur in rain-fed conditions
than 0.8), fairly favorable G.I. (0.4 to 0.8) and least favorable G.I. (less than 0.4) are noted. The most favorable climatic condition for cultivation where all environmental indices such as light, thermal and moisture are non-limiting factor for growth, in other words, the index should be higher than 0.8. As a matter of fact, the energy and moisture balance are very necessary for crop under study. The Figure 10a indicate that only one tropical species (TS) can be grown under optimum condition during the week 23 to 42 (June 4 - 10 to October 16 - 22) as rain-fed condition in summer season. Figure 10b show that the three crops (two tropical species during the week 12 to 42 (March 19 - 25 to October 16 – October 22) and one warm temperate species (WTS) as wheat during the week 43 to 13 (October 23 - October 29 to March 26 – April 1) can be easily managed with proper irrigation facilities. Cold temperate species (CTS) can not be grown in rain-fed as well as irrigated condition.
Thus, only one crop as tropical species can be cultivated in the rain-fed condition for optimum yield during the summer monsoon as shown in Fig. 10a. The second and third crop can be managed only by irrigation application as described earlier and is shown in Figure 10b. It is necessary to have short period of data such as weekly or decade to study the relation between crop and climate data, because normal (Long Term Average) and monthly
Fig. 9 b: Growth Indices at Rampur in Irrigated conditions

150 The Journal of Agriculture and Environment Vol: 11, Jun. 2010 Technical Paper
data may be equal, but the rainfall may had fall within one or two days at the end of the month and where a long intervals of three to four week dry period may have wilted the crop. On the other hand, a short period of squall or hailstorm will just damaged the whole crop in the ground. FAO suggests 10 days period would be just right for crop weather analysis. It is interesting to note that the maize yield in Tarai, Hills and Mountain justify the crop weather model patterns as described earlier. According to crop weather model, the Tarai is most favorable, the Hills and Mountain are relatively less favorable. The results were tallied by yield pattern in different ecological belt as discussed earlier.
In Nepal adaptation of modern farming technique and varietal improvement Maize started from Rampur Agricultural farm in Chitwan district during the early 1970’s. A long time series of area, yield and production data of maize are only available at district level in Nepal. Rampur comes under Chitwan district and therefore, Chitwan district data has been analyzed and presented here. The area of maize remained almost constant throughout 1974 to 1994, but 1995 to 2003 showed much higher in area and a later four years showed less (Fig. 10). Why it was so, the reasonable explanation was not available. Similarly the yield showed decreasing tendency up to 1987 and later showed the increased trend as shown in Fig. 11.
Fig. 10: Maize area in Chitwan
The recent increase of increase of yield may not be only due to introduction of high yielding seeds, but may have been due to climate change factor. Discussions are very much required to draw any conclusion.
This increase in maize yield is due to use of high yielding seeds which have been con rmed by personal discussion with the concerned authorities. While looking at the Figure 10, the cultivated area seemed just jumped during 1990’s and later lower than the 1980’s and therefore the concerned authorities should take note of this matter in future estimation. The production of maize in Chitwan district is shown in Fig. 12
Fig. 11: Maize yield at Chitwan
Fig. 12: Production of maize at Chitwan district
It is interesting to note that the shortfall of production of maize was noted in 1974, 1975, 1978, 1979, 1982, 1985, 1986, 1988, 1991, 1993, 1999, 2002 and 2005. This shortfall is as

The Journal of Agriculture and Environment Vol: 11, Jun. 2010 Technical Paper 151
compared to the preceding year. The 13 years had shortfall of production out of thirty eight years. The decade rainfall and number of rainy days during that decade in the February to May during those years was presented in Table 1. The table indicates that the rainfall during the emergence period in all those years was very poor and therefore production may have been affected. When one relates the rainfall data with crops, the rainfall characteristics such as depth, intensity and distribution in time and space are all important factors.
February March April May
Year Decade Decade Decade Decade Decade Decade Decade Decade Decade Decade Decade Decade
1 2 3 1 2 3 1 2 3 1 2 3
1974 0.0/0 0.6/0 0.0/0 0.0/0 0.0/0 71.3/3 3.8/1 0.0/0 8.0/1 21.1/3 45.1/7 44.0/2
1975 10.0/3 4.3/1 0.0/0 0.3/0 0.5/0 6.4/1 0.0/0 0.0/0 21.1/5 0.0/0 65.8/5 66.3/5
1978 16.0/2 10.2/1 0.0/0 1.0/0 32.8/4 0.0/0 0.0/0 29.5/4 6.9/1 41.5/5 163.2/7 62.2/4
1979 7.7/1 7.0/1 0.0/0 0.5/0 0.2/0 0.0/0 1.5/1 12.4/2 10.6/1 0.0/0 1.7/1 6.8/1
1982 7.8/2 0.5/0 0.0/0 51.0/3 0.0/0 0.9/0 3.4/1 47.1/5 28.7/4 0.0/0 15.8/2 5.2/1
1985 11.1/1 0.0/0 0.0/0 0.0/0 0.0/0 0.0/0 5.2/1 0.0/0 6.2/1 21.5/4 89.9/6 83.0/6
1986 2.8/1 17.4/2 0.0/0 0.0/0 0.0/0 0.0/0 1.8/1 16.7/1 26.8/5 6.9/2 50.7/6 27.8/2
1988 0.0/0 0.8/0 1.9/1 12.2/1 26.0/3 0.0/0 0.0/0 53.7/3 38.5/3 16.9/3 69.9/5 133.6/7
1991 0.0/0 0.0/0 8.4/1 12.2/2 0.6/0 10.9/2 11.9/2 0.0/0 9.1/3 11.3/3 38.3/3 64.3/8
1993 0.0/0 9.1/1 0.0/0 0.0/0 0.0/0 49.4/3 0.0/0 55.4/3 27.1/4 48.8/2 73.5/6 63.2/4
1998 0.0/0 0.0/0 0.0/0 0.0/0 0.0/0 0.0/0 10.1/1 0.0/0 9.1/3 143.5/7 2.0/1 4.6/1
2002 0.0/0 13.2/1 15.1/2 11.2/1 0.0/0 34.4/2 10.5/1 0.0/0 40.0/4 104.4/5 168.3/7 119.2/5
2004 0.0/0 0.0/0 0.0/0 0.0/0 0.0/0 0.0/0 90.0/4 0.0/0 90.2/4 4.1/1 22.6/2 84.7/7
2005 2.2/1 1.4/1 1.2/1 0.0/0 35.6/3 3.3/2 0.0/0 0.0/0 28.7/2 36.1/2 83.6/5 13.8/3
Fig. 13: Number of days of rainfall during March and April at Rampur
Fig. 14: Amount of rainfall during March and April at Rampur
Table 1: Decade Rainfall and rainy days >1.0 mm in Rampur at the lower production year of maize
The water requirement of crops at the different stages, effective rainfall, water holding capacity of the soil and the crop coef cient are all required. Number of days of rainfall during those months of March and April and the amount of rainfall during those months are also presented in Figs. 13 and 14. Similarly, the amount of rainfall during the months of May, June and July are also presented in Fig. 15. If maize planted in May and June, this shows that the amount of rainfall and the soil

152 The Journal of Agriculture and Environment Vol: 11, Jun. 2010 Technical Paper
Fig. 16: Trend of annual average temperature at Rampur
Fig. 17: Trend of maximum temperature during March
Fig. 18: Trend of maximum temperature during April
Fig. 19: Trend of maximum temperature during May
moisture will be quite enough for emergence and vegetative period of maize, On the contrary, the rainfall in March and April is erratic and may not be sure to have enough soil moisture for emergence period.
CLIMATE CHANGE AND THEIR EFFECTS ON MAIZE
In the present scenarios of climate change, the impact on agriculture has to be explored and this is very enormous and complex task, but the country should immediately start planning and take action, before it is too late. The mean annual temperature trend at Rampur during 1968 to 2008 is shown in Fig. 16. It showed that the increase
Fig. 15: Amount of rainfall during June, July and August at Rampur
of temperature seemed to be more in the recent decade than the former decade and the trend was 0.0390C per year.
The maximum temperature trend at Rampur during the maize growing season from March to July was also analyzed as shown in Figs 17- 21. The trend of maximum temperature during April and May showed negative trend (Figures 18 and 19) and the month of June and July showed the positive trend as shown in Figs 17 and 18.
Recently the effect of climate change to agriculture in Nepal was also studied by

The Journal of Agriculture and Environment Vol: 11, Jun. 2010 Technical Paper 153
Fig. 20: Trend of maximum temperature during June
Fig. 21: Trend of maximum temperature during July
different researchers. The APN report shows, when the temperature rises up to 10C, there is a positive role in percentage change in maize yield in all the agro-ecological zones. When the temperature rises up to 20C and at the same time carbon dioxide is doubled, the yield will decrease in Tarai, Hills will not be much affected. On the contrary, Mountain environment will have better yield if the carbon dioxide is doubled and temperature rises up to 40 C, the maize yield in Tarai will suffer 25% lesser than the present yield . Therefore the study of present variation of climatic parameters such as rainfall and temperature in the crop yield should be regularly studied and discussed.
PROBLEMS ENCOUNTERED
Gray Leaf Spot is a great threat Gray leaf spot, a new disease of maize is a
great threat in the mid hills of Nepal. Local varieties are more susceptible to this disease than improved varieties. Improved varieties such as Manakamana-3, Shitala, Deuti, Ganesh -1 and Ganesh -2 are less susceptible and thus these varieties need to be promoted in eastern and central hills of Nepal.
Post harvest losses (storage) Post harvest losses due to diseases and storage
pests should be minimized. Grain weevils are the major storage pest of maize in Nepal.
Climate Change (Drought)
Drought is prolonging year after year in Nepal. Development of drought tolerant varieties is the answer to the drought problem. Adjustment of planting season could help to escape the critical stage of crops to escape from the drought.
One of the drought tolerant characters in a
variety is having less anthesis and silking interval (ASI) in maize. Shorter ASI will escape drought in maize cultivation. Varieties with long ASI are more vulnerable to drought. In the context of climate change, development of drought tolerant varieties is one of the options to overcome the drought and answer to the problem of climate change.
DISCUSSION
Despite the importance of maize, the yield has not been increased to satisfactory level. The production seemed to increase due to more land brought under cultivation he low yield of maize may be due to the following reasons.
It is noted earlier that out of 38 years, 13 years had poor rainfall during the maize emergence period that affected maize production in those years.

154 The Journal of Agriculture and Environment Vol: 11, Jun. 2010 Technical Paper
Fig. 22: Sun shine hours at the different places
The second possible factor may be due to lower sunlight during the grain formation stage of maize and thereby, lower photosynthetic rate. Sunshine hours at Rampur, Kathmandu, Okhaldhunga, and Chialsa had low during July and August. During those months there is highest rainfall in Nepal. The long term average sunshine hours at Rampur, 256m; Kathmandu, 1336m, Okhaldhunga, 1720m and Chialsa, 2770 of Nepal at the different elevations are presented in Figure 22.
During the maturity period, the high rainfall and high humidity caused maize disease such as BLSP and Turccicum blight resulting low maize production.
Drought period is prolonging year after year in Nepal and same as the onset of monsoon. Planting of maize in rain-fed conditions depend upon the rainfall, one need to rethink on maize planting based on rainfall pattern. May to June planting and October/ November harvesting would be suitable for maize cultivation in Nepal. For this, experiment of maize planting on these months should be conducted.
RECOMMENDATION AND CONCLUSION
The study of maize yield and production with
relation to pre-monsoon rainfall (March- May) for the 1971-2008, through crude analysis, showed that maize yield in Chitwan was badly affected in thirteen years particularly in the years, 1974, 1975, 1978, 1979, 1982, 1985, 1986, 1989, 1991, 1993, 1999, 2002, and 2005. During those years the pre-monsoon rainfall was much below lower than normal rainfall. Therefore the impact of rainfall on maize yield and production is quite evident. Maize planting in the Chitwan should be adjusted according to the change in rainfall pattern in the recent decades.
According to the crop weather model show in gure 9a, the most favourable condition of tropical species at rain-fed condition lies in June to October and therefore the maize should be planted during that period.
The present system of monitoring and evaluation of crop from Ministry of Agriculture and Cooperatives should be strengthened by updating the cultivated areas.
REFERENCES
CBS 1999: Agricultural Statistics of Nepal, CBS, NPC, HMG of Nepal, Kathmandu.
CBS 2003: Agricultural Statistics of Nepal, CBS, NPC, HMG of Nepal, Kathmandu.
CBS 2006: Monograph, Agriculture Census, Nepal, 2001/2002, CBS, NPC, Government of Nepal, Kathmandu.
DFAMS 1977: Agricultural Statistics of Nepal, 1977, Department of Food and Agricultural Marketing Services (DFAMS), Ministry of Agriculture (MoA), HMG of Nepal, Kathmandu.

The Journal of Agriculture and Environment Vol: 11, Jun. 2010 Technical Paper 155
DHM 1997: Climatological Records of Nepal (1991-1994), DHM, Kathmandu, Nepal.
DHM 1999a: Daily precipitation records of gandaki and narayani Zones through 1966, Department of Hydrology and Meteorology (DHM) Kathmandu, Nepal.
DHM 2001: Daily Precipitation Records of Nepal, 1997-1998, DHM, Kathmandu, Nepal.
DHM 2002: Climatological Records of Nepal (1999-2000), DHM, Kathmandu, Nepal.
DHM 2005: Climatological Records of Nepal (2001-2003), DHM, Kathmandu, Nepal.
DHM 2007: Climatological Records of Nepal (2004-2005), DHM, Kathmandu, Nepal.
DHM 2009: Climatological Records of Nepal (2006-2007), DHM, Kathmandu, Nepal
FAO, 1979. Yield response to water, FAO Irrigation and Drainage Paper 33, Rome
Fitzpatrick,E.A. and Nix, H.A. 1970 “The climatic factor in Australian grassland ecology” In ‘Australian Grassland’. (Ed. Moore, R.M.): The Australian National University Press, Canberra, Australia, pp.3-26.
MoAC, 2002, “Statistical Information on Nepalese Agriculture, 2001/2002”, Ministry of Agriculture and Coperatives, Kathmandu.
MoAC, 2004, “Statistical Information on Nepalese Agriculture, 2002/2003”, Ministry of Agriculture and Coperatives, Kathmandu.
MoAC, 2004, “Statistical Information on Nepalese Agriculture, 2003/2004”, Ministry
of Agriculture and Coperatives, Kathmandu.
MoAC, 2005, “Statistical Information on Nepalese Agriculture, 2004/2005”, Ministry of Agriculture and Coperatives, Kathmandu.
MoAC, 2006, “Statistical Information on Nepalese Agriculture, 2005/2006”, Ministry of Agriculture and Coperatives, Kathmandu.
MoAC, 2007, “Statistical Information on Nepalese Agriculture, 2006/2007”, Ministry of Agriculture and Coperatives, Kathmandu.
MoAC, 2008, “Statistical Information on Nepalese Agriculture, 2007/2008”, Ministry of Agriculture and Coperatives, Kathmandu.
NARC, 2005 “Released and registered crop varieties in Nepal”, Nepal Agricultural Research Council, Kathmandu.
NARC, 1997 “ 25 Years of Maize Research in Nepal (1972-1997)”, National Maize research Program, Nepal
Nayava, J.L. 1981 “ Climates of Nepal and their implications for Agricultural Development”, Ph.D thesis submitted to the Australian National University, Canberra, Australia.
NPCS, 1994 “Agricultural statistics of Nepal Revised Cropped Area Series”, 1974/75- 1991/92, Singh Durbar, Kathmandu.
ACKNOWLEDGEMENT
The authors wish to thank Mr. Rabi Singh, former Deputy Director General, Central Bureau of Statistics, the Government of Nepal for his suggestions and comments on this paper.
156
World Meteorological Day, 2005 sf] pknIodf ;f]xd–g]kfnsf r]o/Dofg 8f= >L hgs nfn gfoafn] lbg'ePsf] jQmJoM
cfb/0fLo ;efkltHo", cfb/0fLo k|d'v cltlyHo", ljZjljBfno cg'bfg cfof]u (UGC) sf cWoIfHo", ljefuLo dxflgb]{zsHo", ;f]xdsf ;b:o ;fyLx? pkl:yt cltly dxfg'efjx?,dlxnf tyf ;Hhgj[Gb ;a}df d]/f] / ;f]xdsf] tkm{af6 xflb{+s :jfut ub{5' .
World Meteorological Day sf] pknIodf b'O{ zAb af]Ng] df}sf lbg' ePsf]df cfof]hs ;a} ;xefuL ;fyLx?nfO{ wGojfb lbg rfxG5' . jf:tjdf o;/L ;df/f]xdf s'g} jQmJo lbg] d]/f] afgL 5}g . z'?df Technical ljifodf g} s]xL af]Ng] ljrf/ u/]sf] lyPF, t/;fyLx?n] o;df easily lnPg . To;}n] ePsf / ug'{kg]{ wf/0ffx? k|s6 ug]{ hdsf]{ u/]sf] 5' . o;df zAbdf tn–dfly ePdf d dfkmL rfxG5' .
cfhsf] ljZj df};d lbj; dgfpg] l;nl;nfdf, ljZj df};d ;+:yfn] g]kfndf lbPsf] ;xfotf, d]/f]
cg'ej / ljZj df};d lbj;sf] o; jif{sf] Theme : Weather, Climate,Water and Sustainable Development leq} af]Ng] sf]lz; ub{5' .
;j{k|yd ljZj df};d lbj; dgfpg] xfdL ;a}sf] cfhsf] O{R5f xf] . Many many returns and this type of happy day z'esfdgf kmnf];\ km'nf];\, b"wn] g'xfcf];\ .
g]kfndf pk/f]Qm h:t} theme df sfd ug]{ / u/fpg] p2]Zon] tTsfnLg hn;|f]t tyf hnjfo' lj1fg ljefu O{:jL 1966 df u7g ePsf] lyof] / ;f]xL jif{ WMO sf] ;b:otf klg k|fKt ePsf] lyof] . t/ ljefu full-fledged x'g s]xL jif{ nfUof] . pQm ljefunfO{ O{:jL 1969 dfq meteorological authority in Nepal >L % sf] ;/sf/af6 k|fKt ePsf] lyof] . To;a]nf oxfF c? b]zsf] xfd|} h:tf] sfd ug]{ ;+:yf lyof] . lqe'jg cGt/f{li6«o ljdfg:yndf cGt/f{li6«o xjfO{ oftfoftnfO{ df};d briefing ug{ Indian Meteorological Department (IMD) åf/f ;+rflnt Supplementary Meteorological Office (SMO) af6 sfd x'Fb} cfPsf] lyof] . HMG sf] tTsfnLg ljefun] clk|n 2, 1970 df dfq lqe'jg cGt/f{li6«o ljdfg:yn (TIA) df Main Meteorological Office (MMO) z'? u/]s} lbg ef/taf6 ;+rflnt SMO aGb eof] .
o:t} g]kfn clw/fHosf] ljleGg :yfgx?df sl/a–sl/a O{:jL 1950 b]lv 104 j6f Hydromet station x? IMD af6 ;+rfng u/L sfd ub}{ cfPsf lyP . tL s]Gb|x? s'g}–s'g} g]kfn–rLg l;dfgfdf Check post OToflbdf klg eO{ o;af/] high level df ;d]t s'/fx? rn]sf lyP . o;af/] O{:jL 1970 lt/ tTsfnLg ljefudf d}n] Deputy Director sf] x}l;otn] dGqLkl/ifb (cabinet) df ;d]t o;af/]df tTsfnLg hnljB't dGqfnosf >Ldfg ;lrjHo" s[i0f /fhe08f/Lsf] ;fy hfg] df}sf kfPsf] lyPF .
157
w]/} 5nkmn / lgisif{ kl5 tTsfnLg ljefuaf6 O{:jL 1970/71 / 1971/72 df g]kfnsf] hxfF–hxfF IMD sf] s]Gb|x? 5g\, ;f]xL :yfgx?df xfdLn] xfd|f] s]Gb|x? ;kmntfsf ;fy :yfkgf ug]{ sfd ;'–;DkGg ePsf lyP . IMD af6 pgLx?sf] 104 s]Gb|x? rnfpg kl5 ;Dd klg w]/} k|of; ul/of] . t/ >L % sf] ;/sf/sf] tkm{af6 s]Gb|x? :yflkt ePsf]n] IMD sf] h?/t gePsf] k//fi6« dfkm{t\ hfgsf/L u/fPkl5 la:tf/} aGb eof] . o; lsl;daf6 xfdL cfkm\gf] v'§fdf cfkm}+ pleof}+ . cfkm\gf] :j/fi6«df c?sf] cl:tTjsf] sfd x6\of] . o;df To;a]nf ljefuLo lgb]{zs >L uf]s'nnfn cdfTosf] klg k|d'v e"ldsf ePsf] hfgsf/L lbg rfxG5' . xfn;Dd klg pk/f]Qm s]Gb|x? ;'rf? ?kn] rNb} cfPsf 5g\ / o;af6 k|fKt tYof+sx? b]zsf] ljleGg ljsf;sf] sfddf k|of]u eO{ /fv]sf] /fd|/L b]Vg ;lsG5 . olx xf], g]kfndf klg lg/Gt/ rln /fv]sf] ljsf;sf] sfd xfdLn] uj{;fy eGg ;S5f}+ .
g]kfnn] weather, climate, water ;DaGwL cTofjZos tYof+sx? ;+sng u/L lg/Gt/ ljsf;u/L/fv]sf] HjnGt pbfx/0f of] ;+:yfn] :yfkgf sfnb]lv O{:jL 1987 ;Dd WMO sf] lg/Gt/ Technical Assistance ;xfotf ul/ /fv]sf] :d/0f u/fpF5' .
O{:jL 1980 lt/ WMO sf] world circulation paper df WMO sf] Technical Assistance df developing countries df ;aeGbf ;kmn /fi6« g]kfn egL sf]6 klg u/]sf] lyof],h'g k9\bf dnfO{ uj{ dxz'; ePsf] lyof] .
t/ la8Djgf Pp6f s'/f s] 5 eg] g]kfndf Department of Hydrology and Meteorology slxn] priority df k/]g, Project lbg] /fi6«, Agency tof/ ePklg b]zsf] of]hgfdf low priority n] of] ljefusf] ljsf;df w]/} jfwf c8\rg ul//fv]sf] 5 . cfjZos jh]6 gxF'bf, project gx'Fbf g]kfn /fi6«n] Pp6f Radiosonde klg /fVg ;lsPg .
d]l6of]/f]]nf]hLdf vf;u/L df};d eljioaf0fLsf] vfnL ;txsf xfjfkfgLsf] tYof+s dfq x}g ;tx eGbf dfly ljleGg prfO{x?df xfjfsf] lbzf / j]u, Pressure, tfkqmd, dewpoint temperature O{Toflbsf] tYof+s cfjZos kb{5g\ . h'g Upper air station x?af6 k|fKtx'G5g\ . o:tf s]Gb|x? ;fs{ /fi6«x?df kfls:tfgdf—!^, a+unfb]zdf–^, ef/tdf–#&, >Ln+sfdf–$, dfnlbE;df–! / To:t} l5d]sL /fi6« rLgdf () :yfgx?df 5g\ . g]kfndf z"Go .
o; cj:yfdf df};d eljioaf0fLsf] h]–hlt cg'ejx?af6 sfd ub}{ cfPsf 5g\, ax't ;/fxgLo 5g\,t}klg ;docg';f/ kl/jt{gsf] lgs} cTofjZos 5 .
g]kfndf priority kfPsf ljefux?n] j}b]lzs a}+sx?af6 lnPsf] r'n{'Dd 8'afPsf] C0f s]nfP/ x]¥of] eg], g]kfndf of]hgfsf/, cy{ljbx?, /fhgLlt1x?sf] Vj} s;n] s] d"Nofª\sg ug]{ xf] . Vj} g]kfnLsf] efUo

158
o:t} /x]5 . g]kfnLsf] la8Djgf . o;df ulxl/P/ ljrf/ ug]{ xf], sfd ug]{ xf] eg], ;a} txaf6 cfkm\gf] lglZrt ;dodf s'g}klg Project sf] monitoring and evaluation / policy df g8u\dufO{ lg:jfy{, /fi6«sf] ;]js egL sfd ug{ ;Sg'k¥of] .
s'/}–s'/fdf efif0f cGt} df]l8of] . jf:tjdf priority / low priority n] g]kfndf Hydrology / Meteorology development sf] afwf, of] s;/L a'emfpg] xf], ;DalGwt dGqfno / /fli6«o of]hgf cfof]uaf6 o;df cfjZos Wofg cfsif{0f u/fpg rfxG5' .
g]kfnsf] kl/k|]Iodf xfnsf] hnjfo' df};d lj1fg ljefusf], ljefusf] b[li6af6 w]/} ;fgf] cfsf/ ePtf klg o;sf] tYof+s / cg';Gwfgaf6 vf; u/L g]kfnsf] hn;|f]t ljsf; / s[lif ljsf;df dxTjk"0f{b]g 5 . g]kfnsf] gbLgfnfx¿ af6 /flvPsf hndfkg s]Gb|x?sf tYof+sx? cWoog ug{sf] nflu xfn} National Irrigation Sectorial Project (NISP) cGt/ut o; ljefuåf/f Strengthening the Department of Hydrology and Meteorology af6 sf7df8f}+ b]lv klZrd && j6f j]l;gdf Water Availability sf] cWoog ;'? u/L k"/f ePsf] lyof] / o:t} cWoog o; ljefuaf6 k"j{df klg x'g lgtfGt cfjZos 5 . o; lsl;dsf] cWoogaf6 ePsf tYof+sx? ;+sngdf s]–slt sdhf]/L 5g\ ca ;'wfg{ s] slt sbd rfNg'kg]{, ePsf] s]Gb|x? eGbf, c? a9L rflxg] xf] ls OToflb w]/} laZn]if0f ul/Psf x'G5g\ / cfkm"n] ul/ /fv]sf]df cfjZos ;'wf/sf dfu{x? klg c+lst u/fpF5g\ . To;sf/0f tYof+s dfq ga6'nL To;df cWoog, cg';Gwfgsf] klg lgs} vfFrf] 5 .
o:t} ljrf/n] clek|]l/t eO{ ut tLg jif{ cl3 SOHAM-Nepal, Society of Hydrologists and Meteorologists-Nepal :yfkgf eof] . of] Pp6f ljz'¢ efjgfsf] tkfO{x¿s} ;+:yf xf], o;dfg]kfnsf ljleGg :yfgx?df sfd ug'{x'g] xfn g]kfnsf] / ljb]zL d'n'sx?sf] ;d]t u/L sl/j 150 hgf Professional Hydrologists / Meteorologists sf] ;b:otf lnPsf 5g\ .
of] SOHAM ;+:yfsf] ut tLg jif{sf] :yfkgfsfn kl5, o; ljifo ;DaGwL cWoog, cg';Gwfg,;f]r / ljrf/x?nfO{ Ps–cfk;df Communicate ug{ SOHAM-Nepal n] ut tLg jif{ b]lv g} talk forum ;+rfng ub}{ cfPsf 5f}+ . cfhsf] of] fast and dynamic age df JolQm–JolQmdf ljrf/ ;fF3'l/P/ g/fvL, Pp6f ;d"xaf6} cfkm\gf] ljifo a:t'nfO{ ;fd"lxs k|rf/k|;f/ u/L b]zsf] ;jf{ª\uL0f ljsf;df s]xL ;]jf / OsfO{x?df ;do–;dodf 3r3Rofpg h?/L 7fg]sf] 5' . o:t} ljrf/af6 s[lif ljsf;df d]l6of]/f]nf]hLsf] ;DaGw ljifodf d]/f] cfkm\gf] ljz]if understanding / cle?lr;d]t ePsf]n] Ps Comprehensive package h:t} tof/ kf/L Soham-Nepal sf] Chairman sf] x}l;otn] ljleGg ;DalGwt ljefux? / ;DalGwt High level / donors df ;d]t interaction program agfO{ Talk program ;'? ub}{ cfPsf 5f}+, cfzf 5 /fd|} xf]nf, x]?+ s] x'G5 .
g]kfnsf] cGgafnLsf] ljsf;df Ps nfO{gdf eGg'kbf{ ut O{:jL 1970/71 b]lv 2000/01 cGgafnL pTkfbg / g]kfnsf] ;f]xL cjlwsf] -df};d_ dg;'g jiff{ s]nfP/ x]bf{, 1972, 76, 77, 79, 82, 86, 92,

159
94, 97 / 99 pk/f]Qm 10 jif{x?df g]kfndf ;fdfGo dg;'g jiff{ eGbf sd jiff{ x'Fbf cGgafnLdf k|ToIf c;/ k/]sf] lyof] .
o;df cGgafnLdf dfq slt gf]S;fg eof] egL d"Nodf ?kfGt/ u/L x]bf{ jif{df ? kfFr c/a eGbf a9L gf]S;fg ePsf] k|ToIf b]lvG5 . o;df d]l6of]/f]nf]hL, Hydrology sf] uxg cWoog u/L ;f] ;DaGwL ;]jf ug{ ;lsP 10% dfq cGgafnL sd x'g glbPdf ? krf; s/f]8 aRg ;lsG5 . s] o:tf] sfddf ;DalGwt OsfO{x?sf] Wofg cfs[i6 ug{ ;s"Fnf .
jf:tjdf h'ga]nf d}n] d]l6of]/f]nf]hLdf sfd u/]sf] lyPF, ;'? b]lvg} g]kfnsf] k|To]s Pu|f]d]6 s]Gb|x?df, :yfkgf, lg/LIf0f, tflndsf] l;nl;nfdf, s[liflj1x?sf] ;fy ;do–;dodf ljrf/sf] cfbfgk|bfg eO{g} /fv]sf] lyof] . vf; u/L O{:jL 1980 sf] bzsdf g]kfnsf] Station design of First Irrigation Manual, LRMP, Agro forestrysf] 8s'd]G6x? tof/ u/]sf] a]nf ljb]zL ;Nnfxsf/x? ;Fu w]/} lgs6 ;DaGwx? sfod ePsf lyP . s'g} klg s[lif ljefusf] 7"nf] ;ef, Conference, ;fy} NARCsf] hu xfn]sf] a]nf;d]t lgDtf]df efu lnO{ ;Dks{ eO{g} /fv]sf lyP . t/ xfn 1988 kZrft\ xfn;Dd s[liftkm{ ;Dks{ z"Gotf, 5fPsf] b]lvof], a'lemof] .
xfn Climate Change df vf; u/L s[lifsf] adaptation df o; lsl;dsf] eljio Predict ug{, past / present scenario df vf; u/L agrometeorological aspect df xfdLn] s]–s:tf] practical cWoog u/]sf 5f}+, x]g'{k5{, d]/f] cg'ejdf o;df z"Gok|foM 5 . o;sf/0f clxn]sf] jf:tljstf a'em\g] k|of; u/L Weather and their impacts on agriculture cWoog u/f}+, clg o;sf] cfwf/df eljiosf] prediction u/f}+ . Without proper understanding of present scenario, future prediction will be uncertain .vfnL project for project df ePsf] /sd afn'jfdf g/fvf}+ .
o:t} WMO df Secretary General n] o;} WMO Day df ;Daf]wg ug'{ePsf] jfSox? h:tf] "Another outstanding development is the seasonal prediction of phenomena such as EL Nino and La Nino. Thanks to the enhance knowledge and network of facilities that are available today it is possible to produce useful forecasts to such phenomena a few months to a year ahead"
g]kfndf s[lifdf kg]{ k|ToIf c;/x?df SOHAM-Nepal sf] sfd ug{ ;Sg] Ifdtf 5,o;df ;]jf lbg HMG nfO{ s:tf] Support rflxof], To;df ;xefuL eO{ sfd ug{ tof/ 5f}+ .
cGTodf, of] ;+:yfaf6 World Meteorlogical Day 2004 df 1st Journal of Hydrology and Meteorology sf] ljdf]rg xfn oxL ;ef ;+rfng ub}{ cfpg'ePsf lj1fg tyf k|ljlw dGqfnosf ;lrjHo" 8f= >L :joDe"dfg cdfToaf6 ePsf] :d/0f ug{ rfxG5' . of] ;fn klg bf];|f] issue k|sflzt ug{ x/;Dej k|of; ul/Psf] lyof], of] ;fn SAARC Countries af6 ;d]t n]vx? k|fKt ePsf] / n]vx? 12 j6f 5g\ . o;df cfjZos review OToflbn] ubf{ a9L ;do lnPsf] 5, t}klg j}zfvdf
160
k|sflzt u/L ca cfpg] SOHAM-Nepal sf] jflif{s ;efdf ;a} ;b:o dxfg'efjx? ;dIf k'¥ofpg] nIo /flvPsf] 5 . o;df n]vx¿ lbO{ ;xof]u ug]{ ;a} contributers / reviewers ul/lbg' x'g] ;a} dxfg'efjx?nfO{ x[bo b]lvg} wGojfb lbg rfxG5' .
cGTodf WMO sf] Theme cg';f/ b]z ljsf;sf] sfddf Ps O{+§f eP klg yKg O{Zj/n] xfdL ;a}nfO{ ;b\a'l¢ lbpg\ / s]xL u/f}+ eGg] ;sf/fTds ;f]r /fvf}+ . ;d"xdf afFRg] k|of; u/f}+, /fli6«otf hf]ufcf}+ . olt a]nf b'O{ zAb oxLF 6'+UofpF5' .
wGojfb Û
23 dfr{ 2005 8f= hgs nfn gfoafsf7df8f}+, g]kfn Chairman Society of Hydrologists and Meteorologists-Nepal
161
Further works and references on Climates of Nepal
Climates of Nepal were written during 1974 and this is my fi rst article in my life. In this article, I had described the very preliminary description of a climate in Nepal. Later, in late 1970’s, in my Ph.D. thesis on “Climates of Nepal and their implications on agricultural development” the classifi cation of rainfall and temperature regimes of 30 groups (as shown in Fig. xx) have been determined using computer software by Taxon methodology (1971). These regimes in groups yields homo climates which can be useful in many ways, such as investigating the climate and vegetation interaction in transferring new high yielding varieties (HYV) to similar sort of climates (rainfall and temperature regimes). The analysis of major rainfall and temperature indicates that the fi rst two regimes lie in Tarai and inner Tarai; the third, fourth and fi fth regimes lie in the Hill and sixth in the Mountain. Broadly the fi rst two regimes lie in the “tropical climate”, the next three in its “mesothemal” and the last in its “microthermal climate”. This analysis has used the meteorological station only up to 3857 m, Tengboche. So, naturally, other climatic types dominate above this altitude. Since snow line is subject to great local variations ranging from 4500 m to 6000 m (Hagen, 1961), the altitude above Tengboche and below the snow line can be called the taiga and above the snow line can be called alpine climate.
Barros, A. P, Joshi, M, Putkonen, J, and Burbank, D. W. 2000. A study of the 1999 monsoon rainfall in a mountainous region in central Nepal using TRMM products and rain gauge observations, Geophy. Res. Lett., 27(22), 3683–3686
Barros, A. P. and Lang, T. 2003a. Monitoring the monsoon in the Himalayas: observations in central Nepal, June 2001, Monthly Weather Review, 131, 1408–1427
Barros, A. P. and Lang, T. 2003b. Exploring Spatial Modes of Variability of Terrain-Atmosphere Interactions in the Himalayas during Monsoon Onset, Hydro-Sciences Report Series 03–001, Environmental Sciences and Engineering Program, Division of Engineering and Applied Sciences, Harvard University, 51
Chataro Nakajima, Shrestha, M.L. and Basnyat, M.B. 1976. Synoptic analysis of the precipitation over Nepal and India, Journal of the Japanese Society of Snow and Ice, Vol. 38, Special Issue, March, pp.50-58
Note: A study of climate and its changes have also dealt in Journal of the Japanese Society of Snow and Ice, Vol. 38, Special Issue, March 1976.
CREH, Cryosphere Research in the Himalayas, 2001. Collected papers on Glaciers in the Himalayas, CREH Published in 1994-2001 by members of Institute for Hydrospheric- atmospheric sciences, Nagoya University
Devkota, L. P. 2001. Climate variability over observation, forecasting modal evaluation and impacts on agriculture and water resources, Ph. D. Thesis, Tribhuvan University, Kathmandu, pp. 180
Devkota, L.P. 2004. Atmospheric heating over sub-Himalayan regions during active and break phases of summer monsoon, Journal of Hydrology and Meteorology, Vol. 1, pp. 45-54

162
Devkota, L. P. and Quadir, D. A. 2006. Long Range Forecasting (LRF) of monsoon rainfall in Nepal, August 2006, SMRC – No. 20.
Devkota, L. P, Baidya, S. K. and Quadir, D. A. 2008. Climate variability of Nepal, 2008, SMRC - No. 23.
Gill, G. J, Hobbs, P.R. and Shrestha, M.L. 1998. Possible Impact of the current El Nino event on Nepal’s 1998 Paddy crops, His Majesty’s Government of Nepal, Ministry of Agriculture/ Winrock International-Policy Analysis in Agriculture and Related Resources Management. Series No. 1.
Hydro Engineering Consultancies Ltd., 2004. Intensity of rainfall, Report for Department of Hydrology and Meteorology
ICIMOD, Climatic and Hydrological Atlas of Nepal, Kathmandu, 1996
Jackson, J.K. 1987. Manual of Afforestation in Nepal. Nepal UK Forestry Research Project pp 402
Manandhar, K.B.2006. The fog episode in Southern Terai plains of Nepal: some observations and concepts, Journal of Hydrology and Meteorology, Vol. 5, pp.95-101
Nayava, J.L. 1974. The summer monsoon in Nepal and southern Asia, M.Sc. dissertation, Birmingham University, England
Nayava, J.l. 1981. Climates of Nepal and their implications to Agricultural Development, Ph.D. Thesis, The Australian National University, Canberra ACT
Nazrul, I., and Das, S., Ahsan, N., Rahman, M., Hasana, S. A., Devkota, L. P., Baidya, S. K. and Budhathoki, K. P. 2009. Drought Diagnosis and Monitoring over Bangladesh and Nepal, July 2009, SMRC-No. 26,
Rajbahak, M. and Shrestha, R.P. 2005. A diagnostic study of onset and withdrawal of summer monsoon in Nepal, 2003, Journal of Hydrology and Meteorology, Vol. 1, pp.8-15
Shrestha, R. P. 2004. Break and active monsoon over Nepal, Journal of Hydrology and Meteorology, Vol. 1, pp. 74-80
Regmi, S.K. 2005. Heavy monsoon rainfall: a case study of July, 2003 with reference to synoptic perspective in Nepal, Journal of Hydrology and Meteorology, Vol. 1, pp.24-33
Regmi, S.K. and Kansakar, R.S. 2008. Synoptic study associated with cyclonic storm following heavy avalanches of November 1995 in Khumbu Region, Journal of Hydrology and Meteorology, Vol. 1, pp. 62-
Shrestha, A.B, Wake, C.P, Mayawski, P.A. and Dibb, J.E. 1999. Maximum temperature trends in the Himalaya and its vicinity: An analysis based on temperature records from Nepal for the period 1971-94, In Journal of climate, 12: pp.2775-2787

163
Shrestha, A.B, Wake, C.P, Mayawski, P.A. and Dibb, J.E. 2000. Precipitation uctuation in the Himalaya and its vicinity: An analysis based on temperature record from Nepal. Intl. Journal of Climate, 20, pp.317-327
Shrestha, A.B. and Devkota, L.P. Climate Change in the Eastern Himalayas: Observed trends and model Projections, Technical Report 1, International Centre for Integrated Mountain Development (ICIMOD), 2010
Shrestha, M. L. 2000. Inter-annual variation of summer monsoon rainfall over Nepal and its relation to Southern Oscillation Index, Meteorology and Atmospheric Physics, Austria, Vol. 75, pp. 21-28.
Tahal Consulting Engineers Ltd., In association with GEOCE, ARMS and CEMAT, 2003 Final Report, Technical Report no. 4, Meteorological Study. Report for Institutional Development of Department of Hydrology and Meteorology, Nepal Irrigation Project, credit no. 3009 Nep.
UNFCC, 2004 First National communication report on climate change in Nepal
Upadhyay, B.P. 1984. Water balance of Nepal with reference to water resources and agriculture development, Ph.D, thesis, Department of Meteorology and Oceanography, Andhra University, India, pp. 320
Vaidya, S.K., Shrestha, M.L. and Sheikh, M.M. 2008. Trends in daily climatic extremes of temperature precipitation of Nepal, Journal of Hydrology and Meteorology, Vol. 5, pp. 38-53

164
Fig. xx Dendrogram of 30 groups of MULCLAS classi cation of 168-meteorological station network
2 GROUPS
3 GROUPS
4 GROUPS
6 GROUPS 331
328
318
312
320
314
327
322
309313
307 310315
324
323326
319321
304 292 303 242 291 293 298 301 30 276 306 284 280 282 290 281 285 299 300 305 144 295 287 93 100 77 302 297 286 171 2 3 4 5 6 7 8 9 10 11 12 13 14 15 16 17 18 19 20 21 22 23 24 25 26 27 28 29 30
324
316311
333
334
332
329
323

CLIMATES OF NEPAL AND THEIR IMPLICATIONSWWW.WWFNEPAL.ORG
- Janak Lal Nayava Shrestha
NP
© 1986 Panda Symbol WWF-World Wide Fund For Nature(also known as World Wildlife Fund)® “WWF” is a WWF Registered TrademarkWWF Nepal, P. O. Box: 7660, Baluwatar, Kathmandu, NepalT: +977 1 4434820, F: +977 1 4438458, E: [email protected]
Why we are here
www.wwfnepal.org
To stop the degradation of the planet’s natural environment andto build a future in which humans live in harmony with nature.
WWF is in over 100 countries, on 5 continents
WWF was founded in 1961
WWF has over 5,000 staff worldwideWWF has over 5 million
supporters
+100
+5,000+5M
1961 2012
REPORT
NP
CLIMATES OF NEPALAND THEIR IMPLICATIONS...
rabi.sharma
Typewriter
ISBN 978-9937-854-7-7


![[Urban Management Program City Paper : Kathmandu, Nepal]](https://static.fdocuments.net/doc/165x107/55862592d8b42a4c578b4630/urban-management-program-city-paper-kathmandu-nepal.jpg)


![[Waterworks] City Presentation - Kathmandu(Nepal)](https://static.fdocuments.net/doc/165x107/557c65b1d8b42a757c8b50e4/waterworks-city-presentation-kathmandunepal.jpg)