
Climate-smart food systems
19
Climatesmart food systems Sonja Vermeulen John R. Porter and Eskild Bennetzen Department of Plant and Environmental Sciences University of Copenhagen Montpellier March 1618, 2015
-
Upload
ccafs-cgiar-program-climate-change-agriculture-and-food-security -
Category
Environment
-
view
330 -
download
0
Transcript of Climate-smart food systems

Climate-‐smart food systems
Sonja Vermeulen John R. Porter and Eskild Bennetzen Department of Plant and Environmental Sciences
University of Copenhagen
Montpellier March 16-‐18, 2015
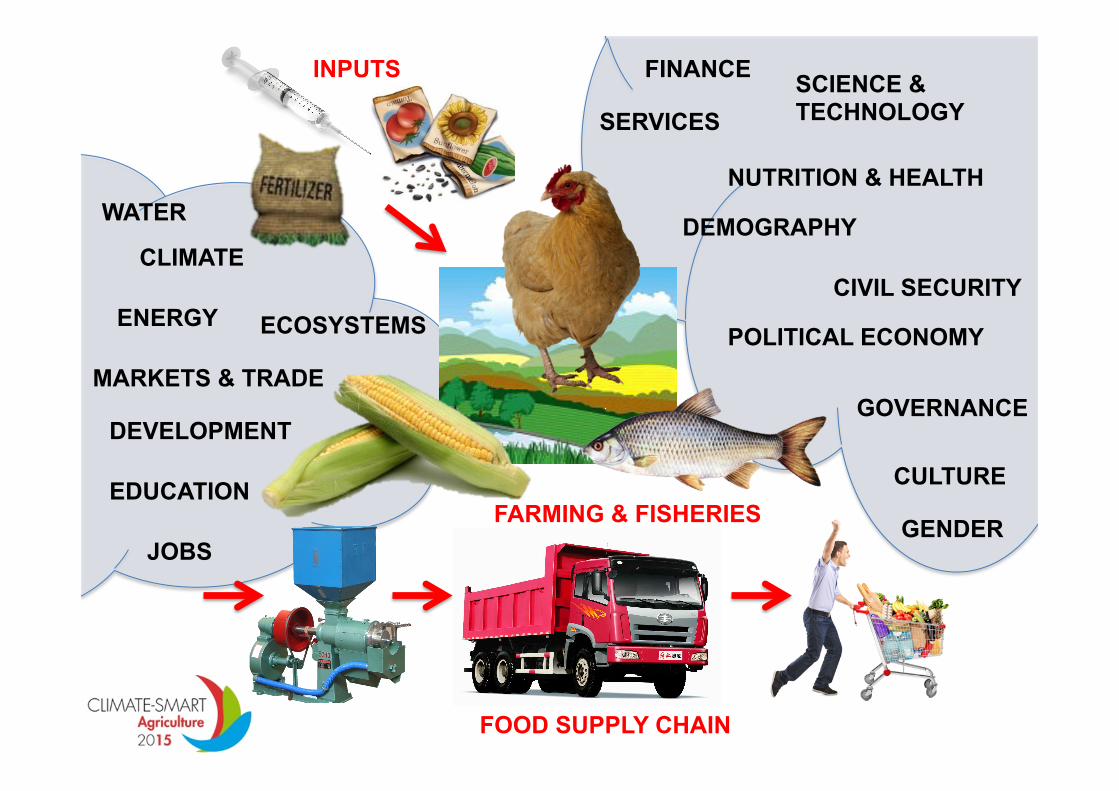
FOOD SUPPLY CHAIN
INPUTS
FARMING & FISHERIES
ECOSYSTEMS
JOBS
CLIMATE
ENERGY
MARKETS & TRADE
DEVELOPMENT
WATER
EDUCATION
POLITICAL ECONOMY
GOVERNANCE
NUTRITION & HEALTH
CIVIL SECURITY
CULTURE
SCIENCE & TECHNOLOGY
DEMOGRAPHY
FINANCE
SERVICES
GENDER

1 No need for Climate-Smart Food Systems! Agriculture alone can achieve all three CSA goals at global level.
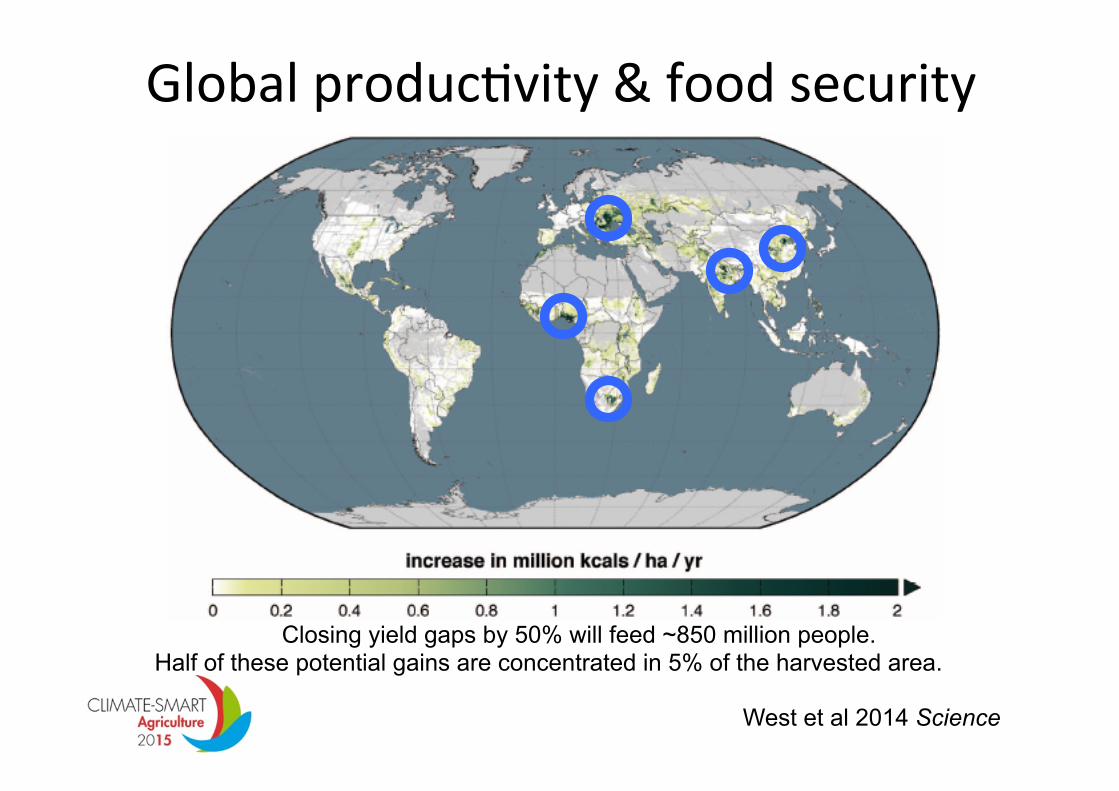
West et al 2014 Science
Closing yield gaps by 50% will feed ~850 million people. Half of these potential gains are concentrated in 5% of the harvested area.
Global producNvity & food security

Global adaptaNon
Challinor et al 2014 Nature Climate Change
Meta-analysis of model results finds that, globally, adaptations (e.g. different cultivars, agronomy) compensate for crop yield losses due to changes in climatic means.
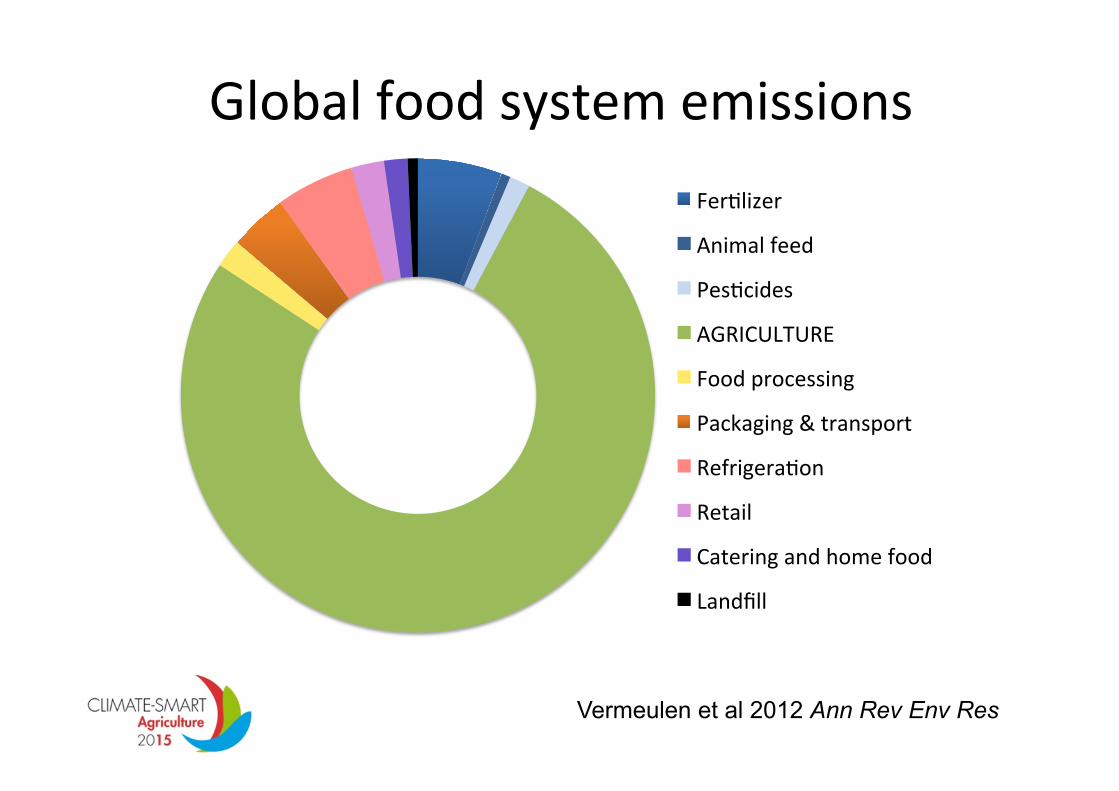
Global food system emissions FerNlizer
Animal feed
PesNcides
AGRICULTURE
Food processing
Packaging & transport
RefrigeraNon
Retail
Catering and home food
Landfill
Vermeulen et al 2012 Ann Rev Env Res

Global trends in ag emissions
Bennetzen, Smith and Porter, forthcoming

2 Really so simple? Or does change in agriculture need change in food systems?

Trade for food security & adaptaNon?
South
Sudan
Libya
Prevalence of undernourishment in the population (percent) in 2012-14
It costs as little
as US 25 cents a day
to feed a hungry child
and change her life
forever.
About 805 million
people, or 1 in 9 of the
world’s population,
go to bed hungry
each night.
We can achieve
Zero Hunger in our
lifetimes. In the world
today, we have the
knowledge, tools and
policies to feed
everyone.
***
Very low
<5%
Moderately low
5-14,9%
Moderately high
15-24,9%
High
25-34,9%
Very high
35%
and over
Missing
or insufficient data
***
State of Palestine
The map shows the prevalence of undernourishment in the population of developing countries as of 2012-14. The indicator measures
the probability that a randomly selected individual in the population is consuming an amount of dietary energy, which is insufficient to
cover her/his requirement for an active and healthy life.
Source: FAO, IFAD and WFP. 2014. The State of Food Insecurity in the World 2014. Strengthening the enabling environment for
food security and nutrition. Rome, FAO. Further information is available at www.fao.org/publications/sofi/en/
Undernourishment data source: FAO Statistics Division (ESS) - www.fao.org/economic/ess
© 2014 World Food Programme
The designations employed and the presentation of material in this map does not imply the expression of any opinion whatsoever on the part of WFP concerning the legal
or constitutional status of any country, territory or sea area, or concerning the delimitation of frontiers.
* Dotted line represents approximately the Line of Control in Jammu and Kashmir agreed upon by India and Pakistan. The final status of Jammu and Kashmir has not
yet been agreed upon by the parties.
** A dispute exists between the governments of Argentina and the United Kingdom of Great Britain and Northern Ireland concerning sovereignty over the
Falkland Islands (Malvinas).
*** Final boundary between the Republic of South Sudan and the Republic of Sudan has not yet been determined.
Data for the Republic of South Sudan and the Republic of Sudan for the years 2012-14 are not reliable and are not reported.
Brunei
Darussalam
Comoros
Seychelles
Hunger Map 2014
Yield gap hotspots
WFP e.g. Liu et al Global Environmental Change 2014

Trade-‐offs: trade versus miNgaNon & other environmental factors
deforestation nitrogen transfers
Lassaletta et al 2014 Biogeochemistry Schmitz et al 2012 GEC Also see Lambin & Meyfroidt 2011

Achieving global emissions reducNons?
Bennetzen, Smith and Porter, forthcoming
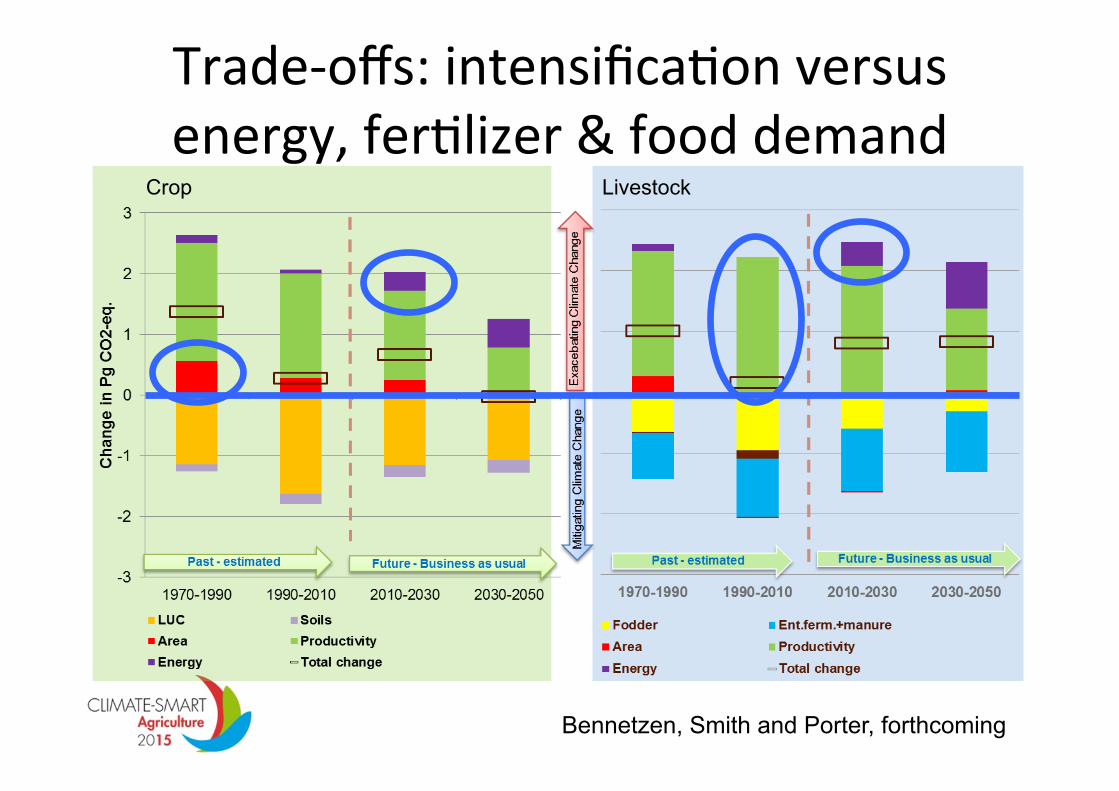
Crop Livestock
Trade-‐offs: intensificaNon versus energy, ferNlizer & food demand
Bennetzen, Smith and Porter, forthcoming

ReducNons require demand restraint (over-‐consumpNon, diets, waste)
Tilman & Clark 2014 Nature Also see Bajželj et al 2014
Nutritional quality of diets around the world
Imamura et al 2015 Lancet
BA
U
MED
I
FISH
VEG

Trade-‐offs: sustainability versus nutriNon & food prices
Photo: Vivek Prakash
If prices go up 10%, consump:on goes down:
High income country
Low income country
Cereals 4 % 6 % Meat 6 % 8 % In all cases poor households are worst affected.
Green et al 2013 BMJ
3
Transformation is possible. Food systems are changing incredibly fast. Even ahead of “climate-smart” actions, there are multiple entry points for Climate-Smart Food Systems.

Consumers’ food preferences change rapidly – and drive the whole system.
e.g. Trends in meat consumption in USA
data from USDA
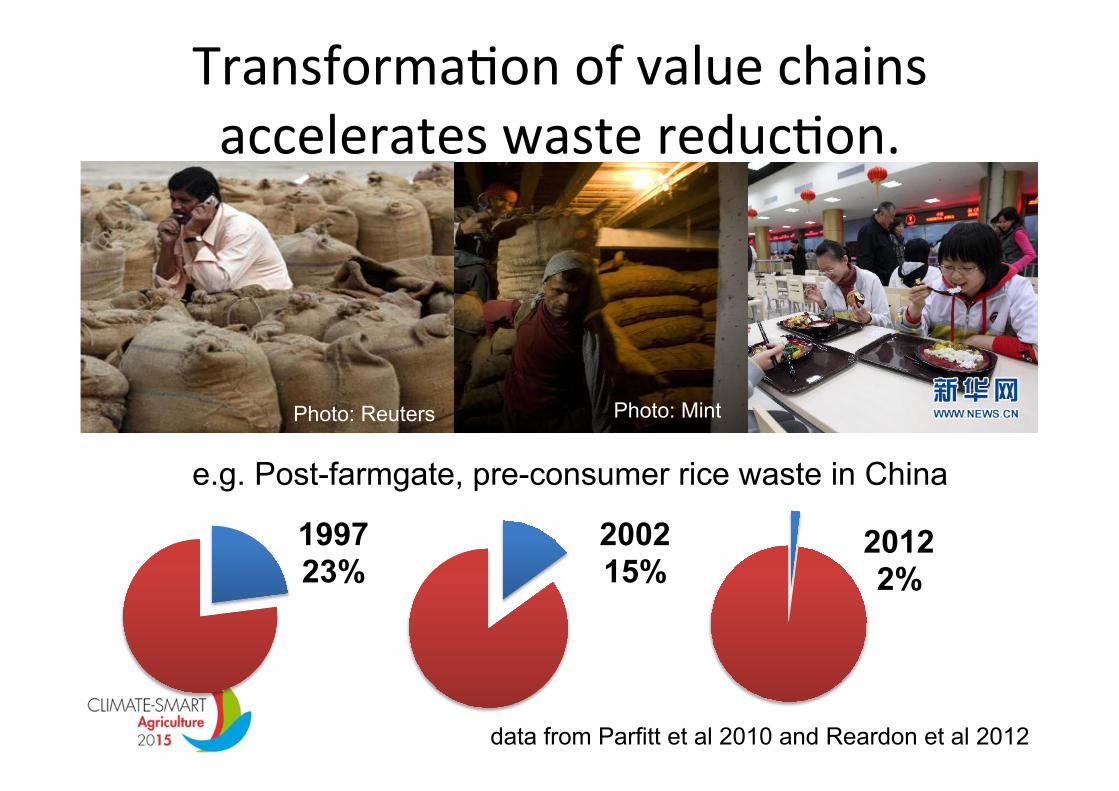
TransformaNon of value chains accelerates waste reducNon.
Photo: Mint Photo: Reuters
data from Parfitt et al 2010 and Reardon et al 2012
2002 15%
e.g. Post-farmgate, pre-consumer rice waste in China
1997 23%
2012 2%
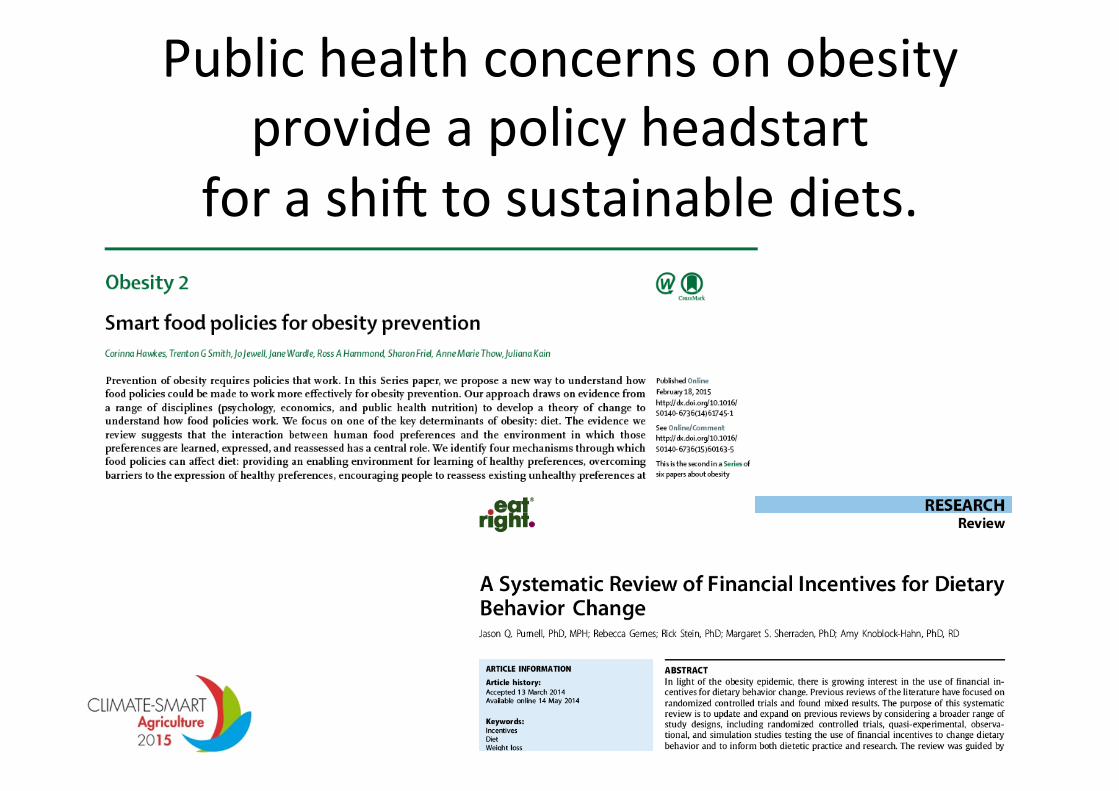
Public health concerns on obesity provide a policy headstart
for a shic to sustainable diets.


