Climate Resilient Green Growth (CRGG) Planning Framework · CALABARZON Cavite, Laguna, Batangas,...
170
Climate Resilient Green Growth (CRGG) Planning Framework
Transcript of Climate Resilient Green Growth (CRGG) Planning Framework · CALABARZON Cavite, Laguna, Batangas,...

Climate Resilient Green Growth (CRGG)Planning Framework

The Global Green Growth Institute (GGGI) is grateful to have collaborated with the Climate Change Commission (CCC) of the Government of the Philippines in completing the final report on the Climate Resilient Green Growth (CRGG) Planning Framework.
The technical team composed of individuals from GGGI and the Stockholm Environment Institute (SEI) have worked together toward completion of this report: Yongsung Kim (GGGI), Chiden Balmes (GGGI), David Von Hippel (SEI), William Dougherty (SEI), Bernadette Resurrección (SEI), and Michael Boyland (SEI).
Furthermore, much appreciation is extended to the following contributors: Joyceline Goco (CCC), Helena Gaddi (CCC), Alexis Lapiz (CCC), Harrier Tauli (CCC), Cari Espenesin (CCC), Hyoyoul Kim (GGGI), Rhoel Bernardo (GGGI), and Eryn Gayle de Leon (GGGI).
In gaining valuable inputs regarding the applicability of the framework on the ground, GGGI is heavily indebted to the representatives of various agencies that composed the National Project Advisory Committee (NPAC) of the CRGG Project namely: the Department of the Interior and Local Government (DILG), National Economic and Development Authority (NEDA), Department of Trade and Industry (DTI), Department of Environment and Natural Resources (DENR), Department of Science and Technology (DOST), Department of Finance (DOF) as well as the representatives from the participating provinces of Palawan and Oriental Mindoro.
This report was made possible through the shared leadership provided by Secretary Mary Ann Lucille Sering (CCC), Myung Kyoon Lee (GGGI), and Per Bertilsson (GGGI).
ISBN 979-11-952673-2-3
Copyright © 2015
Global Green Growth Institute19F Jeongdong Building, 21-15 Jeongdong-gil, Jung-gu, Seoul, 100-784, Korea
The Global Green Growth Institute does not make any warranty, either express or implied, or assumes any legal liability or responsibility for the accuracy, completeness, or any third party’s use or the results of such use of any information, apparatus, product, or process disclosed of the information contained herein or represents that its use would not infringe privately owned rights. The text of this publication may be reproduced in whole or in part and in any form for educational or nonprofit uses, provided that acknowledgement of the source is made. Resale or commercial use is prohibited without special permission. The views and opinions of the authors expressed herein do not necessarily state or reflect those of the Global Green Growth Institute.
Cover Image © KieferPix - Shutterstock, Inc.
Acknowledgement
Climate Resilient Green Growth (CRGG)Planning Framework

I
Abbreviations and Acronyms
ADB Asian Development Bank ADW Alliance Development Works ANECs AffiliatedNon-ConventionalEnergyCentersARMM AutonomousRegioninMuslimMindanaoBAU Business As Usual CALABARZON Cavite,Laguna,Batangas,Rizal,QuezonCARE CooperativeforAssistanceandReliefEverywhereCCA ClimateChangeAdaptationCCC ClimateChangeCommission–PhilippinesCCVI ClimateChangeVulnerabilityIndexCDP ComprehensiveDevelopmentPlanCLUP ComprehensiveLandUsePlanCLWUP ComprehensiveLandandWaterUsePlanCRGG ClimateResilientGreenGrowthCRiSTAL Community-basedRisk-ScreeningTool–AdaptationandLivelihoodsCSO CivilSocietyOrganizationDA DepartmentofAgricultureDANIDA DanishInternationalDevelopmentAgencyDENR DepartmentofEnvironmentandNaturalResourcesDepEd DepartmentofEducationDFID UnitedKingdomDepartmentforInternationalDevelopmentDoH DepartmentofHealthDOST-PAGASA DepartmentofScienceandTechnology–PhilippineAtmospheric,GeophysicalandAstronomicalServicesAdministrationDPSIR Drivingforce-Pressure-State-Impact-ResponseDPWH DepartmentofPublicWorksandHighwaysDRR DisasterRiskReductionEC-LEDS EnhancingCapacitiesforLowEmissionDevelopmentStrategiesENRA EnvironmentandNaturalResourceAccountingEO ExecutiveOrderESSC EnvironmentalScienceforSocialChangeFAO FoodandAgricultureOrganizationoftheUNFDI ForeignDirectInvestmentFIES FamilyIncomeandExpenditureSurveyG2A2 GreenGrowthActionAllianceGDI GenderDevelopmentIndexGDP GrossDomesticProductGEM GenderEmpowermentMeasureGGGI GlobalGreenGrowthInstituteGGGI-PPO GlobalGreenGrowthInstitute–PhilippinesProjectOfficeGHG GreenHouseGas/GasesGIZ DeutscheGesellschaftfürInternationaleZusammenarbeitHa Hectares HLURB HousingandLandUseRegulatoryBoardIEA InternationalEnergyAgencyIFRC InternationalFederationofRedCrossandRedCrescentSocietiesIISD InternationalInstituteforSustainableDevelopmentIP IndigenousPeopleIPCC IntergovernmentalPanelonClimateChangeIRRI InternationalRiceResearchInstituteLDC LeastDevelopedCountryLEAP Long-rangeEnergyAlternativesPlanning

II
LGC LocalGovernmentCodeLGU LocalGovernmentUnitM&E MonitoringandEvaluationMCA MultiCriteriaAnalysisMDGs MillenniumDevelopmentGoalsMGB MinesandGeosciencesBureauMIMAROPA Mindoro,Marinduque,Romblon,PalawanMMTDP MunicipalMediumTermDevelopmentPlansMPI MultidimensionalPovertyIndexMVA ManufacturingValueAddedNAMRIA NationalMappingandResourceInformationAuthorityNAPA NationalAdaptationProgrammeofActionNCCAP NationalClimateChangeActionPlan2011-2028NCR NationalCapitalRegionNDRRMC NationalDisasterRiskReductionandManagementCouncilNEDA NationalEconomicandDevelopmentAuthorityNFSCC NationalFrameworkStrategyonClimateChange2010-2022NGO Non-GovernmentalOrganizationNPAC NationalProjectAdvisoryCommitteeNRA NaturalResourceAccountingODI OverseasDevelopmentInstituteODS OzoneDepletingSubstancesOECD OrganisationforEconomicCo-operationandDevelopmentPCG ProvincialConsultativeGroupPCSD PhilippineCouncilforSustainableDevelopmentPDP PhilippineDevelopmentPlan2011-2016PDPFP ProvincialDevelopmentandPhysicalFrameworkPlanPDPO ProvincialDevelopmentPlanningOfficerPEENRA PhilippineEconomic-EnvironmentalandNaturalResourcesAccountingPhP PhilippinePesoPMU ProjectManagementUnitPOEA PhilippineOverseasEmploymentAdministrationPPDO ProvincialDevelopmentPlanningOfficePPP PurchasingPowerParityPPT ProvincialProjectTeamsPSA-NSCB PhilippineStatisticsAuthority-NationalStatisticalCoordinationBoardSBSTA SubsidiaryBodyforScientificandTechnologicalAdviceSDGs SustainableDevelopmentGoalsSLR Sea-LevelRiseSMEs SmallandMediumEnterprisesUKCIP UnitedKingdomClimateImpactsProgrammeUN UnitedNationsUNCTAD UnitedNationsConferenceonTradeandDevelopmentUNDP UnitedNationsDevelopmentProgrammeUNEP UnitedNationsEnvironmentProgrammeUNESCAP UnitedNationsEconomicandSocialCommissionforAsiaandthePacificUNFCCC UnitedNationsFrameworkConventiononClimateChangeUNIDO UnitedNationsIndustrialDevelopmentOrganizationUNPEI UnitedNationsPoverty-EnvironmentInitiativeUNU-EHS UnitedNationsUniversity–InstituteforEnvironmentandHuman SecurityUSAID UnitedStatesAgencyforInternationalDevelopment

III
Table of Contents
Abbreviations and Acronyms ..............................................................................................................................................ITable of Contents ......................................................................................................................................................................IIIList of Figures .............................................................................................................................................................................VList of Tables ...............................................................................................................................................................................VI
Executive Summary .................................................................................................................................................................. 1
1. Introduction ............................................................................................................................................................................ 61.1 Opportunities, Benefits, and Challenges Associated with Adaptation Planning in the Philippines 91.2 Summary of Ecotown Phase 1 Process, Findings, and Challenges, and Lessons for the Phase 2 CRGG Methodology 131.3 Goals, Objectives and Guiding Principles of the Philippines Phase 2 Ecotown Climate Resilient Planning Framework 141.4 Implementation Mechanisms for CRGG Options 161.5 “Road Map” to the Remainder of this Framework Document 16
2. Climate Change and Economic Development Planning in the Philippines ..............................................182.1 Climate-related Hazards in the Philippines 192.2 Philippine Government Action on Climate Change and Development 19
3. Methodology and Summary of Background Literature Used to Develop the Phase II Climate Resilient Green Growth Planning Framework ................................................................... 22
3.1 Introduction 233.2 Summary of relevant literature on integrating adaptation and economic development planning 233.3 Methodology Used to Develop the CRGG Framework 33
4. Presentation of Ecotown Phase 2 CRGG Planning Framework .....................................................................344.1 Step 1: Project Organization 364.2 Step 2: Rapid Assessment: Provincial Profile, Climate Projections, Resource Base, and Economic Development 424.2.1 Research and Assemble Socio-Economic and Gender Provincial Profile 424.2.2 Compile Climate Projections and Recent Disasters 434.2.3 Characterize Natural Asset Base 444.2.4 Identify Local Development Plans and Trends 444.2.5 Possible Outputs of Step 2 454.2.6 Potential Step 2 Entry Point for Mitigation Planning 474.3 Step 3: Identification of Key Existing Economic Development Paths and Their Resource Needs 484.3.1 Introduction and Premises 484.3.2 Overview of the approach 504.3.3 Adaptation-related areas 524.3.4 Socioeconomic indicators 534.3.5 Baseline Development Pathway Matrix 544.3.6 Potential Step 3 Entry Point for Mitigation Planning 564.4 Step 4: Assessment of Potential Climate-related Hazards, Impacts, and Vulnerabilities, and Mapping to Development Paths (Adaptation Analysis) 564.4.1 Hazard Assessment 574.4.2 Impact Assessment 59

IV
4.4.3 Vulnerability Assessment 624.4.4 Potential Step 4 Entry Point for Mitigation Planning 644.5 Step 5: Identification and Prioritization of Adaptation Measures 644.5.1 Review Literature and Conduct Discussions with Experts on Existing Adaptation Options 654.5.2 Identify Additional Potential Adaptation Measures/Options for Province 664.5.3 Prioritize Potential Adaptation Measures/Options for Province 684.5.4 Potential Step 5 Entry Point for Mitigation Planning 694.6 Step 6: Prepare and Evaluate Adaptation/Economic Development Paths 704.6.1 Prepare Adaptation/Economic Development Path(s) 714.6.2 Evaluation of Adaptation/Economic Development Path(s) 714.6.3 Identify “Optimal” Path 734.6.4 Potential Step 6 Entry Point for Mitigation Planning 734.7 Step 7: Implementing Identified Adaptation Measures/Options (“Mainstreaming”) in Concert with Economic Development 744.7.1 Elaborate priority adaptation options as a part of an overall development/adaptation plan 754.7.2 Implement Plans 764.7.3 Monitor, Evaluate, and Revise Implementation of Measures as Needed 764.7.4 Update Plan on a Regular, Periodic Basis 774.7.5 Potential Step 7 Entry Point for Mitigation Planning 77
5. Conclusion and “Next Steps” in Framework Development and Application ............................................805.1 Objective of the CRGG Framework 815.2 Potential Limitations of CRGG Framework 815.3 Next Steps in CRGG Framework Development and Application 82
Glossary ...................................................................................................................................................................................... 83
Literature Cited ...................................................................................................................................................................... 87
Annex A ......................................................................................................................................................................................93 Annotated Bibliography
Annex B ...................................................................................................................................................................................102 Full Review of Literature
Annex C ....................................................................................................................................................................................141 List and description of key illustrative adaptation/development measures, options, and tracks
Annex D ...................................................................................................................................................................................157 Illustrative Listing of Data Required for CRGG Planning at the Provincial Level, and Examples of Potential Sources of Information
Annex E ....................................................................................................................................................................................159 Illustrative Listing of Actors and Institutions to be Involved in Plan Implementation, and Illustrative Process for Plan Implementation
V
List of Figures
Figure ES-1 OverallStagesandStepsinCRGGPlanningFramework .......................................................................... 3
Figure 1-1 ConceptualRelationshipbetweenEcotownPhase2CRGGGoalsandInputs ..............................9
Figure 1-2 UnderlyingObjectivesofCRGGandRelatedApproaches ...................................................................... 9
Figure 1-3 PrioritiesandOutcomesofNCCAPImplementation .............................................................................. 10
Figure 1-4 LocalPlanningStructure ......................................................................................................................................... 12
Figure 3-1 OECDFrameworkforMainstreamingAdaptation ................................................................................... 23
Figure 3-2 ThePoverty-environmentApproachtoMainstreamingAdaptationintoDevelopment ........24
Figure 3-3 TheCRiSTALFramework ....................................................................................................................................... 25
Figure 3-4 MethodologicalapproachfordevelopmentoftheCRGGFramework............................................ 33
Figure 4-1 OverallStagesandStepsinCRGGPlanningFramework ....................................................................... 35
Figure 4-2 GroupsInvolvedinCRGGPlanningEffortandTheirRoles .................................................................. 41
Figure 4-3 ConceptualizationoftheDevelopmentPathways..................................................................................... 49
Figure 4-4 SequenceofstepsforcharacterizingtheBaselineDevelopmentPathway................................... 50
Figure 4-5 InputsfromSteps2and3toStep4,andStep4OutputstoStep5,
intheCRGGPlanningFramework..................................................................................................................... 57
Figure 4-6 Componentsofclimatechangevulnerability ............................................................................................... 62
Figure 4-7 Top-downandbottom-upapproachestovulnerabilityassessment .................................................. 64
Figure 4-8 AnalyticalElementsofStep5:DevelopmentandPrioritizationofAdaptationOptions ........65
Figure 4-9 ElementsofStep6,NotingInputsfromStep5andOutputsto
Step7oftheCRGGPlanningFramework ..................................................................................................... 71
Figure 4-10 InputstoandElementsofStep7:
ImplementingIdentifiedAdaptationMeasures/Options ....................................................................... 74

VI
List of Tables
Table 3-1 ExampleEvaluationCriteriafortheSelectionandPrioritizationof
AdaptationResponses ................................................................................................................................................. . 27
Table 3-2 LocalInformationforAdaptation,andExamplesofDataGatheringand
OrganizingTools ................................................................................................................................................. ............. 30
Table 3-3 EntryPointsfortheIntegrationofAdaptationintoDevelopmentPlanningLevels ........................ 31
Table 4-1 ExamplesofKeyPlanningObjectives .................................................................................................................... 37
Table 4-2 IllustrativeRoles/ExpertiseforCRGGPlanningTeamMembers(Provincial) .................................. 39
Table 4-3 ComparisonofCRGGFrameworkPlanningGroups/Roleswiththose
IdentifiedinEcotownPhase2Proposals ............................................................................................................ 41
Table 4-4 OverallstructureoftheBaselineDevelopmentPathwayMatrixshowinga
startingsetofAdaptation-relatedareas.............................................................................................................. 52
Table 4-5 OverallstructureoftheBaselineDevelopmentPathway
MatrixshowingthestartingsetofIndicators ................................................................................................... 54
Table 4-6 SimplifiedCompletedBaselineDevelopmentPathwayMatrix ................................................................ 55
Table 4-7 Factorsforconsiderationinidentifyingandprioritizinghazardsforassessment .......................... 58
Table 4-8 Hazardmapsanddatasources ................................................................................................................................. 59
Table 4-9 ImpactClassificationCategoryofIPCC(2014) ............................................................................................... 60
Table 4-10 ImpactClassificationCategoryofEcotownPhase1Methodology ....................................................... 61
Table 4-11 ThePotentialImpactsofClimateChangeonEconomicDevelopment ................................................ 61
Table 4-12 DPSIRframeworkconceptsandexamples ......................................................................................................... 63
Table 4-13 PartialListingofIllustrativeAdaptationMeasure/OptionDesicionCriteria .................................... 67
Table B-1 LandAreaandClassification ................................................................................................................................... 104
Table B-2 AreaofagricultureandnumberoffarmsinMIMAROPA(RegionIV-B),
andPalawanandOrientalMindoroProvinces,1975–2010 ................................................................ 106
Table B-3 Totalpopulationandpopulationgrowthratefiguresforthe
projectimplementationprovinces,andthePhilippines ............................................................................ 107
Table B-4 Nationaldistributionofproductionandemploymentbysectorin2011 ......................................... 108
Table B-5 NationalGDPgrowthratesbysector ................................................................................................................ 108
Table B-6 Estimatednationalpovertyincidences,1991to2014 .............................................................................. 109
Table B-7 MPIstatisticsforthePhilippines,Thailand,Indonesia,andVietnam
fromthe2014HumanDevelopmentReport ................................................................................................. 109
Table B-8 Nationaldistributionofproductionandemploymentbysectorin2011 .......................................... 113
Table B-9 Decision-supporttoolsforclimateriskassessmentandadaptationplanning ............................... 116
Table B-10 Exampleevaluationcriteriafortheselectionandprioritizationofadaptationresponses ....... 128
Table B-11 Localinformationforadaptation,andexamplesofdatagatheringandorganizingtools........... 132
Table B-12 Entrypointsfortheintegrationofadaptationintodevelopmentplanninglevels ......................... 159

1
Executive Summary

2
The Philippines has many reasons—ranging from its geographical position in the path of frequent typhoons, its heavily populated, low-elevation areas, and its economic dependence on natural resources, to its sizable population living below the poverty line—to be concerned about a changing global and regional climate. Working with the Global Green Growth Institute (GGGI), the Philippine National Climate Change Commission (CCC) and collaborators in several local jurisdictions carried out a series of municipal-level adaptation planning efforts called “Ecotown” projects (Phase 1). The second phase of Ecotown projects, carried out in coordination with authorities at the provincial level, calls for the implementation of adaptation planning for several Philippine provinces, but with an emphasis on incorporating climate change adaptation and climate resilience to economic development planning, and vice versa. In order to guide planning authorities in Philippine provinces, and the national CCC staff working with them, in carrying out Phase 2 Ecotown projects, GGGI has commissioned this Framework Document to provide a systematic, but flexible, approach to the incorporation of adaptation planning together with economic development planning so as to produce climate resilient green growth (CRGG or Ecotown Phase 2) plans addressing multiple environmental, social, and economic goals.
Building on the considerable literature for climate change adaptation planning in general, and in particular on the literature covering the inclusion of economic development goals in climate adaptation planning (and vice versa), the Framework has been designed to guide inclusive, consultative CRGG planning efforts at the provincial level in the Philippines.
• CHAPTER 1 provides an introduction to combined climate change adaptation and economic development planning in the Philippines, including a brief review of some of the opportunities, challenges, and benefits associated with linked adaptation and economic development planning, a summary of previous Ecotown activities, a presentation of the goals of Phase 2 of Ecotown, and a sampling of implementation mechanisms for climate adaptation options.
• CHAPTER 2 reviews some of the issues associated with climate change and economic development planning in the Philippines.
• CHAPTER 3 provides a summary of the literature reviewed in the preparation of the CRGG Framework; a more detailed version of the literature review is provided in Annex B to this Report. This Framework is designed to integrate climate adaptation and economic development considerations, but also to include consideration of goals such as poverty alleviation and the improvement of social equity. As such, The CRGG Framework is designed to be a participatory, systematic, and objective process for climate proofing of local development plans to address local development priorities considering the impacts of climate change, underlying trends in local economic growth, and effects on community welfare.
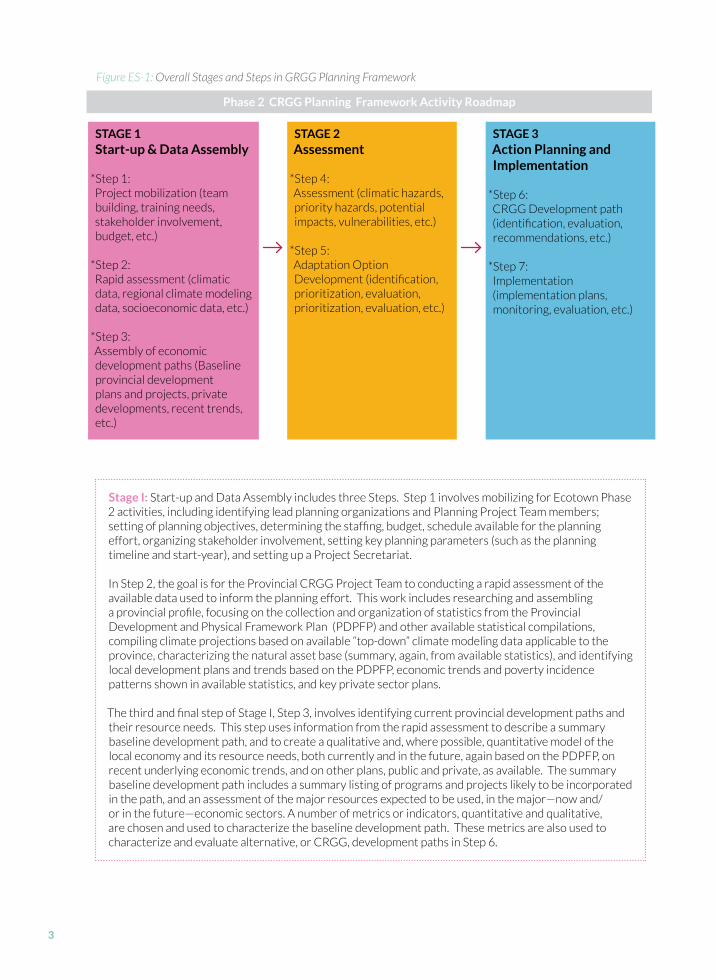
• CHAPTER 4 describes in detail the CRGG Planning Framework developed by the Project Team. As summarized in Figure ES 1, below, the CRGG Planning Framework is composed of seven steps organized into three “stages”.
Executive Summary
3
Stage I:Start-upandDataAssemblyincludesthreeSteps.Step1involvesmobilizingforEcotownPhase2activities,includingidentifyingleadplanningorganizationsandPlanningProjectTeammembers;settingofplanningobjectives,determiningthestaffing,budget,scheduleavailablefortheplanningeffort,organizingstakeholderinvolvement,settingkeyplanningparameters(suchastheplanningtimelineandstart-year),andsettingupaProjectSecretariat.
InStep2,thegoalisfortheProvincialCRGGProjectTeamtoconductingarapidassessmentoftheavailabledatausedtoinformtheplanningeffort.Thisworkincludesresearchingandassemblingaprovincialprofile,focusingonthecollectionandorganizationofstatisticsfromtheProvincialDevelopmentandPhysicalFrameworkPlan(PDPFP)andotheravailablestatisticalcompilations,compilingclimateprojectionsbasedonavailable“top-down”climatemodelingdataapplicabletotheprovince,characterizingthenaturalassetbase(summary,again,fromavailablestatistics),andidentifyinglocaldevelopmentplansandtrendsbasedonthePDPFP,economictrendsandpovertyincidencepatternsshowninavailablestatistics,andkeyprivatesectorplans.
ThethirdandfinalstepofStageI,Step3,involvesidentifyingcurrentprovincialdevelopmentpathsandtheirresourceneeds.Thisstepusesinformationfromtherapidassessmenttodescribeasummarybaselinedevelopmentpath,andtocreateaqualitativeand,wherepossible,quantitativemodelofthelocaleconomyanditsresourceneeds,bothcurrentlyandinthefuture,againbasedonthePDPFP,onrecentunderlyingeconomictrends,andonotherplans,publicandprivate,asavailable.Thesummarybaselinedevelopmentpathincludesasummarylistingofprogramsandprojectslikelytobeincorporatedinthepath,andanassessmentofthemajorresourcesexpectedtobeused,inthemajor—nowand/orinthefuture—economicsectors.Anumberofmetricsorindicators,quantitativeandqualitative,arechosenandusedtocharacterizethebaselinedevelopmentpath.Thesemetricsarealsousedtocharacterizeandevaluatealternative,orCRGG,developmentpathsinStep6.
STAGE 1Start-up & Data Assembly
*Step1:Projectmobilization(teambuilding,trainingneeds,stakeholderinvolvement,budget,etc.)
*Step2:Rapidassessment(climaticdata,regionalclimatemodelingdata,socioeconomicdata,etc.)
*Step3:Assemblyofeconomicdevelopmentpaths(Baselineprovincialdevelopmentplansandprojects,privatedevelopments,recenttrends,etc.)
STAGE 2Assessment
*Step4:Assessment(climatichazards,priorityhazards,potentialimpacts,vulnerabilities,etc.)
*Step5:AdaptationOptionDevelopment(identification,prioritization,evaluation,prioritization,evaluation,etc.)
STAGE 3Action Planning and Implementation
*Step6:CRGGDevelopmentpath(identification,evaluation,recommendations,etc.)
*Step7:Implementation(implementationplans,monitoring,evaluation,etc.)
Figure ES-1: Overall Stages and Steps in GRGG Planning Framework
Phase 2 CRGG Planning Framework Activity Roadmap
4
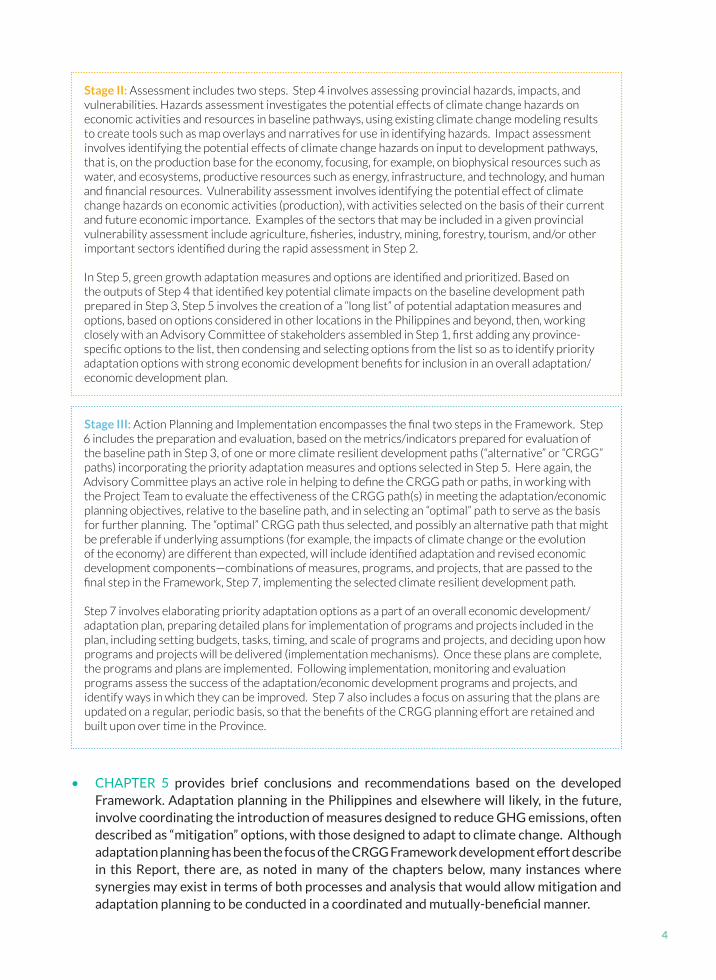
Stage III: ActionPlanningandImplementationencompassesthefinaltwostepsintheFramework.Step6includesthepreparationandevaluation,basedonthemetrics/indicatorspreparedforevaluationofthebaselinepathinStep3,ofoneormoreclimateresilientdevelopmentpaths(“alternative”or“CRGG”paths)incorporatingthepriorityadaptationmeasuresandoptionsselectedinStep5.Hereagain,theAdvisoryCommitteeplaysanactiveroleinhelpingtodefinetheCRGGpathorpaths,inworkingwiththeProjectTeamtoevaluatetheeffectivenessoftheCRGGpath(s)inmeetingtheadaptation/economicplanningobjectives,relativetothebaselinepath,andinselectingan“optimal”pathtoserveasthebasisforfurtherplanning.The“optimal”CRGGpaththusselected,andpossiblyanalternativepaththatmightbepreferableifunderlyingassumptions(forexample,theimpactsofclimatechangeortheevolutionoftheeconomy)aredifferentthanexpected,willincludeidentifiedadaptationandrevisedeconomicdevelopmentcomponents—combinationsofmeasures,programs,andprojects,thatarepassedtothefinalstepintheFramework,Step7,implementingtheselectedclimateresilientdevelopmentpath.
Step7involveselaboratingpriorityadaptationoptionsasapartofanoveralleconomicdevelopment/adaptationplan,preparingdetailedplansforimplementationofprogramsandprojectsincludedintheplan,includingsettingbudgets,tasks,timing,andscaleofprogramsandprojects,anddecidinguponhowprogramsandprojectswillbedelivered(implementationmechanisms).Oncetheseplansarecomplete,theprogramsandplansareimplemented.Followingimplementation,monitoringandevaluationprogramsassessthesuccessoftheadaptation/economicdevelopmentprogramsandprojects,andidentifywaysinwhichtheycanbeimproved.Step7alsoincludesafocusonassuringthattheplansareupdatedonaregular,periodicbasis,sothatthebenefitsoftheCRGGplanningeffortareretainedandbuiltuponovertimeintheProvince.
• CHAPTER 5 provides brief conclusions and recommendations based on the developed Framework. Adaptation planning in the Philippines and elsewhere will likely, in the future, involve coordinating the introduction of measures designed to reduce GHG emissions, often described as “mitigation” options, with those designed to adapt to climate change. Although adaptation planning has been the focus of the CRGG Framework development effort describe in this Report, there are, as noted in many of the chapters below, many instances where synergies may exist in terms of both processes and analysis that would allow mitigation and adaptation planning to be conducted in a coordinated and mutually-beneficial manner.
Stage II:Assessmentincludestwosteps.Step4involvesassessingprovincialhazards,impacts,andvulnerabilities.Hazardsassessmentinvestigatesthepotentialeffectsofclimatechangehazardsoneconomicactivitiesandresourcesinbaselinepathways,usingexistingclimatechangemodelingresultstocreatetoolssuchasmapoverlaysandnarrativesforuseinidentifyinghazards.Impactassessmentinvolvesidentifyingthepotentialeffectsofclimatechangehazardsoninputtodevelopmentpathways,thatis,ontheproductionbasefortheeconomy,focusing,forexample,onbiophysicalresourcessuchaswater,andecosystems,productiveresourcessuchasenergy,infrastructure,andtechnology,andhumanandfinancialresources.Vulnerabilityassessmentinvolvesidentifyingthepotentialeffectofclimatechangehazardsoneconomicactivities(production),withactivitiesselectedonthebasisoftheircurrentandfutureeconomicimportance.Examplesofthesectorsthatmaybeincludedinagivenprovincialvulnerabilityassessmentincludeagriculture,fisheries,industry,mining,forestry,tourism,and/orotherimportantsectorsidentifiedduringtherapidassessmentinStep2.
InStep5,greengrowthadaptationmeasuresandoptionsareidentifiedandprioritized.BasedontheoutputsofStep4thatidentifiedkeypotentialclimateimpactsonthebaselinedevelopmentpathpreparedinStep3,Step5involvesthecreationofa“longlist”ofpotentialadaptationmeasuresandoptions,basedonoptionsconsideredinotherlocationsinthePhilippinesandbeyond,then,workingcloselywithanAdvisoryCommitteeofstakeholdersassembledinStep1,firstaddinganyprovince-specificoptionstothelist,thencondensingandselectingoptionsfromthelistsoastoidentifypriorityadaptationoptionswithstrongeconomicdevelopmentbenefitsforinclusioninanoveralladaptation/economicdevelopmentplan.

5

6
C h a p t e r
Introduction

7
As a nation of islands lying in the path of frequent typhoons, with many heavily populated, low-elevation areas, an economy dependent on natural resources, and a sizable population living below the poverty line, the Philippines has many reasons to be concerned about a changing global and regional climate. In addition to its active national climate planning efforts, the Philippines has worked with the Global Green Growth Institute (GGGI) on a series of municipal-level adaptation planning efforts called “Ecotown” projects (Phase 1). The second Phase of Ecotown projects, carried out jointly by the Philippine Climate Change Commission (CCC) and in coordination with authorities at the provincial level, calls for the implementation of adaptation planning for several Philippine provinces, but with an emphasis on incorporating considerations of climate change adaptation (CCA) and improvement in climate resilience to economic development planning, and vice versa. In order to guide planning authorities in Philippine provinces, and the national CCC staff working with them, in carrying out Phase 2 Ecotown projects, GGGI has commissioned this Framework Document to provide a systematic, but flexible, approach to the incorporation of adaptation planning in economic development planning so as to produce climate resilient green growth (CRGG) plans addressing multiple environmental, social, and economic goals.
“Green growth” has become an emphasis of many international organizations, including the World Bank, International Energy Agency/Organisation for Economic Co-operation and Development (IEA/OECD), and other groups. Green growth denotes a path of economic development that a nation, province, municipality, or other jurisdiction can choose to embark upon that is designed to avoid some of the environmental and social impacts of historically standard development models. Green growth is therefore economic development that is sustainable from the point of view of environmental protection and remediation, while at the same time promoting job creation, improvements in social equity, and other related objectives. Green growth enhances, green productivity—that is, productivity gains from enhancing efficiency in the use of energy, materials, and other natural capital, green opportunity—opportunities to pursue new green industries, innovation, infrastructure, resilient economies—economies that accrue economic benefits from adapting to ecosystem-related risks, and ecosystem service benefits—the enhancement and/or restoration of the ability of ecosystems to support human and other life, both now and for future generations (GGGI, 2015).
Put another way, green growth means fostering economic growth and development while ensuring that natural assets continue to provide the resources and environmental services on which our well-being relies. It focuses on the synergies and trade-offs between the environmental and economic pillars of sustainable development. As such, green growth discards the traditional convention of “grow first, clean up later” and discourages investment decisions that entrench communities and countries in environmentally damaging, carbon-intensive system, seeking instead to spur investment and innovation in ways that give rise to new, more sustainable sources of growth and development. Importantly, green growth does not neglect the social aspects of development planning as without good governance, transparency, and consideration of equity, no transformative growth strategy can succeed.
Climate resilient green growth builds on the green growth definition by emphasizing in particular the inclusion of measures and options—which can be combinations of policy changes, technology deployment, environmental modifications, and/or changes in the social and economic patterns— that are designed to increase the extent to which a jurisdiction is resilient to changes in climate
Introduction

8
and to the impacts and risks inherent in a changing climate. CRGG can be defined as economic development that emphasizes environmental sustainability and advances social and equity goals, while also pursuing climate change adaptations that makes economic development more climate-resilient. CRGG considers how climate change adaptation will affect the achievement of development objectives, many of which may encompass greenhouse gas mitigation, and how the achievement of development objectives and exploiting adaptation-mitigation synergies, in turn, will contribute to managing climate risks and promoting green growth. Thus, CRGG highlights the mutually enforcing relationship between climate change adaptation and economic development as well as poverty reduction and social inclusion.
The CRGG Framework described in this Report is a participatory, systematic, and objective process for “climate-proofing” of local development plans to address local development priorities while considering the impacts of climate change, underlying trends in local economic growth, and effects on community welfare. As such, this Framework Document is tailored toward development and economic needs and modalities of the Philippines. It is anchored and informed by Ecotown Phase I results as well as the broader economic, development and environmental constraints/opportunities for the Philippines. It is also informed by current/planned sectoral strategies, provincial development plans, the National Climate Change Action Plan 2011-2028 (NCCAP)1 , the National Strategy for Sustainable Development 2, and National Water Vision 3 as practicable. Finally, the strategy provided in this Framework is informed/guided by international green/resilient growth strategy development experience, including experience in other Asian and even African jurisdictions, as well as by existing work by non-governmental organizations (NGOs, for example, Green Growth Action Alliance (G2A2), Green Growth Coalition, Green Growth Knowledge Platform), multilateral agencies (such as the United Nations Environment Programme (UNEP), the World Bank, and the Partnership for Action on Green Economy), and bilateral support forums (such as the Danish International Development Agency (DANIDA). Figure 1-1 shows the conceptual relationships in the CRGG Framework between the goals of strengthening climate resilience, informing provincial economic development policy, promoting green growth (including addressing sustainability and social goals such as poverty reduction, while building on previous Ecotown work to develop CRGG paths at a provincial level.
Figure 1-2 (Oxfam, 2012) illustrates the underlying objectives of the CRGG context, with a focus on decoupling economic growth from resource use, addressing poverty without locking in unsustainable resource use, and transforming rural and urban development pathways to build in climate change adaptation together with development. The remainder of this introduction describes some of the opportunities, challenges, and benefits associated with adaptation planning in the Philippines, summarizes the goals of the Philippines CRGG Framework, notes some classes of implementation measures for CRGG options, and provides a brief “Road Map” to the remainder of this document.
1. Available at http://adaptationmarketplace.org/data/library-documents/NCCAP_TechDoc.pdf. administrati support to conduct green life 2. Available at http://documents.worldbank.org/curated/en/1990/01/700349/philippines-philippine-strategy-sustainable-development-
conceptual-frameworkthe. 3. Available at http://www.lwua.gov.ph/downloads_14/Philippine%20Water%20Supply%20Sector%20Roadmap%202nd%20Edition.pdf

9
1.1 Opportunities, Benefits, and Challenges Associated with Adaptation Planning in the Philippines
The National Climate Change Action Plan 2011-2028 (NCCAP) authored by the Climate Change Commission (CCC, 2011), focuses on seven strategic priority areas related to the impacts of climate change on the Philippines. The seven priority areas are:
• Food Security • Water Sufficiency • Environmental and Ecological Security • Human Security
• Sustainable Energy • Climate-smart Industries and Services• Knowledge and Capacity Development
Figure 1-2: Unerlying Objectives of CRGG and Related Approaches
Figure 1-1: Conceptual Relationship between Ecotown Phase 2 CRGG Goals and Inputs
Priority adaptationstrategies
StrengtheningClimate
PromotingGreen Growth
Sustainable investments &
poverty reduction
Informing ProvincialDevelopment Policy
Building on Previous Work
Local budgets & priorities
ECOTOWN(Phase 1)
Development paths leading
to Climate Resilience &
Green Growth
10
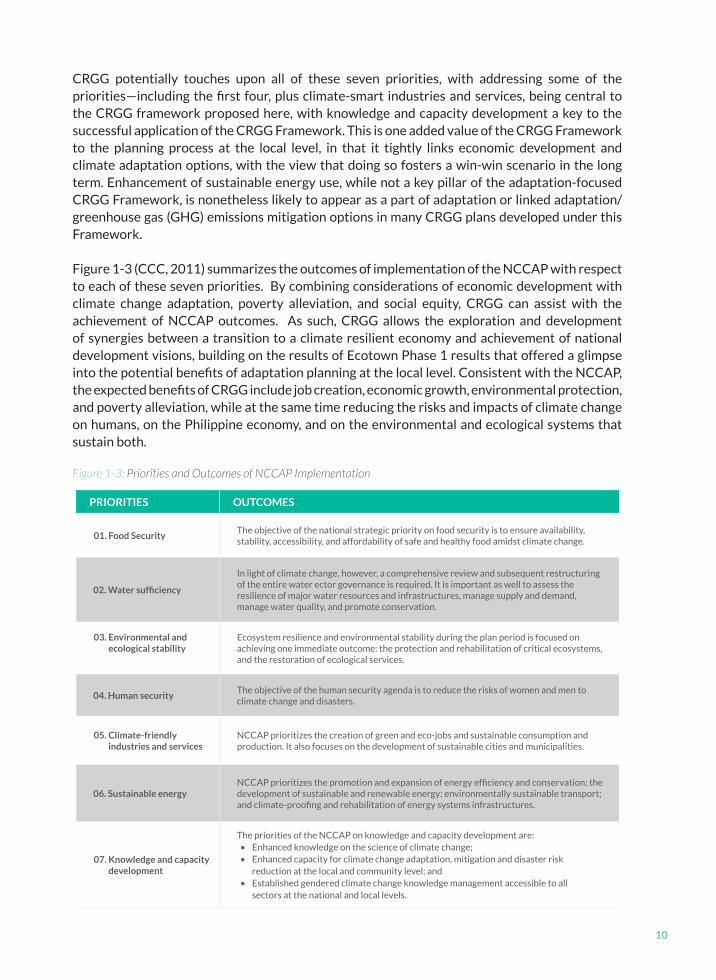
CRGG potentially touches upon all of these seven priorities, with addressing some of the priorities—including the first four, plus climate-smart industries and services, being central to the CRGG framework proposed here, with knowledge and capacity development a key to the successful application of the CRGG Framework. This is one added value of the CRGG Framework to the planning process at the local level, in that it tightly links economic development and climate adaptation options, with the view that doing so fosters a win-win scenario in the long term. Enhancement of sustainable energy use, while not a key pillar of the adaptation-focused CRGG Framework, is nonetheless likely to appear as a part of adaptation or linked adaptation/greenhouse gas (GHG) emissions mitigation options in many CRGG plans developed under this Framework.
Figure 1-3 (CCC, 2011) summarizes the outcomes of implementation of the NCCAP with respect to each of these seven priorities. By combining considerations of economic development with climate change adaptation, poverty alleviation, and social equity, CRGG can assist with the achievement of NCCAP outcomes. As such, CRGG allows the exploration and development of synergies between a transition to a climate resilient economy and achievement of national development visions, building on the results of Ecotown Phase 1 results that offered a glimpse into the potential benefits of adaptation planning at the local level. Consistent with the NCCAP, the expected benefits of CRGG include job creation, economic growth, environmental protection, and poverty alleviation, while at the same time reducing the risks and impacts of climate change on humans, on the Philippine economy, and on the environmental and ecological systems that sustain both.
PRIORITIES OUTCOMES
01. Food SecurityThe objective of the national strategic priority on food security is to ensure availability, stability, accessibility, and affordability of safe and healthy food amidst climate change.
02. Water sufficiency
In light of climate change, however, a comprehensive review and subsequent restructuring of the entire water ector governance is required. It is important as well to assess the resilience of major water resources and infrastructures, manage supply and demand, manage water quality, and promote conservation.
03. Environmental and ecological stability
Ecosystem resilience and environmental stability during the plan period is focused on achieving one immediate outcome: the protection and rehabilitation of critical ecosystems, and the restoration of ecological services.
04. Human securityThe objective of the human security agenda is to reduce the risks of women and men to climate change and disasters.
05. Climate-friendly industries and services
NCCAP prioritizes the creation of green and eco-jobs and sustainable consumption and production. It also focuses on the development of sustainable cities and municipalities.
06. Sustainable energyNCCAP prioritizes the promotion and expansion of energy efficiency and conservation; the development of sustainable and renewable energy; environmentally sustainable transport; and climate-proofing and rehabilitation of energy systems infrastructures.
07. Knowledge and capacity development
The priorities of the NCCAP on knowledge and capacity development are:• Enhanced knowledge on the science of climate change;• Enhanced capacity for climate change adaptation, mitigation and disaster risk
reduction at the local and community level; and• Established gendered climate change knowledge management accessible to all
sectors at the national and local levels.
Figure 1-3: Priorities and Outcomes of NCCAP Implementation

11
Some of the challenges associated with CRGG planning, and with the implementation of CRGG plans, many of which are associated with climate change adaptation planning and/or economic development planning as well, include:
• Lack of information in key areas ranging from the status of current resources use and infrastructure to the future impacts of climate change. Even where information does exist, lack of awareness of climate change hazards, impacts, and vulnerabilities on the part of policymakers and stakeholders poses a barrier to timely and effective identification of adaptation options.
• Lack of funding for implementing climate adaptation plans, and/or a disconnect between the potential beneficiaries of climate adaptation plans and those with access to funding. Lack of funding may not, however, be a lack of monetary resources, but rather a lack of financing mechanisms, including innovative financing approaches, needed to bridge the gap between financial resources and adaptation/economic development needs.
• Lack of coordination between the different stakeholders groups affected by climate change, including a lack of coordination with specific agencies working on economic development plans.
• Difficulties in coordinating the actions of public and private sector actors in the economy.• Lack of capacity to carry out climate change-related planning at the provincial and local
levels.• Existing regulatory frameworks that do not adequately take climate change considerations
into account.• The influences of current trade and investment flows, and existing capital stocks, as barriers
to changes needed for climate change adaptation, though in some cases the need to protect capital infrastructure and maintain trade and investment flows, including maintaining or establishing advantages in trade in commodities produced by the province, may be a spur to adaption activities.
These and other challenges and barriers must be addressed and overcome in the development of adaptation options with economic development benefits in order to develop an enabling environment for a long-term economic and environmental transition via CRGG.
Another challenge associated with adaptation planning in the Philippines is coordinating the introduction of measures designed to reduce GHG emissions, often described as “mitigation” options, with those designed to adapt to climate change. Although adaptation planning has generally been a focus in the Philippines, an active program of mitigation planning, including through the Climate Change Commission, also exists. The current United States Agency for International Development (USAID)-funded project “Enhancing Capacities for Low Emission Development Strategies (EC-LEDS) in the Philippines” is an example of such an effort. 4 Although this CRGG Framework primarily focuses on adaptation and economic development, there are, as noted in many of the chapters below, many instances where synergies may exist in terms of both processes and analysis that would allow mitigation and adaptation planning to be conducted in a coordinated and mutually-beneficial manner.
Relatedly, closer coordination between economic development planning and adaptation planning (as is the focus of this Framework) and between adaptation and mitigation planning can help to
4. See, for example, CCC (2015), “Enhancing Capacities for Low Emission Development Strategies: EC-LEDS in the Philippines”, available as http://climate.gov.ph/index.php/projects/mitigation/ec-leds.

12
avoid “maladaptation”, that is, to avoiding adopting measures, whether (for example) designed to reduce GHG emissions or to enhance economic development, that result in increasing risks associated with climate change. Adaptation options should also be reviewed for their potential to increase GHG emissions, which will in turn increase climate risks. Although there can be significant benefits to coordinating adaptation and mitigation planning, the two have a number of aspects that are sufficiently different—for example, the need in adaptation planning to consider climate change hazards, impacts, and vulnerabilities has no direct analog in mitigation planning, and the requirement of a GHG emissions inventory and forecast has both similarities and key differences with establishing an adaptation baseline path—that developing a holistic adaptation/mitigation approach is often difficult. In addition, some of the skill sets and tools required of mitigation and adaptation planners may mean that it may be more effective to closely coordinate groups of mitigation and adaptation planners than to try and combine their work in a single effort.
Due to the archipelagic nature of the Philippines, local government units have required more political, fiscal and administrative autonomy. The most comprehensive piece of legislation that addresses this need – the Local Government Code of 1991 (LGC) – provided LGUs with greater responsibility to chart the development of their territory and provided additional financial resources and revenue-raising powers to plan, fund and implement their own local programs and projects. As a result, the LGUs have become increasingly self-reliant through the exercise of fiscal autonomy under the LGC. LGUs are expected to more effectively manage their own local development. Section 20 of the LGC mandates LGUs to prepare a Comprehensive Land Use Plan (CLUP) enacted through a zoning ordinance, while Sections 106 and 109 of the same Code mandate the LGUs to prepare Comprehensive Development Plans (CDP) and public investment programs. The local government planning process is summarized as shown in Figure 1-4.
A viable institutional entry point for applying the CRGG Framework may lie under the Technical Component of the local planning structure, specifically within the sectoral functional committees. These committees are composed of inter-sectoral representatives from various local government line agencies (e.g., agriculture, environment, social welfare and development, etc.) to ensure
Figure 1-4: Local Planning Structure
LOCAL PLANNING STRUCTURE
POLITICAL COMPONENT
LOCAL SANGGUNIAN
LOCAL SPECIAL BODIES
SECTORAL & FUNCTIONAL COMMITTEES
DEPARTMENT HEADS
LPDP
NGAs
PRIVATE SECTOR REPRESENTATIVES
TECHNICAL COMPONENT
LOCAL DEVELOPMENTCOUNCIL
LCE
PUNONGBARANGAYS
CONGRESSMAN OR REPRESENTATIVE
CSOs / PSO

13
more holistic planning that recognizes sectoral concerns simultaneously with efforts towards integrative implementation and outcomes. Table 3-3, in a later section, also suggests other viable entry points in a more generic fashion.
In sum, the CRGG Framework adds value to current local planning exercises by chiefly integrating the goals of socially-inclusive economic development with climate change adaptation options, which to date have been somewhat separate processes in the planning architecture. The CRGG framework is applied locally as this is fundamentally deemed a strategic scale where plans translate into realistic and concrete options and benefits to local populations, and where viable linkages can be made with NCCAP priorities and outcomes at the national level.
1.2 Summary of Ecotown Phase 1 Process, Findings, and Challenges, and Lessons for the Phase 2 CRGG Methodology
The Ecotown framework was formed by a partnership between the CCC and GGGI to jointly promote green growth in the Philippines and implement the NCCAP at the local level (CCC and GGGI, 2014). Through mitigation and adaptation interventions, the framework is designed to build the resilience of local communities to the impacts of climate change, whilst also promoting economic growth and ecological sustainability. According to the Demonstration of the Eco-town Framework Project in San Vicente, Palawan, Philippines (CCC and GGGI, 2014), an Ecotown is defined as a sustainable community in harmony with the environment, but is set in a rural context. It stands for “ecologically stable” and “economically resilient” communities. Further, an Ecotown is a planning unit composed of municipalities or a group of municipalities located within and around boundaries of critical biodiversity areas, which are likely to be at higher risk to climate change.
The Demonstration of Eco-town Framework Project in San Vicente, Palawan, Philippines (CCC and GGGI, 2014) report identifies lessons learned, challenges and ways forward for building on the Phase 1 framework within the Phase 2 methodology. Central to the vision of the enhanced framework is moving beyond a natural resource, sustainable ecosystems approach to adaptation and instead placing considerable emphasis on sub-national economic performance by analyzing the main sectors that comprise the regional GDP for adaptation intervention pathways at the provincial level. That is not to say, however, that Phase I significantly departed from this vision, as it claims to “support key aspects of green growth by reducing vulnerability… and prioritizing adaptation measures that are framed within the local economic development model” (CCC and GGGI, 2014; p.28). Eco-town advocates for adaptation as a vehicle for economic growth and development.
In terms of project implementation, one of the major challenges faced is how to meaningfully harmonize top-down and bottom-up approaches. Pursuing both approaches ensures that the interests and perspectives of key stakeholders are considered in risk assessment and adaptation planning processes, but finding common ground or compromise between the two was found to be difficult. For example, of the sectors analyzed, only the health sector qualified as a common denominator but both coastal and marine, and agriculture, did not fit into the top-down approach categories (CCC and GGGI, 2014).
For assessment processes, the Phase 1 methodology utilized both a prediction-oriented top-down approach and a resilience-oriented bottom-up approach, to predominantly minimize the

14
biggest obstacle to adaptation planning: uncertainty. This way, the wide impacts and response capacity of the community are provided on the basis of an international assessment model, but still includes local-specific outcomes grounded by prior experiences. However, uncertainty cannot be eliminated when climate change scenarios and projections form part of the analysis, and so the degree of uncertainty has to be thoroughly accounted for by providing a comprehensive range of estimates and confidence levels for projected impacts (UNDP-UNEP, 2011). Moreover, the uncertainty must be communicated properly, while still emphasizing the necessity to adapt to both current and projected future variability and extremes so as not to undermine the central message that adaptation planning and action requires urgency from both governmental and non-governmental actors (World Bank, 2010).
Another related challenge faced during the Eco-Town Phase I implementation was that in practice, it proved to be difficult to plan and conduct vulnerability assessments objectively, and results were sometimes analyzed relative to other vulnerability assessments, making it impossible to measure vulnerability in absolute terms (CCC and GGGI, 2014). The Criteria used for determining adaptation measures in Ecotown Phase 1 were effectiveness, costs, technical feasibility, social and cultural feasibility, and time. While workable, these criteria did not include linking adaptation with socially-inclusive economic development. The intention of the CRGG is to address this gap more explicitly. In turn, the CRGG will benefit from consideration of a range of available frameworks, methods and tools that exist for assessing climate change vulnerability, impacts and adaptation options (see, for example, UNFCCC, 2008; Olhoff and Schaer, 2010; UNDP-UNEP, 2011), some of which have promising application for integrating adaptation planning into development at sub-national levels. The available frameworks, methods and tools that have relevance and lessons for the CRGG are analyzed in the literature review report found in Annex B. Brief summaries of some of these documents are also available in the annotated bibliography found in Annex A to this Report.
Some of the limitations of the Ecotown Phase 1 work—a lack of linkage with economic development processes, for example, and difficulties in distinguishing between socially desirable investments and those with true climate change adaptation roles, for example—have been considered in the development of the CRGG Planning Framework that follows, and the Framework seeks to address those limitations to produce a tool useful at the provincial level for Ecotown Phase 2, as well as for adaptation/economic development planning in other jurisdictions.
1.3 Goals, Objectives and Guiding Principles of the Philippines Phase 2 Ecotown CRGG Planning Framework
In the second Phase of the Ecotown project named the “Ecotown Scale-Up Project (Phase 2): Climate Resilient Green Growth Project at the Provincial Level”, GGGI and its partners in the Philippines are building on the lessons and experience gained in the project’s first phase to emphasize the integration of climate adaptation planning with planning for economic development and its closely-related subsidiary social goals--for example, alleviating poverty, improving inclusion in decision making, addressing gender issues, providing employment opportunities, and addressing gender and related social issues.
The CRGG Planning Framework is designed for use in guiding the projects implemented under the second phase of the Ecotown Project in the Philippines, as well as for use, ultimately, in other Philippine provinces and other nations served by GGGI. The CRGG Planning Framework,

15
as described in this document, incorporates elements of natural resources and vulnerability assessment, identification and evaluation of adaptation measures, evaluation of economic development goals and resources and the preparation of a regional climate resilient green growth strategies and plans for the province that integrates consideration of adaptation and economic development issues and options. The CRGG Planning Framework is thus envisioned as a tool to guide the participatory planning for climate-resilient development at the provincial level. As such, the Phase 2 Framework overview overlaps with the sustainable development and other objectives of the NCCAP and other national goals, including low carbon economic growth (as noted above), resilience to climate change, preservation of ecosystem services, and in particular the strengthening of social well-being through jobs, food, water, and energy security.
Beyond its use in the Philippines, however, the CRGG Framework described here is intended to be more than a tool prepared solely for the Philippines context. Rather, the Framework is a general methodology that can be adapted for and applied at various sub-national levels in countries of different circumstances. The CRGG Framework is also designed to provide a working set of premises to guide a transition to a climate resilient economy. These premises are aligned with the principles underlying recent national vision documents, including the NCCAP but also including, for example, the Philippines National Communication to the UN Framework Convention on Climate Change (UNFCCC) and sustainable development policies such as the Philippines Input to Rio+ 20 (PCSD, 2011). These premises include strong, equitable, and sustainable economic growth, enhanced quality of life, gender equality, rational resource use, provincial coordination, and others. These premises are reflected in the CRGG Framework, in part, as follows:
• Mainstreaming poverty alleviation and social/gender equity in the CRGG Planning Framework is addressed through assessments undertaken in Stages 1 and 2 of the process described in Chapter 5 of this report. These assessments include the inclusion of social stratifications information based on poverty incidence indices and gender indicators such as the Gender Development Index (GDI) and/or gender empowerment measure (GEM) for the Philippines. Vulnerability and climate risk assessments that address the actual or potential climate change sensitivity of the poor, women/men, specific ethnic groups, and internally displaced groups also play a role in addressing poverty alleviation and social/gender equity issues.
• Stakeholder consultations, which play central roles in processes throughout the CRGG Framework, use a social inclusion principle in identifying relevant stakeholders for adaptation planning—or example, inclusion of climate change-affected groups, policy actors, and national and international experts.
• Adaptation option development and the preparation of CRGG development paths, as undertaken progressively through the Framework, include criteria that address poverty alleviation and social/gender equity in the selection of adaptation measures and options, and in the formulation of economic development path.

16
1.4 Implementation Mechanisms for CRGG Options
Once CRGG options are chosen through the use of the Framework described below, mechanisms for implementing climate resilient green growth must be identified. As a brief summary, potentially classes of applicable implementation mechanisms typically include, but are not limited to: 5
• New public financing policies and financial innovations that can mitigate risk and enable private financing to flow at scales needed;
• Creation of an environment that facilitates partnerships between local and international private and public sector finance institutions with government;
• Clear sector-level goals and strategies to overcome environmental and resource challenges;
• Taking advantage of the influence of supporting actions and strategies in other Asian countries; and
• Mechanisms for equitable sharing of benefits from natural resources, including the devolution of ownership and responsibilities for managing provincial resources.
These and other mechanisms for implementing CRGG options, once identified, are tailored to be consistent with national and provincial policy and economic resources, as well as goals for environmental preservation and enhancement, economic development, social equity, and poverty alleviation.
1.5 “Road Map” to the Remainder of this Framework Document
The remainder of this CRGG Framework document is organized as follows:
• CHAPTER 2 provides a brief summary of the current situation in the Philippines with regard to planning for climate change adaptation and economic development, including a review of the physical, economic, political, and demographic situation in the country, a description of the climate-related hazards facing the Philippines, and the existing planning structure for both economic development and climate policy formulation at the different levels of government. More detailed information on these topics is provided in the second and third sections of Annex B (Literature Review).
• CHAPTER 3 describes the methodology/process used to develop and assemble this CRGG Framework document, including providing a summary of the literature reviewed to inform Framework Development. Annex B to this Report provides the more detailed Review of Related Literature for the CRGG Planning Framework and Rapid Assessment of the Philippine Context prepared as input to the development of this Framework.
• CHAPTER 4, the main section of this Report, introduces the overall recommended CRGG Framework, and presents each Step of the Framework and the connections between Steps.
5. See, for example, Mimura et al (2014), available as https://ipcc-wg2.gov/AR5/images/uploads/WGIIAR5-Chap15_FINAL.pdf.

17
• CHAPTER 5 offers brief conclusions and recommendations based on the Frameworks, as well as a summary of potential “Next Steps” in further elaborating and applying the Framework in the Philippines and elsewhere.
In addition to the Literature Review, Annexes C, D, and E to this Framework Report provide illustrative tools and examples for use in applying the Steps of the Framework. These tools and examples are intended to be starting points for those applying the CRGG Framework on the provincial level in the Philippines.

18
2C h a p t e r
Climate Change and Economic Development Planning
in the Philippines

19
2.1 Climate-related Hazards in the Philippines
The Philippines is widely regarded as one of the most hazard-prone and vulnerable to climate change nations in the world. For instance, the 2014 Verisk Maplecroft Climate Change Vulnerability Index (CCVI) rates the Philippines as facing “extreme risk” to climate change impacts over the next 30 years. The CCVI has also ranked the Philippines as being the 8th most at risk nation in the world by evaluating exposure to climate-related disasters and sea-level rise (SLR), human sensitivity in terms of population patterns, conflicts, development, natural resources, dependence on agriculture, and adaptive capacity of infrastructure and governance to combat climate change (Philippines ranked 6th in 2011). This finding is supported by other indices, such as the 2013 Global Climate Risk Index (ranked 4th) (Harmeling and Eckstein, 2012) and 2014 World Risk Report (ranked 2nd) (ADW and UNU-EHS, 2014). Geographically, at least, the islands of the Philippines will continue to be highly exposed to risks of climate change including extreme climate-related hazards such as typhoons, floods, droughts and landslides. Furthermore, the country is highly dependent on natural ecosystems and climatic conditions for economic productivity and national food security, increasing its vulnerability to climate change – including to both temperature and precipitation variability and extremes (CCC and GGGI, 2014).
Changes in the climate have been shown to be increasing the frequency and magnitude of certain hazards in recent years; a trend that is forecasted to continue throughout the 21st century unless GHG emissions are severely reduced from current levels. Nationally, the Philippines has been experiencing average temperature increases and rainfall changes in recent decades, and climate model projections point to this trend continuing and likely increasing throughout the 21st century (yielding, for example, at least a 2°C temperature increase by 2100).
Climate change and disaster impacts come in various forms – generally categorized into economic (for example, crop failure or asset losses) and non-economic (for example, loss of life or psychological impact). These negative impacts generally hit the poorest the hardest – in the Philippines, despite impressive national economic growth rates, the rate of poverty remains high, relative to other Southeast Asian nations (see Annex B, Table B 7), and, according to one survey, eight out of ten Filipinos feel that they are experiencing the impacts of climate change already (World Bank, 2012). Climate scenarios and projections suggest that the negative impacts of climate change will seriously threaten the recent economic and social development gains achieved in the Philippines for decades to come (CCC and GGGI, 2014), and will also have implications for meeting the Millennium Development Goals (MDGs), which expire in 2015 and will be replaced by the Sustainable Development Goals (SDGs). The second section of Annex B (Literature Review, “The Philippine context: Resources, development, and institutions”) contains more detailed information on climate change conditions and impacts on the Philippines.
2.2 Philippine Government Action on Climate Change and Development
The Philippine political structure described in Annex B constitutes the framework within which planning for economic development and for climate change adaptation strategy development takes place at the national, provincial, and local levels. In response to the threat of climate change, the Philippines central government has positioned itself as a frontrunner in Asia for setting policy and strategy on climate change and development.
Climate Change and Economic Development Planning in the Philippines
20
Recent policy examples include the 2004 enhancement of the Philippine Agenda 21: A National Agenda for Sustainable Development for the 21st Century, which made legislative and structural changes for the consideration of climate change, and lead to the passing of the 2009 Climate Change Act (Republic Act 9729) and the establishment of the Climate Change Commission (CCC). In terms of strategy, the Philippine National Framework Strategy on Climate Change 2010-2022 (NFSCC) places emphasis on adaptation, with mitigation a function of adaptation – due to the current and short-term impacts from changes in climate variability and extreme events that can now not be avoided even if immediate curbing of emissions occurred. Explicit provisions on poverty alleviation and gender equality and climate adaptation are provided in the NFSCC. The more long-term National Climate Change Action Plan 2011-2028 (NCCAP) has seven strategic priorities – food security water sufficiency, ecosystem and environmental stability, human security, climate-smart industries and services, sustainable energy, and knowledge and capacity development – for the reduction of climate risk in the Philippines. Overall, a range of on-going programs related to economic diversification, drought resilient crops, poverty reduction, and more climate resilient infrastructure have improved the Philippines’ rating in Maplecroft’s Adaptive Capacity Index in recent years.
National planning for climate change in developing and middle-income countries around the world tends to prioritize natural resource management and ecosystem-based adaptation (Stucki and Smith, 2010), and the Philippines is no different. The reasons for this general trend are wide-ranging, but it remains of central importance to the Philippines that the national level frameworks continue to facilitate and support local priorities and initiatives, due to the strong linkages between natural resources, sustainable livelihoods, and economic development.
The National Economic and Development Authority’s (NEDA) Philippine Development Plan (PDP) 2011-2016 is a framework of goals, objectives, strategies, programs and projects for inclusive growth that is sustainable, generates employment, and reduces poverty (NEDA, 2011). Through this plan, the Philippines central government is pursuing a top-down course for rapid economic growth and development whilst also addressing quality of life, inequality and human development, and ecological integrity. The PDP has several references to the potential impact of climate change on development, and sets some sector outcome goals accordingly. For example, one goal for the agriculture and fisheries sectors is to increase resilience to climate change impacts, and success in reaching this goal will be indicated by whether a reduction in average annual agri-production loss due to weather and climate-related disasters from Philippine Peso (PhP) 13.8 billion between 2004 and 2010 can be achieved. It points to the risk climate change poses to the achievement of growth in agriculture and fisheries sectors, national rice self-sufficiency, and productivity targets. National government agencies, particularly those concerning rural issues such as the Department of Agriculture (DA), are called on to re-double adaptation efforts to reduce predicted climate change impacts.
The PDP shows that the Philippines is acutely aware of its reliance on the natural environment and its resources for economic development. Therefore, the achievement of resilient natural systems enhanced with improved adaptive capacities of human communities is a national priority. The Plan is targeting a reduction in annual damage and loss resulting from disasters primarily through the improvement of adaptation and disaster risk reduction (DRR) measures in all national, sectoral, regional and local development plans across the Philippines’ urban and rural settings. More broadly, NEDA has identified some lessons learned from the PDP implementation to date, which include acknowledging that disasters and climate change can negate gains and

21
even reverse development, improving the inclusiveness of growth strategies by adding spatial and sectoral dimensions, and realizing that economic growth is necessary but not sufficient for reducing poverty. By 2016, in terms of climate and disaster risk, the PDP hopes to have achieved climate change resilient, eco-efficient, and environmentally-friendly industries and services, and sustainable towns and cities.

22
3C h a p t e r
Methodology and Summary of Background Literature Used to Develop
the CRGG Planning Framework

23
3.1 Introduction
This section briefly describes the methodology applied to develop the CRGG Framework, and reviews key documents contributing ideas toward the analytical elements of the proposed Framework. It includes a summary overview of key documents in the area of adaptation planning and of documents providing guidance on linking adaptation and economic development planning.
3.2 Summary of relevant literature on integrating adaptation and economic development planning
As discussed in detail by the literature review report, see Annex B, there are a range of comparable climate risk screening and adaptation decision-making tools and guides for the integration of adaptation into development planning, across scales. This section will highlight those that have guidance and lessons for the CRGG framework and linking adaptation with economic development, particularly at the local level.
The OECD (2009) policy guidance on integrating adaptation into development takes a holistic “whole of government” approach to operationalizing adaptation across scales, and examines four levels of governance – the national, sector, project and local levels – for entry points into decision-making and development planning processes. Its focus on local level processes (referring to LGUs and community action), which are the closest to implementation of activities, covers key options for the incorporation of adaptation at the strategic level and in ground-level actions. The OECD (2009) framework for mainstreaming, as shown in Figure 3-1, distinguishes resource allocation from planning, and offers explicit links to planning steps and policy cycle stages.
Methodology and Summary of Background Literature Used to Develop the CRGG Planning Framework
Figure 3-1: OECD Framework for Mainstreaming Adaptation (OECD, 2009; Olhoff and Schaer, 2010)

24
The UN Poverty-Environment Initiative (UNPEI) offers a guide for mainstreaming adaptation in national level development planning, viewed through a poverty-environment lens, including a proposed framework consisting of three main components: finding the entry points and making the case; mainstreaming adaptation into policy processes; and meeting the implementation challenge (see Figure 3-2) (UNDP-UNEP, 2011).
Whilst this operational guide offers sound advice to practitioners for an approach to mainstreaming adaptation for the achievement of development and pro-poor economic growth, it stops short of offering explicit context-specific lessons on mainstreaming adaptation at the local level, for example in rural settings which the CRGG Framework proposes to address. Primarily, the UNPEI aims for poverty-environment mainstreaming, which is defined as the integration of linkages between the environment and poverty reduction into policy-making, budgeting and implementation processes across scales, from the national to the sector to sub-national levels (UNDP-UNEP, 2011). Evidence suggests that effective environmental and natural resource management can directly or indirectly improve livelihoods, health, disaster resilience and adaptive capacity, and contribute towards economic development (UNPEI, 2009).
Figure 3-2: The Poverty-Environment Approach to Mainstreaming Adaptation into Development (UNDP-UNEP, 2011)
Finding the Entry Points and making the Case
Preliminary assessmentsUnderstanding the climate
development-poverty linkages (building on national communications and NAPA)
Preliminary assessmentsUnderstanding the
governmental, institutional and political contexts
Raising awareness and building partnerships
Evaluating the institutional and capacity needs
(Building on National Capacity Self-Assessments)
Mainstreaming Adaptation into Policy Processes
Collecting country-specific evidence
Assessments, economic analysis and demonstration
projects (building on national communications and NAPA)
Influencing policy processesNational, sector, and
subnational levels
Developing and climate-proofing policy measures
(building on national communications and NAPA)
Strengthening institutions and capacities
Learning by doing
Engaging stakeholders and coordination within the development communityGovernment, non-governmental and development actors
Meeting the Implementation Challenge
Strengthening the national monitoring system for
adaptation
Budgeting and financingNational, sector, and
subnational levels (building on adaptation funding mechanisms
Supporting policy measuresNational, sector, and
subnational
Strengthening institutions and capacities
Mainstreaming as standard practice

25
While the UNPEI is comprehensive within its framework, its focus is narrow and on natural capital; just one of the drivers of local and national economic development (see Annex B on
“Drivers of economic development – climate change impacts and adaptation responses”). In general, UNPEI is a useful entry point for integration, but is does not aid government policies and ministries to see adaptation as a development challenge, and therefore falls short of effectively achieving synergies between climate change adaptation and social and economic development benefits. It does, however, highlight the key challenge of linking and aligning the local manifestations of climate change with national level adaptation responses, and the importance of stakeholder engagement in achieving such alignment. More broadly, the initiative itself has not fully succeeded in promoting national recognition of the importance and value of natural resource and ecosystem service protection for social development and poverty reduction (Lebel et al., 2012).
Another relevant and potentially useful tool, CRiSTAL, or “community-based risk-screening tool – adaptation and livelihoods” is a community project-based tool for livelihood and adaptation integration (IISD, 2012). As a project planning and management tool CRiSTAL offers a decision-making framework that guides users in identifying livelihoods resources most important to adaptation that then form the basis for designing adaptation strategies (IISD, 2012). This can be seen as an approach to assessment and adaptation planning that places local social and economic development at its core, through a livelihoods and capital lens, and closely resembles the proposed CRGG Framework. However, this tool is more suited for planning specific projects rather than wide-range institutional programming exercises that the CRGG Framework attempts to achieve. The expected outcome of using CRiSTAL is an improvement in livelihoods in a climate risk context. It is also a user-friendly tool in the form of a computer desktop application. Figure 3-3 shows the CRiSTAL framework organized according to its three phases and related outputs, which are achieved through a series of analytical steps.
Figure 3-3: The CRiSTAL Framework (IISD, 2012)
• List of livelihood resources for men and women that are most affected by climate hazards and most important for responding to climate impacts
• List of desired adaptation outcomes and important influencing factors to be monitored.
• Proposed adjustments to existing projects• Prioritized new activities to support climate
adaptation• A list of key opportunities and barriers to revised/
new project implementation
• Describe livelihood activities, key actors, gender and diversity aspects, and the ecological context
• Assess the implications for your analysis
• Identify resources that are important to local livelihoods and who has access and control over them
• Document observed and projected climate changes in the area
• Identify current and potential future climate hazards
• Document the impacts of these hazards
• Document community response to climate impacts
• Assess impacts of project activities on livelihood resources that are important in the climate context
• Revise project activities to support climate adaptation
• Identify opportunities and barriers to project implementation
• Propose new activities to reduce risks identified in step 2
• Identify criteria for evaluating proposed activities
• Prioritize and select proposed activities based on evaluation criteria
• Identify opportunities and barriers to project implementation
• Identify the changes in behavior or practice you want to see by the end of your project as result of the implementation of adaptation activities
• Identify important factors (climate and non-climatic) that can influence your expected outcomes
Describe livelihoods context1 Analyze
climate risk2 Revise existing project activities3 Design new
project activities4Identify key elements for your monitoring & evaluation framework
5
Evaluate the implications for your projectBSupport monitoring & evaluation
CUnderstand the livelihoods and climate contextA
PH
ASE
STE
PS
& P
RO
CE
SSO
UT
PU
TS

26
The livelihoods approach taken by CRiSTAL is based on an assumption that climate risk management and reduction at the local scale requires an appraisal of how livelihoods are conducted and maintained. Drawing on the UK Department for International Development (DFID)’s sustainable livelihoods framework, livelihoods are collectively supported by natural, human, physical, and financial capitals and resources (see more discussion on this topic in Annex B). As discussed in both CRiSTAL and in Annex B, these livelihood resources and capitals constitute the drivers to local economic development. By taking this approach to risk assessment and adaptation, practitioners and decision-makers are able to ascertain how these development drivers can be utilized to enable economic development in the context of climate change, rather than narrowly viewing climate risk as purely an environmental issue. A livelihoods approach also draws focus to people’s usually unequal access to and management of resource capitals, instead of simply just the presence or absence of resources, particularly natural and ecosystem resources, and how climate change is and may potentially alter that presence or absence in a given setting (IISD, 2012). This approach might be able to further explain why poorer and less well-off groups are more vulnerable to climate risk and less resilient due to their weak access to particular resources that result largely in insecure livelihoods.
When it comes to the identification, selection and implementation of adaptation options, CRiSTAL uses the multi criteria analysis (MCA). The first step after identifying adaptation measures in the CRiSTAL framework is to identify and weight (or rank) evaluation criteria for the selection of appropriate measures. This process should ideally be a discussion that includes community members and other local partners with a potential stake in the implementation of an adaptation measure (IISD, 2012). Whilst project users are encouraged to come up with their own criteria, CRiSTAL proposes seven criteria by default, which are shown in Table 3-1. After this step, the contribution of each proposed measure is evaluated against each selection criterion, and subsequently opportunities and barriers to implementation should be identified.
Mainstreaming adaptation at the local level and integration with higher scales and sectors.
Effective adaptation approaches should involve both stand-alone adaptation-centered policies and plans, and the holistic integration of measures to mainstream into all development strategies and processes, including policy-making, budgeting, implementation, and monitoring and evaluation, in order to make them more resilient to climate change, at national, sectoral, project and sub-national levels (OECD, 2009; UNDP-UNEP, 2011). Working with existing institutions and their policies and practices, as opposed to producing and building new ones, is often a more efficient use of generally scarce financial resources. A specific example of such mainstreaming would be seeking to adapt to the risks posed to the agricultural sector by including measures as part of pre-existing farming practices, within community development plans and national agriculture, water, poverty alleviation, and development policies and strategies (OECD, 2009).
The coordination of adaptation measures across these scales is crucial, as the planning and strategy time frame may be much shorter at the farm level, for example, seasonal, compared to the sectoral and central government level, which may operate on a multi-year or decadal time scale. In reality, the decisions made around policies and budgets at higher levels of government authority may hold sway over the ground-level actions; national level decision-making can be both enabling and constraining to adaptation choices (OECD, 2009). As well as a means for cross-scale coordination, mainstreaming can also be in the form of cross-sectoral policy integration, for example by taking a long-term perspective of future climate-related hazard patterns when

27
providing relief and development assistance that can shape future livelihoods and vulnerabilities (Agrawala and van Aalst, 2008; Dovers and Hezri, 2010). In general, the potential benefits of mainstreaming can be numerous and spread widely among stakeholders. Benefits include reduced risk to the most vulnerable, avoided policy conflicts, leveraging greater finances in climate-sensitive sectors than the available funds for financing adaptation separately, and improved efficiency compared with separate management of adaptation (Agrawala, 2004; Lebel et al., 2012).
Mainstreaming adaptation to climate change at the local level is deemed important for three reasons (OECD, 2009) - (i) the impacts of global climate change are manifested locally; according to local geography and other environmental, socio-economic and political factors, and specifically affect local livelihood and income-generating activities, (ii) vulnerability, resilience and adaptive
Criteria for Selection and Evaluation of Adaptation Responses
Description and Parameters of Criteria
Targets vulnerable groups
The most vulnerable socio-economic groups have the greatest need to increase their adaptive capacity. Activities that target vulnerable groups should be preferred over those that share their benefits indiscriminately across the population. Identifying which social groups tend to be more socially disadvantaged/ marginalized, and therefore who could be more vulnerable, is done by looking at the results of focus group consultations and by considering those groups who most lack access and control over key resources for building capacity to cope with climate risks.
Multiple beneficiariesThis straightforward criterion counts how many people are likely to benefit from an intervention. More widely shared benefits might be preferred. This criterion may in some cases be in partial conflict with the “target vulnerable groups” criterion.
Considers long-term changes
The proposed activities should already take into account the impacts of climate change. Nevertheless, practical actions often focus on the more short-term risks. This criterion is intended to make sure that the projected longer-term climatic changes are explicitly taken into account. However, a user may also decide that addressing more immediate climate hazards is more important and this should be reflected when weighting criterion.
Politically feasible
Running into strong political resistance with certain activities may undermine activities. Nevertheless, the transition towards sustainable development can be contentious and encounter political opposition. This criterion should therefore not be used to rule out innovative thinking.
Culturally appropriateChanges induced by new activities should respect the local culture. Otherwise, you may find that changes are not widely adopted. Similar to the previous criterion, this should not rule out change, as deeply rooted behaviors may often be part of the problem.
Long-term cost-effectiveness
Less costly solutions should be preferred for obvious reasons; however, cost effectiveness should be considered over the long term, as adaptation solutions will by their very nature often only pay off in the longer run. Looking at costs therefore needs to take into account not only the immediate implementation costs of the project, but also the avoided future costs of climate impacts.
Low-emissions
While reducing a carbon footprint may not be a priority for local development planning in poor and vulnerable populations, synergies between low-carbon and climate-resilient development should be exploited whenever possible. The operations of development organizations should also be run with as few emissions as possible.
Table 3-1: Example Evaluation Criteria for the Selection and Prioritization of Adaptation Responses (adapted from IISD, 2012)

28
capacity are context-specific and thus determined by local conditions, (iii) adaptation measures and development impacts are generally best observed and understood at the local level - the experience and observation of climate change impacts shapes adaptation decision-making and action through knowledge and capacity.
Climate change adaptation at the local level is strongly linked to other ”higher” levels of decision-making, namely the project, sectoral and national levels, particularly when considering the differences between decisions made at the local level and decisions made for the local level at these higher levels. As will be detailed later, local actor and stakeholder engagement and consultation should be central to such externally driven decision-making processes (OECD, 2009). Ideally, attempts to integrate adaptation into development at higher levels should be designed to enable, through frameworks, plans and incentives, sub-national and local government levels to assess their risk and vulnerability contexts and analyze their adaptation options in their own local economic development contexts. At the same time, of course, the central government frameworks and plans should be designed with bottom-up inputs and consultations in order to ensure their local level applicability and success.
One such example of an existing project seeking to mainstream adaptation at the local level in the Philippines is the Project Climate: Twin Phoenix, being implemented through a partnership between the HLURB, CCC, UNDP and Australian Aid. The projects Supplemental Guidelines on Mainstreaming Climate and Disaster Risks in the CLUP (HLURB et al., 2015) is helping LGUs formulate risk-sensitive CLUPs and zoning ordinances to guide allocation of land use in a way that minimizes risk creation and maximizes risk prevention. The project Supplemental Guidelines offer a step-by-step process to risk assessment and adaptation mainstreaming (into the CLUP) at sub-national levels, and would serve as a useful referencing tool for the CRGG implementation team.
Key steps and entry points for integrating adaptation into local development processes
In general terms, the process for integrating climate change adaptation into development policies, strategies and plans involved the linking of two processes - (i) the process of assessing climate risk (hazard, impact and vulnerability assessments) and choosing adaptation measures, and (ii) the process of creating and implementing development policies and plans (OECD, 2009). Specific sub-national level planning and integration of adaptation measures acknowledges that the local manifestations of climate change are context-specific, and vulnerabilities and coping and adaptive capacities are site specific (Lebel et al., 2012). Successful integration relies on a set of enabling conditions that can be understood as key steps for achieving success. The framework for mainstreaming at the national level put forward by Huq and Ayers (2008) proposes a linear sequence of four steps. However, it is a relatively simple and unspecified framework, and thus this section of builds on these steps, with a specific discussion of how to mainstream at the sub-national level.
• Awareness-raising and targeted messagingRaising awareness among local stakeholders such as community-based organizations, community leaders, and households, is key to informed decision-making for adaptation. Effective awareness-raising efforts should not scaremonger (alarm) stakeholders, but should enable those at risk to anticipate forthcoming shocks and stresses by communicating and describing changing risk contexts, the potential implications of such changes, and how

29
to prepare for anticipated impacts. Further, the selection of appropriate communication tools and channels is equally important to achieving increased awareness and resilience. In selecting means of communicating climate risk messages, it should be considered that men and women use different information channels, and that women may actually have less access to information than men do. Therefore adaptation information should be designed and disseminated in gender-sensitive ways, and be part of broader efforts to explicitly ensure women and girls can easily have access to and understand the required information (OECD, 2009).
Overall, climate change messages that combine both an explanation of the phenomenon and its local implications are effective, and the Red Cross/Red Crescent Climate Guide (IFRC, 2007) is an appropriate tool for local-level risk communication that builds on this approach. The UNDP-UNEP (2011) guide for mainstreaming adaptation into development planning highlights awareness-raising among decision-makers as a continuing challenge due to the complexity of climate change and its many links with development issues. It argues that to increase the relevance of adaptation to decision makers, adaptation planning needs to explicitly make the linkages with broader development goals of poverty reduction and pro-poor economic growth, and encourage economic cost-benefit and cost-effectiveness analyses of adaptation actions.
• Gathering and using appropriate information Local decision-making for adaptation requires a wide range of information and sources, with data needed at various scales, for example, from household income to global climate change projections. As part of a “whole of government” approach, institutions and ministries including universities, land surveying, census and water resource management departments, at national and sub-national levels, should be engaged in adaptation planning processes (OECD, 2009). It is, however, the local-level information that is most important to the process of integrating adaptation into local development planning. Understanding local contexts intimately enables actors to scale down, digest, and adapt national development frameworks and economic growth goals into appropriate local strategies for a mutual enforcing relationship between strengthening adaptive capacity and local economic development. The types of information needed for adaptation planning and the tools available for gathering that information are extensive; Table 3-2, taken from OECD (2009), provides some useful examples.
Of the climate risk and vulnerability assessment tools noted in Annex B in Table B-9, CRiSTAL offers an approach to understanding risk and vulnerability in the local development context. CRiSTAL is not, however, a stand-alone, step-by-step, risk or vulnerability assessment tool such as the Red Cross/Red Crescent Climate Guide (IFRC, 2007). Instead, CRiSTAL is a more narrowly focused guide for analyzing local livelihoods, in an actual and expected climate risk context (IISD, 2012). The methods for gathering this information, which feeds into an understanding of the local development situation, should be participatory where possible and appropriate.
• Stakeholder engagementThe UNDP-UNEP (2011) framework for mainstreaming emphasizes the importance of stakeholder engagement throughout, and suggests the process should be integrative and iterative (see Figure 3-2). Moreover, to achieve effective and sustained engagement with local actors and stakeholders, local government decision-makers should step beyond a top-down, single-direction relationship and view and engage those with strong roots in at-risk
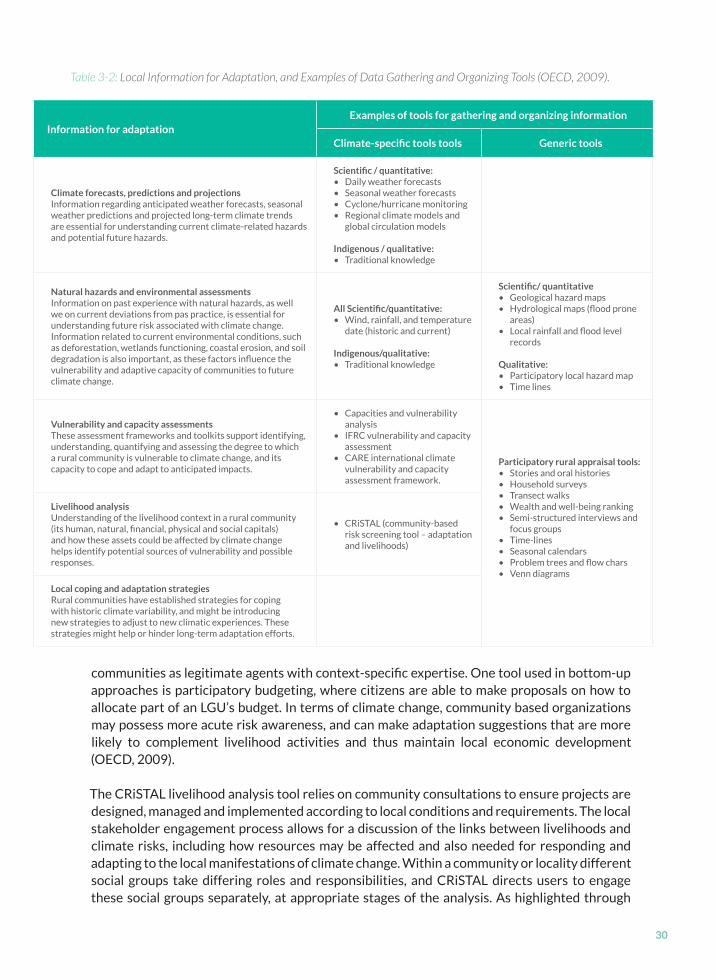
30
communities as legitimate agents with context-specific expertise. One tool used in bottom-up approaches is participatory budgeting, where citizens are able to make proposals on how to allocate part of an LGU’s budget. In terms of climate change, community based organizations may possess more acute risk awareness, and can make adaptation suggestions that are more likely to complement livelihood activities and thus maintain local economic development (OECD, 2009).
The CRiSTAL livelihood analysis tool relies on community consultations to ensure projects are designed, managed and implemented according to local conditions and requirements. The local stakeholder engagement process allows for a discussion of the links between livelihoods and climate risks, including how resources may be affected and also needed for responding and adapting to the local manifestations of climate change. Within a community or locality different social groups take differing roles and responsibilities, and CRiSTAL directs users to engage these social groups separately, at appropriate stages of the analysis. As highlighted through
Table 3-2: Local Information for Adaptation, and Examples of Data Gathering and Organizing Tools (OECD, 2009).
Information for adaptationExamples of tools for gathering and organizing information
Climate-specific tools tools Generic tools
Climate forecasts, predictions and projectionsInformation regarding anticipated weather forecasts, seasonal weather predictions and projected long-term climate trends are essential for understanding current climate-related hazards and potential future hazards.
Scientific / quantitative:• Daily weather forecasts• Seasonal weather forecasts• Cyclone/hurricane monitoring• Regional climate models and
global circulation models
Indigenous / qualitative:• Traditional knowledge
Natural hazards and environmental assessmentsInformation on past experience with natural hazards, as well we on current deviations from pas practice, is essential for understanding future risk associated with climate change.Information related to current environmental conditions, such as deforestation, wetlands functioning, coastal erosion, and soil degradation is also important, as these factors influence the vulnerability and adaptive capacity of communities to future climate change.
All Scientific/quantitative:• Wind, rainfall, and temperature
date (historic and current)
Indigenous/qualitative:• Traditional knowledge
Scientific/ quantitative• Geological hazard maps• Hydrological maps (flood prone
areas)• Local rainfall and flood level
records
Qualitative:• Participatory local hazard map• Time lines
Vulnerability and capacity assessmentsThese assessment frameworks and toolkits support identifying, understanding, quantifying and assessing the degree to which a rural community is vulnerable to climate change, and its capacity to cope and adapt to anticipated impacts.
• Capacities and vulnerability analysis
• IFRC vulnerability and capacity assessment
• CARE international climate vulnerability and capacity assessment framework.
Participatory rural appraisal tools:• Stories and oral histories• Household surveys• Transect walks• Wealth and well-being ranking• Semi-structured interviews and
focus groups• Time-lines• Seasonal calendars• Problem trees and flow chars• Venn diagrams
Livelihood analysisUnderstanding of the livelihood context in a rural community (its human, natural, financial, physical and social capitals) and how these assets could be affected by climate change helps identify potential sources of vulnerability and possible responses.
• CRiSTAL (community-based risk screening tool – adaptation and livelihoods)
Local coping and adaptation strategiesRural communities have established strategies for coping with historic climate variability, and might be introducing new strategies to adjust to new climatic experiences. These strategies might help or hinder long-term adaptation efforts.

31
the OECD (2009) guidance, considering and addressing the contrasting positions of men and women in society is vital to the processes of adaptation action.
• Entry points for integrating adaptation with local development planningOpportunities for the integration of adaptation into development planning are understood in terms of entry points (OECD, 2009). Whilst the UNDP-UNEP (2011) guidance analyses entry points for integration into national development planning by breaking down the levels of planning into national, sectoral and sub-national (see Table 3-3), the OECD (2009) guidance identifies four entry points for integration specifically at the local level. Whilst the national level is certainly critical, as the planning often provides the framework within which sub-national levels operate and the government coordinates sector-specific policies (Lebel et al., 2012), this sub-section of the report will maintain a local-level focus and as such evaluate local entry points for mainstreaming adaptation, primarily into rural development planning. Whilst decentralization and devolution of powers and duties has enabled LGUs to become more accountable to the people, the appropriateness of each of these entry points for integration is always dependent upon the specific administrative system context in question (Lebel et al., 2012). In any case, a greater emphasis on providing bottom-up channels for lessons learned at the local level to shape planning and frameworks at higher levels is needed.
Table 3-3: Entry Points for the Integration of Adaptation into Development Planning Levels (UNDP-UNEP, 2011).
Planning Level Entry Points
National government and cross-sector ministries
Poverty reduction strategy paper
National development plan
MDG-based national development strategy
National budget allocation process or revies (e.g. medium-term expenditure framework, public expenditure review)
Sector ministries
Sector strategies, plans and policies (e.g. agricultural sector plan)
Preparation of sector budgets
Public expenditure reviews
Subnational authorities
Decentralization policies
District plans
Preparation of subnational budgets
32
ENTRY POINT 01
Consideration of climate change implications in development planning processes of local governments
Developmentplanninginvolvesthesettingofgoalsandobjectivesforsocialandeconomicdevelopment,andproducingandimplementingstrategiesfortheachievementofthesegoalsandobjectivesthroughtheallocationandmanagementofhuman,naturalandfinancialresources.Atthesub-nationallevel,developmentplanningwillbefocusedonrelativelysmallspatialandtemporalscales,andmaystriveformorespecific,targetedoutcomessuitedtothelocaldevelopmentcontext.Foradaptation,theseprocessesofferframeworkswithinwhichprioritiescanbeintegrated(seeFigure3-1)(OECD,2009).However,thelong-termconsequencesofplanningdecisions,inthecontextoffuturerisksthatwillneedtobeaddressed,shouldbeconsidered(Füssel,2007).
Inruralcontexts,developmentplansoftenprimarilyfocusontheallocationandmanagementofnaturalcapitalandbiophysicalresourcesforproductivity,asdiscussedabove,forthegoalofsustainingandimprovinglivelihoods,reducinglevelsofpoverty,andcontributingtoeconomicdevelopmentacrossscales,fromthenationaltothelocal.Aconsiderationofclimatechangecanbeincorporatedintoruraldevelopmentplanningprocessesthroughmeanssuchascommunity-driven,semi-autonomous,villageactionplans,anddistrictdevelopmentplanswhichcomeunderanationaldevelopmentplanningframeworkwhichshouldidentifyprioritiesandtrade-offs(OECD,2009;Lebeletal.,2012).
ENTRY POINT 02
Adjustment of local regulatory and service provision plans (including information on local climate change impacts)
TheadjustmentofregulatoryframeworksbyLGUscanenablemoreeffectiveresourcemanagementandland-useplanning;processeswhereadaptationconsiderationscanbeintegrated.Forinstance,legislationcanallowforincentivesforwaterconservationandimprovingtheresilienceoflivelihoods,promotionofecosystemgoodsandservicesprotection,andtheconsiderationofcurrentandprojectedclimaterisksandexposedareasininfrastructureprojectplanning.Promotingadaptationtolocalstakeholdersshouldensurethatcontextualclimatechangeinformationiswidelydisseminated.Thisrequiresinfrastructureandservicesforthegathering,storingandanalyzingofinformationdatabasesrelatingtohazards,climaticprojections,andlocalvulnerability.
ENTRY POINT 03
Adjustment of local government accountability mechanisms
Governmentaccountabilitymechanisms,forexampleannualdistrictperformancecontracts,canincludespecificmeasuresforthemanagementoflocalclimaterisks.Thesecontractsexistbetweendifferentlevelsofgovernmentforthemonitoringandevaluationofperformanceasawayofholdingdecision-makersaccountabletotheircitizensandconstituencies.Typically,thecontractswillincludeasummaryofthelocaldevelopmentcontext,andspecificgoalsrelatingtohealth,education,agriculture,infrastructure,water,environmentalprotection,andotherdevelopmentareas.Indicatorsshouldbeincludedtomeasuretheachievementofgoalsagainstcurrentbaselineconditionsofsocio-economicdevelopment.Ifawarenessofclimateriskscanbebuilt,thesecontractshaveclearentrypointsforintegratingcontext-specificadaptationactions.
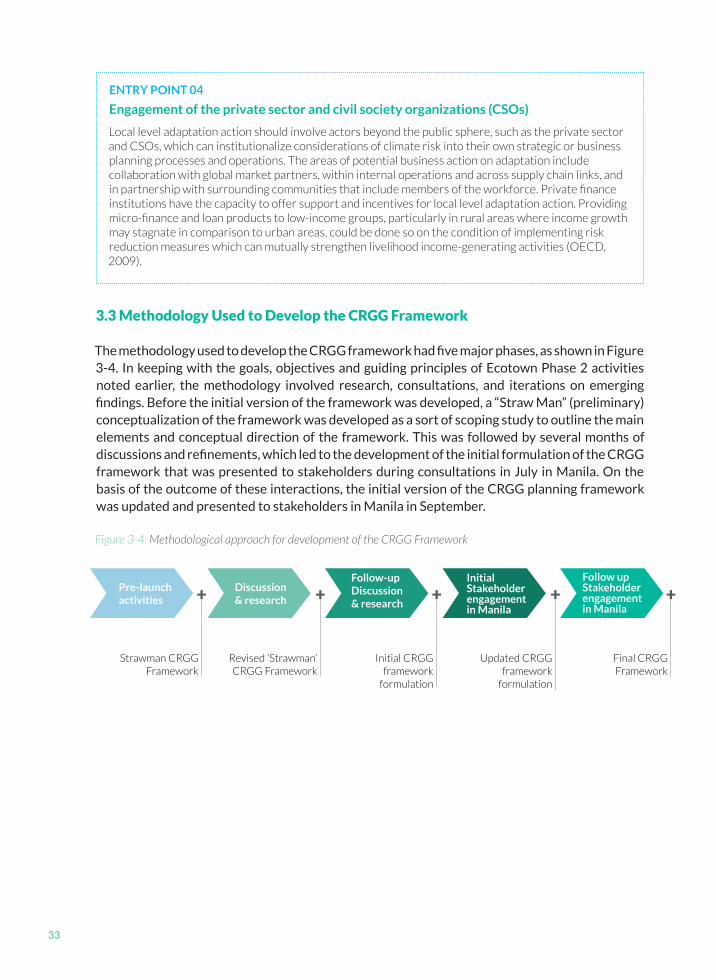
33
ENTRY POINT 04
Engagement of the private sector and civil society organizations (CSOs)
Localleveladaptationactionshouldinvolveactorsbeyondthepublicsphere,suchastheprivatesectorandCSOs,whichcaninstitutionalizeconsiderationsofclimateriskintotheirownstrategicorbusinessplanningprocessesandoperations.Theareasofpotentialbusinessactiononadaptationincludecollaborationwithglobalmarketpartners,withininternaloperationsandacrosssupplychainlinks,andinpartnershipwithsurroundingcommunitiesthatincludemembersoftheworkforce.Privatefinanceinstitutionshavethecapacitytooffersupportandincentivesforlocalleveladaptationaction.Providingmicro-financeandloanproductstolow-incomegroups,particularlyinruralareaswhereincomegrowthmaystagnateincomparisontourbanareas,couldbedonesoontheconditionofimplementingriskreductionmeasureswhichcanmutuallystrengthenlivelihoodincome-generatingactivities(OECD,2009).
3.3 Methodology Used to Develop the CRGG Framework
The methodology used to develop the CRGG framework had five major phases, as shown in Figure 3-4. In keeping with the goals, objectives and guiding principles of Ecotown Phase 2 activities noted earlier, the methodology involved research, consultations, and iterations on emerging findings. Before the initial version of the framework was developed, a “Straw Man” (preliminary) conceptualization of the framework was developed as a sort of scoping study to outline the main elements and conceptual direction of the framework. This was followed by several months of discussions and refinements, which led to the development of the initial formulation of the CRGG framework that was presented to stakeholders during consultations in July in Manila. On the basis of the outcome of these interactions, the initial version of the CRGG planning framework was updated and presented to stakeholders in Manila in September.
Figure 3-4: Methodological approach for development of the CRGG Framework
Pre-launch activities
Discussion & research
Follow-up Discussion & research
Initial Stakeholder engagement in Manila
Follow up Stakeholder engagement in Manila
StrawmanCRGGFramework
FinalCRGGFramework
Revised‘Strawman’CRGGFramework
InitialCRGGframework
formulation
UpdatedCRGGframework
formulation

34
4C h a p t e r
Presentation of Ecotown Phase 2 CRGG Planning Framework

35
The following, and central, chapter of this Ecotown Phase 2 Climate Resilient Green Growth Planning Final Report details GGGI’s proposed framework for CRGG Planning in the Philippines at the provincial level, and in particular, for use in Ecotown Phase 2 projects. The steps in this Framework are designed to provide planners at the provincial level with thorough, but flexible and practical, directions for carrying out comprehensive CRGG planning to identify and implement climate adaptation options that also contribute toward goals for economic development.
The seven overall steps in the framework are described in the sections of this chapter that follow. These steps are organized into three “Stages”, with Steps 1 through 3 comprising a “Start-up and Data Assembly” phase in which the project team is organized, data, mostly from existing sources, is collected to describe the planning task, and a summary baseline future economic development path is created to serve as a basis for assessment of climate change adaptation options.
The second Stage, “Assessment” involves first assessing the climate change hazards, impacts, and vulnerabilities associated with the sector activities and resource use implied in the economic development baseline path prepared in Stage I, then developing and prioritizing a list of adaptation measures with economic development benefits and consistent with the economic development path created in the first Stage.
Stage III involves assembling the priority adaptation measures into a plan of action—projects and programs—consistent with and supporting/augmenting economic development goals, then undertaking detailed planning of and implementing the chosen project and programs. The remainder of this chapter offers a stepwise listing of the elements of the framework, with discussion of the types of activities and analytical methods that are recommended at each step. Each Step, and the elements that make up the Step, are described in individual subsections of this Chapter. An overall conceptual diagram of the CRGG Planning Framework is provided in Figure 4-1, below.
Presentation of Ecotown Phase 2 CRGG Planning Framework
Figure 4-1: Overall Stages and Steps in CRGG Planning Framework
Phase 2 CRGG Planning Framework Activity Roadmap
STAGE 1Start-up & Data Assembly
*Step1:Projectmobilization(teambuilding,trainingneeds,stakeholderinvolvement,budget,etc.)
*Step2:Rapidassessment(climaticdata,regionalclimatemodelingdata,socioeconomicdata,etc.)
*Step3:Assemblyofeconomicdevelopmentpaths(Baselineprovincialdevelopmentplansandprojects,privatedevelopments,recenttrends,etc.)
STAGE 2Assessment
*Step4:Assessment(climatichazards,priorityhazards,potentialimpacts,vulnerabilities,etc.)
*Step5:AdaptationOptionDevelopment(identification,prioritization,evaluation,prioritization,evaluation,etc.)
STAGE 3Action Planning and Implementation
*Step6:CRGGDevelopmentpath(identification,evaluation,recommendations,etc.)
*Step7:Implementation(implementationplans,monitoring,evaluation,etc.)

36
Operationally, although the application of the CRGG Framework laid out in the following sections of this Chapter could be carried out independently from the typical provincial economic development planning process, it is intended to be to a large extent integrated with and adding value existing local development planning processes. Much of the data to be gathered for implementation of the CRGG Planning Framework are data that would need to be gathered for a comprehensive economic development planning effort anyway, or, in some cases, would come out of such an effort. The Framework described below therefore adds to the toolkit of provincial planners in that it provides a way to address climate resilience in the process of development planning. The CRGG planning approach is therefore a “lens” by which the local governments can revisit and enhance their plans and planning process to come up with a Provincial Climate Resilient Green Growth Strategy that will serve as basis for concrete local government actions.
As noted below, existing provincial planning committees may serve as the starting point for developing CRGG Advisory Committees at the provincial level, and it is anticipated that there will be a substantial (but not complete) overlap between the officials and analysts engaged in PDPFP development and in applying the CRGG Framework. Although the exact interface between the PDPFP and CRGG processes may vary from province to province based on goal, needs, and capabilities in different places, overall, the CRGG Framework in concept should be seen as adding capability to the PDPFP planning process.
As noted in Chapter 1 of this CRGG Framework, although the focus of this document is on linked planning for climate change adaptation and economic development, it is highly likely that most such integrated planning efforts will also include at least some elements of planning associated with climate change mitigation, or GHG emissions reduction. Although it is beyond the scope of this document to provide detail on how mitigation planning can be incorporated into the framework presented here, a number of “entry points” where tasks or processes related to mitigation planning might be efficiently integrated into the CRGG Framework, if desired, have been indicated in the descriptions of Framework steps below.
4.1 Step 1: Project Organization
The focus of Step 1 of the CRGG Planning Framework is the organization of the CRGG planning effort itself. This involves forming and readying the team that will carry out and oversee the planning effort, and attending to related issues such as identifying the project timeline, budget, and staffing, and defining the roles that stakeholders will play in the process. The organizational structures and processes suggested for this step are intended to be generic, and thus applicable at the provincial level throughout the Philippines or at a similar jurisdictional level in other countries, but they are also broadly consistent with the organizational structures anticipated in existing Ecotown Phase 2 proposals.
The tasks involved in organizing a CRGG planning effort at the provincial level will typically include the following:
• Identify the lead planning agency and other agencies that will be involved, ideally as an inter-agency Task Force, in the planning effort. The planning exercise could, however, also be embedded within existing institutional structures such as the Local Planning Structure within LGUs (see Figure 1-4 for this purpose). The Task Force will include agencies at the provincial and national levels, and may include key agencies at the municipal level (for

37
example, from large and important cities or towns within a province, if applicable. 6 The “lead” agency identified can be responsible for convening the other agencies, but policies and procedures could be collectively created by an initial leadership/guidance core team of 3-4 representatives under the authority of one or more senior agency officials. 7 The members of the core team could be technical experts and/or hands-on planning personnel. It may be desirable, in some provinces, to coordinate CRGG planning efforts at the regional level to make good use of planning capacity resources and expertise, and to assure that the plans prepared by the different provinces are consistent and compatible with those of their neighbors.
• Determine key planning objectives consistent with the aims of CRGG Planning. Key general objectives of CRGG planning will include implementing climate adaptation measures so as to reduce the risk to the economy and residents of climate-related hazards, adoption of adaptation measures that also improve economic performance and the availability of resources needed for development, improvement of equity and conditions for disadvantaged groups, and many others. An illustrative list of objectives for a CRGG Planning effort is provided in Table 4-1, below. The NCCAP should be reviewed by potential authorities as planning objectives are set, as provincial CRGG objectives will usually need to be consistent with those used at the national level for climate planning.
6. The formation of an inter-agency task force or team may help to ensure that planning efforts of individual agencies are appropriately integrated and not locked in “silos” with limited communications between the agencies. Philippine government agencies are in the process of acclimating to a more inclusive planning approach, especially with respect to mounting DRR efforts that require integrated, rather than segmented, responses through a “cluster” approach.
7. It will be necessary to assure that the Ecotown Phase 2 project teams have an appropriate institutional mandate, for example, via a memorandum of authority between the national government and GGGI to establish teams at the provincial level.
8. From, for example, UNFCCC (2012), The National Adaptation Plan Process: A Brief Overview, LDC Expert Group, December, 2012, available as http://unfccc.int/resource/docs/publications/publication_ldc_napp_2013.pdf.
9. UNFCCC (2012), ibid.
Table 4-1: Examples of Key Planning Objectives
Category Example of Objective
Climate Change Adaptation
Reduce vulnerability to the impacts of climate change by building adaptive capacity and resilience. 8
Adaptation and Development
Integrate climate change adaptation into development planning processes and strategies. 9
Social and Gender EquityImprove the access and benefits of women and disadvantaged groups to economic development
Social Services Improve emergency services related to climate change hazards
Economic DevelopmentSupport the development of key industries compatible with sustainable development/green growth
Ecosystem Protection Support the protection of key ecosystems and habitats from climate change impacts
Climate Change Mitigation
Reduce GHG emissions while addressing climate change adaptation
Environmental Protection
Reduce emissions of local and regional air and water pollutants
38
• Prepare an overall project budget and schedule. Ideally, this should be accomplished by breaking the overall planning effort into a series of tasks (based on the steps identified in this Framework, with customization as needed to suit local conditions), and planning the labor, travel, materials, services, and other inputs needed for each task, as well as the timeline for each task. For Ecotown Phase 2 projects, the timeline for completion of the planning effort is on the order of 12 to 18 months, with more complex plans potentially requiring 24 months to prepare. It may be desirable, where possible and practical, to synchronize the timing of CRGG planning to local/provincial political cycles to assure maximum support for CRGG planning outcomes. Once a draft budget has been determined, funds to carry out the planning project must be secured from provincial/national government, international agency sources. In the even that funds ultimately raised are insufficient to cover the total cost of the project, the planning effort may need to be scaled back in scope or level of detail.
• Determine approach to and timing of stakeholder involvement. Stakeholder involvement is crucial to obtaining a complete understanding of how adaptation options may affect the various groups in society, but the inclusion of stakeholders can be a time-consuming and expensive process. At the provincial level, it is recommended to focus on assembling a committee of individuals who can represent the interests of groups of stakeholders. This can be accomplished, for example, by convening from the outset a stakeholder Advisory Committee to call upon for advice or review at specific points in the process. This Committee might not be involved in all day-to-day planning activities, but could be called upon to help determine goals and objectives, review key intermediate and final draft outputs, including adaptation/economic development plan review, as well as throughout the process for data gathering and obtaining feedback on the feasibility/desirability of specific options.
• Thus, the small leadership/guidance group formed as above would be complemented by a socially inclusive Advisory Committee composed of provincial-level representatives from independent but affected constituencies including, for example, farmers, fishers, private small and medium enterprises (SMEs) and companies, representatives of municipal governments, representatives of selected national governmental organizations (including national government agencies with regional and provincial mandates such as NEDA, the Department of Interior and Local Government, the Department of Trade and Industry, and DENR), emergency responders, market vendors, university professors, members of indigenous culture committees (if applicable), local NGOs, etc. In selected cases it may be possible to include some direct stakeholders in Advisory Committees, as was done in Ecotown Phase 1 at the municipal level, but in many cases it may be more practical to include in Advisory Committees representatives of stakeholder groups, given the broader scope of provincial planning efforts.
• The Advisory Committee can reflect on and influence the planning agenda as well as its outcomes. Note that the Advisory Committee need not be a totally new body. If existing institutional mechanisms such as a Provincial Development Council or the Technical Component Sectoral Committees10 exist and are appropriate to be augmented by the addition of individuals with appropriate background and expertise to form an inclusive Advisory Committee, it may be feasible and more efficient to build on existing institutions
10. The Provincial Development Council is a political sub-group within the LGU. The Technical Component of the local planning structure, together with its technical working groups embedded in sectoral committees would be well-placed to address the requirements of applying the CRGG methodology if deemed appropriate. Planning outcomes, on the other hand, could be presented to the Provincial Development Council for approval and/or deliberation as the Council has decision-making power.

39
for the CRGG Planning effort, rather than starting with a new group. Depending on the complexity of the CRGG Planning effort in a given province, the Advisory Committee may find it useful to appoint several smaller “Technical Working Groups” composed of Advisory Group members and other experts, to study issues and provide recommendations (for example, on adaptation/economic development options and measures) related to particular issues and/or sectors, and provide outputs for review by the full Advisory Committee.
• Identify individuals to be directly involved in planning effort (“CRGG Planning Team”, which could be an inter-agency team, if applicable)11 . The team would likely include regional agency staff, regional technical experts (such as local university professors 12 ), national technical experts and national agency staff, international experts. The types of expertise that would be expected to be represented in the CRGG Planning Team would be those with expertise in climate adaptation planning, economists and others with experience in development planning, those familiar with national and provincial demographic, economic, industry, and other statistics, land-use planning experts and geographers, and others with skills relevant to the planning effort. When the individuals for the Team have been identified, the next (or concurrent) step will be to secure time allocation to allow those seconded from agencies time to adequately participate in the planning effort. For those coming to the Planning Team from outside government, for example, national or regional consultants, funding from provincial or national agencies, or from international donors, will need to be secured to underwrite their involvement. This element would include the preparation of a detailed staffing plan. Table 4-2 provides general guidance as to the types of expertise and number of individuals that might be engaged on the CRGG Planning team at the provincial level.
• Identify training needs and obtain or make plans to obtain training for CRGG Planning Team. For example, some of the members of Team may need to be trained in the use of quantitative tools associated with water, energy, or economic planning, if such tools are to be used, as well as in the qualitative methods of rapid assessment, mapping potential climate hazards, evaluating climate change adaptation options, and related planning steps described in this Framework. Training may be available in the form of workshops taught by national or international experts, or in short courses attended by Project Team members inside or outside of the Philippines. 14
Table 4-2: Illustrative Roles/Expertise for CRGG Planning Team Members (Provincial)13
Role/ExpertiseInvolved in
Framework StepsEstimated
Person-Months
Planning Team Leader or Co-Leaders All 18
Project Secretariat Staff (and related service providers) All 36
Geographer/Mapping Expert(s) 2 - 6 12
Economist/Economic Development Experts 2 - 6 24
Provincial Planners/Policy Development 2 - 7 12
Climate Change Assessment Expert(s) 2 - 6 10
Social/Gender Equity Expert(s) 2 - 7 12
Poverty Alleviation Impacts Expert(s) 2 - 7 12

40
• Identify key parameters of the planning process, such as the “base year” for analysis and the time span of the planning effort. Typically, the base year will be the most recent year for which collected economic, demographic, industrial and agricultural production, and other data are most readily available, often one or two years before the start date of the planning effort. Alternatively the base year might be the year before the most recent Provincial Development and Physical Framework Plan (PDPFP) to which the CRGG planning effort is intended to align. The time span of the planning effort will often be longer than the time span of the PDPFP, which have a 10-year time horizon, as many of the adaptation options being considered require and need to address climate trends that are much longer than 10 years. At the same time, it is hard to do economic planning with a very long time horizon. As such a reasonable time horizon for CRGG planning might be 20 to 30 years, which, given a start year of 2015, means that the plans created would extend through 2035 or 2045.
• Set up a Project Secretariat, likely based in the lead planning agency. The Project Secretariat would coordinate the activities of the Project team, including handling information management, assisting with travel and other logistics for Project Team members Advisory Committee members, and consultants to the project, maintaining the project accounts and budget, and addressing other project needs.
Figure 4-2 provides a summary of the different groups typically expected to be involved in an Ecotown Phase 2 CRGG Planning Project, with brief descriptions of the expected roles of the groups. In a planning effort that also includes mitigation planning, most of the tasks above would be applicable to and usefully coordinated with mitigation activities as well, although different types of technical expertise (and thus training) will likely be needed to augment the adaptation planning skills on the Project Team, and, of course, additional budget would probably be needed.
As noted above, the descriptions of tasks and expected organization described here is intended to be relatively generic, and thus applicable to other provincial climate adaptation/development analyses in the Philippines (beyond those carried out with GGGI funds), as well as adaptable to similar situations in other nations. What is presented above, however, is generally consistent with the Ecotown Phase 2 organizational structure proposed by the CCC and GGGI. Table 4-3 provides a sample comparison of project groups and roles described above with those proposed for the Ecotown Phase 2 project. 15
11. However, as expressed earlier, the CRGG Framework may be implemented by those involved in the technical component of the current local planning structure (see Figure 1 4).
12. Philippine colleagues have made the point that involvement of local academics in CRGG planning project, in addition to adding expertise to the Planning Team, offers the means to integrate training in planning methods into local university curricula, providing a source for additional trained planners over time, and also that in instances where provincial agency staff may change substantially over the space of a few years, local university professors can constitute a type of external “institutional memory” for planning processes. Professors in different provinces might even be “networked” in the way that, years ago, professors from rural and provincial universities were trained and connected through a network of “ANECs” (Affiliated Non-Conventional Energy Centers) working on renewable energy issues in the 1990s. Further, it has been suggested that incorporating professors and their students into CRGG planning efforts in various roles may assist in both gathering and improving the required data for planning efforts, and in encouraging government agencies and industries to work toward greater transparency in information sharing with stakeholder groups.
13. Person-months shown assume an 18-month project.14. For training of Project Team members through short courses, it will be necessary to plan well in advance for training needs so that
the individuals participating receive the training they need in time to participate in the planning effort.15. CCC and GGGI (2014), Project Proposal: Eco-Town Scale Up (Phase 2): Climate Resilient Green Growth Planning at the Provincial
Level, dated September, 2014.

41
TYPICAL OUTPUTS OF CRGG STEP 01: PROJECT ORGANIZATION
•Projectorganizationalchart•Projectbudget•Projectstaffingplan•Projecttrainingplan•ListofStakeholders(organizationsand/orindividualswithinorganizations)tobeinvitedtojoinAdvisoryCommittee
Table 4-3: Comparison of CRGG Framework Planning Groups/Roles with those Identified in Ecotown Phase 2 Proposals
Planning Groups/Roles from this Framework
Planning Groups/Roles in Ecotown Phase 2 Proposal
Provincial Lead Agency/Project Secretariat Provincial Government
CRGG Planning Team (Provincial)* Provincial Project Teams (PPT), Local Experts and Institutions
Advisory Committee (Provincial) Provincial Consultative Group (PCG)
[National Government/Funder Input to Provincial CRGG Planning Team]
Climate Change Commission, National Project Advisory Committee (NPAC), National Project Management Unit (PMU), GGGI-PPO (Philippine Project Office) Project Manager
* May include some members from national organizations, as appropriate.
Figure 4-2: Groups Involved in CRGG Planning Effort and Their Roles
CRGG PLANNING PROJECT TEAM
Convenes and supports planning effort, input on provincial goals, review for consistency with development plans
Provincial Lead Agency/Project Secretariat
Other Stakeholders and Experts
Planning budget/timeline input, project goals from
funder perspective, consistency with other
ongoing CRGG planning
Input from perspective of stakeholders, information/expertise needed for planning effort, assist in selected planning decisions (Advisory Committee)
Overall responsibility for carrying out planning process, including data collection, analysis, document preparation, meeting facilitation, report preparation…
ADVISORY COMMITTEE
Input from national plans/goals/budgets,
review consistency with national efforts
National Agencies
Funder(s)

42
4.2 Step 2: Rapid Assessment: Provincial Profile, Climate Projections, Resource Base, and Economic Development
Existing information in several areas will need to be collected and compiled, as described below. 16 A key goal of this step will be to build upon information that already exists at the provincial, national and local levels to inform the provincial CRGG planning effort, though it is well-understood that data availability and even the timing of planning efforts will vary widely across provinces, and in many cases the expertise of the planning team and Advisory Committee will be needed to fill gaps in information with judicious assumptions based on local knowledge, with information adapted from, for example, similar planning jurisdictions, and by other means. Moreover, it is also understood that capacity for planning in provinces in the different topic areas needed for CRGG planning in general, and some of the techniques in Step 4 in particular, will vary from place to place, and will need to be built and/or augmented with other expertise in some places.
4.2.1 Research and Assemble Socioeconomic and Gender Provincial Profile
Obtain basic and where possible, gender-disaggregated information on the economy, demography, wealth and income rankings, demography and migration, health and education, on the province. Many of these may be contained in PDPFP and other existing planning documents, but some additional existing data may need to be collected from the provincial PSA and other public sources. This information would include information on provincial income accounts (as well as income accounts at the municipal level, if applicable)17, labor force participation in manufacturing, agriculture and services, as well as incomes from these occupation sources to establish local stratified wealth rankings. Information collected would include quantitative and qualitative information on major sectors and subsectors, resources used, historical and time-based trends in the economy and its key actors and drivers, related natural, human, financial and other “drivers” to economic development, including rates of poverty in areas of the province and situations with
16. An illustrative listing of the types of data to be collected is provided as Annex D to this Framework document, as well as in section 5.2.5.
17. This may serve as a proxy in the absence of a provincial GDP
Potential Step 1 Entry Point for Mitigation PlanningVirtually all of the activities identified above for project organization for adaptation/economic development planning are directly applicable or easily expandable to GHG emissions mitigation planning efforts, or to “Low Carbon Development” or “Low Emissions Development Strategy” planning efforts, which typically have most of the same objectives. Mitigation planning efforts will require designation of a lead planning agency, definition of objectives for the planning process, identification and development of a planning team—some of whom may be shared with the adaptation/economic development planning team, but some of whom likely will not because different skills are needed—and definition of a stakeholder engagement/involvement process. It is possible that mitigation and adaptation/economic development planning efforts can share a single Advisory Committee, which will help to assure that the goals and outcomes of the two processes are coordinated and consistent, but if there is a single Advisory Committee, it is likely that two or more “Technical Working Groups” or similar will be needed to oversee and provide input separately on mitigation and adaptation/economic development processes, because those processes often require different types of expertise and attract the interest of different individuals. In addition, the mitigation planning effort at the provincial level will need to be coordinated with similar national and local efforts, as is the case with adaptation planning.

43
regard to disadvantaged groups. Assemble collected profile data into a summary write-up to inform further steps in the CRGG Framework.
4.2.2 Compile Climate Projections and Recent Disasters
Obtain existing “Top Down” information on climate change impacts and vulnerability assessments, for example, what is known about how changing climate is predicted affect the province, including rainfall patterns, temperature, and SLR. These data may be obtained from the provincial or regional offices of PAGASA and the National Disaster Risk Reduction and Management Council (NDRRMC), as well as from regional/provincial news publications, if any.
It is important to note that “Top-Down”, as used regarding climatic information refers to regional dynamic downscaling experiments. For many province-specific applications, top-down global datasets may not have adequate spatial or temporal resolution to resolve the local or regional aspects of weather and climate. Hence, the outputs of regional climate models (RCMs), which downscale these comparatively coarse resolution global datasets to smaller geographic regions on a case-by-case basis, are recommended to be used in order to provide the finer spatial and temporal resolution information needed. In the Philippines, the number of weather- and climate-sensitive sectors at the provincial level suggest that the generation of reliable, fine spatial resolution, multi-decadal climate datasets is an essential point of departure for any subsequent quantitative analysis of climatic hazards and impacts in Phase 2, if such end up being undertaken. For the atmosphere, this kind of research has been a focus of the Manila Observatory, 18 which ideally would be consulted at the early stage of Phase 2 activities to obtain regional climate modeling results. For the oceans, one source of regional modeling of the Philippine Archipelago is the Ocean Modeling Group at Rutgers University 19 which used the Regional Ocean Modeling System (ROMS) in an effort to develop an enhanced understanding of the oceanographic processes and features in and around straits under a changing climate.
In addition, the Department of Environment and Natural Resources (DENR) is currently engaged in the development of a “climate futures tool,” to be launched in late 2015. This tool will include impact models and climate projections for the Philippines that are planned to be downscaled and geographically defined in a way that may not precisely correspond to the provincial level, but provide useful reference points for provincial CRGG studies.
This existing information should be summarized in the form of tables, maps, or other formats for use in overlaying demographic, agricultural, economic development and related information. For example, NAMRIA offers a set of hazard maps20that may be relevant to many provincial applications of this Framework. If desired, this element could be extended to include a rough GHG inventory for the province.21
18. For more information on regional climate modeling experiements undertaken at the Manila Observatory, please see http://www.observatory.ph/regional-climate-systems/
19. For more information on regional climate modeling experiements undertaken by the Ocean Modeling Group, please see http://www.myroms.org/philex/
20. Hazard maps are available from http://www.namria.gov.ph/readyMapsResultFrame.htm21. Although a GHG emissions inventory is not strictly an adaptation-related element, in all likelihood, it seems like the province may
have to prepare such an inventory anyway, and much of the information needed to prepare an inventory will be provided through the CRGG Framework’s data gathering steps.

44
4.2.3 Characterize Natural Asset Base
Collect and assemble information to inform a physical and resource assessment of the province focusing on aspects important for economic development. This could include, for example, agricultural resource assessment, forest resource assessment, reef coral assessments, reef fish assessments, water resource assessments, and assessment of other resources of economic and/or ecological import to the province possibly from the regional and/or provincial offices of NAMRIA or the PSA-NSCB Compendium of Environment Statistics. The emphasis will be on using data already compiled at the provincial level or other levels, adapting information from other, similar jurisdictions, or obtaining data through interviews with government and academic experts. Additional surveys may be needed as well, but these will be carefully selected based on the need to fill major data gaps, and preferably rapid and inexpensive to implement.
Where appropriate and necessary, use Natural Resource Accounting (NRA) to look at resources in terms of opening stocks, incremental growth/harvest/use, closing stocks, in physical and, where possible, monetary terms. Ascertain whether the DA and DENR employ this accounting methodology, and/or whether they have stock data on these subjects. The goal here is to rapidly identify resources where an accounting is needed, such as where resources are key to the existing and/or planned future economy, and perform a rapid assessment. To the extent that existing NRA efforts can be adapted or adopted for use in CRGG planning, such as, for example, in the forestry and mining sectors through the environment and natural resource accounting (ENRA) in the Philippines, that will be preferred, as it is unlikely that the resources available for Ecotown Phase 2 analyses will support new and detailed NRA efforts, thus existing data will need to be relied upon and/or adapted for use in the CRGG framework. 22
Part of the characterization of the local asset base, both here and in the baseline description assembled as in Step 3, below, will be to identify regions under special management, such as military reserves, natural protected areas, and indigenous culture community areas that may affect how resources can be used and/or require special consideration with respect to adaptation.
4.2.4 Identify Local Development Plans and Trends
Obtain current economic plans at the provincial and, as applicable, municipal level, including the most recent PDPFP, plus any Comprehensive Land Use Plans (CLUPs), Comprehensive Land and Water Use Plans (CLWUPs), Municipal Medium Term Development Plans (MMTDP), and Comprehensive Development Plans (CDP) for major municipalities within the Province. Some PDPFPs are likely to be quite comprehensive and well documented, and may contain a considerable portion of the economic and related data needed for a CRGG process, but some PDPFPs may be lacking in detail, thus CRGG planning in those provinces may require significant additional economic data collections.
22. Where existing NRA assessments have been done in the Philippines, whether at the local, provincial, or national levels, it may be possible to adapt them (as “proxies”) to the province under study by, for example, using growth rates and values for similar kinds of forests, or productivity for similar kinds of terrestrial or aquatic ecosystems, as are prevalent in the province under study. Examples of organizations that have conducted NRA include USAID, UNDP, and GIZ. See, for example, http://www.wavespartnership.org/en/philippines, and http://www.nscb.gov.ph/rucar/pdf/enra/ENRACAR.pdf. In addition, Philippines Presidential Executive Order (EO 406) institutionalizing the Philippine Economic-Environmental and Natural Resources Accounting (PEENRA) System may have produced, or may produce in the future, data useful for the assessment of resource for CRGG planning (http://www.nscb.gov.ph/peenra/about/eo406.asp).

45
Learn about the existing schedules for updating of these plans at the regional, provincial and municipal levels, as well as, for example, what government agencies are involved in economic planning, and what individuals and groups are involved in government-sponsored economic planning. To the extent not captured in step 2.1 (and/or using information collected as above), obtain data on economic trends in the province, such as output of key commodities, populations of humans, vehicles, and livestock, and other indicators of development that may or may not be captured in the official development plans. Additional data collection here may include interviewing operators of major industries (including service industries, such as tourism) to learn about their plans for expansion, or with agricultural or fisheries experts to better understand trends in those occupations that may translate both to increased or decreased climate vulnerability and/or to changes in patterns of economic development. Here, special consideration and effort may be needed to assess existing and emerging industries of local importance, so that they can be enhanced through CRGG local economic and environmental planning processes. Such consideration should include understanding and keeping in mind local value chains during the CRGG data collection and planning process.
4.2.5 Possible Outputs of Step 2
The following are envisaged qualitative and quantitative outputs of Step 2 and the purposes that they may serve in order to inform the CRGG Framework, and ultimately the selection of adaptation measures. At the end of this assemblage of information through this rapid assessment exercise, a robust and triangulated description of the province and/or municipality 23 should be available to inform decisions regarding climate adaptation options that integrate with inclusive economic development goals for the province/municipality, locating where possible investments could be made and for implementing Step 3. Description of the provincial and/or municipality context (disaggregated by gender, municipality and barangay, wherever available and possible, and from the most recent public datasets):
1. Socio-economic-gender profile: provides information on stratified wealth and incomes, population, poverty and demography of the province)
a. Population of province and municipalities (source: Family Income and Expenditure Survey (FIES – PSA-NSCB; PDPFP)
b. Labor employment per occupation or sector in the province (source: PDPFP; Labor and Employment, FIES – PSA-NSCB)
c. Income distribution per occupation or sector (source: FIES – PSA-NSCB; Income and Poverty – PSA-NSCB)
d. Rate of employment, underemployment and unemployment (source: Provincial Quickstat – PSA-NSCB)
e. Indices depicting the ‘working poor’ if available (source: NEDA)f. Existing information on migration outflows and percentage of inward remittances
to the province from overseas workers (source: Philippine Overseas Employment Administration (POEA); Survey on Overseas Filipinos – PSA-NSCB; Provincial Quickstat on Demography – PSA-NCSB)
g. Poverty profile with indicators (source: NEDA; Income & Poverty: Poverty Maps per Province – PSA-NSCB)
h. Proportion of urban population (source: Provincial Quickstat – PSA-NSCB)
23. It is recognized that datasets and information sources may not be available at the municipality level, therefore it is useful to consider provincial-scale data to characterize the economic, institutional, and physical features and properties for CRGG site application.

46
2. Productive and adaptive infrastructure: identifies and describea the state of productive resources in the province and whether these enable economic and livelihoods development
a. Location and quality of bridges, farm to market roads, market facilities, waterworks, flood control infrastructure, ports, alternative energy facilities, power generation/transmission facilities; multi-purpose dams; recreation facilities, emergency evacuation centers, etc. (source: Department of Public Works and Highways (DPWH); Provincial utilities sources)
3. Health profile and facilities: describes the health picture of the province in terms of physical health status of its residents and the province’s capacity to respond to disease and ailments of its residents
a. Health facilities and type (National Health Facility Registry – Department of Health (DoH))
b. Disease surveillance (Disease Surveillance Per Region – DoH)
4. Education profile: describes and analyzes the human capital potential of the municipality for possible deployment of human resources to economically-viable adaptation options
a. Highest educational attainment (source: Provincial Quickstat – PSA-NSCB)b. Literacy rate (source: Provincial Quickstat – PSA-NSCB)c. Educational centers (source: Datasets and Interactive Maps – Department of Education
(DepEd))
5. Business and industry profile: identifies major revenue-generating industries and businesses in the province, their respective labor participation rate, demand and supply chains for these businesses, as well as their demand sources
a. Major industries and their revenue-generating capacities (source: PDPFP; Provincial development plans of the Provincial Development Planning Office (PPDO); Annual Reports of major businesses and industries; interviews with Provincial Development Planning officer/s; Provincial Development Council representatives, and Provincial Trade and Industry officer/s; and with operators of major industries)
b. Labor participation in major industries and businesses (source: PSA-NSCB)c. Value chains for major industries (source: interviews with Provincial Development
Planning officer/s; Provincial Development Council representatives, and Provincial Trade and Industry officer/s; and with operators of major industries)
6. Natural resource assets base and ecosystems: accounts for available natural resource assets that may or may not be harnessed for economic development and adaptation measures, and adequate standards that guide their use and management.
a. Natural resource assets of the province (source: DENR: PEENRA databases; Compendium on Environment Statistics – PSA-NSCB)
b. Land use and water use profiles (source: NAMRIA; CLUP – Housing and Land Use Regulatory Board, HLURB; Provincial Development Planning Office; CLWUPs – HLURB)
c. Existing official environmental, safety and social safeguards that guide the harnessing of natural resource assets
7. Climate change projections and recent disasters: put together an ex-ante and ex-post facto climate change and disaster profile to help inform climate adaptation options
a. Disaster response maps to mitigate health effects (source: Disaster Response Maps – DoH)
47
b. Climatological statistics and trends (source: Climatological Statistics, Tropical Cyclones by Province – DOST-PAGASA)
c. Disaster accounts and coverage (source: local print media; Compendium on Environment Statistics – PSA-NSCB)
d. Hazard topographical mapping (source: Provincial offices of the DENR; Mines and Geosciences Bureau (MGB); Environmental Science for Social Change (ESSC)
e. Media accounts of recent disasters (sourced from, for example, local print media and citizen journalism)
8. Development planning in the province: describe the economic and social development scenarios envisaged by the municipality/province that will inform climate change adaptation options and measures.
a. Priority occupations and industries (source: PDPFP; CDP; interviews with Provincial Council representatives and the Provincial Development Planning Officer (PDPO); documents from the PDPO)
b. Infrastructure plans (source: interviews with provincial DPWH representatives, local electricity generating authority and waterworks representatives)
c. Spatial planning and zoning (source: CLUP – HLURB; Provincial Development Planning Office; CLWUP – HLURB)
The assembly and subsequent technical analyses of the data specified above are not for stock-taking purposes alone. These data constitute the different human, institutional, and physical assets and resources that integrated planning of economic development and climate change adaptation will have to consider will require to move forward. They will potentially guide planners’ decisions for adaptation options, together with the economic development pathways discussed in Step 3 below.
4.2.6 Potential Step 2 Entry Point for Mitigation Planning
Some of the data gathered in Step 2, and the methods used to gather and assemble those data, would also be applicable to a parallel and coordinated mitigation planning effort, if appropriate and desired. Mitigation planning efforts nearly always, necessarily involve the assembly or updating of a GHG emissions inventory. Such an inventory includes identifying and quantifying sources of emissions ranging from fossil fuels consumption to agriculture, industry, and forestry, typically for a recent year and for as many years in the past as reliable data are available. A mitigation planning effort also includes the assembly, consistent with the data needed for CRGG
TYPICAL OUTPUTS OF CRGG STEP 2: RAPID ASSESSMENT: PROVINCIAL AND MUNICIPALITY PROFILE, CLIMATE PROJECTIONS, RESOURCE BASE, AND ECONOMIC DEVELOPMENT
Asnotedinmoredetailabove,outputsofStep2maytypicallyinclude:• Anarrativedescriptionoftheprovincialandmunicipalsetting(demographic,physical,economic,and
environmental)withsummarytablesshowinggender-disaggregatedpatternswhereavailable• Asetoftablesandmapsdescribingclimateimpactsontheprovince/municipality• Aquantitativeandqualitativelistingoftheprovincial/municipalassetbase• Alisting,perhapsasatablehighlightingkeycomponents,ofexistingprovincialeconomic
developmentplans,ofmunicipalplanswithprovincialimplications,andofexistingtrendsinkeyindustriesnotnecessarilycoveredbygovernmentplans
• Asynthesizeddocumentthatintegrateskeyandrelevantpointsandfeatures

48
planning, of “driver” or “activity” data that include parameters such as resource use, industrial activity, demographics, economics, and sectoral production, in a recent year and, typically, for five or ten (or more) years in the past. Emissions of GHGs are rarely measured directly, rather they are estimated as the product of an activity, such as terajoules (TJ) of use of a particular type of fuel, or tonnes of cement produced, and an emission factor, such as the tonnes of carbon dioxide and other GHGs emitted per TJ of fuel consumed, or tons of CO2 produced per tonne of cement “clinker” produced. Emission factors are typically sourced from international (such as IPCC) or national compilations, while activity data would typically be found or estimated at the provincial level. Many of the types of data activity data needed for mitigation planning are also needed for adaptation planning, as noted above. The preparation of a GHG inventory typically will use an Excel workbook or energy/environment planning software tool to compile and process activity, emission factor, and emissions data, and to produce summary historical and “current year” results that are then used in a baseline forecast of GHG emissions. Such tools can be built on a custom basis, or the planning group can adapt or adopt existing tools available nationally or internationally. In addition to the data required for preparation of GHG emissions inventories, other data typically compiled for mitigation planning typically include data needed for evaluation of emissions mitigation options, including, for example current and future costs of fuels and electricity, demographic and building area growth projections, and industrial and agricultural output forecasts.
4.3 Step 3: Identification of Key Existing Economic Development Paths and Their Resource Needs
4.3.1 Introduction and Premises
This section addresses the development of a Baseline Development Pathway for the province or region where Phase 2 activities are to be eventually implemented. Its core aim is to synthesize official projections regarding local economic/sectoral development plans through the use of a set of default indicators, augmented by any others deemed appropriate by the project team. The outcome of Step 3 is a completed matrix that suitably characterizes Baseline Development Pathway and represents a consensus stakeholder view regarding how development is expected to unfold in the province or region under Business-as-Usual conditions. As such, the Baseline Development Pathway, although it needs to specify at least generally the economic development elements that will or may be influenced by climate change, and/or, to the extent that GHG emissions mitigation is included in the planning effort, may influence GHG emissions, the description of the Baseline Development Path need not be as fully detailed as, for example, a PDPFP. Rather, it is a description that serves as the starting point for consideration and evaluation of the potential impacts of climate change on the current and future economy of the province, and for the identification of changes in policies or plans that can be made to help to reduce those impacts.
Underlying the characterization of the Baseline Development Pathway are four (4) key premises. First, the methodology follows the core elements of adaptation baseline scenario approaches that have been codified into widely circulated adaptation planning guidance documents (Feenstra et al., 1998; Fisher and et al., 2000; UKCIP, 2001; Lim et al., 2004) and applied in various locales (UNEP, 2011; ODI, 2013; Horton et al., 2011). The methodology has been adapted to be

49
consistent with the Philippine provincial development context, a single central development pathway, and the expected resource constraints associated with Phase 2 activities.
Second, the Baseline Development Pathway is analogous to the notion of “Business-as-usual” (BAU) conditions, both current and future. That is, BAU conditions, as applied to Ecotown Phase II, correspond to a development trajectory in which climate-resilient, green growth strategies have not been adequately incorporated into development planning. In the parlance of the Intergovernmental Panel on Climate Change (IPCC), the Baseline Development Pathway represents a “future baseline” that excludes the driving factor of interest, namely local investments in adaptation measures, strategies, and technologies that contribute to climate-resilience and green growth. Such investments - the aim of Ecotown Phase 2 - are intended to bring about an alternative development trajectory, a CRGG Development Pathway. Figure 4-3 offers an overall conceptualization of this premise.
Third, stakeholder engagement is central. In fact, the Baseline Development Pathway and the stakeholder process by which it is developed are equally important. Stakeholders are instrumental in characterizing/confirming key baseline targets, resource requirements, and indicators. Moreover, they will ultimately be crucial to the successful implementation of a CRGG Development Pathway. Engaging stakeholders requires an active and sustained dialogue among affected individuals and groups. It is assumed that the Project Team is well-versed in methods for identifying stakeholders and ensuring their engagement throughout the Phase 2 process. For reference, resource materials on stakeholder adaptation processes are widely available in the public domain.
Fourth, the approach in developing the Baseline Development Pathway is focused on the use of the Delphi method, with its emphasis on expert judgement and the development/application
Figure 4-3: Conceptualization of the Development Pathways
Clim
ate
resi
lien
ce
Green growth potential
HighLow
Hig
hLo
w
Current Development
pathway
CRGGDevelopment
pathway
Adaptation
Investments

50
of suitable indicators.24 This approach focuses on priority sectors/systems as opposed to a comprehensive exercise to characterize economic and environmental performance under baseline conditions. It is recommended for Phase 2 activities in order to be consistent with project duration and various other constraints envisioned. It is important to note that this approach is in contrast to other legitimate and more comprehensive methods for characterizing the Baseline Development Pathway, such as the use of general equilibrium econometric models or sectoral planning models to establish quantitative estimates of economic and/or environmental productivity under baseline conditions. However, within the Phase 2 project context, there are several disadvantages of this latter approach, including high budgetary resources needed, extensive data requirements, potential over-reliance on quantitative estimates, and inherent limitations in fostering sustained engagement among the wider network of stakeholders due to the highly specialized nature of the econometric modeling exercise.
Finally, a mid-term temporal planning framework is required. In contrast to climatic projections that are often focused on long-term (i.e., late 21st Century), the focus of the Baseline Development Pathway is on the near- to mid-term planning horizon. The default planning period is the 35-year period between 2015 (Base Year) and 2050 (End Year). Such a time frame offers the advantage of being more relevant to ongoing policy dialogues, as well as being able to make better strategic use of official planning projections and targets which typically do not extend beyond 2040 or 2050.
4.3.2 Overview of the approach
The overall approach for developing the Baseline Development Pathway is a simplified methodology that relies on the key elements outlined in the bullets below. The role of these elements in the overall approach for characterizing the Baseline Development Pathway is illustrated in Figure 4-4. The last three bullets are described in more detail in the subsections that follow.
24. For information on the use of the Delphi method, please see, for example, Hsu, C and Sandford, B., 2007. “The Delphi Technique: Making Sense Of Consensus”, Practical Assessment, Research & Evaluation, Vol 12, No 10.
Stak
eho
lder
En
gage
men
t
Figure 4 -4: Sequence of steps for characterizing the Baseline Development Pathway
Complete the Baseline Development Pathway Matrix by scoring all indicators
Organize Background information in a form suitable for data extraction
Synthesize available background information for default (or other) Adaptation-related Areas
Establish or refine Socioeconomic indicators for the default (or other) Adaptation-related Areas

51
Background information: This refers to available information from a range of national/provincial planning documents. For example, the PDPFP identifies local development goals, targets, and strategies. Other sources of relevant information are found in sectoral expansion planning reports, visioning documents, and regional climatic forecasting reports. Such information has been collected and synthesized during the preceding Step 2 and will form the basis for constructing the matrix characterizing the Baseline Development Pathway. Note that existing local development goals may, to some extent, include climate change adaptation considerations, sometimes in the context of disaster risk assessment, and if so, they should be noted and incorporated into the baseline development pathway. Including existing adaptation and disaster risk assessment efforts helps both to assure that existing actions, or those in the advanced planning stage, are reflected as point of comparison for CRGG pathways (as complied in Step 6), and because existing adaptation efforts can and should be built upon when developing lists of potential adaptation/economic development options, as described in Step 5.
Adaptation-related areas: This refers to a synthesis of available background information regarding five (5) key adaptation-related areas. These areas are climate, urban planning and zoning, public safety, environmental protection, and economic development. Each of these areas is central to the development of adaptation strategies that are consistent with climate-resilient, green growth development. Moreover, these areas are those in which local government agencies or community groups manage, plan, or develop policies that affect services and activities associated with sectors and systems in the Baseline Development Pathway. It is important to note that the justification for the identification of these adaptation related areas stems from our review of the results of the Phase 1 activities, taken as a whole. That is, the range of adaptation strategies that emerged from Phase 1 activities are understood to fall within, or be directly related, to these key adaptation areas. Nevertheless, the identification of these adaptation-related areas in this Framework document is intended merely as a guiding framework, rather than being proscriptive. Should more appropriate key adaptation-related area be identified early on in the implementation of Phase 2 activities, such would supersede the key areas identified above.
Socioeconomic indicators: This refers to a set of parameters that can adequately characterize physical or abstract concepts for each of the five key adaptation-related areas described in the previous bullet. Indicators are essential for understanding the Baseline Development Pathway relative to adaptive or maladaptive potential. For example, GDP can be useful as a measure of economic productivity. Other indicators may include provincial water demand (Ml/day), total agricultural area (ha), or poverty level (% of people below a certain income level). A set of default indicators is provided as a point of departure for the Project Team; these can be augmented or adapted as needed.
Baseline Development Pathway Matrix: This refers to the stakeholder-driven completion of the table of established indicators relative to the set of adaptation-related areas. For example, an estimate of a quantitative indicator like GDP per capita can ideally be extracted directly from development-related information for some future year and confirmed/validated through the stakeholder review process. Other indicators that are qualitative in nature (e.g., impact of increasing climatic variability on native and invasive species) can be scored on an ordinal scale by consensus through the stakeholder engagement process. A set of default development-related areas is provided as a point of departure for the Project Team; these can be augmented or adapted as needed.

52
4.3.3 Adaptation-related areas
Adaptation-related areas are defined as key development-related areas identified previously in Ecotown 1 as central to climate change adaptation strategies. Specifically, these are five (5) such areas in which local government agencies or community groups manage data, plan actions, or develop policies that affect essential public services and strategic economic activities. The starting set of key adaptation-related areas is identified in the bullets below. This starting list can be augmented or further refined as needed based on the outcome of stakeholder consultations. Table 4-4 provides an overview of how these areas are integrated into the Baseline Development Pathway Matrix.
Climate: This is a data-intensive area that can encompass climatic patterns associated with future average annual temperature; average annual precipitation; SLR; frequency of extreme events, and other meteorological variables, both spatially and inter-annually.
Urban planning and zoning: This area can encompass current/future activities associated with sectors such as coastal zones, water supply/demand, and electric supply/demand, and others. It can also encompass current/future activities associated with systems such as port/harbor management, land use planning, and other management activities.
Public safety: This area can encompass current/future activities associated with systems such as emergency management, fire control, disaster mitigation planning, and other related human health services.
Environmental protection: This area can encompass current/future activities associated with the protection of sectors such as forestry, fisheries, and terrestrial biodiversity. It can also encompass current/future activities associated with systems such as marine/terrestrial conservation planning, environmental sustainability planning, and other environmental management services.
Economic development: This area focuses on the priority sectors of agriculture, water supply/demand, tourism, and fisheries and can encompass private/public sector investment, technology transfer/innovation, poverty alleviation, and other parameters.
In the above bullets, “sectors” and “systems” are used to denote distinct foci of potential adaptation actions that promote climate resilience and green growth. Sectors refer to production units
Table 4-4: Overall structure of the Baseline Development Pathway Matrix showing a starting set of Adaptation-related areas
Adaptation-related area Indicator 2015 2050
Climate 1 through n Value of indicators 1 through n Value of indicators 1 through n
Urban planning and zoning 1 through n Value of indicators 1 through n Value of indicators 1 through n
Public safety 1 through n Value of indicators 1 through n Value of indicators 1 through n
Environmental protection 1 through n Value of indicators 1 through n Value of indicators 1 through n
Economic development 1 through n Value of indicators 1 through n Value of indicators 1 through n
53
within the built/managed environment. These include, for example, the agriculture, water, urban infrastructure sectors. For simplicity, the term “sector” is also used to refer to production units within the natural environment. These include, for example, forestry, fisheries, and terrestrial biodiversity. To first order, the outcomes of Ecotown 1 imply that there are several priority sectors (that is, water, agriculture, forestry, fisheries, coastal zones) where future adaptation strategies are essential at the provincial level.
Systems refer to human networks in which important local management services are centralized and which are considered essential for promoting climate-resilient, green growth development at the provincial level. These include management activities centered in, for example, public institutions, political systems, and non-governmental organizations. To first order, the outcomes of Ecotown 1 imply several priority systems (i.e., integrated water resource management, integrated coastal zone management, agricultural systems management, marine/terrestrial conservation planning) where future improvements to adaptive capacity are essential at the provincial/national level.
4.3.4 Socioeconomic indicators
Each of the adaptation-related areas described above can be characterized through the use of indicators. The literature provides many useful guidance documents on the development of performance indicators for a large range of activities, including climate change adaptation (World Bank, 1996; Bandura, 2008; SBSTA, 2009; Sniffer, 2012). Indicators can be quantitative, qualitative, or both. When properly constructed, indicators are used to describe various characteristics of interest. The essential criteria from such documents for the development of useful indicators are summarized in the bullets below.
Simplifying: This refers to the ability of an indicator to distill essential information into a meaningful value or judgment. Good indicators are able to summarize, quantify and simplify relevant and potential complex information.
Encompassing: This refers to the ability of an indicator to capture the range of phenomena of interest. Good indicators are applicable across the full scope of an activity.
Communicative: This refers to the ability of an indicator to adequately get across the essential nature of the information. Good indicators are able to communicate relevant information to a broad audience.
To a large extent, the nature of the adaptation-related area dictates the nature of indicator(s) that is (are) most relevant. That is, indicator development is tightly linked to project goals and objectives. Also, it is important to note that the set of indicators for characterizing the Baseline Development Pathway is a critical step as these same indicators will also be used in the evaluation of the CRGG Development Pathway, as well as in the subsequent project monitoring and evaluation process.
A starting set of indicators has been developed corresponding to each of the adaptation-related areas described in the previous section. Specifically, these are three (3) criteria for each area, except for the Economic development area in which there are four (4). In total, sixteen (16) socioeconomic indicators are proposed in this Framework for characterizing the Baseline

54
Development Pathway, as outlined in Table 4-5. This starting list can be augmented or further refined as needed based on the outcome of stakeholder consultations.
These same indicators will be applied in a subsequent stage of this Framework to construct the alternative CRGG Development Pathway. To the extent that quantitative analysis is undertaken in Phase 2, the Baseline values for 2050 for all but the Climate adaptation-related area will be replaced with values from such analyses. Otherwise, relative changes based on expert judgment can be used.
4.3.5 Baseline Development Pathway Matrix
Each of the indicators described above can be scored through either referencing to official planning documents or expert judgment. In the case of the former, the quantitative values may need to account for differences in the reporting year. Various techniques are available including
Table 4-5: Overall structure of the Baseline Development Pathway Matrix showing the starting set of Indicators
Adaptation-
related area
Indicator
No. Description Units
Climate
1 Average annual temperature
% Change relative to historical average
2 Average annual precipitation
3Average number of extreme annual weather events
Urban Planning and zoning
4 Population Thousand people
5 Costal land use for residential/industrial use Thousand hectare
6 Total water demand Liter/cap/day
Public safety
7Damage to coastal infrastructure from flooding and / or sea level rise
Scale of 1 to 5 (1=low potential; 5=high potential)
8Weakening of critical infrastructure (i.e.,z roads, storm drains, etc) from prolonged stress from climatic events
9 Potential for vector-borne disease development
Environmental protection
10 Potential for invasive species
11 Marine conservation area Hectare
12 Terrestrial conservation area Hectare
Economic development
13 Total provincial GDP Billion pesos
14People with income below 40% of average provincial income
% of population
15 Government expenditures % of GDP
16 Total agricultural productivity (per crop) Tons per hectare

55
regression and simple extrapolation. In the case of the latter, it is typically needed in the absence of planning documents that explicitly address the particular indicator. In such cases, expert judgment developed through stakeholder consultations is the recommended approach.
Once the process of scoring each indicator for the Base and End Years is complete, a fully characterized Baseline Development Pathway is established which is adequate for the requirements of subsequent stages of Phase 2 activities. Table 4-6 provides a simplified overview of the appearance of the completed Baseline Development Pathway Matrix, with placeholders indicated for actual indicator values.
Table 4-6: Simplified Completed Baseline Development Pathway Matrix
Adaptation-
related area
Indicator
2015 2050No. Description Units
Climate
1 Average annual temperature
% Change relative to historical average
NA Value2 Average annual precipitation
3Average number of extreme annual weather events
Urban Planning and zoning
4 Population Thousand people NA Value
5 Costal land use for residential/industrial use Thousand hectare NA Value
6 Total water demand Liter/cap/day Value Value
Public safety
7Damage to coastal infrastructure from flooding and / or sea level rise
Scale of 1 to 5 (1=low potential; 5=high potential)
Value Value
8Weakening of critical infrastructure (i.e., roads, storm drains, etc) from prolonged stress from climatic events
Value Value
9Potential for vector-borne disease development
Value Value
Environmental protection
10 Potential for invasive species Value Value
11 Marine conservation area Hectare Value Value
12 Terrestrial conservation area Hectare Value Value
Economic development
13 Total provincial GDP Billion pesos Value Value
14People with income below 40% of average provincial income
% of population Value Value
15 Government expenditures % of GDP Value Value
16 Total agricultural productivity (per crop) Tons per hectare Value Value
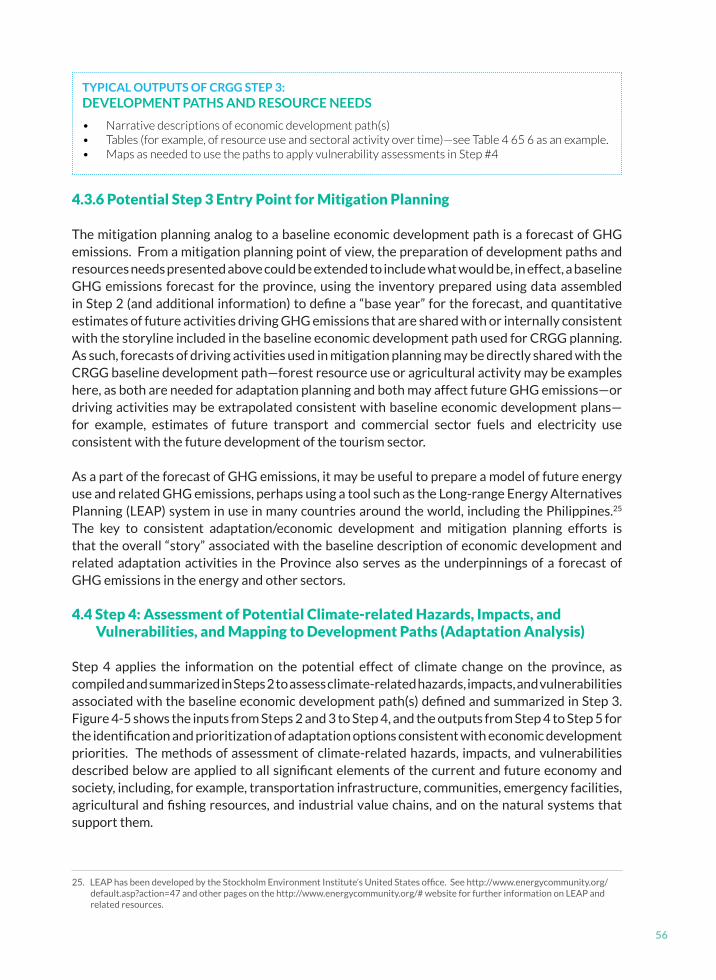
56
4.3.6 Potential Step 3 Entry Point for Mitigation Planning
The mitigation planning analog to a baseline economic development path is a forecast of GHG emissions. From a mitigation planning point of view, the preparation of development paths and resources needs presented above could be extended to include what would be, in effect, a baseline GHG emissions forecast for the province, using the inventory prepared using data assembled in Step 2 (and additional information) to define a “base year” for the forecast, and quantitative estimates of future activities driving GHG emissions that are shared with or internally consistent with the storyline included in the baseline economic development path used for CRGG planning. As such, forecasts of driving activities used in mitigation planning may be directly shared with the CRGG baseline development path—forest resource use or agricultural activity may be examples here, as both are needed for adaptation planning and both may affect future GHG emissions—or driving activities may be extrapolated consistent with baseline economic development plans—for example, estimates of future transport and commercial sector fuels and electricity use consistent with the future development of the tourism sector.
As a part of the forecast of GHG emissions, it may be useful to prepare a model of future energy use and related GHG emissions, perhaps using a tool such as the Long-range Energy Alternatives Planning (LEAP) system in use in many countries around the world, including the Philippines.25
The key to consistent adaptation/economic development and mitigation planning efforts is that the overall “story” associated with the baseline description of economic development and related adaptation activities in the Province also serves as the underpinnings of a forecast of GHG emissions in the energy and other sectors.
4.4 Step 4: Assessment of Potential Climate-related Hazards, Impacts, and Vulnerabilities, and Mapping to Development Paths (Adaptation Analysis)
Step 4 applies the information on the potential effect of climate change on the province, as compiled and summarized in Steps 2 to assess climate-related hazards, impacts, and vulnerabilities associated with the baseline economic development path(s) defined and summarized in Step 3. Figure 4-5 shows the inputs from Steps 2 and 3 to Step 4, and the outputs from Step 4 to Step 5 for the identification and prioritization of adaptation options consistent with economic development priorities. The methods of assessment of climate-related hazards, impacts, and vulnerabilities described below are applied to all significant elements of the current and future economy and society, including, for example, transportation infrastructure, communities, emergency facilities, agricultural and fishing resources, and industrial value chains, and on the natural systems that support them.
TYPICAL OUTPUTS OF CRGG STEP 3: DEVELOPMENT PATHS AND RESOURCE NEEDS
• Narrativedescriptionsofeconomicdevelopmentpath(s)• Tables(forexample,ofresourceuseandsectoralactivityovertime)—seeTable4656asanexample.• MapsasneededtousethepathstoapplyvulnerabilityassessmentsinStep#4
25. LEAP has been developed by the Stockholm Environment Institute’s United States office. See http://www.energycommunity.org/default.asp?action=47 and other pages on the http://www.energycommunity.org/# website for further information on LEAP and related resources.

57
4.4.1 Hazard Assessment
The goal of the hazard assessment element of Step 4 of the CRGG Framework is to determine climate-change-related hazards that might affect baseline economic development paths, so that the identified hazards can be used as a guide, along with the assessment of impacts and vulnerabilities, in identifying and prioritizing adaption options.
Ex ante hazard risk assessment involves an examination of natural hazards to establish historical patterns, potential magnitude and frequency for extent and impact characteristics, and possible trigger factors. The hazard assessment is a tool for determining the hazard types to be taken forward for further consideration in impact and vulnerability assessments, and in the identification and prioritization of adaptation options. For the purposes of this CRGG framework, and to build on Phase 1 of Ecotown, the categories of climate-related hazards suggested for assessment and consideration throughout Step 4 are: mass movement (for example, rain-induced landslides), flood and coastal hazard, and drought hazard. Further, for explicit identification of hazards to be assessed, the six factors described in Table 4-7 (adapted from HLURB et al., 2015) should be considered and weighted/ranked against each other to arrive at the most critical hazards for assessment in a given province.
Hazard maps showing the potential spatial extent of a given hypothetical hazard, with an indicative probability of occurrence, should be used to determine exposed elements; that is, specific populations and geographical areas that would be affected by the hazard. Currently, there are several data sources for hazard mapping across different scales, including NAMRIA
Figure 4-5: Inputs from Steps 2 and 3 to Step 4, and Step 4 Outputs to Step 5, in the CRGG Planning Framework
Step 4 Output: Identification of Key Climate Impacts on Baseline Development Path
Hazard Assessment
Potential Effect of Climate Change Hazards on Economic
Activities and Resources in Baseline Pathways
(Map Overlays and Narrative)
Vulnerability Assessment
Potential Effect of Climate Change Hazards on Economic
Activities (Production)Selected on basis of current and
future economic importance (Examples below)
Agriculture, Fisheries, Industry
Mining, Forestry, Tourism
Others as Identified in Step 2
Impact Assessment
Potential Effect of Climate Changes Hazards on Input to Development Pathways
(Production Base)
Biophysical (Water, Ecosystems)
Productive Resources (Energy, Infrastructure, Technologies)
Human and Financial Resources
Human and Financial Resources
Climate Change Hazard Identification
Sea Level Rise
Floods/ Droughts/ Water Availability
Extreme Climate Events
Baseline Economic Development Pathway(s)Identification of trends in resource needs for key resources over time, sectors (inputs and economic activities)
Rapid Economic AssessmentIdentification of primary current and future economic activities from PDPFP, recent trends, other plans, with sectors prioritized by labor engagement, GDP, resource use, or other criteria.
Top-down Climate Change Projection for
Province / Region
STEP 2
STEP 3
STEP 4
USE IN STEP 5

58
and MGB, which would be of use for provincial hazard mapping as part of the CRGG framework methodology. The sources and information for the climate-related hazards of relevance to the CRGG framework are displayed in Table 4-8 below. Exposed populations are identified and quantified by overlaying the hazard map with the provincial population density map, or other socio-economic maps produced in Step 2 (top-down climate projections) and Step 3 (development pathways). Exposed areas, which may include aggregated built-up areas or agricultural areas, are derived from overlaying the hazard map with the provincial land use map. Additional assessment may include the proportion of units (for example, barangays) that would be significantly affected; qualified by a high (>50) percentage of people or geographical area affected. The analysis can also be a tool for the identification of less exposed areas for future development.
Potential data sources for the assessment of hazards are widespread, and may include PAGASA weather and climate experts (for example, for help with downscaling regional climate modeling results to the provincial level), engineers, NDRRMC emergency management personnel, and DENR; one of the mandated agencies for climate change. Available hazard maps can be validated through data collection and literature research, and provincial population density, land use and topographic maps available from NAMRIA.
Table 4-7: Factors for consideration in identifying and prioritizing hazards for assessment (adapted from HLURB et al., 2015)
Factor Description
Spatial ExtentWhat barangays and municipalities within the province are likely to be inundated or affected by a given hazard?
Magnitude/IntensityWhat is the estimated strength of the hazard that will impact the area? E.g. water depth and flow velocity, wave heights
FrequencyWhat is the estimated likelihood or the average recurrence interval (expressed by “1 in x years” probability) that a hazard event will occur?
Duration How long will the hazard occur for? (In weeks, days, minutes)
PredictabilityCan available technologies accurate determine when and where a given hazard may occur, and its magnitude/intensity?
Speed of onset Is the hazard intensive (landslide, flash flood) or extensive (drought, SLR)?

59
4.4.2 Impact Assessment
The goal of the impacts assessment element of Step 4 of the CRGG Framework is to identify impacts of climate change on resources used in baseline economic development paths. These identified impacts, both quantitative (where possible) and qualitative, are used as input to identifying and prioritizing adaption options in step 5 by helping to identify where adaptation is needed to avoid or reduce climate impacts.
Hazard maps of 4.4.1 provide a good understanding of the potential spatial extent of a given hazard, such as regions that are more or less likely to experience floods. However, in order to understand the potential “impact” from hazards (i.e potential source of harm or adverse effect) or risks (i.e probability of a hazard event causing harmful or adverse consequences) on communities and economic activities, it is necessary to move beyond this point to more comprehensive understanding of the harmful or adverse events that are reasonably certain to occur. For example,
Table 4-8: Hazard maps and data sources (adapted from HLURB et al., 2015)
Hazard Maps Source/s Scale Remarks
Flood Susceptibility
Mines and Geosciences Bureau 1:50,000
Depicts areas susceptible to floods, classified as high, moderate and low with supplemental information on flood heights. Available for selected regions, provinces and municipalities/cities. Map availability can be viewed through http://gdis.denr.gov.ph/mgbviewer/
Philippine Atmospheric, Geophysical and Astronomical Services Administration (PAGASA), Office of Civil Defense (READY Project)
1:50,000 1:10,000
Identifies areas prone to floods representing a worst case scenario. Selected provinces and municipalities/cities generated through the READY project. Map availability can be viewed through http://www.ndrrmc.gov.ph/
Department of Science and Technology Nationwide Operational Assessment of Hazards Project (DOST-NOAH)
Various Map
Scales
Flood hazard maps of selected areas within 18 major river basins. Provides flood inundation zones are based from 5, 10, 25,50, and 100 year rainfall recurrence interval, with indicative flood heights. Map availability for selected areas can be verified through http://noah.dost.gov.ph
Rain-Induced Landslide
Mines and Geoscience Bureau 1:50,000
Depicts areas susceptible to rain-induced landslide, classified as high, moderate and low. Available for selected regions, provinces and municipalities/cities. Availability can be viewed through http://gdis.denr.gov.ph/mgbviewer/
Mines and Geosciences Bureau, Office of Civil Defense (READY Project)
1:50,000
Depicts areas susceptible to rein-induced landslide, classified as high, moderate and low. Available for selected provinces and municipalities/cities generate through the READY Project. Map availability can be viewed through http://www.ndrrmc.gov.ph/
Storm Surge
Philippine Atmospheric Geophysical Services Administration (PAGASA), Office of Civil Defense (READY Project)
1:50,000
Depicts areas prone to storm surge. Available for selected provinces and municipalities/cities generated through the READY Project. Map availability can be viewed through http://www.ndrrmc.gov.ph/

60
rather than simply identifying coastal areas that are likely to to be affected from sea level rise, impact assessments provide information on the likely physical, social, and economic losses in these areas.
Impact assessments for climate change extremes and variability are based on future climate change projections in terms of changes to precipitation, temperature, SLR, and the magnitude and frequency of climate-related extreme events, or hazards. In assessing the impacts of changes to these climate-driven phenomena, it is important to consider the potential effects on a range of sectors, including natural resources and ecosystems, physical capital and infrastructure, human health, education and well-being, financial markets, and economic growth. However, at the present time, impact assessment knowledge and methodologies are considered to be weak at the national and sub-national levels in the Philippines, and may present a barrier to the successful completion of Step 4 of the CRGG framework. In general terms, the range of potential impacts of climate change can be organized into physical, social and economic impacts. As sustainable development calls for a convergence between the three pillars of environmental protection, social equity, and economic development, the linkages between climate change impacts and long-term development pathways are clear.
A top-down approach may be taken for selecting a categorization method for classifying impact sectors. For instance, the Ecotown Phase 1 approach adapted the IPCC (2014) 5th Assessment Report (working group II) model, as modified by Lee et al. (2010), as shown in Table 4-9. As shown in Table 4 10, Lee et al. (2010), and subsequently the Ecotown Phase 1 methodology (CCC and GGGI, 2014), reorganized the sub-categories into two categories: natural environment and human activities. Within these sub-categories sit sectors that are important to human and economic development. A bottom-up approach sees the selection and prioritization of sectors for assessment being made on the basis of major resources present in the provinces, and the natural climate-hazard risks (including both extreme events and climate variability) that may impact those resources and subsequently threaten both environmental and economic sustainability. For example, climate-sensitive sectors include agriculture, forestry, coastal and marine, health, infrastructure, financial markets, and other areas central to local livelihoods and provincial development trajectories. Impact assessment can therefore be done on a sector level for those sectors currently important to the local economy, as well as those expected to be important in the future, across the “value chain” of those sectors. That is, impacts assessment should consider all of the processes and inputs involved in the production or provision of a goods and/or services from a sector. 26
26. The Philippines Climate Project is developing a climate futures tool with impact models for the Philippines as a whole, focusing on energy, water, and forestry. The models are due to be available around the end of 2016. The Australian organization CSIRO is assisting in the effort, which could provide useful inputs to Step 4 of the CRGG planning process.
Table 4-9: Impact Classification Category of IPCC (2014)
Category Sub-category
Natural and managed resources and systems, and their uses
01. Freshwater resources02. Terrestrial and inland water systems03. Coastal systems and low-lying areas04. Ocean systems05. Food production systems and food security
Human settlements, industry, and infrastructure
06. Urban areas 07. Rural areas08. Key economic sectors and services
Human health, well-being, and security
09. Human health10. Human security11. Livelihoods and poverty

61
For the purposes of better linking adaptation and development, Ecotown Phase 2 may move beyond the view that climate change is predominantly an environmental issue towards seeing it as a development challenge. With this in mind, the impact classification may be altered, as shown in Table 4-11, for added emphasis on the current and potential effects of climate change on key drivers for economic development, in the broader frame of sustainable development. NCCAP’s seven strategic priorities can serve as a criteria to prioritize the classified impacts; the importance of preparing against climate change impacts on the natural environment such as water resources and ecosystems, and human activities such as livelihood (i.e., human security), agricultural production (i.e., foods security), infrastructure (i.e., climate smart industries and services), energy use, and transportation have been emphasized in the NCCAP.
Table 4-10: Impact Classification Category of Ecotown Phase 1 Methodology (after Lee and et al., 2010)
Category Sub-category
Natural environment
01. Water resources02. Natural disasters03. Biodiversity04. Natural resources
Human activities
05. Energy06. Living condition and poverty07. Infrastructure08. Industries09. Health
Table 4-11: The Potential Impacts of Climate Change on Economic Development
Category / Drivers of economic development
Examples of potential climate change impacts
Human capital, labor, health, skills, and education
• Human capital accumulation falls following extreme events• Flooding indirectly leading to health impacts though water-borne diseases• Long-term changes in global climate leading to changes in spatial and temporal ranges
of vector-borne diseases
Natural capital, biophysical resources, and ecosystems
• Greater evaporation and water demands resulting from rising temperatures• Restricted coastal freshwater supply due to SLR and resulting salinization• Greater precipitation intensity increasing flood risk• Reduced average annual precipitation increasing drought risk• Reduced water quality arising from rising temperatures, increased pollutant loading
due to greater precipitation intensity during certain seasons and reduced flow conditions during other seasons
Physical capital, critical infrastructure, and technologies
• Infrastructural loss and damage resulting from extreme events• Damage to telecommunications technology during tropical storms• Impact on energy plant, such as hydro-meteorological dam, output following storm
damage to critical infrastructure
Financial capital and markets
• Extreme events burden national economies and budgets through the demand for finance for emergency services, and disaster relief, rehabilitation, reconstruction and recovery
• Disasters can also lead to a temporary fall in revenues and the long-term impacts on other forms of capital that feed economic development
• Alteration to the types micro-finance products required, for example, the rising need for insurance against climate-related impacts

62
4.4.3 Vulnerability Assessment
The goal of the vulnerability assessment element of Step 4 of the CRGG Framework is to identify climate change vulnerabilities, including areas of unsustainability, specific capacities, and potential responses of vulnerable groups in society, related to baseline economic development paths, as identified in Step 3, for use as input to identifying and prioritizing adaption options. Vulnerability to climate change, as used here in this planning framework, is defined by the IPCC as the degree to which a system is susceptible to or unable to cope with adverse effects of climate change including variability and extremes (IPCC, 2012). It is understood as a function of the character, magnitude, and rate of climate change and variation to which a system is exposed, its sensitivity, and its adaptive capacity, as shown in Figure 4-6. This conceptualization of vulnerability is adopted in the Philippines Climate Change Act of 2009 (Republic Act No. 9729).
In general, the goal of a vulnerability assessment is to understand threats and their root causes in order to formulate strategies for adaptation interventions that reduce those threats and their potential impacts on society. For assessment, vulnerability can be disaggregated into physical and socio-economic factors that drive vulnerability by creating unequal exposure and differential responses and adaptive capacities. It is challenging, however, to take the holistic
Definitions (IPCC, 2012)
*Exposure – is the presence of people; livelihoods; environmental services and resources; infrastructure; or economic, social, or cultural assets in places that could be adversely affected by climate extremes and variability.
*Sensitivity – is the degree to which a system is affected, either adversely or beneficially, by climate variability or climate change. The effect may be direct (e.g., a change in crop yield in response to a change in the mean, range, or variability of temperature) or indirect (e.g., damages caused by an increase in the frequency of coastal flooding due to sea level rise).
*Adaptive capacity – The combination of the strengths, attributes, and resources available to an individual, community, society, or organization that can be used to prepare for and undertake actions to reduce adverse impacts, moderate harm, or exploit beneficial opportunities, of climate extremes and variability.
Figure 4-6: Components of climate change vulnerability [Vulnerability = f (exposure, sensitivity, adaptive capacity)]
Exposure
AdaptiveCapacity
Sensitivity
Vulnerability
Adaptation response
PotentialImpacts

63
systems approach to assessing vulnerability, as driving physical and socio-economic factors tend to operate at national and global scales, while the impacts of climate change are manifested at the local level.
Based on the impact assessment categorization, the driving force-pressure-state-impact-response (DPSIR) framework is used for linking causes and outcomes to produce impact and adaptive capacity (or response) indicators (see Table 4-12). Integrating the vulnerability assessment approach and information on current and projected climate change into the DPSIR framework allows for the development of adaptation responses that do not exacerbate other environmental and socio-economic challenges. Data sources for vulnerability assessments are wide-ranging, but can include provincial level land use and water plans, census, health reports, biodiversity assessments, and many others offering data on demography, poverty, rates of production, provincial infrastructure, and other indicators of socio-economic development.
Achieving harmonization of top-down and bottom-up approaches to vulnerability assessment (see Figure 4-7) is challenging but necessary for minimizing uncertainty in climate risk assessments and adaptation planning (CCC and GGGI, 2014). Effective integration of results from the two approaches can achieve a more comprehensive understanding of the climate change impacts and suitable adaptation responses for the given provincial context. Whilst the top-down approach uses global and possibly national data to project future climate change impacts, the bottom-up approach rightly places emphasis on engagement with local stakeholders for the necessary contextualization of assessment processes. Understanding the local social context is key to assessing vulnerability to climate change and how potential impacts may manifest in livelihood and local development change. Further, consulting with knowledgeable stakeholders and actors on drivers of vulnerability and local development pathways can enable a robust set of adaptation responses to be produced and prioritized for planning processes. Overall, harmonization may be achieved by a sequential process approach to assessment; top-down projection analysis followed by grounding of results through stakeholder consultation.
Table 4-12: DPSIR framework concepts and examples (Kristensen, 2004)
DPSIR Component
Examples of potential climate change impacts Examples of Component
Driving Forces
Socio-economic, socio-cultural, and demographic forces and sectors driving human activities and fulfilling human needs that can increase pressure on the environment.
Food, water, health, security, culture.
Pressures
Human activities that may exert pressure on the environment in three ways – excessive use of environmental resources, changes in land use, and emissions to air, water, and soil.
Urbanization, population growth, land use change, increased GHG emissions, changes in agricultural production, resource consumption.
State (and effects/trends)
Societal pressures can lead to negative changes in the state of an ecosystem and its physical, chemical and biological variables.
Damage to and degradation of habitats, species, stocks, and biodiversity.
ImpactsChanges in the quality and functioning of the ecosystem impacts on the well-being of humans through the provision of ecosystem goods and services.
Provision of food, water, materials, and cultural benefits, and the regulation of air and water quality.
ResponsesDecision-making in response to impacts, by groups or individuals in society and government to prevent, compensate or adapt to changes in the state of the system.
Control drivers or pressures through regulation or mitigation, and directly maintaining or restoring the state of the system.

64
4.4.4 Potential Step 4 Entry Point for Mitigation Planning
Of the steps in the CRGG Framework, Step 4 arguably has the least obvious synergies with a parallel and coordinated climate mitigation planning effort. The hazard, impact, and vulnerability assessments in Step 4 may, however, spur the identification of mitigation options that can help to address key climate vulnerabilities, while also reducing GHG emissions. Mitigation option identification and prioritization is discussed in section 4.5.4.
4.5 Step 5: Identification and Prioritization of Adaptation Measures
Step 5 of the CRGG Framework involves the identification and prioritization of adaptation measures and options for development in the Province. As such, Step 5 applies the results of step 4, along with input from a literature review and input from the Advisory Committee, to identify and select priority CRGG options with benefits as shown in the Figure below. The outputs of Step 5 are used in Step 6 to assemble and prepare one or more CRGG Paths, and to evaluate the overall performance of those paths relative to the baseline path(s) assembled in Step 3. Figure 4-8 shows the elements of Step 5, as well as its relationship with information from Step 4 and outputs to Step 6 (Adaptation Plan preparation).
TYPICAL OUTPUTS OF CRGG STEP 4: ASSESSMENT OF POTENTIAL CLIMATE-RELATED HAZARDS, IMPACTS, AND VULNERABILITIES, AND MAPPING TO DEVELOPMENT PATHS (ADAPTATION ANALYSIS)
• Narrative,andpossibly,insomecases,graphicalmappingofhazardsandvulnerabilityastheypertaintothepathsidentifiedinStep3(andkeyelementstherein).Resultscouldbepresented,forexample,asatablelistinghazardsandvulnerabilitiesononeaxis,andkeyelements(sectorsand/ormajorprojects,forexample)ofdevelopmentpathsontheother,withtextinthetabledescribingtheinteraction/overlapsofthetwo,withanadditionalrowand/orcolumnidentifyingpotentialsynergiesoroverlapsbetweensectorsastheypertaintoclimatechangehazards/vulnerabilities.
Figure 4-7: Top-down and bottom-up approaches to vulnerability assessment
Indicators based on: Economic Resources
Technology Infrastructure
InstitutionsInformation & Skills
EquityInstitutions
Bottom-up approach
Vulnerability (Social)
World developmentGlobal greenhouse gasesGlobal climate modelsRegionalizationImpacts
Vulnerability (physical)
Top-down approach
Climate Adaptation Policy
Shifting the focus away from piecemeal adaptation projects and moving toward a fundamental integration of adaptation into economic activities to synergize adaptation and economic benefits.
Future Economic Growth
Past Present Future
Global
Local

65
27. For example, “Climate Change Adaptation Best Practices in the Philippines” by DENR and MDG-F, available as http://climatechange.denr.gov.ph/index.php?option=com_content&view=article&id=147:climate-change-adaptation-best-
practices-in-the-philippines&catid=8:press-releases. A number of databases of adaptation options exist and may be used as input to preparing a “long list”. One example is “ADAM, Adaptation and Mitigation Strategies”, available as http://adam-digital-compendium.pik-potsdam.de/adaptation-catalogue/.
Step 5 starts with a review by the CRGG Project Team of existing literature on adaptation options relevant to the Philippines in general to create a “long list” of possible options. This list is then augmented, as appropriate, through conversations with the Advisory Committee and other experts, to include options not on the generic list that may be important for the Province. A list of criteria for selection of priority adaptation measures and options is then prepared by the CRGG Project Team in draft form, reviewed and revised with input from the Advisory Committee, and used by the Project Team working with the Advisory Committee to select a number of Priority adaptation measures and options. The Priority measures and options are used in Step 6 to create an Adaptation Plan for the province that identifies the timing, budget, and other attributes of Adaptation programs and projects designed to improve climate resilience while contributing to and reinforcing economic development activities.
4.5.1 Review Literature and Conduct Discussions with Experts on Existing Adaptation Options
The first task in Step 5 is to develop a “long list” of adaptation measures and options for consideration by the CRGG Project Team and the Advisory Committee. There is a rich existing literature on adaptation options in general, so there is no need for the CRGG Project Team to start out with a “blank slate” in compiling an initial listing of options. The initial listing should be based on existing lists and completed research used in the Philippines and elsewhere,27 augmented by
Figure 4-8: Analytical Elements of Step 5: Development and Prioritization of Adaptation Options
Prepare and Evaluate Adaptation/ Economic Development/ CRGG Paths
STEP 6
STEP 5FROM STEP 4
Step 4 Output: Identification of Key Climate Impacts on Baseline Development Path
Input from Advisory Committee
Literature Review of Adaptation Options Proposed for the Philippines (including
from Ecotown Phase I) and Similar Countries
Identify Additional Potential Adaptation/CRGG Measure/
Options for Province
Establish Criteria for Prioritizing
Adaptation/CRGG Options
Develop Priority List of Adaptation/CRGG Options
for Province Base on Performance with Regards
to Chosen Criteria; Evaluate Impacts of Uncertainties on
Options

66
local knowledge from CRGG Planning Team, stakeholders, and other experts. 28 Options included in the NCCAP will likely be considered at the provincial level as well, when applicable and perhaps with adjustments for consistency with a provincial application, to help coordinate climate policy at the national and provincial levels.
For easy review and comparison, the initial listing of options should be compiled as a Word or Excel table, and organized with individual options in rows and selected attributes of the options as columns. Attributes will include such information as an option name, a general description of the option, a reference or link to a literature source describing the option (if applicable), and other descriptive attributes (or “fields”) such as the type of option (for example, infrastructure or policy), the time to implement and option longevity (short-term or long-term), the relative cost, the effectiveness, degree to which adaption investments avoid or limit damages due to climate change, 29 the option’s likely ease of adoption, from a societal point of view, in a Philippine provincial setting, whether the option is a “win-win” or “no regrets” option, the ancillary benefits of the option, and others. A suggested template, with illustrative categories of adaptation measures and some individual measures from key literature sources, and including an illustrative listing and scoring of suggested attributes of measures, is provided as Annex C to this Framework.
If desired and needed, it may be useful to hold focus group or individual discussions with various constituencies on how residents and businesses adapt to climate change in their livelihoods and daily lives and operations. If a similar study has been done in a similar province, it may be possible to adapt the results of that study. These discussions could be mediated with help from members of the Advisory Committee. It is likely that these discussions would begin with conversations with experts at the provincial level and with representatives of key stakeholder groups, with selected, focused direct discussions with stakeholders at the local level only when there are key gaps in the understanding of how constituencies might view adaptation options. It may also be useful to use other adaptation needs assessment methods, including surveys, to identify support mechanisms for adaptation options with key stakeholders and constituencies.
4.5.2 Identify Additional Potential Adaptation Measures/Options for Province
An initial listing of adaptation options has been prepared based on existing literature and other inputs, it the next step is to make sure that its coverage is comprehensive with respect to potentially useful options and measures for the Province. This task starts with the listing of options and measures from the literature and conversations as above, and undertakes a review of the list of generic options to identify options that address both development and adaptation needs to the province, and to exclude options that are not applicable. A key source of options to add to the list will be those adaptation (and mitigation) initiatives and best practices proposed for and implemented in the province, and in neighboring or similar provinces or municipalities, which will facilitate both the evaluation of those options (based on already existing data) and the implementation, perhaps in cooperation with other provinces and/or with national agencies of those options (if chosen) for which there is already experience. Options will be included or excluded based on criteria decided upon by the CRGG Project Team and its Advisory Committee.
28. It has been suggested that it would be useful to have a national reference database of good adaptation, and possibly other, practices related to climate change, which could potentially reside in the knowledge management system at the CCC, so that the CCC could be a clearinghouse for information on adaptation measures.
29. For example, E.L. Wright (2003) argued that adaptation is an economic investment made to avoid or limit damages due to climate change. See “Climate variability, economic adaptation, and investment timing”, International Journal for Global Environmental Issues (3), pp. 357-368.

67
An illustrative (but hardly exhaustive) listing of potential criteria that might be used to exclude or include options is provided in Table 4-13, below.
Through this process, options specific to the province that have clear adaptation (as well as economic) benefits and that are not yet in the list of generic options will be added. Here, it may be useful to focus specifically on no regrets” and “robust” options that offer both adaptation and development benefits. Note also that many climate adaptation/resilience improvement options may also have GHG emissions mitigation benefits. Examples of such options include (but are not limited to):
• Distributed generation to improve the resilience of health, educational, economic systems to climate-related hazards while often reducing carbon emissions, particularly when renewable energy sources are used.
• “Blue-carbon” ocean-related biomass plantation development for sequestration of carbon, biomass production, and protection of coastlines, villages, and other infrastructure from tidal surges, thus yielding economic benefits 30 and increasing resilience to hazards.
• Application of demand-side energy efficiency options, particularly in urban areas, that increase survivability of economic infrastructure, and reduce electricity requirements so that as power is restored, more economic activities can resume.
Options that may have particular local applicability may include policies/actions to reduce “top-down” climate vulnerabilities and simultaneously support economic development, such as improvement/hardening of key water supply, sanitation, energy supply, and transport infrastructure, as well as from the “bottom-up” on a sector-by-sector basis.
30. See, for example, http://www.thebluecarbonproject.com/the-problem-2/, and http://thebluecarboninitiative.org/.
Table 4-13: Partial Listing of Illustrative Adaptation Measure/Option Decision Criteria
Illustrative Criteria for Adding or Removing Adaptation Measures/Options from List
Applicable to resources used (or expected to be used) widely in Province
Applicable (or, for removal, not applicable) to economic sectors important in Province (now and/or in the future)
Needed to protect important local cultural or social resources
Applicable in particular to disadvantaged social or economic groups
Is purely an economic development option with no significant adaptation benefit (for removal)
Too costly to consider, or includes technology that is unlikely to be applicable and/or available at the province level (for removal)
Needed to protect key economic or environmental resources in the Province
Offers significant GHG emissions reduction (mitigation) benefits
Offers significant economic/environmental/social co-benefits
Offers significant risk of maladaptation (for removal)
Helps to build capacity for implementation of additional development/climate-change-related initiatives

68
The first round of identification and inclusion/exclusion of options will be carried out by the CRGG Planning Team, supported/supplemented by selected experts as appropriate. The resulting, focused list of adaptation options will be further (but still approximately) evaluated for potential impacts based on a selection of criteria, with a focus on economic development benefits specifically related to the baseline economic development path prepared in Step 3. The compilation of options will then be reviewed and finalized by the Advisory Committee, then used in the prioritization step described below.
4.5.3 Prioritize Potential Adaptation Measures/Options for Province
The final element of Step 5 is the prioritization of potential adaptation measures and options to select the options most suitable for use in the adaptation plans compiled in Step 6. Although prioritization is by its nature a process requiring many subjective decisions, it is important to make the decision process as guided and systematic as possible, while still leaving freedom to make selections based on local knowledge and preferences. In order to make the selection process systematic, it is necessary to establish a set of selection criteria for use by those doing the prioritization. The criteria will typically include a mix of quantitative and qualitative attributes for use in prioritizing measures/options. Examples of potential criteria include:
• The value of protection provided by an option, based on the provincial climate change hazard, impact, vulnerability assessments carried out in Step 4 of this Framework.
• The contribution toward inclusive economic development and resilience of economic systems.
• The degree to which an option provides protection of the society’s most vulnerable individuals (which might be accomplished, for example, through mechanisms such as public and private affordable insurance packages)
• An option’s role in poverty alleviation and improving equity, including the impact of the option on “the social safety net” (the availability of services and assistance for low-income residents and the needy).
• The cost to implement an option.• The degree to which an option avoids or reduces maladaptation, such as increasing GHG
emissions. • The capacity of governments to invest in and carry out adaptation/development projects.• The availability of private and other (for example, international aid) financing for an option.• Impact on and linkages with climate change mitigation as well (as an ancillary impact).
It is likely that the CRGG Planning Team would establish an initial list of criteria for consideration and revision by the Advisory Committee. With the modified list of options and the evaluation criteria in hand, the next step is to evaluate the candidate measures/options with regard to the criteria established. Depending on how many options are being considered, and how complex the economic system and potential climate hazards, impacts, and vulnerabilities in the Province are, prioritization could be a two-stage process. The first stage would be application of a coarse filter to eliminate clearly suboptimal or limited measures/options, and/or to combine measures/options into readily implementable groupings (for example, projects composed of measures that work together). The second stage would be to establish priorities for near-term development based on criteria including potential/suitability for provincial implementation. The evaluation of the group of options included in the second-level screening could include quantitative estimates of measures such as direct and indirect costs and benefits at assumed levels of implementation.

69
In some cases these estimates could be along the lines of a “pre”-pre-feasibility study for certain options that might explore, for example, feasibilities in terms of the local government’s (or other’s) ability to provide the necessary funding for the option, or whether the technical capability exists to reliably operate and maintain a particular piece of infrastructure at the local level. The results of such pre-pre-feasibility studies, or simple, approximate cost-effectiveness analyses, may help to evaluate options for prioritization.
As the criteria for evaluation (at both stages) will include a mix of qualitative and quantitative measures, the most straightforward way to evaluate the different options is to develop a matrix that allows comparison of multiple measures/options against multiple criteria. An illustrative example of an evaluation matrix template is provided in Annex C to this Framework document. Stakeholders (Advisory Committee members and others) can then review the matrix and decide—subjectively but through a transparent process—which criteria are the most important, and thus which options should be accorded the highest priority. Consideration of the climate hazards, impacts, and vulnerabilities identified during Step 4 provides one basis for prioritization, as does the impact of adaptation options on economic development plans.
Once a prioritized list of options has been identified, priority measures/options with which to move forward are selected. Selection may involve or be reviewed by the Advisory Committee, and by other stakeholders, if applicable. Measures and options may be ranked from most urgent/attractive for implementation to lowest priority, or grouped by attractiveness for implementation.
In order to test the degree to which the prioritized options would evaluate differently if key input parameters changed, select a small number of key uncertainties to use in preparing sensitivity analysis for the performance of the priority measures/options against the full range of evaluation criteria, or a subset of that range. The uncertainties could be, for example, related to economic development, to climate change, to budgets for implementing adaptation options, or to changes in the demography of the province. Uncertainty analyses would likely involve a combination of qualitative and quantitative analysis, but the latter, if used, would likely be of a very straightforward nature (such as simple cost-benefit analysis).
4.5.4 Potential Step 5 Entry Point for Mitigation Planning
In a mitigation planning effort, the identification and prioritization of options for reducing GHG emissions can follow a pathway very similar to that described above for adaptation options—identification of a “long list” of options, adding local options, combining options as needed, qualitative and sometimes quantitative screening of options, then selecting priority options with the help of an Advisory Committee and other stakeholders. Often, a set of Technical Working Groups, typically organized around individual sectors (for example, “Buildings” or
TYPICAL OUTPUTS OF CRGG STEP 5: IDENTIFICATION/PRIORITIZATION OF ADAPTATION MEASURES
• Initiallistingofadaptationoptionsconsidered.• Listingofprioritizedadaptation/developmentoptionsandmeasures,presentedinmatricesshowing
theevaluationofoptions/measuresevaluatedagainsttheprioritizationcriteriadefinedduringtheprocess.
• Evaluationoftheperformanceofselectedoptionstakingintoaccountkeyuncertainties.

70
“Residential/Commercial/Institutional”, “Industrial”, “Agriculture, Forestry, and Land Use”, “Transportation”, and “Energy Supply”) will be tasked with screening and deciding upon priority options to recommend to an overarching Advisory Committee—which could be the same group of stakeholder as serve as the Advisory Committee for the CRGG planning process—and the Advisory Committee then accepts the recommendations or requests modifications. There are many examples of lists of GHG emissions mitigation options that may be built upon by provincial teams in both the national and international literature.
The options review step in a mitigation planning process will also typically include at least quantitative “microeconomic” analysis of the costs and benefits of most or the priority options identified by the Technical Working Groups. Although some options—“Provide climate education in schools” would be an example—do not lend themselves well to quantitative analysis, others, for example “Implement Distributed Renewable Energy Systems”, will require a quantitative analysis in which the annual impact of the policy option on greenhouse gas emissions, relative to the emissions baseline presented in the inventory in forecast (which, it should be recalled, should be consistent with the baseline economic development path prepared in Step 3 of the CRGG planning effort) is estimated, as well as the annual incremental cost (or benefit) of the option relative to the baseline. Summing and taking the net present value, respectively, of the emissions and costs impacts allows the calculation of a cost of emissions reduction, expressed, for example, in PnP per tonne of carbon dioxide equivalent, that can then be compared with the costs of other options.
A parallel and coordinated mitigation planning effort that accompanies or is integrated with CRGG planning could and should include the review of the list of adaptation measures for synergies with mitigation options, and adaptation planners should review the list of mitigation options for synergies with adaptation/economic development options. In this way, options offering benefits for adaptation, economic development, and GHG emissions mitigation can be identified. Similarly, mitigation options that lead to maladaptation (make the economy/society more climate-change-sensitive), and those options can be avoided or revised.
4.6 Step 6: Prepare and Evaluate Adaptation/Economic Development Paths
The list of priority measures and options for the Province, decided upon with the input of the Advisory Committee, constitute input to a climate resilient green growth path, but is not such a path in and of itself because it lacks information about the phasing, timing, and interactions of the options. To determine how these options will interact with economic development plans, as well as with each other, Step 6 incorporates the priority list of adaptation/CRGG options into an internally-consistent CRGG economic development path or paths. The path(s) prepared are then evaluated relative to the baseline path, using criteria as prepared as a part of step 5 to determine a “best” or “optimal” path, as shown in Figure 4-9, below. The adaptation/CRGG elements of that path are then passed to Step 7 for action planning and implementation.

71
4.6.1 Prepare Adaptation/Economic Development Path(s)
The general procedure for preparing “alternative”, or CRGG adaptation/economic development paths is as follows.
• Define one or more paths that depart from the baseline path established in step #3 by modifying the baseline path to implement the priority adaptation/development options and measures identified in Step #5. This will require preparing a combination of a narrative and calculations that places the priority options into the economic development context, evaluates the interactions between options (and with the economic development plans in the baseline).
• The use of paths approach allows better evaluation of synergies and compatibilities/incompatibilities between multiple options. The key will be to establish an internally-consistent “story” that underlies the alternative paths.
• The alternative (or CRGG) path(s) would likely include “no regrets” and other options with combined climate adaptation/GHG emissions mitigation impacts.
• The goal of the definition of the alternative (or CRGG) path(s) will be to define a path or paths that effectively “climate proof” and enhance the economic development activities present in the baseline path.
4.6.2 Evaluation of Adaptation/Economic Development Path(s)
Once defined as above, the CRGG path(s) will be evaluated based on multiple development and adaptation-related criteria. These criteria will include those used to describe the baseline economic path in Step #3 (see metrics in section 5.3.6 of this Report, for example), as well as the key criteria established and used in Step #5 to evaluation adaptation measures and options. The evaluation of the alternative path(s) will focus on the differences between the alternative path(s) and the baseline path, such that small differences in costs or performance can be ignored or de-
Figure 4-9: Elements of Step 6, Noting Inputs from Step 5 and Outputs to Step 7 of the CRGG Planning Framework
Step 6 Outputs: Priority Adaptation/CRGG and Economic Development Elements of Optimal Path
TO STEP 7
STEP 6
FROM STEP 5
Priority List of Adaptation/CRGG Options for Province
Input from Advisory Committee
Prepare Adaptation/ Economic Development
Path(s)
Evaluate Adaptation/Economic Development
Path(s) Relative to Baseline
Identify Optimal Path, Including Adaptation
and Revised Economic Development Components
72
emphasized, and larger differences will stand out. Note that much of the evaluation of different paths will likely be qualitative, as well as subjective, in nature, which is why strong participation by stakeholders, through the Advisory Committee, and other means, as desired, is crucial to maintaining the credibility of the process for local application.
It will be important to maintain transparency about which criteria are deemed most important in evaluating CRGG and baseline paths, and to retain a sense of proportion as to what the differences between plans mean from a practical point of view. For example, if an alternative path has a higher cost than the baseline plan, that cost should be judged in proportion to projections of regional GDP. A small difference over a long time frame suggests that overall costs should not be a key criterion in deciding between paths, given the substantial uncertainty inherent in projecting costs into the future.
There are a number of different types of quantitative analyses that could be undertaken to compare the adaptation and baseline paths, focusing on the differences between the paths. These include, but are by no means limited to, the following:
• Evaluation of the relative greenhouse gas emissions impacts of the two paths (indicating the impact of the adaptation path on mitigation goals).
• Accounting for the direct costs and benefits of measures/options included in the adaptation path(s), relative to activities included in the baseline path. (A similar approach is often undertaken in GHG emissions mitigation studies).
• Modeling the relative potential damage (to, for example, infrastructure of different types) due to climate-driven events in the different paths. Damage could be measured in physical terms, such as meters of coastline degraded or number of communities affected, or in economic terms.
• Modeling the macroeconomic impacts (on provincial GDP and/or employment, for example) of implementing the adaptation path(s) relative to the baseline path.
The determination of which models are useful, usable, and ultimately used in a given planning jurisdiction will depend in large part on a number of factors, among which are data availability, the planning goals and scope set by the Advisory Committee and other stakeholders, the human capacity available for modeling, and the time and money allocated to the planning effort. For example, macroeconomic modeling is often attractive, but requires the availability of an input-output model database and related software that, if available, may cost tens of thousands of dollars or more, require significant expertise to use, and may provide results that, when carefully examined, have significant limitations and/or do not provide insights that are significantly better than a careful, well-informed qualitative analysis.
Depending on the amount of information available for the baseline paths—information gathered in Step 2 and applied in Step 3—evaluation of overall paths could be qualitative-only or include quantitative elements (for example, costs, or area protected, or number of people affected, as shown in the metrics described in section 5.3.6). The relative performance of the paths can be evaluated using an extension of the “Matrix” approach introduced in Step 3 to compare the baseline and CRGG path(s) side by side against a range of criteria.

73
Evaluation would likely be carried out by the CRGG Planning Team and reviewed by the Advisory Committee and/or other stakeholders. A key benefit of path evaluation is that it offers the opportunity to explore the synergies (and potential conflicts) between the adaptation and economic development options included in the paths. As such, the evaluation stage may require some iteration. For example, alternative choices of adaptation and/or economic development options may need to be made if conflict arise, or if synergies come to light that should be taken advantage of.
4.6.3 Identify “Optimal” Path
Working with the advisory committee and stakeholders, the CRGG Project Team will identify an “optimal” or preferred path, and possibly a back-up path should conditions change, based on evaluation of the paths based on criteria identified as above. In this case, “optimal” will mean a path that meets the evaluation criteria in a way that is deemed superior to other candidate paths. Again, the weighting of criteria for selection will likely be largely subjective, but should be reported in a transparent manner that clearly indicates why the Project Team and Advisory Committee have made specific choices. In this way, the scoring results for the Optimal Pathway can be directly compared with the scoring results for the Baseline Development Pathway. The calculations involved are quite simple. Ideally, the results can be synthesized into a series of bar charts, one for each of the indicators analyzed, that illustrates the relative risk reduction achieved through the implementation of the adaptation options as measured by the difference in the height of the bars.
4.6.4 Potential Step 6 Entry Point for Mitigation Planning
For GHG emissions mitigation planning, a clear analog to Step 6, above, is the creation of one or more alternative GHG emission paths that reflect the impact of applying priority mitigation options to economic development/resource use paths in multiple sectors, including, for example, energy supply and demand, agriculture, land use, and forestry. In mitigation planning, this step involves compilation of all of the priority options recommended by mitigation Technical Working Groups and accepted by the Advisory Committee, completing descriptions of each option along with the “stand-alone” estimates of emissions reductions and direct costs described in section 4.5.4, adding together the GHG emissions reduction and net costs (or benefits) estimated for all of the options in each sector, then adding together all of the options in all of the sectors When options are added together, generally a process of estimating the degree of “overlap” between options is included. For example, an energy supply option may include a “renewable portfolio standard” that meets a fraction of electricity needs with renewable energy, and a “buildings” sector option may reduce the amount of electricity required, which would reduce the amount (and cost) of renewable energy that would need to be added to the electricity generation system.
TYPICAL OUTPUTS OF CRGG STEP 6: PREPARE AND EVALUATE ADAPTATION/ECONOMIC DEVELOPMENT (CRGG) PATHS
• Narrativedescriptionsofalternativeand“optimal”path(s).• Descriptionofthecomparison(s)betweenthealternativeandbaselinepaths,includingrationalesfor
pathchoicesmadebyplanninggroup.• Matrixofresults(inExcelorWordtableformat)showingpathresultsforeachcriterion(similarto
formatforStep3results).

74
The final result of the mitigation planning process typically includes a report that describes a mitigation “action plan” that shows the integrated (overlap-adjusted) emissions reduction and net direct costs or benefits of the options included in the plan, along with discussions of key issues including plan implementation. In some cases, mitigation planning will also include and report on the results of other quantitative or qualitative analyses, including the estimate of non-GHG air pollution benefits of the options included in a plan, and estimates of the indirect economic (or “macroeconomic”) impacts—on, for example, future provincial GDP and future employment by sector—that the mitigation action plan produces relative to the baseline path describe in the GHG emissions forecast prepared as described in section 4.3.7. It should be noted, however, that macroeconomic studies, though attractive as inputs to policymaking, can be very data-intensive and expensive to implement, and need to be both carried out and interpreted with care to avoid presenting misleading results.
In a planning exercise where consideration of adaptation and mitigation options is accomplished in a coordinated fashion, the adaptation and mitigation paths/plans would, like the baseline mitigation and adaptation paths/forecasts, share a common “storyline”, and probably many other elements as well. To the extent that priority adaptation options have the potential for GHG emissions mitigation, and vice versa, some options can and should appear, and be evaluated, in both adaptation- and mitigation-focused paths.
4.7 Step 7: Implementing Identified Adaptation Measures/Options (“Mainstreaming”) in Concert with Economic Development
In Step 7, as shown in Figure 4-10, below, the adaptation/CRGG elements of the optimal path chosen in Step 6 are elaborated into plans for implementation of programs and projects, then implemented. Monitoring and evaluation of the programs and projects is ongoing to determine whether the elements of the path are achieving their goals, and if not, to help to determine how they can be improved. Information from monitoring and evaluation is also used to help to determine how to improve the CRGG planning process in its next iteration.
Figure 4-10: Inputs to and Elements of Step 7: Implementing Identified Adaptation Measures/Options
FROM STEP 6
Priority Adaptation/ CRGG and Economic Development Elements of Optional Path
Update Plan on a regular Periodic Basis
STEP 7
Elaborate priority adaptation options as a part of an overall
development/ adaptation plan
Detailed Plans for programs and Project Implementation
(budgets, timing, scale…)
Implement Plans for Programs and Projects Monitoring and Evaluation

75
Part of the process of implementing the selected optimal path, and part of the use of the path will be as input to existing economic development plans, including the PDPFP. Those preparing and revising PDPFPs would use the optimal CRGG path as a means to identify adaptation-related additions to the PDPFP, and thus to update the elements of the PDPFP to make the plan more resilient to climate change impacts. The goal is to use the optimal path as a guide to revise current and future provincial and (as appropriate) local and municipal economic development plans to improve climate resilience as well as the achievement of other goals, such as poverty reduction and improvement in social equity. Economic development plans will also effectively be updated as the elements of the optimal plan are implemented, as described below. 31
4.7.1 Elaborate priority adaptation options as a part of an overall development/adaptation plan
With the optimal path defined as in Step 6, above, the next task is to elaborate the priority adaptation options included in the identified optimal path, and make decisions as to details regarding the scope, timing, and scaling of each option as needed, and will involve project development—determining the key inputs needed to bring the projects included in the plan to fruition—and at least preliminarily identifying project financing for the included options. Determining these details will require coordination with economic development and adaptation activities underway, and opportunities present, at the national, provincial, and local levels. In some cases the first task will be to identify ongoing economic development activities that will be augmented by adaptation components, though most of this “matching” process will likely be done, at least at a high level, as a part of the path definition work in Step 6.
The output of this process will be a Development/adaptation (CRGG) Plan composed of a number of specific programs and projects, each at a scale that is implementable given the human, financial, and other resources of the province (or the province and its local and/or national partners), some of which may focus solely on adaptation, some of which may add adaptation-related components to existing economic development initiatives, and some of which may add economic development components to existing climate change adaptation programs and projects. The provincial CRGG plan will optimally seek to be coordinated with plans at the national level, including those coming out of the NCCAP process.
With the Development/adaptation Plan and individual programs and projects elaborated, the next set of tasks will be to identify next steps and make plans for implementation of programs and projects (composed of measures, actions, and policies) included in the chosen and elaborated development/adaptation plan. Preparing implementation plans for programs and projects will typically involve writing general descriptions of each program/project identifying how and on what schedule they will be implemented, and by whom, what activities will be involved, what implementation mechanisms will be applied, what markets or groups or regions they will serve, as well as where the funding to implement the program/project will come from. These descriptions will likely need to be prepared in close coordination with provincial economic development authorities, and in some instances, with local or national authorities and/or private sector actors as well.
31. The Climate Change Public Expenditure and Institutional Review (CCPEIR), prepared by the World Bank and the CCC, provides guidance on understand the various mainstreaming entry points for climate change adaptation planning into the economic development planning process.

76
4.7.2 Implement Plans
With general descriptions for each program/project in place, the next task will be to implement the plans for adaptation/development and (if applicable) mitigation measures, actions, and policies included in the programs/projects in support of development objectives and other goals. This process will involve identifying, engaging, and working with the actors and institutions that will play key roles in implementing each program/project in the overall development/adaptation plan. An initial and generic listing of likely actors and institutions to be involved in plan implementation, and a proposed process for plan implementation is provided as Annex E to this Framework.
Working with the actors who will be implementing the programs and projects, planners will determine required budgets, staffing, scheduling, and sources of financing for each element of each adaptation program/project in the Plan. Note that in some cases, implementation may be by the private sector, in coordination with provincial authorities. With details as to implementation in place, those implementing each program/project will secure financing, retain contractors as needed, and begin programs and projects.
4.7.3 Monitor, Evaluate, and Revise Implementation of Measures as Needed
Even the best-designed programs or projects may not work properly, for reasons unforeseen, and in any case their implementation invariably offers lessons that can help in designing better programs and projects in the future. As such, each significant program or project implemented as part of the adaptation/development plan should include plans for monitoring and evaluation. Monitoring and evaluation (M&E) processes are used to harvest information on program/project effectiveness, and to generate ideas for making new or existing initiatives more effective. M&E typically includes collecting information on the progress of a given program or project, including, for example:
• The timing of completion of program/project milestones relative to the initial project schedule.
• The costs of the program/project, for comparison with initial projections.• The number of people served or protected by the program/project, or other metrics of the
extent to which the program or project met its goals, as applicable.• Surveys of participants in the program or project to ascertain their satisfaction with the
services provided, and gather ideas as to what might have been done better.• Surveys/interviews with those who worked on the program or project for a different
perspective on whether the project was implemented smoothly, and what might have been improved.
Project/program evaluation involves the use of data collected as above and comparison of collected data with the initial expectations for the project. Lessons learned from these evaluations are then incorporated into revisions of project or program goals and methods to try and improve the overall effectiveness of the initiative. Monitoring and evaluation is ideally carried out by third parties, that is, by groups other than those who have prepared and implemented the programs or projects in the first place. In some cases academics, including professors and students from provincial universities, may be good candidates to staff for monitoring and evaluation due to their expertise, relative independence from government and private interests, and ongoing
77
presence in the province and field, assisting with the recording and retention of lessons from previous program efforts.
4.7.4 Update Plan on a Regular, Periodic Basis
Climate change adaptation needs will certainly continue for many years, even if GHG emissions mitigation activities globally are very effective. CRGG plans will be much more effective if commitments are in place to update them on a regular basis. A regular schedule of plan updates assures that decision-makers, technical staff, and stakeholders remain engaged in adaptation planning, and retain and build upon the skills that they learn in each round of planning. As such, additional capacity-building will be an important part of the updating process, as will periodic review and revision of the CRGG Framework to make sure that it is consistent with the planning needs and capacities of the jurisdiction. Plan updates can be scheduled to coincide and coordinate with regular provincial planning activities (such as preparation of PDPFPs), but should be carried out every 3 or 4 years to make sure that too much time does not elapse between plans, and that the programs and projects developed remain responsive to current conditions.
Updating a CRGG Plan will involve confirming (or securing, if needed) a mandate to regularly update the CRGG plan, including a schedule and process for revising or revisiting the planning process on a regular basis in order to adequately reflect changes in knowledge about climate impacts, changes in economic outlook and development priorities, and other potentially changing concerns. As the first CRGG Plan is completed, the CRGG Planning Team, working with policymakers, will want to identify the required budgets, staffing, and training needs to support iterative updates, and make sure support for those resources is in place.
4.7.5 Potential Step 7 Entry Point for Mitigation Planning
If a GHG emissions mitigation planning effort parallels the adaptation/economic development planning process in a province, the final step for mitigation planning would look very similar to that outlined above. Though different actors and implementation mechanisms may be involved in bringing mitigation options to fruition, relative to adaptation options, the general process of elaborating mitigation plans, programs, and projects implied in the alternative paths described in Step 6, implementing the plans/programs/projects, monitoring and evaluating them, and retaining planning momentum by committing to regular plan updates, are all similar in concept to the adaptation-geared Step 7 process described above.
Monitoring and evaluation of mitigation options may in some cases be somewhat more straightforward than for adaptation options—as activities such as energy use, capacity of
TYPICAL OUTPUTS OF CRGG STEP 7: IMPLEMENTING IDENTIFIED ADAPTATION MEASURES/OPTIONS (“MAINSTREAMING”) IN CONCERT WITH ECONOMIC DEVELOPMENT
• Specificplans,schedules,andbudgetsforimplementationofadaptation/developmentprogramsandprojects.
• Reportsonmonitoringandevaluationofimplementedprogramsandplans.• Overallplan(staffing,budgets,timing)forperiodicupdatingofCRGGPlanningprocessandits
outputs

78
renewable electricity generation deployed, agricultural fertilizers replaced, and other “metrics” of mitigation programs and projects may be more easily measured than similar indicators of progress for adaptation options—but the concept of monitoring and evaluation is the same. Similarly, mitigation planning efforts need to be updated and revised regularly as conditions change, including preparing a new inventory and forecast of GHG emissions for the province every few years, and updating the mitigation (or low carbon development, or low-emissions development strategy) plan on the same periodic schedule. To the extent that capacity and budgets allow, mitigation and adaptation/economic development planning efforts should be closely coordinated in terms of the timing of and phasing of planning efforts, in order to be able to more closely integrate and coordinate mitigation and adaptation/economic development plans, and thus to make the best possible use of planning capabilities and resources.

79

805C h a p t e r
Conclusion and “Next Steps” in Framework Development and
Application
C h a p t e r

81
5.1 Objective of the CRGG Framework
As noted in the introduction to this Final Report, GGGI has commissioned this Framework Document to provide a systematic, but flexible, approach to the incorporation of climate adaptation planning together with economic development planning so as to produce climate resilient green growth (CRGG) plans addressing multiple environmental, social, and economic goals. The second Phase of Ecotown projects, carried out jointly by the CCC and in coordination with authorities at the provincial level, calls for the implementation of adaptation planning for several Philippine provinces, but with an emphasis on incorporating considerations of climate change adaptation and improvement in climate resilience to economic development planning, and vice versa. This Framework has been prepared to guide planning authorities in Philippine provinces, and the national CCC staff working with them, in carrying out Phase 2 Ecotown projects. Although it is designed with Philippine provinces in mind, it is also intended to be applicable, with modifications to suit local needs and resources, in other countries at the national and sub-national (including state, provincial, and municipal) levels.
5.2 Potential Limitations of CRGG Framework
The CRGG Framework as described above is intended to build on and use existing climate modeling efforts, but not to replicate them, thus to the extent that available climate modeling results prove inaccurate, the basis of the plans produced with the CRGG framework may be likewise problematic. This issue can be addressed by sensitivity analysis that uses different values of climate parameters as bases for comparison of options and plans, with a review of how comparisons change under different assumed climate change impacts. Many elements of the CRGG Framework may, particularly in their first implementation in a jurisdiction, be data-limited, and estimates of economic and physical (for example) parameters based on results in other places must be used. To the extent that those estimates are not reflective of the area for which the plan is prepared, inaccuracies can be introduced.
In addition, the CRGG Framework depends in many cases on subjective judgment, and thus relies on the Planning Team and Advisory Committee, as well as others involved in the planning process, to as much as possible be willing to work toward the overall good of the society, by evaluating options based on generally-agreed planning criteria, setting aside personal aspirations as much as possible. As such, the process requires participants to be well-informed, open-minded, consultative, and willing to participate in a transparent planning process that is inclusive of all relevant stakeholders.
Ultimately, as with any planning methodology, the effectiveness of the CRGG Framework in helping planners to achieve robust and successful plans depends centrally on at least three key factors: the competence, dedication, and effectiveness of the planning team, the degree of support for the planning team and its work by key decisionmakers and funding agencies, and, relatedly, the degree of follow-up to the planning effort with regards to plan implementation.
Conclusion and “Next Steps” in Framework Development and Application

82
5.3 Next Steps in CRGG Framework Development and Application
The next steps in the development of the CRGG Planning Framework and its application in the Philippines and beyond are, of course, to be decided by GGGI and its counterparts in the Philippines and elsewhere. Potential/likely “next steps” could, however, include:
• Revision/augmentation of training presentations for Philippine provincial teams undertaking Ecotown Phase 2 projects, and/or for Philippine national consultants, including professors and other university-based staff, who could serve as trainers in the Philippines more broadly.
• Work with national and selected provincial experts to develop additional Philippines-specific material, including databases and illustrative examples, to assist provincial teams in applying the CRGG Planning Framework. This could include establishing a national “clearinghouse” for information to support the application of the Framework at the provincial and other levels, or building upon the collections of an existing clearinghouse of climate information. Another possibility is to develop a regular training course for those carrying out CRGG Planning at the local level, including, for example, academics who might be able to help on multiple plans, as well as provincial agency staff who might be key participants in efforts in their provinces. Training could be provided in the general implementation of all of the steps of the CRGG Framework (including both participation in stakeholder processes and facilitation of same), in addition for example, to areas including data collection, interpretation of climate data for climate adaptation planning designing, carrying out surveys relevant to adaptation and economic development planning, and the use of relevant planning methods and software tools, The graduates of such a training course could be brought together as a formal or informal network at the national or regional level to share experiences and facilitate the linkage of experts to Provincial or local CRGG process where they are needed.
• Implement the CRGG Planning Framework in the context of Ecotown Phase 2 projects. For initial projects, it may be helpful to have assistance from national and international consultants in implementing the Framework, which would also provide an opportunity to update the Framework based on the experience in those Phase 2 projects.
• Implement the CRGG Planning Framework in other provinces in the Philippines.
• Adapt the CRGG Planning Framework for use at the local and provincial/state, and possibly national, level in other nations, and apply the Framework in other places.
• Broaden the CRGG Framework to more explicitly include procedures for GHG emissions mitigation planning to take place in parallel with adaptation/economic development planning. Such an initiative could, for example, integrate the concepts laid out in the methods for green growth planning emphasizing GHG emissions mitigation in the energy sector as provided in Energy Planning for Green Growth: A Handbook for Green Energy Planning and Mitigation Assessment (GGGI, 2015). The resulting Framework could them be applied in nations where both adaptation and mitigation were priorities.

83
Glossary
Literature Cited

84
Adaptation (Congress of the Philippines, 2009) Theadjustmentinnaturalorhumansystemsinresponsetoactualorexpectedclimaticstimuliortheireffects,whichmoderatesharmorexploitsbeneficialopportunities.
Adaptive capacity (Congress of the Philippines, 2009) Theabilityofecological,socialoreconomicsystemstoadjusttoclimatechangeincludingclimatevariabilityandextremes,tomoderateoroffsetpotentialdamagesandtotakeadvantageofassociatedopportunitieswithchangesinclimateortocopewiththeconsequencesthereof.
Climate change (Congress of the Philippines, 2009) Achangeinclimatethatcanbeidentifiedbychangesinthemeanand/orvariabilityofitspropertiesandthatpersistsforanextendedperiodtypicallydecadesorlonger,whetherduetonaturalvariabilityorasaresultofhumanactivity.
Climate extreme (extreme weather or climate event) (IPCC, 2012)Theoccurrenceofavalueofaweatherorclimatevariableabove(orbelow)athresholdvalueneartheupper(orlower)endsoftherangeofobservedvaluesofthevariable.Forsimplicity,bothextremeweathereventsandextremeclimateeventsarereferredtocollectivelyas“climateextremes”.
Climate resilient green growth (CRGG)CRGGcanbedefinedaseconomicdevelopmentthatemphasizesenvironmentalsustainabilityandadvancessocial andequitygoals,while alsopursuing climate changeadaptations thatmakeseconomicdevelopmentmoreclimate-resilient.
Climate risk (Congress of the Philippines, 2009)Theproductofclimateandrelatedhazardsworkingoverthevulnerabilityofhumanandnaturalecosystems.
Climate scenario (IPCC, 2012)A plausible and often simplified representation of the future climate, based on an internally consistentset of climatological relationships that has been constructed for explicit use in investigating the potentialconsequencesofanthropogenicclimatechange,oftenservingasinputtoimpactmodels.Climateprojectionsoften serve as the raw material for constructing climate scenarios, but climate scenarios usually requireadditionalinformationsuchasabouttheobservedcurrentclimate.
Climate variability (Congress of the Philippines, 2009)The variations in the average state and in other statistics of the climate on all temporal and spatial scalesbeyondthatofindividualweatherevents.
Disaster (Congress of the Philippines, 2009)Aseriousdisruptionof the functioningof a communityor a society involvingwidespreadhuman,material,economicorenvironmentallossesandimpactswhichexceedtheabilityoftheaffectedcommunityorsocietytocopeusingitsownresources.
Disaster risk reduction (Congress of the Philippines, 2009)The concept andpracticeof reducingdisaster risks through systematic efforts to analyze andmanage thecausalfactorsofdisasters, includingthroughreducedexposuretohazards, lessenedvulnerabilityofpeopleandproperty,wisemanagementoflandandtheenvironment,andimprovedpreparednessforadverseevents.
Ecotown (CCC and GGGI, 2014)Ecotownisdefinedasasustainablecommunityinharmonywiththeenvironment,butissetinaruralcontext.Itstandsfor“ecologicallystable”and“economicallyresilient”communities.
Glossary

85
Economic development (World Bank, 2000)Qualitative change and restructuring in a country’s economy in connection with technological and socialprogress. Themain indicator of economic development is increasingGNP per capita (orGDP per capita),reflectinganincreaseintheeconomicproductivityandaveragematerialwell-beingofacountry’spopulation.Economicdevelopmentiscloselylinkedwitheconomicgrowth.
Economic growth (World Bank, 2000)Quantitativechangeorexpansioninacountry’seconomy.EconomicgrowthisconventionallymeasuredasthepercentageincreaseinGDPorGNPduringoneyear.Economicgrowthcomesintwoforms:aneconomycaneithergrowextensivelybyusingmoreresources(e.g.,physical,human,naturalcapitals),orintensivelybyusingthesameamountofresourcesmoreefficiently(productively).Intensiveeconomicgrowthrequireseconomicdevelopment.
Exposure (IPCC, 2012)Thepresenceofpeople;livelihoods;environmentalservicesandresources;infrastructure;oreconomic,social,orculturalassetsinplacesthatcouldbeadverselyaffected.
Gender mainstreaming (Congress of the Philippines, 2009)The strategy formakingwomen’s aswell asmen’s concerns and experiences an integral dimension of thedesign, implementation,monitoring, and evaluation of policies and programs in all political, economic, andsocietalspheressothatwomenandmenbenefitequallyandinequalityisnotperpetuated.Itistheprocessofassessingtheimplicationsforwomenandmenofanyplannedaction,includinglegislation,policies,orprogramsinallareasandatalllevels.
Green growth (GGGI, 2011)Thenewrevolutionarydevelopmentparadigmthatsustainseconomicgrowthwhileatthesametimeensuringclimaticandenvironmentalsustainability.Itfocusesonaddressingtherootcausesofthesechallengeswhileensuringthecreationofthenecessarychannelsforresourcedistributionandaccesstobasiccommoditiesfortheimpoverished.
Greenhouse gases (GHG) (Congress of the Philippines, 2009)Constituentsoftheatmospherethatcontributetothegreenhouseeffectincluding,butnotlimitedto,carbondioxide,methane,nitrousoxide,hydrofluorocarbons,perfluorocarbonsandsulfurhexafluoride.
Hazard (IPCC, 2012)Thepotentialoccurrenceofanaturalorhuman-inducedphysicaleventthatmaycauselossoflife, injury,orotherhealthimpacts,aswellasdamageandlosstoproperty,infrastructure,livelihoods,serviceprovision,andenvironmental resources.
Hazard Assessment Hazardsassessmentinvestigatesthepotentialeffectsofclimatechangehazardsoneconomicactivitiesandresources inbaselinepathways,usingexistingclimatechangemodelingresults tocreatetoolssuchasmapoverlaysandnarrativesforuseinidentifyinghazards.
Impact AssessmentImpactassessmentinvolvesidentifyingthepotentialeffectsofclimatechangehazardsoninputtodevelopmentpathways,thatis,ontheproductionbasefortheeconomy,focusing,forexample,onbiophysicalresourcessuchaswater,andecosystems,productiveresourcessuchasenergy,infrastructure,andtechnology,andhumanandfinancialresources.
Mainstreaming (Congress of the Philippines, 2009)Theintegrationofpoliciesandmeasuresthataddressclimatechangeintodevelopmentplanningandsectoraldecision-making.

86
Maladaptation (Lim et al., 2004)Occurswhen an action or process increases vulnerability to climate change-related hazards.Maladaptiveactionsandprocessesoftenincludeplanneddevelopmentpoliciesandmeasuresthatdelivershort-termgainsoreconomicbenefits,butcaneventuallyleadtoexacerbatedvulnerabilityinthemediumtolongterm.
Mitigation (Congress of the Philippines, 2009)Inthecontextofclimatechange,referstohumaninterventiontoaddressanthropogenicemissionsbysourcesandremovalsbysinksofallGHG,includingozone-depletingsubstancesandtheirsubstitutes.
Resilience (IPCC, 2012)Theabilityofasystemanditscomponentpartstoanticipate,absorb,accommodate,orrecoverfromtheeffectsofahazardouseventinatimelyandefficientmanner,includingthroughensuringthepreservation,restoration,orimprovementofitsessentialbasicstructuresandfunctions.
Sea level rise (SLR) (Congress of the Philippines, 2009)Anincreaseinsealevelwhichmaybeinfluencedbyfactorslikeglobalwarmingthroughexpansionofseawaterastheoceanswarmandmeltingoficeoverlandandlocalfactorssuchaslandsubsidence.
Sensitivity (IPCC, 2012)Thedegree towhich a system is affected, either adversely or beneficially, by climate variability or climatechange.Theeffectmaybedirect(e.g.,achangeincropyield inresponsetoachangeinthemean,range,orvariabilityoftemperature)orindirect(e.g.,damagescausedbyanincreaseinthefrequencyofcoastalfloodingduetosealevelrise).
Sustainable Development (IPCC, 2012)Developmentthatmeetstheneedsofthepresentwithoutcompromisingtheabilityoffuturegenerationstomeettheirownneeds.
Transformation (IPCC, 2012)The altering of fundamental attributes of a system (including value systems; regulatory, legislative, orbureaucraticregimes;financialinstitutions;andtechnologicalorbiologicalsystems).
Vulnerability (Congress of the Philippines, 2009)Thedegree towhicha system is susceptible to, orunable to copewith, adverseeffectsof climate change,includingclimatevariabilityandextremes.Vulnerabilityisafunctionofthecharacter,magnitude,andrateofclimatechangeandvariationtowhichasystemisexposed,itssensitivity,anditsadaptivecapacity.
Vulnerability AssessmentVulnerability assessment involves identifying the potential effect of climate change hazards on economicactivitiesproduction,withactivitiesselectedonthebasisoftheircurrentandfutureeconomic importance.Examplesofthesectorsthatmaybeincludedinagivenprovincialvulnerabilityassessmentincludeagriculture,fisheries,industry,mining,forestry,tourism,and/orotherimportantsectors.

87
ADW,UNU-EHS,2014.WorldRiskReport-Thecityasariskarea,WorldRiskReport.AllianceDevelopmentWorks(ADW)andUnitedNationsUniversity-InstituteforEnvironmentandHumanSecurity(UNU-EHS),Bonn,Germany.
Agrawala, S., 2004.Adaptation,DevelopmentAssistance andPlanning:Challenges andOpportunities. IDSBulletin35,50–54.doi:10.1111/j.1759-5436.2004.tb00134.
Agrawala,S.,Fankhauser,S.,2008.EconomicAspectsofAdaptationtoClimateChange:Costs,BenefitsandPolicyInstruments.OrganisationforEconomicCo-operationandDevelopment(OECD),Paris,France.
Agrawala,S.,vanAalst,M.,2008.Adaptingdevelopmentcooperationtoadapttoclimatechange.ClimatePolicy8,183–193.
Alkire,S.,Santos,M.E.,2010.AcuteMultidimensionalPoverty:ANewIndexforDevelopingCountries(SSRNScholarlyPaperNo.ID1815243).SocialScienceResearchNetwork,Rochester,NY.
AsianDevelopmentBank,2012.KeyIndicatorsforAsiaandthePacific2012.AsianDevelopmentBank(ADB).
Asian Development Bank, 2007. Philippines: Critical Development Constraints. Asian Development Bank(ADB).
Bandura,R.,2008.ASurveyofComposite IndicesMeasuringCountryPerformance:2008Update(UNDP/ODSWorkingPaper).OfficeofDevelopmentStudies(ODS),UnitedNationsDevelopmentProgramme(UNDP),NewYork.
Bowen, A., Cochrane, S., Fankhauser, S., 2012.Climate change, adaptation and economic growth.ClimaticChange113,95–106.doi:10.1007/s10584-011-0346-8.
CCC, 2015. Enhancing Capacities for Low EmissionDevelopment Strategies: EC-LEDS in the Philippines.ClimateChangeCommission,ExecutiveOfficeofthePresidentofthePhilippines.
CCC, 2011. National Climate Change Action Plan (NCCAP) 2011-2028. Climate Change Commission,ExecutiveOfficeofthePresidentofthePhilippines.
CCC,GGGI,2014.DemonstrationoftheEco-townFrameworkProjectinSanVicente,Palawan,Philippines.ClimateChangeCommissionandtheGlobalGreenGrowthInstitute,Seoul.
Colfer,C.J.P.,Capistrano,D.,eds,2005.Thepoliticsofdecentralization:forests,peopleandpower.EarthscanPublications,London,UK.
CongressofthePhilippines,2009.ClimateChangeActof2009(RepublicActNo.No.9729).RepublicofthePhilippines,CongressofthePhilippines,MetroManila,Philippines.
Dessai,S.,Hulme,M.,2004.Doesclimateadaptationpolicyneedprobabilities?ClimatePolicy4,107–128.doi:10.1080/14693062.2004.9685515.
Dovers,S.R.,Hezri,A.A.,2010.Institutionsandpolicyprocesses:themeanstotheendsofadaptation.WIREsClimChg1,212–231.doi:10.1002/wcc.29.
Feenstra, J.F., Burton, I., Smith, J.B., Tol, R.S.J., 1998. Handbook on Methods for Climate Change ImpactAssessmentandAdaptationStrategies.UNEP/VrijrUniversiteit,Amsterdam.
Fisher,A.,etal.,2000.Preparingforachangingclimate:thepotentialconsequencesofclimatevariabilityandchange(AreportoftheMid-AtlanticRegionalAssessmentTeam(MARA)).EPAandPennsylvaniaStateUniversity,PA,USA.
Literature Cited

88
Füssel, H.-M., 2007. Adaptation planning for climate change: concepts, assessment approaches, and keylessons.SustainSci2,265–275.doi:10.1007/s11625-007-0032-y.
GGGI, 2015. Energy Planning forGreenGrowth: AHandbook forGreen Energy Planning andMitigationAssessment.GlobalGreenGrowthInstitute(GGGI),Forthcoming,Seoul,SouthKorea.
GGGI,2014.GreenGrowthinPractice-LessonsfromCountryExperiences.GlobalGreenGrowthInstitute(GGGI),Seoul,SouthKorea.
GGGI,2011.GreenGrowthinmotion:SharingKorea’sExperiences.GlobalGreenGrowthInstitute(GGGI),Seoul,SouthKorea.
Harmeling, S., Eckstein, D., 2012. Global Climate Risk Index 2013 (Briefing Paper). Germanwatch, Bonn,Germany.
HLURB,CCC,UNDP,AustralianAid,2015.SupplementalGuidelinesonMainstreamingClimateandDisasterRisksintheComprehensiveLandUsePlan.HousingandLandUseRegulatoryBoard(HLURB),QuezonCity,Philippines.
Horton, R.M., Gornitz, V., Bader, D.A., Ruane, A.C., Goldberg, R., Rosenzweig, C., 2011. Climate HazardAssessmentforStakeholderAdaptationPlanninginNewYorkCity.J.Appl.Meteor.Climatol.50,2247–2266.doi:10.1175/2011JAMC2521.1
Hsu,CandSandford,B.,2007.“TheDelphiTechnique:MakingSenseOfConsensus”,PracticalAssessment,Research&Evaluation,Vol12,No10
Huq,S.,Ayers, J.,2008.TakingSteps:MainstreamingNationalAdaptation (IIEDPolicyBrief). InternationalInstituteforEnvironmentandDevelopment,London,UK.
IFRC,2007.RedCross/RedCrescentClimateGuide.InternationalFederationofRedCrossandRedCrescentSocieties.
IISD, 2012. CRiSTAL User’s Manual Version 5 - Community-based Risk Screening Tool - Adaptation andLivelihoods.InternationalInstituteforSustainableDevelopment,Manitoba,Canada.
IPCC,2014.ClimateChange2014:SynthesisReport.ContributionofWorkingGroupsI,IIandIIItotheFifthAssessmentReportof the IntergovernmentalPanelonClimateChange. IntergovernmentalPanelonClimateChange,Geneva,Switzerland.
IPCC,2012.ManagingtheRisksofExtremeEventsandDisasterstoAdvanceClimateChangeAdaptation(No.ASpecialReportofthe IntergovernmentalPanelonClimateChangeWorkingGroups IandII (Field,C.B.,V.Barros,T.F.Stocker,D.Qin,D.J.Dokken,K.L.Ebi,M.D.Mastrandrea,K.J.Mach,G.-K.Plattner,S.K.Allen,M.Tignor,andP.M.Midgley,eds.)).CambridgeUniversityPress,Cambridge,UK,andNewYork.
Kristensen,P.,2004.TheDPSIRFramework.NationalEnvironmentResearchInstitute,Denmark.
Larson,A.M.,2005.Democraticdecentralizationintheforestrysector:lessonslearnedfromAfrica,AsiaandLatinAmerica.CenterforInternationalForestryResearch.
Lasco,R.D.,Pulhin,F.B.,Jaranilla-Sanchez,P.A.,Delfino,R.J.P.,Gerpacio,R.,Garcia,K.,2009.Mainstreamingadaptationindevelopingcountries:ThecaseofthePhilippines.ClimateandDevelopment1,130–146.doi:10.3763/cdev.2009.0009.
Lebel,L.,Li,L.,Krittasudthacheewa,C.,etal.,2012.Mainstreamingclimatechangeadaptationintodevelopmentplanning.AdaptationKnowledgePlatformandStockholmEnvironmentInstitute,Bangkok,Thailand.
89
Lee,J.,etal.,2010.ClimateChangeAdaptationCapacity Indicators -PilotStudy fortheApplicationof theIndicatorsattheLocalLevel.KoreaEnvironmentInstitute(KEI),Seoul,SouthKorea.
Lim,B.,Spanger-Siegfried,E.,Burton,I.,Malone,E.,Huq,S.,2004.AdaptationPolicyFrameworksforClimateChange:DevelopingStrategies,PoliciesandMeasures.CambridgeUniversityPress,Cambridge,UK,andNewYork.
McGray,H.,Bradley,R.,Hammill, A., Schipper,E.L.F., Parry, J.-E., 2007.Weathering theStorm:Options forFramingAdaptationandDevelopment.WorldResourcesInstitute.
Mimura, N., R. S. Pulwarty, D.M.Duc, I.Elshinnawy, M.H.Redsteer, H.Q.Huang, J,Nkem, and R.A.SanchezRodriguez,2014: Adaptation planning and implementation In:ClimateChange2014:Impacts,Adaptation,and Vulnerability. Part A:Global and Sectoral Aspects. Contribution of WorkingGroup II to the Fifth Assessment Report of the Intergovernmental Panel on Climate Change[Field,C.B.,V.R.Barros,D.J.Dokken,K.J.Mach,M.D.Mastrandrea,T.E.Bilir,M.Chatterjee,
K.L.Ebi,Y.O.Estrada,R.C.Genova,B.Girma,E.S.Kissel,A.N.Levy,S.MacCracken,P.R.Mastrandrea,and L.L.White(eds.)].CambridgeUniversityPress,Cambridge,UnitedKingdomandNewYork,NY,USA,pp.869-898.
NEDA,2011.PhilippineDevelopmentPlan2011-2016.NationalEconomicandDevelopmentAuthority.
ODI,2013.CaseStudies-AdaptationtoClimateChangeinWater,SanitationandHygiene-AssessingrisksandappraisingoptionsinAfrica.OverseasDevelopmentInstitute(ODI),London,UK.
OECD,2013.PuttingGreenGrowthattheHeartofDevelopment:SummaryForPolicymakers.OrganisationforEconomicCo-operationandDevelopment(OECD),Paris,France.
OECD, 2009. Integrating Climate Change Adaptation into Development Co-operation - Policy Guidance.OrganisationforEconomicCo-operationandDevelopment(OECD),Paris,France.
Olhoff, A., Schaer, C., 2010. Screening tools and guidelines to support themainstreaming of climate changeadaptationintodevelopmentassistance-astocktakingreport.UnitedNationsDevelopmentProgramme,NewYork.
PCSD,2011.ThePhilippines’Rio+20Report: Inputs for theCompilationDocument.PhilippineCouncil forSustainableDevelopment(PCSD).
PSA-NSCB, 2014. 2014 Compendium of Philippine Environment Statistics. Republic of the Philippines,PhilippineStatisticsAuthority(PSA).
RaworthK2012.ASafeandJustSpaceforHumanity:Canwelivewithinthedoughnut:OxfamInternational.
SBSTA,2009.Performanceindicatorstomonitorandevaluatetheeffectivenessoftheimplementationofthetechnologytransferframework”-FinalreportbytheChairoftheExpertGrouponTechnologyTransfer.SubsidiaryBodyforScientificandTechnologicalAdvice(SBSTA),UNFCCC.
Sietz,S.,2013.IndigenousPeoplesandtheprocessofdecentralization:ConflictinginterestsregardinguplandresourcemanagementinPalawanProvince/Philippines(OccasionalPaperNo.No.13).SoutheastAsianStudiesattheUniversityofFreiburg,Freiburg,Germany.
Sniffer, 2012. Climate change adaptation-related indicators (Final Report No. ER23). Sniffer - knowledgebrokersforaresilientScotland,Scotland.

90
Stucki, V., Smith, M., 2010. Integrated Approaches to Natural Resources Management in Practice: TheCatalyzingRoleofNationalAdaptationProgrammes forAction.AMBIO40,351–360.doi:10.1007/s13280-010-0097-1.
UKCIP,2001.Socio-economicscenariosforclimatechangeimpactassessment-AguidetotheiruseintheUKClimateImpactsProgramme.UKClimateImpactsProgramme(UKCIP),Oxford,UK.
UNCTAD, 2012.World InvestmentReport 2012.UnitedNationsConference on Trade andDevelopment(UNCTAD),Geneva,Switzerland.
UNDP,2014.HumanDevelopmentReport2014-SustainingHumanProgress:ReducingVulnerabilitiesandBuildingResilience.UnitedNationsDevelopmentProgramme(UNDP),NewYork,NY.
UNDP-UNEP, 2011. Mainstreaming climate change adaptation into development planning: A guide forpractitioners.UNDP-UNEPPovertyEnvironmentInitiative(PEI).
UNEP, 2011. IEA TrainingManual Volume Two - ClimateChange Vulnerability and Impact Assessment inCities.UnitedNationsEnvironmentProgramme(UNEP).
UNESCAP,2011.EconomicandSocialSurveyofAsiaandthePacific2011.UNESCAP,Bangkok,Thailand.
UNFCCC,2012.TheNationalAdaptationPlanProcess-Abriefoverview(LeastDevelopedCountries(LDC)ExpertGroup).UnitedNationsFrameworkConventiononClimateChange(UNFCCC).
UNFCCC,2008.CompendiumonMethodsandToolstoEvaluateImpactsof,andVulnerabilityandAdaptationto,ClimateChange.UnitedNationsFrameworkConventiononClimateChange.
UNIDO,2011.IndustrialDevelopmentReport2011.UnitedNationsIndustrialDevelopmentOrganization,Vienna,Austria.
UNPEI, 2009.MainstreamingPoverty-Environment Linkages intoDevelopmentPlanning:AHandbook forPractitioners.UNDP-UNEPPovertyEnvironmentInitiative(PEI),Nairobi,Kenya.
World Bank, 2012. Inclusive Green Growth: The Pathway to Sustainable Development. World Bank,Washington,D.C.
World Bank, 2010. Mainstreaming adaptation to climate change in agriculture and natural resourcesmanagementprojects(GuidanceNoteNo.1).WorldBank,Washington,D.C.
WorldBank,2000.BeyondEconomicGrowth–MeetingtheChallengesofGlobalDevelopment.WorldBank,Washington,D.C.
WorldBank,1996.PerformanceMonitoringIndicatorsHandbook(WorldBankTechnicalPaperNo.No.334).WorldBank,Washington,D.C.
WWF,2009.TheGreaterMekongandClimateChange:Biodiversity,ecosystemservicesanddevelopmentatrisk.WorldWideFundGreaterMekongProgram.
Yap,J.T.,Majuca,R.P.,2013.AspirationsandChallengesforEconomicandSocialDevelopmentinthePhilippinesToward2030(DiscussionPaperNo.DP2013-27).PhilippineInstituteforDevelopmentStudies.

91

Annotated Bibliography

93
Annex A: Annotated Bibliography
The following provides brief annotated descriptions of key references that may be of particular use to CRGG Planners. These references also appear above in the standard bibliography of documents accessed/reviewed in the development of this Framework Report.
Annotated Bibliography 1: Literature for practitioners’ and decision-makers’ use and guidance (including frameworks, tools, methods)
1. Economic Aspects of Adaptation to Climate Change: Costs, Benefits and Policy Instruments (Agrawala and Fankhauser, 2008).
This report presents the economic aspect of adaptation with an assessment of costs and benefits of adaptation in key climate-sensitive sectors and at national and global levels as well. The current issue of adaptation is mainly on costs, benefits and trade-offs between the cost of climate policies and residual damage. Costs and benefits of adaptation are relevant at different levels:
• The actor level: help decision maker formulate policy, deciding whether, how much, and when to invest in adaptation
• The national, global level: help create aggregate adaptation “price tags” which would then allow funding to be sourced domestically, internationally, and privately
Also, it discusses three key economic and policy instruments to incentivize adaptation:
1. Insurance• A dual role in lessening adverse impacts of climate events on policy-makers and reducing
climate risks2. Price signals and environmental markets
• Critical to adaptation within the context of climate-sensitive natural resources such as water and ecosystems
3. Public private partnerships (PPPs)• A crucial role in financing and enhancing climate resilience of infrastructure• In research and development for adaptation technologies in agriculture
This report gives a comprehensive cost-benefit analysis of adaptation and policy instruments to incentivize adaptation. It is useful for the Eco-town Phase II when adaptation is integrated into economic development agenda.
2. Demonstration of the Eco-town Framework Project in San Vicente, Palawan, Philippines (CCC and GGGI, 2014).
This report presents a contextual background, conceptualized framework, results and recommendations for the Phase I Eco-Town Project and potentially points out ways forward for the Eco-Town Phase II with Climate-resilient Green Growth (CRGG) Framework. Initiated jointly by the Philippine Climate Change Commission (CCC) and the Global Green Growth Institute (GGGI), the Demonstration of Eco-town Framework Project aims to:

94
1. Promote green growth2. Reduce the vulnerability of communities and ecosystems to climate change impacts3. Integrate adaptation measures as drivers of economic growth4. Support the implementation of the National Climate Change Action Plan (NCCAP) at the
local level
The Eco-town in this context stands for “ecologically stable” and “economically resilient” local communities. Being a coastal municipality with people’s livelihoods largely dependent on natural resources, San Vicente in Palawan is highly vulnerable to adverse impacts of climate change. With a comprehensive sectoral analysis concerning development priorities, natural resources, hazards and risks and vulnerability, the report points out that integrating adaptation measures into sectoral planning from agriculture, health, to coastal and marine is essential for achieving a successful eco-town model at the local government unit (LGU). Moreover, climate-proofing is critical for current and future development planning across sectors and at all levels.
3. Green Growth in Practice - Lessons from Country Experiences (GGGI, 2014).
Green growth is becoming increasingly attractive because it integrates poverty reduction, environmental protection, resource efficiency and economic growth. Carried out by the Green Growth Best Practice (GGBP) initiative, this report provides a conceptual and practical support for CRGG Framework as it explores key elements, effective practices and lessons in green growth analysis. It is noteworthy that these elements are not a linear, step-by-step process, and policy-makers may choose different entry points according to their own domestic context.
Nine effective elements for green growth:1. Employ well designed planning and coordination processes 2. Establish clear visions, targets, baselines 3. Undertake robust analysis and balanced communication of benefits of green growth 4. Prioritize measures and technologies and construct credible pathways towards formulated
targets 5. Design portfolios of policies to address near-term development and long-term green
growth transformation goals and respond to specific market failures and political economy challenges
6. Design public finance instruments to overcome barriers to mobilize private investment into green growth sectors
7. Take advantage of the power of public-private collaboration 8. Pursue mutually reinforcing action across subnational and national levels of government 9. Build and maintain robust green growth monitoring and evaluation systems
Lastly, the GGBP review of past experiences of countries found that: • Green growth can lead to substantial economic, social, and environmental benefits • Integrated and robust planning, analysis, implementation, and monitoring are indispensable• Broad support for transformative change is necessary • Long-term and transformational benefits of green growth need further assessment and
validation

95
4. Taking Steps: Mainstreaming National Adaptation (IIED Policy Brief) (Huq and Ayers, 2008).
This article sheds light on possible approaches to realize climate change mainstreaming. It uses a “learning by doing” approach and provides a four-step guide for mainstreaming climate change adaptation, primarily at national level. Climate change adaptation needs to be integrated into development planning and policy. As an integrated approach to adaptation and development, mainstreaming incorporates development policies and practices that address adaptation and vulnerability reduction into ongoing sectoral planning and decision making.
The four-step mainstreaming process in a period of five to seven years:
1. Step one: awareness raisingThe first step includes identification of the causes of vulnerability, improved tools for climate data analysis, investment in technical and scientific capacity building, and enhanced communication between available climate information and policymakers.
2. Step two: targeted informationThe need to translate scientific climate information into usable format for different stakeholders including policymakers, planners, civil society organizations and research communities. Reversely, stakeholders should be receptive to use scientific information.
3. Step three: piloted activitiesGood practice demonstration for adaptation and mitigation from government, NGOs and private sector.
4. Step four: mainstreamingThe phase which climate change information is fully integrated into development. Moreover, further capacity building is needed across sectors and at all levels to absorb lessons learned from Step 1 to 3.
In all, the four-step guide is clear and accessible. However, elements such as governance, planned evaluation, policy review and required training and knowledge for pilot activities remain unspecified. It could be considered as a starting point for reviewing mainstreaming policy-making for CRGG Framework at the national level.
5. CRiSTAL User’s Manual Version 5 - Community-based Risk Screening Tool - Adaptation and Livelihoods (IISD, 2012).
Targeting project planners and managers, CRiSTAL, or “community-based risk-screening tool – adaptation and livelihoods”, uses a livelihood approach to address climate risks and adaptation at the local or community level. This desktop application has three main outputs:
1. List of livelihood resources that are most affected by climate hazards and most important for responding to climate impacts.
2. Proposed adjustments to existing projects and new activities to support climate adaptation.3. List of desired adaptation outcomes and important influencing factors to be monitored.

96
Based on an assumption that climate risk management and reduction needs an appraisal of how livelihoods are conducted and maintained at the local scale, CRiSTAL offers a capital lens to draw on the sustainable livelihoods framework. Livelihoods here are defined in terms of capitals and resources. In this way, rather than viewing climate risks as an environmental issue solely, CRiSTAL allows policy-makers and practitioners to appreciate development issues in the context of climate change.
CRiSTAL serves as an ideal risk assessment tool for the Eco-town Phase II CRGG Framework as it connects adaptation to economic development. It is an effective way to frame adaptation interventions that are mutually reinforcing with economic development at the community or local level.
6. Mainstreaming climate change adaptation into development planning (Lebel et al., 2012).
This report reviews main approaches and lessons learned for mainstreaming adaptation into development planning in the Asia-Pacific region after the Adaptation Knowledge Platform in Bangkok, 2010. Firstly, it points out several benefits of mainstreaming:
i. Avoided policy conflictsii. Reduced risks and vulnerabilityiii. Greater efficiency in comparison with managing adaptation separatelyiv. Leveraging much larger financial flows in affected sectors than the amounts available for
financing adaptation separately
Later, with a review of current mainstreaming frameworks and practices proposed by different stakeholders, it presents lessons learned and strategies for effective mainstreaming:
1. Inform and engagea) Strengthen capacities to use climate informationb) Enable locally appropriate responses
2. Screen and assessa) Screen risksb) Assess risks and adaptation options
3. Allocate and coordinatea) Start with existing policies and plansb) Broaden constituencies beyond environment agenciesc) Manage policy conflicts
4) Review and learna) Learn from projects but recognize their limitationsb) Monitor and learn
In all, this report gives a critical lens reviewing current proposed mainstreaming frameworks and reflects on lessons learned from past experiences. It is useful for CRGG Framework in terms of planning, evaluating, and reflecting processes.

97
7. Weathering the Storm: Options for Framing Adaptation and Development (McGray et al., 2007).
Written based on internet resources on 135 examples of adaptation efforts from the developing world, this paper explores the link between climate adaptation and development agenda. It points out that the majority of existing mechanisms merging development and adaptation have a distinct cut between “normal” and “additional” types, which the latter specifies the need of adaptation to climate change. However, it proposes a breakdown of “either/or” thinking and argues for a more integrated approach in addressing climate change along with other pressing global issues. It suggests that:
1. Funders need to include vulnerability-reduction and capacity-building activities in adaptation projects
2. Fostering inclusive and accountable decision-making due to its centrality in ensuring that policies are implemented as formulated
3. Data that are priorities for adaptation do not necessarily associate directly with climate prediction as they include; more channels of communication and data are in need to interpret climate information
4. As adaptation efforts progress, donor coordination is needed so that redundancies are avoided and gaps are covered
This review is relevant to the Eco-Town Phase II planning as it helps to recognize how adaptation and development best support one another, shedding light on understanding how best to support adaptation efforts in the context of the need for development.
8. Integrating Climate Change Adaptation into Development Co-operation - Policy Guidance (OECD, 2009).
This policy guidance provides insight for the CRGG Framework especially at local level regarding adaptation integration into development and governance. In particular, it proposes a holistic “whole of government” approach to operationalize adaptation at all levels. It is a relatively comprehensive guidance with explicit links between planning and policy cycle. In general, this guidance offers information and advice to policy-makers and practitioners primarily in development cooperation agencies on how to mainstream climate change adaptation into development. Emphasizing on the integration of adaptation into existing development processes and activities, it recommends potential approaches at different levels:
1) National level: A “whole of government”, holistic approach is requireda) Engaging key stakeholdersb) Improving the coordination with existing mechanisms for disaster risk reductionc) Implementing of relevant multilateral and regional environmental agreementsd) Reviewing and adjusting relevant regulations and standards to reflect climate change
impactse) Making sure decision making is based on best available information
2) Sectoral levela) Incorporating the adaptation activities and projects identified during the planning stageb) Including climate change risks in the screening criteria used to assess project proposals
before investment

98
c) Making room in the budget for adaptation responses identified in the context of cross-sectoral plans
3) Project levela) Incorporating considerations of climate risks and adaptation throughout the project cycle b) Developing, pilot testing and implementing climate risk assessmentsc) Developing appropriate metrics and indicators to assess the effectiveness of efforts to
better integrate climate risks and adaptation considerations d) Engaging a wide variety of stakeholders to identify adaptation options and indicators that
monitor progress and success
4) Local levela) Integrating climate change in development planning processes of local governments b) Adjusting local regulatory and service provision frameworks to local impacts of climate
change c) Adjusting local government accountability mechanisms d) Engaging private-sector and civil society organizations and processes which can support
adaptation at the local level by internalizing and institutionalizing climate risk management into their own decision-making process and operations
9. Putting Green Growth at the Heart of Development: Summary For Policymakers (OECD, 2013).
This report by OECD provides a summary for policy-makers regarding the definition, necessity, required actions for achieving green growth in developing countries, and therefore serves as a strong theoretical support and instructive guideline for CRGG Framework. The highlight of the report is an elaborated agenda for action-taking at national and international levels to pursue green growth:
National: A three-step agenda for action at the policy level 1) Leadership, vision, and plan 2) Design, reform, and implement policies conducive to green growth
• Tax and pricing instruments - Energy subsidy reform - Reform of environment taxes and fees - Payments for ecosystem services (PES)
• Regulations, standards, and information policies - Standards and certification of sustainable production - Sustainable public procurement - Land tenure
• Cross-cutting policies - Green investment policies - Green innovation policies - Greening skills development policies - Climate adaptation policy
3) Augment governance capacity and resources
International: an agenda for international cooperation to support green growth in developing countries. The international community plays a crucial role in helping to support and facilitate

99
developing countries in making the shift towards green growth (especially in the management the short-term tradeoffs).
Facilitation through incentives: 3 main pillars1) Strengthen green finance and investment 2) Facilitate trade in green goods and services 3) Promote green technology innovation through cooperation
10. Screening tools and guidelines to support the mainstreaming of climate change adaptation into development assistance - a stocktaking report (Olhoff and Schaer, 2010).
This stocktaking report provides a comparative overview and analysis of screening tools and guidance efforts on climate change up to 2010. It points out that the constructing of conceptual framework for mainstreaming has progressed considerably over the last decade. It demonstrates how climate risk screening supports the mainstreaming process. It suggests that in order to make best use of climate information, there is a need to harmonize approaches to assessment and integration of climate risks in development activities.
Moreover, to better understand the operationalization of mainstreaming at national, sectoral and project levels, this report draws on information from Policy Guidance on Integrating Climate Change Adaptation into Development Co-operation by OECD (2009) and presents a comprehensive framework mapping . In addition, the Annex 1 provides a summary of major climate screening tools and guidelines up to 2010 and will be very useful for a time-constrained review in relation to the CRGG Framework on mainstreaming adaptation into economic development.
11. Mainstreaming climate change adaptation into development planning: A guide for practitioners (UNDP-UNEP, 2011).
The global UN-led program, Poverty-Environment Initiative (PEI) offers a framework for practitioners concerning mainstreaming adaptation in development planning at national level. Through a poverty-environment lens, the proposed framework consists of three main components:
1) Finding the entry points and making the case- Setting the stage for mainstreaming- Understanding the linkages between climate change and national development priorities- Understanding the governmental, institutional, and political contexts that inform efforts
to define pro-poor adaptation outcomes2) Mainstreaming adaptation into policy processes
- Integrating climate change adaptation issues into an ongoing policy process3) Meeting the implementation challenge
- Ensuring mainstreaming of climate change adaptation into budgeting and financing, implementation and monitoring, and the establishment of mainstreaming as standard practice

100
Moreover, stakeholder engagement with government, non-governmental and development actors takes place throughout the course, from inception to policy development, implementation and monitoring. This framework provides a detailed guide for practitioners to achieve mainstreaming adaption into pro-poor economic growth and development. It is useful for the CRGG Framework as an entry point for adaptation integration and highlights the importance of stakeholder engagement. However, it should offer more explicit, context-specific lessons on mainstreaming adaptation at the local level.
12. Compendium on Methods and Tools to Evaluate Impacts of, and Vulnerability and Adaptation to, Climate Change (UNFCCC, 2008).
This compendium provides its target audience (assessment manager, technical researchers) with key information about methods and tools on impacts evaluation, vulnerability and adaptation to climate change. It serves as a reference document to identify currently available frameworks, tools and special features of each framework or tool for assessing vulnerability and adaptation. It has three main focuses:
1) Reviewing frameworks, methods that prescribe an entire process for the assessment of vulnerability and adaptation and assemble toolkits to support this process. These frameworks offer a broad strategic approach
2) Establishing a structure for cataloging tools that assist in addressing key cross-cutting themes
3) Organizing discrete tools specific to particular sectors.
This document could be highly useful for the Eco-Town Phase II for quick references and guidance in relation to adaptation, impacts assessment and vulnerability. It includes a wide array of approaches such as multisector, socioeconomic scenarios, stakeholder and sectoral ones. It is noteworthy that the purpose of this compendium is to direct its users on how to obtain more information, rather than instructing them on how to apply any particular framework or tool.
Annotated Bibliography 2: Academic literature for background on concepts and theories
1. Climate change, adaptation and economic growth (Bowen et al., 2012).
This article provides an evidence-based support for CRGG Framework as it explores the link between climate change impacts and economic growth. It points out that only the right kind of growth can reduce vulnerability and improve adaptive capacity. With a review of available literature, it answers a central question – how development countries have to adjust its economic growth policies to account for climate change and what the “right kind of growth” might be.
Firstly, it identifies four main aspects to achieve rapidly growing economy, namely sufficient capital, sound business environment, easy access and high productivity. Secondly, it points out the interrelation between economic growth and climate change based on evidence. Thirdly, it presents nice key drivers for an adjusted growth policy accounting for climate change, which are natural capital, infrastructure, human capital, macroeconomic stability, the institutional and regulatory framework, access to markets, access to capital, competitive markets and firm performance. Lastly, it draws four lessons between climate change and economic growth:

101
1) Climate events potentially affect growth trajectories.2) There is a positive correlation between economic growth and adaptive capacity.3) The effect of economic growth on a country’s sensitivity to climate change is ambiguous.4) Climate change may strengthen the need for collective action.
2. Does climate adaptation policy need probabilities? (Dessai and Hulme, 2004).
This article gives a critical analysis of probability-based climate prediction and is useful to decision-making for the Eco-Town Phase II. It argues that in the context of adaptation to climate change, estimating probabilities is highly subjective, conditional, and provisional. Adaptation in relation to probabilities is categorized as two types here:
1) Anticipatory, planned, and strategic type which is usually undertaken by public decision-makers. Probability assessment is potentially very helpful.
2) Autonomous, responsive, instantaneous type which is mainly undertaken by private decision-makers. This type might not benefit from probability assessment as it is based on immediate response to climate hazards.
Lastly, it reaches a conclusion that the necessity of probability-based prediction is context-dependent which concerns the goals and motivation of policy analysis, unit of analysis, timescale and training of analyst. Due to the unquantifiable nature of uncertainty and reflexive human behavior, novel methodologies which combine conditional probabilities with scenarios for climate decision-making are needed.
3. Mainstreaming adaptation in developing countries: The case of the Philippines (Lasco et al., 2009)
This article informs the progress of mainstreaming climate adaptation in the Philippines by 2009 and points out potential priorities for the Eco-Town Phase II CRGG Framework concerning economic growth, poverty reduction, climate change hazards, and vulnerability. It states that the most effective way to address climate change impacts on the poor is to integrate adaptation measures into sustainable development and poverty reduction strategies through mainstreaming.
However, through interviews with key stakeholders in the country, it was found out that there was no mainstreaming taking place at the policy level yet. Such a case was so due to a prevalent lack of awareness, as well as bias towards climate change impacts against other national priorities which were deemed more urgent. As the Philippines is highly vulnerable to adverse climate change impacts, current efforts exist but are insufficient. However, the article highlights that as massive investments in infrastructure projects have been designed to adapt to weather-related hazards, they could serve as entry points for integrating climate change adaptation into current and future development plans and policies in the country.
102
Annex B: Full Review of Literature
I. Introduction
The primary goal of the development of a climate resilient green growth (CRGG) planning framework for use in the provinces of the Philippines is to provide a standardized-but-flexible, stepwise guide that will enable planners to efficiently incorporate economic development criteria into planning for climate change adaptation, as well as to incorporate climate change adaptation considerations into economic development planning. The CRGG Framework must allow a structured consideration of the climate hazards, impacts, and vulnerabilities associated with existing economic development plans and trends, as well as the selection and development of adaptation options that are consistent with and support desired economic development pathways. The Framework must also take into account in its recommendations the resources and capacity available in the provinces to apply CRGG planning.
Adaptation planning is not a new field, and as a consequence a number of documents exist to guide and inform adaptation planning at the national and local levels, many prepared by leading multinational agencies. The consideration of economic development aspects of adaptation planning has also received considerable attention by the international community, resulting in a significant literature. In this document, we review a number of seminal documents related to climate change adaptation and adaptation/economic development planning, and describe the key lessons of the existing literature for the Philippines Provincial CRGG Planning Framework currently under development.
The remainder of this Annex is structured as follows:
• The Philippine climate change risk and development context;• Climate change in the Philippines;• The Eco-town Phase 1 Framework, and lessons for the Phase 2 CRGG Planning Framework;• A review of the academic and practitioner literature on the integration of climate change
adaptation and economic development;• Conclusions for the Philippine context based on the reviewed literature; and• A bibliography listing all sources cited in this Literature Review.
II. The Philippine context: Resources, development, and institutions
The Philippines is an archipelago country located in Southeast Asia, formed of 7,107 islands that have a total land area of approximately 300,000 square kilometers (or approximately 30 million hectares). At 36,289 kilometers, the nation has one of the longest coastlines in the world, and borders the Luzon Strait to the north, the Celebes Sea to the south, the Pacific Ocean to the east, and the West Philippine Sea to the west. The many islands of the Philippines include topography ranging from high mountains, including many active volcanoes, to lowland floodplains where much of the population lives and works.
According to the modified Corona climate classification, the Philippines has four distinct climate types by rainfall distribution, as shown in Figure B 1. This climate variability is due to the interaction of a range of factors, including geography and topography, air streams, ocean currents,

103
and tropical cyclones. In general terms, however, the national climate is divided into two – the rainy season when monthly rainfall averages can range from 200 to 300 mm, and the dry season when monthly rainfall averages can range from 100 to 160 mm. The hotter temperatures are normally recorded between April and June, and the cooler temperatures between December and February. Whilst the historical rainfall and temperature monthly trends are consistent, changes in temperature (an increase of between 0.05° and 0.2°C) and rainfall (an increase from January to July, and a decrease between August and December) are observed when comparing 1981-2010 data with 1971-2000 figures (DOST-PAGASA) 32 .
32. PAGASA Climate projection data are available at http://pagasa.dost.gov.ph/climate-agromet/climate-change-in-the philippines/116-climate-change-in-the-philippines/595-climate-projections/
33. Source – IRRI and PAGASA, available at http://www.bswm.da.gov.ph/ladaphilippines/gallery.html
Figure B-1: Agroclimatic map of the Philippines 33
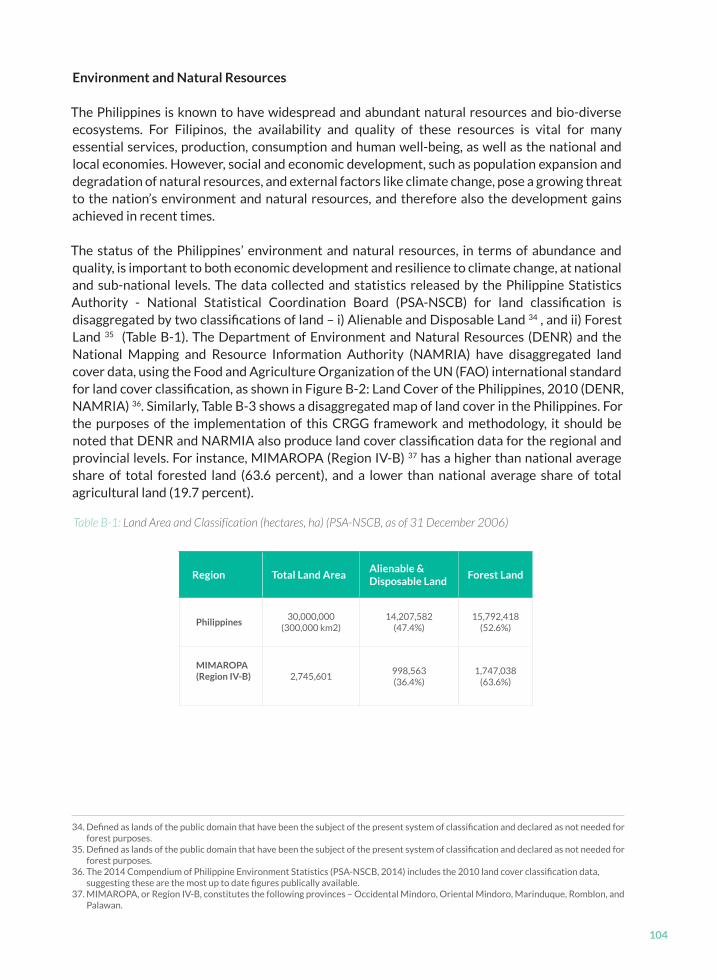
104
Environment and Natural Resources
The Philippines is known to have widespread and abundant natural resources and bio-diverse ecosystems. For Filipinos, the availability and quality of these resources is vital for many essential services, production, consumption and human well-being, as well as the national and local economies. However, social and economic development, such as population expansion and degradation of natural resources, and external factors like climate change, pose a growing threat to the nation’s environment and natural resources, and therefore also the development gains achieved in recent times.
The status of the Philippines’ environment and natural resources, in terms of abundance and quality, is important to both economic development and resilience to climate change, at national and sub-national levels. The data collected and statistics released by the Philippine Statistics Authority - National Statistical Coordination Board (PSA-NSCB) for land classification is disaggregated by two classifications of land – i) Alienable and Disposable Land 34 , and ii) Forest Land 35 (Table B-1). The Department of Environment and Natural Resources (DENR) and the National Mapping and Resource Information Authority (NAMRIA) have disaggregated land cover data, using the Food and Agriculture Organization of the UN (FAO) international standard for land cover classification, as shown in Figure B-2: Land Cover of the Philippines, 2010 (DENR, NAMRIA) 36. Similarly, Table B-3 shows a disaggregated map of land cover in the Philippines. For the purposes of the implementation of this CRGG framework and methodology, it should be noted that DENR and NARMIA also produce land cover classification data for the regional and provincial levels. For instance, MIMAROPA (Region IV-B) 37 has a higher than national average share of total forested land (63.6 percent), and a lower than national average share of total agricultural land (19.7 percent).
34. Defined as lands of the public domain that have been the subject of the present system of classification and declared as not needed for forest purposes.
35. Defined as lands of the public domain that have been the subject of the present system of classification and declared as not needed for forest purposes.
36. The 2014 Compendium of Philippine Environment Statistics (PSA-NSCB, 2014) includes the 2010 land cover classification data, suggesting these are the most up to date figures publically available.
37. MIMAROPA, or Region IV-B, constitutes the following provinces – Occidental Mindoro, Oriental Mindoro, Marinduque, Romblon, and Palawan.
Table B-1: Land Area and Classification (hectares, ha) (PSA-NSCB, as of 31 December 2006)
Region Total Land AreaAlienable & Disposable Land
Forest Land
Philippines30,000,000
(300,000 km2)14,207,582
(47.4%)15,792,418
(52.6%)
MIMAROPA(Region IV-B) 2,745,601
998,563(36.4%)
1,747,038(63.6%)
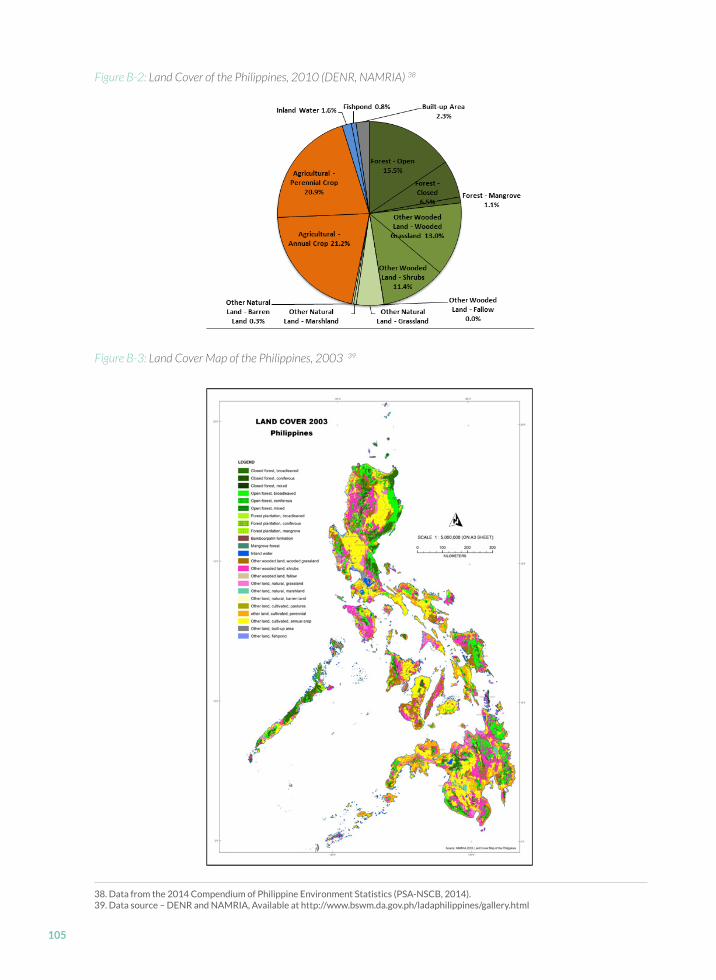
105
38. Data from the 2014 Compendium of Philippine Environment Statistics (PSA-NSCB, 2014).39. Data source – DENR and NAMRIA, Available at http://www.bswm.da.gov.ph/ladaphilippines/gallery.html
Figure B-2: Land Cover of the Philippines, 2010 (DENR, NAMRIA) 38
Figure B-3: Land Cover Map of the Philippines, 2003 39
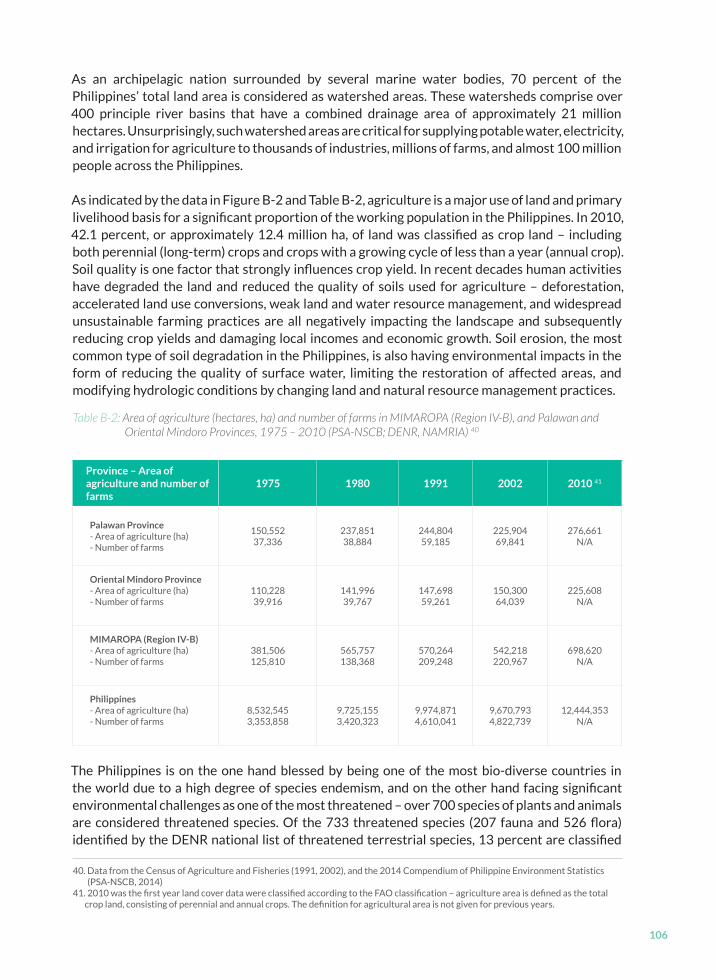
106
As an archipelagic nation surrounded by several marine water bodies, 70 percent of the Philippines’ total land area is considered as watershed areas. These watersheds comprise over 400 principle river basins that have a combined drainage area of approximately 21 million hectares. Unsurprisingly, such watershed areas are critical for supplying potable water, electricity, and irrigation for agriculture to thousands of industries, millions of farms, and almost 100 million people across the Philippines.
As indicated by the data in Figure B-2 and Table B-2, agriculture is a major use of land and primary livelihood basis for a significant proportion of the working population in the Philippines. In 2010, 42.1 percent, or approximately 12.4 million ha, of land was classified as crop land – including both perennial (long-term) crops and crops with a growing cycle of less than a year (annual crop). Soil quality is one factor that strongly influences crop yield. In recent decades human activities have degraded the land and reduced the quality of soils used for agriculture – deforestation, accelerated land use conversions, weak land and water resource management, and widespread unsustainable farming practices are all negatively impacting the landscape and subsequently reducing crop yields and damaging local incomes and economic growth. Soil erosion, the most common type of soil degradation in the Philippines, is also having environmental impacts in the form of reducing the quality of surface water, limiting the restoration of affected areas, and modifying hydrologic conditions by changing land and natural resource management practices.
The Philippines is on the one hand blessed by being one of the most bio-diverse countries in the world due to a high degree of species endemism, and on the other hand facing significant environmental challenges as one of the most threatened – over 700 species of plants and animals are considered threatened species. Of the 733 threatened species (207 fauna and 526 flora) identified by the DENR national list of threatened terrestrial species, 13 percent are classified
40. Data from the Census of Agriculture and Fisheries (1991, 2002), and the 2014 Compendium of Philippine Environment Statistics (PSA-NSCB, 2014)
41. 2010 was the first year land cover data were classified according to the FAO classification – agriculture area is defined as the total crop land, consisting of perennial and annual crops. The definition for agricultural area is not given for previous years.
Table B-2: Area of agriculture (hectares, ha) and number of farms in MIMAROPA (Region IV-B), and Palawan and Oriental Mindoro Provinces, 1975 – 2010 (PSA-NSCB; DENR, NAMRIA) 40
Province – Area of agriculture and number of farms
1975 1980 1991 2002 2010 41
Palawan Province- Area of agriculture (ha)- Number of farms
150,55237,336
237,85138,884
244,80459,185
225,90469,841
276,661N/A
Oriental Mindoro Province- Area of agriculture (ha)- Number of farms
110,22839,916
141,99639,767
147,69859,261
150,30064,039
225,608N/A
MIMAROPA (Region IV-B)- Area of agriculture (ha)- Number of farms
381,506125,810
565,757138,368
570,264209,248
542,218220,967
698,620N/A
Philippines- Area of agriculture (ha)- Number of farms
8,532,5453,353,858
9,725,1553,420,323
9,974,8714,610,041
9,670,7934,822,739
12,444,353N/A

107
as critically endangered species that are not found in any other country in the world. The factors previously described that are degrading the landscape are therefore subsequently threatening the existence of rare flora and fauna through deforestation and overexploitation of environments that act as vital ecosystems. Furthermore, the increasing impacts of climate change are expected to exacerbate environmental challenges and subsequent loss of biodiversity.
Demographics and Socioeconomic Development Trends
The Philippines is home to 92.3 million people – according to the latest PSA-NSCB census data from 2010. The total population is estimated to have reached 100 million people in 2014 (United Nations Development Programme, UNDP, 2014). The national population growth rate of 1.9 percent, for the period 2000-2010, is slightly down on growth rate seen between 1990 and 2000, when the national population grew by 16 million, or 2.3 percent. The total population and growth rate figures for the provinces in which this project will be initially implemented, Palawan and Oriental Mindoro, are shown in Table B-3. For the purposes of the CRGG framework and project, it will be important to recognize and consider the very latest official statistics on population and demographic trends at the provincial level, which will be provided by the 2015 Census of Population. The PSA-NSCB will conduct the 2015 census in the third quarter of 2015, with results expected to be released in the fourth quarter of 2016. The PSA-NSCB has also released projected population figures based on analysis of census data, which predict the national population to grow to 142 million by 2045. Despite this representing an increase of almost 50 million people in 35 years, this projection is based on a declining annual growth rate of 1.73 percent during 2010-2015 to 0.65 percent during 2040-2045. From this population growth analysis, it can also be gleamed that the predicted national population for the 2015 census will be over 108 million. Historically, sustained economic development has been elusive for the Philippines, as other
East and South-East Asian national economies have grown with better average growth rates for the period 1951-2010 (Asian Development Bank (ADB), 2007; Yap and Majuca, 2013). Economic reform in the shape of the “openness model” of development towards closer global economic integration through liberalization, privatization and deregulation has been a long-
42. Data from the 2010 Census and Housing Population Report (PSA-NSCB).43. Highly Urbanized Cities, such as Puerto Princesa City, are local government units (LGUs) autonomous from provinces, with at least
200,000 inhabitants and a minimum annual income of 50 million Philippine Pesos (PhP).
Table B-3: Total population and population growth rate figures for the project implementation provinces, and the Philippines (PSA-NSCB) 42
Province[Highly Urbanized City 43 ]
Total Population Population Growth Rate
May 1990 May 2000 May 2010 1990 - 2000 2000 - 2010 1990 - 2010
Palawan excluding Puerto Princesa City
436,140 593,500 771,667 3.13 2.66 2.89
Puerto Princesa City 92,147 161,912 222,673 5.79 3.24 4.51
Oriental Mindoro 550,049 681,818 785,602 2.17 1.43 1.80
Philippines 60,703,810 76,506,928 92,337,852 2.34 1.90 2.12

108
standing mantra of governments since the 1970s and 80s (Yap and Majuca, 2013). However, the investment rate in the Philippines is consistently one of the lowest in the region, due to reasons such as political instability and poor physical infrastructure discouraging both foreign direct investment (FDI) and domestic investment (UNESCAP, 2011; UNCTAD, 2012). This sustained low investment rate has caused a widening of the development gap over recent decades between the Philippines and neighboring nations, as indicated by per capita gross domestic product (GDP) figures and manufacturing value added (MVA) to GDP ratio (UNIDO, 2011).
Low investment and weak economic transformation has had consequences for employment; as recently as 1996 the Philippines has the second highest unemployment rate amongst the ADB’s development countries, but faster economic growth since the turn of the century has rapidly improved that situation (Asian Development Bank, 2012; Yap and Majuca, 2013). Lack of economic transformation has also created a notable imbalance between production and employment; in 2011 the agriculture sector accounted for 31 percent of employment but just under 12 percent of output (see Table B 4). Further, Table B 5 highlights that service and industry sectors, and particularly manufacturing, are the main sectors driving recent national economic growth. The inability to allocate resources to more productive sectors is severely limiting to development, and is the result of the lack of an effective industrial policy (Yap and Majuca, 2013). Therefore, the national government is targeting growth in the industrial sector, particularly through manufacturing jobs, to boost national growth and development that is inclusive of all. Suggested strategies for increasing industry capacity and generating employment include greater support for new investors and improved access to financing, shifting the structure of the economy from being largely consumption driven to increasingly led by investments, and building economic resilience to climate-related shocks and stresses.
44. Data from the Index of Labor Force Statistics, and Labor Force Survey (PSA-NSCB).45. Data from the PSA-NSCB National Accounts.
Table B-4: National distribution of production and employment by sector in 2011 (PSA-NSCB) 44
SectorShare of National
GDP (%)Share of National Employment (%)
Agriculture 11.67 31.3
Industry * Manufacturing
32.5721.32
16.18.41
Services 55.75 52.6
Table B-5: National GDP growth rates by sector (PSA-NSCB) 45
SectorAnnual (%) 1st Quater (%)
2011 2012 2012 2013
GDP 3.6 6.7 6.5 7.8
Agriculture 2.6 2.8 1.1 3.3
Industry * Manufacturing
1.84.7
6.85.4
5.36.0
10.99.7
Services 4.9 7.6 52.6 7.0

109
Geographically, three regions contribute a dominant share of the national GDP: the National Capital Region (NCR), 35.7 percent in 2011; Region IV-A (CALABARZON)46 , 17.4 percent in 2011; and Region III (Central Luzon), 9.3 percent in 2011. Region IV-B (MIMAROPA), which includes Palawan and Oriental Mindoro, contributed 1.8 percent of national GDP in 2011 and 2010.
Nationally, high unemployment and the productivity imbalance have perpetuated high rates of poverty for some time in the Philippines, particularly compared with neighboring countries. Despite recent strong GDP growth, the number of poor people has continued to increase since the start of the century (Asian Development Bank, 2012). According to the latest figures released by PSA-NSCB, the estimated incidence of poverty in the Philippines suggests a long-term downward trend but a plateauing in recent years, as shown in Table B-6. Furthermore, the UNDP Multidimensional Poverty Index (MPI), which identifies multiple deprivations related to education, health and standard of living, points to relatively high poverty rates in the Philippines compared with other Asian nations, as shown in Table B-7.
46. CALABARZON, or Region IV-A, constitutes the following provinces – Cavite, Laguna, Batangas, Rizal, Quezon.47. Data from the PSA-NSCB Philippine Poverty Statistics Report. 48. Not all indicators are available for all countries, and thus caution should be used in cross-country comparisons.49. MPI obtained using a methodology introduced in 2010 (Alkire and Santos, 2010). For details visit http://www.ophi.org.uk/50. PPP $1.25 per day (as opposed to national poverty line), in the year the survey was conducted.
Table B-6: Estimated national poverty incidences, 1991 to 2014 (PSA-NSCB) 47
Poverty Incidence (%) 1991 2003 2006 2009 2012 2013 2014
Families 29.7 20.0 21.0 20.5 19.7 18.8 20.0
Population 34.4 24.9 26.6 26.3 25.2 24.6 25.8
Table B-7: MPI statistics for the Philippines, Thailand, Indonesia, and Vietnam from the 2014 Human Development Report 48 (UNDP, 2014)
Sector Country (survey year)
Multidimensional Poverty Index (MPI) 49
Intensity of deprivation
(%)
Population (%)
ValueHeadcount
(%)
Vulnerable (near) to poverty
In severe poverty
Below income poverty line50
Philippines (2008) 0.038 7.3 51.9 12.2 5.0 18.4
Thailand (2006) 0.004 1.0 38.8 4.4 0.1 0.4
Indonesia (2012) 0.024 5.9 41.3 8.1 1.1 16.2
Vietnam (2011) 0.026 7.6 40.7 8.7 1.3 16.9

110
Political Structure
The Philippines is divided up into 18 administrative regions. These regions do not have a separate local government (apart from the Autonomous Region in Muslim Mindanao (ARMM), as indicated in Figure B-4) but rather serve primarily to organize the 81 provinces. Below the provincial level sits the component cities (total 144) and municipalities (total 1490), and below them exist the final local government units (LGUs), the barangays (total 42,028). As also indicated in Figure B-4, 38 cities are politically independent from the province in which they are geographically located; for example Puerto Princesa City, located on the island of Palawan, is a politically independent area classified as a highly urbanized city not controlled by the Palawan provincial government (see also Table B-3). Figure B-5 shows a map of the regions and provinces in the Philippines.
The Philippines was the first nation in Southeast Asia to introduce decentralization reforms, through the approval of the Local Government Code (LGC, also known as the Local Autonomy Act) in 1991. After a long period of centralized government and power resulting in inequitable development among the remote and far-flung regions, the proclamation of the Philippine Constitution in 1987 and subsequent policies guaranteeing greater local autonomy began the decentralization process. The LGC has been seen as an important and ‘natural’ move for a nation that is so geographically divided and vastly culturally diverse – there are over 100 ethnic groups and almost 200 different languages to be found across the archipelago (Sietz, 2013).
One area that has benefited greatly from the decentralization reforms is forest management, particularly at the community level where forestry resources are intrinsically linked to the livelihoods of many minority groups (Colfer et al., 2005; Larson, 2005). Specifically, the devolution of power has enabled the development and implementation of community forestry programs focusing on land entitlements, access to resources and recognition of minority groups (Seitz, 2013). As the majority of indigenous communities exist close to or below the economic poverty line, and poverty reduction is a stated aim of decentralization, promoting indigenous peoples’ (IP) rights and access to resources for livelihoods is a vital aspect. However, this goal is at odds with efforts to protect the forest, reduce environmental degradation, and sustainably manage natural resources.
51. More information on the local government structure of the Philippines can be found at the official website of the Department of Interior and Local Government (DILG): http://www.dilg.gov.ph/.
Figure B-4: Local government structure of the Philippines 51
President of the Philippines
Barangays Barangays Barangays Barangays BarangaysBarangays
Component cities MunicipalitiesComponent
citiesMunicipalities
AutonomousRegions
Cities independent from a province
ProvincesCities independent
from a provinceProvinces
General supervision
Direct relation

111
III. Climate change in the Philippines
The 2014 Verisk Maplecroft Climate Change Vulnerability Index (CCVI) rates the Philippines as facing “extreme risk” to climate change impacts over the next 30 years. The CCVI has also ranked the Philippines as being the 8th most at risk nation in the world by evaluating exposure to climate-related disasters and sea-level rise (SLR), human sensitivity in terms of population patterns, conflicts, development, natural resources, dependence on agriculture, and adaptive capacity of infrastructure and governance to combat climate change (Philippines ranked 6th in 2011). This finding is supported by other indices, such as the 2013 Global Climate Risk Index (ranked 4th) (Harmeling and Eckstein, 2012) and 2014 World Risk Report (ranked 2nd) (ADW and UNU-EHS, 2014). Geographically, at least, the archipelago islands of the Philippines will continue to be highly exposed to risks of climate change including extreme climate-related hazards such as typhoons, floods, droughts and landslides. Furthermore, the country is highly dependent on natural ecosystems and climatic conditions for economic productivity and national food security,
52. Available at http://www.zamboanga.com/z/index.php?title=File:Regions_provinces_philippines.png [Accessed 10 August 2015].
Figure B-5: Map of the Philippines Regions and Provinces (from Zamboanga.com )52

112
increasing its vulnerability to climate change – including to both temperature and precipitation variability and extremes (CCC and GGGI, 2014).
Changes in the climate have been shown to be increasing the frequency and magnitude of certain hazards in recent years; a trend that is forecasted to continue throughout the 21st century unless greenhouse gas emissions are severely reduced from current levels. Nationally, the Philippines has been experiencing average temperature increases and rainfall changes in recent decades, and climate model projections point to this trend continuing and likely increasing throughout the 21st century (yielding, for example, at least a 2°C temperature increase by 2100).
Climate change and disaster impacts come in various forms – generally categorized into economic (for example, crop failure or asset losses) and non-economic (for example, loss of life or psychological impact). These negative impacts generally hit the poorest hardest – in the Philippines, despite impressive national economic growth rates, the rate of poverty is almost 30 percent (CCC and GGGI, 2014), and, according to one survey, eight out of ten Filipinos feel that they are experiencing the impacts of climate change already (World Bank, 2012).
Climate scenarios and projections suggest that the negative impacts of climate change will seriously threaten the recent economic and social development gains achieved in the Philippines for decades to come (CCC and GGGI, 2014), and will also have implications for meeting the Millennium Development Goals (MDGs), which expire in 2015 and will be replaced by the Sustainable Development Goals (SDGs).
In response to the threat of climate change, the Philippines central government has positioned itself as a frontrunner in Asia for setting policy and strategy on climate change and development. Recent policy examples include the 2004 enhancement of the Philippine Agenda 21: A National Agenda for Sustainable Development for the 21st Century, which made legislative and structural changes for the consideration of climate change, and lead to the passing of the 2009 Climate Change Act (Republic Act 9729) and the establishment of the Climate Change Commission (CCC). In terms of strategy, the Philippine National Framework Strategy on Climate Change 2010-2022 (NFSCC) places emphasis on adaptation, with mitigation a function of adaptation – due to the current and short-term impacts from changes in climate variability and extreme events that can now not be avoided even if immediate curbing of emissions occurred. Explicit provisions on poverty alleviation and gender equality and climate adaptation are provided in the NFSCC. The more long-term National Climate Change Action Plan 2011-2028 (NCCAP) has seven strategic priorities – food security water sufficiency, ecosystem and environmental stability, human security, climate-smart industries and services, sustainable energy, and knowledge and capacity development – for the reduction of climate risk in the Philippines. Overall, a range of on-going programs related to economic diversification, drought resilient crops, poverty reduction, and more climate resilient infrastructure have improved the Philippines rating in Maplecroft’s Adaptive Capacity Index in recent years.
National planning for climate change in developing around the world, and middle-income countries tends to prioritize natural resource management and ecosystem-based adaptation (Stucki and Smith, 2010), and the Philippines is no different. The reasons for this general trend are discussed in detail throughout this report, but it remains of central importance to the Philippines that the national level frameworks continue to facilitate and support local priorities and initiatives, due to the strong linkages between natural resources, sustainable livelihoods, and economic development.

113
Development in the Philippines
Historically, sustained economic development has been elusive for the Philippines, as other East and South-East Asian national economies have grown with better average growth rates for the period 1951-2010 (Asian Development Bank, 2007; Yap and Majuca, 2013). Economic reform in the shape of the “openness model” of development towards closer global economic integration through liberalization, privatization and deregulation has been a long-standing mantra of governments since the 1970s and 80s (Yap and Majuca, 2013). However, the investment rate in the Philippines is consistently one of the lowest in the region, due to reasons such as political instability and poor physical infrastructure discouraging both foreign direct investment (FDI) and domestic investment (UNESCAP, 2011; UNCTAD, 2012). This sustained low investment rate has caused a widening of the development gap over recent decades between the Philippines and neighboring nations, as indicated by per capita GDP figures and manufacturing value added (MVA) to GDP ratio (UNIDO, 2011).
Low investment and weak economic transformation has had consequences for employment; as recently as 1996 the Philippines has the second highest unemployment rate amongst the ADB’s development countries, but faster economic growth since the turn of the century has rapidly improved that situation (Asian Development Bank, 2012; Yap and Majuca, 2013). Lack of economic transformation has also created a huge imbalance between production and employment; in 2011 the agriculture sector accounted for 33 percent of employment but just 11 percent of output (see Table B 8, with data from the Index of Labor Force Statistics, and Labor Force Survey (PSA-NSCB). This inability to allocate resources to more productive sectors is severely limiting to development, and is the result of the lack of an effective industrial policy (Yap and Majuca, 2013).
Overall, high unemployment coupled with the productivity imbalance have perpetuated high rates of poverty for some time in the Philippines, particularly compared with neighboring countries. Despite recent strong GDP growth, the number of poor people has continued to increase since the start of the century (Asian Development Bank, 2012). The correlation between poverty and vulnerability has meant the Philippines is now one of the countries most at risk from climate change, and strongly suggests reducing climate vulnerability will remain a development challenge that demands a sharp reduction in rates of poverty. As recently as 2009, however, a review of the Philippines’ national development plans and policies found no mention of climate change or adaptation (Lasco et al., 2009). Now, in 2015, the national picture is somewhat improved. The National Economic and Development Authority’s (NEDA) Philippine Development Plan (PDP) 2011-2016, is a framework of goals, objectives, strategies, programs
Table B-8: National distribution of production and employment by sector in 2011 (PSA-NSCB)
SectorShare of National
GDP (%)Share of National Employment (%)
Agriculture 11.67 31.3
Industry * Manufacturing
32.5721.32
16.18.41
Services 55.75 52.6

114
and projects for inclusive growth that is sustainable, generates employment and reduces poverty. Through this plan, the Philippines central government is pursuing a top-down course for rapid economic growth and development whilst also addressing quality of life, inequality and human development, and ecological integrity.
The PDP has several references to the potential impact of climate change on development, and sets some sector outcome goals accordingly. For example, one goal for the agriculture and fisheries sectors is to increase resilience to climate change impacts, and success in reaching this goal will be indicated by whether a reduction in average annual agri-production loss due to weather and climate-related disasters from PhP 13.8 billion between 2004 and 2010 can be achieved. It points to the risk climate change poses to the achievement of growth in agriculture and fisheries sectors, national rice self-sufficiency, and productivity targets. National government agencies, particularly those concerning rural issues such as the Department of Agriculture, are called on to re-double adaptation efforts to reduce predicted climate change impacts.
The PDP shows that the Philippines is acutely aware of its reliance on the natural environment and its resources for economic development. Therefore, the achievement of resilient natural systems enhanced with improved adaptive capacities of human communities is a national priority. The Plan is targeting a reduction in annual damage and loss resulting from disasters primarily through the improvement of adaptation and disaster risk reduction (DRR) measures in all national, sectoral, regional and local development plans across the Philippines’ urban and rural settings. By 2016, the Plan hopes to have achieved climate change resilient, eco-efficient, and environmentally-friendly industries and services, and sustainable towns and cities.
IV. Ecotown framework: Phase 1 and lessons for the Phase 2 methodology
The Ecotown framework was formed by a partnership between the Philippine CCC and the Global Green Growth Institute to jointly promote green growth in the Philippines and implement the NCCAP at the local level (CCC and GGGI, 2014). Through mitigation and adaptation interventions, the framework is designed to build the resilience of local communities to the impacts of climate change, whilst also promoting economic growth an ecological sustainability. According to the Demonstration of the Ecotown Framework Project in San Vicente, Palawan, Philippines (CCC and GGGI, 2014), an ecotown is defined as a sustainable community in harmony with the environment, but is set in a rural context. It stands for “ecologically stable” and “economically resilient” communities. Further, an Ecotown is a planning unit composed of municipalities or a group of municipalities located within and around boundaries of critical key biodiversity areas, which are at high risk to climate change.
This section of the report aims to build on findings of an analysis of Ecotown Phase 1 and offer lessons and recommendations for the development of a Phase II methodology framework called Climate Resilient Green Growth (CRGG), based on approaches and opportunities identified in the literature reviewed throughout later sections of this report. As a starting point, the Demonstration of Ecotown Framework Project in San Vicente, Palawan, Philippines (CCC and GGGI, 2014) report itself identifies lessons learned, challenges and ways forward for building on the Phase 1 framework within the Phase 2 methodology. Central to the vision of the enhanced framework is moving beyond a natural resource, sustainable ecosystems approach to adaptation and instead placing considerable emphasis on sub-national economic performance by analyzing the main sectors that comprise the regional GDP for adaptation intervention pathways at the

115
provincial level. That is not to say, however, that Phase 1 significantly departed from this vision, as it claims to “support key aspects of green growth by reducing vulnerability… and prioritizing adaptation measures that are framed within the local economic development model” (CCC and GGGI, 2014; p.28). Ecotown advocates for adaptation as a vehicle for economic growth and development.
In terms of project implementation, one of the major challenges faced is how to meaningfully harmonize top-down and bottom-up approaches. Pursuing both approaches ensures the interests and perspectives of key stakeholders are considered in risk assessment and adaptation planning processes, but finding common ground or compromise between the two was found to be difficult. For example, of the sectors analyzed, only the health sector qualified as a common denominator but both coastal and marine, and agriculture, did not fit into the top-down approach categories (CCC and GGGI, 2014). For assessment processes, the Phase 1 methodology utilized both a prediction-oriented top-down approach and a resilience-oriented bottom-up approach, to predominantly minimize the biggest obstacle to adaptation planning: uncertainty. This way, the wide impacts and response capacity of the community are provided on the basis of an international assessment model, but still includes local-specific outcomes grounded by prior experiences. However, uncertainty cannot be eliminated when climate change scenarios and projections form part of the analysis, and so the degree of uncertainty has to be thoroughly accounted for by providing a comprehensive range of estimates and confidence levels for projected impacts (UNDP-UNEP, 2011). Moreover, the uncertainty must be communicated properly, while still emphasizing the necessity to adapt to both current and projected future variability and extremes so as not to undermine the central message that adaptation planning and action requires urgency from both governmental and non-governmental actors (World Bank, 2010a). Another related challenge faced during the Ecotown Phase 1 implementation was that in practice, it proved to be difficult to plan and conduct vulnerability assessments objectively, and results were sometimes analyzed relative to other vulnerability assessments, making it impossible to measure vulnerability in absolute terms (CCC and GGGI, 2014).
The criteria used for determining adaptation measures in Ecotown Phase 1 were effectiveness, costs, technical feasibility, social and cultural feasibility, and time. While workable, these criteria did not include linking adaptation with socially-inclusive economic development. The intention of the CRGG is to address this gap more explicitly. In turn, the CRGG will benefit from consideration of a daunting array of frameworks, methods and tools that exist for assessing climate change vulnerability, impacts and adaptation options (see, for example, UNFCCC, 2008; Olhoff and Schaer, 2010; UNDP-UNEP, 2011), some of which have promising application for integrating adaptation planning into development at sub-national levels, and are shown in Table B-9.
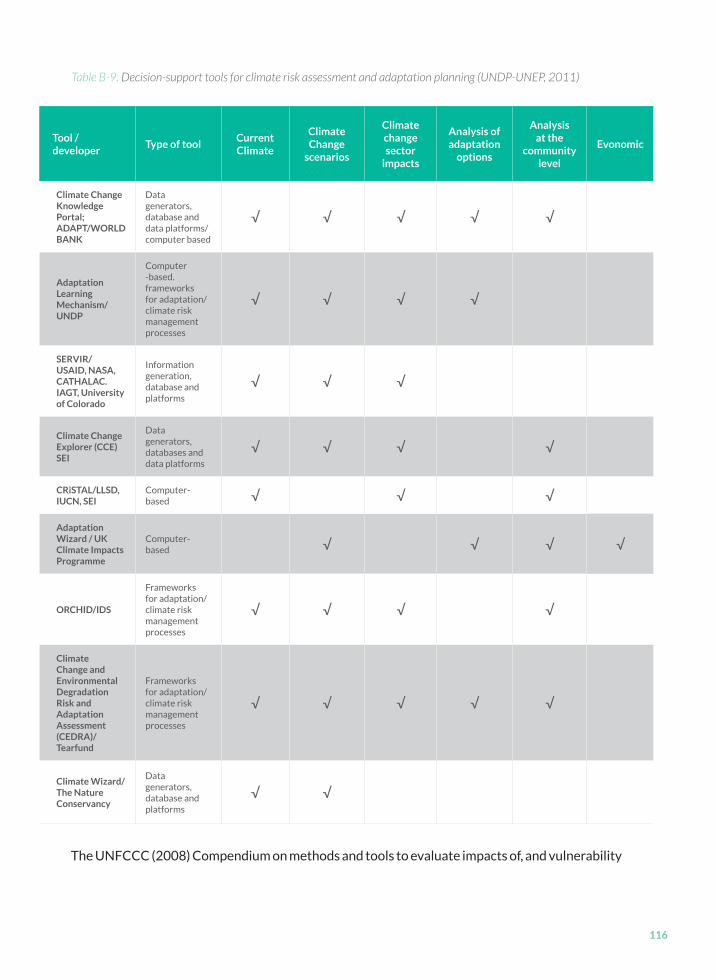
116
The UNFCCC (2008) Compendium on methods and tools to evaluate impacts of, and vulnerability
Table B-9: Decision-support tools for climate risk assessment and adaptation planning (UNDP-UNEP, 2011)
Tool / developer
Type of toolCurrent Climate
Climate Change
scenarios
Climate change sector
impacts
Analysis of adaptation
options
Analysis at the
community level
Evonomic
Climate Change Knowledge Portal;ADAPT/WORLD BANK
Data generators, database and data platforms/computer based
√ √ √ √ √
Adaptation Learning Mechanism/UNDP
Computer -based. frameworks for adaptation/climate risk management processes
√ √ √ √
SERVIR/ USAID, NASA, CATHALAC. IAGT, University of Colorado
Information generation, database and platforms
√ √ √
Climate ChangeExplorer (CCE)SEI
Data generators, databases and data platforms
√ √ √ √
CRiSTAL/LLSD, IUCN, SEI
Computer-based √ √ √
Adaptation Wizard / UK Climate Impacts Programme
Computer-based √ √ √ √
ORCHID/IDS
Frameworks for adaptation/climate risk management processes
√ √ √ √
Climate Change and Environmental Degradation Risk and Adaptation Assessment (CEDRA)/ Tearfund
Frameworks for adaptation/climate risk management processes
√ √ √ √ √
Climate Wizard/The Nature Conservancy
Data generators, database and platforms
√ √

117
and adaptation to, climate change organizes frameworks, methods, and tools into three broad categories: first, complete frameworks offering a broad strategic approach to the entire process of assessment; second, partial tools and frameworks that focus on cross-cutting themes or whose application spans several but not all steps of assessment processes; and third, discrete tools and methods specific to a particular sector such as agriculture (UNFCCC, 2008). Critically, the usefulness and suitability of any frameworks or tools are dependent on the users’ circumstances and contexts under study; information needs, available resources and requirements of the project should all be clarified before considering the tools most appropriate for analyzing potential adaptation options (UNFCCC, 2008). One example of a tool that may have potential for application to the Eco-town framework is the NOAA Community Vulnerability Assessment Tool (CVAT), which supports the linking of environmental, social and economic data in coastal zones, in GIS format, to produce relative risk and vulnerability analyses of coastal communities to a range of hazard threats (Flax et al., 2002). Taking a spatial approach to the presentation of assessment outputs, for example by mapping the areas and populations at risk, can prove to be a powerful way of communicating the need for adaptation interventions (World Bank, 2010a). However, CVAT is a sector-specific tool that may not capture the full socioeconomic picture of inputs to local economic development from all sectors.
V. Integrating Climate Change Adaptation and Economic Development
Rationale for linking adaptation with economic development
“Climate events have the potential to affect growth trajectories” (Bowen et al., 2012, p.103).
Even the most stringent mitigation efforts, including an immediate dramatic halt to greenhouse gas (GHG) emissions, would not prevent the global climate from continuing to change and negatively affect society for decades to come (OECD, 2008; Solomon et al., 2009). Therefore, particularly in order to address the near-term impacts of climate change, adaptation is and will continue to be a necessity. Due to a range of inter-related risk factors, including high exposure, high sensitivity, and low adaptive capacity, developing countries in particular are required to adopt adaptation measures in order to reduce existing and potential climate vulnerability (Tol et al., 2004; Mendelsohn et al., 2006; World Bank, 2010b).
A country’s relative economic development and adaptive capacity or ability to cope with climate stresses and shocks (e.g.,changes in seasonal rainfall patterns, flood events) are strongly correlated. Indeed, adaptive capacity is determined by multiple variables, including governance, resource availability and socioeconomic contexts (Lebel et al., 2012). Economic development fundamentally aims at the economic and social well-being of people, involving the development of human capital, social inclusion, health, safety, appropriate infrastructure and the sustainable use of natural resources, competitiveness and stable flows of financial capital. Nobel Laureate and economist Amartya Sen points out that economic growth, on the other hand, is largely a phenomenon of market productivity, the accumulation of wealth, and the rise in GDP, which is only one aspect of economic development (Sen, 1983). Economic development therefore involves the inclusion of effective institutions, such as responsive governance, quality education and adequate health infrastructure, and a well-developed financial sector (Tol and Yohe, 2007; Barr et al., 2010; Bowen et al., 2012). Strengthening economic development can therefore be a central strategy for reducing climate risk and vulnerability through improving adaptive and coping capacities (McGray et al., 2007; Klein and Persson, 2008).

118
Patterns of economic growth, however, affect sensitivity to climate change either positively (for example, through diversification from climate-sensitive agricultural practices into manufacturing), or negatively (such as when urban development is concentrated in high-risk coastal or flood-plain areas, or rural development through agriculture expansion increases water resource reliance) (Bowen et al., 2012). Overall, this means that the net impact of economic growth on vulnerability is unclear, but empirical evidence showing climate variations and extremes may have a greater economic impact in low-income countries with weak development indicators (such as GDP per capita, poverty rates, literacy rates, depth of financial markets) points to the domination of positive effects of economic development on vulnerability (O’Brien et al., 2008; Dell et al., 2008; Noy, 2009; Raddatz, 2009; Bowen et al., 2012). One examination of the economic impact of droughts found reduced vulnerability of national economies that had become more diversified (Benson and Clay, 1998). However, only the “right kind” of economic development can achieve such reductions in vulnerability, for example by addressing root causes such as poverty and implementing measures to build resilience across scales.
The relationship between climate change and economic development is a two way street: it should be anticipated that climate change will alter national, regional, and global economic growth trajectories through the impacts on natural systems and resources, labor productivity across industries and sectors, and infrastructure (UNDP-UNEP, 2011). Recent disasters demonstrate the effect of extreme climatic events on economies, for example the 2011 Bangkok and central Thailand floods which destroyed assets and slowed productivity and the global value chain in a number of manufacturing industries. Other case studies include the impact of Hurricane Mitch on Honduras’ national GDP growth rate in 1998 (Mechler, 2004). Similar impacts may also be seen as a result of slow-onset stresses such as average annual temperature and precipitation changes, for example on the productivity of small holder farmers.
Climate change adaptation, or the adjustment in natural or human systems in response to actual (observed) or expected (anticipated) climatic stimuli or their effects, should, by definition, moderate potential harm and harness any beneficial opportunities (OECD, 2008; UNISDR, 2009; IPCC, 2012). One such example of the beneficial opportunities that implementation of adaptation measures may offer is in the form of economic development. Given that inclusive, pro-poor growth is the central objective of development, and the near-term impact of climate change is a growing development concern, decision-makers have to increasingly consider the extent to which existing policies for growth are enabling or constraining the adaptation requirements of developing nations to be met (UNDP-UNEP, 2011; Bowen et al., 2012).
Planning for observed and anticipated climate change impacts, including the selection of appropriate adaptation measures, must rest on a sound economic basis (OECD, 2008). Using an economic development lens, adaptation measures may be evaluated in terms of whether, and to what extent, the benefits of such interventions exceed the incurred costs to human and social well-being. This form of adaptation cost-benefit analysis is important at all scales - ranging from local community-based adaptation (CBA) projects to national and international climate policies where trade-offs between cost and residual climate change impacts will be considered. But, in general, adaptation public sector decision-making is decentralized to the local government planning scale, where authorities make use of support tools such as cost-benefit analysis, but also cost-effectiveness analysis and multi-criteria analysis (MCA). Because of this decentralized nature, there is a question of whether, and if so how, economic agents require incentives to adapt (OECD, 2008). There are, however, major challenges associated with economic assessments of adaptation, particularly in comparison with climate change mitigation, where there is a

119
straightforward metric in greenhouse gas (GHG) emission reduction to assess the effectiveness of mitigation measures. At present, there are no clear metrics for measuring the effectiveness of adaptation interventions, be they policy or project measures (OECD, 2008). In many instances, cost-effectiveness may mean taking adaptation needs into account earlier rather than later (Agrawala and van Aalst, 2008), but being unable to assess the long-term economic benefit of this approach is a major barrier to achieving real linkages between adaptation and development. Most climate variables cannot be confidently projected for the timescale development planning requires, particularly at sub-national levels, and so improving the understanding of and capacity to factor in uncertainty is vital (Lebel et al., 2012).
”Business-as-usual” development that fails to factor in climate change risks can lead to maladaptation; a term that refers to the inadvertent increase in climate change exposure and vulnerability through development that overlooks climate change impacts (OECD, 2009). One example of maladaptation would be if new infrastructure project plans were not designed to withstand current and projected weather extremes, despite being located in an exposed area. As a result, the infrastructure, say for an potable water supply line, would not provide adequate protection from disasters and may have a more reduced useful lifetime than planned, thus restricting growth by causing a larger economic loss than would have occurred if it were built to withstand extreme event impacts (OECD, 2009).
Overall, there is a wide and fairly long-standing consensus in the academic and practitioner literature that adaptation could, and should, be more closely aligned with core development objectives that exist at all levels (e.g. Agrawala, 2004; Klein et al., 2005; Schipper, 2007; Schipper et al., 2008; Olhoff and Schaer, 2010; UNDP-UNEP, 2011).
Adaptation, development, and poverty alleviation
Poverty reduction, rural development, and climate change vulnerability are strongly inter-linked in developing countries. For instance, agriculture is central to rural livelihoods and economic development, but yet it is extremely climate-sensitive and the rural poor are highly vulnerable to the impacts of climate change (Kok and de Coninck, 2007; Lebel et al., 2012). In Asia, the number of people living below the poverty line is increasing, in absolute and relative terms (UNESCAP, 2014). Socioeconomic poverty is often a central determinant of climate change vulnerability and adaptive capacity levels. The conceptual and real-life linkages between poverty, development and climate change adaptation are also strong because efforts to reduce poverty often involve improvements to local infrastructure and services, and because increasing household incomes build the overall resilience and adaptive capacity of a local community population. Poverty, however, is a multi-dimensional concept that needs to be unpacked to appreciate the range of causes and relative degrees of poverty and how each impact upon local economic development. For example, the “productive” or “active” poor may still be able to take advantage of development opportunities, while the chronically poor will have few or no assets and opportunities and may remain economically inactive for long periods (Chronic Poverty Research Centre, 2005; OECD, 2006). The specific climate impacts and appropriate adaptation options available to these different households and communities will reflect the range of livelihood strategies, capitals, assets and access to markets and services that define their respective socioeconomic circumstances and shape the local development trajectory (OECD, 2009).

120
The global trends of (i) higher rates of poverty among women compared with men, and (ii) the greater severity of poverty experienced by women than by men, should be considered and tackled by development planning at all levels of governance, not least because restricted access to resources and opportunities undermines women and girls’ capacity to adapt to climate change (OECD, 2009).
VI. The impacts of climate change on economic development, and adaptation responses for growth
“Economic growth almost always increases the adaptive capacity of people” (Bowen et al., 2012, p.99).
General impacts of climate change in Asia
As the world’s largest region by area and population, Asia has experienced recent rapid economic growth and reductions in the fraction of the population that is impoverished. This progress, however, has been achieved unevenly across and within nations and communities in Asia. For many developing countries, poverty remains a significant social challenge, particularly in rapidly expanding urban and peri-urban areas that are propagated by rural decline and resulting internal migration. Poverty is also a key root cause and driver of vulnerability to climate change, often coupled with relatively low levels of human development indicators such as health and education, restricted social, economic, technical, institutional and financial capacities, and a reliance on climate-sensitive sectors such as agriculture and fisheries.
Across scales, the region lacks the necessary governance capacities to tackle the challenges of deforestation, environmental degradation and pollution, natural resource depletion, human migration and increased population density in low-elevation zones, urbanization, climate extremes, and other major disasters (Estes, 2006). Throughout the 21st century, climate change is expected to magnify many of these development issues as well as create new problems and stresses that governments will have to respond to. Temperature increases, rainfall pattern and intensity changes, increases in tropical cyclone frequency and intensity, more severe and prolonged droughts, and SLR are some of the major projected alterations that parts, or all, of Asia will experience, if they have not already. Each one of these changes has the potential to profoundly impact achieved and forecasted economic development across nations and sectors within the region.
Drivers of economic development – climate change impacts and adaptation responses
As noted above, economic development fundamentally aims to improve the economic and social well-being of people, and involves the development of human capital, social inclusion, health, safety, appropriate infrastructure and the sustainable use of natural resources, competitiveness and stable flows of financial capital, amongst other factors. This section discusses the key inputs to economic development, how climate change can impact upon them, and what adaptation responses can reduce future impacts whilst also promoting economic development. A summary of this section presented in tabular format is available in Annex 1.

121
• Human capital, labor, health, skills and education
Specifically, education and health are two facets of human capital that are key to reducing climate vulnerability, as well as being central to sustainable livelihoods and development. Firstly, climate shocks can affect the accumulation of human capital; as risk of disasters rises, human capital accumulation (as measured by secondary school rates of enrolment, for example) falls (Crespo Cuaresma, 2009). As an example, the children born during rural floods in India throughout the 1970s were found to be 19 percent less likely to have attended primary school (UNDP, 2007).
Climate change implications for human health are associated with both slow-onset stressors such as temperature and precipitation changes and extreme climate-related hazard events such as tropical storms and flash floods, and are therefore complex and wide-ranging. In addition, there are anticipated indirect consequences through effects on water- and food-borne diseases, and also changes to spatial and temporal ranges of vector-borne diseases (OECD, 2009). Increasingly negative health outcomes will also limit human capital accumulation, which has knock-on effects on a population’s rate of development and adaptive capacity (Bowen et al., 2012).
Improving the length and quality of childhood education and access to information enables people to better understand risks and therefore cope with and adapt to them (Toya and Skidmore, 2007); this is particularly the case for girls and women (Wheeler and et al., 2010). For example, in the agricultural sector, farmers with access to weather and climate information have been able to make informed decisions regarding the selection of more climate-resistant crop (Falco et al., 2011), and the use of insurance mechanisms to reduce risk and long-term losses resulting from extreme events (Patt et al., 2010).
• Natural capital, biophysical resources and ecosystems
For developing countries in particular, ecosystems and natural resources provide a major proportion of national income and economic wealth. Such ecosystems and resources are also vulnerable to changes in temperature and rainfall, and SLR, which is in part due to human-induced stresses such as population depletion of species, habitat fragmentation and pollution. The combination of climate change and such human settlement stresses is a major threat to the location and existence of the ecosystems and many species that contribute to economic prosperity.
Water is one vital natural resource for rural livelihoods. Climate change will likely continue placing additional stress on water resources in a number of ways, including through greater evaporation and water demands resulting from rising average annual temperatures; restricted coastal freshwater supply due to SLR and resulting salinization; increased extremes in precipitation such as greater intensity leading to greater flood risk, while reduced annual precipitation averages enhance drought risk (region-dependent); and overall reduced water quality resulting from a combination of rising temperatures, increased pollutant loading due to greater precipitation intensity during certain seasons, and reduced flow conditions during other seasons (OECD, 2009).
One direct economic impact of greater water resource stress is on regional food production, particularly in Southeast Asia. Nations at low latitudes are expected to suffer a decreased yield

122
from cereal production due to seasonal temperature and precipitation shifts associated with climate change, despite higher CO2 concentrations leading to some increases in baseline crop yields at mid- to high latitudes; so called “carbon dioxide fertilization” (OECD, 2009).
Generally, growth policies insufficiently consider environmental impacts of growth, but will have to do so much more actively in the future for both sustainability and for adaptation to climate change, as potential impacts on ecosystems and natural resources will be compounded by climate-related shocks and stresses. Sustainable natural resource management planning would in turn directly build the adaptive capacity of the population directly or indirectly using the resources (Patt et al., 2010), for example sustained and healthy mangrove forests make for improved coastal protection from inundation and salinization.
Improved resource efficiency, for example related to the agriculture sector, allows for a greater productivity to meet growing food demands, ease pressure on food prices and cope with the impacts of climate change, whilst also boosting local economic growth (Bowen et al., 2012). However, striking the balance between maximizing yields and minimizing risk is not straightforward, as some productivity-boosting measures can increase vulnerability, for example, if they involve greater water-use intensity (Falco et al., 2011).
• Physical capital, critical infrastructure, and appropriate technologies
Physical capital refers to forms of infrastructure, energy, tools, and technologies. The scale and quality of infrastructure, in both rural and urban contexts, are central indicators of the level and rate of economic development. The economic loss and damage from the impacts of climate change largely results from the effects of climatic events on infrastructure. Through the worsening of such impacts, and an adaptation consideration in development planning, climate change may well increase the costs of infrastructure needs especially in developing countries (Bowen et al., 2012). This would be due to necessary changes in the location and design of infrastructure such as roads, buildings and water supply channels, plus any need for additional infrastructure designed purely for climate protection, including sea-wall defenses and dykes for fluvial flood protection.
Climate resilient infrastructure development is a key to adaptation, particularly in urban areas, and as such it tends to dominate adaptation cost estimates (Fankhauser, 2010). Despite its daunting price tag, investment in infrastructure assets, following a thorough decision-making process that includes holistic risk assessments and cost-benefit/cost-effectiveness analyses, has the mutual benefit for economic growth as they can lock in development trajectories and are designed to be long-lasting (World Bank, 2010b).
• Financial capital and markets
Climate change places increased pressure on the need for access to sufficient financial capital, at both the macro and micro level. Major disasters place significant burdens on national economies and budgets through the demand for finance for emergency services, relief, rehabilitation, reconstruction, and recovery. Even on occasions when international aid covers the majority of required immediate post-disaster capital, the national economic growth rate will still inevitably slow through a temporary fall in revenues and the long-term impacts on other forms of capital that feed growth, as discussed above (Heipertz and Nickel, 2008). A slow-down in economic growth, often linked to protracted disaster recovery processes, restricts the national budget available for many of the key sectors for development, such as health, education and infrastructure. At

123
the local level, climate change is likely to alter the types of micro-finance products required, for example, the rising need for insurance against climate-related impacts (Bowen et al., 2012).
A strong domestic financial system, openness to capital markets, and access to domestic capital are important to building climate resilience (Bowen et al., 2012). Specifically, given the high vulnerability of the agricultural sector on which many developing economies still rely, national financial firm diversification (as opposed to over-specialization) is a key mechanism for adaptation and economic growth (Hornbeck, 2009). As it has been shown that the degree of climate impacts on the economy can depend on the economic cycle phase (Hallegatte and Ghil, 2008), coping with a climate shock during a time of boom, when there is little spare capacity for reconstruction and recovery, requires access to foreign labor and capital resources to prevent a fall in output over the medium- to long-term (Bowen et al., 2012). At the local scale, targeted micro-finance schemes that consider climate and disaster risks can be used to build adaptive capacity, for example for farmers supported by investment in climate-resilient crop diversification practices (Agrawala and Carraro, 2010).
As already alluded to, trade openness to capital markets is associated with economic growth, but with regards to adaptation to climate change there are both positives and negatives to having a certain reliance on international markets. Some empirical findings point to trade increasing climate resilience by reducing producers’ reliance on domestic markets and consumers’ reliance on domestic production (UNDP, 2007; Noy, 2009). Certain recent disasters, however, such as the 2011 Central Thailand floods, have demonstrated that such openness of trade allows the effects of climate-related shocks to spread internationally along the global value chain of a product or industry, far beyond the locality directly affected by the event (UNESCAP, 2015). Furthermore, international trade can lead to greater domestic production specialization, which as already noted can increase climate risk if the industry is risk-sensitive or if national economies become over-reliant on vulnerable trade and infrastructure (Bowen et al., 2012). At the local level, it has been found in other regions (Africa and Latin America) that greater openness to markets can pressure workers into less productive and more at-risk, often informal, sectors (McMillan and Rodrik, 2011). Overall, the type and severity of the shock will be the key deciding factor in determining the impact on trade flows through the level of reduction in imports and exports (Gassebner et al., 2010).
An openness to international free markets can increase the competitiveness of a national economy, which is also important for being able to cope with and respond effectively to changing market conditions. Such flexibility is therefore a key aspect of adaptation given the degree of uncertainty around precise future impacts of climate change on domestic markets and revenues (Bowen et al., 2012). An example of the importance of competitive markets for climate resilience has been demonstrated in Bangladesh in recent decades, where diversification away from the vulnerable climate-sensitive agricultural sector into the ready-made garment (RMG) industry has increased economic resilience and also positively impacted growth at the national and sub-national level (Benson and Clay, 1998; Benson and Clay, 2004). However, this type of diversification may not be fully facilitated by competitive markets, and resource-draining interventions by national governments to provide the necessary capabilities to diversify may be required (Hausmann and Rodrik, 2006).

124
• Policies, Institutions, Processes
Empirical evidence concludes that strong, effective institutions enable a quick and effective national and local government response to climate shocks, and thus the overall impact of the shock on economic output is limited (Hallegatte and Ghil, 2008; Noy, 2009). Effective institutional reform directly increases the ability of an economy to cope with and adapt to the effects of climate change, and also indirectly improves adaptability through increasing levels of income that can reduce a nation’s social and economic vulnerability to climate change (Dell et al., 2008).
An important lesson for any adaptation planning is to acknowledge that the potential impacts of climate change on any aspect or sector key for development are, to an extent, uncertain, and will vary according to the actual rate of temperature, precipitation and sea-level change, the given socio-economic pathway context, and the type, timing, and extent of adaptation interventions.
Adaptation and Green Growth
Green growth aims to create a paradigm shift away from seeing goals of economic growth and environmental protection as conflicting (GGGI, 2011). Taking the green growth approach to harmonizing these two goals may be the only way to achieve widespread sustainable development and significantly reduce rates of poverty in developing countries for the long-term (OECD, 2013). Furthermore, sustained green growth requires the building of adaptive capacity, or resilience, to the impacts of climate change variability and extreme events, whilst also protecting the primary drivers of economic development, such as human capital and natural resources, as detailed above (World Bank, 2012; OECD, 2013).
The Ecotown framework supports aspects of green growth and argues for its integration with adaptation, and more broadly, resilience, to mutually enhance economic development and climate resilience. The literature on this integration is fledgling, but through the CRGG approach the methodological framework for phase II of Ecotown aims to produce lessons and recommendations for the convergence of adaptation and development objectives. Phase I of the Ecotown framework included a systematic analysis of natural capital resources in local government units (LGUs) as part of the process of climate proofing sub-national development plans (CCC and GGGI, 2014). The CRGG methodology aims to move the framework beyond an ecosystem-focused approach towards a consideration of other drivers of economic development for integration of adaptation and development planning. However, the demonstration of the Phase 1 framework revealed the acute necessity of selecting the right adaptation measures that mutually enforce CRGG.
VII. Linking adaptation with economic development at the local level: Summary of frameworks, tools, and approaches As shown in Table B-10, there are a range of comparable climate risk screening and adaptation decision-making tools and guides for the integration of adaptation into development planning, across scales. This section will discuss those that have guidance and lessons for linking adaptation and economic development, particularly at the local level.

125
The OECD (2009) policy guidance on integrating adaptation into development takes a holistic “whole of government” approach to operationalizing adaptation across scales, and examines four levels of governance – the national, sector, project, and local levels – for entry points into decision-making and development planning processes. Its focus on local level processes (referring LGUs and community action), which are the closest to implementation of activities, covers key options for the incorporation of adaptation at the strategic level and in ground-level actions. The OECD (2009) framework for mainstreaming, as shown in Figure B-6, distinguishes resource allocation from planning, and offers explicit links to planning steps and policy cycle stages.
Figure B-6: OECD Framework for Mainstreaming Adaptation (OECD, 2009; Olhoff and Schaer, 2010)
Figure B-7: The poverty-environment approach to mainstreaming adaptation into development (UNDP-UNEP, 2011)
Finding the Entry Points and making the Case
Preliminary assessmentsUnderstanding the climate
development-poverty linkages (building on national communications and NAPA)
Preliminary assessmentsUnderstanding the
governmental, institutional and political contexts
Raising awareness and building partnerships
Evaluating the institutional and capacity needs
(Building on National Capacity Self-Assessments)
Mainstreaming Adaptation into Policy Processes
Collecting country-specific evidence
Assessments, economic analysis and demonstration
projects (building on national communications and NAPA)
Influencing policy processesNational, sector, and
subnational levels
Developing and climate-proofing policy measures
(building on national communications and NAPA)
Strengthening institutions and capacities
Learning by doing
Engaging stakeholders and coordination within the development communityGovernment, non-governmental and development actors
Meeting the Implementation Challenge
Strengthening the national monitoring system for
adaptation
Budgeting and financingNational, sector, and
subnational levels (building on adaptation funding mechanisms
Supporting policy measuresNational, sector, and
subnational
Strengthening institutions and capacities
Mainstreaming as standard practice

126
The UNDP-UNEP (2011) Poverty-Environment Initiative (PEI) offers a guide for mainstreaming adaptation in national level development planning, viewed through a poverty-environment lens, including a proposed framework consisting of three main components: finding the entry points and making the case; mainstreaming adaptation into policy processes; and meeting the implementation challenge (see Figure B-7) (UNDP-UNEP, 2011).
Whilst this operational guide offers sound advice to practitioners for an approach to mainstreaming adaptation for the achievement of development and pro-poor economic growth, it stops short of offering explicit context-specific lessons on mainstreaming adaptation at the local level, for example in rural settings. Primarily, the UN Poverty-Environment Initiative (UNPEI) aims for poverty-environment mainstreaming, which is defined as the integration of linkages between the environment and poverty reduction into policy-making, budgeting and implementation processes across scales, from the national to the sector to sub-national levels (UNDP-UNEP, 2011). As detailed in section 3.2, evidence suggests that effective environmental and natural resource management can directly or indirectly improve livelihoods, health, disaster resilience and adaptive capacity, and contribute towards economic development (UNPEI, 2009).
While the UNPEI is comprehensive within its framework, its focus is narrow and on natural capital; just one the drivers of local and national economic development. In general, UNPEI is a useful entry point for integration, but it does not aid government policies and ministries to see adaptation as a development challenge rather than an environmental one, and therefore show that taking a development-centric approach leads to more effective integration for mutual climate change adaptation and social and economic development benefits. It does, however, highlight the key challenge of linking and aligning the local manifestations of climate change with national level adaptation responses, and the importance of stakeholder engagement in achieving such alignment. More broadly, the initiative itself has not fully succeeded in promoting national recognition of the importance and value of natural resource and ecosystem service protection for social development and poverty reduction (Lebel et al., 2012).
Drawing upon the general guidance offered by the OECD (2009) publication - Integrating Climate Change Adaptation Into Development Co-operation: Policy Guidance, and the lessons of the CRiSTAL, or “community-based risk-screening tool – adaptation and livelihoods” (IISD, 2012), the following section discusses how adaptation and economic development can be linked at the local level. We draw attention to this community project-based tool for livelihood and adaptation integration, as it is a risk assessment tool that can potentially address the shortcomings of the previously referenced tool, CVAT (Flax et al., 2002), and inform key steps of the Eco-Town phase II CRGG methodology. As a project planning and management tool CRiSTAL offers a decision-making framework that guides users in identifying livelihoods resources most important to adaptation that then form the basis for designing adaptation strategies (IISD, 2012). This can be seen as an approach to assessment and adaptation planning that places local social and economic development at its core, through a livelihoods and capital lens. The expected outcome is an improvement in livelihoods in a climate risk context. It is a user-friendly tool in the form of a computer desktop application. Figure B-8 shows the CRiSTAL framework organized according to its three phases and related outputs, which are achieved through a series of analytical steps.
The livelihoods approach taken by CRiSTAL is based on an assumption that climate risk management and reduction at the local scale requires an appraisal of how livelihoods are conducted and maintained. Drawing on the sustainable livelihoods framework, livelihoods are

127
defined in terms of capitals and resources. As discussed above, these livelihood characteristics form key inputs to local economic development, and taking this approach to risk assessment and adaptation allows practitioners and decision-makers to appreciate development issues in the context of climate change, rather than viewing climate risk as purely an environmental issue. A livelihoods approach also draws focus to people’s access to and management of resource capitals, instead of simply just the presence or absence of resources, particularly natural and ecosystem resources, and how climate change is and may potentially alter that presence or absence in a given setting (IISD, 2012).
When it comes to the identification, selection and implementation of adaptation options, CRiSTAL uses the MCA approach. The first step after identifying adaptation measures in the CRiSTAL framework is to identify and weight (or rank) evaluation criteria for the selection of appropriate measures. This process should ideally be a discussion that includes community members and other local partners with a potential stake in the implementation of an adaptation measure (IISD, 2012). Whilst project users are encouraged to come up with their own criteria, CRiSTAL proposes seven criteria by default, which are shown in Table B-10. After this step, the contribution of each proposed measure is evaluated against each selection criterion, and subsequently opportunities and barriers to implementation should be identified.
Figure B-8: The CRiSTAL framework (IISD, 2012)
• List of livelihood resources for men and women that are most affected by climate hazards and most important for responding to climate impacts
• List of desired adaptation outcomes and important influencing factors to be monitored.
• Proposed adjustments to existing projects• Prioritized new activities to support climate
adaptation• A list of key opportunities and barriers to revised/
new project implementation
• Describe livelihood activities, key actors, gender and diversity aspects, and the ecological context
• Assess the implications for your analysis
• Identify resources that are important to local livelihoods and who has access and control over them
• Document observed and projected climate changes in the area
• Identify current and potential future climate hazards
• Document the impacts of these hazards
• Document community response to climate impacts
• Assess impacts of project activities on livelihood resources that are important in the climate context
• Revise project activities to support climate adaptation
• Identify opportunities and barriers to project implementation
• Propose new activities to reduce risks identified in step 2
• Identify criteria for evaluating proposed activities
• Prioritize and select proposed activities based on evaluation criteria
• Identify opportunities and barriers to project implementation
• Identify the changes in behavior or practice you want to see by the end of your project as result of the implementation of adaptation activities
• Identify important factors (climate and non-climatic) that can influence your expected outcomes
Describe livelihoods context1 Analyze
climate risk2 Revise existing project activities3 Design new
project activities4Identify key elements for your monitoring & evaluation framework
5
Evaluate the implications for your projectBSupport monitoring & evaluation
CUnderstand the livelihoods and climate contextA
PH
ASE
STE
PS
& P
RO
CE
SSO
UT
PU
TS

128
Mainstreaming adaptation at the local level
Effective adaptation approaches should involve both stand-alone adaptation-centered policies and plans, and the holistic integration of measures to mainstream into all development strategies and processes, including policy-making, budgeting, implementation and monitoring and evaluation, in order to make them more resilient to climate change, at national, sectoral, project and sub-national levels (OECD, 2009; UNDP-UNEP, 2011). Working with existing institutions and their policies and practices, as opposed to producing and building new ones, is often a more efficient use of generally scarce financial resources. A specific example of such mainstreaming would be seeking to adapt to the risks posed to the agricultural sector by including measures as part of pre-existing farming practices, within community development plans and national agriculture, water, poverty alleviation, and development policies and strategies (OECD, 2009).
The coordination of adaptation measures across these scales is crucial, as the planning and strategy time frame may be much shorter at the farm level, for example, seasonal, compared to the sectoral and central government level, which may operate on a multi-year or decadal time scale. In reality, the decisions made around policies and budgets at higher levels of government authority may hold sway over the ground-level actions; national level decision-making can be both enabling and constraining to adaptation choices (OECD, 2009). As well as a means for cross-scale coordination, mainstreaming can also be in the form of cross-sectoral policy integration,
Table B-10: Example evaluation criteria for the selection and prioritization of adaptation responses (adapted from IISD, 2012)
Targets vulnerable groups
The most vulnerable socio-economic groups have the greatest need to increase their adaptive capacity. Activities that target vulnerable groups should be preferred over those that share their benefits indiscriminately across the population. Identifying which social groups tend to be more socially disadvantaged/ marginalized, and therefore who could be more vulnerable, is done by looking at the results of focus group consultations and by considering those groups who most lack access and control over key resources for building capacity to cope with climate risks.
Multiple beneficiaries
This straightforward criterion counts how many people are likely to benefit from an intervention. More widely shared benefits might be preferred. This criterion may in some cases be in partial conflict with the “target vulnerable groups” criterion.
Considers long-term changes
The proposed activities should already take into account the impacts of climate change. Nevertheless, practical actions often focus on the more short-term risks. This criterion is intended to make sure that the projected longer-term climatic changes are explicitly taken into account. However, a user may also decide that addressing more immediate climate hazards is more important and this should be reflected when weighting criterion.
Politically feasibleRunning into strong political resistance with certain activities may undermine activities. Nevertheless, the transition towards sustainable development can be contentious and encounter political opposition. This criterion should therefore not be used to rule out innovative thinking.
Culturally appropriate
Changes induced by new activities should respect the local culture. Otherwise, you may find that changes are not widely adopted. Similar to the previous criterion, this should not rule out change, as deeply rooted behaviors may often be part of the problem.
Long-term cost-effectiveness
Less costly solutions should be preferred for obvious reasons; however, cost effectiveness should be considered over the long term, as adaptation solutions will by their very nature often only pay off in the longer run. Looking at costs therefore needs to take into account not only the immediate implementation costs of the project, but also the avoided future costs of climate impacts.
Low-emissions
While reducing a carbon footprint may not be a priority for local development planning in poor and vulnerable populations, synergies between low-carbon and climate-resilient development should be exploited whenever possible. The operations of development organizations should also be run with as few emissions as possible.

129
for example by taking a long-term perspective of future climate-related hazard patterns when providing relief and development assistance that can shape future livelihoods and vulnerabilities (Agrawala and van Aalst, 2008; Dovers and Hezri, 2010). In general, the potential benefits of mainstreaming can be numerous and spread widely among stakeholders. Benefits include reduced risk to the most vulnerable, avoided policy conflicts, leveraging greater finances in climate-sensitive sectors than the available funds for financing adaptation separately, and improved efficiency compared with separate management of adaptation (Agrawala, 2004; Lebel et al., 2012).
Mainstreaming adaptation to climate change at the local level is deemed important for three reasons (OECD, 2009) - (i) the impacts of global climate change are manifested locally; according to local geography and other environmental, socio-economic and political factors, and specifically affect local livelihood and income-generating activities, (ii) vulnerability, resilience and adaptive capacity are context-specific and thus determined by local conditions, (iii) adaptation measures and development impacts are generally best observed and understood at the local level - the experience and observation of climate change impacts shapes adaptation decision-making and action through knowledge and capacity.
Climate change adaptation at the local level is strongly linked to other ”higher” levels of decision-making, namely the project, sectoral and national levels, particularly when considering the differences between decisions made at the local level and decisions made for the local level at these higher levels. As will be detailed later, local actor and stakeholder engagement and consultation should be central to such externally driven decision-making processes (OECD, 2009). Ideally, attempts to integrate adaptation into development at higher levels should be designed to enable, through frameworks, plans and incentives, sub-national and local government levels to assess their risk and vulnerability contexts and analyze their adaptation options in their own local economic development contexts. At the same time, of course, the central government frameworks and plans should be designed with bottom-up inputs and consultations in order to ensure their local level applicability and success.
One such example of an existing project seeking to mainstream adaptation at the local level in the Philippines is the Project Climate: Twin Phoenix, being implemented through a partnership between the HLURB, CCC, UNDP and Australian Aid. The projects Supplemental Guidelines on Mainstreaming Climate and Disaster Risks in the CLUP (HLURB et al., 2015) is helping LGUs formulate risk-sensitive CLUPs and zoning ordinances to guide allocation of land use in a way that minimizes risk creation and maximizes risk prevention. The project Supplemental Guidelines offer a step-by-step process to risk assessment and adaptation mainstreaming (into the CLUP) at sub-national levels, and would serve as a useful referencing tool for the CRGG implementation team.
Adaptation and local economic development in rural contexts
The effective linking of adaptation and local economic growth in either rural or urban settings demands a consideration of various factors and indicators that are specific to one or the other context, including population dynamics, environmental and resource conditions, level of public spending, and economic activities (OECD, 2009). This section will focus on the characteristics that define the rural development context, and how specific adaptation options can be connected to local rural economies to reduce rural-specific vulnerabilities.

130
A common objective of local rural development planning is to reconcile conservation and development objectives (Lebel et al., 2012). Rural livelihoods are typically sourced from the local natural resource base, and are often largely agricultural. Local planning can aim to support rural households in engaging in other income-generating activities relating to timber processing, local transport, domestic services, maintaining ecosystem goods and services, and nature-based tourism - all of which contribute to a less-intensively farmed ecosystem and an increasingly diversified rural income portfolio that builds climate resilience and adaptive capacity (OECD, 2009; WWF, 2009). Reducing the reliance on livelihoods dependent on natural resource reduces climate change sensitivity levels because climate change is projected to significantly affect the distribution, productivity and overall health of the ecosystems that rural livelihoods tend to drawn on. Moreover, an unstable global or regional agriculture commodities market, due in part to climate change, will lead to increased vulnerability of farmers as they would be less able to accumulate assets needed for disaster response and recovery. The direct reliance on natural resources is also felt through the self-provisioning of goods and services like food and water rather than using cash in order to access these goods and services (OECD, 2009).
Differentiating characteristics lead to different vulnerability profiles for rural and urban contexts. The rural development factors influence how climate change is locally manifested, the sensitivity of a given system or locality and the adaptive capacity of the population. The socioeconomic factors that can enhance (such as strong social cohesion and traditional local knowledge) and constrain (such as reliance on limited natural and economic resources, less diversified economies, low levels of technical training, and isolation from services) rural adaptive capacity are issues that should form part of the considerations of vulnerability assessments and selection of suitable adaptation options. Rural communes generally have different growth objectives or strategies to urban areas, and this means the respective adaptation needs and interventions are to be different. As just one example, achieving economic development in rural settings may be done through improving market access for local farmers or enabling livelihood diversification, whereas in urban contexts growth can be indicated by the development and upgrading of infrastructure or the expansion of service sector employment opportunities (OECD, 2009). These growth trajectories can build climate resilience.
Key steps and entry points for integrating adaptation into local development processes
In general terms, the process for integrating climate change adaptation into development policies, strategies and plans involved the linking of two processes - (i) the process of assessing climate risk (hazard, impact and vulnerability assessments) and choosing adaptation measures, and (ii) the process of creating and implementing development policies and plans (OECD, 2009). Specific sub-national level planning and integration of adaptation measures acknowledges that the local manifestations of climate change are context-specific, and vulnerabilities and coping and adaptive capacities are site specific (Lebel et al., 2012). Successful integration relies on a set of enabling conditions that can be understood as key steps for achieving success. The framework for mainstreaming at the national level put forward by Huq and Ayers (2008) proposes a linear sequence of four steps. However, it is a relatively simple and unspecified framework, and thus this section of the report builds on these steps, with a specific discussion of how to mainstream at the sub-national level.

131
• Awareness-raising and targeted messagingRaising awareness among local stakeholders such as community-based organizations, community leaders and households is key to informed decision-making for adaptation. Effective awareness-raising efforts should not scaremonger (alarm) stakeholders, but should enable those at risk to anticipate forthcoming shocks and stresses by communicating and describing changing risk contexts, the potential implications of such changes, and how to prepare for anticipated impacts. Further, the selection of appropriate communication tools and channels is equally important to achieving increased awareness and resilience. In selecting means of communicating climate risk messages, it should be considered that men and women use different information channels, and that women may actually have less access to information than men do. Therefore adaptation information should be designed and disseminated in gender-sensitive ways, and be part of broader efforts to explicitly ensure women and girls can easily have access to and understand the required information (OECD, 2009). Overall, climate change messages that combine both an explanation of the phenomenon and its local implications are effective, and the Red Cross/Red Crescent Climate Guide (IFRC, 2007) is an appropriate tool for local-level risk communication that builds on this approach.
The UNDP-UNEP (2011) guide for mainstreaming adaptation into development planning highlights awareness-raising among decision-makers as a continuing challenge due to the complexity of climate change and its many links with development issues. It argues that to increase the relevance of adaptation to decision makers, adaptation planning needs to explicitly make the linkages with broader development goals of poverty reduction and pro-poor economic growth, and encourage economic cost-benefit and cost-effectiveness analyses of adaptation actions.
• Gathering and using appropriate informationLocal decision-making for adaptation requires a wide range of information and sources, with data needed at various scales, for example, from household income to global climate change projections. As part of a “whole of government” approach, institutions and ministries including universities, land surveying, census and water resource management departments, at national and sub-national levels, should be engaged in adaptation planning processes (OECD, 2009). It is, however, the local-level information that is most important to the process of integrating adaptation into local development planning. Understanding local contexts intimately enables actors to scale down, digest, and adapt national development frameworks and economic growth goals into appropriate local strategies for a mutual enforcing relationship between strengthening adaptive capacity and local economic development. The types of information needed for adaptation planning and the tools available for gathering that information are extensive; Table B-11, taken from OECD (2009), provides some useful examples.
Of the climate risk and vulnerability assessment tools noted in Table B-4, CRiSTAL offers an approach to understanding risk and vulnerability in the local development context, CRiSTAL is not, however, a stand-alone, step-by-step, risk or vulnerability assessment tool such as the Red Cross/Red Crescent Climate Guide (IFRC, 2007). Instead, CRiSTAL is a more narrowly focused guide for analyzing local livelihoods, in an actual and expected climate risk context (IISD, 2012). The methods for gathering this information, which feeds into an understanding of the local development situation, should be participatory where possible and appropriate.

132
• Stakeholder engagementThe UNDP-UNEP (2011) framework for mainstreaming emphasizes the importance of stakeholder engagement throughout, and suggests the process should be integrative and iterative (see Figure B-7). Moreover, to achieve effective and sustained engagement with local actors and stakeholders, local government decision-makers should step beyond a top-down, single-direction relationship and view and engage those with strong roots in at-risk communities as legitimate agents with context-specific expertise. One tool used in bottom-up approaches is participatory budgeting, where citizens are able to make proposals on how to allocate part of an LGU’s budget. In terms of climate change, community-based organizations may possess more acute risk awareness, and can make adaptation suggestions that are more likely to complement livelihood activities and thus maintain local economic development (OECD, 2009). The CRiSTAL livelihood analysis tool relies on community consultations to ensure projects are
Table B-11: Local information for adaptation, and examples of data gathering and organizing tools (OECD, 2009)
Information for adaptationExamples of tools for gathering and organizing information
Climate-specific tools tools Generic tools
Climate forecasts, predictions and projectionsInformation regarding anticipated weather forecasts, seasonal weather predictions and projected long-term climate trends are essential for understanding current climate-related hazards and potential future hazards.
Scientific / quantitative:• Daily weather forecasts• Seasonal weather forecasts• Cyclone/hurricane monitoring• Regional climate models and
global circulation models
Indigenous / qualitative:• Traditional knowledge
Natural hazards and environmental assessmentsInformation on past experience with natural hazards, as well we on current deviations from pas practice, is essential for understanding future risk associated with climate change.Information related to current environmental conditions, such as deforestation, wetlands functioning, coastal erosion, and soil degradation is also important, as these factors influence the vulnerability and adaptive capacity of communities to future climate change.
All Scientific/quantitative:• Wind, rainfall, and temperature
date (historic and current)
Indigenous/qualitative:• Traditional knowledge
Scientific/ quantitative• Geological hazard maps• Hydrological maps (flood prone
areas)• Local rainfall and flood level
records
Qualitative:• Participatory local hazard map• Time lines
Vulnerability and capacity assessmentsThese assessment frameworks and toolkits support identifying, understanding, quantifying and assessing the degree to which a rural community is vulnerable to climate change, and its capacity to cope and adapt to anticipated impacts.
• Capacities and vulnerability analysis
• IFRC vulnerability and capacity assessment
• CARE international climate vulnerability and capacity assessment framework.
Participatory rural appraisal tools:• Stories and oral histories• Household surveys• Transect walks• Wealth and well-being ranking• Semi-structured interviews and
focus groups• Time-lines• Seasonal calendars• Problem trees and flow chars• Venn diagrams
Livelihood analysisUnderstanding of the livelihood context in a rural community (its human, natural, financial, physical and social capitals) and how these assets could be affected by climate change helps identify potential sources of vulnerability and possible responses.
• CRiSTAL (community-based risk screening tool – adaptation and livelihoods)
Local coping and adaptation strategiesRural communities have established strategies for coping with historic climate variability, and might be introducing new strategies to adjust to new climatic experiences. These strategies might help or hinder long-term adaptation efforts.

133
designed, managed and implemented according to local conditions and requirements. The local stakeholder engagement process allows for a discussion of the links between livelihoods and climate risks, including how resources may be affected and also needed for responding and adapting to the local manifestations of climate change. Within a community or locality different social groups take differing roles and responsibilities, and CRiSTAL directs users to engage these social groups separately, at appropriate stages of the analysis. As highlighted through the OECD (2009) guidance, considering and addressing the contrasting positions of men and women in society is vital to the processes of adaptation action.
• Entry points for integrating adaptation with local development planningOpportunities for the integration of adaptation into development planning are understood in terms of entry points (OECD, 2009). Whilst the UNDP-UNEP (2011) guidance analyses entry points for integration into national development planning by breaking down the levels of planning into national, sectoral and sub-national (see Table B-12), the OECD (2009) guidance identifies four entry points for integration specifically at the local level. Whilst the national level is certainly critical, as the planning often provides the framework within which sub-national levels operate and the government coordinates sector-specific policies (Lebel et al., 2012), this sub-section of the report will maintain a local-level focus and as such evaluate local entry points for mainstreaming adaptation, primarily into rural development planning. Whilst decentralization and devolution of powers and duties has enabled LGUs to become more accountable to the people, the appropriateness of each of these entry points for integration is always dependent upon the specific administrative system context in question (Lebel et al., 2012). In any case, a greater emphasis on providing bottom-up channels for lessons learned at the local level to shape planning and frameworks at higher levels is needed.
ENTRY POINT 01
Consideration of climate change implications in development planning processes of local governments
Development planning involves the setting of goals and objectives for social and economic development, and producing and implementing strategies for the achievement of these goals and objectives through the allocation and management of human, natural and financial resources. At the sub-national level, development planning will be focused on relatively small spatial and temporal scales, and may strive for more specific, targeted outcomes suited to the local development context. For adaptation, these processes offer frameworks within which priorities can be integrated (see Figure 3-1) (OECD, 2009). However, the long-term consequences of planning decisions, in the context of future risks that will need to be addressed, should be considered (Füssel, 2007).
In rural contexts, development plans often primarily focus on the allocation and management of natural capital and biophysical resources for productivity, as discussed above, for the goal of sustaining and improving livelihoods, reducing levels of poverty, and contributing to economic development across scales, from the national to the local. A consideration of climate change can be incorporated into rural development planning processes through means such as community-driven, semi-autonomous, village action plans, and district development plans which come under a national development planning framework which should identify priorities and trade-offs (OECD, 2009; Lebel et al., 2012).

134
Private finance institutions have the capacity to offer support and incentives for local level adaptation action. Providing micro-finance and loan products to low-income groups, particularly in rural areas where income growth may stagnate in comparison to urban areas, could be done so on the condition of implementing risk reduction measures which can mutually strengthen livelihood income-generating activities (OECD, 2009).
VIII. Conclusions
This literature review report has demonstrated that there is a direct and positive link between economic development and adaptive capacity (Bowen et al., 2012). Whilst the interrelatedness
ENTRY POINT 04
Engagement of the private sector and civil society organizations (CSOs)
Local level adaptation action should involve actors beyond the public sphere, such as the private sector and CSOs, which can institutionalize considerations of climate risk into their own strategic or business planning processes and operations. The areas of potential business action on adaptation include collaboration with global market partners, within internal operations and across supply chain links, and in partnership with surrounding communities that include members of the workforce. Private finance institutions have the capacity to offer support and incentives for local level adaptation action. Providing micro-finance and loan products to low-income groups, particularly in rural areas where income growth may stagnate in comparison to urban areas, could be done so on the condition of implementing risk reduction measures which can mutually strengthen livelihood income-generating activities (OECD, 2009).
ENTRY POINT 02
Adjustment of local regulatory and service provision plans (including information on local climate change impacts)
The adjustment of regulatory frameworks by LGUs can enable more effective resource management and land-use planning; processes where adaptation considerations can be integrated. For instance, legislation can allow for incentives for water conservation and improving the resilience of livelihoods, promotion of ecosystem goods and services protection, and the consideration of current and projected climate risks and exposed areas in infrastructure project planning. Promoting adaptation to local stakeholders should ensure that contextual climate change information is widely disseminated. This requires infrastructure and services for the gathering, storing and analyzing of information databases relating to hazards, climatic projections, and local vulnerability.
ENTRY POINT 03
Adjustment of local government accountability mechanisms
Government accountability mechanisms, for example annual district performance contracts, can include specific measures for the management of local climate risks. These contracts exist between different levels of government for the monitoring and evaluation of performance as a way of holding decision-makers accountable to their citizens and constituencies. Typically, the contracts will include a summary of the local development context, and specific goals relating to health, education, agriculture, infrastructure, water, environmental protection, and other development areas. Indicators should be included to measure the achievement of goals against current baseline conditions of socio-economic development. If awareness of climate risks can be built, these contracts have clear entry points for integrating context-specific adaptation actions.

135
of development indicators is not fully understood (i.e., how they work together, and whether strong performance in one factor compensates for weakness in another), improvements in them associated with adaptive capacity, through economic growth, are shown to be an effective way of reducing climate change vulnerabilities across scales (Bowen et al., 2012).
The experienced and anticipated impacts of climate change on drivers of local economic development have been discussed, with adaptation responses suggested. A review of the available decision-support tools has revealed that explicit guidance on how to link adaptation action with local development planning is restricted to a limited number of project documents. However, CRiSTAL (IISD, 2012) takes a livelihoods approach that can be seen as an effective way to frame adaptation interventions that are mutually reinforcing with economic development, at the project level. At the local level, OECD (2009) presents general yet detailed guidance on entry points for adaptation into LGU development planning, predominantly taking a bottom-up approach to assessments and information gathering for the design and implementation of adaptation measures. More generally, frameworks, tools and guides struggle to strike the balance between being simple enough to be easily understood and followed, and specific enough to be actionable and answer the “how” questions such as how does mainstreaming result from recommended activities and steps, and how does awareness-raising lead to appropriate projects and actions. Crucially, the suitability of any framework or tool will always be dependent on the users’ circumstances; information needs, available resources and requirements of the project should all be clarified before embarking on an investigation of appropriate tools (UNFCCC, 2008). Regarding assessment tools specifically, balancing bottom-up and top-down approaches is also hugely challenging to implementers, as was discovered during Eco-town phase 1 implementation. Balancing bottom-up and top-down processes to mainstream adaptation is especially critical at the local level (Lebel et al., 2012). At present the balance is too in favor of top-down, and inputs from local actors are arguably most critical to successful adaptation interventions that reinforce or advance development trajectories (OECD, 2009). Eco-town phase 2 methodologies may seek to place more emphasis on bottom-up approaches, where appropriate.
Effective mainstreaming, it is argued, needs adaptation to be viewed as a development challenge, as opposed to an environmental one (Huq and Ayers, 2008; OECD, 2009; Lebel et al., 2012). National governments need to move beyond allocating responsibility and resources for adaptation to environmental agencies, and emphasize the allocation of more responsibility and resources to those concerned with development, poverty reduction, and social inclusion (Agrawala and van Aalst, 2008). Not only would such a transition improve the integration of adaptation and economic development at all levels, it would also create greater awareness and acknowledgement amongst decision-makers who have the power to allocate more sufficient funds for adaptation interventions themselves.
In the Philippine context, the seven strategic priorities of the NCCAP engage a number of national government ministries (see CCC and GGGI, 2014), but the ministries engaged overwhelmingly have an environmental focus; for example the Department of Agriculture (DA), and the Department of Environment and Natural Resources (DENR), rather than developmental; for example the National Economic and Development Authority (NEDA), the Department of Social Welfare and Development (DSWD), the Department of Labor and Employment (DLE) and the Department of Education (DepEd). Whilst mainstreaming can be occurring within these departments, for example through implementation of NEDA’s Philippine Development Plan 2011-2016, not acknowledging and engaging them within the NCCAP strategic priorities
136
may be an oversight, particularly given the long-term nature of NCCAP, in place for the period of 2011 to 2028. More responsibility and resources for adapting to climate change, we argue, should be allocated to these development-focused agencies. As Eco-town is considered the implementation of the NCCAP at the local level (CCC and GGGI, 2014), it may be restricted by the ecosystem-based natural resource management approach to tackling climate change that underplays social and economic development as a form of adaptation (Bowen et al., 2012).

137
ADW, UNU-EHS, 2014. World Risk Report - The city as a risk area, World Risk Report. Alliance Development Works (ADW) and United Nations University - Institute for Environment and Human Security (UNU-EHS), Bonn, Germany.
Agrawala, S., 2004. Adaptation, Development Assistance and Planning: Challenges and Opportunities. IDS Bulletin 35, 50–54. doi:10.1111/j.1759-5436.2004.tb00134.x
Agrawala, S., Fankhauser, S., 2008. Economic Aspects of Adaptation to Climate Change: Costs, Benefits and Policy Instruments. Organisation for Economic Co-operation and Development (OECD), Paris, France.
Agrawala, S., van Aalst, M., 2008. Adapting development cooperation to adapt to climate change. Climate Policy 8, 183–193.
Alkire, S., Santos, M.E., 2010. Acute Multidimensional Poverty: A New Index for Developing Countries (SSRN Scholarly Paper No. ID 1815243). Social Science Research Network, Rochester, NY.
Asian Development Bank, 2012. Key Indicators for Asia and the Pacific 2012. Asian Development Bank (ADB).
Asian Development Bank, 2007. Philippines: Critical Development Constraints. Asian Development Bank (ADB).
Bandura, R., 2008. A Survey of Composite Indices Measuring Country Performance: 2008 Update (UNDP/ODS Working Paper). Office of Development Studies (ODS), United Nations Development Programme (UNDP), New York.
Bowen, A., Cochrane, S., Fankhauser, S., 2012. Climate change, adaptation and economic growth. Climatic Change 113, 95–106. doi:10.1007/s10584-011-0346-8
CCC, 2015. Enhancing Capacities for Low Emission Development Strategies: EC-LEDS in the Philippines. Climate Change Commission, Executive Office of the President of the Philippines.
CCC, 2011. National Climate Change Action Plan (NCCAP) 2011-2028. Climate Change Commission, Executive Office of the President of the Philippines.
CCC, GGGI, 2014. Demonstration of the Eco-town Framework Project in San Vicente, Palawan, Philippines. Climate Change Commission and the Global Green Growth Institute, Seoul.
Colfer, C.J.P., Capistrano, D., eds, 2005. The politics of decentralization: forests, people and power. Earthscan Publications, London, UK.
Congress of the Philippines, 2009. Climate Change Act of 2009 (Republic Act No. No. 9729). Republic of the Philippines, Congress of the Philippines, Metro Manila, Philippines.
Dessai, S., Hulme, M., 2004. Does climate adaptation policy need probabilities? Climate Policy 4, 107–128. doi:10.1080/14693062.2004.9685515
Dovers, S.R., Hezri, A.A., 2010. Institutions and policy processes: the means to the ends of adaptation. WIREs Clim Chg 1, 212–231. doi:10.1002/wcc.29
Feenstra, J.F., Burton, I., Smith, J.B., Tol, R.S.J., 1998. Handbook on Methods for Climate Change Impact Assessment and Adaptation Strategies. UNEP/Vrijr Universiteit, Amsterdam.
Fisher, A., et al., 2000. Preparing for a changing climate: the potential consequences of climate variability and change (A report of the Mid-Atlantic Regional Assessment Team (MARA)). EPA and Pennsylvania State University, PA, USA.
Bibliography for Literature Review

138
Füssel, H.-M., 2007. Adaptation planning for climate change: concepts, assessment approaches, and key lessons. Sustain Sci 2, 265–275. doi:10.1007/s11625-007-0032-y
GGGI, 2015. Energy Planning for Green Growth: A Handbook for Green Energy Planning and Mitigation Assessment. Global Green Growth Institute (GGGI), Forthcoming, Seoul, South Korea.
GGGI, 2014. Green Growth in Practice - Lessons from Country Experiences. Global Green Growth Institute (GGGI), Seoul, South Korea.
GGGI, 2011. Green Growth in motion: Sharing Korea’s Experiences. Global Green Growth Institute (GGGI), Seoul, South Korea.
Harmeling, S., Eckstein, D., 2012. Global Climate Risk Index 2013 (Briefing Paper). Germanwatch, Bonn, Germany.
HLURB, CCC, UNDP, Australian Aid, 2015. Supplemental Guidelines on Mainstreaming Climate and Disaster Risks in the Comprehensive Land Use Plan. Housing and Land Use Regulatory Board (HLURB), Quezon City, Philippines.
Horton, R.M., Gornitz, V., Bader, D.A., Ruane, A.C., Goldberg, R., Rosenzweig, C., 2011. Climate Hazard Assessment for Stakeholder Adaptation Planning in New York City. J. Appl. Meteor. Climatol. 50, 2247–2266. doi:10.1175/2011JAMC2521.1
Huq, S., Ayers, J., 2008. Taking Steps: Mainstreaming National Adaptation (IIED Policy Brief). International Institute for Environment and Development, London, UK.
IFRC, 2007. Red Cross/Red Crescent Climate Guide. International Federation of Red Cross and Red Crescent Societies.
IISD, 2012. CRiSTAL User’s Manual Version 5 - Community-based Risk Screening Tool - Adaptation and Livelihoods. International Institute for Sustainable Development, Manitoba, Canada.
IPCC, 2014. Climate Change 2014: Synthesis Report. Contribution of Working Groups I, II and III to the Fifth Assessment Report of the Intergovernmental Panel on Climate Change. Intergovernmental Panel on Climate Change, Geneva, Switzerland.
IPCC, 2012. Managing the Risks of Extreme Events and Disasters to Advance Climate Change Adaptation (No. A Special Report of the Intergovernmental Panel on Climate Change Working Groups I and II (Field, C.B., V. Barros, T.F. Stocker, D. Qin, D.J. Dokken, K.L. Ebi, M.D. Mastrandrea, K.J. Mach, G.-K. Plattner, S.K. Allen, M. Tignor, and P.M. Midgley, eds.)). Cambridge University Press, Cambridge, UK, and New York.
Kristensen, P., 2004. The DPSIR Framework. National Environment Research Institute, Denmark.
Larson, A.M., 2005. Democratic decentralization in the forestry sector: lessons learned from Africa, Asia and Latin America. Center for International Forestry Research.
Lasco, R.D., Pulhin, F.B., Jaranilla-Sanchez, P.A., Delfino, R.J.P., Gerpacio, R., Garcia, K., 2009. Mainstreaming adaptation in developing countries: The case of the Philippines. Climate and Development 1, 130–146. doi:10.3763/cdev.2009.0009
Lebel, L., Li, L., Krittasudthacheewa, C., et al., 2012. Mainstreaming climate change adaptation into development planning. Adaptation Knowledge Platform and Stockholm Environment Institute, Bangkok, Thailand.
139
Lee, J., et al., 2010. Climate Change Adaptation Capacity Indicators - Pilot Study for the Application of the Indicators at the Local Level. Korea Environment Institute (KEI), Seoul, South Korea.
Lim, B., Spanger-Siegfried, E., Burton, I., Malone, E., Huq, S., 2004. Adaptation Policy Frameworks for Climate Change: Developing Strategies, Policies and Measures. Cambridge University Press, Cambridge, UK, and New York.
McGray, H., Bradley, R., Hammill, A., Schipper, E.L.F., Parry, J.-E., 2007. Weathering the Storm: Options for Framing Adaptation and Development. World Resources Institute.
NEDA, 2011. Philippine Development Plan 2011-2016. National Economic and Development Authority.
ODI, 2013. Case Studies - Adaptation to Climate Change in Water, Sanitation and Hygiene - Assessing risks and appraising options in Africa. Overseas Development Institute (ODI), London, UK.
OECD, 2013. Putting Green Growth at the Heart of Development: Summary For Policymakers. Organisation for Economic Co-operation and Development (OECD), Paris, France.
OECD, 2009. Integrating Climate Change Adaptation into Development Co-operation - Policy Guidance. Organisation for Economic Co-operation and Development (OECD), Paris, France.
Olhoff, A., Schaer, C., 2010. Screening tools and guidelines to support the mainstreaming of climate change adaptation into development assistance - a stocktaking report. United Nations Development Programme, New York.
Oxfam, 2009. The new adaptation marketplace: Climate change and opportunities for green economic growth. Oxfam America Inc., USA.
PCSD, 2011. The Philippines’ Rio+20 Report: Inputs for the Compilation Document. Philippine Council for Sustainable Development (PCSD).
PSA-NSCB, 2014. 2014 Compendium of Philippine Environment Statistics. Republic of the Philippines, Philippine Statistics Authority (PSA).
SBSTA, 2009. Performance indicators to monitor and evaluate the effectiveness of the implementation of the technology transfer framework” - Final report by the Chair of the Expert Group on Technology Transfer. Subsidiary Body for Scientific and Technological Advice (SBSTA), UNFCCC.
Sietz, S., 2013. Indigenous Peoples and the process of decentralization: Conflicting interests regarding upland resource management in Palawan Province/Philippines (Occasional Paper No. No. 13). Southeast Asian Studies at the University of Freiburg, Freiburg, Germany.
Sniffer, 2012. Climate change adaptation-related indicators (Final Report No. ER23). Sniffer - knowledge brokers for a resilient Scotland, Scotland.
Stucki, V., Smith, M., 2010. Integrated Approaches to Natural Resources Management in Practice: The Catalyzing Role of National Adaptation Programmes for Action. AMBIO 40, 351–360. doi:10.1007/s13280-010-0097-1
UKCIP, 2001. Socio-economic scenarios for climate change impact assessment - A guide to their use in the UK Climate Impacts Programme. UK Climate Impacts Programme (UKCIP), Oxford, UK.

140
UNCTAD, 2012. World Investment Report 2012. United Nations Conference on Trade and Development (UNCTAD), Geneva, Switzerland.
UNDP, 2014. Human Development Report 2014 - Sustaining Human Progress: Reducing Vulnerabilities and Building Resilience. United Nations Development Programme (UNDP), New York, NY.
UNDP-UNEP, 2011. Mainstreaming climate change adaptation into development planning: A guide for practitioners. UNDP-UNEP Poverty Environment Initiative (PEI).
UNEP, 2011. IEA Training Manual Volume Two - Climate Change Vulnerability and Impact Assessment in Cities. United Nations Environment Programme (UNEP).
UNESCAP, 2011. Economic and Social Survey of Asia and the Pacific 2011. UNESCAP, Bangkok, Thailand.
UNFCCC, 2012. The National Adaptation Plan Process - A brief overview (Least Developed Countries (LDC) Expert Group). United Nations Framework Convention on Climate Change (UNFCCC).
UNFCCC, 2008. Compendium on Methods and Tools to Evaluate Impacts of, and Vulnerability and Adaptation to, Climate Change. United Nations Framework Convention on Climate Change.
UNIDO, 2011. Industrial Development Report 2011. United Nations Industrial Development Organization, Vienna, Austria.
UNPEI, 2009. Mainstreaming Poverty-Environment Linkages into Development Planning: A Handbook for Practitioners. UNDP-UNEP Poverty Environment Initiative (PEI), Nairobi, Kenya.
World Bank, 2012. Inclusive Green Growth: The Pathway to Sustainable Development. World Bank, Washington, D.C.
World Bank, 2010. Mainstreaming adaptation to climate change in agriculture and natural resources management projects (Guidance Note No. 1). World Bank, Washington, D.C.
World Bank, 2000. Beyond Economic Growth – Meeting the Challenges of Global Development. World Bank, Washington, D.C.
World Bank, 1996. Performance Monitoring Indicators Handbook (World Bank Technical Paper No. No. 334). World Bank, Washington, D.C.
WWF, 2009. The Greater Mekong and Climate Change: Biodiversity, ecosystem services and development at risk. World Wide Fund Greater Mekong Program.
Yap, J.T., Majuca, R.P., 2013. Aspirations and Challenges for Economic and Social Development in the Philippines Toward 2030 (Discussion Paper No. DP 2013-27). Philippine Institute for Development Studies.

141
Annex C: List and description of key illustrative adaptation/development measures, options, and tracks
The goal of this Annex is to provide a suggested template for the identification and evaluation of potential adaptation options. The point of departure are the various sectors and systems that have emerged from the Phase I Eco-town project as likely requiring future adaptation to climate change. For the purposes of this Annex, these sectors and systems can be collapsed into three major adaptation tracks, namely: 1) sustainable infrastructure, 2) natural resource management, and 3) general resilience-building. An overview of each track is provided in the immediate subsections that follow below. In addition, the accompanying table templates offer an illustrative set of adaptation measures based on the adaptation literature review in Annex B and authors’ judgment, together with a proposed set of evaluation criteria (see an sample List of References subsection at the end of this Annex for documents containing adaptation option lists). An overview of the structure of these table templates is provided in the second subsection of this Annex. An illustrative example of how these table templates could be completed is provided in the last subsection of this Annex.
C.1 Overview of Adaptation Tracks
• Track 1: Sustainable Infrastructure: Sustainable infrastructure refers to the development of infrastructure across relevant sectors that facilitate progress towards the goals of a green economy. Key sectors include energy, transport, building, manufacturing, water/sanitation/irrigation, and public health. Sustainable Infrastructure is an emerging concept that seeks integrated solutions in watershed master-planning, green buildings, optimizing water reuse, reclaiming urban spaces, green streets initiatives, and sustainable master-planning. The ultimate aim is to affect a sustainable transformation of the built environment at the provincial level in the Philippines. Table C-1 provides an overview of potential adaptation measures together with key criteria for assessment.
• Track 2: Natural resource management: National resource management refers to the management of natural resources such as water, land, soils, plants, animals, and fish. It brings a strong emphasis on the protocols and systems necessary for an improvement in the quality of life for current and future generations of Kenyans. For this track, CRGG-compatible adaptation measures account for the key linkages between ecosystems and the communities that depend on the services that they provide. Table C-2 provides an overview of potential adaptation measures together with key criteria for assessment.
• Track 3: Resilience-building: Resilience-building refers to the incorporation of risks associated with climate change into development planning. The aim of this track is to contribute to climate-resilient green growth and poverty reduction by reducing the impacts of climate change. Resilience building is intended as a proactive approach to reduce vulnerability by integrating information about emerging climate change risks into the green growth framework and implementation arrangements. Such a track may be urgently needed because adverse climate change impacts are already being experienced in the Philippines, as noted by Phase I Eco-town project results, and will render climate-resilient green growth goals related to poverty reduction

142
and good governance more difficult to achieve. Moreover, this track will emphasize a shift to a set of activities that can limit or avoid the adverse effect of climatic hazards so that the costs of post-disaster responses are lessened. Table C-3 provides an overview of potential adaptation measures together with key criteria for assessment.
C.2 Overview of Table Templates
The templates provided in Tables C-2, C-3, and C-4 are intended to be a potential starting point for strategizing about the CRGG pathway discussed in an earlier chapter. That is, the specific options and measures listed in these tables merely reflect the authors’ judgment about potentially viable strategies at the provincial scale in the Philippines, based on our review of Phase I Eco-town project results and other national policy development documents. In other words, the 122 options listed are not meant to be proscriptive but simply a potentially useful starting point to facilitate stakeholder discussions during Ecotown Phase 2 activities. The ultimate list of adaptation measures developed during Phase 2 activities will necessarily be endogenous to the process itself and not the product of the present framework document.
The templates contain two types of information. The leftmost three columns contain an adaptation classification system relative to each Track. Each adaptation strategy occupies a distinct row that is characterized by the sector/system, a unique code, and a brief description of the option. The next eight columns contain the criteria against which each option will be evaluated. A total of 8 criteria are recommended; while additional criteria could in principle be included, as a practical matter this tends to render the criteria scoring and assessment process more difficult, with incommensurate returns on the insight gained from including the additional criteria. The rightmost column is a place for notes and comments that are important for understanding the underlying motivation and context for the option, as well as understanding why an option was scored in a particular way, or provides references for the option.
Completing the templates is at the heart of the overall identification of priority adaptation options, and while straightforward, is likely to be challenging. At the end of the adaptation assessment process, each of the seven cells to the right of each option should be filled with scores that more or less represent a provincial stakeholder consensus. While there is flexibility in the nature of the scores themselves, our recommendation is that, unless quantitative estimates are clearly preferred, qualitative scores are used.
C.3 Illustrative Example of Completion of Table Templates
The context for this example is an illustrative island province in the Philippines with significant exposure to climate change impacts. This province has a diversified economy; a population of several million people including a large proportion of low-income households; and a total area of several thousand square kilometers. The province produces millions of pesos worth of agricultural products such as coconuts, rice, sugar, citrus fruits, and other products. Tourism is increasing to its ecotourism spots, aggressively under development. Levels of development throughout the province vary, with some towns being relatively industrialized most others continuing to engage in agricultural production/businesses and small-scale industries. Natural resources consist of several tall mountains, dozens of rivers, high capacity aquifers, several hundred kilometers of
143
shoreline, and roughly a quarter of the province being heavily forested. Agricultural activities take place on nearly a third of the total area. Several bays offer abundant fishing grounds producing catches of several hundred tonnes per year. The island has a considerable road and power infrastructure (several low efficiency oil-fired stations).
Moreover, the above province context has significant exposure of climate change risks to crop productivity impacts, fisheries, tourism, coastal zones, physical infrastructure, and sustainable livelihoods. As an example of the outcome of the process for completion of the table templates, several of the adaptation options for this illustrative province have been scored for each of the three tracks. In this example, for criteria 1 through 7, a range of “-” through “+/-” to “+++” was used to score each criterion, with +++ meaning highly positive with regard to that criterion. Criteria number eight in this example, “Time for Implementation”, is evaluated as “short-term”, meaning 1-3 years, “medium-term”, meaning 4 to 12 years, and “long-term”, meaning 13 to perhaps 50 years. Again, these definitions are used for illustration only, and can be adjusted to suit the needs of a particular CRGG process. The completed example is shown in Table C-1. The “Notes” column briefly describes key aspect underlying the final scoring.

144
Tabl
e C-
1: I
llust
rativ
e Ex
ampl
e of
com
plet
ed A
dapt
atio
n O
ptio
n Te
mpl
ate
for S
elec
ted
Opt
ions
156
Eval
uatio
n Cr
iteria
1 2
3 4
5 6
7 8
Trac
k Su
b-se
ctor
or
syst
em
No.
G
reen
gro
wth
opt
ion
Pote
ntia
l ef
ficac
y
Econ
omic
gr
owth
po
tent
ial
Pove
rty
alle
viat
ion
pote
ntia
l
Impl
e-
men
tatio
n co
sts
New
in
stitu
tiona
l ca
paci
ty
requ
irem
ents
Prot
ectio
n of
mos
t vu
lner
able
Syne
rgie
s w
ith G
HG
m
itiga
tion
Tim
e fo
r Im
ple-
men
tatio
n N
otes
Infr
a-st
ruct
ure
Tran
spor
t T-
3
Coor
dina
te e
mer
genc
y ev
acua
tion
and
supp
ly
tran
spor
tatio
n ro
utes
with
em
erge
ncy
prep
ared
ness
syst
ems
to e
nsur
e ca
paci
ty a
nd re
silie
nce
of e
scap
e ro
utes
com
prom
ised
by
natu
ral d
isast
ers r
elat
ed to
cl
imat
e ch
ange
+++
+/-
+/-
+++
+++
++
- Sh
ort-
term
Upd
atin
g of
cur
rent
pr
ovin
cial
disa
ster
risk
m
itiga
tion
plan
Publ
ic
heal
th
H-6
Adap
t the
bui
lt en
viro
nmen
t to
mak
e co
mm
uniti
es m
ore
wal
kabl
e an
d pe
dest
rian
frie
ndly
, and
ens
ure
cons
ider
atio
n of
clim
ate
chan
ge p
lann
ing
++
+/-
- ++
+ ++
-
- Lo
ng-t
erm
In
tegr
ate
with
Sm
art G
row
th
Plan
ning
dia
logu
es
Nat
ural
Re
sour
ce
Man
age-
men
t
Agric
ultu
re
A-1
Crea
te in
cent
ives
and
pr
ogra
ms
to tr
ansf
er
know
ledg
e an
d te
chno
logi
es
to a
ssist
farm
ers w
ith n
ew
prod
uctio
n m
etho
ds,
drou
ght t
oler
ant s
peci
es, e
tc.
+ +
++
- ++
+/
- ++
+ M
ediu
m-
term
The
intr
oduc
tion
and
diss
emin
atio
n of
clim
ate-
resi
lient
pr
oduc
tion
met
hods
and
te
chno
logi
es a
re c
entr
al to
the
deve
lopm
ent o
f loc
al c
opin
g st
rate
gies
at t
he s
mal
l far
m sc
ales
Fore
stry
F-
1
Asse
ss g
ene
man
ipul
atio
n w
ork
to a
dapt
exi
stin
g tr
ee
spec
ies t
o w
arm
er/d
rier
clim
ate
and/
or a
brup
t ch
ange
s in
wea
ther
pat
tern
s an
d/or
new
pes
ts th
rivin
g in
ch
ange
d cl
imat
ic c
ondi
tions
++
- +/
- ++
-
+ ++
+ Lo
ng-t
erm
The
rese
arch
inst
itutio
ns lo
cate
d in
the
prov
ince
incl
ude
Inte
rnat
iona
l Ric
e Re
sear
ch In
stitu
te (I
RRI),
ASE
AN C
ente
r fo
r Bio
dive
rsity
(ACB
) and
the
Sout
heas
t Asia
n Re
gion
al c
ente
r for
G
radu
ate
Stud
y an
d Re
sear
ch in
Ag
ricul
ture
(SEA
RCA)
; whi
ch h
ave
adeq
uate
cap
acity
for t
he a
sses
smen
t
Resi
lienc
e Bu
ildin
g
Gend
er
equi
ty
G-1
Prov
ide
outr
each
to
wom
en a
nd g
irls t
o pl
an
and
prep
are
for c
limat
e ch
ange
+/-
- +/
- ++
+
++
- M
ediu
m-
term
Inte
grat
e cl
imat
e ch
ange
co
ncer
ns in
to o
ngoi
ng
educ
atio
nal o
utre
ach
prog
ram
mes
for w
omen
and
gi
rls
Disa
ster
Ri
sk
Man
age-
men
t
DRM
-5
Deve
lop
regi
onal
ly
cons
isten
t zon
ing
and
coor
dina
ted
emer
genc
y re
spon
se p
lans
+++
+ +/
- +
++
++
+/-
Shor
t-to
- M
ediu
m-
term
To b
e in
corp
orat
ed in
to
inte
grat
ed c
oast
al zo
ne
man
agem
ent a
nd in
tegr
ated
w
ater
reso
urce
pla
nnin
g pr
ogra
mm
es

145
Tabl
e C-
2: C
limat
e R
esili
ent G
reen
Gro
wth
Ada
ptat
ion
Opt
ions
for T
rack
1, I
nfra
stru
ctur
e
Clim
ate
Res
ilien
t G
reen
Gro
wth
Str
ateg
y D
evel
op
men
t in
th
e P
hili
pp
ines
158
Clim
ate
Resi
lient
Gre
en G
row
th S
trat
egy
Deve
lopm
ent i
n th
e Ph
ilipp
ines
Tabl
e C-
2: C
limat
e Re
silie
nt G
reen
Gro
wth
Ada
ptat
ion
Opt
ions
for T
rack
1, I
nfra
stru
ctur
e
12
34
56
78
Sub-
sect
or o
r sy
stem
No.
Gree
n gr
owth
opt
ion
Pote
ntia
l ef
ficac
y
Econ
omic
grow
th
pote
ntia
l
Pove
rty
alle
viat
ion
pote
ntia
lIm
plem
ent-
atio
n co
sts
New
in
stitu
tiona
l ca
pacit
y re
quire
men
ts
Prot
ectio
n of
m
ost
vuln
erab
le
Syne
rgie
s with
GH
G m
itiga
tion
Tim
e fo
r Im
ple-
men
tatio
nN
otes
E-1
Prom
ote
win
d en
ergy
dev
elop
men
t thr
ough
reso
urce
map
ping
, win
dfar
m
pilo
t pro
ject
ven
ture
s, p
ublic
/priv
ate
partn
ersh
ips
E-2
Iden
tify
key
ener
gy in
frast
ruct
ure
(net
wor
ks, p
ipel
ines
, pow
er li
nes
or
poin
ts o
f pro
duct
ion
or d
istri
butio
n) th
at m
ay b
e af
fect
ed b
y cl
imat
e ch
ange
impa
cts
E-3
Map
loca
tions
of e
nerg
y in
frast
ruct
ure
vuln
erab
le to
floo
ds, s
torm
su
rges
, ext
rem
e th
erm
al o
r pre
cipi
tatio
n ev
ents
, wild
fire,
etc
.
E-4
Iden
tify
cons
truct
ion
mat
eria
ls a
nd d
esig
n w
eakn
esse
s in
exi
stin
g en
ergy
in
frast
ruct
ure
in th
e fa
ce o
f an
incr
easi
ng fr
eque
ncy
of e
xtre
me
even
ts
E-5
Inco
rpor
ate
mod
ifica
tions
to e
nerg
y in
frast
ruct
ure
to in
crea
se re
silie
ncy
of th
e re
st o
f the
sys
tem
dur
ing
rout
ine
mai
nten
ance
and
upg
rade
s
E-6
Iden
tify
redu
ndan
cies
and
re-ro
utin
g po
tent
ial i
n in
ene
rgy
infra
stru
ctur
e fo
r em
erge
ncy
switc
hing
sho
uld
prim
ary
syst
ems
go d
own
E-7
Deve
lop
adeq
uate
insu
ranc
e in
stru
men
ts to
ens
ure
that
reco
nstru
ctio
n of
en
ergy
infra
stru
ctur
e ca
n be
exp
edite
d in
the
even
t of a
clim
ate
rela
ted
disa
ster
T-1
Requ
ire/e
nabl
e m
etro
polit
an p
lann
ing
orga
niza
tions
to ta
ke c
limat
e ch
ange
into
acc
ount
in fu
ture
road
net
wor
ks
T-2
Deve
lop
a st
rate
gy fo
r man
agin
g th
e re
treat
of (
smal
l and
larg
e) p
orts
an
d as
soci
ated
infra
stru
ctur
e, s
uch
as ra
il an
d ro
ads
from
zone
s of
hig
h vu
lner
abili
ty (e
.g.,
coas
tal a
reas
)
T-3
Coor
dina
te e
mer
genc
y ev
acua
tion
and
supp
ly tr
ansp
orta
tion
rout
es w
ith
emer
genc
y pr
epar
edne
ss s
yste
ms
to e
nsur
e ca
paci
ty a
nd re
silie
nce
of
esca
pe ro
utes
com
prom
ised
by
an in
crea
sed
frequ
ency
of n
atur
al
disa
ster
s re
late
d to
clim
ate
chan
ge
T-4
Revi
ew e
xist
ing
coas
tal z
one
deve
lopm
ent p
lans
for c
over
age
of s
ea
leve
l ris
e &
oth
er c
limat
e-re
late
d im
pact
s on
tran
spor
tatio
n
Ener
gy
Tran
spor
t
Eval
uatio
n Cr
iteria

146
159
12
34
56
78
Sub-
sect
or o
r sy
stem
No.
Gree
n gr
owth
opt
ion
Pote
ntia
l ef
ficac
y
Econ
omic
grow
th
pote
ntia
l
Pove
rty
alle
viat
ion
pote
ntia
lIm
plem
ent-
atio
n co
sts
New
in
stitu
tiona
l ca
pacit
y re
quire
men
ts
Prot
ectio
n of
m
ost
vuln
erab
le
Syne
rgie
s with
GH
G m
itiga
tion
Tim
e fo
r Im
ple-
men
tatio
nN
otes
B-2
Deve
lop
impr
oved
bui
ldin
g co
des
for e
nerg
y ef
ficie
ncy
that
acc
ount
for
upda
tes
in m
axim
um te
mpe
ratu
res
and
othe
r clim
atic
con
ditio
ns
B-3
Esta
blis
h a
prog
ram
me
for t
rain
ing
of b
uild
ing
code
and
oth
er o
ffici
als
in
ener
gy c
ode
enfo
rcem
ent
B-4
Prov
ide
supp
ort f
or e
nerg
y ef
ficie
nt c
omm
uniti
es lo
ng-ra
nge
plan
ning
, pa
rticu
larly
aro
und
"sm
art g
row
th" c
once
pts
that
hav
e st
rong
syn
ergi
es
with
clim
ate-
resi
lienc
y an
d gr
een
grow
th
B-5
Prom
otio
n an
d In
cent
ives
for I
mpr
oved
Des
ign
and
Cons
truct
ion
(e.g
. LE
ED[4
], gr
een
build
ings
)
M-1
Iden
tify
key
man
ufac
turin
g in
frast
ruct
ure
(fact
orie
s, d
edic
ated
tra
nspo
rt/po
wer
line
s, e
tc) t
hat m
ay b
e af
fect
ed b
y cl
imat
e ch
ange
im
pact
s
M-2
Map
loca
tions
of m
anuf
actu
ring
infra
stru
ctur
e th
at a
re v
ulne
rabl
e to
flo
ods,
sto
rm s
urge
s, e
xtre
me
ther
mal
or p
reci
pita
tion
even
ts, w
ildfir
e,
etc.
M-3
Iden
tify
cons
truct
ion
mat
eria
ls a
nd d
esig
n w
eakn
esse
s in
man
ufac
turin
g in
frast
ruct
ure
in th
e fa
ce o
f an
incr
easi
ng fr
eqiu
ency
of e
xtre
me
even
ts
M-4
Inco
rpor
ate
mod
ifica
tions
to m
anuf
actu
ring
infra
stru
ctur
e to
incr
ease
re
silie
ncy
durin
g ro
utin
e m
aint
enan
ce a
nd u
pgra
des
M-5
Adeq
uate
ly in
sure
man
ufac
turin
g in
frast
ruct
ure
to e
nsur
e th
at
reco
nstru
ctio
n ca
n oc
cur i
n th
e ev
ent o
f a c
limat
e re
late
d di
sast
er
Build
ings
Man
ufac
turin
g
Eval
uatio
n Cr
iteria

147
160
12
34
56
78
Sub-
sect
or o
r sy
stem
No.
Gree
n gr
owth
opt
ion
Pote
ntia
l ef
ficac
y
Econ
omic
grow
th
pote
ntia
l
Pove
rty
alle
viat
ion
pote
ntia
lIm
plem
ent-
atio
n co
sts
New
in
stitu
tiona
l ca
pacit
y re
quire
men
ts
Prot
ectio
n of
m
ost
vuln
erab
le
Syne
rgie
s with
GH
G m
itiga
tion
Tim
e fo
r Im
ple-
men
tatio
nN
otes
WSI
-1M
anag
e st
orm
wat
er o
nsite
, whi
le u
tilizi
ng lo
w-im
pact
dev
elop
men
t te
chni
ques
WSI
-2De
velo
p re
gula
tions
for d
evel
opm
ents
to c
aptu
re a
nd tr
eat s
torm
wat
er
onsi
te fr
om th
e de
sign
10-
year
24-
hour
sto
rm, u
pdat
ed to
acc
ount
for
clim
ate
chan
ge
WSI
-3Cr
eate
a lo
w-im
pact
dev
elop
men
t uni
t to
assi
st d
evel
oper
s re
duce
im
pact
to p
rote
ct w
ater
qua
lity,
pre
vent
floo
ding
and
faci
litat
e w
ater
re-
use
by m
anag
ing
stor
m w
ater
ons
ite
WSI
-4In
crea
se th
e us
e of
nat
ural
sto
rm w
ater
am
elio
ratio
n te
chni
ques
(man
-m
ade
pond
s, v
eget
ated
sw
ales
, mar
shes
, etc
.)
WSI
-5In
corp
orat
e fu
ture
sea
leve
l ris
e co
ncer
ns a
nd o
ther
clim
ate
chan
ge
impa
cts
in p
riorit
izatio
n fo
r fun
ding
, des
ign,
and
pos
t-pro
ject
ope
ratio
n an
d m
aint
enan
ce.
WSI
-6Ev
alua
te a
nd im
prov
e ca
paci
ty o
f sto
rm w
ater
infra
stru
ctur
e fo
r hig
h in
tens
ity ra
infa
ll ev
ents
that
exc
eed
prev
ious
des
ign
limits
WSI
-7In
crea
se m
aint
enan
ce a
nd c
lean
ing
of g
utte
rs, d
rain
ages
ditc
hes
and
culv
erts
con
sist
ent w
ith in
crea
sed
frequ
ency
of w
eath
er e
vent
s
WSI
-8De
velo
p ne
w p
lann
ing
prot
ocol
s to
man
age
rese
rvoi
rs in
resp
onse
to
chan
ges
in te
mpe
ratu
re a
nd p
reci
pita
tion
regi
mes
WSI
-9In
crea
se w
ater
use
effi
cien
cy a
nd w
ater
recy
clin
g in
resi
dent
ial a
nd
com
mer
cial
bui
ldin
gs
WSI
-10
Empl
oy w
ater
con
serv
atio
n te
chni
ques
suc
h as
reus
ing
was
tew
ater
from
te
rtiar
y tre
atm
ent p
lant
s, c
iste
rns
and
rain
bar
rels
WSI
-11
Incr
ease
the
shar
e of
indu
stria
l wat
er u
se to
recy
cled
wat
er
WSI
-12
Incr
ease
wat
er u
se e
ffici
ency
and
wat
er re
cycl
ing
in in
dust
rial a
nd p
ower
st
atio
n co
olin
g
WSI
-13
Incr
ease
cap
acity
of w
ater
re-u
se in
frast
ruct
ure
Wat
er,
sani
tatio
n, a
nd
irrig
atio
n
Eval
uatio
n Cr
iteria

148
161
12
34
56
78
Sub-
sect
or o
r sy
stem
No.
Gree
n gr
owth
opt
ion
Pote
ntia
l ef
ficac
y
Econ
omic
grow
th
pote
ntia
l
Pove
rty
alle
viat
ion
pote
ntia
lIm
plem
ent-
atio
n co
sts
New
in
stitu
tiona
l ca
pacit
y re
quire
men
ts
Prot
ectio
n of
m
ost
vuln
erab
le
Syne
rgie
s with
GH
G m
itiga
tion
Tim
e fo
r Im
ple-
men
tatio
nN
otes
H-1
Adap
t the
bui
lt en
viro
nmen
t to
redu
ce th
e im
pact
s of
clim
ate
chan
ge o
n hu
man
hea
lth (e
.g.,
decr
ease
hea
t isl
and
effe
cts
in u
rban
are
as th
roug
h gr
een
roof
s)
H-2
Requ
ire c
onsi
dera
tion
of h
uman
hea
lth a
spec
ts a
ssoc
iate
d w
ith c
limat
e ch
ange
in b
uild
ing
guid
elin
es a
nd u
rban
pla
nnin
g
H-3
Incr
ease
urb
an v
eget
atio
n- p
lant
tree
s, ro
of g
arde
ns th
roug
h pl
anne
d gr
owth
and
loca
l ord
inan
ces
prot
ectin
g ve
geta
tion
and
open
spa
ce.
H-4
Enac
t pla
nnin
g la
ws
that
pre
vent
new
-con
stru
ctio
n in
zone
s (e
.g.,
flood
plai
ns) t
hat a
re h
ighl
y vu
lner
able
to c
limat
e ch
ange
impa
cts
H-5
Prov
ide
econ
omic
ince
ntiv
es fo
r bui
ldin
g in
non
- to
low
-risk
zone
s
H-6
Adap
t the
bui
lt en
viro
nmen
t to
mak
e co
mm
uniti
es m
ore
wal
kabl
e an
d pe
dest
rian
frien
dly,
and
ens
ure
cons
ider
atio
n of
clim
ate
chan
ge in
pl
anni
ng
H-7
Augm
ent v
ecto
r sur
veill
ance
and
con
trol p
rogr
ams
for v
ecto
r bor
ne
dise
ases
that
are
like
ly to
bec
ome
mor
e co
mm
on o
r wid
espr
ead
with
cl
imat
e ch
ange
H-8
Desi
gn p
rogr
ams
to m
onito
r for
the
appe
aran
ce o
f vec
tor-
and
wat
erbo
rne
dise
ases
follo
win
g flo
ods
and
stor
ms
H-9
Deve
lop
synd
rom
ic s
urve
illan
ce p
rogr
am to
iden
tify
outb
reak
s of
w
ater
born
e di
seas
es w
hose
freq
uenc
y m
ay in
crea
se w
ith c
limat
e ch
ange
H-10
Enha
nce
prep
ared
ness
pro
gram
mes
for d
isea
se p
reve
ntio
n of
vec
tor-
born
e an
d w
ater
-bor
ne d
isea
ses
follo
win
g flo
ods
and
stor
ms
H-11
Incr
ease
ove
rall
effic
ienc
y an
d re
al-ti
me
sens
itivi
ty o
f the
cur
rent
su
rvei
llanc
e sy
stem
s to
mon
itor a
nd re
spon
d to
dis
ease
eve
nts
Not
esNo
te 1
:
Publ
ic h
ealth
Eval
uatio
n Cr
iteria

149
Tabl
e C-
3: C
limat
e R
esili
ent G
reen
Gro
wth
Ada
ptat
ion
Opt
ions
for T
rack
2, N
atur
al R
esou
rce
Man
agem
ent
Clim
ate
Res
ilien
t G
reen
Gro
wth
Str
ateg
y D
evel
op
men
t in
th
e P
hili
pp
ines
162
Clim
ate
Resi
lient
Gre
en G
row
th S
trat
egy
Deve
lopm
ent i
n th
e Ph
ilipp
ines
Tabl
e C-
3: C
limat
e Re
silie
nt G
reen
Gro
wth
Ada
ptat
ion
Opt
ions
for T
rack
2, N
atur
al R
esou
rce
Man
agem
ent
12
34
56
78
Sub-
sect
or o
r sy
stem
No.
Gree
n gr
owth
opt
ion
Pote
ntia
l ef
ficac
y
Econ
omic
grow
th
pote
ntia
l
Pove
rty
alle
viat
ion
pote
ntia
lIm
plem
ent-
atio
n co
sts
New
in
stitu
tiona
l ca
pacit
y re
quire
men
ts
Prot
ectio
n of
m
ost
vuln
erab
le
Syne
rgie
s with
GH
G m
itiga
tion
Tim
e fo
r Im
ple-
men
tatio
nN
otes
Agric
ultu
re
A-1
Crea
te in
cent
ives
and
pro
gram
s to
tran
sfer
kno
wle
dge
and
tech
nolo
gies
to
ass
ist f
arm
ers
with
new
pro
duct
ion
met
hods
that
refle
ct c
limat
e re
silie
ncy
crite
ria, e
.g.,
drou
ght t
oler
ant s
peci
es, e
tc.
A-2
Mod
ify fa
rmin
g pr
actic
es to
con
serv
e so
il m
oist
ure
and
nutri
ents
, red
uce
runo
ff an
d co
ntro
l soi
l ero
sion
A-3
Eval
uate
the
effe
cts
of c
limat
e ch
ange
on
past
ure
and
rang
elan
ds,
iden
tify
man
agem
ent s
trate
gies
to a
id in
ada
ptat
ion
(rota
tion,
sto
ckin
g le
vels
, res
tora
tion,
gra
zing
syst
ems,
alte
rnat
ive
or m
ixed
live
stoc
k, e
tc.)
A-4
Use
mob
ile te
leco
mm
unic
atio
ns te
chno
logy
to e
nsur
e th
at fa
rmer
s,
espe
cial
ly in
rem
ote,
rura
l loc
atio
ns h
ave
acce
ss to
mos
t up-
to-d
ate
wea
ther
fore
cast
s
A-5
Iden
tify
curre
nt a
ltern
ate
crop
s th
at re
spon
d w
ell t
o ho
tter a
nd/o
r dry
er
tem
pera
ture
s
A-6
Impr
ove
adop
tion
of ri
sk m
anag
emen
t and
bus
ines
s m
anag
emen
t ski
lls
by fa
rmer
s an
d ra
nche
rs
A-7
Redu
ce w
ater
dem
and
for i
rriga
tion
by c
hang
ing
the
crop
ping
cal
enda
r, cr
op m
ix, i
rriga
tion
met
hod,
and
are
a pl
ante
d co
nsis
tent
with
out
com
es
of re
gion
al c
limat
e m
odel
ing
A-8
Impl
emen
t ear
ly w
arni
ng s
yste
ms
for e
xtre
me
even
ts to
ben
efit
farm
ers
Eval
uatio
n Cr
iteria

150
163
12
34
56
78
Sub-
sect
or o
r sy
stem
No.
Gree
n gr
owth
opt
ion
Pote
ntia
l ef
ficac
y
Econ
omic
grow
th
pote
ntia
l
Pove
rty
alle
viat
ion
pote
ntia
lIm
plem
ent-
atio
n co
sts
New
in
stitu
tiona
l ca
pacit
y re
quire
men
ts
Prot
ectio
n of
m
ost
vuln
erab
le
Syne
rgie
s with
GH
G m
itiga
tion
Tim
e fo
r Im
ple-
men
tatio
nN
otes
F-1
Asse
ss g
ene
man
ipul
atio
n w
ork
to a
dapt
exi
stin
g tre
e sp
ecie
s to
w
arm
er/d
rier c
limat
e an
d/or
abr
upt c
hang
es in
wea
ther
pat
tern
s an
d/or
ne
w p
ests
thriv
ing
in c
hang
ed c
limat
ic c
ondi
tions
F-2
Incr
ease
floo
d pr
otec
tion
(e.g
., le
vees
, res
ervo
irs) f
or k
ey fo
rest
pr
oduc
tion
site
s
F-3
Asse
ss p
oten
tial n
ew p
est p
robl
ems
unde
r clim
ate
chan
ge a
nd th
eir
impa
ct to
fore
st p
rodu
ctio
n.
F-4
Rese
arch
alte
rnat
ive
met
hods
for a
ddre
ssin
g ne
w fo
rest
pes
ts a
nd
inva
sive
spe
cies
thro
ugh
impr
oved
man
agem
ent t
echn
ique
s an
d/or
bi
olog
ical
con
trols
F-5
Com
pile
and
eva
luat
e ex
istin
g re
sear
ch o
n th
e ef
fect
s of
a w
arm
er
and/
or d
ryer
clim
ate
on fo
rest
eco
syst
ems
and
com
mer
cial
ly g
row
n tre
e sp
ecie
s an
d po
tent
ial i
mpa
cts
on th
e fo
rest
pro
duct
s an
d tre
e in
dust
ries
F-6
Deve
lop
a be
tter u
nder
stan
ding
of l
ikel
y im
pact
s on
tree
spe
cies
, ev
alua
te s
trate
gies
and
beg
in to
impl
emen
t ris
k m
anag
emen
t stra
tegi
es
to e
nsur
e pe
rpet
uatio
n of
tree
gen
etic
reso
urce
s
F-7
Deve
lop
a sy
stem
of c
limat
e ch
ange
indi
cato
rs fo
r for
ests
and
impl
emen
t an
ear
ly w
arni
ng s
yste
m fo
r maj
or fo
rest
dis
rupt
ions
F-8
Adap
t for
est c
onse
rvat
ion,
man
agem
ent a
nd fo
rest
pro
duct
s in
dust
ries
to
seve
re s
torm
s an
d dr
ough
t, in
vasi
ve s
peci
es a
nd p
ests
and
oth
er c
limat
e ch
ange
s im
pact
s
F-9
Iden
tify
and
mai
ntai
n pr
otec
ted
fore
st a
reas
that
may
be
capa
ble
of
sust
aini
ng s
peci
es th
at m
ay b
e at
-risk
und
er c
limat
e ch
ange
F-10
Prom
ote
refo
rest
atio
n an
d af
fore
stat
ion
of m
argi
nal l
ands
to in
crea
se
soil
moi
stur
e re
tent
ion,
pro
vide
sha
de a
nd in
crea
se h
abita
t for
spe
cies
un
der s
tress
F-11
Sear
ch fo
r alte
rnat
e ec
onom
ic v
entu
res
to e
ither
repl
ace
the
impa
cted
in
dust
ry o
r pla
nt o
ther
tree
spe
cies
that
do
wel
l in
the
chan
ged
clim
ate.
Fore
stry
Eval
uatio
n Cr
iteria

151
164
12
34
56
78
Sub-
sect
or o
r sy
stem
No.
Gree
n gr
owth
opt
ion
Pote
ntia
l ef
ficac
y
Econ
omic
grow
th
pote
ntia
l
Pove
rty
alle
viat
ion
pote
ntia
lIm
plem
ent-
atio
n co
sts
New
in
stitu
tiona
l ca
pacit
y re
quire
men
ts
Prot
ectio
n of
m
ost
vuln
erab
le
Syne
rgie
s with
GH
G m
itiga
tion
Tim
e fo
r Im
ple-
men
tatio
nN
otes
WRM
-1Sa
fegu
ard
fresh
wat
er s
uppl
y ag
ains
t con
tam
inat
ion,
deg
rada
tion
and
loss
WRM
-2Id
entif
y m
etho
ds a
nd In
cent
ives
for s
torm
wat
er c
olle
ctio
n an
d re
-use
by
indu
stry
and
hou
seho
lds
unde
r a c
hang
ed c
limat
e
WRM
-3Es
tabl
ish
wat
er c
onse
rvat
ion,
recl
amat
ion,
recy
clin
g, a
nd re
use
goal
s an
d an
acc
ount
abili
ty s
yste
m to
ens
ure
goal
s ar
e m
et
WRM
-4St
reng
then
regu
latio
ns g
over
ning
wat
er q
ualit
y, e
.g.,
agric
ultu
ral r
un-o
ff,
indu
stria
l was
te w
ater
, site
dev
elop
men
t, et
c.
WRM
-5St
reng
then
and
enf
orce
wat
ersh
ed c
onta
min
atio
n pr
otec
tion
law
s
FI-1
Asse
ss th
e ef
fect
iven
ess
of c
urre
nt m
arin
e co
nser
vatio
n st
rate
gies
in th
e fa
ce o
f clim
ate
chan
ge
FI-2
Cond
uct r
esea
rch
and
inte
grat
ed m
anag
emen
t of f
ishe
ries
with
in c
oast
al
and
open
mar
ine
ecos
yste
ms
FI-3
Pred
ict m
arin
e lif
e vi
abili
ty a
nd b
iodi
vers
ity tr
ends
und
er v
ario
us c
limat
e sc
enar
ios
FI-4
Org
anize
of m
arin
e bi
osph
ere
rese
rves
and
pro
tect
ed a
reas
to p
rovi
de
habi
tat o
f mar
ine
mam
mal
s
FI-5
Rese
arch
, mea
sure
and
mon
itor c
limat
e ef
fect
s on
cor
al re
efs.
Dev
elop
hi
gher
resi
lienc
e th
roug
h m
anag
emen
t of h
uman
act
iviti
es
FI-6
Use
emer
ging
pre
dict
ive
info
rmat
ion
rela
ted
to n
atur
al c
limat
e va
riabi
lity
(e.g
., EN
SO) t
o su
ppor
t fis
hery
man
agem
ent a
nd p
lann
ing.
FI-7
Asse
ss c
limat
e im
pact
incl
udin
g se
a le
vel r
ise,
dro
ught
, etc
. on
habi
tat
for f
ishe
ries
in e
arly
life
sta
ges
FI-8
Inco
rpor
ate
clim
ate
chan
ge in
to fi
sher
ies
man
agem
ent a
nd a
ssis
t fis
hing
co
mm
uniti
es a
nd u
sers
in a
dapt
atio
n
FI-9
Mod
ifiy
and
impr
ove
of th
e te
chno
logy
of t
he fi
shin
g in
dust
ry a
nd
man
agem
ent o
f the
fish
trad
e
FI-1
0In
clud
e in
em
erge
ncy
prep
ared
ness
pla
ns to
sto
ck c
reek
s w
ith fi
sh p
ost-
stor
m a
nd fl
oodi
ng
Fish
erie
s
Wat
er re
sour
ce
man
agem
ent
Eval
uatio
n Cr
iteria

152
165
12
34
56
78
Sub-
sect
or o
r sy
stem
No.
Gree
n gr
owth
opt
ion
Pote
ntia
l ef
ficac
y
Econ
omic
grow
th
pote
ntia
l
Pove
rty
alle
viat
ion
pote
ntia
lIm
plem
ent-
atio
n co
sts
New
in
stitu
tiona
l ca
pacit
y re
quire
men
ts
Prot
ectio
n of
m
ost
vuln
erab
le
Syne
rgie
s with
GH
G m
itiga
tion
Tim
e fo
r Im
ple-
men
tatio
nN
otes
LU-1
Prom
ote
smar
t gro
wth
LU-2
Info
rm p
rope
rty p
urch
aser
s an
d in
vest
ors
rega
rdin
g ris
k of
sea
leve
l ris
e th
at m
ay a
ffect
coa
stal
pro
perty
.
LU-3
Prov
ide
com
preh
ensi
ve d
ata
and
info
rmat
ion
to la
ndow
ners
, pol
icy-
mak
ers,
and
the
publ
ic a
bout
exi
stin
g an
d de
velo
ping
fore
st h
ealth
and
fir
e ha
zard
con
ditio
ns.
LU-4
Incl
ude
onlin
e m
appi
ng c
apab
ility
in p
lann
ing
info
rmat
ion
for m
ultip
le
audi
ence
s in
clud
ing
loca
l gov
ernm
ents
LU-5
Crea
te v
isua
lizat
ion
tool
for s
ea le
vel r
ise
and
asso
ciat
ed h
azar
ds th
at
can
effe
ctiv
ely
com
mun
icat
e to
pol
icym
aker
s th
e ris
ks a
ssoc
iate
d w
ith
coas
tal z
one
deve
lopm
ent u
nder
clim
ate
chan
ge
LU-6
Requ
ire th
at a
dmin
istra
tive
regi
ons
act o
n co
mpr
ehen
sive
pla
nnin
g re
quire
men
ts th
at in
corp
orat
e cl
imat
e ch
ange
con
side
ratio
ns
LU-7
Cond
uct a
sses
smen
t of t
rend
s in
cha
nge
in la
nd u
se a
nd s
tabi
lity
of
natu
ral l
ands
cape
s
LU-8
Stre
ngth
en e
xist
ing
criti
cal a
rea
plan
ning
and
impl
emen
t req
uire
men
ts to
ad
dres
s se
a le
vel r
ise
and
asso
ciat
ed c
oast
al h
azar
ds
LU-9
Guid
e fu
ture
dev
elop
men
t out
of a
reas
vul
nera
ble
to s
ea le
vel r
ise
and
asso
ciat
ed h
azar
ds
LU-1
0En
d pe
rmitt
ing
of n
ew h
ome
or o
ther
con
stru
ctio
n in
are
as v
ulne
rabl
e to
se
a le
vel r
ise
and
asso
ciat
ed c
oast
al h
azar
ds
Land
use
Eval
uatio
n Cr
iteria

153
166
Sub-
sect
or o
r sy
stem
No.
Gree
n gr
owth
opt
ion
Pote
ntia
l ef
ficac
y
Econ
omic
grow
th
pote
ntia
l
Pove
rty
alle
viat
ion
pote
ntia
lIm
plem
ent-
atio
n co
sts
New
in
stitu
tiona
l ca
pacit
y re
quire
men
ts
Prot
ectio
n of
m
ost
vuln
erab
le
Syne
rgie
s with
GH
G m
itiga
tion
Tim
e fo
r Im
ple-
men
tatio
nN
otes
TO-1
Cond
uct a
clim
ate
chan
ge im
pact
ass
essm
ent b
y to
uris
t reg
ion
and
reso
urce
s, w
ith a
focu
s on
the
mos
t eco
logi
cally
vul
nera
ble
sect
ors
and
loca
tions
TO-2
Assi
st th
e to
uris
m in
dust
ry to
bui
ld re
silie
nce
and
capa
city
to a
dapt
to
the
chal
leng
es a
nd o
ppor
tuni
ties
of c
limat
e ch
ange
TO-3
Asse
ss e
ffect
s of
impa
cts
of c
limat
e ch
ange
on
cultu
ral r
esou
rces
and
lif
eway
s an
d th
e re
sulti
ng e
ffect
on
tour
ism
TO-4
Deve
lop
tour
ism
pol
icie
s in
tegr
atin
g ec
onom
ic a
nd re
sour
ce
cons
erva
tion
issu
es in
the
face
of p
oten
tial a
nd o
bser
ved
cons
eque
nces
of
clim
ate
chan
ge
TO-5
Stat
e go
vern
men
t con
side
r way
s to
redu
ce c
limat
e ch
ange
effe
cts
on
wat
er-re
late
d re
crea
tion
and
tour
ism
TO-6
Ensu
re a
ccur
ate
info
rmat
ion
reac
hes
curre
nt a
nd p
oten
tial t
ouris
ts o
n be
havi
ors
and
uses
that
ens
ure
envi
ronm
enta
l qua
lity
and
ecos
yste
m
resi
lienc
y at
pop
ular
trav
el d
estin
atio
ns
TO-7
Impl
emen
t agg
ress
ive
wat
er c
onse
rvat
ion,
ene
rgy
cons
erva
tion
and
effic
ienc
y an
d re
cycl
ing/
was
te m
anag
emen
t at p
opul
ar tr
avel
de
stin
atio
ns
TO-8
Asse
ss th
e ef
fect
s of
clim
ate
chan
ge o
n hu
ntin
g an
d fis
hing
op
portu
nitie
s an
d th
e re
late
d to
uris
m in
dust
ry
TO-9
Asse
ss th
e ef
fect
s of
clim
ate
chan
ge o
n sp
ecia
l des
igna
ted
natu
ral a
reas
th
at a
ttrac
t tou
rists
suc
h na
tiona
l par
ks a
nd fo
rest
s
TO-1
0As
sure
that
all
stat
e pr
ogra
ms
invo
lved
in a
cqui
sitio
n of
, or a
cces
s to
an
d us
e of
, pub
lic la
nds
incl
ude
clim
ate
chan
ge a
dapt
atio
n in
pla
nnin
g an
d de
cisi
on m
akin
g
TO-1
1O
rgan
ize m
arin
e bi
osph
ere
rese
rves
and
pro
tect
ed a
reas
for t
he h
abita
t of
mar
ine
mam
mal
s to
enh
ance
eco
tour
ism
indu
stry
Not
esNo
te 1
:
Tour
ism

154
Tabl
e C-
4: C
limat
e R
esili
ent G
reen
Gro
wth
Ada
ptat
ion
Opt
ions
for T
rack
3, R
esili
ence
bui
ldin
g
Clim
ate
Res
ilien
t G
reen
Gro
wth
Str
ateg
y D
evel
op
men
t in
th
e P
hili
pp
ines
167
Cl
imat
e Re
silie
nt G
reen
Gro
wth
Str
ateg
y De
velo
pmen
t in
the
Phili
ppin
esTa
ble
C-4:
Clim
ate
Resi
lient
Gre
en G
row
th A
dapt
atio
n O
ptio
ns fo
r Tra
ck 3
, Res
ilien
ce b
uild
ing
12
34
56
78
Sub-
sect
or o
r sys
tem
No.
Gree
n gr
owth
opt
ion
Pote
ntia
l ef
ficac
y
Econ
omic
grow
th
pote
ntia
l
Pove
rty
alle
viat
ion
pote
ntia
lIm
plem
ent-
atio
n co
sts
New
in
stitu
tiona
l ca
pacit
y re
quire
men
ts
Prot
ectio
n of
m
ost
vuln
erab
le
Syne
rgie
s with
GH
G m
itiga
tion
Tim
e fo
r Im
ple-
men
tatio
nN
otes
HC-1
Crea
te a
dapt
atio
n tra
inin
g op
portu
nitie
s fo
r tec
hnic
al a
nd p
rofe
ssio
nals
ac
ross
all
sect
ors
HC-2
Out
reac
h to
the
publ
ic a
nd o
ther
s to
pla
n an
d pr
epar
e fo
r clim
ate
chan
ge
usin
g ef
fect
ive
exam
ples
and
app
licab
le s
olut
ions
for s
peci
fic p
robl
ems
HC-3
Enga
ge b
usin
ess
and
indu
stry
lead
ers
to a
ddre
ss c
halle
nges
HC-4
Inst
itute
on-
goin
g cl
imat
e ch
ange
info
rmat
ion
and
educ
atio
n op
portu
nitie
s to
edu
cate
loca
l/nat
iona
l pol
icym
aker
s
Gend
er e
quity
GE
-1Pr
ovid
e ou
treac
h to
wom
en a
nd g
irls
to p
lan
and
prep
are
for c
limat
e ch
ange
Soci
al se
rvic
es
SS-1
Initi
ate/
sust
ain
vacc
inat
ion
cam
paig
ns
Hum
an c
apita
l
Eval
uatio
n Cr
iteria

155
168
12
34
56
78
Sub-
sect
or o
r sys
tem
No.
Gree
n gr
owth
opt
ion
Pote
ntia
l ef
ficac
y
Econ
omic
grow
th
pote
ntia
l
Pove
rty
alle
viat
ion
pote
ntia
lIm
plem
ent-
atio
n co
sts
New
in
stitu
tiona
l ca
pacit
y re
quire
men
ts
Prot
ectio
n of
m
ost
vuln
erab
le
Syne
rgie
s with
GH
G m
itiga
tion
Tim
e fo
r Im
ple-
men
tatio
nN
otes
DRM
-1En
cour
age
a hu
man
e an
d co
mpa
ssio
nate
nat
iona
l pol
icy
that
add
ress
es
effe
ctiv
ely
the
poss
ibili
ty o
f clim
ate
impa
ct re
fuge
es, p
artic
ular
ly fr
om
neig
hbor
ing
natio
ns
DRM
-2Ap
prop
riate
sta
tew
ide
drou
ght m
anag
emen
t stra
tegi
es th
at a
ccou
nt fo
r ev
olvi
ng re
curre
nt d
roug
ht ri
sks
in a
drie
r clim
ate.
DRM
-3De
velo
p a
Fund
that
acc
ount
s fo
r dro
ught
pre
pare
dnes
s, e
mer
genc
y w
ater
sup
ply
and
othe
r clim
ate
chan
ge-re
late
d co
ntin
genc
ies
DRM
-4Co
mpr
ehen
sive
revi
ew o
f dro
ught
pol
icie
s un
der a
cha
nged
clim
ate
DRM
-5De
velo
p re
gion
ally
con
sist
ent z
onin
g an
d co
ordi
nate
d em
erge
ncy
resp
onse
pla
ns in
corp
orat
ing
incr
ease
d cl
imat
e ris
ks
DRM
-6Re
view
goa
ls, s
trate
gies
, pla
ns o
f em
erge
ncy
prep
ared
ness
, res
pons
e &
re
cove
ry u
nder
con
ditio
ns in
duce
d by
clim
ate-
rela
ted
disr
uptio
ns (e
.g.,
heat
/col
d w
aves
, mig
ratin
g di
seas
e ve
ctor
s, fl
oodi
ng, a
nd s
torm
sur
ges)
DRM
-7Re
view
or c
reat
e em
erge
ncy
man
agem
ent p
lann
ing
requ
irem
ents
and
gu
idel
ines
for h
eat w
aves
and
em
erge
ncy
prep
ared
ness
exe
rcis
es
DRM
-8De
velo
p or
stre
ngth
en jo
int p
roto
cols
for m
ulti-
juris
dict
iona
l (i.e
., ac
ross
pr
ovin
ces)
resp
onse
to a
bro
ad s
pect
rum
of c
limat
e-re
late
d em
erge
ncie
s an
d di
sast
ers
DRM
-9Re
-eva
luat
e ev
acua
tion
rout
es to
ens
ure
safe
ty, c
apac
ity a
nd re
silie
nce
to d
amag
e or
loss
DRM
-10
Incl
ude
sea
leve
l ris
e da
ta in
typh
oon
prep
ared
ness
, eva
cuat
ion
and
reco
very
pla
ns
DRM
-11
Esta
blis
h co
mm
unic
atio
n m
echa
nism
s to
coo
rdin
ate
effo
rts b
etw
een
disa
ster
relie
f and
pub
lic h
ealth
age
ncie
s.
DRM
-12
Deve
lop
early
war
ning
sys
tem
s fo
r ex
trem
e w
eath
er c
oupl
ed w
ith
adeq
uate
resp
onse
pla
ns
DRM
-13
Impr
ove
coop
erat
ive
effo
rts a
mon
g ag
enci
es a
t all
leve
ls to
ass
ure
need
ed re
dund
ancy
in d
isas
ter/
seve
re w
eath
er s
ituat
ions
ED-1
Prom
ote
clim
ate
chan
ge s
cien
ce th
roug
h K-
12 e
duca
tion
ED-2
Deve
lop
publ
ic e
duca
tion
prog
ram
s on
clim
ate
adap
tatio
n, in
clud
ing
med
ia c
ampa
igns
and
info
rmat
iona
l pro
gram
mes
ED-3
Prep
are
publ
ic e
duca
tion
mat
eria
ls to
incr
ease
aw
aren
ess
of p
oten
tial
spec
ies
dist
urba
nce
and
lost
hab
itat u
nder
clim
ate
chan
ge.
Not
esNo
te 1
:
Disa
ster
risk
man
agem
ent
Educ
atio
n
Eval
uatio
n Cr
iteria

156
C.4 List of references for examples of adaptation/economic development options
The references listed below are good sources for examples of adaptation/economic development options and/or the source of some of the illustrative options provided in the table.
The references listed below are good sources for examples of adaptation/economic development options and/or the source of some of the illustrative options provided in the table.
Center for Climate Strategies, 2010. “Center for Climate Strategies Adaptation Guidebook: Comprehensive Climate Action”
Major, D. and M. O’Grady. 2010. “New York City Panel on Climate Change”, Appendix B in Adaptation Assessment Guidebook.
Rosenzweig, C and Tubiello, F., 2007. “Adaptation and mitigation strategies in agriculture: an analysis of potential synergies” in Mitigation and Adaptation Strategies for Global Change, Volume 12, Number 5, 855-873, DOI:10.1007/s11027-007-9103-8.
State of Maryland, 2008. “Global Warming and the Free State”, available at http://www.umces.edu/sites/default/files/pdfs/global_warming_free_state_report.pdf

157
Annex D: Illustrative Listing of Data Required for CRGG Planning at the Provincial Level, and Examples of Potential Sources of Information
• Socio-economic-gender profile: provides information on stratified wealth and incomes, population, poverty and demography of the province)
a. Population of province and municipalities (source: Family Income and Expenditure Survey (FIES – PSA-NSCB; PDPFP)
b. Labor employment per occupation or sector in the province (source: PDPFP; Labor & Employment, FIES – PSA-NSCB)
c. Income distribution per occupation or sector (source: FIES – PSA-NSCB; Income & Poverty – PSA-NSCB)
d. Rate of employment, underemployment and unemployment (source: Provincial Quickstat – PSA-NSCB)
e. Indices depicting the ‘working poor’ if available (source: NEDA)f. Existing information on migration outflows and percentage of inward remittances
to the province from overseas workers (source: Philippine Overseas Employment Administration (POEA); Survey on Overseas Filipinos – PSA-NSCB; Provincial Quickstat on Demography – PSA-NCSB)
g. Poverty profile with indicators (source: NEDA; Income & Poverty: Poverty Maps per Province – PSA-NSCB)
h. Proportion of urban population (source: Provincial Quickstat – PSA-NSCB)
• Productive and adaptive infrastructure: identify and describe the state of productive resources in the province and whether these enable economic and livelihoods development
a. Location and quality of bridges, farm to market roads, market facilities, waterworks, flood control infrastructure, ports, alternative energy facilities, power generation/transmission facilities; multi-purpose dams; recreation facilities, emergency evacuation centers etc. (source: Department of Public Works and Highways (DPWH); Provincial utilities sources)
• Health profile and facilities: describe the health picture of the province in terms of physical health status of its residents and the province’s capacity to respond to disease and ailments of its residents
a. Health facilities and type (National Health Facility Registry – Department of Health (DoH))
b. Disease surveillance (Disease Surveillance Per Region – DoH)
• Education profile a. Highest educational attainment (source: Provincial Quickstat – PSA-NSCB)b. Literacy rate (source: Provincial Quickstat – PSA-NSCB)c. Educational centers (source: Datasets and Interactive Maps – Department of
Education (DepEd))
• Business and industry profile: identify major revenue-generating industries and businesses in the province, their respective labor participation rate, and supply chains for these businesses, as well as their demand sources
a. Major industries and their revenue-generating capacities (source: PDPFP; Provincial development plans of the Provincial Development Planning Office (PPDO); Annual

158
Reports of major businesses and industries; interviews with Provincial Development Planning officer/s; Provincial Development Council representatives, and Provincial Trade and Industry officer/s; and with operators of major industries)
b. Labor participation in major industries and businesses (source: PSA-NSCB)c. Value chains for major industries (source: interviews with Provincial Development
Planning officer/s; Provincial Development Council representatives, and Provincial Trade and Industry officer/s; and with operators of major industries)
• Natural resource assets base and ecosystemsa. Natural resource assets of the province (source: DENR: PEENRA databases;
Compendium on Environment Statistics – PSA-NSCB)b. Land use and water use profiles (source: NAMRIA; CLUP – Housing and Land Use
Regulatory Board, HLURB; Provincial Development Planning Office; CLWUPs – HLURB)
• Climate change projections and recent disastersa. Disaster response maps to mitigate health effects (source: Disaster Response Maps
– DoH)b. Climatological statistics and trends (source: Climatological Statistics, Tropical
Cyclones by Province – DOST-PAGASA)c. Disaster accounts and coverage (source: local print media; Compendium on
Environment Statistics – PSA-NSCB)d. Hazard topographical mapping (source: Provincial offices of the DENR; Mines and
Geosciences Bureau (MGB); Environmental Science for Social Change (ESSC))
• Development planning in the provincea. Priority occupations and industries (source: PDPFP; interviews with Provincial
Council representatives and the Provincial Development Planning Officer (PDPO); documents from the PDPO)
b. Infrastructure plans (source: interviews with provincial DPWH representatives, local electricity generating authority and waterworks representatives)
c. Spatial planning and zoning (source: CLUP – HLURB; Provincial Development Planning Office; CLWUP – HLURB)

159
Annex E: Illustrative Listing of Actors and Institutions to be Involved in Plan Implementation, and Illustrative Process for Plan Implementation
* Note that the lists of actors and roles in this Annex is not intended to be exhaustive in either case—in practice, the actors involved in any given adaptation/economic development program or project, and the roles they may play in the program or project, will depend strongly on the aims and design of the program or project and on a multitude of local and other factors.
Potential Actors Involved in Plan Implementation*
Potential Roles in Implementation*
Provincial Sectoral Agencies (Agriculture, Fisheries, Forestry, Industry, Transport, for example)
Help to set criteria for, provide incentives to participate in (or enforce penalties for not complying with) CRGG policies, possibly provide funding, expertise for implementation
Municipal Agencies/AuthoritiesAssist in interpreting, implementing provincial programs and projects at the local level
Electric UtilitiesProvide incentives or other funding for implementation of electricity-related options, and/or manage electricity-related programs
Water Utilities (or Municipal water/wastewater authorities)
Provide incentives or other funding for implementation of water/wastewater-related options, and/or manage related programs
Provincial Infrastructure or Construction Ministry
Develops standards, develops tenders for infrastructure upgrades related to adaptation
Private Construction Firms Respond to tenders for infrastructure projects
Other Private Contractors
Work by contract on aspects of programs or projects beyond the capacity of other actors on tasks ranging from advertising and marketing to data collection, consumer assistance, patrolling of conservation zones, and many others.
Private Banks/Financial InstitutionsProvide funding for investments in infrastructure with both economic development and adaptation benefits.
Multilateral Banks/Financial Institutions
Provide funding for investments in infrastructure related to adaptation—preferably with both economic development and adaptation benefits—where investments are not easily supported by local or national institutions, and where investments offer broad benefits
National Agencies (CCC, Ministries of Industry, Transport, Commerce, Environment…)
Coordinate adaptation activities that cross provincial boundaries and/or need to be/benefit by being consistently implemented across provinces; provide expertise for implementation of provincial programs/projects; provide finding for provincial activities
Provincial Academic InstitutionsProvide/help to collect/assemble data (for example, via surveys) to aid in plan implementation, potential roles in monitoring and evaluation of programs), help to train program staff members.
Local Schools and EducatorsEducate students in climate change issues, including in subjects related to climate change adaptation; seek ways to involve students in adaptation projects (for example, through data collection)
Non-governmental OrganizationsProvide input to program design and implementation, help to implement programs and projects where applicable (including assuring involvement of key groups), help to provide independent program oversight


ISBN 979-11-952673-3-0 (PDF)
About the Global Green Growth Institute
About the Climate Change Commission
Based in Seoul, GGGI is an intergovernmental organization founded to support and promote a new model of economic growth known as “green growth.” The organization partners with countries to help them build economies that grow strongly and are more efficient and sustainable in the use of natural resources, less carbon intensive, and more resilient to climate change. GGGI’s experts are already working with governments around the world, building their capacity and working collaboratively on green growth policies that can impact the lives of millions.
www.gggi.org
T: +82-2-2096-9991 | F: +82-2-2096-9990
The Climate Change Commission, an independent and autonomous body that has the same status as that of a national government agency, is under the office of the President of the Philippines. It is the lead policy-making body of the government which is tasked to coordinate, monitor and evaluate the programs and action plans of the government relating to climate change pursuant to the provisions of the Republic Act No. 9729 or the Climate Change Act as amended by Republic Act No. 10174 or the People’s Survival Fund.
www.climate.gov.ph
T: +63-2-735-3069 (736-3144) | E: [email protected]