Climate-Related Variation of the Human Nasal Cavity related variation... · nasal cavity itself has...
16
Climate-Related Variation of the Human Nasal Cavity Marlijn L. Noback, 1,2 * Katerina Harvati, 1 and Fred Spoor 2,3 1 Paleoanthropology Section, Senckenberg Center for Human Evolution and Paleoecology, Eberhard Karls Universita ¨t Tu ¨bingen, Department of Early Prehistory and Quaternary Ecology, 72070, Tu ¨ bingen, Germany 2 Department of Cell and Developmental Biology, University College London, London, WC1E 6JJ, United Kingdom 3 Department of Human Evolution, Max Planck Institute for Evolutionary Anthropology, 04103 Leipzig, Germany KEY WORDS nose; adaptation; geometric morphometrics; PLS ABSTRACT The nasal cavity is essential for humidify- ing and warming the air before it reaches the sensitive lungs. Because humans inhabit environments that can be seen as extreme from the perspective of respiratory func- tion, nasal cavity shape is expected to show climatic adap- tation. This study examines the relationship between modern human variation in the morphology of the nasal cavity and the climatic factors of temperature and vapor pressure, and tests the hypothesis that within increasingly demanding environments (colder and drier), nasal cavities will show features that enhance turbulence and air-wall contact to improve conditioning of the air. We use three- dimensional geometric morphometrics methods and multi- variate statistics to model and analyze the shape of the bony nasal cavity of 10 modern human population samples from five climatic groups. We report significant correlations between nasal cavity shape and climatic variables of both temperature and humidity. Variation in nasal cavity shape is correlated with a cline from cold–dry climates to hot– humid climates, with a separate temperature and vapor pressure effect. The bony nasal cavity appears mostly asso- ciated with temperature, and the nasopharynx with humidity. The observed climate-related shape changes are functionally consistent with an increase in contact between air and mucosal tissue in cold–dry climates through greater turbulence during inspiration and a higher sur- face-to-volume ratio in the upper nasal cavity. Am J Phys Anthropol 000:000–000, 2011. V V C 2011 Wiley-Liss, Inc. As humans live and breathe in a wide range of envi- ronments, including those which can be seen as ‘‘extreme’’ from a perspective of respiratory function (Baker, 1988), the nasal cavity has long been hypothe- sized to play an important role in climatic adaptation. Because the lungs are very sensitive to air temperature and humidity, it is important that the nose regulates these particular factors (Negus, 1958; Cole, 1982). The nasal cavity (see Fig. 1) is essential for conditioning the air because this is where exchange of heat and moisture mostly occur (Franciscus and Long, 1991). Research link- ing modern human nasal morphology with climate, how- ever, has focused mainly on the outer nose and the nasal aperture (Thomas and Buxton, 1923; Davies, 1932; Weiner, 1954; Carey and Steegmann, 1981; Franciscus and Long, 1991; Roseman, 2004; Hubbe et al., 2009). None of the external measurements deals with the mor- phology of the nasal cavity behind the nasal aperture, e.g., the amount of turbinate area or the depth of the cavity (St. Hoyme and Iscan, 1989), even though this is the part of the nose most crucial for conditioning the air (Franciscus and Long, 1991; Yokley, 2009). Research on the relationship between climate and the nasal cavity itself has been limited, largely because of the difficulties involved in measuring this complicated internal structure (Yokley, 2009), with only a small num- ber of studies addressing this topic. Morgan et al. (1995) reported differences in the size of the cross-section area of the nasal cavity between sub-Saharan Africans and European and Asian groups. Corey et al. (1998) studied the nasal volume in different geographic groups, but did not find significant differences. More recent work by Yokley (2009) found significant differences in the nasal cavity surface/volume ratio between European and African Americans in an (artificially) decongested condition. These studies are limited by the use of linear measurements, which cannot fully address the three-dimensional proper- ties of the nasal cavity, as well as by their general treat- ment of climatic factors, which are considered only in broad terms. This work aims to fill this gap by assessing the rela- tionship between climate and nasal cavity shape using three-dimensional geometric morphometric methodology and climate data representing temperature and vapor pressure, and taking into account the diverse functional demands on nasal cavity shape. BACKGROUND Nasal cavity shape and function Nasal cavity morphology is the most important factor in determining the stream mechanics of nasal air flow (Mlynski et al., 2001). The nasal cavity can be divided Grant sponsor: Huygens Scholarship Programme—Talentprog- ramme; Grant number: HSP-TP.07/192. *Correspondence to: Marlijn Noback, Eberhard Karls Universita ¨t Tu ¨bingen, Department of Early Prehistory and Quaternary Ecology, Ru ¨ melinstrasse 23, 72070 Tu ¨bingen, Germany. E-mail: marlijn.no- [email protected] Received 16 November 2010; accepted 31 January 2011 DOI 10.1002/ajpa.21523 Published online in Wiley Online Library (wileyonlinelibrary.com). V V C 2011 WILEY-LISS, INC. AMERICAN JOURNAL OF PHYSICAL ANTHROPOLOGY 000:000–000 (2011)
Transcript of Climate-Related Variation of the Human Nasal Cavity related variation... · nasal cavity itself has...

Climate-Related Variation of the Human Nasal Cavity
Marlijn L. Noback,1,2* Katerina Harvati,1 and Fred Spoor2,3
1Paleoanthropology Section, Senckenberg Center for Human Evolution and Paleoecology, Eberhard Karls UniversitatTubingen, Department of Early Prehistory and Quaternary Ecology, 72070, Tubingen, Germany2Department of Cell and Developmental Biology, University College London, London, WC1E 6JJ, United Kingdom3Department of Human Evolution, Max Planck Institute for Evolutionary Anthropology, 04103 Leipzig, Germany
KEY WORDS nose; adaptation; geometric morphometrics; PLS
ABSTRACT The nasal cavity is essential for humidify-ing and warming the air before it reaches the sensitivelungs. Because humans inhabit environments that can beseen as extreme from the perspective of respiratory func-tion, nasal cavity shape is expected to show climatic adap-tation. This study examines the relationship betweenmodern human variation in the morphology of the nasalcavity and the climatic factors of temperature and vaporpressure, and tests the hypothesis that within increasinglydemanding environments (colder and drier), nasal cavitieswill show features that enhance turbulence and air-wallcontact to improve conditioning of the air. We use three-dimensional geometric morphometrics methods and multi-variate statistics to model and analyze the shape of the
bony nasal cavity of 10 modern human population samplesfrom five climatic groups. We report significant correlationsbetween nasal cavity shape and climatic variables of bothtemperature and humidity. Variation in nasal cavity shapeis correlated with a cline from cold–dry climates to hot–humid climates, with a separate temperature and vaporpressure effect. The bony nasal cavity appears mostly asso-ciated with temperature, and the nasopharynx withhumidity. The observed climate-related shape changes arefunctionally consistent with an increase in contact betweenair and mucosal tissue in cold–dry climates throughgreater turbulence during inspiration and a higher sur-face-to-volume ratio in the upper nasal cavity. Am J PhysAnthropol 000:000–000, 2011. VVC 2011Wiley-Liss, Inc.
As humans live and breathe in a wide range of envi-ronments, including those which can be seen as‘‘extreme’’ from a perspective of respiratory function(Baker, 1988), the nasal cavity has long been hypothe-sized to play an important role in climatic adaptation.Because the lungs are very sensitive to air temperatureand humidity, it is important that the nose regulatesthese particular factors (Negus, 1958; Cole, 1982). Thenasal cavity (see Fig. 1) is essential for conditioning theair because this is where exchange of heat and moisturemostly occur (Franciscus and Long, 1991). Research link-ing modern human nasal morphology with climate, how-ever, has focused mainly on the outer nose and the nasalaperture (Thomas and Buxton, 1923; Davies, 1932;Weiner, 1954; Carey and Steegmann, 1981; Franciscusand Long, 1991; Roseman, 2004; Hubbe et al., 2009).None of the external measurements deals with the mor-phology of the nasal cavity behind the nasal aperture,e.g., the amount of turbinate area or the depth of thecavity (St. Hoyme and Iscan, 1989), even though this isthe part of the nose most crucial for conditioning the air(Franciscus and Long, 1991; Yokley, 2009).Research on the relationship between climate and the
nasal cavity itself has been limited, largely because ofthe difficulties involved in measuring this complicatedinternal structure (Yokley, 2009), with only a small num-ber of studies addressing this topic. Morgan et al. (1995)reported differences in the size of the cross-section areaof the nasal cavity between sub-Saharan Africans andEuropean and Asian groups. Corey et al. (1998) studiedthe nasal volume in different geographic groups, but didnot find significant differences. More recent work byYokley (2009) found significant differences in the nasalcavity surface/volume ratio between European and African
Americans in an (artificially) decongested condition. Thesestudies are limited by the use of linear measurements,which cannot fully address the three-dimensional proper-ties of the nasal cavity, as well as by their general treat-ment of climatic factors, which are considered only inbroad terms.This work aims to fill this gap by assessing the rela-
tionship between climate and nasal cavity shape usingthree-dimensional geometric morphometric methodologyand climate data representing temperature and vaporpressure, and taking into account the diverse functionaldemands on nasal cavity shape.
BACKGROUND
Nasal cavity shape and function
Nasal cavity morphology is the most important factorin determining the stream mechanics of nasal air flow(Mlynski et al., 2001). The nasal cavity can be divided
Grant sponsor: Huygens Scholarship Programme—Talentprog-ramme; Grant number: HSP-TP.07/192.
*Correspondence to: Marlijn Noback, Eberhard Karls UniversitatTubingen, Department of Early Prehistory and Quaternary Ecology,Rumelinstrasse 23, 72070 Tubingen, Germany. E-mail: [email protected]
Received 16 November 2010; accepted 31 January 2011
DOI 10.1002/ajpa.21523Published online in Wiley Online Library
(wileyonlinelibrary.com).
VVC 2011 WILEY-LISS, INC.
AMERICAN JOURNAL OF PHYSICAL ANTHROPOLOGY 000:000–000 (2011)

into three different functional regions that influence theairflow: 1) an inflow area (vestibule, isthmus and ante-rior cavum), 2) a functional area (area of the turbinates),and 3) an outflow area (posterior cavum, choanae, andnasopharynx) (Mlynski et al., 2001; see Fig. 1). Becausethe relative dimensions and properties of the nasal cav-ity directly affect air flow during both inspiration andexpiration, variation in nasal cavity morphology directlyimpacts its function.
One of the most important functions of the nasal cav-ity is to condition inspired air so as to prevent damage ofthe sensitive mucosal tissues of the lungs, where the airmust be at body temperature and nearly saturated tofacilitate gas exchange (Negus, 1958). Besides warmingand humidifying the inspired air, moisture retentionduring expiration is also a crucial function of the exter-nal nose and nasal cavity, especially in dry environments(Franciscus and Trinkaus, 1988). Conflicting statementshave been made regarding the function of the nose andnasal cavity in thermoregulation: (selective) cooling(Davies, 1932; Cabanac and Caputa, 1979; Dean, 1988;Mariak et al., 1999), prevention of heat loss (Negus,1958), or no evidence for such function at all (Deklunderet al. 1991; Jessen and Kuhnen, 1992; Mekjavic et al.,2002; Maloney et al., 2007). The human nose lacks thespecialized carotid rete present for the cooling purposein some animals; the surface of the nose is particularlysmall compared with that of the body, making its influ-ence on body temperature rather small (Weiner, 1954),and mouth breathing appears to be more effective to cooldown (Negus, 1958; Lieberman, 2011). With respect toselective brain cooling involving nasal breathing recentexperimental studies found no evidence that this formof thermoregulation exists at all in humans and otherprimates (Mekjavic et al., 2002; Maloney et al., 2007).
Hence, in this study we focus explicitly on the functionof the nasal cavity in conditioning the air on inspirationand retaining moisture on expiration.Table 1 gives an overview of the demands that differ-
ent climate types pose on the nose in terms of the levelof air-conditioning that is needed, both during inspira-tion and expiration.As breathing in hot and humid environments requires
almost no warming or humidifying of the incoming air,we regard this type of environment as least stressful interms of air-conditioning to maintain lung function. Thetemperate regions show temperature and humidity val-ues between those of hot and humid and cold and dryenvironments, and are therefore regarded as being inter-mediately stressful for breathing.Warming and humidifying inspired air is influenced by
the amount of contact between nasal mucosal tissue andthe air (Mowbray and Gannon, 2001; Clement and Gordts,2005). Several important features of the nasal cavityenhance this contact, including 1) greater surface-volumeratio, 2) increased residence time, and 3) greater turbu-lence (Churchill et al., 2004; Clement and Gordts, 2005).
Greater surface-volume ratio. Increasing the mucosalcontact surface per unit of air volume that is inspired,enhances the exchange of moisture and warmth betweenthe air and the mucosal tissue. The surface-volume ratiocan be increased by an elaborate turbinate system, by anincrease in length of the cavity and by a smaller cross-sectional area (narrowing) of the nasal cavity. A nasalcavity that is too narrow, on the other hand, increasesnasal resistance and flow velocity, which in turn decreasetemperature and humidity exchange with the nasal wall(Inthavong et al., 2007). There is therefore a limit todecreasing the nasal cross-sectional area for enhancingair-conditioning.
Residence time. To improve air-conditioning in narrownasal cavities, an increase of the time the air is insidethe nasal cavity (residence time) becomes important(Inthavong et al., 2007). It is expected that relativelengthening of the nasal cavity provides this increase ofresidence time.
Turbulence. For air-conditioning to be efficient, turbu-lence is necessary (Cole, 2000; Clement and Gordts,2005). The higher the degree of turbulence, the betterthe incoming air gets mixed within the boundary layerof the nasal walls and mucus, thus directly influencingthe efficiency of moisture and heat exchange during res-piration (Franciscus and Long, 1991; Cole, 2000; Church-ill et al., 2004). Especially in the posterior part of theturbinate chamber, turbulence is essential for convectiveheat transfer (Inthavong et al., 2007). Turbulenceincreases with increased diameter (i.e., breadth and/orheight) of the tube (Churchill et al., 2004) and withgreater shape irregularity of the tube (Courtiss andGoldwyn, 1983). Another turbulence inducing factor isthe relative increase in cross-sectional area (a pro-nounced diameter size step) between the nasal apertureand the turbinate chamber during inspiration, andbetween the choana and the turbinate chamber duringexpiration, relative to the anteroposterior length of theanterior and posterior cavum, respectively (see Fig. 1;Mlynski et al., 2001). The smaller the opening throughwhich air has to flow relative to the size of the turbinatechamber, and the shorter the distance that it has totravel to enter this chamber, the greater the turbulence.
Fig. 1. Structural elements of the nose in inspiratory direc-tion (adapted from Mlynski et al., 2001). The black lines indi-cate the nasal cavity model used in this study (see Fig. 3). Ininspiration direction, the vestibule (1) changes the direction ofthe air. The concave isthmus makes the airflow diverge.Depending on the shape of the anterior cavum (2) and the flowvelocity, airflow changes from laminar flow to turbulent flow inthe anterior or posterior part of the turbinate area (3). The pos-terior cavum (4) decreases the amount of turbulence and forcesthe air through the convex choanae that cause the air stream-lines to converge. The laminar flow that results flows throughthe nasopharynx (5) where it changes direction into the lowerrespiratory tract (Mlynski et al., 2001).
2 M.L. NOBACK ET AL.
American Journal of Physical Anthropology

Other features, not measured in this study, such asgreater airflow velocity (Clement and Gordts, 2005),downward facing nares and/or large turbinates alsoinfluence airflow turbulence (Churchill et al., 2004).It is important to point out that the nasal cavity shape
requirements to enhance one or the other of the aboveproperties are sometimes contradictory, e.g., turbulence isenhanced by a wider cavity, whereas a narrow cavityincreases the surface to volume ratio. With so many differ-ent functional processes at work, the nasal cavity will likelyshow a compromise morphology (Churchill et al., 2004).
Hypotheses
This research aims to investigate a possible functionalrelationship between nasal cavity morphology and cli-mate, by examining the following two hypotheses andtheir predictions:
1. Climate affects nasal morphology.
a There are significant correlations between nasalcavity shape and climatic factors of temperatureand vapor pressure.
b Trends in nasal cavity shape will follow a climatictrend from least to most physiologically demandingenvironments for breathing: from hot–humid tocold–dry.
c Nasal morphology is related to climate irrespectiveof nasal cavity size.
2. Cold–dry climates, most demanding in terms ofbreathing, have resulted in nasal cavity morphologywhich enhances conditioning of the air. Cold–drygroups will show air-wall contact enhancing features:
a decrease in relative breadth and/or height toincrease surface/volume ratio.
b increased relative length of the cavity to increaseresidence time.
c increased turbulence through larger breadth andespecially relative height of the cavity, and through apronounced relative diameter size step between thecross-sectional area of the anterior cavum and theturbinate chamber, and between the posterior cavumand the turbinate chamber.
MATERIALS AND METHODS
Samples
The 100 crania from 10 populations were selected fromcollections housed in the Natural History Museum Lon-don and the American Museum of Natural History. Thesamples come from five zones of diverse climatic stress(Beals et al., 1984), and attempt to represent indigenouspopulations of each area, not dominantly affected bymodern western lifestyle and health care. Table 2 sum-marizes population location, sample size, and the collec-tions where the cranial material are housed, climatezone, temperature, and vapor pressure data. MN meas-ured the listed material from the Natural HistoryMuseum in London; FS measured the listed materialfrom the American Museum of Natural History in NewYork. In an attempt to separate genetic relatedness fromclimatic type as a possible influence on nasal morphol-ogy, at least two populations from different continentswere selected for each climate zone.Selection of crania was based on the presence of all
features where the landmarks were taken. Only adultcrania were included, based on fusion of the sphenoocci-pital synchondrosis. Individuals with substantial in vivotooth loss or signs of other dental pathologies wereexcluded, as such conditions may influence palatal mor-phology and thus the nasal floor. Attempts to obtainsamples with equal numbers of males and females werenot successful. The number of available specimens perpopulation was severely hampered by the difficulty tofind skulls sufficiently preserved to measure alllandmarks, and few have reliable historical gender infor-mation. We chose not to estimate sex from cranial mor-phology because established sex estimation methods arepartly based on robustness, including the nasal area,and thus might result in biased samples and results.Corey et al. (1998) and Franciscus (1995) showed thatindigenous men and women from the same geographicalarea show no significant difference in nasal morphology,and any major climate-related trend can be expected toaffect both sexes following a similar pattern (Hall, 2005),especially, since it is predominantly shape, rather thansize that is analyzed here.Climate data of temperature and vapor pressure
(Table 2) were obtained using the KNMI ClimateExplorer compiled by Dr G. J. van Oldenborgh (http://climexp.knmi.nl; Oldenborgh et al., 2005), retrievingmonthly observations from the CRU TS3 database at 0.5degree, for the years 1901–2006. Although this datasetlikely does not fully reflect the climatic conditions of the
TABLE 1. Overview of air-conditioning demands in different climate types
Climate Humidity adjustment of air Temperature adjustment of airExpected stress
level
Cold–dry Much humidification needed. Moistureconservation during expiration
Much warming needed. Minimization ofheat loss during expiration
Very high
Cold–humid Much humidification needed. Cold air containslittle moisture. Moisture conservationduring expiration
Warming of air needed. Minimization ofheat loss during expiration
High
Temperate Seasonal fluctuations in humidity, butnever extreme
Seasonal fluctuations in temperature,but never extreme
Intermediate
Hot–dry Humidification needed: hot dry air can extractmoisture from the body. Moisture conservationduring expiration
Air temperature can be higher thanbody temperature. Cooling ratherthan heat preservation
Medium
Hot–humid No air-conditioning needed No air-conditioning needed. Coolingrather than heat preservation
Low
3HUMAN NASAL CAVITY AND CLIMATE ADAPTATION
American Journal of Physical Anthropology

past thousands of years, during which time the differen-tiation of the modern human groups examined tookplace, it is among the most exhaustive and detailed cli-matic databases currently available. The data wereobtained for the geographical location of each individualcranium, but when no exact provenance is known anarea rather than single location was used to representthe region of origin of that specimen. For each specimenthe following values were calculated: mean yearly tem-perature (Tmean), coldest monthly temperature (Tmin),warmest monthly temperature (Tmax), mean yearlyvapor pressure (VPmean), lowest monthly vapor pres-sure (VPmin), and highest monthly vapor pressure(VPmax). Subsequently, sample means of the six varia-bles were calculated for each of the 10 populations.
Measurements
Data were collected with a Microscribe 3DX portabledigitizer in the form of three-dimensional coordinates of21 nasal cavity landmarks. Microscribe digitization islimited to externally accessible landmarks. We thereforechose our landmarks as to best reflect the major aspectsof nasal cavity shape that affect air-wall contact andhence conditioning of inspired air (Table 3, Figs. 2 and3). Some of these are well-established anthropologicallandmarks (Brauer, 1988), whereas others were specifi-cally defined to quantify particular aspects of the nasal
cavity. In addition to type 1 landmarks, it was necessaryto include several type 2 (8) and type 3 (1) landmarks toaccurately describe the nasal cavity (Bookstein, 1991).To better visualize the complex shape represented by
our landmark set we constructed a wireframe model usingMorphoJ (version 1.01c, Klingenberg, 2011) which makesit easier to visualize and interpret the landmark configu-ration. Figure 1 shows the terminology used to describedifferent parts of the nasal cavity model (modified fromMlynski et al., 2001). As the bony part of the nasal cavityand the nasopharynx form one functional complex, bothare included in the term ‘‘nasal cavity.’’ This termexcludes the external, fleshy part of the nose (the outernose). We used relative distances between landmarks (seeFig. 3) to describe elements of the nasal cavity that influ-ence air-wall contact. Changes in surface-volume ratio arereflected by changes in nasal aperture, upper nasal cavity,choana, and nasopharynx breadth and height. Changes incavity length are described using the relative length ofthe bony cavity versus that of the nasopharynx. Turbu-lence enhancing features are reflected in measures ofbreadth and diameter size step (see Fig. 3).An extra set of standard landmarks was registered for
each specimen to represent overall cranial size (nasal cavitylandmarks excluded). These additional landmarks includenasion, glabella, bregma, lambda, inion, basion, radiculare,frontomalare orbitale, zygoorbitale, zygomaxillare, andprosthion. Descriptions of all landmarks follow Brauer(1988). Each specimen was mounted with plasticine in such
TABLE 3. Definitions of the 21 nasal cavity landmarks and description of the landmarks representing the air-wall contact featuresused in this study
Landmark Osteometric name Description Type
1,3 – Anterior edge of anterior ethmoid foramen. 22,4 – Posterior edge of posterior ethmoid foramen. 25 Rhinion Midline point at inferior free end of the internasal suture. 16,7 – Nasomaxillary suture at piriform aperture. 18,9 Alare The lateralmost margin of nasal aperture. 110,11 – Inferiormost margin of nasal aperture. 212 ANS Anterior nasal spine: tip of the median bony process of the maxilla. 213 PNS Posterior nasal spine: posterior tip of midsagittal bony palate. 214,15 – Inferolateral choanal corner. 216,17 – Superiormost margin of choana. 218 Hormion Most posterior midline point on the vomer. 119,20 – Posterosuperior end of medial pterygoid plate. 221 – Most inferior midpoint on the pharyngeal tubercle. 3
TABLE 2. Overview of populations, number of individuals per population per collection (AMNH 5 American Museum of NaturalHistory, measured by FS; NHM 5 Natural History Museum London, measured by MN), and climatic data per population. Tempera-
ture (T) in degrees Celsius, vapor pressure (VP) in hectopascal
Collection (#) Tmean Tmin Tmax VPmean VPMin VPmax
Cold and dryGreenland NHM(9), AMNH(1) 25.69 216.88 6.28 3.90 1.48 7.73Indian Point Siberia AMNH(10) 25.11 216.86 7.82 3.80 1.11 8.02
Cold and humidAleutian Islands AMNH(10) 3.52 21.18 9.69 6.89 4.26 11.04Tierra del Fuego and Patagonia NHM(7), AMNH(2) 4.97 0.98 8.73 6.13 4.97 7.56
TemperateCentral Europe NHM(11) 10.29 21.14 20.62 10.19 4.81 16.48Chatham Islands NHM(10) 12.51 7.74 18.11 19.76 16.44 22.88
Hot and drySouth Africa NHM(9), AMNH(1) 17.39 10.55 23.20 11.03 7.07 15.51Western Australia NHM(8), AMNH(2) 21.58 14.13 28.14 12.67 9.12 17.19
Hot and humidGabon NHM(10) 24.95 23.00 26.05 25.74 22.95 27.05Papua New Guinea AMNH(10) 25.52 24.32 26.41 25.22 22.94 26.66
4 M.L. NOBACK ET AL.
American Journal of Physical Anthropology
a way that all landmarks could be obtained in a singleseries. The specimens preserve all landmarks, except thathormion of three crania had to be estimated because of adamaged vomer.
Error tests
To investigate the intra- and interobserver error, threemodern human crania (not part of the comparative sam-ples used) were digitized three times by MN and FS,separately and at different occasions (MN with intervalsof 4 and 9 weeks, FS with intervals of 1 day). FollowingLockwood et al. (2002), the impact of measurement erroron the results was assessed by comparing the Euclideandistances between the repeats of the same individuals tothose between all 100 individuals used in the study.These were calculated from the Procrustes coordinatedata on all 21 nasal cavity landmarks used in the analy-ses. Results of the intraobserver error test are shown inFigure 4a. For both authors, the Euclidean distancesbetween repeats (intra FS or intra MN) do not overlapthe Euclidean distances between any two different indi-viduals from the actual data set (Total data). This meansthat intraobserver variation in landmark placement issmall relative to inter-individual differences encounteredin the full sample analyzed here. The MN measurementsshow larger Euclidean distances between repeats thanthose of FS, which may be the result of the longer inter-val between repeats and less initial familiarity with themeasuring procedure.The effect of interobserver error was assessed by com-
paring Euclidean distances obtained between repeatedmeasurements taken from the same individuals by bothobservers to those obtained between the 100 differentindividual crania used in this research, of which 74 aremeasured by MN and 26 by FS. The results show mini-mal overlap in the Euclidean distances (Fig. 4b), withjust 54 of 4949 (1%) pairs in the full sample havingthe same distance range as 6 of 27 (22%) pairs in theinterobserver repeat. So 1.09% of the differences in shapemeasured between two individual crania are similar to dif-ferences due to interobserver measurement differences.The largest Euclidean distances among the interob-
server pairs concern initial measurements made by
MN, suggesting that inexperience with the methodcould be an underlying factor. The one landmark posi-tion particularly prone to interobserver error is thesuperiormost margin of the choana (landmarks 16, 17).It can be difficult to locate anteroposteriorly, when the
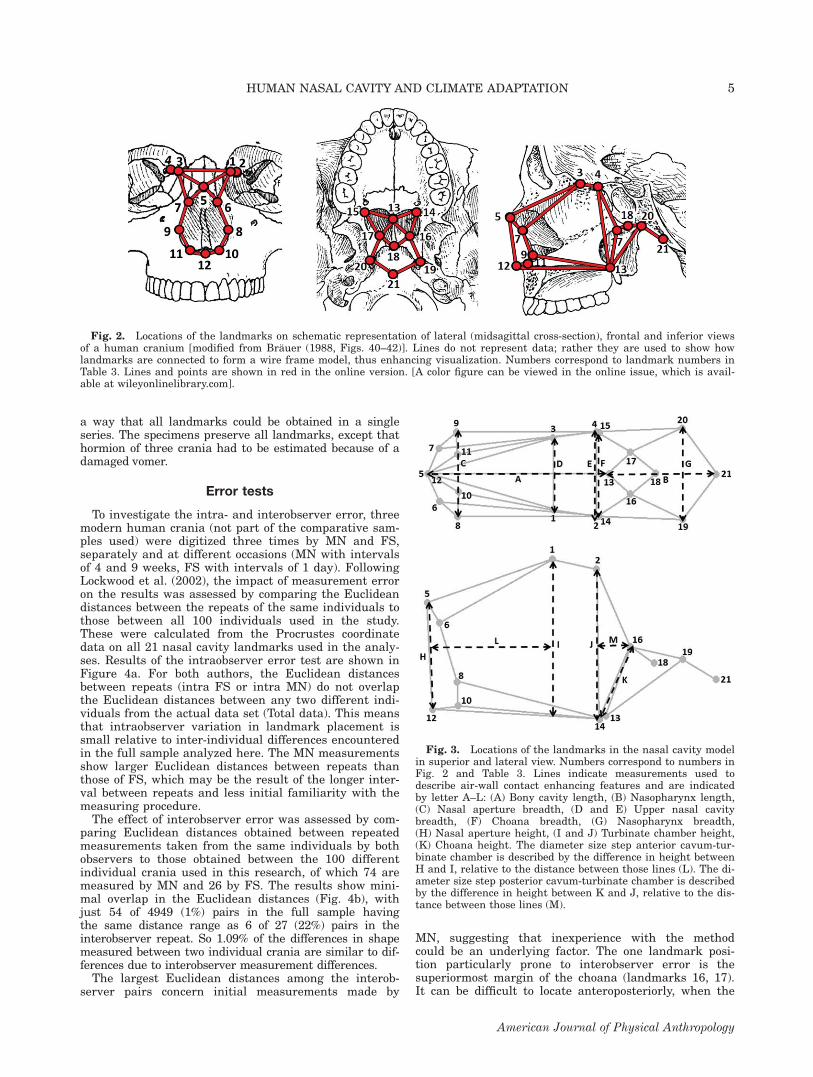
Fig. 3. Locations of the landmarks in the nasal cavity modelin superior and lateral view. Numbers correspond to numbers inFig. 2 and Table 3. Lines indicate measurements used todescribe air-wall contact enhancing features and are indicatedby letter A–L: (A) Bony cavity length, (B) Nasopharynx length,(C) Nasal aperture breadth, (D and E) Upper nasal cavitybreadth, (F) Choana breadth, (G) Nasopharynx breadth,(H) Nasal aperture height, (I and J) Turbinate chamber height,(K) Choana height. The diameter size step anterior cavum-tur-binate chamber is described by the difference in height betweenH and I, relative to the distance between those lines (L). The di-ameter size step posterior cavum-turbinate chamber is describedby the difference in height between K and J, relative to the dis-tance between those lines (M).
Fig. 2. Locations of the landmarks on schematic representation of lateral (midsagittal cross-section), frontal and inferior viewsof a human cranium [modified from Brauer (1988, Figs. 40–42)]. Lines do not represent data; rather they are used to show howlandmarks are connected to form a wire frame model, thus enhancing visualization. Numbers correspond to landmark numbers inTable 3. Lines and points are shown in red in the online version. [A color figure can be viewed in the online issue, which is avail-able at wileyonlinelibrary.com].
5HUMAN NASAL CAVITY AND CLIMATE ADAPTATION
American Journal of Physical Anthropology

saddle-shaped area is flat in this direction, and tendedto be placed more posteriorly by FS than by MN. Theinferosuperior location of landmarks 16 and 17, mark-ing the height of the choanae, is not affected, and theselandmarks were kept in the analyses to maintain a bio-logically meaningful model of the nasal cavity. In theResults section, we will consider if a specific trend ininterobserver error could have influenced the results ofthe analyses.
Statistics
Data superimposition. The three-dimensional coordi-nates of the 21 nasal landmarks were superimposed
with generalized Procrustes analysis (GPA) (Rohlf, 1990;Rohlf and Marcus, 1993; Slice, 1996; O’Higgins andJones, 1998) using the Morpheus and MorphoJ softwarepackages (Slice, 1998; Klingenberg, 2011). This proce-dure allowed the visual and statistical assessment ofshape after scaling to common centroid size. The fittedcoordinates were then used for all further statisticalanalysis. Centroid size of the nasal cavity (CSnose) wasalso retrieved from the Procrustes analysis of the nasalcavity landmark set. A similar procedure for the craniallandmark dataset was used to produce a more general,overall cranial measure of size, the centroid size of thecranium (CScran).
Distance matrices. We calculated morphological,climate, and centroid size distance matrices among all10 groups. We first performed a principal componentanalysis (PCA) on the Procrustes superimposed coordi-nates. By using a screeplot, the first eight principalcomponents, accounting for 65.2% of the total variance,were selected to eliminate irrelevant small-scale varia-tion from further analysis (Harvati and Weaver, 2006b).These principal components were then used as variablesto calculate Mahalanobis squared distances among ourpopulation samples. Mahalanobis D2 are scaled by theinverse of the pooled covariance matrix and are a measureof the distance between group centroids. (Harvati, 2003;Harvati and Weaver, 2006b; Hubbe et al., 2009). UnlikeProcrustes distance, an alternative morphological distancemeasure used with landmark data, Mahalanobis D2
accounts for nonindependence of landmark coordinates aswell as within-group variation (Neff and Marcus 1980;Klingenberg and Monteiro, 2005). Both PCA and Mahala-nobis analyses were performed in SAS (The SAS Institute).A matrix of squared distances in centroid size was made
for both CSnose and CScran. Climate matrices were calcu-lated from the squared differences among series for eachclimate variable (Tmean, Tmin, Tmax, VPmean, VPmin,VPmax). A geographic distance matrix was also calculatedfor our population samples, to account for population his-tory, which has been shown to correlate well with geogra-phy (see Relethford, 2001). The latter matrix was con-structed following Hubbe et al. (2009): geographic distancesconsisted of linear distances among groups in kilometers,using several checkpoints (Cairo, Bangkok, Bering, andPanama) to confine the distances to terrestrial routes.
Matrix comparisons. To test for patterns of correlationamong nasal cavity shape and factors of climate and sizewe compared the morphological and climatic distancematrices using Mantel Matrix Correlation tests (Mantel1967; see also Relethford 2004, Harvati and Weaver,2006a, b; Hubbe et al., 2009) in NTSYSPc, (v2.10t.Applied Biostatistics, Rohlf, 1986–2000). This test evalu-ates the level of association between two matrices. Per-mutation tests (10,000 runs) were used to evaluate thesignificance of the results (Harvati and Weaver, 2006b;Hubbe et al., 2009). Mantel tests also allow for three-way matrix comparisons in a manner similar to a partialcorrelation among three variables. This enabled us tocompare morphological and climate matrices while con-trolling for the effects of size as well as of geographicdistance, used here as a proxy for population history (seealso Roseman, 2004; Harvati and Weaver, 2006b; Hubbeet al., 2009).
Partial least squares analysis. To analyze the covari-ance patterns between nasal cavity shape and climate,
Fig. 4. (a) Analysis of intraobserver error. Black columnsshow frequency distribution of all Euclidean distances among100 human nasal cavity shapes (total data). Light grey anddark grey columns show the distributions for Euclidean distan-ces between repeats of measurements of MN and FS, respec-tively. The latter are not to scale and are exaggerated 10 timesto illustrate their position relative to differences between indi-viduals (following Lockwood et al., 2002). (b) Analysis of inter-observer error. Black columns show frequency distribution of allEuclidean distances among 100 human nasal cavity shapes(total data).White columns show the distributions for Euclideandistances between repeats of measurements of the same threecrania between both authors. The latter are not to scale and areexaggerated 10 times to illustrate their position relative todifferences between individuals.
6 M.L. NOBACK ET AL.
American Journal of Physical Anthropology

we performed a two block partial least squares analysis(2B-PLS) (Bookstein et al., 1990, 2003; Rohlf and Corti,2000) within MorphoJ. This analysis is particularly use-ful for analyzing data where there is an expected highdegree of multicolinearity within each block (Gil andRomera, 1998). With this analysis, there is no need foran arbitrary choice of factors (Manfreda et al., 2006).This makes PLS analysis ideal for research in a climaticcontext as temperature and humidity factors in natureare inseparable. The variables in the first block consistedof all six Z-scored climate factors, all of which are highlycorrelated with each other. Individuals from the samepopulation all had the same value for the climate varia-bles. The second block of variables was formed by firstrunning a second, separate, Procrustes analysis on theraw coordinate data using MorphoJ (Klingenberg, 2011).From the output dataset, only the symmetric componentof shape variation was used for further analysis.Asymmetric shape variation, which can also be partlycaused by measurement errors, is not of interest for thisanalysis (Mitteroecker and Gunz, 2009). The 2B-PLSsearches for pairs of new explanatory factors (PLSdimensions), one for climate [climate latent variable(LV)], and one for shape (singular warp), that maximizethe covariance between the two blocks of data. The firstpair of explanatory factors forms the first PLS dimension(PLS1) and explains the highest percentage of the totalcovariance between the two blocks. Each following PLSdimension consequently explains a lower percentage.The explanatory factors of each dimension are only cor-
related with each other and not with any factor fromother PLS dimensions. The climate LVs scores and sin-gular warp scores can be plotted against each other. Thisvisualizes changes in shape score per change in climateLV score. Each climate LV consists of a combination ofthe six climate variables. The loadings of the climatevariables on the vector of the climate LV show which cli-mate variables are most important for describing thecovariation between climate and shape. The loadings ofthe shape variables on the singular warp can be visual-ized. This then enables us to describe the shape changeswhich maximally explain covariance between nasal cav-ity shape and the optimal combination of climate varia-bles, the climate LV (see also Manfreda et al., 2006). Thesignificance level for the covariation between the blocksand for the correlation between the climate LV and sin-gular warp within each pair of exploratory variables wasevaluated using permutation tests (10,000 runs). As theinterobserver error was highest for landmarks number16 and 17 (superiormost margin of choana), we checkedthe influence of these two landmarks by leaving themout in an extra run of the PLS analysis (described inResults section).
Multiple multivariate regression. To see what shapechanges are specifically related to the temperature andvapor pressure factors which had the highest correlationwith nasal cavity shape in the Mantel tests and to testwhether shape changes related to climate are not onlyan effect of allometry, we performed a multiple multivar-iate regression analysis within MorphoJ. The programallows for input of multiple independents (the climatefactors and nasal cavity centroid size) and multipledependents from one dataset (the symmetric componentof the Procrustes shape coordinates). Within the pro-gram, we can then visualize shape changes related solelyto the temperature factor, while the vapor pressure andcentroid size are kept constant. We can do the same forshape changes related to vapor pressure. Keeping cent-roid size constant removes the allometric effect andkeeping the other climate factor constant allows foruntangling of the separate effects of temperature andhumidity.
RESULTS
Correlations
The results of the Mantel tests for correlation betweenmorphological shape distances and climate distancescorrected for geographic distance are shown in Table 4.All climate factors, except VPmax, show a significant(P \ 0.05) correlation with nasal cavity shape. Of thethree temperature factors, Tmean has the highest corre-lation with nasal cavity shape coordinates. Of the threevapor pressure factors, VPmean has the highest correla-tion with nasal cavity shape. Nasal cavity shape is sig-nificantly correlated with nose centroid size. Althoughthere is a significant correlation between nose centroidsize (CSnose) and cranial centroid size (CScran), there isno significant correlation between nasal cavity shapeand CScran. Centroid size of the nose does not showcorrelation with either temperature or vapor pressure.Cranial centroid size only shows a highly significant cor-relation with Tmean.
TABLE 4. Mantel correlations results between morphological,climate, and centroid size distances, corrected for geographicaldistances. Significant correlations (P < 0.05) are indicated by *
Nasal cavity shape (first 8PCs) 3Temperature R p
Mean monthly temperature (Tmean) 0.352 0.026 *Temperature warmest month (Tmax) 0.287 0.048 *Temperature coldest month (Tmin) 0.316 0.038 *
Vapor pressure R pMean monthly vapor pressure (VPmean) 0.308 0.040 *Vapor pressure wettest month (VPmax) 0.267 0.061 nsVapor pressure driest month (VPmin) 0.298 0.048 *
Centroid size R pNose centroid size (CSnose) 0.388 0.013 *Cranial centroid size (CScran) 0.236 0.075 ns
Nose centroid size 3Temperature R p
Mean monthly temperature (Tmean) 0.027 0.397 nsTemperature warmest month (Tmax) 0.025 0.601 nsTemperature coldest month (Tmin) 0.018 0.578 ns
Vapor pressure R pMean monthly vapor pressure (VPmean) 20.118 0.746 nsVapor pressure wettest month (VPmax) 20.104 0.276 nsVapor pressure driest month (VPmin) 20.124 0.249 ns
Centroid size R pCranial centroid size (CScran) 0.293 0.040 *
Cranial centroid size 3Temperature R p
Mean monthly temperature (Tmean) 0.427 0.017 *Temperature warmest month (Tmax) 0.659 0.997 nsTemperature coldest month (Tmin) 0.271 0.943 ns
Vapor pressure R pMean monthly vapor pressure (VPmean) 20.043 0.592 nsVapor pressure wettest month (VPmax) 0.051 0.704 nsVapor pressure driest month (VPmin) 20.094 0.238 ns
7HUMAN NASAL CAVITY AND CLIMATE ADAPTATION
American Journal of Physical Anthropology

PLS
To further explore the association between the climatefactors and nasal cavity shape, we performed a PLSanalysis of the symmetric component of the Procrustesshape coordinates against the Z-scored climate variables(Tmin, Tmax, Tmean, VPmin, VPmax, VPmean). Thesingular values are 0.043, 0.010, 0.003, 0.0009, 0.0003,and 0.000. The first dimension of the PLS analysis(PLS1) explains 94.3% of the total squared covariancebetween the shape coordinates and the climate variables.The first two dimensions (PLS1 and PLS2) together span99.4% of the total squared covariance pattern. The corre-lation between the first pair of PLS scores (shape vs. cli-mate) is 0.770 (P 5 0.0427), between the second pair is0.552 (P 5 0.0217). The customary permutation testyields a significance level for the first two singular warpsof P\ 0.001 on 10,000 permutations.Table 5 gives the loadings of the climate LVs on the
first two singular vectors: PLS1 and PLS2. It shows thatPLS1 is loaded by a combination of positive temperatureand positive vapor pressure factors: low PLS1 valuesindicate cold–dry climate, high PLS1 values indicatewarm and humid climate. The highest loading is fromTmean (0.433), but all climate factors have loadings in asimilar range (0.392–0.433). PLS2 shows a combinationof negatively loading temperature factors and positiveloading vapor pressure factors. This means that a highPLS2 score indicates a cold-humid climate, whereas alow PLS2 score indicates a warm and dry climate. PLS2is mostly loaded by vapor pressure factors, mostly mini-mum vapor pressure (0.437), but again all climate fac-tors have loadings in a similar range (see Table 5).On singular warp 1, a clear division is visible between
hot–humid climate populations from Gabon and PapuaNew Guinea which show the highest PLS1 scores, hot–dry climate populations from Australia and South Africawith slightly lower PLS1 scores, and cold climate groupsfrom Tierra del Fuego, the Aleutian Islands, Siberia andGreenland with low PLS1 scores (see Fig. 5). Temperateclimate populations from Central Europe and the Chat-ham Islands show intermediate scores. On singular warp2, the division is less clear, as all populations overlap.From this graph, it becomes clear that the climaticpattern of PLS1 reflects the hypothesized cline in cli-matic stress.
Shape changes. Because PLS1 already explains 94.3%of the covariance between nasal cavity shape and the cli-matic factors, description of shape changes will onlyfocus on the first singular warp. Figure 6 shows the firstsingular warp against the first climate LV score.Although there is intrapopulation variation, there is asignificant correlation [r 5 0.77, P (perm.) 5 0.0427]between the first pair of PLS scores, with higher thanaverage nasal shape scores in populations with high cli-mate LV scores (e.g., Gabon, Papua New Guinea, Aus-tralia) and low nasal shape scores in populations withlow climate LV scores (e.g., Siberia, Greenland).Shape changes related to PLS1 are summarized in
Figure 7. There are three regions of the nasal cavitythat show shape variation: 1) Nasal aperture, 2) Uppernasal cavity, and 3) Nasopharynx. Compared with highscoring populations (e.g. warm and humid climates), pop-ulations with low PLS1 scores (colder and drier climates)show a superior shift of rhinion, an inferior shift of theanterior nasal spine and a closer to midline positioningof the nasale landmarks and most inferior margins of
the nasal aperture. This results in a relatively higherand narrower nasal aperture (see Fig. 7). Furthermore,cold–dry climate populations have anterior and posteriorethmoid foramina positioned more superiorly and closerto midline. The anterior foramina are more closelyspaced than the posterior ones. This gives the appear-ance of a relatively high and narrow upper nasal cavity.In total, the landmarks of the nasal cavity landmarksshow a high and anteriorly narrowing nasal cavityshape. The superiormost margins of the choanae arelocated more posteriorly which increases the relativeposterior cavum length. The more anteriorly positionedpharyngeal tubercle and more posterior positioned post-erosuperior ends of the medial pterygoid plates shortenthe nasopharynx. Width of the nasopharynx does notshow variation, neither does height.
Multiple multivariate regression
To examine the separate effects of temperature andvapor pressure on nasal cavity shape, corrected foreffects of allometry, the nasal cavity shape coordinatesare regressed on Z-scored Tmean, Z-scored VPmean andCSnose simultaneously. Only a small percentage of thetotal variance within the sample can be explained byTmean (6.65%) and VPmean (5.48%). Centroid size, how-ever, explains an even smaller amount (3.52%). Togetherthe three factors explain 13.17%, indicating that there issome overlap in the morphology that the factors explain.Pearson correlation between regression scores andVPmean (with Tmean and Cnose kept constant) is lower(r 5 0.23, p 5 0.025) than the correlation betweenregression scores and Tmean (with VPmean and Cnosekept constant) (r 5 0.44, P \ 0.001). This could indicatethat vapor pressure has only a minor contribution toshape variation and that most of its correlation withshape is due to its high colinearity with temperature.
Shape changes Tmean. Visualizations of the nasal cav-ity shape changes related to Tmean, corrected forVPmean and CSnose effects, are shown in Figure 8.Compared with warm climates, nasal cavities from coldclimates show a superior shift of rhinion and thenasomaxillare landmarks, an inferior-posterior shift ofthe anterior nasal spine, left and right alare, and theinferiormost margins of the nasal aperture. The last twosets of landmarks are also located closer to the midline.This results in a higher and much narrower nasal aper-ture. Furthermore, cold climate nasal cavities show asuperior-anterior and closer to the midline position ofthe anterior ethmoid foramen, as well as a closer to themidline position of the posterior ethmoid foramen. Theselandmark shifts indicate an anteriorly narrower and lon-ger upper nasal cavity. Overall, the nasal cavity of coldpopulations is laterally narrowing from back to the front,compared with a widening in warm climate nasal cav-
TABLE 5. Loadings of the first two PLS vectors for the climatelatent variables
PLS1 PLS2
Tmean 0.433 20.394Tmin 0.417 20.349Tmax 0.430 20.422VPmean 0.392 0.434VPmin 0.376 0.437VPmax 0.400 0.407
8 M.L. NOBACK ET AL.
American Journal of Physical Anthropology

ities (Fig. 8, superior view). At the nasopharynx, severallandmarks change: an inferior shift of the inferolateralchoanal corners combined with a superior shift of thesuperiormost margins of the choanae increases choanaeheight, an anterior shift of hormion, an inferior shift ofthe posterosuperior end of the medial pterygoid platesand a posterior-inferior shift of the pharyngeal tubercle.This indicates a relatively elongated nasopharynx shapewith a smoother, less abrupt diameter size stepfrom nasopharynx to the posterior cavum due to highchoanae.
Shape changes VPmean. Visualization of the shapechanges related to VPmean (see Fig. 9), corrected forTmean and CSnose effects, shows nasal cavity shape dif-ferences between dry and humid climates. Comparedwith humid climates, dry climate nasal cavities show aninferior shift of rhinion and nasomaxillare, a superiorshift of the anterior nasal spine and inferiormost mar-gins of the nasal aperture, a posterior-inferior shift ofthe anterior ethmoid foramen and superiormost marginsof the choanae, a superior shift of the posterior ethmoidforamen and an superior-anterior shift of the pharyngealtubercle. Overall, these shifts result in lower nasal aper-tures in dry climates, with the nasal cavity taperingmore strongly from posterior to anterior compared withnasal cavities in humid climates. The nasopharynx indry climates is shortened, while the posterior cavum iselongated. The diameter size step from nasopharynx toposterior cavum is more abrupt in dry climate, due tohigher posterior cavum, lower choanae, and shorternasopharynx.
Shape changes CSnose. The shape changes related todifferences in nasal cavity size (CSnose with Tmean andVPmean kept constant) are shown in Figure 10. Overall,shape differences between the smallest and largest nasalcavities in the measured sample are relatively smallcompared with the climate-related changes. No changesin width of the cavity are observed. Compared withsmall nasal cavities, large noses show an anterior-superior shift of rhinion, an anterior-inferior shift of theanterior nasal spine, a posterior shift of nasale, and ananterior-inferior shift of the pharyngeal tubercle.
Fig. 6. PLS1: shape scores (singular warp 1) versus climatelatent variable scores (climate LV1). Color legend: see Figure 5.
Fig. 5. First two singular warp scores for the shape coordinates, with convex hulls marking the cold–dry (turquoise dashedline), cold–humid (dark blue line), hot–dry (orange dashed line) and hot–humid (red line) populations. Note that grouping of thepopulations on singular warp 1 corresponds with the climate latent variable 1 scores: cold populations have low PLS1 scores (lefttwo convex hulls), warm populations have high PLS1 scores (right two convex hulls).
9HUMAN NASAL CAVITY AND CLIMATE ADAPTATION
American Journal of Physical Anthropology

In all, the shape changes related to a trend from cold–dry to hot–humid climates shown by the PLS analysis(see Fig. 7) appear to combine two separate shape trendsvisible in the Multiple regressions on Tmean andVPmean (Figs. 8 and 9). The bony cavity itself is mostlyassociated with temperature, whereas the nasopharynxis mostly associated with humidity. In addition, there isa small allometric effect shown in both analyses.
Effects of interobserver error
Comparing the results obtained here with the findingsof the error test suggests that the outcome of the analy-ses is not biased by interobserver error. There is no cleardifference in PLS1 singular warp scores between the twocold–dry populations (see Fig. 6), even though one wasmeasured by FS (Siberia), and the other near-exclusivelyby MN (Greenland). The same can be seen for the twocold-humid populations, with one measured by FS(Aleutian Islands), and the other near-exclusively by MN(Tierra del Fuego).Second, we examined the impact of the one landmark
position most prone to interobserver error, the superior-most choanal margin (landmark 16, 17). Re-running thePLS analysis leaving out these landmarks, does notchange the results in any substantial way. PLS1 still cap-tures the morphological differences between cold–dry ver-
sus hot–humid climate groups, and all shifts in landmarksare the same (not shown here). The RV coefficient becomesslightly lower (0.208 instead of 0.225) and the first PLSexplains 94.6% of the total covariation within the sample(instead of 94.3%). The correlation between the two blocksbecomes slightly smaller (0.74 instead of 0.77).Third, FS measured 59% of the cold sample, but only
8% of hot sample. In the error test, he tended to placelandmarks 16 and 17 more posteriorly than MN. Hence,if cold populations would show a trend toward a moreposterior position of these landmarks this could indicatea bias caused by interobserver error. However, the multi-ple regression analyses show that the anteroposteriorposition of landmarks 16 and 17 is not correlated withTmean (see Fig. 8). It is correlated with VPmean (seeFig. 9), but FS measured near-equal parts of the humidand dry samples.
DISCUSSION
Hypothesis 1: correlations of climatewith cavity shape
Our first hypothesis is that there is a relationshipbetween climate and nasal cavity shape. The predictionsof this hypothesis were met by our results. We found sig-nificant correlations between nasal cavity shape and
Fig. 7. Comparing shape differences between low scoring populations ‘‘cold and dry’’ (20.04 on singular warp 1) and high scor-ing populations ‘‘warm and humid’’ (0.04 on singular warp 1). Showing anterior, superior, and lateral view of the nasal cavity wire-frame model. Light grey colored frame indicates average cavity shape. Areas with most shape change are indicated by arrows and/or colored grey for visualization purposes. Numbers correspond with the described three regions of morphological change: 1. Nasalaperture, 2. Upper nasal cavity, and 3. Nasopharynx.
10 M.L. NOBACK ET AL.
American Journal of Physical Anthropology

climatic factors of temperature and vapor pressure. Thissupplements earlier research that found significantcorrelations between temperature and the humanface (Harvati and Weaver, 2006b; Hubbe et al., 2009).Harvati and Weaver (2006b) found no significant correla-tions between vapor pressure and shape of the face.However, that study used no nasal landmarks. Hubbe etal. (2009) reported significant correlations between nasalmeasurements (breadth and height of the nasal aper-ture) and all the temperature variables used, as well astwo of the humidity measures (annual rainfall and rain-fall of the wettest month; vapor pressure was not usedin that study). Our findings indicate that the nasal cap-sule might be more strongly responding to climate, espe-cially vapor pressure, compared with the rest of the face.This supports the notion that the nasal capsule forms afunctional unit with a degree of independence from therest of the face (Carey and Steegmann, 1981). From bothtemperature and vapor pressure factors, the meanmonthly values were most highly correlated with nasalcavity shape. The PLS analysis showed that all climatefactors have a similar loading on the first PLS. This sug-gests that the minimum and maximum values of theclimate variables follow similar patterns as the meanvalues. Yearly variability, e.g., the amount of differencebetween minimum and maximum temperatures thus
does not seem to play an important role in nasal cavityshape.The second prediction, that trends in nasal cavity
shape follow climatic trends of increased difficulty of air-conditioning: from hot–humid to cold–dry, was also sup-ported. From the PLS analysis it is shown that nasalcavity shape depends on a combination of both tempera-ture and vapor pressure factors. Maximum covariationbetween nasal cavity shape and climatic factors follows acline from hot–humid to cold–dry climate, via hot–dryand cold–humid climate. Temperate populations score in-termediate. Although vapor pressure and temperaturefactors both have similar loadings on the first PLSdimension, the grouping of the populations indicatesthat the main difference in shape is related to tempera-ture (see Fig. 5). This contradicts the notion that humid-ity should play a more important role in nasal climateadaptation, as humidification is a more importantfactor for air-conditioning than temperature adjustment(Negus, 1958).Considering our hypothesis that dry and cold climate
would be the most difficult to condition air, weassumed that nasal cavity shape would follow similaradaptive trends toward more dry and towards morecold climates when humidity and temperature are con-sidered separately. This, however, appears not to bethe case. The multiple regression analysis showed that
Fig. 8. Comparing nasal cavity shape differences along regression on Tmean: cold climate morphology (left) versus hot climatemorphology (right). Showing posterior, inferior, and lateral views of the nasal cavity wireframe model. Light grey colored frameindicates average cavity shape. Areas with most shape change are marked in grey for visualization purposes.
11HUMAN NASAL CAVITY AND CLIMATE ADAPTATION
American Journal of Physical Anthropology

vapor pressure and temperature have opposite effectson nasal cavity shape (Figs. 8 and 9). For example,cold climates are related to higher nasal cavities withhigh nasal apertures and choanae, and elongatedupper nasal cavities, whereas dry climates are relatedto lower nasal cavities with low nasal apertures andshortened upper nasal cavities. The nasal cavity shapeeffect of temperature seems to be focused on increasingturbulence during inspiration by the anterior narrow-ing of the nasal cavity and increased air-wall contactby a relatively longer upper nasal cavity in colder cli-mates. The vapor pressure effect seems twofold: anincrease in the turbinate chamber length relative tothe nasopharynx and a focus on moisture retentionduring expiration in drier climates, with a larger di-ameter size step from nasopharynx to turbinate cham-ber. When combining both separate shape trends onecan arrive at a morphology as shown by the PLS anal-ysis. Although the multiple multivariate regressionanalysis can be used to study the separate effects oftemperature and humidity on nasal cavity shape, ourresults suggest that there might be a problem withanalyzing influence of factors with such high colinear-ity. It can be questioned how useful this untangling ofclimate factors is, as in nature temperature and vaporpressure are inseparable. A functional interpretation ofthe shape changes will therefore only be discussed forthe PLS results.
Combining the temperature and vapor pressureeffects in the PLS analysis (see Fig. 7), and comparingthis with the separate shape changes in the regressionanalysis (Figs. 8 and 9), it appears that in cold–dry cli-mates it is cold temperatures that most influence thenasal aperture and anterior narrowing of the cavity,whereas it is the low vapor pressure that has a stron-ger influence on the nasopharynx. Both climatic factorscause a superior shift of the ethmoid foramen, whichmakes an extra high upper nasal cavity in cold–dry cli-mates. It seems that a higher turbinate area mightindeed be very important for air-conditioning (Uliyanov,1998; Franciscus, 2003).Finally, we predicted that the relationship between cli-
mate and nasal cavity shape would hold irrespective ofsize differences. After correction for allometry nasal cav-ity shape is still correlated with temperature and vaporpressure, as predicted (Figs. 8 and 9). Although nasalcavity shape is significantly correlated with nose cent-roid size (Table 4), nose centroid size is neither corre-lated with temperature nor with humidity (Table 4:Tmean, VPmean). Therefore, it is unlikely that these cli-matic factors primarily affect nasal cavity size and shapevia allometric effects. Multiple multivariate regressionanalysis shows that there are only minor shape changesthat are related to nose centroid size (after correction forTmean and VPmean; see Fig. 10). Those shape changesare only related to the height of the nasal aperture (notthe width), and the position of the pharyngeal tubercle.
Fig. 9. Comparing nasal cavity shape differences along regression on VPmean: dry climate morphology (left) versus humid cli-mate morphology (right). Showing posterior, inferior, and sagittal views of the nasal cavity wireframe model. Light grey coloredframe indicates average cavity shape. Areas with most shape change are marked in grey for visualization purposes.
12 M.L. NOBACK ET AL.
American Journal of Physical Anthropology

They do not affect the width of the cavity, nor the height.After correction for centroid size, the shape changesremain visible for Tmean and VPmean. This indicatesthat the climatic effects observed in the PLS analysisare indeed not the result of allometry. As nasal cavitysize, Tmean and VPmean together only explained13.17% of the total nasal cavity shape variation, about67% of the total variation remains unexplained withincurrent research. This might indicate importance ofother factors such as turbinate morphology, soft tissuedifferences, influence of diet, lifestyle, age, and/or sex.
Hypothesis 2: cold–dry climate groups andair-wall contact
In nature, vapor and temperature effects are not sepa-rable. Therefore, a functional interpretation of nasal cav-ity morphology can only be given for the PLS results(and not for the regression results), as these provide arealistic overview of the combined effects of temperatureand vapor pressure. Table 6 summarizes the changes inhypothesized turbulence and contact time enhancing fea-tures in nasal cavity shape in hot–humid and cold–dryclimate.We predicted an increase in air-wall contact enhancing
features in cold–dry climate populations (turbulence,contact time, surface-volume ratio). Concerning thisprediction, nasal cavity morphology does show anincrease in air-wall contact with increasing difficulty ofair-conditioning in physiologically more demanding envi-ronments (Fig. 7, Table 6).Cold–dry climate populations show a decrease in
upper nasal cavity width, which increases surface/
volume ratio in this part of the cavity. This confirms pre-vious findings of a narrower superior ethmoidal breadthin supra-Saharan populations compared with sub-Saharan Bantu groups at any given interorbital width(Franciscus, 2003). The particular importance of the rel-atively narrower upper parts of the nose in conditioningof the air has previously been pointed out by Uliyanov(1998). The breadth of the upper nasal fossa might wellbe one of the critical internal nasal features for climateadaptation (Franciscus, 2003). The observed increasedheight in combination with a narrower upper nasal cav-ity in cold–dry populations in our study could thus berelated to the need to create such a narrow space with ahigh surface-volume ratio for air-conditioning, whilekeeping the nasal resistance sufficiently low. Further-more, a relatively decreased length of the nasopharynxin cold–dry populations might indicate increased impor-tance of the rest of the nasal cavity for air-conditioningfunctions. The actual area of air-conditioning (nasalvalve and turbinate chamber) (Keck et al., 2000) is rela-tively reduced in the hot–humid climate groups andincreases in size in colder and drier climate populations.Our results also showed an anterior widening of the
nasal cavity in hot–humid climate populations. This find-ing was not among the predictions of our hypotheses.During expiration, this nasal shape might result inreduced air-nose contact, reflecting the reduced need toretain moisture. In cold–dry populations the anteriorpart of the cavity is relatively narrow. This nasalaperture shape might cause an increased surface/volumeratio in the nasal entrance and could act as a mecha-nism to increase warmth and moisture conservation(Shea, 1977).
Fig. 10. Comparing nasal cavity shape differences along regression on Cnose (Tmean and VPmean kept constant): small nosemorphology (left) versus large nose morphology (right). Showing posterior, inferior, and sagittal views of the nasal cavity wireframemodel. Light grey colored frame indicates average cavity shape. Arrows indicate areas of largest shape changes.
13HUMAN NASAL CAVITY AND CLIMATE ADAPTATION
American Journal of Physical Anthropology

Our study further found that cold–dry nasal cavitiesdo indeed show an increase of features that enhance tur-bulence (see Fig. 7). The expected features in such envi-ronments (larger diameter of the cavity, especially cavityheight, and a pronounced diameter size step from ante-rior and posterior cavum to the turbinate chamber) arefound within the cold–dry population samples (see Table6). A higher cavity would result in an increase in turbu-lence due to its large diameter (Churchill et al., 2004). Alarge diameter size step has been found to result ingreater air turbulence (Mlynski et al. 2001). The inflowtract from the nostrils (not measured here) to the highnasal aperture of cold–dry populations might form anextra diameter size step at the nasal cavity entrance,creating a high level of turbulence immediately afterinspiration.Contrary to our expectations, some turbulence enhanc-
ing features are also found in hot–humid climates (seeTable 6). Importantly, hot–humid groups have a rela-tively large diameter size step from the posterior cavumto the turbinate chamber, which increases turbulence inthe nasal cavity during expiration (Mlynski et al., 2001).Such morphology could be expected in hot–dry climategroups and in cold groups to increase moisture retentionduring expiration (Franciscus and Trinkaus, 1988; Clem-ent and Gordts, 2005). Its occurrence here in hot–humidgroups seems contradictory. The wide nasal aperturemight create more turbulence during inspiration, but itspresence might be related to the reduction of contacttime between the air and mucosal tissue.Our results further show that populations from
hot–humid climates have a relatively lower overall nasalcavity. The observed decrease in overall height is a tur-bulence restricting feature, as a low diameter of a tubeenhances laminar flow (Churchill et al., 2004). Laminarflow is the most energy efficient way of breathing and istherefore expected to occur in environments where nei-ther warming nor humidification of the air is necessary(Churchill et al., 2004). This shape, however, alsoincreases surface/volume ratio which is an unexpectedfeature in climates where air-conditioning is relativelyeasier.For this article, we focused explicitly on the function
of the nasal cavity in conditioning the air to maintainlung function. However, other functions of the nose, suchas filtering, olfaction and a possible role in thermoregu-lation, might also affect nasal cavity shape. If we assumethat the nasal cavity plays a role in heat loss, theobserved morphology in hot and humid climate might beinterpreted as a way of increasing contact with the moistmucosal tissue to promote local evaporative cooling(Mariak et al. 1999). However, besides nasal cavity
dimensions, an important factor influencing the avail-able surface would be the structure and size of the turbi-nates. Future studies including internal measurementsmight clarify this issue further.Although this study documents clear trends in nasal
cavity shape, there is much intrapopulation variationand overlap among populations, especially in the inter-mediate climate groups. Furthermore, the observed dif-ferences are modest, perhaps because nasal shape is acompromise of its different functions (Churchill et al.,2004), or because extreme adaptations would reduce theversatility of humans as generalists and a mobilespecies.
CONCLUSIONS
Our study found significant correlations between nasalcavity morphology as reflected by our dataset and bothtemperature and vapor pressure variables. The bonynasal cavity appears mostly associated with tempera-ture, and the nasopharynx with humidity. Most impor-tantly, nasal cavities from cold–dry climates arerelatively higher and narrower compared with those ofhot–humid climates, agreeing with previous findings onthe nasal aperture. The shape changes found are func-tionally consistent with an increase in contact betweenair and mucosal tissue in cold–dry climates by increaseof turbulence during inspiration and increase in surface-to-volume ratio in the upper nasal cavity. However, theobserved shape differences are relatively modest andshow population overlap, which might indicate a compro-mise morphology of the nasal cavity and/or the absenceof extreme adaptations that would reduce the versatilityof humans as generalists and a mobile species. Futurestudy including internal measurements and larger/morediverse population samples will further refine our find-ings and improve our understanding of the role of thenasal cavity in modern human climate adaptation.
ACKNOWLEDGMENTS
We thank Chris Stringer, Rob Kruszynski, Ian Tatter-sall, and Giselle Garcia for allowing access to the cranialmaterial and for sharing their knowledge on the collec-tions. We are also grateful to Susan Anton, Markus Bas-tir, Fred Bookstein, Will Harcourt-Smith, Mark Hubbe,Chris Klingenberg, the late Charles Lockwood, PaulO’Higgins, Geert Jan van Oldenborgh, Christophe Sol-igo, and Martin Todd for helpful discussion and advice.We thank the Editor and Associate Editor of the Ameri-can Journal of Physical Anthropology and two anony-
TABLE 6. Overview of contact time enhancing (1) or decreasing (2) features in populations from cold–dry and hot–humid climates
Feature Cold–dry Hot–humid
High surface-volume ratio 1 Narrow superior cavity 2 Wide superior cavity1 Narrow nasal aperture 2 Wide nasal aperture
Long cavity length 1 Long bony cavity relative tonasopharynx length
2 Short bony cavity relative tonasopharynx length
High turbulence 1 Higher cavity and nasal aperture 2 Lower cavity and nasal aperture1 Increased anterior degree of increase in
cross-sectional area2 Decreased anterior degree of increase
in cross-sectional area1 Anterior narrowing cavity 2 Anterior broadening cavity2 Narrow nasal aperture 1 Wide nasal aperture2 Decreased degree of increase in posterior
cross-sectional area1 Increased posterior degree of increase
in cross-sectional area
14 M.L. NOBACK ET AL.
American Journal of Physical Anthropology

mous reviewers. Their comments and suggestionsgreatly improved this manuscript.
LITERATURE CITED
Baker PT. 1988. Human adaptability. In: Harrison GA, TannerJM, Pilbeam DR, Baker PT, editors. Human biology: an intro-duction to human evolution, variation, growth and adaptabil-ity. Oxford: Oxford University Press. p 437–547.
Beals KL, Courtland LS, Dodd SM, Angel JL, Armstrong E,Blumenberg B, Girgis FG, Turkel S, Gibson KR, HennebergM, Menk R, Morimoto I, Sokal RR, Trinkaus E. 1984. Brainsize, cranial morphology, climate, and time machines [andcomments and reply]. Curr Anthropol 25:301–330.
Bookstein FL. 1991. Morphometric tools for landmark data.New York: Cambridge University Press.
Bookstein FL, Gunz P, Mitteroecker P, Prossinger H, SchaeferK, Seidler H. 2003. Cranial integration in Homo: singularwarps analysis of the midsagittal plane in ontogeny and evo-lution. J Hum Evol 44:167–187.
Bookstein, FL, Sampson, PD, Streissguth AP. 1996. Exploitingredundant measurement of dose and developmental outcome:new methods from the behavioral teratology of alcohol. DevPsychol 32:e404–e415
Brauer G. 1988. Osteometrie. In: Knußmann R, editor. Anthro-pologie—Handbuch der vergleichenden Biologie des Men-schen. Stuttgart: Gustav Fischer Verlag. p 160–232.
Cabanac M, Caputa M. 1979. Natural selective cooling of thehuman brain: evidence of its occurrence and magnitude.J Physiol 286:255–264.
Carey JW, Steegmann AT. 1981. Human nasal protrusion, lati-tude, and climate. Am J Phys Anthropol 56:313–319.
Churchill SE, Shackelford LL, Georgi JN, Black MT. 2004.Morphological variation and airflow dynamics in the humannose. Am J Hum Biol 16:625–638.
Clement PAR, Gordts E. 2005. Consensus report on acousticrhinometry and rhinomanometry. Rhinology 43:169–179.
Cole P. 1982. Upper respiratory airflow. In: Proctor DF, Ander-sen IB, editors. The nose: upper airway physiology and theatmospheric environment. Amsterdam: Elsevier BiomedicalPress. p 163–189.
Cole P. 2000. Biophysics of nasal airflow: a review. Am J Rhinol14:245–249.
Corey JP, Gungor A, Nelson R, Liu XL, Fredberg J. 1998. Nor-mative standards for nasal cross-sectional areas by race asmeasured by acoustic rhinometry. Otolaryngol Head NeckSurg 119:389–393.
Courtiss EH, Goldwyn RM. 1983. The effects of nasal surgeryon air-flow. Plast Reconstr Surg 72:9–19.
Davies A. 1932. A re-survey of the morphology of the nose inrelation to climate. J R Anthropol Inst 62:337–359.
Dean MC. 1988. Another look at the nose and the functionalsignificance of the face and nasal mucous membrane for cool-ing the brain in fossil hominids. J Hum Evol 17:715–718.
Deklunder G, Dauzat M, Lecroart JL, Hauser JJ, Houdas Y.1991. Influence of ventilation of the face on thermoregulationin man during hyperthermia and hypothermia. Eur J ApplPhysiol 62:342–348.
Franciscus RG. 2003. Comparing internal nasal fossa dimen-sions and classical measures of the external nasal skeleton inrecent humans: inferences for respiratory airflow dynamicsand climatic adaptation. Am J Phys Anthropol Suppl 36:96–97.
Franciscus RG, Long JC. 1991. Variation in human nasal heightand breadth. Am J Phys Anthropol 85:419–427.
Franciscus RG, Trinkaus E. 1988. Nasal morphology and theemergence of Homo erectus. Am J Phys Anthropol 75:517–527.
Gil JA, Romera R. 1998. On robust partial least squares (PLS)methods. J Chemomet 12:365–378.
Hall RL. 2005. Energetics of nose and mouth breathing, bodysize, body composition, and nose volume in young adult malesand females. Am J Hum Biol 17:321–330.
Harvati K. 2003. The Neanderthal taxonomic position: modelsof intra- and inter-specific craniofacial variation. J Hum Evol44:107–132.
Harvati K, Weaver T. 2006a. Reliability of cranial morphologyin reconstructing Neanderthal phylogeny. In: Hublin J-J,Harvati K, Harrison T, editors. Neanderthals revisited:new approaches and perspectives. Netherlands: Springer.p 239–254.
Harvati K, Weaver TD. 2006b. Human cranial anatomy and thedifferential preservation of population history and climate sig-natures. Anat Rec A 288:1225–1233.
Hubbe M, Hanihara T, Harvati K. 2009. Climate signatures inthe morphological differentiation of worldwide modern humanpopulations. Anat Rec A 292:1720–1733.
Inthavong K, Tian ZF, Tu JY. 2007. CFD simulations on theheating capability in a human nasal cavity. In: Jacobs P,McIntyre T, Cleary M, Buttsworth D, Mee R, Clements R,Morgan R, Lemckert C, editors. Proceedings of the 16th Aus-tralasian Fluid Mechanical Conference (AFMC). Gold Coast,Queensland, Australia. p 842–847.
Jessen C, Kuhnen G. 1992. No evidence for brain-stem coolingduring face fanning in humans. J Appl Physiol 72:664–669.
Keck T, Leiacker R, Heinrich A, Kuhnemann S, Rettinger G.2000. Humidity and temperature profile in the nasal cavity.Rhinology 38:167–171.
Klingenberg CP. 2011. MorphoJ: an integrated software packagefor geometric morphometrics. Mol Ecol Res 11:353–357.
Klingenberg CP, Monteiro LR. 2005. Distances and directions inmultidimensional shape spaces: implications for morphometricapplications. Syst Biol 54:678–688.
Lieberman DE. 2011. The evolution of the human head. Cam-bridge, MA: Belknap Press.
Lockwood CA, Lynch JM, Kimbel WH. 2002. Quantifying tempo-ral bone morphology of great apes and humans: an approachusing geometric morphometrics. J Anat 201:447–464.
Maloney SK, Mitchell D, Mitchell G, Fuller A. 2007. Absence ofselective brain cooling in unrestrained baboons exposed toheat. Am J Physiol Regul Integr Comp Physiol 292:R2059–R2067.
Manfreda E, Mitteroecker P, Bookstein FL, Schaefer K. 2006.Functional morphology of the first cervical vertebra inhumans and nonhuman primates. Anat Rec B 289:1552–4906.
Mantel N. 1967. Detection of disease clustering and a general-ized regression approach. Cancer Res 27:209–220.
Mariak Z, White MD, Lewko J, Lyson T, Piekarski P. 1999.Direct cooling of the human brain by heat loss from the upperrespiratory tract. J Appl Physiol 87:1609–1613.
Mekjavic IB, Rogelj K, Radobuljac M, Eiken O. 2002. Inhalationof warm and cold air does not influence brain stem or core tem-perature in normothermic humans. J Appl Physiol 93:65–69.
Mitteroecker P, Gunz P. 2009. Advances in geometric morpho-metrics. Evol Biol 36:235–247.
Mlynski G, Grutzenmacher S, Plontke S, Mlynski B, Lang C.2001. Correlation of nasal morphology and respiratory func-tion. Rhinology 39:197–201.
Morgan NJ, Macgregor FB, Birchall MA, Lund VJ, SittampalamY. 1995. Racial differences in nasal fossa dimensions deter-mined by acoustic rhinometry. Rhinology 33:224–228.
Mowbray K, Gannon PJ. 2001. Unique anatomy of the Neander-thal skull. Athena Rev 4:59–64.
Neff NA, Marcus LF. 1980. A survey of multivariate methodsfor systematics. New York: Privately published.
Negus V. 1958. The comparative anatomy and physiology of thenose and paranasal sinuses. Edinburgh: E. & S. LivingstoneLtd.
O’Higgins P, Jones N. 1998. Facial growth in Cercocebus torqua-tus: an application of three dimensional geometric morpho-metric techniques to the study of morphological variation.J Anat 193:251–272.
Relethford JH. 2001. Global analysis of regional differences incraniometric diversity and population substructure. Hum Biol73:629–636.
Relethford JH. 2004. Boas and beyond: migration and cranio-metric variation. Am J Hum Biol 16:379–386.
15HUMAN NASAL CAVITY AND CLIMATE ADAPTATION
American Journal of Physical Anthropology

Rohlf FJ. 1990. Rotational fit (Procrustes) methods. In: RohlfFJ, Bookstein FL, editors. Proceedings of the MichiganMorphometrics Workshop. Ann Arbor: University of MichiganMuseum of Zoology. p 227–236.
Rohlf FJ, Corti M. 2000. Use of two-block partial least-squaresto study covariation in shape. Syst Biol 49:740–753.
Rohlf FJ, Marcus LF. 1993. A revolution in morphometrics.Trends Ecol Evol 8:129–132.
Roseman CC. 2004. Detecting interregionally diversifying natu-ral selection on modern human cranial form by using matchedmolecular and morphometric data. Proc Natl Acad Sci USA101:12824–12829.
Shea BT. 1977. Eskimo craniofacial morphology, cold stress andmaxillary sinus. Am J Phys Anthropol 47:289–300.
Slice DE. 1996. Three-dimensional generalized resistance fittingand the comparison of least squares and resistant fit resid-uals. In: Marcus LF, Corti M, Loy A, Naylor GJP, Slice DE,editors. Advances in morphometrics. NATO ASI Series. NewYork: Plenum Press. p 179–199.
St. Hoyme LE, Iscan MY. 1989. Determination of sex and race:accuracy and assumptions. In: Iscan MY, Kennedy KAR, edi-tors. Reconstruction of life from the skeleton. New York: AlanR. Liss Inc. p 53–93.
Thomas A, Buxton LHD. 1923. Man’s nasal index in relation tocertain climatic conditions. J R Anthropol Inst 53:92–122.
Uliyanov YP. 1998. Clinical manifestations of the variants ofnasal aerodynamics. Otolaryngol Head Neck Surg 152:152–153. Available at: http://www.airsilver.net/ch125.html(accessed August 2010).
van Oldenborgh GJ, Balmaseda MA, Ferranti L, Stockdale TN,and Anderson DLT. 2005. Evaluation of atmospheric fieldsfrom the ECMWF seasonal forecasts over a 15 year period.J Climate 18:3250–3269.
Weiner JS. 1954. Nose shape and climate. Am J Phys Anthropol12:615–618.
Yokley TR. 2009. Ecogeographic variation in human nasal pas-sages. Am J Phys Anthropol 138:11–22.
16 M.L. NOBACK ET AL.
American Journal of Physical Anthropology