Ancient trees, climate models, and the future of drought in western Colorado

Climate of Western Colorado
Joe RameyNational Weather Service
Grand Junction, COhttp://www.weather.gov/gjt

Outline
• Present
- What is the nature of climate in western Colorado?
- Where are we now?
• Past Temperature and Precipitation Trends
- for the last 100 years
- for the last 5 years
• Future
- El Nino Southern Oscillation (ENSO)
- Climate Prediction Center’s Outlook into 2017
(new CPC outlooks were issued today!)

What is Climate Normal?
• Answer: 30 Year Average, updated every 10
years.
• The latest climate normal is 1981-2010.
• Now we are half way to a new climate
normal period that will be 1991-2020.


2015
1997 1982
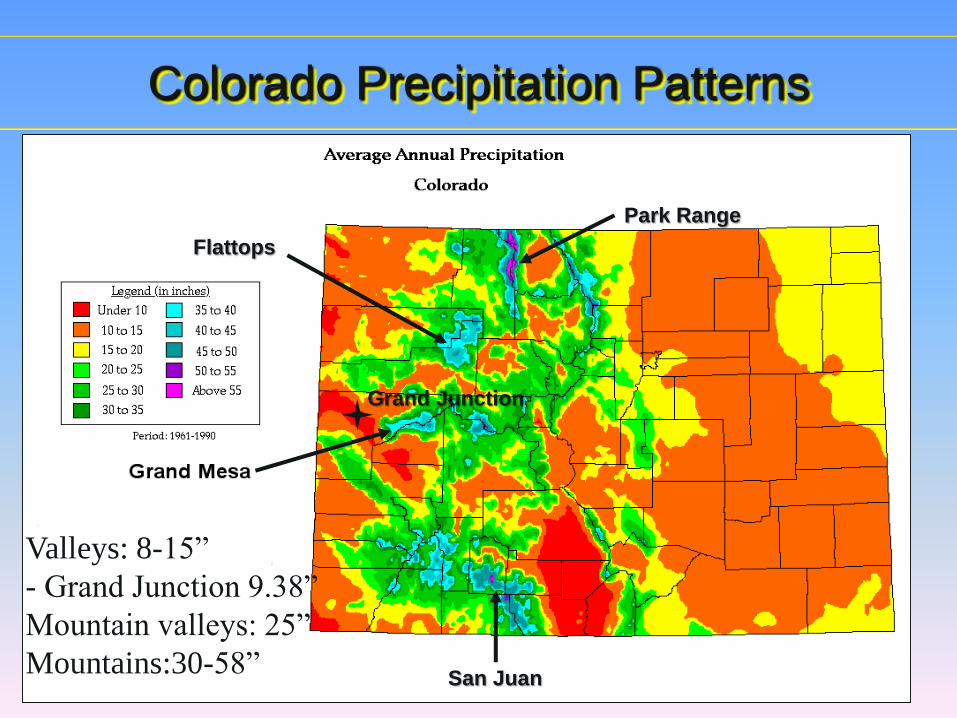
Colorado Precipitation Patterns
San Juan
Flattops
Park Range
Grand Junction
Valleys: 8-15”
- Grand Junction 9.38”
Mountain valleys: 25”
Mountains:30-58”

Western Colorado Climate
• Colorado has a continental, semi-arid
climate. • Experiences large temperature and
precipitation variation at all time scales.
• Our precipitation falls mainly in the high
country.• Snowpack is a natural reservoir.
• All Colorado rivers, but the Green, originate
here and flow out of state.

Steamboat Springs
..
Winter Park
. Breckenridge
. Crested Butte
Aspen .
. Silverton
-Seven Snow Study Sites-
Chosen for their long climate records
Valley Coop Sites, Not Ski Areas
Telluride*Up to 2008


Drier
than
normal

Wetter
than
normal
Drier
than
normal

Western Colorado Climate History
• Colorado has enjoyed a wet year.
• What about the previous five years?• How does 2011-2015 compare to the current
30 year average 1981-2010?
• What about the last 100 years?

Station Elevation (ft) Tmax Tmin Tave Precipitation
Dinosaur N.M. 5900 -0.7 1.6 0.5 -2.56
Steamboat Springs 6960 -0.1 1 0.4 0.37
Colorado N.M. 5660 -0.7 2.4 0.9 0.47
Grand Junction 4858 -0.4 -1.1 -0.8 1.01
Paonia 5645 -0.3 -0.4 -0.4 0.15
Crested Butte 8860 1.3 0.5 0.9 -3.43
Montrose 5760 0.8 1.3 1.1 -0.28
Gunnison 7640 0.2 0.4 0.2 -1.1
Silverton 9320 0.8 0.6 0.5 -2.2
Hovenweep N.M. 5210 0.6 1.8 1.3 0.11
Cortez 6153 1.7 2 1.8 -0.26
Mesa Verde N.P. 7115 0.9 2.1 1.5 -2.21
Flaming Gorge N.R.A. 6040 0.7 2.9 1.9 -2.52
Vernal 5278 -0.6 2.1 0.7 -0.54
Moab 4026 -1.1 0.3 -0.4 0.35
Canyonlands The Neck 5930 0.2 1.6 0.9 0.48
Canyonlands The Needles 4998 -0.4 0 -0.2 -0.21
Natural Bridges N.M. 6500 0.3 0.3 0.4 -0.82
Blanding 6039 -0.6 2 0.7 -2.02
Mexican Hat 4130 1.2 1.1 1.1 -0.56
Total Average 6101 0.2 1.1 0.7 -0.8
Changes in Monthly Average (1981 to 2010)-(2011 to 2015) in degrees F or inches of Precipitation
(positive values mean 2011-2015 years are warmer/wetter)
• In the last 5 years,
the region has been
drier and warmer,
especially in our
low temperatures.
• Grand Junction,
wetter and cooler.

Changes in Monthly Average (1981 to 2010)-(2011 to 2015) in degrees F or inches of Precipitation
(positive values mean 2011-2015 years are warmer/wetter)
For 2011-2015, the drying trend has been stronger in higher elevations.
Stations Below 6000 ft Tmax Tmin Tave Precipitation
Dinosaur N.M. -0.7 1.6 0.5 -2.56
Colorado N.M. -0.7 2.4 0.9 0.47
Grand Junction -0.4 -1.1 -0.8 1.01
Paonia -0.3 -0.4 -0.4 0.15
Montrose 0.8 1.3 1.1 -0.28
Hovenweep N.M. 0.6 1.8 1.3 0.11
Vernal -0.6 2.1 0.7 -0.54
Moab -1.1 0.3 -0.4 0.35
Canyonlands The Neck 0.2 1.6 0.9 0.48
Canyonlands The Needles -0.4 0 -0.2 -0.21
Mexican Hat 1.2 1.1 1.1 -0.56
Low Elevation Average -0.1 1.0 0.4 -0.14
Stations Above 6000 ft Tmax Tmin Tave Precipitation
Steamboat Springs -0.1 1 0.4 0.37
Crested Butte 1.3 0.5 0.9 -3.43
Gunnison 0.2 0.4 0.2 -1.1
Silverton 0.76 0.64 0.52 -2.2
Cortez 1.7 2 1.8 -0.26
Mesa Verde N.P. 0.9 2.1 1.5 -2.21
Flaming Gorge N.R.A. 0.7 2.9 1.9 -2.52
Natural Bridges N.M. 0.3 0.3 0.4 -0.82
Blanding -0.6 2 0.7 -2.02
High Elevation Average 0.6 1.3 0.9 -1.58
Stations Above 8500 ft Tmax Tmin Tave Precipitation
Crested Butte 1.3 0.5 0.9 -3.43
Silverton 0.76 0.64 0.52 -2.2
Highest Elevation Average 1.0 0.6 0.7 -2.82

Study Sites with Climate Data back to 1911
Eleven sites,
average elevation
6558 feetColoradoUtah
Wyoming

Problems with Climate Sites
(Grand Junction Example)
• The site could have moved

Problems with Climate Sites
(Grand Junction Example)
• Urbanization can create local warming

Problems with Climate Sites
(Grand Junction Example)
• Instrumentation has changed

Where Are These Site Problems Minimized?
• National Parks and Monuments• Faming Gorge NWR 1958
• Dinosaur NM 1964
• Ouray NWR 1956
• Colorado NM 1940
• Canyonlands (Neck and Needles) 1965
• Natural Bridges NM 1965
• Hovenweep NM 1957
• Mesa Verde NP 1924

National Parks and Monuments
with Climate Data back to 1961
Nine sites,
Average elevation:
5839 feet
Colorado National Monument
climate site

Maximum Temperatures per Decade since 1911

Minimum Temperatures per Decade since 1911
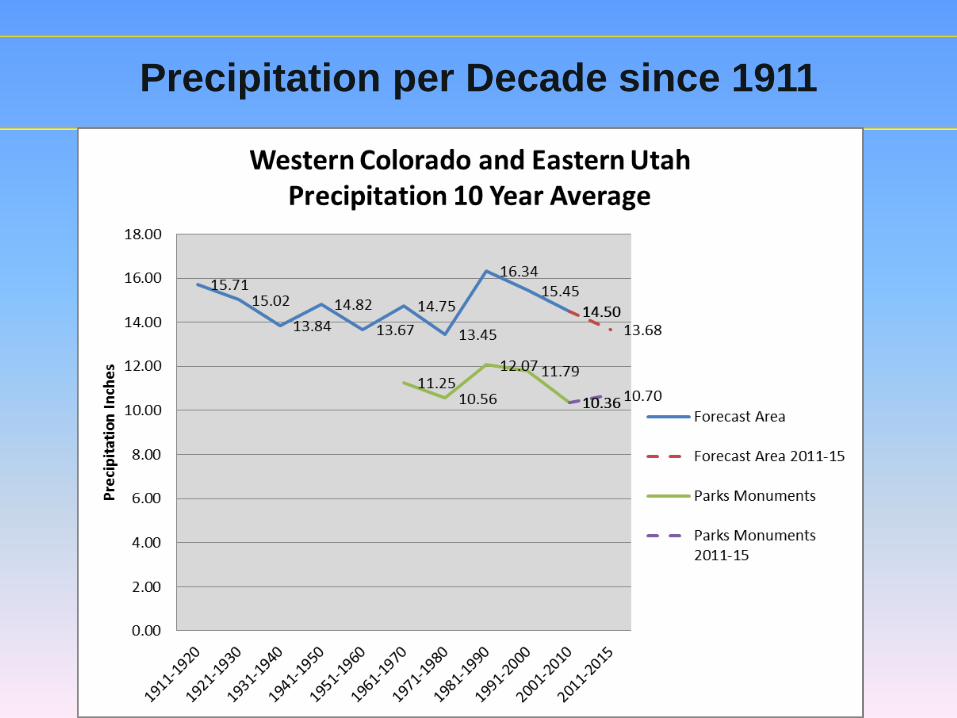
Precipitation per Decade since 1911

Western Colorado Climate History
• The last five years have showed a drying
and partial warming trend.
• The last 100 years have shown large
variations in precipitation.
• The last 100 years have shown little change
in maximum temperatures.
• Minimum temperatures have shown a
warming trend since the 1970s.

Climate Future
• A climate outlook for the El Niño spring
season.
• Who knows for summer!
• An outlook into a La Niña winter.
• El Niño Southern Oscillation

El Niño Southern Oscillation (ENSO)
• Simple Definition: variance from normal sea surface temperatures (and sea level pressure and winds) in the eastern equatorial Pacific Ocean.
El Niño: a warm change (+ENSO)
La Niña: a cold change (-ENSO)
• ENSO changes the jet streams
(winds aloft) which changes the
storm track with resulting
predictable effects
• ENSO effects are felt mainly in the
cold season
• ENSO: primary winter outlook tool

Current Pacific Conditions:
Current Ocean Niño Index 2.3 (strong), this week 2.5,
Current Pacific Decadal Oscillation 1.53 (also quite warm)
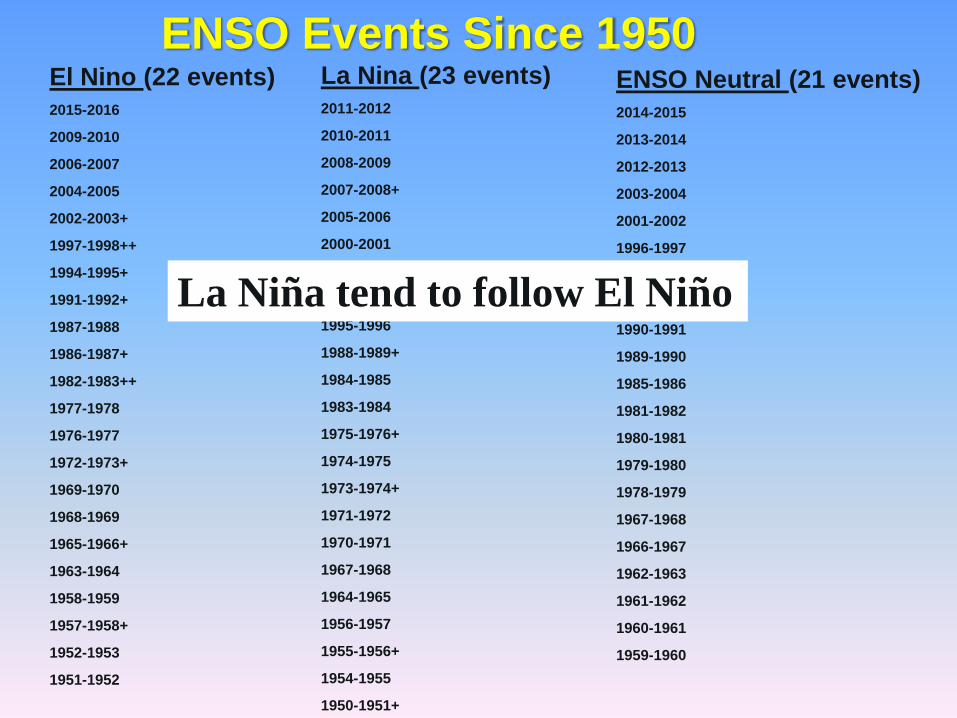
El Nino (22 events)2015-2016
2009-2010
2006-2007
2004-2005
2002-2003+
1997-1998++
1994-1995+
1991-1992+
1987-1988
1986-1987+
1982-1983++
1977-1978
1976-1977
1972-1973+
1969-1970
1968-1969
1965-1966+
1963-1964
1958-1959
1957-1958+
1952-1953
1951-1952
La Nina (23 events)2011-2012
2010-2011
2008-2009
2007-2008+
2005-2006
2000-2001
1999-2000+
1998-1999+
1995-1996
1988-1989+
1984-1985
1983-1984
1975-1976+
1974-1975
1973-1974+
1971-1972
1970-1971
1967-1968
1964-1965
1956-1957
1955-1956+
1954-1955
1950-1951+
ENSO Events Since 1950ENSO Neutral (21 events)2014-2015
2013-2014
2012-2013
2003-2004
2001-2002
1996-1997
1993-1994
1992-1993
1990-1991
1989-1990
1985-1986
1981-1982
1980-1981
1979-1980
1978-1979
1967-1968
1966-1967
1962-1963
1961-1962
1960-1961
1959-1960
La Niña tend to follow El Niño

• El Niño
Dry and Warm
North of Colorado
Wet and Cool
South of Colorado
• La Niña
Wet and Cold
North of Colorado
Dry and Warm
South of Colorado

0
5
10
15
20
25
30
35
40
JUL AUG SEP OCT NOV DEC JAN FEB MAR APR MAY JUN
Mo
nth
ly S
no
wfa
ll I
nch
esSeven Colorado Mountain Sites
El Nino Average
La Nina Ave
30 Year Average 1981-2010
La Niña: a wet December-January (northern mountains)


ENSO Review
• ENSO is an important part of long-range national forecasts
• Colorado precipitation is highly variable and has some subtle cold season response to ENSO
• El Niño tends to produce a wetter spring and fall.
• El Niño years are wetter south, drier north.
• La Niña produces a snowier heart of winter, centered on January, wetter north, drier south.
• The ENSO dividing line is roughly the I-70 corridor.

PrecipitationTemperature
Climate Prediction Center’s Outlook
For Spring Season March-April-May

PrecipitationTemperature
Climate Prediction Center’s Outlook
For Summer Season June-July-August

PrecipitationTemperature
Climate Prediction Center’s Outlook
For Fall Season Sep-Oct-Nov

PrecipitationTemperature
Climate Prediction Center’s Outlook
For Winter Season Dec-Jan-Feb

Climate Outlook Review
• El Niño has produced a wet winter season for Colorado so far.
• El Niño springs are typically wet.
• Summer climate signals are weak for precipitation, but with a shift towards warmer then normal.
• La Niña may develop next fall and winter.
• La Niña tends to produce a dry autumn.
• La Niña tends to produce a snowy heart of winter mainly across northwest Colorado.

Questions?