Climate indices in historical climate reconstructions: a ...
42
Clim. Past, 17, 1273–1314, 2021 https://doi.org/10.5194/cp-17-1273-2021 © Author(s) 2021. This work is distributed under the Creative Commons Attribution 4.0 License. Climate indices in historical climate reconstructions: a global state of the art David J. Nash 1,2 , George C. D. Adamson 3 , Linden Ashcroft 4,5 , Martin Bauch 6 , Chantal Camenisch 7,8 , Dagomar Degroot 9 , Joelle Gergis 10,11 , Adrian Jusopovi´ c 12 , Thomas Labbé 6,13 , Kuan-Hui Elaine Lin 14,15 , Sharon D. Nicholson 16 , Qing Pei 17 , María del Rosario Prieto 18,19, , Ursula Rack 20 , Facundo Rojas 18,19 , and Sam White 21 1 School of Environment and Technology, University of Brighton, Brighton, UK 2 School of Geography, Archaeology and Environmental Studies, University of the Witwatersrand, Johannesburg, South Africa 3 Department of Geography, King’s College London, London, UK 4 School of Earth Sciences, University of Melbourne, Melbourne, Australia 5 ARC Centre of Excellence for Climate Extremes, University of Melbourne, Melbourne, Australia 6 Leibniz Institute for the History and Culture of Eastern Europe, University of Leipzig, Leipzig, Germany 7 Oeschger Centre for Climate Change Research, University of Bern, Bern, Switzerland 8 Institute of History, University of Bern, Bern, Switzerland 9 Department of History, Georgetown University, Washington DC, USA 10 Fenner School of Environment & Society, Australian National University, Canberra, Australia 11 ARC Centre of Excellence for Climate Extremes, Australian National University, Canberra, Australia 12 Institute of History, Polish Academy of Sciences, Warsaw, Poland 13 Maison des Sciences de l’Homme de Dijon, University of Burgundy, Dijon, France 14 Research Center for Environmental Changes, Academia Sinica, Taipei, Taiwan 15 Graduate Institute of Environmental Education, National Taiwan Normal University, Taipei, Taiwan 16 Department of Earth, Ocean, and Atmospheric Science, Florida State University, Tallahassee, Florida, USA 17 Department of Social Sciences, Education University of Hong Kong, Hong Kong SAR, Peoples Republic of China 18 Argentine Institute of Nivology, Glaciology and Environmental Sciences (IANIGLA-CONICET), Mendoza, Argentina 19 Facultad de Filosofía y Letras, Universidad Nacional de Cuyo, Mendoza, Argentina 20 Gateway Antarctica, University of Canterbury, Christchurch, New Zealand 21 Department of History, Ohio State University, Columbus, Ohio, USA deceased Correspondence: David J. Nash ([email protected]) Received: 23 September 2020 – Discussion started: 9 October 2020 Revised: 5 May 2021 – Accepted: 7 May 2021 – Published: 17 June 2021 Abstract. Narrative evidence contained within historical documents and inscriptions provides an important record of climate variability for periods prior to the onset of systematic meteorological data collection. A common approach used by historical climatologists to convert such qualitative informa- tion into continuous quantitative proxy data is through the generation of ordinal-scale climate indices. There is, how- ever, considerable variability in the types of phenomena re- constructed using an index approach and the practice of index development in different parts of the world. This review, writ- ten by members of the PAGES (Past Global Changes) CRIAS working group – a collective of climate historians and his- torical climatologists researching Climate Reconstructions and Impacts from the Archives of Societies – provides the first global synthesis of the use of the index approach in climate reconstruction. We begin by summarising the range of studies that have used indices for climate reconstruction across six continents (Europe, Asia, Africa, the Americas, Published by Copernicus Publications on behalf of the European Geosciences Union.
Transcript of Climate indices in historical climate reconstructions: a ...

Clim. Past, 17, 1273–1314, 2021https://doi.org/10.5194/cp-17-1273-2021© Author(s) 2021. This work is distributed underthe Creative Commons Attribution 4.0 License.
Climate indices in historical climate reconstructions:a global state of the artDavid J. Nash1,2, George C. D. Adamson3, Linden Ashcroft4,5, Martin Bauch6, Chantal Camenisch7,8,Dagomar Degroot9, Joelle Gergis10,11, Adrian Jusopovic12, Thomas Labbé6,13, Kuan-Hui Elaine Lin14,15,Sharon D. Nicholson16, Qing Pei17, María del Rosario Prieto18,19,�, Ursula Rack20, Facundo Rojas18,19, andSam White21
1School of Environment and Technology, University of Brighton, Brighton, UK2School of Geography, Archaeology and Environmental Studies, University of the Witwatersrand, Johannesburg, South Africa3Department of Geography, King’s College London, London, UK4School of Earth Sciences, University of Melbourne, Melbourne, Australia5ARC Centre of Excellence for Climate Extremes, University of Melbourne, Melbourne, Australia6Leibniz Institute for the History and Culture of Eastern Europe, University of Leipzig, Leipzig, Germany7Oeschger Centre for Climate Change Research, University of Bern, Bern, Switzerland8Institute of History, University of Bern, Bern, Switzerland9Department of History, Georgetown University, Washington DC, USA10Fenner School of Environment & Society, Australian National University, Canberra, Australia11ARC Centre of Excellence for Climate Extremes, Australian National University, Canberra, Australia12Institute of History, Polish Academy of Sciences, Warsaw, Poland13Maison des Sciences de l’Homme de Dijon, University of Burgundy, Dijon, France14Research Center for Environmental Changes, Academia Sinica, Taipei, Taiwan15Graduate Institute of Environmental Education, National Taiwan Normal University, Taipei, Taiwan16Department of Earth, Ocean, and Atmospheric Science, Florida State University, Tallahassee, Florida, USA17Department of Social Sciences, Education University of Hong Kong, Hong Kong SAR, Peoples Republic of China18Argentine Institute of Nivology, Glaciology and Environmental Sciences (IANIGLA-CONICET), Mendoza, Argentina19Facultad de Filosofía y Letras, Universidad Nacional de Cuyo, Mendoza, Argentina20Gateway Antarctica, University of Canterbury, Christchurch, New Zealand21Department of History, Ohio State University, Columbus, Ohio, USA�deceased
Correspondence: David J. Nash ([email protected])
Received: 23 September 2020 – Discussion started: 9 October 2020Revised: 5 May 2021 – Accepted: 7 May 2021 – Published: 17 June 2021
Abstract. Narrative evidence contained within historicaldocuments and inscriptions provides an important record ofclimate variability for periods prior to the onset of systematicmeteorological data collection. A common approach used byhistorical climatologists to convert such qualitative informa-tion into continuous quantitative proxy data is through thegeneration of ordinal-scale climate indices. There is, how-ever, considerable variability in the types of phenomena re-constructed using an index approach and the practice of index
development in different parts of the world. This review, writ-ten by members of the PAGES (Past Global Changes) CRIASworking group – a collective of climate historians and his-torical climatologists researching Climate Reconstructionsand Impacts from the Archives of Societies – provides thefirst global synthesis of the use of the index approach inclimate reconstruction. We begin by summarising the rangeof studies that have used indices for climate reconstructionacross six continents (Europe, Asia, Africa, the Americas,
Published by Copernicus Publications on behalf of the European Geosciences Union.

1274 D. J. Nash et al.: Climate indices in historical climate reconstructions
and Australia) as well as the world’s oceans. We then out-line the different methods by which indices are developed ineach of these regions, including a discussion of the processesadopted to verify and calibrate index series, and the mea-sures used to express confidence and uncertainty. We con-clude with a series of recommendations to guide the develop-ment of future index-based climate reconstructions to max-imise their effectiveness for use by climate modellers and inmultiproxy climate reconstructions.
1 Introduction
Much of the effort of the palaeoclimatological communityin recent decades has focused on understanding long-termchanges in climate, typically at millennial, centennial, or atbest (in the case of dendroclimatology and palaeolimnol-ogy) sub-decadal to annual resolution. The results of thisresearch have revolutionised our knowledge of both how cli-mates have varied in the past and the potential drivers of suchvariability. However, as Pfister et al. (2018) identify, the re-sults of palaeoclimate research are often at a temporal andspatial scale that is not suitable for understanding the short-term and local impacts of climate variability upon economiesand societies. To this end, historical climatologists work toreconstruct high-resolution – annual, seasonal, monthly andin some cases daily – series of past temperature and precipita-tion variability from the archives of societies, as these are thescales at which weather impacts upon individuals and com-munities (e.g. Allan et al., 2016; Brönnimann et al., 2019).
The archives of societies, used here in a broad sense to re-fer to both written records and evidence preserved in the builtenvironment (e.g. historic flood markers, inscriptions), con-tain extensive information about past local weather and itsrepercussions for the natural environment and on daily lives.Information sources include, but are not limited to, annals;chronicles; inscriptions; letters; diaries/journals (includingweather diaries); newspapers; financial, legal, and adminis-trative documents; ships’ logbooks; literature; poems; songs;paintings; and pictographic and epigraphic records (Brázdilet al., 2005, 2010, 2018; Pfister, 2018; Rohr et al., 2018).Three main categories of information appear in these sourcesthat can be used independently or in combination for climatereconstruction: (i) early instrumental meteorological data;(ii) records of recurring physical and biological processes(e.g. dates of plant flowering, grape ripening, the freezingof lakes and rivers); and (iii) narrative descriptions of short-term atmospheric processes and their impacts on environ-ments and societies (Brönnimann et al., 2018).
The heterogeneity of the archives of societies – in time,space and in the types of information included in individ-ual sources – raises conceptual and methodological chal-lenges for climate reconstruction. Historical meteorologicaldata can be quality-checked and analysed using standard cli-matological methods, whereas records of recurrent physical
and biological phenomena provide proxy information thatmay be assessed using a variety of palaeoclimatological ap-proaches (see Brönnimann et al., 2018). Narrative descrip-tions, however, require different treatment to make local ob-servations of weather and its impacts compatible with the sta-tistical requirements of climatological research.
A common approach used in historical climatology forthe analysis of descriptive (or narrative) evidence is the gen-eration of ordinal-scale indices as a bridge between rawweather descriptions and climate reconstructions. A simpleindex might, for example, employ a three-point classifica-tion, with months classed as −1 (cold or dry), 0 (normal),or 1 (warm or wet) depending upon the prevailing conditionsdescribed within historical sources. As Pfister et al. (2018)note, this “index” approach provides a means of converting“disparate documentary evidence into continuous quantita-tive proxy data. . . but without losing the ability to get backto the short-term local information for critical inspection andanalysis” (p. 116). Brázdil et al. (2010) provide a detailed ac-count of the issues associated with the generation of indices.
The index approach to historical climate reconstructionover much of the world – an exception being China – hasits roots in European scholarship. There is, however, consid-erable variability in the types of phenomena reconstructedusing an index approach in different areas. There is also vari-ability in practice, both in the way that historical evidence istreated to generate indices and in the number of ordinal cate-gories in individual index series. Variability in the treatmentof evidence arises, in part, from the extent to which analyticalapproaches have developed independently. In terms of cate-gorisation, three-, five-, and seven-point index series are mostwidely used, but greater granularity (i.e. a greater number ofindex classes) may be achieved in different regions and fordifferent climate phenomena depending upon the quantity,resolution, and/or richness of the original historical evidence.
This study arises from the work of the PAGES (Past GlobalChanges) CRIAS working group – a cooperative of climatehistorians and historical climatologists researching ClimateReconstructions and Impacts from the Archives of Societies.The first meeting of the working group in Bern, Switzerland,in September 2018 identified the need to understand vari-ability and – ideally – harmonise practice in the use of in-dices to maximise the utility of historical climate reconstruc-tions for climate change investigations. This study, writtenby regional experts in historical climatology with contribu-tions from other CRIAS members, is intended to address thisneed.
The main aims of this paper are as follows: (i) the provi-sion of a global state-of-the-art review of the developmentand use of the index approach as applied to descriptive ev-idence in historical climate reconstruction; and (ii) identifi-cation of best practice for future investigations. It does sothrough a continent-by-continent overview of practice, fol-lowed by a review of the use of indices in the reconstructionof climate variability over the oceans. Studies from northern
Clim. Past, 17, 1273–1314, 2021 https://doi.org/10.5194/cp-17-1273-2021

D. J. Nash et al.: Climate indices in historical climate reconstructions 1275
polar regions are reviewed in Sects. 5 (the Americas) and 7(the oceans), as appropriate. To the knowledge of the authors,no studies of the climate history of Antarctica have used anindex approach.
Three caveats are necessary to frame the coverage of thereview. First, the nature of documentary sources is well dis-cussed in the climate history literature for most parts of theworld. As such, we provide only limited commentary onsources for each continent, except for selected regions. Theseinclude China, where only a few overviews of documentarysources have been published (e.g. Wang, 1979; Wang andZhang, 1988; Zhang and Crowley, 1989; Ge et al., 2018), andJapan and Russia where, to our knowledge, no detailed de-scriptions are available for Anglophone audiences. Second,there are instances in the literature where quantifiable data indocumentary sources (e.g. sea-ice cover, phenological phe-nomena) and even instrumental meteorological data are con-verted to indices for climate reconstruction purposes. Thisoccurs mainly in studies where such data are integrated withnarrative evidence to generate longer, more continuous andhomogenous series with a consistent (monthly or seasonal)resolution. We do not describe the generation of such indexseries in detail, but we do provide examples in Sects. 2–7,as appropriate. Third, the emphasis of the article is on thedocumentation of studies that have used an index approachto climate reconstruction, with critical review and compari-son where appropriate. The number of instances where com-parative analysis is possible is necessarily restricted by thelimited number of studies that have undertaken either differ-ent approaches to index development for the same locationor identical approaches for different regions.
2 Climate indices in Europe
2.1 Origins of documentary-based indices in Europe
The use of climate indices has a long tradition in Europe,with the earliest studies published during the 1920s. As inany area, the start date for meaningful index-based recon-structions is determined by the availability of source mate-rial. In central, western, and Mediterranean Europe, for ex-ample, sources containing narrative evidence are sufficientlydense from the 15th century (CE) onwards to enable seasonalindex reconstruction for more than half of all covered years.Exceptionally, indices can be generated from the 12th cen-tury onwards but with greatest confidence from the 14th cen-tury when serial sources join the available historiographic in-formation (Wozniak, 2020). The number of index-based cli-mate reconstructions for Europe is large; as such, this sectionof the review focuses mainly upon studies that include origi-nal published series based on primary sources and that recon-struct meteorological entities. This excludes climate mod-elling and other studies that synthesise or reanalyse previ-ously published historical index series.
Due to the dominance of references to winter conditionsin European documentary sources, early investigations cen-tred primarily on winter severity (Pfister et al., 2018). Thefirst use of the index approach was by the Dutch journal-ist, astronomer, and later climatologist Cornelis Easton, whopublished his oeuvre on historical European winter sever-ity in 1928 (Easton, 1928). In this monograph, Easton pre-sented early instrumental data as well as a catalogue of de-scriptions of winter conditions dating back to the 3rd cen-tury (BCE) derived from narrative evidence. For the periodprior to 1205 CE, this catalogue lists only remarkable win-ter seasons; however, after this date every winter up to 1916is attributed to a 10-point classification, including a quantifi-able coefficient and a descriptive category. Easton’s classifi-cation appears as an adapted graph in the second edition ofCharles E. P. Brooks (1949) book on Climate Through theAges (Pfister et al., 2018).
An isolated attempt to quantify the evaluation of weatherdiaries (spanning from 1182 to 1780 CE) was proposed bythe German meteorologist Fritz Klemm (1970), with a two-point scale for winter and summer temperature (cold/mildand mild/warm respectively) and precipitation (dry/wet). TheDutch meteorologist Folkert IJnsen also developed winterseverity indices for the Netherlands (1200–1916 CE) but fol-lowing a slightly different approach (IJnsen and Schmidt,1974). However, one of the most important advances camein the late 1970s when British climatologist Hubert Ho-race Lamb published a three-point index series of winterseverity and summer wetness for western Europe (1100–1969 CE) in his seminal book Climate: Past, Present andFuture (Lamb, 1977). Lamb’s methodology was more eas-ily applicable compared with Easton’s – a likely reason whysuccessive studies refer to Lamb’s method and why, in theaftermath of his publication, the index approach was appliedin many different European regions.
In 1984, the Swiss historian Christian Pfister published hisfirst temperature and precipitation indices for Switzerland inthe volume Das Klima der Schweiz von 1525–1860, expand-ing his climate indices to cover all months and seasons ofthe year (Pfister, 1984). Pfister’s work adapted Lamb’s meth-ods, extending Lamb’s three-point scale into monthly seven-point ordinal-scale temperature and precipitation indices(Fig. 1). Shortly after Pfister’s initial study, Pierre Alexan-dre (1987) developed a comprehensive overview of the cli-mate of the European Middle Ages (1000–1425 CE), alsousing indices. Over a decade later, Van Engelen et al. (2001)published a nine-point index-based temperature reconstruc-tion for the Netherlands and Belgium (764–1998 CE). Mostresearch groups investigating European climate history – in-cluding those led by Rüdiger Glaser (Freiburg, Germany) andRudolf Brázdil (Brno, Czech Republic) – now adopt Pfister’sapproach as the standard method for index development, atleast for temperature and precipitation reconstructions. Thisis described in more detail in Sect. 8 as part of a globaloverview of approaches to index construction. The opportu-
https://doi.org/10.5194/cp-17-1273-2021 Clim. Past, 17, 1273–1314, 2021

1276 D. J. Nash et al.: Climate indices in historical climate reconstructions
nity to combine narrative evidence with quantifiable infor-mation is one of the great advantages of the index approach(Pfister et al., 2018). As a result, many index-based seriesfor Europe incorporate some quantitative data. Many seriesalso contain data gaps; the earlier the epoch, the more likelythere are to be breaks in series – this is common to almost allindex-based series globally.
One area of Europe with a different research tradition isRussia (Jusupovic and Bauch, 2020). Here, the earliest cli-mate history research was by Konstantin Veselovskij (1857),who compared historical information from various sourcetypes against early 19th century statistical climate data (formore details of Veselovskij’s work, see Zhogova, 2013).Mikhail Bogolepov later analysed climate-related informa-tion in published Cyrillic and Latin sources from the 10thcentury onwards (Bogolepov, 1907, 1908, 1911). Other stud-ies have focused on accounts of anomalous weather in Rus-sian sources (e.g. Borisenkov and Paseckij, 1983, 1988)and on reconstructing historical climate (Burchinskij, 1957;Liakhov, 1984; Borisenkov, 1988; Klimanov et al., 1995;Klimenko et al., 2001; Slepcov and Klimenko, 2005; Kli-menko and Solomina, 2010), river flows (Oppokov, 1933),and famine years (Leontovich, 1892; Bozherianov, 1907).
The most important collection of Russian documentarysources is the 43-volume(“Complete Collection of Russian Chronicles”, abbreviatedto ; Borisenkov and Paseckij, 1988). These chroniclesdocument events including infestations of insects, droughts,wet summers, wet autumns, unusual frost events, famine,floods, storms, and earthquakes. The records have been used,in conjunction with other European sources, by Borisenkovand Paseckij (1988) to reconstruct a qualitative Russian cli-mate history for the last 1000 years. More recent recon-structions have extended beyond historical sources to in-clude a variety of other climate proxies (e.g. Klimenko andSolomina, 2010). The development of index-based seriesfrom narrative evidence has yet to be attempted, althoughreconstructions of specific meteorological extremes, includ-ing wet/dry/warm/cold seasons and floods plus related socio-economic events such as famines, have been published byShahgedanova (2002) (based on Borisenkov and Paseckij,1983).
2.2 Temperature indices
Temperature is the most common meteorological phe-nomenon analysed using an index approach over northernand central Europe. Authors who have developed tempera-ture index series include Christian Pfister (1984, 1992, 1999),Pierre Alexandre (1987), Rudolf Brázdil (e.g. Brázdil andKotyza, 1995, 2000; Brázdil et al., 2013a; spanning peri-ods from 1000 to 1830 CE), Rüdiger Glaser (e.g. Glaser etal., 1999; Glaser, 2001; Glaser and Riemann, 2009; 1000–2000 CE), Astrid Ogilvie and Graham Farmer (1997; 1200–1439 CE), Gabriela Schwarz-Zanetti (1998; 1000–1524 CE),
Lajos Rácz (1999; 16th century onwards), the Dutch work-ing group around Aryan Van Engelen (Van Engelen et al.,2001; Shabalova and van Engelen, 2003), Maria-João Al-coforado et al. (2000; 1675–1715 CE), Elena Xoplaki etal. (2001; 1675–1715 and 1780–1830 CE), Anita Bokwaet al. (2001; 16th and 17th centuries), Petr Dobrovolný etal. (2009), Dario Camuffo et al. (2010; 1500–2000 CE),Maria Fernández-Fernández et al. (2014; 2017; 1750–1840 CE), Laurent Litzenburger (2015; 1400–1530 CE), andChantal Camenisch (2015a, b; 15th century). The basis ofthese reconstructions is mainly narrative evidence from mul-tiple sources, or in the case of Brázdil and Kotyza (1995,2000) and Fernández-Fernández et al. (2014), a single narra-tive source. However, depending on the epoch, evidence maybe supplemented by information from early weather diaries,administrative records, and legislative sources. The majorityof these studies (e.g. Pfister, 1984, 1992; Brázdil and Kotyza,1995; Glaser et al., 1999; Pfister, 1999; Rácz, 1999; Brázdiland Kotyza, 2000; Glaser, 2001; Van Engelen et al., 2001;Shabalova and van Engelen, 2003; Dobrovolný et al., 2009;Glaser and Riemann, 2009; Camuffo et al., 2010) include anoverlap with available instrumental data.
In Europe, different types of index scales have been used.As noted above, Christian Pfister (1984) developed a seven-point scale with a monthly resolution for temperature andprecipitation (e.g. for temperature, −3 denotes extremelycold, −2 denotes very cold, −1 denotes cold, 0 denotes nor-mal, 1 denotes warm, 2 denotes very warm, and 3 denotesextremely warm). Most historical climatologists follow thisapproach, though in some cases less granulated versions havehad to be applied due to limited source density or quality. Forinstance, Glaser (2013) followed Pfister’s indexing approachbut used a three-point scale for the 1000–1500 CE period asinformation on weather appears only occasionally in doc-umentary sources from this time. Schwarz-Zanetti (1998),Litzenburger (2015), and Camenisch (2015a) have also ap-plied seven-point indices for the late Middle Ages, with thelatter two series at a seasonal resolution (Fig. 2).
In addition to these studies, four other approaches exist forEurope: (i) IJnsen’s temperature index (IJnsen and Schmidt,1974) consists of a nine-point scale, which was also adoptedby Van Engelen et al. (2001); (ii) Alexandre (1987) useda five-point scale seasonal index, with categories from −2(very warm) to +2 (very cold) and 0 being attributed to non-documented seasons; (iii) Fernández-Fernández et al. (2014,2017) used a three-point-scale (with +1 being warmer thanusual, 0 being normal, and −1 being colder than usual), and(iv) Domínguez-Castro et al. (2015) used a five-point index(with +2 being very hot, +1 being hot, 0 being normal, −1being cold, and −2 being very cold). As noted in Sect. 2.1,Klemm (1970) proposed a two-point index (warm/cold) forwinter conditions.
Clim. Past, 17, 1273–1314, 2021 https://doi.org/10.5194/cp-17-1273-2021
D. J. Nash et al.: Climate indices in historical climate reconstructions 1277
Figure 1. Monthly seven-point temperature indices for the Swiss Plateau (1680–1700 CE), reconstructed using the Pfister index approach(data from Pfister, 1998). Zero values for specific months are indicated by a small green bar.
Figure 2. Comparison of seven-point winter temperature indices for Metz (Litzenburger, 2015) and the Low Countries (Belgium, Luxem-bourg, and the Netherlands; Camenisch, 2015a) for the 1420–1500 CE period, reconstructed using the Pfister index approach. Zero valuesfor specific years are indicated by a small bar.
2.3 Precipitation indices
Many of the authors mentioned in Sect. 2.2 have also pub-lished precipitation indices. These reconstructions are usu-ally based on the same source materials as the temperature in-dices (an exception being Dobrovolný et al., 2015). However,for certain regions, very specific source types exist that aremore favourable for precipitation reconstructions than tem-perature – see, for example, the precipitation series for the
Mediterranean based on the analysis of urban annals, reli-gious chronicles, and books of church and city archives (e.g.Rodrigo et al., 1994, 1998, 1999; Rodrigo and Barriendos,2008; Fernández-Fernández et al., 2014; Domínguez-Castroet al., 2015; Fernández-Fernández et al., 2015). These se-ries span various periods of the 16th to 20th centuries and,in some cases, overlap with instrumental data.
https://doi.org/10.5194/cp-17-1273-2021 Clim. Past, 17, 1273–1314, 2021

1278 D. J. Nash et al.: Climate indices in historical climate reconstructions
Often the same scale is applied for both temperatureand precipitation indices; however, in certain regions, pre-cipitation indices may show more gaps than their temper-ature counterparts as data may be seasonal or more spo-radic. The studies by Van Engelen et al. (2001), Alexan-dre (1987), Fernández-Fernández et al. (2014, 2017), andDomínguez-Castro et al. (2015) are exceptions, in that eachadopted a different or more rudimentary scale for precipita-tion compared with their temperature reconstructions. VanEngelen et al. (2001) opted for a five-point scale for pre-cipitation compared with a nine-point scale for temperature,and Alexandre (1987) opted for a three-point rather than afive-point index. The precipitation index of Alexandre (1987)is also relatively simple and separates events by their na-ture (1 represents snow, 2 represents rain, and 3 representsdry conditions) rather than intensity. Fernández-Fernández etal. (2014, 2017) used a two-point scale (with 0 being the to-tal absence of rain and 1 being the occurrence of rain), andDomínguez-Castro et al. (2015) used a four-point scale.
Index series based on historical records of religious ro-gation ceremonies warrant separate discussion. Rogationsare liturgical acts conducted to request either rainfall dur-ing a drought (termed pro-pluvia rogations) or an end to ex-cessive or persistent precipitation (pro-serenitate rogations),and were used as an institutional mechanism to address so-cial stress in response to such meteorological extremes (seeMartín-Vide and Barriendos, 1995; Barriendos, 2005; Teje-dor et al., 2019). Analyses of the occurrence and nature ofrogation ceremonies have proven particularly valuable forwestern Mediterranean regions (most notably the IberianPeninsula), where they have been used to create precipita-tion indices spanning the 16th to 19th centuries (e.g. ÁlvarezVázquez, 1986; Martín-Vide and Vallvé, 1995; Barriendos,1997, 2010; Gil-Guirado et al., 2019). In some cases, infor-mation about rogation ceremonies has been combined withclimate-related narrative evidence to generate precipitationseries (e.g. Fragoso et al., 2018). Useful evaluations of dif-ferent indexing methods are provided by Domínguez-Castroet al. (2008) and Gil-Guirado et al. (2016). For a discussionof the use of rogation ceremonies as a proxy for drought, seeSect. 2.5, and for examples of rogation-based reconstructionsin Mexico and South America, see Sect. 5.
2.4 Flood indices
Flood events – the result of short periods of heavy precipi-tation and/or prolonged rainfall – can also be classified us-ing indices. The basis of European flood indices includesdescriptive accounts, administrative records such as bridgemaster’s accounts (e.g. those in Wels, Austria, which spanthe 1350–1600 CE period; Rohr, 2006, 2007, 2013), historicflood marks, and river profiles (Wetter et al., 2011; span-ning 1268 CE to present and overlapping with instrumentaldata). In some regions, the availability and characteristics ofsources may vary, and certain source types may be more im-
portant for flood reconstruction than others. This is, for in-stance, the case in Hungary, where charters play a particu-larly important role in flood reconstruction (Kiss, 2019; forthe 1001–1500 CE period).
The scales used for flood reconstruction differ slightlyfrom those used for the reconstruction of temperature andprecipitation. Drawing on Brázdil et al. (1999; which spansthe 16th century), scholars mainly from central Europe (e.g.Sturm et al., 2001 – for the 1500 CE–present period; Glaserand Stangl, 2003, 2004 – 1000 CE–present; Kiss, 2019), andFrance (Litzenburger, 2015) have applied a three-point scale.In contrast, Pfister (1999), Wetter et al. (2011), and Salvis-berg (2017; 1550–2000 CE) used a five-point scale for floodsof the river Rhine in Basel and the river Gürbe in the vicinityof Bern. The French historian Emmanuel Garnier also de-veloped a five-point scale to reconstruct flood time seriesfrom 1500 to 1850 CE, taking the spatial extent and eco-nomic consequences of each event into consideration (Gar-nier, 2009, 2015). A novel feature of the Garnier index isthat it includes a −1 value for events where intensity can-not be estimated through documentary sources. Rohr (2006,2007, 2013) chose a four-point scale for his flood recon-struction of the river Traun in Wels (Austria). In many cases,the index values express the amount of flood damage and/orthe duration of flooding in combination with the geograph-ical extent (e.g. Pfister and Hächler, 1991 – covering the1500–1989 CE period; Salvisberg, 2017; Kiss, 2019). Com-prehensive overviews of flood reconstruction, including theindex method, are given in Glaser et al. (2010), Brázdil etal. (2012), and recent work by the PAGES Floods WorkingGroup synthesised in Wilhelm et al. (2018).
2.5 Drought indices
Drought events are closely linked to precipitation vari-ability. As a result, many analyses of historical Europeandroughts use indices adapted from precipitation reconstruc-tions. Evidence of past droughts can be found in adminis-trative sources, diaries, newspapers, religious sources, andepigraphic evidence (see Brázdil et al., 2005, 2018; Erfurtet al., 2019 – which spans the 1800 CE–present period). Dif-ferent approaches exist in historical climatology to expressthe severity of droughts in index form. Brázdil and collab-orators (2013b) proposed a three-point scale (with −1 beingdry,−2 being very dry, and−3 being extremely dry) adaptedfrom the precipitation indices described in Sect. 2.3. Dry pe-riods appear only in the drought index if they last for at least2 successive months. A similar approach is used by Pfister etal. (2006), Camenisch and Salvisberg (2020; covering 1315–1715 CE), and Bauch et al. (2020; 1200–1400 CE). However,Garnier (2018) applies a five-point scale with an additionalsixth category for known drought years with insufficient evi-dence for a more precise classification.
Drought indices have also been derived for the westernMediterranean using records of rogation ceremonies, with
Clim. Past, 17, 1273–1314, 2021 https://doi.org/10.5194/cp-17-1273-2021

D. J. Nash et al.: Climate indices in historical climate reconstructions 1279
specific methodologies developed to estimate the length,severity, and continuity of drought episodes (see Domínguez-Castro et al., 2008). A number of studies have used evidenceof pro-pluvia ceremonies (see Sect. 2.3) as a drought proxy(Piervitali and Colacino, 2001; Domínguez-Castro et al.,2008, 2010; Garnier, 2010; Domínguez-Castro et al., 2012b;Tejedor et al., 2019), sometimes in combination with othernarrative evidence (e.g. Fragoso et al., 2018; Gil-Guirado etal., 2019). Readers are referred to Brázdil et al. (2018) for adetailed discussion of the different types of drought indices.
2.6 Other indices
In Europe, the index method has only rarely been appliedin contexts other than for temperature, precipitation, flood,and drought reconstruction. For example, Pichard and Rou-caute (2009) developed an index for snowfall in the FrenchMediterranean region since 1715 CE, including ordinal cate-gories escalating from 1 to 3 depending on the event durationand quantity of snow fallen. This study is based on infor-mation from diaries and other urban documentary sources.Marie-Luise Heckmann (2008, 2015), coming from the fieldof historical seismology and seemingly unconnected to dis-cussions in historical climatology, developed a combinedtemperature–precipitation index that differentiates wintersand summers by weather description and phenological phe-nomena; this index was applied to documentary data fromlate-medieval Prussia and Livonia (1200–1500 CE). Pro-pluvia rogation ceremonies have been analysed as a proxyfor the winter North Atlantic Oscillation between 1824 and1931 CE in the Extremedura region of Spain (Bravo-Paredeset al., 2020).
Sea-ice reconstructions for the seas around Iceland havebeen developed by Astrid Ogilvie, the pioneer of Icelandicclimate history (Ogilvie, 1984, 1992; Ogilvie and Jónsson,2001). She developed a monthly resolution sea-ice indexbased on historical observations in 37 sectors of the seaaround Iceland (Ogilvie, 1996), including sightings of seaice in ships’ logbooks, whalers’ and sealers’ charts, diaries,letters, books, and newspapers. Hence, the index values varyfrom 1 to (theoretically) 37, with data weighed by source re-liability. Pre-1900 CE records report single observations oficebergs, and varying concepts of sea ice have to be takeninto consideration. The record is presented as a 5-year sum-marised value for the 1600–1784 CE period, with monthlyand annual values given from 1785 to present.
3 Climate indices in Asia
3.1 Origins of documentary-based indices in Asia
The use of the index approach in Asia is limited to researchin China and India. With the exception of Japan, historicalclimatology research is either in its infancy or completelyabsent in other parts of the continent (Adamson and Nash,
2018). Very little work to reconstruct climate from documen-tary sources has occurred in southeast Asia, for example, andefforts to utilise records from the Byzantine Empire (Telelis,2008; Haldon et al., 2014) and Muslim world (e.g. Vogt et al.,2011; Domínguez-Castro et al., 2012a) have only recentlybeen emerging. In Korea, only Kong and Watts (1992) havedeveloped anything resembling climate indices, categorisingindividual years as warm/cold or dry/humid using informa-tion from diaries and histories.
Climate reconstruction work in China has developedlargely independently from European historical climatologytraditions. The Central Meteorological Bureau of China haspublished several fundamental works on Chinese wet/dry se-ries. In 1981, a milestone work showed 120 cities with a five-point wet/dry series for the whole of China spanning the 1470to 1979 CE period (Central Meteorological Bureau of China,1981). Nowadays, most reconstructions (including coldness,drought, frost, hail, and others) are based on the Compendiumof Chinese Meteorological Records of the Last 3,000 Yearsedited by Zhang De’er (2004). This compendium providesdetails of a wide range of historical meteorological phenom-ena from across China at a daily level. However, due to animbalance in population distribution, records are more abun-dant for eastern than western China (Ge et al., 2013). In In-dia, the only study to use an index approach (Adamson andNash, 2014) was developed from Nash and Endfield’s workin southern Africa (see Sect. 4); there were, however, severaldifferences in approach, notably the inclusion of calibrationtables.
One country where the field of historical climatology isrelatively well-developed is Japan. Japan has weather datarecorded in documents dating back to at least 55 CE (Ingramet al., 1981), and diaries in particular have been utilised to re-construct climate conditions (e.g. Mikami, 2008; Zaiki et al.,2012; Ichino et al., 2017; Sho et al., 2017). Access to docu-mentary data on past weather phenomena is provided by de-tailed collections that evaluate historical sources (Mizukoshi,2004–2014; Fujiki, 2007). However, Japanese historical cli-matology has no tradition of using indices, instead tendingto use information in documentary sources to reconstructunits of meteorological measurement, such as temperatureand precipitation, directly. For example, Mikami (2008) cor-related mean monthly summer temperature with number ofrain days. Mizukoshi (1993) and Hirano and Mikami (2008)used historical records to provide detailed reconstructions ofweather patterns. Mizukoshi (1993) divided rainy seasonsinto three types – “heavy rain type”, “light rain type”, and“clear rainy season type” – although these are not indicesper se. In a similar way, Ito (2014) distinguished precipita-tion in categories such as “persisting rainfall” or “long down-pour”, depending on seven keywords for each category. Heused a similar approach to define indicators for cold spells,using keywords such as “cold”, “frost”, and “put on cotton(clothes)”. This keyword method for climatic conditions isalso applied by Tagami (2015). There has also been much ef-
https://doi.org/10.5194/cp-17-1273-2021 Clim. Past, 17, 1273–1314, 2021

1280 D. J. Nash et al.: Climate indices in historical climate reconstructions
fort to reconstruct climate from climate-dependent phenom-ena such as cherry blossom or lake freezing dates (e.g. Aonoand Kazui, 2008; Mikami, 2008; Aono and Saito, 2010).
3.2 Types of documentary evidence used to createindex series
Historical climate index development in India has used asimilar range of sources to those noted above for Europe –specifically newspapers and private diaries spanning the pe-riod from 1781 to 1860 CE, supplemented by governmentrecords, missionary materials, and some reports (Adamsonand Nash, 2014). The sources used for the development ofclimate indices in China, however, are very different and re-quire further explanation.
The earliest known written weather records in China, in-scribed onto oracle bones, bronzes, and wooden scripts, dateto the Shang dynasty (∼ 1600 BCE). These records wereintended for weather forecasting but later included actualweather observations (Wang and Zhang, 1988). Emperors ofsucceeding dynasties compiled more systematic records toallow them to better understand the weather, forecast har-vests, and, hence, maintain social stability (Tan et al., 2014).Some scholars use an old Chinese concept of Tien (or Tian,meaning Heaven) to explain the tradition. Tien was viewedas a medium used by gods and divinities to forward mes-sages. Natural hazards (e.g. droughts and floods) were re-garded as displaying Tien’s displeasure with the emperor andhis court and were often followed by uprisings and rebel-lions (Perry, 2001; Pei and Forêt, 2018). To help them under-stand the long-term pattern of such hazards, imperial govern-ments appointed specialists such as Taishi (imperial histori-ans) or Qintian Jian (imperial astronomers) to record unusualand/or extreme weather events. Later, related environmentaland socio-economic events, such as early or late blossom-ing, agricultural conditions, famine, plagues, and locust out-breaks, were also recorded (see Wang et al., 2018, for furtherdetails). This long tradition of chronicling has resulted in anexceptional range of materials for understanding and recon-structing past climates. It is worth noting, however that – dueto a desire in imperial China to generalise details (Hansen,1985) – phenomena were often only recorded as narrativedescriptions with magnitude categorised as large, medium,or small.
The earliest official chronicle was Han Shu (“The Bookof Han”) written by Ban Gu (32–92 CE). However, manyearlier historical books incorporate climate observations, in-cluding Shi Ji (“Records of the Grand Historian”) by SimaQian (145–86 BCE) and Chun Qiu (“Spring and Autumn An-nals”) compiled by Confucius (551–479 BCE) for the historyof the Lu Kingdom (722–481 BCE) (Wang and Zhang, 1988).Classic literature called Jing Shi Zi Ji was compiled in Si KuQuan Shu (“Complete Library in Four Branches of Litera-ture”) published in 1787 (full-text digital versions are acces-sible at websites including Scripta Sinica: http://hanchi.ihp.
sinica.edu.tw/ihp/hanji.htm, last access: 3 June 2021). TheShi (meaning “history”) branch contains, but is not limitedto, the “Twenty-Four Histories” (later expanded to “Twenty-Five Histories” by adding Qing Shi Gao, the “Draft Historyof Qing”), other historical books, documents of the centraladministration, local gazettes, and private diaries (Ge et al.,2018).
While providing consistency in recording practices, thespatial coverage of official historical books was often limitedto national capitals or other important locations. However,the writing of Fang Zhi – local chronicles or gazettes, popu-lar in the Ming (1368–1643 CE) and especially Qing (1644–1911 CE) dynasties – substantively expanded the availabil-ity of documentary sources. Local gazettes contain unusualweather- and climate-related statements like those in the of-ficial chronicles, but they incorporate additional details atprovincial, prefectural, county, or township levels depend-ing on the local administrative unit. For more information,see Ge et al. (2018) and a database of local gazettes athttp://lcd.ccnu.edu.cn/#/index (last access: 3 June 2021).
In the 1980s, the Central Meteorological Bureau of Chinainitiated a massive project for the compilation of weather-and climate-related records. The work resulted in the most in-fluential publication in contemporary Chinese climate litera-ture, the Compendium of Chinese Meteorological Records ofthe Last 3,000 Years edited by Zhang De’er (2004); this con-tains more than 150 000 records quoted from 7930 historicaldocuments, mostly local gazettes. To maximise the availabil-ity of the compendium, Wang et al. (2018) have digitised therecords into the Reconstructed East Asian Climate HistoricalEncoded Series (REACHES) database (Fig. 3). The quan-tity of records peaks in the last 600 years, during the Mingand Qing dynasties. This is due to a large number of localgazettes spread across the country; however, only a few areavailable for the Tibetan Plateau and arid western regions.The Institute of Geographic Sciences and Natural ResourcesResearch (Chinese Academy of Sciences) has also collatedphenological records from historical documents (Zhu andWang, 1973; Ge et al., 2003).
Two sources of documentary evidence are of particularimportance for historical climate reconstruction in China.Daily observations of sky conditions, wind directions, andprecipitation types and duration are recorded in Qing YuLu (“Clear and Rain Records”) (Wang and Zhang, 1988).The records, however, are descriptive and are only avail-able for selected areas; these include Beijing (1724–1903with 6 missing years), Nanjing (1723–1798), Suzhou (1736–1806), and Hangzhou (1723–1773). Yu Xue Fen Cun (“Depthof Rain and Snow”) reported the measured depth of rain-fall infiltration into the soil or depth of snow accumulationabove ground in the Chinese units fen (∼ 3.2 mm) and cun(∼ 3.2 cm). From 1693 to the end of the Qing dynasty in1911, these measurements were taken in 18 provinces; how-ever, many records include imprecise measurements and/ordates (Ge et al., 2005, 2011). Despite their descriptive and
Clim. Past, 17, 1273–1314, 2021 https://doi.org/10.5194/cp-17-1273-2021

D. J. Nash et al.: Climate indices in historical climate reconstructions 1281
Figure 3. Numbers of historical documentary records in the REACHES database for China. (a) Spatial distribution of records at 1692geographical sites across China. (b) Temporal evolution of the records in the database from 1 to 1911 CE (brown series); the inset (blueseries) shows the same data for 1 to 1350 CE but with an expanded vertical axis.
semi-quantitative nature, the two documentary sources arevaluable for reconstructing past climate, especially for sum-mer precipitation (Gong et al., 1983; Zhang and Liu, 1987;Zhang and Wang, 1989; Ge et al., 2011) and meiyu (or“plum rains”, marking the beginning of the rainy season;see Wang and Zhang, 1991) in different cities depending onthe record length as described above. They are also usefulfor cross-checking and/or validating climate indices derivedfrom other documentary sources.
3.3 Temperature indices
The availability of documentary temperature indices for Asiais restricted to China. Zhu (1973) was the first Chinesescholar to use historical weather records and phenological
evidence to identify temperature variability over the last5000 years (∼ 3000 BCE to 1955 CE). He consulted a rangeof data sources for his reconstruction, including the dates oflake/river freezing/thawing; the start/end dates of snow andfrost seasons; arrival dates of migrating birds; the distribu-tion of plants such as bamboo, lychee, and orange; the blos-soming dates of cherry trees; and harvest records. However,the study did not clearly indicate his methodology.
Winter temperature anomalies were initially regarded askey indicators of temperature changes in China (Zhang andGong, 1979; Zhang, 1980; Gong et al., 1983; R. S. Wangand Wang, 1990; Shen and Chen, 1993; Ge et al., 2003),as (i) there were more temperature-related descriptions inwinter than in other seasons and (ii) winter temperatureshave higher regional uniformity than summer temperatures
https://doi.org/10.5194/cp-17-1273-2021 Clim. Past, 17, 1273–1314, 2021

1282 D. J. Nash et al.: Climate indices in historical climate reconstructions
(Wang and Zhang, 1992). However, this uniformity mainlyreflects changes in the Siberian High system, so reconstruc-tions of summer (and other season) temperature and precip-itation anomalies to reflect other aspects of monsoon circu-lation soon received increasing attention (see, for example,Zhang and Liu, 1987; S. W. Wang and Wang, 1990; Yi et al.,2012).
The pioneering work of Zhu (1973) has had a great in-fluence upon the development of historical climatology inChina. Successive studies used a similar approach to re-construct winter temperature indices for every decade fromthe 1470s to the 1970s by counting the frequency of yearswith cold- or warm-related records (Zhang and Gong, 1979;Zhang, 1980; Shen and Chen, 1993; Zheng and Zheng,1993). Zhang (1980) adopted binary (cold/warm) categoriesand further developed an equation to derive decadal tempera-ture indices for the 1470–1970 CE period (see Sect. 8.2); thisapproach was applied in several studies (Gong et al., 1983;S. W. Wang and Wang, 1990; Zheng and Zheng, 1993; Man,1995).
The formal development of an ordinal-scale temperatureindex was first introduced by S. W. Wang and Wang (1990)who used a four-point scale to build decadal winter coldindex series for the 1470–1979 CE period in eastern China(with 0 being no or light snow or no frost, 1 being heavysnow over several days, 2 being heavy snow over months,and 3 being heavy snow and frozen ground until the follow-ing spring). This approach was widely applied in subsequentseries in different regions, for different seasons, and at differ-ing temporal resolutions (R. S. Wang and Wang, 1990; S. W.Wang and Wang, 1990; Wang et al., 1998; Wang and Gong,2000; Tan and Liao, 2012; Tan and Wu, 2013). For example,Wang and Gong (2000) developed a 50-year resolution win-ter cold index for eastern China spanning the 800–2000 CEperiod. Tan and colleagues adapted the approach to recon-struct decadal temperature index series (with−2 being rathercold, −1 being cold, 0 being normal, and 1 being warm) inthe Ming (1368–1643 CE; Tan and Liao, 2012) and Qing dy-nasties (1644–1911 CE; Tan and Wu, 2013) in the YangtzeRiver Delta region.
3.4 Drought–flood and moisture indices
China has a particularly rich legacy of documents describinghistorical floods and droughts, and using such records to de-fine drought–flood series has a long tradition. Zhu (1926) andYao (1943) presented the earliest drought–flood series for allof eastern China (206 BCE–1911 CE), although their tempo-ral and spatial resolutions are vague. Due to the higher num-ber of available records for the last several hundred years,reconstructions using frequency counts were avoided in theirseries; instead, the ratio between flood and drought eventswas used to build moisture indices (see Sect. 8.2). Ex-amples of other early studies include Yao (1982), Zhang
and Zhang (1979), Zheng et al. (1977), and Gong andHameed (1991).
Beginning in the 1970s, the Central Meteorological Ad-ministration initiated a project to reconstruct historic annualprecipitation. This adopted a five-point ordinal scale (with 1being very wet, 2 being wet, 3 being normal, 4 being dry, and5 being very dry) to form drought–flood indices for 120 loca-tions in China spanning the 1470–1979 CE period (Academyof Meteorological Science of China Central Meteorologi-cal Administration, 1981). The indices were compiled basedon the evaluation of historical descriptions (Sect. 8.2), withthe series later extended to 2000 CE (Zhang and Liu, 1993;Zhang et al., 2003). Most reconstructions in China now usethis five-point index (Zheng et al., 2006; Tan and Wu, 2013;Tan et al., 2014; Ge et al., 2018). For example, Zhang etal. (1997) used the approach to establish six regional se-ries of drought–flood indices for eastern China (from theNorth China Plain to the Lower Yangtze Plain) spanningthe 960–1992 CE period. Zheng et al. (2006) developed adataset covering 63 stations across the North China Plainand the middle and lower reaches of the Yangtze Plain andreconstructed a drought–flood index series spanning from137 BCE to 1469 CE.
Adamson and Nash (2014) also adopted a five-point indexseries when reconstructing monsoon precipitation in west-ern India (Fig. 4). Where data quality allowed, indices werederived for individual “monsoon months” (May/June, July,August, and September/October) and summed to produce anindex value for each entire monsoon season. Where monthlylevel indices could not be constructed, indices pertaining tothe whole monsoon were generated directly from narrativeevidence. The five-point index was chosen to correspond tothe terminology currently used by the Indian MeteorologicalDepartment for their seasonal forecasts (from “deficient” to“excess” rainfall) and regular reports of rainfall conditions (afour-point scale from “scanty” to “excess”, with a fifth cat-egory “heavy” added by the authors). As each of these cor-respond to percentage deviations from a rainfall norm, thisallowed the generation of calibration tables within an instru-mental overlap period, to assign descriptive terms to specificindex points (e.g. the term “seasonable rain” to the category+1 “excess”). This should allow the same methodology to berepeated elsewhere in India but limits the methodology to thesubcontinent.
3.5 Other series
Several other studies have used weather descriptions withindocumentary records to reconstruct past climate series inChina. These include reconstructed winter thunderstorm fre-quency (Wang, 1980, spanning 250 BCE–1900 CE), dust fall(Zhang, 1984, 1860–1898 CE; Fei et al., 2009, for the past1700 years), and typhoon series in Guangdong (Liu et al.,2001, 1000–1909 CE) and coastal China (Chen et al., 2019,0–1911 CE). Many scholars have also used information in
Clim. Past, 17, 1273–1314, 2021 https://doi.org/10.5194/cp-17-1273-2021

D. J. Nash et al.: Climate indices in historical climate reconstructions 1283
Figure 4. Five-point western India monsoon rainfall reconstruction for 1780–1860. The reconstruction is a combination of separate seriesfor Mumbai, Pune, and the Gulf of Khambat (now the Gulf of Khambhat; see inset). Monsoon index categories map broadly onto IndianMeteorological Department (IMD) descriptors of seasonal monsoon rainfall (data for reconstruction from Adamson and Nash, 2014). Zerovalues are shown as small bars; years with insufficient data to generate an index value are left blank.
Qing Yu Lu and Yu Xue Fen Cun to count and build win-ter snowfall days series (Zhou et al., 1994; Ge et al., 2003),while Hao et al. (2012) further used the series to regress an-nual winter temperatures over the middle and lower reachesof the Yangtze River since 1736 CE.
Phenology-related phenomena have also been widely usedin China to indicate past climate variability (Liu et al., 2014).Flower blossom dates in Hunan between 1888 and 1916 CE(Fang et al., 2005) and in the Yangtze Plain from 1450to 1649 CE (Liu, 2017) were used to indicate temperaturechange. The date of the first recorded “song” of the adult ci-cada has also been used to reconstruct precipitation changeduring the rainy season in Hunan from the late 19th to early20th century (on the principle that cicada growth to adult-hood requires sufficient humidity, and this coincides withthe peak rainy season; Xiao et al., 2008). In recent years,researchers have been able to reconstruct various series in-cluding typhoons (Chen et al., 2019; Lin et al., 2019) anddroughts (Lin et al., 2020) from the compendium of Chineserecords compiled by Zhang (2004).
Using descriptions of agricultural outputs in the Twenty-Four Histories and Qing History, Yin et al. (2015) developeda grain harvest yield index and used this to infer temperaturevariations from 210 BCE to 1910 CE. Details of outbreaks ofOriental migratory locusts in these same histories have beenused by Tian et al. (2011) to construct a 1910-year-long lo-cust index through which precipitation and temperature vari-ations can be inferred. The History of Natural Disasters andAgriculture in Each Dynasty of China, published by the Chi-
nese Academy of Social Science (1988), includes details ofdisasters such as famines to reconstruct indices of climatevariability during the imperial era.
4 Climate indices in Africa
4.1 Origins of documentary-based indices in Africa
Compared with the wealth of documentary evidence avail-able for Europe and China, there are relatively few collec-tions of written materials through which to explore the his-torical climatology of Africa (Nash and Hannaford, 2020).The bulk of written evidence stems from the late 18th cen-tury onwards, with a proliferation of materials for the 19thcentury following the expansion of European missionary andother colonial activity.
Most historical rainfall reconstructions for Africa use ev-idence from one or more source type. A small number ofstudies are based exclusively upon early instrumental meteo-rological data. Of these, some (e.g. the continent-wide analy-sis by Nicholson et al., 2018) combine early rain gauge datawith more systematically collected precipitation data fromthe 19th to 21st centuries, to produce quantitative time se-ries. Others, such as Hannaford et al. (2015) for southeastAfrica, use data digitised from ships’ logbooks to generatequantitative regional rainfall chronologies. Most climate re-constructions, however, make use of narrative accounts to de-velop relative rainfall chronologies based on ordinal indices,either for the whole continent or for specific regions.
https://doi.org/10.5194/cp-17-1273-2021 Clim. Past, 17, 1273–1314, 2021

1284 D. J. Nash et al.: Climate indices in historical climate reconstructions
While drawing upon European traditions and sharingmany similar elements, methodologies for climate index de-velopment in Africa have evolved largely in isolation fromapproaches in Europe (see Sect. 8.3). The earliest workby Sharon Nicholson, for example, was published aroundthe same time that Hubert Lamb was developing his in-dex approach (Nicholson, 1978a, 1978b, 1979, 1980). Herearly methodological papers on precipitation reconstruction(Nicholson, 1979, 1981, 1996) use a qualitative approach toidentify broadly wetter and drier periods in African history.A seven-point index (+3 to −3) integrating narrative evi-dence with instrumental precipitation data was introducedin Nicholson (2001) and expanded upon in Nicholson etal. (2012a) and Nicholson (2018).
The many regional studies in southern Africa owe theirapproach to the work of Coleen Vogel (Vogel, 1988, 1989),who drew on Nicholson’s research but advocated the use of afive-point index to classify rainfall levels in the Cape regionof South Africa (with +2 being very wet, severe floods; +1being wet, good rains; 0 being seasonal rains; −1 being dry,months of no rain reported; and −2 being very dry, severedrought). Subsequent regional studies, starting with Endfieldand Nash (2002) and Nash and Endfield (2002), have adoptedthe same five-point approach.
4.2 Precipitation indices
The main continent-wide index-based series for Africa orig-inates from research undertaken by Sharon Nicholson (e.g.Nicholson et al., 2012a). This series uses a seven-point scaleand has been used to explore both temporal (Fig. 5) andspatial (Fig. 6) variations in historical rainfall across Africaduring the 19th century. One regional rainfall reconstruc-tion is available for West Africa (Norrgård, 2015, spanning1750–1800 CE and using a seven-point scale) and one isavailable for Kenya (Mutua and Runguma, 2020, spanning1845–1976 CE with a five-point scale). The greatest num-bers of regional reconstructions – all using a five-point scale– are available for southern Africa. These include chronolo-gies covering all or part of the 19th century for the Kala-hari (Endfield and Nash, 2002; Nash and Endfield, 2002,2008) and Lesotho (Nash and Grab, 2010), and – most re-cently – Malawi (Nash et al., 2018) and Namibia (Grab andZumthurm, 2018). Several reconstructions are available forSouth Africa, including separate 19th century series for theWestern and Eastern Cape, Namaqualand, and present-dayKwaZulu-Natal (Vogel, 1988, 1989; Kelso and Vogel, 2007;Nash et al., 2016). Most studies, including the continent-wideseries, reconstruct rainfall at an annual level, but, where in-formation density permits, it has been possible to constructrainfall at seasonal scales (e.g. Nash et al., 2016). Regionalstudies from southern Africa have recently been combinedwith instrumental data and other annually resolved proxies(including sea surface temperature data derived from analy-ses of fossil coral) to produce two multi-proxy reconstruc-
tions of rainfall variability (Neukom et al., 2014a; Nash etal., 2016).
4.3 Temperature indices
To date, the only study exploring temperature variationsin Africa using an index approach is an annually re-solved chronology of cold season variability spanning 1833–1900 CE for the high-altitude kingdom of Lesotho in south-ern Africa (Grab and Nash, 2010). This uses a three-pointindex for winter severity (normal/mild; severe; very severe)and identifies more severe and snow-rich cold seasons duringthe early- to mid-19th century (1833–1854) compared withthe latter half of the 19th century (Fig. 7). A reduction inthe duration of the frost season by over 20 d during the 19thcentury is also identified.
5 Climate indices in the Americas
5.1 Origins of documentary-based indices in theAmericas
The use of the index approach in climate reconstruction isvariable across the Americas. Although sufficient historicalrecords exist in some regions, particularly the northeasternUSA since the 18th century, few researchers have generatedclimate indices for the USA or Canada (White, 2018). Mex-ico, in contrast, has produced pioneering studies in climatehistory, especially on extreme droughts (see Prieto and Rojas,2018; Prieto et al., 2019). In South America, documentaryevidence is generally lower in quality and quantity comparedwith Europe, so more complex indices have been replaced bysimpler ones, which extend to the 1500s (CE).
5.2 Temperature, precipitation and river flow indices
The only index-based temperature and precipitation recon-structions for the USA and Canada are those produced byWilliam Baron and collaborators. Although influenced by thework of Pfister, Baron (1980, 1982) used a distinct contentanalysis of weather diaries (see Sect. 8.4) to produce open-ended seasonal indices of New England temperature and pre-cipitation for 1620–1800 CE, a period overlapping with thefirst local instrumental temperature series (which began inthe 1740s). He later combined seasonal indices, early in-strumental records, and phenological observations to createannual temperature and precipitation series and reconstructfrost-free periods (Baron et al., 1984; Baron, 1989, 1995).
There are a number of valuable compilations of extremedroughts in Mexico (e.g. Florescano, 1969; Jáuregui, 1979;Castorena et al., 1980; Endfield, 2007) and research thathas identified climate trends across the country for 1450–1977 CE (Metcalfe, 1987; Garza Merodio, 2002). GarzaMerodio systemised the frequency and duration of climaticanomalies in the Basin of Mexico for 1530–1869 CE. García-
Clim. Past, 17, 1273–1314, 2021 https://doi.org/10.5194/cp-17-1273-2021
D. J. Nash et al.: Climate indices in historical climate reconstructions 1285
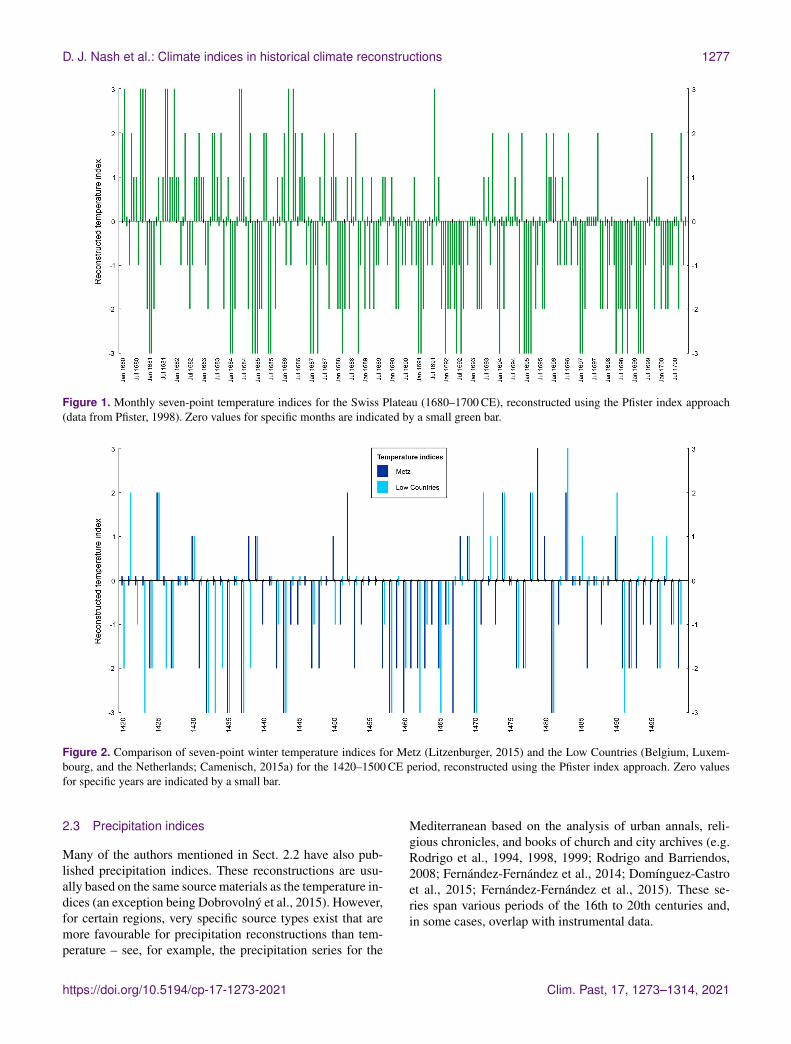
Figure 5. Seven-point “wetness” index series for 1801–1840 for the 90 homogenous rainfall regions of Africa indicated across the x axis.This series is reconstructed using documentary and instrumental data, with data gaps infilled using substitution and statistical inference (seeSect. 8.3 and Nicholson et al., 2012a). From left to right, the regions approximately extend by latitude from the northern (region 1 – northernAlgeria/Tunisia) to southern (region 84 – Western Cape, South Africa) extremes of the continent. Anomalies in the numbering sequence areregions 85, 86, 90 (all equatorial Africa), 87 (eastern Africa), and 88 and 89 (Horn of Africa).
Figure 6. Rainfall anomaly patterns for 1835 and 1888 for the90 homogenous rainfall regions of Africa delineated on the maps(modified after Nicholson et al., 2012b).
Acosta et al. (2003) developed an unprecedented catalogue ofhistoric droughts in central Mexico for 1450–1900 CE. Laterwork compared this information with a tree-ring series andfound a significant correlation between major droughts andEl Niño–Southern Oscillation (ENSO) years over the sameperiod (Mendoza et al., 2005). Mendoza et al. (2007) con-structed a similar series of droughts on the Yucatán Penin-sula for the 16th to 19th centuries. Garza Merodio (2017) im-proved this index and extended it back in time (see Hernán-dez and Garza Merodio, 2010), based on the frequency andcomplexity of rogation ceremonies (16th to 20th centuries).This approach identified droughts in bishoprics and townsof Mexico. Most recently, Domínguez-Castro et al. (2019)developed series for rainfall, temperature, and other mete-orological phenomena for Mexico City using informationrecorded in the books of Felipe de Zúñiga and Ontiveros;
these volumes provide meteorological data with daily reso-lution for the 12 years spanning from 1775 to 1786 CE.
In South America, the most detailed available historicalinformation is on the scarcity or abundance of water. For in-vestigations into historical rainfall and river flow rates, moststudies construct 5–7 classes of data with annual or seasonalresolution. For example, a number of flood series have beencompiled for rivers in Argentina (Prieto et al., 1999; Herreraet al., 2011; Prieto and Rojas, 2012, 2015; Gil-Guirado et al.,2016) – see Fig. 8. In Bolivia, Gioda and Prieto (1999) andGioda et al. (2000) developed a precipitation series for Potosíbeginning in 1574 CE. In northern Chile, Ortlieb (1995) alsocompiled a detailed precipitation series for the 1800s (CE).In Colombia, Mora Pacheco developed a drought series forthe Altiplano Cundiboyacense spanning the 1778–1828 CEperiod (Mora Pacheco, 2018). Finally, Domínguez-Castro etal. (2018) present a precipitation instrumental series fromQuito (1891–2015 CE) and a series of wet and dry extremesfrom rogation ceremonies from 1600 to 1822 CE. In contrast,temperature records are less reliable and generally begin withthe earliest instrumental data in the late 1800s (CE) (Prietoand García-Herrera, 2009; Prieto and Rojas, 2018), but thereare exceptions (e.g. Prieto, 1983, which covers the 17th and18th centuries). Most temperature-related indices use threeclasses.
Some of the world’s most important index-basedchronologies of ENSO derive from the analysis of ENSO-related impacts recorded in South American documentaryevidence. This area of research was pioneered by WilliamQuinn and colleagues (Quinn et al., 1987; Quinn and Neal,1992), with Quinn’s chronologies revised and improvedby various authors using additional primary documentarysources (e.g. Ortlieb, 1994, 1995, 2000; García-Herrera etal., 2008).
https://doi.org/10.5194/cp-17-1273-2021 Clim. Past, 17, 1273–1314, 2021

1286 D. J. Nash et al.: Climate indices in historical climate reconstructions
Figure 7. Three-point “cold season severity” index for Lesotho and surrounding areas during the 19th century (top), with major volcaniceruptions indicated. The occurrence of snowfall events (bottom) during the same period is also shown (modified after Grab and Nash, 2010).
Figure 8. Six-point index series of historical flow in the Bermejo River (northern Argentina) between 1600 and 2008 CE based on documen-tary evidence. These annual-level data were used to create the decadal-scale flood series in Prieto and Rojas (2015). Zero values are indicatedby short orange bars.
5.3 Sea-ice and snowfall indices
Relatively few studies have developed indices of winter con-ditions for the Americas. Building on their content analysisapproach and that of Astrid Ogilvie in Iceland (see Sect. 2.6),Catchpole and Faurer (1983) and Catchpole (1995) producedopen-ended annual sea-ice indices for the western and east-ern Hudson Bay, spanning the 1751–1869 CE period. A dif-ferent type of three-class index was developed for snowfallin the Andes at 33◦ S spanning 1600–1900 CE, based on thenumber of months per year that the main mountain pass be-tween Argentina and Chile was closed (Prieto, 1984).
6 Climate indices in Australia
6.1 Origins of documentary-based indices in Australia
Like Africa, Australia has a limited history of using doc-umentary records for developing regional climate indices.Aside from early compilations of 19th century colonial docu-ments and newspaper records (Jevons, 1859; Russell, 1877),or climate almanacs published by the Australian Bureau ofMeteorology (Hunt, 1911, 1914, 1918; Watt, 1936; War-ren, 1948), few attempts were made in the 20th centuryto use historical sources to develop climate indices. Thosethat were developed focused predominantly on droughtconditions (see, for example, Foley, 1957; McAfee, 1981;Nicholls, 1988). However, considerable effort has been given
Clim. Past, 17, 1273–1314, 2021 https://doi.org/10.5194/cp-17-1273-2021

D. J. Nash et al.: Climate indices in historical climate reconstructions 1287
in recent years to reconstruct climate variability in south-eastern Australia since British colonisation in 1788 CE us-ing both historical documents and instrumental observations(e.g. Gergis et al., 2009; Fenby, 2012; Fenby and Gergis,2013; Gergis and Ashcroft, 2013; Ashcroft et al., 2014a, b;Gergis et al., 2018; Ashcroft et al., 2019; Gergis et al., 2020).There have also been attempts to reconstruct storms and trop-ical cyclones along the east coast of Australia (e.g. Callaghanand Helman, 2008; Callaghan and Power, 2011, 2014; Powerand Callaghan, 2016), although these are not index-based.
Documentary-based indices for Australia have focusedon regional rainfall histories, primarily using material frompreviously published drought and/or rainfall compilations(Fenby and Gergis, 2013). These compilations contained avast collection of primary source material including news-paper reports, unpublished diaries and letters, almanacs, ob-servatory reports, 19th century Australian publications, andofficial government reports. For example, the seminal 19thcentury sources of Jevons (1859) and Russell (1877), whichformed the foundation of the Fenby and Gergis (2013) anal-ysis, contain 79 primary sources, including 40 accounts frompersonal diaries, letters, and correspondence between a rangeof people in the colony with the authors. Most recently, Ger-gis et al. (2020) compiled colonial newspaper and govern-ment reports to identify daily temperature extremes of snow-fall and heatwaves from South Australia back to 1838. Al-though a temperature index has not yet been developed fromthis material, there is great potential to do so alongside re-cently homogenised 19th century instrumental temperatureobservations from the Adelaide region.
6.2 Precipitation and drought indices
The most extensive analysis of documentary records wascompiled by Fenby (2012) and Fenby and Gergis (2013) aspart of a large-scale project to reconstruct climate in south-eastern Australia using palaeoclimate, early instrumental,and documentary data (Gergis et al., 2018). Fenby and Ger-gis (2013) used 12 secondary source compilations to collatemonthly summaries of drought conditions experienced in fivemodern states in southeastern Australia between 1788 and1860 CE into a three-point index (wet, normal, and drought).As explained in Sect. 8.5, agreement between sources andseveral months of dry conditions was required before a pe-riod was considered a drought, rather than just “normal”low summer rainfall. In coastal New South Wales, monthsof above-average rainfall were only compiled where suffi-ciently detailed rainfall information was available (Fenbyand Gergis, 2013). Given that Australian rainfall has highspatial variability, and many of the secondary sources onlycontained descriptions of localised floods or severe stormevents, there were insufficient local reports from other re-gions to reconstruct larger-scale rainfall conditions using thesources considered.
To combine instrumental and documentary data into asingle series spanning European settlement of Australia(1788 CE–present), Gergis and Ashcroft (2013) developed athree-point drought and wet year index based on instrumen-tal rainfall observations from a 5-station network in the Syd-ney region (spanning 1832–1859) and a 45-station rainfallnetwork from across southeastern Australia (1860–2008). Aswith the “wetness” index for Africa (Fig. 5), the instrumen-tal data were converted to an index so they could be com-bined with the documentary-based index of Fenby and Ger-gis (2013) to create a single, complete rainfall reconstruc-tion. Good agreement was found during the overlapping pe-riod between instrumental and documentary-derived indices(1832–1860), and between the eastern New South Wales in-dex and the wider southeastern Australian indices. This pro-vides some confidence that the two indices could be com-bined, and that data from the very early period, when onlyeastern New South Wales records are available, are indica-tive of conditions experienced in the broader region.
Given the exploratory nature of this work in southeasternAustralia, the aim of these studies was to use documentaryand instrumental data to simply identify the occurrence ofwet and dry years in the first instance, rather than developa more finely resolved scale of the magnitude of the rainfallanomalies. The recent digitisation and analysis of daily in-strumental rainfall data from Sydney, Melbourne, and Ade-laide (Ashcroft et al., 2019) provides an excellent opportu-nity to develop indices combining documentary and instru-mental data from these regions in the future.
7 Climate indices and the world’s oceans
7.1 Challenges in generating documentary-basedindices for the world’s oceans
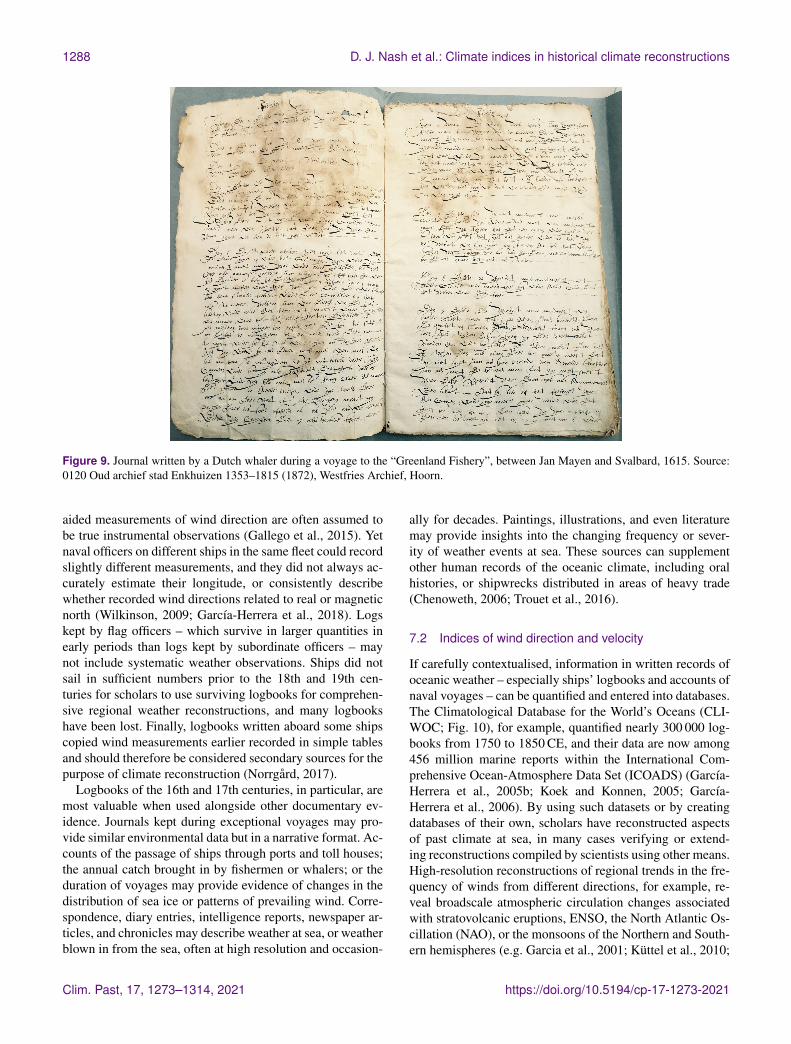
The oceans constitute a challenging environment for histori-cal climatologists. Written evidence of past weather at sea isgenerally local in scope, especially before the 17th century,and direct weather observations scarcely extend beyond thecoast before the 15th century. Historical climatologists canuse two categories of information to create reconstructionsof past oceanic climate: (i) direct observations of weather,water, and sea-ice conditions; and (ii) records of activitiesthat were influenced by weather and water conditions. Suchinformation can be found in documents written at sea (onships, boats or, from the 20th century, submarines; Fig. 9),documents written on the coast within sight of the sea, anddocuments written inland that record weather or activities atsea.
Between the 16th and 20th centuries, ships’ logbooks areperhaps the most useful source type (see Wheeler, 2005a,b; Wheeler and Garcia-Herrera, 2008; Ward and Wheeler,2012; García-Herrera and Gallego, 2017; Degroot, 2018).Sailors originally recorded the speed and direction of thewind in order to calculate their location, and their compass-
https://doi.org/10.5194/cp-17-1273-2021 Clim. Past, 17, 1273–1314, 2021
1288 D. J. Nash et al.: Climate indices in historical climate reconstructions
Figure 9. Journal written by a Dutch whaler during a voyage to the “Greenland Fishery”, between Jan Mayen and Svalbard, 1615. Source:0120 Oud archief stad Enkhuizen 1353–1815 (1872), Westfries Archief, Hoorn.
aided measurements of wind direction are often assumed tobe true instrumental observations (Gallego et al., 2015). Yetnaval officers on different ships in the same fleet could recordslightly different measurements, and they did not always ac-curately estimate their longitude, or consistently describewhether recorded wind directions related to real or magneticnorth (Wilkinson, 2009; García-Herrera et al., 2018). Logskept by flag officers – which survive in larger quantities inearly periods than logs kept by subordinate officers – maynot include systematic weather observations. Ships did notsail in sufficient numbers prior to the 18th and 19th cen-turies for scholars to use surviving logbooks for comprehen-sive regional weather reconstructions, and many logbookshave been lost. Finally, logbooks written aboard some shipscopied wind measurements earlier recorded in simple tablesand should therefore be considered secondary sources for thepurpose of climate reconstruction (Norrgård, 2017).
Logbooks of the 16th and 17th centuries, in particular, aremost valuable when used alongside other documentary ev-idence. Journals kept during exceptional voyages may pro-vide similar environmental data but in a narrative format. Ac-counts of the passage of ships through ports and toll houses;the annual catch brought in by fishermen or whalers; or theduration of voyages may provide evidence of changes in thedistribution of sea ice or patterns of prevailing wind. Corre-spondence, diary entries, intelligence reports, newspaper ar-ticles, and chronicles may describe weather at sea, or weatherblown in from the sea, often at high resolution and occasion-
ally for decades. Paintings, illustrations, and even literaturemay provide insights into the changing frequency or sever-ity of weather events at sea. These sources can supplementother human records of the oceanic climate, including oralhistories, or shipwrecks distributed in areas of heavy trade(Chenoweth, 2006; Trouet et al., 2016).
7.2 Indices of wind direction and velocity
If carefully contextualised, information in written records ofoceanic weather – especially ships’ logbooks and accounts ofnaval voyages – can be quantified and entered into databases.The Climatological Database for the World’s Oceans (CLI-WOC; Fig. 10), for example, quantified nearly 300 000 log-books from 1750 to 1850 CE, and their data are now among456 million marine reports within the International Com-prehensive Ocean-Atmosphere Data Set (ICOADS) (García-Herrera et al., 2005b; Koek and Konnen, 2005; García-Herrera et al., 2006). By using such datasets or by creatingdatabases of their own, scholars have reconstructed aspectsof past climate at sea, in many cases verifying or extend-ing reconstructions compiled by scientists using other means.High-resolution reconstructions of regional trends in the fre-quency of winds from different directions, for example, re-veal broadscale atmospheric circulation changes associatedwith stratovolcanic eruptions, ENSO, the North Atlantic Os-cillation (NAO), or the monsoons of the Northern and South-ern hemispheres (e.g. Garcia et al., 2001; Küttel et al., 2010;
Clim. Past, 17, 1273–1314, 2021 https://doi.org/10.5194/cp-17-1273-2021

D. J. Nash et al.: Climate indices in historical climate reconstructions 1289
Barriopedro et al., 2014; Barrett, 2017; Barrett et al., 2018;García-Herrera et al., 2018).
7.3 Indices of sea-ice extent
Records of sea ice in harbours and heavily trafficked water-ways – or records of dues paid at ports and toll houses –yield easily quantified data. However, reports of sea ice athigh latitudes in correspondence, logbooks, or journals writ-ten before the 19th century often give unclear descriptionsof sea-ice density, which makes it harder to determine howmuch sea ice there might have been in different regions fromyear to year (Prieto et al., 2004). The resolution and preci-sion of Arctic index-based sea-ice or iceberg reconstructionsthat rely on early modern documents is accordingly quite low(Catchpole and Faurer, 1983; Catchpole and Halpin, 1987;Catchpole and Hanuta, 1989). An emerging way to circum-vent this issue is to focus on particular regions where warmand cold ocean currents mixed and areas that were sensi-tive to (a) changes in sea and air surface temperatures and(b) current strength, for example, around western Svalbardor the Yugorsky Strait (Degroot, 2015). Logbook reports ofthe presence of sea ice in these target areas can be quanti-fied, indexed, and used to develop reconstructions that sug-gest broadscale shifts in the strength of marine currents (De-groot, 2020).
7.4 Indices of precipitation and storms
Some ships’ logbooks note the occurrence of precipitation atsea, and most record winds that must have influenced pre-cipitation on land. Therefore, historical climatologists haveused logbooks to classify and graph precipitation at or nearthe sea (e.g. Wheeler, 2005b; Hannaford et al., 2015). More-over, most documents that directly describe weather at sea orblown in from the sea faithfully report storms and at least ap-proximately note their severity (Lamb, 1992; García-Herreraet al., 2004; García-Herrera et al., 2005a; Chenoweth and Di-vine, 2008; Wheeler et al., 2010). Reconstructions based onwritten evidence of damage inflicted along the coast, how-ever, can be more problematic, as damage reflected bothcomplex social conditions and environmental circumstancesbeyond the severity of storms (de Kraker, 2011; Degroot,2018).
8 Methods for the derivation of climate indices
The preceding sections have highlighted the variable numberof classes used in index-based climate reconstructions andhinted at the variety of different approaches to index devel-opment. This section summarises the main methodologicalapproaches used to derive indices on the different continents,with an emphasis on temperature and rainfall series.
8.1 Climate index development in Europe – “Pfisterindices”
In Europe, the most widely adopted approach to the re-construction of temperature and rainfall variability for cli-matically homogenous regions is through the developmentof seven-point ordinal indices (Pfister, 1984; Pfister et al.,2018), which the climate historian Franz Mauelshagen hastermed “Pfister indices” (Mauelshagen, 2010). These indicesare normally generated at a monthly level through the anal-ysis of (bio)physically based proxies and contemporary re-ports of climate and related conditions. This is not withoutits challenges, and it requires a source-critical understandingof the evidence-base in addition to a knowledge of regionalclimates (Brázdil et al., 2010). To aid interpretation, any con-temporary report should be accompanied by a range of infor-mation, including details of the date, time, location affected,author, and source quality (see Brázdil et al., 2010; Pfister etal., 2018). The criteria used to allocate a specific month toa specific index category will vary from place to place ac-cording to regional climatic variability. Table 1, for example,illustrates the indicators used to classify individual monthsas either “warm” (+2/+3) or “cold” (−2/−3) in a tempera-ture reconstruction for Switzerland (Pfister, 1992); these in-clude regionally relevant phenomena such as the timing andduration of snowfall and various plant-phenological indica-tors. Pfister et al. (2018) recommend that monthly rankingsof above +1 and below −1 should only be attributed basedon proxy data such as phenological evidence, with values of−3 and +3 reserved only for exceptional months. An indexvalue of 0 should only be used where reports of climate sug-gest normal conditions – an absence of data should be re-ported as a gap in the time series rather than a 0 value.
Once monthly index values have been generated, these arethen summed to produce seasonal or annual classificationswhere required. Three-month seasonal values can, as a re-sult, fluctuate from −9 to +9 and annual values from −36 to+36 (see Pfister, 1984). It should be remembered, however,that indexation generates ordinal data, with no guarantee thatthe intervals between each index level are equal, so that thesum for a specific season or year can only approximate themagnitude of a meteorological phenomenon. The process ofsummation may result in positive index values for relativelywarmer/wetter months during the year being cancelled out bynegative index values for relatively colder/drier months. Forexample, a year containing a run of extremely dry monthsfollowed by a run of extremely wet months may produce asummed index value close to zero – even though the yearincludes two periods of “extreme” climate. Careful assess-ment is therefore required when reporting summed indicesto avoid any loss of information, particularly concerning ex-treme events. The approach used by Nicholson et al. (2012a)for African precipitation series may be helpful here, whereindividual years were flagged if documentary sources sug-
https://doi.org/10.5194/cp-17-1273-2021 Clim. Past, 17, 1273–1314, 2021

1290 D. J. Nash et al.: Climate indices in historical climate reconstructions
Figure 10. Plot of the position of all ships’ logbook entries in the CLIWOC database (Degroot and Ottens, 2021). The map is derived fromthe open-source variant of the CLIWOC database (García-Herrera et al., 2005b) held at https://www.historicalclimatology.com (last access:3 June 2021).
Table 1. Criteria used in the generation of seven-point temperature indices for “warm” (+2/+3) or “cold” (−2/−3) months in Switzerland(after Pfister, 1992, and Pfister et al., 2018). Bold text indicates criteria grounded in statistical analyses.
Month “Cold”(index values of −2/−3)
“Warm”(index values of +2/+3)
Dec, Jan, Feb Uninterrupted snow coverFreezing of lakes
Scarce snow coverEarly vegetation activity
Mar Long duration of snow coverFrequent snowfalls
Early sweet cherry floweringNo snowfall
Apr Several days of snow coverFrequent snowfalls
Beech tree leaf emergenceEarly vine flower
May Late grain and grape harvestLate vine flower
Early grain and grape harvestStart of barley harvest
Jun Late vine flowerSeveral low-altitude snowfalls
Early grain and grape harvestHigh vine yields
Jul Low vine yieldsSnowfalls at higher altitudes
High vine yields
Aug Low tree ring densityLow sugar content of vineSnowfalls at higher altitudes
High tree ring densityHigh sugar content of vine
Sep Low sugar content of vineSnowfalls at higher altitudes
High sugar content of vine
Oct Snowfalls, snow cover Second flowering of spring plants
Nov Long duration of snow cover Second flowering of springplantsNo snowfall
gested wetter and drier extremes across the year that differedby more than two index classes.
Implicit in this methodological approach is that runs ofmonthly indices are available with almost no gaps (e.g.Litzenburger, 2015) or that, where gaps occur, there is a highprobability that conditions during a given month reflect the
longer-term average for that month (e.g. Dobrovolný et al.,2009). Variations in source density, however, mean that itmay not always be possible to define indices at a monthlylevel. Such variations could simply be due to a scarcity ofavailable sources, or could be the product of seasonal vari-ability that results in observations of a climate phenomenon
Clim. Past, 17, 1273–1314, 2021 https://doi.org/10.5194/cp-17-1273-2021

D. J. Nash et al.: Climate indices in historical climate reconstructions 1291
being concentrated in specific parts of the year (e.g. obser-vations of rainfall in areas of Europe with a Mediterraneanclimate are likely to be concentrated between Septemberand April). In these situations, researchers should (i) choosean appropriate temporal resolution (i.e. seasonal or annual)based on the number and quality of available records, and (ii)develop specific seasonal- or annual-level criteria – see, forexample, the temperature and precipitation reconstructionsfor Belgium, Luxembourg, and the Netherlands generated byCamenisch (2015a) or the Mediterranean temperature seriesby Camuffo et al. (2010). The methods used for calibrationand verification are outlined in the following section.
In the development of his seven-point scale, Pfister as-sumed that monthly temperature and precipitation followeda Gaussian distribution. Initially, Pfister (1984) developed“duodecile” classes based on the frequency distribution ofmonthly temperature/precipitation means for the 60-year ref-erence period from 1901 to 1960 as the standard of compar-ison (Table 2). The most extreme months (i.e. those givenan index value of −3/+3) were those that fell into duodecileclasses 1 and 12, representing the 8.3 % driest (or coldest) or8.3 % wettest (or warmest) months respectively. Other indexcategories were defined using 16.6 % intervals. In the laterversion of his indices, Pfister (1999 and onwards) discon-tinued the use of duodecile classes, instead using the stan-dard deviation from the mean temperature/precipitation forthe 1901–1960 reference period to define index categories:±180 % (of the standard deviation from the mean of the ref-erence period) for index values −3/+3, ±130 % for values−2/+2, and ±65 % for values +1/−1.
8.2 Climate index development in Asia
In China, the quantification of historical records to recon-struct climate change originated with a semantic differentialmethod based on an analysis of each record’s content (seeCentral Meteorological Bureau of China, 1981; Su et al.,2014; Yin et al., 2015). Temperature series were traditionallyestablished at a decadal scale only. In creating a series, eachyear was first defined as “cold”, “warm”, or “normal” ac-cording to direct weather descriptions or environmental andphenological evidence. In contrast to the Pfister method (seeSect. 8.1), “normal” was also used when there was insuffi-cient information available to determine temperature abnor-malities. This approach reflects the nature of most Chinesedocuments, where the primary mission of the recorders wasto detail abnormal or extreme events; fewer descriptions ofabnormal events are therefore interpreted as indicating con-ditions closer to normal. After each year had been defined ascold, warm, or normal, an equation was then used to derivethe decadal indices. The earliest example was published byZhang (1980): Ti =−[n1+0.3(10−(n1+n2)], where Ti is thedecadal winter temperature index, n1 is the number of coldyears, n2 is the number of warm years, and 0.3 is the em-pirical coefficient (see also Zhang and Crowley, 1989). The
resulting value is always negative; the lower the value, themore severe the coldness.
A second approach to the construction of ordinal scale in-dices was developed by other researchers in the 1990s (e.g.R. S. Wang and Wang, 1990; S. W. Wang and Wang, 1990;Wang et al., 1998). This used a four-point scale (0, 1, 2, 3)(Table 3). As in Europe, indices were generated through theanalysis of phenological descriptions and contemporary re-ports of climate and related phenomena. Like Europe, crite-ria for individual index categories could also be adjusted forspecific places at specific seasons according to geographicaland climatic attributes. However, unlike the Pfister method,an index value of 0 could be used where there were miss-ing data. S. W. Wang and Wang (1990) further introduceda statistical method to compare phenological evidence withmodern (1951–1985 CE) and early instrumental data (1873–1972 CE in Shanghai) and allocate temperature ranges to or-dinal scales. An index value of −0.5 corresponded to a −0.5to −0.9 ◦C temperature anomaly, a value of −1.0 to a −1.0to −1.9 ◦C anomaly, and a value of −2.0 to an anomaly of≤−2.0 ◦C; values of 1.5 were added to indicate warm tem-peratures, and values of −3.0 were added to capture extremecold periods. These cold indices were then regressed with thedecadal mean temperature (1873–1972 CE) to derive a coef-ficient through which the index value could be transferredinto a “real” temperature.
Chen and Shi (2002) built upon the approaches ofZhang (1980) and R. S. Wang and Wang (1990) in devel-oping an equation to calculate decadal temperature indices:Ti = 10−2n1−n2+n3, where n1 is the number of extremelycold years, n2 is the number of cold years, and n3 is the num-ber of warm years. A resulting decadal temperature indexvalue of 10 denotes average conditions;<10 denotes anoma-lous cold; and >10 denotes anomalous warm. Successivework (Tan and Liao, 2012; Tan and Wu, 2013) adopted theChen and Shi (2002) approach with a slight modification ofthe index criteria while retaining the four-point ordinal scale.The temperature series generated using this approach havebeen incorporated into multi-proxy temperature reconstruc-tions (e.g. Yi et al., 2012; Ge et al., 2013). Zheng et al. (2007)and Ge et al. (2013) provide useful reviews of the approachused to generate temperature indices in China.
As noted in Sect. 3.2, drought–flood index reconstruc-tion in China has a long tradition. Two main approachesare used. Earlier studies adopted a proportionality index ap-proach (Zhu, 1926; Yao, 1943). As explained by Gong andHameed (1991), Zhu used the equation I =D/F to calcu-late the index, where D represents the number of droughtsand F the number of floods in a given time period. Thisequation is poorly defined if F or D is zero. Brooks (1949)modified the equation and used the flood percentage, I =100×F/(F+D), to derive moisture conditions in Britain andsome European regions from 100 BCE onwards at a 50-yearresolution. Gong and Hameed (1991) further modified theequation as I = 2F (F +D) to derive indices at a 5-year res-
https://doi.org/10.5194/cp-17-1273-2021 Clim. Past, 17, 1273–1314, 2021
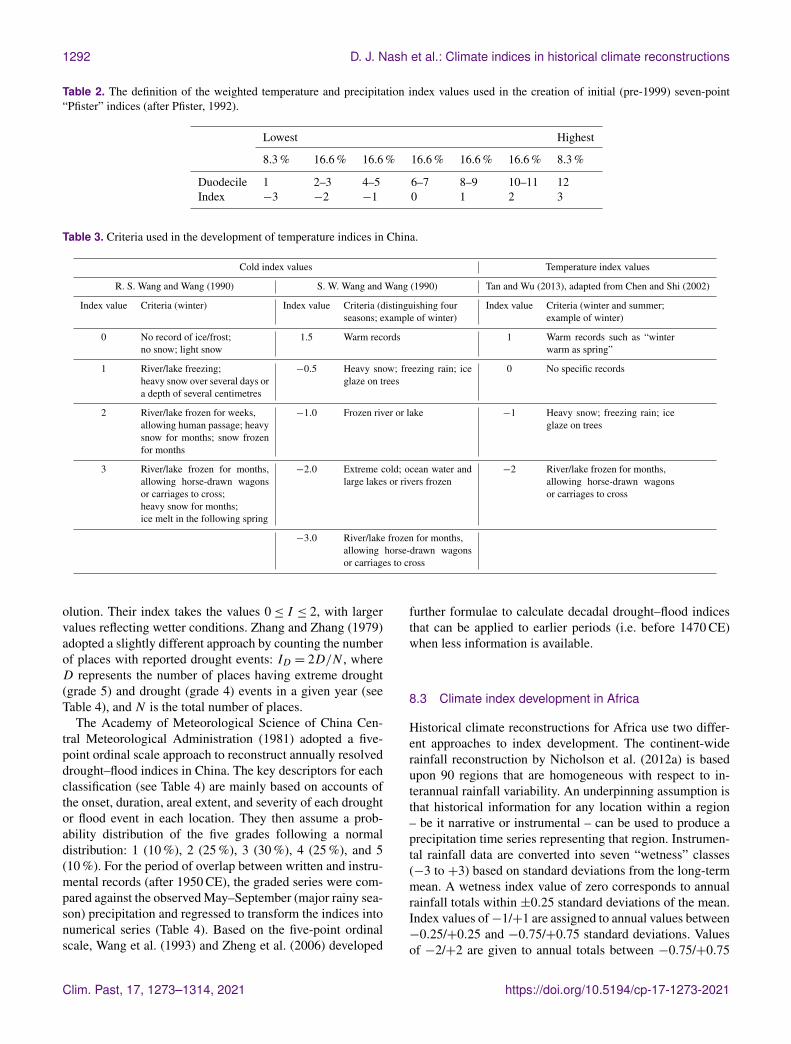
1292 D. J. Nash et al.: Climate indices in historical climate reconstructions
Table 2. The definition of the weighted temperature and precipitation index values used in the creation of initial (pre-1999) seven-point“Pfister” indices (after Pfister, 1992).
Lowest Highest
8.3 % 16.6 % 16.6 % 16.6 % 16.6 % 16.6 % 8.3 %
Duodecile 1 2–3 4–5 6–7 8–9 10–11 12Index −3 −2 −1 0 1 2 3
Table 3. Criteria used in the development of temperature indices in China.
Cold index values Temperature index values
R. S. Wang and Wang (1990) S. W. Wang and Wang (1990) Tan and Wu (2013), adapted from Chen and Shi (2002)
Index value Criteria (winter) Index value Criteria (distinguishing fourseasons; example of winter)
Index value Criteria (winter and summer;example of winter)
0 No record of ice/frost;no snow; light snow
1.5 Warm records 1 Warm records such as “winterwarm as spring”
1 River/lake freezing;heavy snow over several days ora depth of several centimetres
−0.5 Heavy snow; freezing rain; iceglaze on trees
0 No specific records
2 River/lake frozen for weeks,allowing human passage; heavysnow for months; snow frozenfor months
−1.0 Frozen river or lake −1 Heavy snow; freezing rain; iceglaze on trees
3 River/lake frozen for months,allowing horse-drawn wagonsor carriages to cross;heavy snow for months;ice melt in the following spring
−2.0 Extreme cold; ocean water andlarge lakes or rivers frozen
−2 River/lake frozen for months,allowing horse-drawn wagonsor carriages to cross
−3.0 River/lake frozen for months,allowing horse-drawn wagonsor carriages to cross
olution. Their index takes the values 0≤ I ≤ 2, with largervalues reflecting wetter conditions. Zhang and Zhang (1979)adopted a slightly different approach by counting the numberof places with reported drought events: ID = 2D/N , whereD represents the number of places having extreme drought(grade 5) and drought (grade 4) events in a given year (seeTable 4), and N is the total number of places.
The Academy of Meteorological Science of China Cen-tral Meteorological Administration (1981) adopted a five-point ordinal scale approach to reconstruct annually resolveddrought–flood indices in China. The key descriptors for eachclassification (see Table 4) are mainly based on accounts ofthe onset, duration, areal extent, and severity of each droughtor flood event in each location. They then assume a prob-ability distribution of the five grades following a normaldistribution: 1 (10 %), 2 (25 %), 3 (30 %), 4 (25 %), and 5(10 %). For the period of overlap between written and instru-mental records (after 1950 CE), the graded series were com-pared against the observed May–September (major rainy sea-son) precipitation and regressed to transform the indices intonumerical series (Table 4). Based on the five-point ordinalscale, Wang et al. (1993) and Zheng et al. (2006) developed
further formulae to calculate decadal drought–flood indicesthat can be applied to earlier periods (i.e. before 1470 CE)when less information is available.
8.3 Climate index development in Africa
Historical climate reconstructions for Africa use two differ-ent approaches to index development. The continent-widerainfall reconstruction by Nicholson et al. (2012a) is basedupon 90 regions that are homogeneous with respect to in-terannual rainfall variability. An underpinning assumption isthat historical information for any location within a region– be it narrative or instrumental – can be used to produce aprecipitation time series representing that region. Instrumen-tal rainfall data are converted into seven “wetness” classes(−3 to +3) based on standard deviations from the long-termmean. A wetness index value of zero corresponds to annualrainfall totals within ±0.25 standard deviations of the mean.Index values of−1/+1 are assigned to annual values between−0.25/+0.25 and −0.75/+0.75 standard deviations. Valuesof −2/+2 are given to annual totals between −0.75/+0.75
Clim. Past, 17, 1273–1314, 2021 https://doi.org/10.5194/cp-17-1273-2021

D. J. Nash et al.: Climate indices in historical climate reconstructions 1293
Table 4. Criteria used in the generation of five-point drought–flood indices in China (Academy of Meteorological Science of China CentralMeteorological Administration, 1981). For more details, see Zhang and Crowley (1989), Zhang et al. (1997), and Yi et al. (2012).
Index value Norm Transfer function for precipitation amount
1 (Very wet) Prolonged heavy rain, continuous flood overtwo seasons, extensive flood, unusually heavytyphoon rain
Ri > (R+ 1.17σ ), where R is the mean May–Sep precipitation, σ is the standard deviation,and Ri is the precipitation in the ith year
2 (Wet) Spring or autumn prolonged rain with moderatedamage, local flood
(R+ 0.33σ )< Ri ≤ (R+ 1.17σ )
3 (Normal) Favourable weather, usual case, or nothing spe-cial to be noted in records
(R− 0.33σ )<Ri ≤ (R+ 0.33σ )
4 (Dry) Minor impacts of drought in a single season, lo-cal minor drought disaster
(R− 1.17σ )<Ri ≤ (R− 0.33σ )
5 (Very dry) Severe drought over a season, drought contin-ued for several months, severe drought over anextensive area, or records describing extensiveareas of barren land
Ri ≤ (R− 1.17σ )
and −1.25/+1.25 standard deviations, with more extremedepartures classed as −3/+3.
Documentary data are integrated by first assigning indi-vidual pieces of narrative evidence to a specific region; eachpiece of evidence is then classified into one of the seven“wetness” categories. Like the approach used by Pfister, thepresence of key descriptors of climate conditions is used todistinguish these categories. The scores for each item of evi-dence for a specific region/year are summed and averaged.Where there are several sources, a “0 index” value repre-sents an average of conditions. Where only single sourcesare available, some contain so much climate-related infor-mation that, as in China, absence of evidence for a specificseason is taken to infer “normal” conditions; such cases areindicated in the original data file accompanying the Nichol-son et al. (2012a) reconstruction. Algorithms are then usedto weight and combine documentary and instrumental datafor each region and year. These are defined subjectively ac-cording to the accuracy of the quantitative versus qualita-tive indicators. For example, when one of each type is avail-able, the qualitative indicator is weighted twice as much asthe gauge because of the inherent spatial variability withinAfrican rainfall. A second assumption is that when the cor-relation between rainfall in two regions is >0.5, the regionsare appropriate substitutes for each other (Nicholson, 2001).In this way, classifications for regions without evidence fora given year can be derived by substitution. Statistical infer-ence (termed “spatial reconstruction” by Nicholson) is thenused to generate classifications for any remaining regions.The cut-off of 0.5 was selected based on examination of timeseries that correlate with each other at various levels. Thosewith a correlation of 0.5 showed marked similarity, though itshould be noted that, in most cases, the correlation was muchhigher, with the statistical significance being >0.001.
Regional rainfall reconstructions in southern Africa use anapproach much closer to the Pfister method to classify doc-umentary evidence into one of five rainfall classes (−2 to+2); these classes are ordinal rather than based on statisti-cal distributions. Like the Pfister method, a “0 index” valueis only awarded where narrative evidence suggests normalconditions – years with inconclusive or no data are left un-classified. Owing to the relatively paucity of documentarydata for Africa compared with Europe, conditions for spe-cific rainy seasons are categorised at a quarterly (e.g. Nash etal., 2016) or, more commonly, annual level. Again, key de-scriptors are used to distinguish the various index classes.The main point of divergence with the approach used byNicholson is that – rather than assigning individual piecesof evidence to wetness classes and averaging – qualitativeanalysis is undertaken of all quotations describing weatherand related conditions for an entire quarter/year (see Nash,2017). These different methodological approaches, as wellas the type of documentary evidence used, can introduce dis-crepancies between rainfall series for overlapping regions.Hannaford and Nash (2016) and Nash et al. (2018) note, forexample, that the reconstructions in Nicholson et al. (2012a)for KwaZulu-Natal during the first decade of the 19th cen-tury and Malawi for the 1880s–1890s show generally drierconditions than overlapping series generated using differentmethods.
8.4 Climate index development in the Americas
Temperature, precipitation, and phenological indices forNorth America have been based on a distinctive content anal-ysis approach. This method was first applied to historical cli-matology in the 1970s to reconstruct freeze and break-updates around Hudson Bay for the 1714–1871 CE period by
https://doi.org/10.5194/cp-17-1273-2021 Clim. Past, 17, 1273–1314, 2021

1294 D. J. Nash et al.: Climate indices in historical climate reconstructions
quantifying the frequency and co-occurrence of key weatherdescriptors in Hudson’s Bay Company records (Catchpole etal., 1970; Moodie and Catchpole, 1975). The resulting in-dices are open-ended, as more and stronger descriptors in thesources could generate indefinitely larger (positive or nega-tive) values. Baron (1980) adapted content analysis to anal-yse historical New England diaries, by ranking and then nu-merically weighting descriptors of several types of weatherfound in those sources. In subsequent publications, he andcollaborators adopted different scales for annual and sea-sonal temperature and precipitation depending on the levelof detail in the underlying sources (e.g. Baron, 1995).
In Mexico, Mendoza et al. (2007) constructed a seriesof historical droughts for the Yucatán Peninsula using themethod of Holmes and Lipo (2003). In this investigation, his-torical drought data were transformed into a series of pulsewidth modulation types (1 drought, 0 no drought) and linkedto the Atlantic Multidecadal Oscillation and Southern Oscil-lation Index. Other studies have used key descriptors as thebasis for index development. Garza Merodio (2017), for ex-ample, classified rogation ceremonies into five ordinal lev-els based on Garza and Barriendos (1998), creating droughtseries for México, Puebla, Morelia, Guadalajara, Oaxaca,Durango, Sonora, Chiapas, and Yucatán. Domínguez-Castroet al. (2019) generated binary series (presence or absence)for precipitation, frost, hail, fog, thunderstorm, and windin Mexico City. Temperature indices for Mexico have beendeveloped using the applied content analysis approach ofBaron (1982) and Prieto et al. (2005).
In South America, the methodology used to analyse histor-ical sources for climate reconstruction initially followed thecontent analysis approach of Moodie and Catchpole (1975),but it was later adapted in a number of papers by María delRosario Prieto (e.g. Prieto et al., 2005). As noted in Sect. 5,most historical rainfall and river flow index series use five toseven annually resolved or seasonally resolved classes basedon key descriptors, whereas most temperature-related seriesuse three classes. To date, all South American rainfall andtemperature series are ordinal in nature and do not makebackground assumptions about the statistical distribution ofclimate-related phenomena. However, the method used to de-rive “0 index” values is not always clearly stated, and manyseries do not discriminate between “no data” and “normal”years (both of which are expressed as zero values). For ex-ample, in many studies that use rogation ceremonies as thebasis for rainfall index development, months when there areno ceremonies are categorised as zero. There are exceptions,e.g. Domínguez-Castro et al. (2018), who explicitly identifyan absence of ceremonies as “no data”, and Prieto and Ro-jas (2015), who clearly differentiate between normal yearsand no data. A systematic reanalysis of many series wouldbe useful to determine exactly how each was constructed.
The approach used by Quinn et al. (1987) and Quinn andNeal (1992) to construct El Niño series over the past 4.5centuries is slightly different. The relative strengths of in-
dividual El Niño events were based on a range of subjectiveand objective measures in documentary sources from coastalPeru. These include descriptions of relative rainfall, the ex-tent of flooding, and the degree of physical damage and de-struction associated with each event, alongside accounts ofimpacts on shipping (e.g. wind and current effects on traveltimes between ports), fisheries (e.g. changes to fish catches,changes in fish meal production), and marine life (e.g. massmortality of endemic marine organisms and guano birds, ex-tent of invasion by tropical nekton) (Quinn et al., 1987). Thisbroad approach was continued in subsequent studies by Or-tlieb (1994, 1995, 2000), García-Herrera et al. (2008), andothers.
8.5 Climate index development in Australia
Australian efforts have largely been based on the Pfis-ter approach (Sect. 8.1) and regional-scale historical cli-matology investigations in southern Africa (Sect. 8.3), al-though instrumental and documentary sources have beenanalysed separately. Fenby and Gergis (2013) and Gergisand Ashcroft (2013) converted documentary and instrumen-tal data into a three-point scale of wet, normal, and droughtconditions. Historical data availability along with high spa-tial variability and known non-linearities in Australian rain-fall meant that wet and dry conditions were assessed differ-ently. Years were classified as “normal” if they failed to reacheither wet or dry criteria. To avoid introducing errors or bi-ases in the record, years with missing data were marked asmissing, rather than given a value of zero.
For droughts, agreement between a minimum of 3 of the12 documentary sources used was required for drought con-ditions to be identified in a given month. Droughts wereidentified regionally in one of five modern southeastern Aus-tralian states. To avoid issues associated with exaggerated ac-counts of dry conditions and/or localised drought, a year wasclassified as a “drought year” only when at least 40 % of his-torical sources indicated dry conditions for at least 6 consec-utive months during the May-April “ENSO” year (the periodwith strongest association between southeastern Australianrainfall variations and ENSO; Fenby and Gergis, 2013). Dryconditions were defined as times where a lack of rainfall wasperceived as severe by society, or negatively impacted uponagriculture or water availability.
Months of above-average rainfall in coastal New SouthWales were identified using the annual rainfall summariesof Russell (1877), as this was the only source with consistentyearly information about rainfall events and impacts. Alongwith specific reports of good rainfall, monthly classificationsof wet conditions were also based on accounts of flooding,abundant crops, excellent pasture, and the occurrence of in-sect plagues (Fenby and Gergis, 2013). Six months of highrainfall were required for a year (May–April) to be definedas wet.
Clim. Past, 17, 1273–1314, 2021 https://doi.org/10.5194/cp-17-1273-2021

D. J. Nash et al.: Climate indices in historical climate reconstructions 1295
Combining the documentary-based indices with an instru-mentally derived index enabled the development of a sin-gle index of wet and dry conditions for eastern New SouthWales from 1788 to 2008 CE. Each year of the instrumen-tal rainfall datasets – the nine-station network for the Syd-ney region (1832–1860 CE) and a larger 45-station networkrepresenting the wider southeastern Australian region – wasassigned an index value of wet (1), normal (0), or dry (−1)based on normalised precipitation anomalies. Years with anormalised precipitation anomaly greater than the 70th per-centile were counted as wet for that station, whereas thosewith an anomaly below the 30th percentile were counted asdry. Overall, a year was classified as wet or dry for the re-gion if at least 40 % of the stations with data available werein agreement, in line with the documentary classification ofFenby and Gergis (2013). Similar methods were employedby Ashcroft et al. (2014a), who used half a standard devia-tion above or below the 1835–1859 CE mean to build three-point indices of temperature, rainfall, and pressure variabilityin southeastern Australia before 1860 CE using early instru-mental data.
8.6 Climate index development in the oceans
The most common indices for marine climate reconstruc-tion quantify shifts in prevailing wind direction. Most con-vert directional measurements from the 32-point system usedby mariners in logbooks to 1-, 4- or (very recently) 8-pointindices – in part, because sailors were biased towards 4,8, and 16-point compass readings (Wheeler, 2004, 2005a).These “directional indices” resemble the ordinal scales usedto quantify qualitative temperature and rainfall observationson land. Few calculate error or confidence in their recon-structions, in part because those considerations are difficultto quantify (see García-Herrera et al., 2018). Recent studieshave quantified the uncertainty involved in connecting log-book observations to broadscale circulation changes by us-ing a calibration process that correlates wind directions in atarget area traversed by ships to, for example, the strength ofa monsoon (Gallego et al., 2015, 2017).
Wind velocity and storm intensity or frequency indiceshave also made use of observations recorded in logbooks.Beginning in the 19th century, mariners made these measure-ments using the 12-point Beaufort wind force scale. Beforethat, measurements refer to the sails that mariners needed tofurl or unfurl in winds of different velocity. Thus, the mea-surements are more subjective than those of wind direction,yet they can still be roughly translated into Beaufort indices(see García-Herrera et al., 2003; Koek and Konnen, 2005).Hence, it is possible to use these indices to develop high-resolution reconstructions of trends in average wind veloci-ties and storm frequency and intensity (Degroot, 2014). Yet,as shifts in wind direction were more objectively recordedby sailors than changes in wind velocity, and are equally in-dicative of broadscale circulation changes, directional recon-
structions are generally favoured by historical climatologists(Ordóñez et al., 2016).
9 Calibration, verification, and dealing withuncertainty
9.1 Calibration and verification in index development
There are several approaches for calibrating and verifying in-dex series used globally. Where overlapping meteorologicaldata are available, long series of temperature and precipita-tion indices can be converted into quantitative meteorolog-ical units by using statistical climate reconstruction proce-dures; some of these have been inherited from fields such asdendroclimatology (see Brázdil et al., 2010, for a full discus-sion of statistical methods). For regions of the world lackinglong instrumental records, simple cross-checking of climateindices against shorter periods of overlapping data is oftenused.
In Europe, Pfister (1984) was the first to use a calibrationand verification process in the development of his indices.His approach – an example of best practice for regions wherethere is a lengthy period of instrumental overlap with the doc-umentary record – is summarised by Brázdil et al. (2010) andDobrovolný (2018) and illustrated in Fig. 11. However, evenwhere a period of overlap is lacking, indices from documen-tary sources can still be used to cross-check reconstructionsfrom proxy data (e.g. Bauch et al., 2020) or modelling re-sults and observations (e.g. Bothe et al., 2019). The aim ofcalibration is to develop a transfer function between an indexseries and the measured climate variable, with verificationagainst an independent period or subset of the overlappingmeteorological data used to check the validity of this transferfunction. In studies where there is a multi-decadal period ofoverlap, the instrumental data are normally divided into twosub-periods; the index series is first calibrated to the earliersub-period and then verified against the later sub-period (Do-brovolný, 2018). If only a short period of overlap is available,then cross-validation procedures are required.
The transfer function derived from a calibration periodis normally evaluated by statistical measures (e.g. squaredcorrelation r2, standard error of the estimate) before beingapplied in the verification period. During verification, indexvalues calibrated to physical units (e.g. temperature degreesor precipitation amount) are compared with the instrumen-tal data and, again, evaluated statistically using r2, reductionof error, and the coefficient of efficiency (see Cook et al.,1994; Wilson et al., 2006). If the calibrated data series, de-rived by applying the transfer function obtained for the cali-bration period, expresses the variability of the climate factorunder consideration with satisfactory accuracy in the verifi-cation period, then the index series can be considered as use-ful for climate reconstruction back beyond the instrumentalperiod (Brázdil et al., 2010). Caution is needed, however, astransfer functions, which are usually derived from relatively
https://doi.org/10.5194/cp-17-1273-2021 Clim. Past, 17, 1273–1314, 2021

1296 D. J. Nash et al.: Climate indices in historical climate reconstructions
Figure 11. The main steps in quantitative climate reconstruction based on temperature or precipitation indices derived from documentaryevidence. Historical documentary sources are analysed to generate seven-point monthly indices (step 1), which are then summed to pro-duce annual index series (step 2). Calibration and verification are carried out on periods of overlapping instrumental data (step 3), withstatistical results from verification used to define error bars for the final reconstruction (step 4). Reprinted with permission from Brázdil etal. (2010)(© Springer 2010).
Clim. Past, 17, 1273–1314, 2021 https://doi.org/10.5194/cp-17-1273-2021

D. J. Nash et al.: Climate indices in historical climate reconstructions 1297
modern periods, may not be stable through time (e.g. wherephenological series have been influenced by the introductionof new varieties or different harvesting technologies; Pfister,1984; Meier et al., 2007).
Like the European approach, calibration and verificationmethods in China are applied to reconstructed temperatureand drought–flood indices by comparing the series over-lap between instrumental and documentary periods. Shang-hai has the longest instrumental data coverage (1873 CE on-wards), with Beijing, Suzhou, Nanjing, and Hangzhou alsohaving century-long data series (Chen and Shi, 2002; Zhangand Liu, 2002). As a result, most calibration is performedwith reference to these cities. R. S. Wang and Wang (1990)compared their temperature series to these instrumental datato estimate correlation coefficients and allocate correspond-ing values to their indices. A transfer function was also esti-mated between the number of snow days (or number of lakefreezing days) and observed temperatures by using multipleregression methods (Zhang, 1980; Gong et al., 1983; Zhangand Liu, 1987; Wang and Gong, 2000; Ge et al., 2003). How-ever, the statistical correlation reports in these earlier studiesappear incomplete.
The Academy of Meteorological Science of China Cen-tral Meteorological Administration (1981) have used precip-itation data (1951–2000 CE) to validate drought–flood in-dices. However, the approach used focused on determiningthe probability distribution function of their five index classesto make the series comparable with instrumental data, ratherthan calibration per se (Yi et al., 2012; Shi et al., 2017). Aspecial feature of calibration and verification in China is theutilisation of records in the Qing Yu Lu and Yu Xue Fen Cun(Hao et al., 2018; see Sect. 3.2), where comparisons can bemade between reconstructed drought–flood indices and ob-served precipitation patterns (Zhang and Wang, 1990). Suchcorrelations can further be compared and calibrated usinginstrumental data, for example for Beijing (Zhang and Liu,2002), Suzhou, Nanjing, and Hangzhou (Zhang and Wang,1990).
Validation within the Nicholson et al. (2012a) rainfall re-construction for continental Africa was carried out by com-paring time series based on those entries with instrumentalrainfall data available for the same time and region. Qual-ity control in the final seven-class combined instrumental-historical reconstruction was provided by comparing thespread of estimates from the various sources. If more thana two-class spread existed among the entries for an individ-ual region and year, each of those entries was re-evaluated.In most, it was found that an error was made in determin-ing the location or year of a piece of documentary evidence.Only eight “conflicts” in the Nicholson series could not beresolved in this way. The various regional studies in south-ern Africa employ a simpler approach, using short periods ofoverlap with available instrumental data for qualitative cross-checking/validation purposes (e.g. Nash and Endfield, 2002;
Kelso and Vogel, 2007; Nash and Grab, 2010; Nash et al.,2016).
The content analysis method developed for North Amer-ican historical climatology uses replication by other re-searchers to test the reliability of the quantification processand compared results from multiple independent sources totest validity (Baron, 1980, pp. 150–170). Subsequent stud-ies have elaborated on this method, but many also drawon the Pfister index approach as summarised in Sect. 8.1.For South America, Neukom et al. (2009) created “pseudo-documentary” series to quantify the relationship betweendocument-derived precipitation indices and instrumental data(see also Mann and Rutherford, 2002; Pauling et al., 2003;Xoplaki et al., 2005; Küttel et al., 2007). Following Euro-pean conventions, index series were transformed to instru-mental units by linear regression with overlapping instru-mental data. The skill measures were quantified based ontwo calibration/verification intervals, using the first and sec-ond half of the overlap periods as calibration and verificationperiod respectively and vice versa (Neukom et al., 2009). Asimilar approach has been used in southern Africa to inte-grate documentary-derived index series with other annuallyresolved proxy data for the 19th century as part of multi-proxy rainfall reconstructions (Neukom et al., 2014a; Nashet al., 2016).
Calibration and verification of indices in Australia(Fig. 12) have been conducted using overlapping andlargely independent instrumental data products, similar to ap-proaches used in African reconstructions. In an example ofgood practice for future studies, independent high-resolutionpalaeoclimate reconstructions and records of water availabil-ity, such as lake levels, were also used for verification (Gergisand Ashcroft, 2013). Disagreements between these differentsources were examined closely and often attributed to spa-tial variability in individual sources. For example, the 1820sin southeastern Australia were identified as wetter than av-erage in a regional palaeoclimate reconstruction (Gergis etal., 2012), but drier than average in a documentary-derivedindex and in historical information about water levels inLake George, New South Wales (Gergis and Ashcroft, 2013).This was put down to geographical differences between thedatasets – the palaeoclimate reconstruction was biased to-wards rainfall variability in southern parts of southeasternAustralia whereas the lake records and documentary indexrepresented the east.
It is a long-standing best practice in marine historical cli-matology to verify weather observations by comparing dif-ferent kinds of documentary evidence or alternative differ-ent examples of the same evidence (e.g. multiple logbooksin the same fleet). Despite the very real challenges of in-terpreting measurements even in logbooks, there are indica-tions that reconstructions that use these sources are reliable.There appears to be a high consistency and homogeneity bothwithin wind measurements derived entirely from ships’ log-books, and between such measurements and data obtained
https://doi.org/10.5194/cp-17-1273-2021 Clim. Past, 17, 1273–1314, 2021

1298 D. J. Nash et al.: Climate indices in historical climate reconstructions
Figure 12. Wet and dry years for eastern New South Wales (Australia) identified using the nine-station network (1860–2008 CE, purple)and a documentary index (1788–1860 CE, grey). The median rainfall reconstruction (1788–1988) from Gergis et al. (2012) is also plotted asanomalies (mm) relative to a 1900–1988 base period. Note that 1841, 1844, 1846, and 1859 have been classified as wet, in accordance witha rainfall index derived from observations in the Sydney region (blue). Adapted from Gergis and Ashcroft (2013).
from diverse sources that register the marine climate. There-fore, researchers have linked documentary weather observa-tions in, for example, the CLIWOC database, with datasetsthat homogenise and synthesise evidence from both tex-tual and natural proxies, such as the National Oceanic andAtmospheric Administration’s International ComprehensiveOcean-Atmosphere Data Set (ICOADS) (Jones and Salmon,2005; Barriopedro et al., 2014).
9.2 Reporting confidence and uncertainty inindex-based climate series
Two forms of uncertainty are encountered when develop-ing index-based climate series: (i) uncertainties related tothe compilation of the index series themselves from docu-mentary evidence and (ii) uncertainties within any resultingindex-based climate reconstruction. The first form of uncer-tainty relates mainly to the nature of information containedwithin specific source types. A detailed discussion is beyondthe scope of this review. However, where indices are com-piled from a unique documentary source – such as a pri-vate diary or diaries (e.g. Brázdil et al., 2008; Adamson,2015; Domínguez-Castro et al., 2015), a series of correspon-dence (e.g. Rodrigo et al., 1998; Nash and Endfield, 2002;Fernández-Fernández et al., 2014) or a series of acts of mu-nicipal and ecclesiastical institutions for a location (e.g. Bar-riendos, 1997; Domínguez-Castro et al., 2018) – it is eas-ier to identify and correct unexpected bias or homogene-ity problems. Other index series draw together informationfrom many different documentary sources (e.g. Camuffo etal., 2010; Nash and Grab, 2010; Fenby and Gergis, 2013;Brázdil et al., 2016), allowing the analysis of longer peri-ods or larger regions but at the risk of incorporating non-homogeneities. Methodological differences – for example in
the way in which “0 index” values are derived (see Sect. 8) –may also mask uncertainties introduced by data gaps.
While compiling this review, it became apparent that rela-tively few index-based climate series provide an assessmentof the degree of uncertainty in the compilation of their in-dices – in effect, something akin to the error bars used inquantitative climate reconstructions (e.g. Dobrovolný et al.,2010). Further, very few studies report directly on potentialbiases in their series due to the well-known tendency fordocumentary evidence to better record extreme events. Theincorporation of statistical error is achievable where index-based series have been subject to full calibration and verifi-cation (Sect. 9.1). However, it is less straightforward for cli-mate reconstructions in regions (or for time periods) where alack of overlapping instrumental data renders full calibrationimpossible.
To overcome this issue, Australian studies include someassessment of confidence by showing details of the num-ber of sources in agreement as well as the proportion of thestudy regions affected (see Fenby and Gergis, 2013). Inde-pendent high-resolution palaeoclimate and historical recordswere also used to verify each year of the reconstruction to as-sess confidence in the results (Fenby and Gergis, 2013; Ger-gis and Ashcroft, 2013).
One innovation from African historical climatology is theintroduction by Clare Kelso and Coleen Vogel (2007) of aqualitative three-point “confidence rating” (CR) for the clas-sification of each rainy season in their climate history ofNamaqualand (South Africa). The rating for each season(Fig. 13) was derived from the number of sources consultedcombined with the number of references to that particular cli-matological condition. A CR of 1 was awarded where therewas only one source referring to the climatic condition. Incontrast, years awarded a CR of 3 were those that had more
Clim. Past, 17, 1273–1314, 2021 https://doi.org/10.5194/cp-17-1273-2021

D. J. Nash et al.: Climate indices in historical climate reconstructions 1299
than three date- and place-specific references describing cli-matic conditions. This approach has been adopted in subse-quent studies in southern Africa by Nash et al. (2016, 2018)and Grab and Zumthurm (2018), with slight variations in thecriteria used to award specific ratings according to sourcedensity.
A similar approach was adopted by Quinn et al. (1987)and Quinn and Neal (1992) in their development of El Niñoindices for Peru. El Niño events with a confidence rating of1 were those that lacked a source reference or informationalbasis; these were not incorporated into the final list of recon-structed events. A CR of 2 was awarded when an event wasbased on limited or circumstantial evidence; a CR of 3 wasawarded when additional information was needed to confirmthe time of occurrence or intensity of an event; a CR of 4 wasawarded when the occurrence time and intensity informa-tion was generally satisfactory, but additional evidence wasneeded to confirm the spatial extent of the event; and a CRof 5 was awarded when the available information concerningthe occurrence and intensity of the event was considered tobe satisfactory.
The second form of uncertainty relates specifically toindex-based climate reconstruction. Where uncertainties canbe quantified (either formally with statistics or less formallyby comparison with other reconstructions), index-based re-constructions can be made fully comparable to natural proxy-based quantitative reconstructions. One example of this ap-proach is the central Europe temperature series by Dobro-volný et al. (2010), the only documentary series used as partof the PAGES 2k Consortium (2013) continent-by-continenttemperature reconstruction. Calibrated temperature seriesfrom China, including Zhang (1980) and R. S. Wang andWang (1990), are also incorporated into the PAGES 2k Con-sortium (2017) community-sourced database of temperature-sensitive proxy records.
10 Towards best practice in the use of climateindices for historical climate reconstruction
10.1 Regional variations in the development andapplication of climate indices
This review has shown that there are multiple approachesglobally to the development and application of indices forhistorical climate reconstruction. Returning to the themesidentified in the introduction, three categories of variabilitycan be recognised. First, there is variability in the types ofclimate phenomena reconstructed in different regions (Ta-ble 5). Studies of the historical climatology of Europe andAsia span the greatest range of climate phenomena. Thisis partly a product of the range of climate zones present inthese continents and, therefore, the diversity of weather phe-nomena to which observers might be exposed and document.However, it also reflects the relative abundance of documen-tary materials available for analysis and the richness of the
climate-related information they contain. Where smaller vol-umes of documentary evidence are available, reconstructionsnaturally tend to be skewed towards the climate parametersthat were of sufficient importance to people that they cap-tured them in writing or as artefacts – hence the emphasis onprecipitation reconstructions for Africa and Australia and onwinds and storm events over the oceans.
Second, there is variability in the way that historical ev-idence is treated to develop individual index series. Suchvariability arises, in part, from the extent to which analyticalmethods have developed independently. Thus, approaches toindex-based climate reconstruction in parts of Asia are verydifferent to those used in Europe. Chains of influence in prac-tice can also be identified with, for example, elements ofthe “Pfister method” from Europe being adopted by regionalstudies in southern Africa from the 1980s and then feedinginto more recent precipitation reconstructions in Australia.There are common features of most historical treatments, re-gardless of tradition. These include the use of key descrip-tors or indicator criteria to match either individual observa-tions (e.g. the continent-wide precipitation series for Africadeveloped by Nicholson) or sets of monthly, seasonal, or an-nual observations (as per the Pfister method) to specific in-dex classes. Most reconstructions are ordinal but, particu-larly where long runs of overlapping instrumental data areavailable, many are grounded in statistical distributions andpresent semi- or fully quantified climate series.
The final source of variability across index-based investi-gations is in the number of index points used in individualreconstructions. A snapshot of this variability can be seenfrom investigations in Europe (Table 6). While most index-based reconstructions of European temperature and precipi-tation published since the 1990s employ the seven-point Pfis-ter approach, some use up to nine classes. The number ofclasses used in European flood and drought reconstructionis usually smaller but, even here, may extend to seven-pointclassifications. There are also some commonalities. For ex-ample, most temperature and precipitation reconstructionsuse an odd number of classes – to allow the mid-point ofthe reconstruction to reflect “normal” conditions – whereasopen-ended unidirectional climate-related phenomena suchas droughts and floods may be classified using either an evenor odd number of classes. Similar patterns can be seen inother parts of the world (Table 7). In the rare instances whereauthors justify the number of index categories they use, mostpoint to limitations in the quantity and/or richness of the his-torical evidence available for reconstruction as the reason fora smaller number of index categories.
10.2 Guidelines for generating futuredocumentary-based indices
The diversity of practice revealed in this review raises two is-sues. First, different approaches to index development makeit harder for climate historians and historical climatologists
https://doi.org/10.5194/cp-17-1273-2021 Clim. Past, 17, 1273–1314, 2021

1300 D. J. Nash et al.: Climate indices in historical climate reconstructions
Figure 13. Five-point index of rainfall variability in Namaqualand (South Africa) during the 1800s, including the first use of confidenceratings in relation to annual classifications in a documentary-derived index series (1 denotes low confidence and 3 denotes high confidence).Data from Kelso and Vogel (2007).
Table 5. Types of historical environmental phenomena reconstructed using an index approach in different parts of the world, with a qualitativeindication of the relative emphasis of studies in each region (3 indicates a large number of studies, 1 a small number of studies, and “–”indicates no studies).
Region Temperature Precipitation Floods Drought Snow/ice Wind/storms
Europe 3 3 3 2 1 1Africa 1 2 – 1 1 1The Americas 1 1 1 1 1 1Asia 2 2 2 1 1 1Australia – 1 1 1 – –Oceans – 1 – – 1 2
working in different parts of the world to compare theirclimate indices directly, as each will include indices withdiffering climatological boundaries. Second, they make itharder for (palaeo)climatologists to use the resulting time se-ries in synthesis and modelling studies without recourse tothe methodology used in each original study. As noted inSect. 9.2, fully calibrated series have been included withinglobal climate compilations such as the PAGES 2k Consor-tium (2013, 2017) temperature syntheses. Non-calibrated in-dex series have also been incorporated into multi-proxy re-constructions using the “Pseudo proxy” approach of Mannand Rutherford (2002) – see, for example, Neukom etal. (2014a, b) – but these types of reconstruction are rela-tively rare.
Having a standard approach to index-based climate recon-struction would clearly have its benefits. However, we recog-nise that a one-size-fits-all approach is neither appropriatefor all climate phenomena nor for all source types. The re-construction of historical wind patterns over the oceans from
ships’ logbooks and the identification of precipitation vari-ability through the analysis of descriptions of rogation cere-monies, for example, already have well-developed method-ologies and protocols. We further recognise that the mostwidely used approaches such as the Pfister method wouldrequire modification to be useful for temperature and/or rain-fall reconstruction in all regions, as climates with strong sea-sonality may not have documentary evidence available year-round. Their use would, in some areas, also override thelegacy of decades of methodological effort and require thereanalysis of enormous volumes of documentary evidence.
Rather than suggest a prescriptive method, we instead of-fer a series of guidelines as best practice for generating in-dices from collections of historical evidence. The guidelinesare of greatest relevance to index-based reconstructions oftemperature and precipitation from multiple source types butalso have resonance for other climate phenomena (e.g. win-ter severity) and for many single source types (e.g. annals,chronicles, letters, diaries/journals, newspapers). The guide-
Clim. Past, 17, 1273–1314, 2021 https://doi.org/10.5194/cp-17-1273-2021

D. J. Nash et al.: Climate indices in historical climate reconstructions 1301
Table 6. Variability in the number of index classes used in index-based historical climate reconstructions across Europe.
Climate phenomenon Number of index classes used inclimate reconstructions
Examples
Temperature Seven-point most common (but also two-,three-, five-, and nine-point)
Pfister (1984); Alexandre (1987);Brázdil and Kotyza (1995, 2000); Van Engelen etal. (2001); Glaser (2013); Litzenburger (2015)
Precipitation Seven-point most common (but also three-and five-point)
Alexandre (1987); Pfister (1992);Glaser et al. (1999); Van Engelen et al. (2001);Rodrigo and Barriendos (2008)
Floods Three-, four-, and five-point all common Pfister (1999); Rohr (2006, 2013);Wetter et al. (2011); Brázdil et al. (2012);Garnier (2015); Kiss (2019)
Drought Three-point most common (but also five-and seven-point)
Pfister et al. (2006); Brázdil et al. (2013b);Garnier (2018); Erfurt et al. (2019)
Table 7. Variability in the number of index classes used in index-based historical climate reconstructions in Africa, the Americas, Asia,Australia, and over the oceans.
Region Number of index classes used inclimate reconstructions
Examples
Africa Three-point for temperature; five- or seven-point for precipitation
Nicholson (2001); Nash and Endfield (2002); Kelso and Vo-gel (2007); Grab and Nash (2010); Nicholson et al. (2012a);Nash et al. (2016); Grab and Zumthurm (2018)
Americas Three-point for temperature, five- or seven-point for floods/precipitation; three-pointfor snowfall
Baron et al. (1984); Prieto (1984); Baron (1989, 1995); Prietoet al. (1999); Prieto and Rojas (2015); Gil-Guirado et al. (2016)
Asia Four- or five-point most common for tem-perature/precipitation and floods/drought
Zhu (1926); Zhang and Zhang (1979); R. S. Wang and Wang(1990); Academy of Meteorological Science of China Cen-tral Meteorological Administration (1981); S. W. Wang andWang (1990); Wang et al. (1998); Tan and Wu (2013); Tan etal. (2014); Ge et al. (2018)
Australia Three-point for precipitation Fenby and Gergis (2013); Gergis and Ashcroft (2013); Gergiset al. (2018)
Oceans One-, four-, or eight-point for wind direc-tion; twelve-point for wind speed
Garcia et al. (2001); Prieto et al. (2005); Küttel et al. (2010);Barriopedro et al. (2014); Barrett et al. (2018); García-Herreraet al. (2018)
lines are based, in part, on the excellent reviews by Brázdilet al. (2010) and Pfister et al. (2018) but also incorporate in-sights from this study:
1. Researchers should be familiar with the climatology oftheir study region, as this may influence the temporaldistribution of documentary evidence. Indices should,ideally, be based on collections of historical records thatoverlap with a climatically homogenous region with re-spect to the phenomena to be reconstructed.
2. Researchers should be familiar with the strengths andweaknesses of each of their historical sources prior totheir use in climate reconstruction.
3. Researchers should select an appropriate temporal res-olution for their index series according to the quantity,quality, and richness (in terms of climate information)of available historical sources. This may be monthly,seasonal, annual, or longer. For information-rich areas,a monthly resolution is optimal as it offers the great-est potential for comparison with early instrumental se-ries (which may be published as monthly averages priorto the wider availability of daily data) and the greatestflexibility for comparison with more coarsely resolvedsources, such as palaeoclimate reconstructions. For re-gions with marked variations in the quantity and qualityof climate information across the year, the choice of res-
https://doi.org/10.5194/cp-17-1273-2021 Clim. Past, 17, 1273–1314, 2021

1302 D. J. Nash et al.: Climate indices in historical climate reconstructions
olution may be dictated by the length of period duringthe year when information is most sparse.
4. Whether a three-, five-, or seven- (or more) point in-dex series should be developed may also be influencedby the legacy of previous studies in a region if directcomparisons are required; however, following guideline3, researchers should only generate series with highernumbers of index classes if source density and richnesspermit.
5. Transforming the information in historical documents tonumbers on a scale requires a high degree of expertiseto minimise subjectivity and should, ideally, be under-taken by experienced researchers with a good knowl-edge of the climate of a region and an understanding ofthe language of the time period in which sources werewritten.
6. Historical records should ideally be sorted chronolog-ically prior to analysis, with indices developed in astepwise manner. Pfister et al. (2018, p. 120) recom-mend that indexing begin with the most recent period(a process referred to by Brázdil et al., 2010, as “hind-casting”), which for most studies will also be the periodwith the greatest volume of documentary evidence. Thisallows researchers to become familiar with the vagariesof their evidence during well-documented periods be-fore working backwards to periods where informationmay be less complete.
7. For regions and periods where large volumes of his-torical information are available, indices should alwaysbe generated using evidence from more than one inde-pendent contemporary observer or record. If weather ina region is documented within a single contemporaryrecord, appropriate levels of uncertainty should be notedin the final reconstruction (see Pfister et al., 2018).
8. It is advisable to sum up index series – either in time(i.e. from monthly to seasonal or annual) or in space(i.e. by combining several index series from a climato-logically homogeneous region). Careful assessment isneeded, however, to avoid any loss of information dur-ing the process of summation, particularly for extremeevents (see Sect. 8.1). Potential seasonal biases withindocumentary sources should also be considered as thesewill influence annual totals.
9. Where possible, index series should be developed in-dependently from the same set of historical sources bymore than one researcher to minimise subjectivity. Thefinal index series for southeast Africa produced by Nashet al. (2016), for example, was first developed indepen-dently by two members of the research team who thenmet to agree the final series.
10. To maximise their wider usefulness, index series should,ideally, overlap with runs of local or regional instrumen-tal data to permit calibration and verification. Where in-strumental data are not available, overlaps with inde-pendent high-resolution palaeoclimate records may beuseful for comparison and testing, noting that palaeocli-mate records may have their own biases.
11. If fully calibrated, statistical measures of error should beincorporated into the presentation of any reconstruction.
12. Where insufficient overlapping instrumental data areavailable to permit full calibration and verification,some form of “confidence rating” (see Sect. 9.2 andKelso and Vogel, 2007) should be incorporated into thepresentation of any reconstruction.
13. Finally, as Pfister et al. (2018, p. 121) identify, the pur-pose and process of index development should be “fullytransparent and open to critical evaluation”, with themethod of index development described in detail anda source-critical evaluation of the underlying evidenceincluded.
Vast collections of documentary evidence from all parts ofthe globe remain that have yet to be explored for informa-tion about past climate. We hope that, if such collectionsare scrutinised following these guidelines, they will lead toindex-based reconstructions of climate variability that can beused to both extend climate records and contextualise stud-ies of climate–society relationships to the wider benefit ofhumankind.
Dedication. This paper is dedicated to the memory ofMaría del Rosario Prieto, a pioneer in historical climatologyand active promoter of climate history studies in South America,who sadly passed away in 2020 during the preparation of the firstdraft of this paper. Rest in peace, María.
Code and data availability. No new data were created during thecompilation of this review article.
Author contributions. DJN, MB, CC, and TL conceived the orig-inal study. The overall paper development, compilation, and editingwas led by DJN. All authors contributed to the writing of the firstdraft of the paper and to the preparation of the final article. DJN ledthe writing of Sects. 1, 4, 8.3, 9, and 10; MB, CC, and TL of Sects. 2and 8.1; KHEL, GCDA, and QP of Sects. 3 and 8.2; MdRP, FR, andSW of Sects. 5 and 8.4; LA and JG of Sects 6 and 8.5; and DD ofSects. 7 and 8.6.
Competing interests. The authors declare that they have no con-flict of interest.
Clim. Past, 17, 1273–1314, 2021 https://doi.org/10.5194/cp-17-1273-2021

D. J. Nash et al.: Climate indices in historical climate reconstructions 1303
Special issue statement. This article is part of the special issue“International methods and comparisons in climate reconstructionand impacts from archives of societies”. It is not associated with aconference.
Acknowledgements. The authors would like to thank PAGES(Past Global Changes) for supporting the CRIAS working groupmeetings in Bern (2018) and Leipzig (2019) that led to theconception and subsequent development of this publication, andLina Lerch (Leipzig) for help with Japanese climate-historicalsources.
Financial support. The meetings that underpinned this articlewere supported by PAGES (Past Global Changes). The article pro-cessing charges for this open-access publication were covered bythe Freigeist Fellowship “The Dantean Anomaly (1309–1321)”(funded by the Volkswagen Foundation) and the Education Univer-sity of Hong Kong.
Review statement. This paper was edited by Rudolf Brazdil andreviewed by three anonymous referees.
References
Academy of Meteorological Science of China Central Meteorolog-ical Administration: Yearly Charts of Dryness/Wetness in Chinafor the Last 500 Years, Cartographic Publishing House, Beijing,1981.
Adamson, G. C. D.: Private diaries as information sources in climateresearch, WIRES Clim. Change, 6, 599–611, 2015.
Adamson, G. C. D. and Nash, D. J.: Documentary reconstructionof monsoon rainfall variability over western India, 1781–1860,Clim. Dynam., 42, 749–769, 2014.
Adamson, G. C. D. and Nash, D. J.: Climate history of Asia (ex-cluding China), in: The Palgrave Handbook of Climate History,edited by: White, S., Pfister, C., and Mauelshagen, F., PalgraveMacmillan, London, 203–211, 2018.
Alcoforado, M. J., Nunes, M. D., Garcia, J. C., and Taborda,J. P.: Temperature and precipitation reconstruction in southernPortugal during the late Maunder Minimum (AD 1675–1715),Holocene, 10, 333–340, 2000.
Alexandre, P.: Le climat en Europe au moyen âge: contribution àl’histoire des variations climatiques de 1000 à 1425, d’après lesnarratives de l’Europe Occidentale, Recherches d’histoire et desciences sociales 24, Éditions de l’École des hautes études ensciences sociales, Paris, 1987.
Allan, R. J., Endfield, G. H., Damodaran, V., Adamson, G. C. D.,Hannaford, M. J., Carroll, F., MacDonald, N., Groom, N., Jones,J., Williamson, F., Hendy, E., Holper, P., Arroyo-Mora, J. P.,Hughes, L., Bickers, R., and Bliuc, A. M.: Toward integratedhistorical climate research: the example of Atmospheric Circu-lation Reconstructions over the Earth, WIRES Clim. Change, 7,164–174, 2016.
Álvarez Vázquez, J. A.: Drought and rainy periods in the Provinceof Zamora in the 17th, 18th, and 19th centuries, in: Quaternary
Climate in Western Mediterranean, edited by: López-Vera, F.,Universidad Autonoma de Madrid, Madrid, 221–233, 1986.
Aono, Y. and Kazui, K.: Phenological data series of cherry treeflowering in Kyoto, Japan, and its application to reconstruction ofspringtime temperatures since the 9th century, Int. J. Climatol.,28, 905–914, 2008.
Aono, Y. and Saito, S.: Clarifying springtime temperature recon-structions of the medieval period by gap-filling the cherry blos-som phenological data series at Kyoto, Japan, Int. J. Biometeo-rol., 54, 211–219, 2010.
Ashcroft, L., Gergis, J., and Karoly, D. J.: A historical climatedataset for southeastern Australia, 1788–1859, Geosci. Data J.,1, 158–178, 2014a.
Ashcroft, L., Karoly, D. J., and Gergis, J.: Southeastern Australianclimate variability 1860–2009: a multivariate analysis, Int. J. Cli-matol., 34, 1928–1944, 2014b.
Ashcroft, L., Karoly, D. J., and Dowdy, A. J.: His-torical extreme rainfall events in southeastern Aus-tralia, Weather and Climate Extremes, 25, 100210,https://doi.org/10.1016/j.wace.2019.100210, 2019.
Baron, W. R.: Tempests, Freshets and Mackerel Skies; Climatologi-cal Data from Diaries Using Content Analysis, Unpublished PhDthesis, University of Maine at Orono, Orono ME, USA, 1980.
Baron, W. R.: The reconstruction of 18th-century temperaturerecords through the use of content-analysis, Climatic Change, 4,384–398, 1982.
Baron, W. R.: Retrieving American climate history – a bibliographicessay, Agricultural History, 63, 7–35, 1989.
Baron, W. R.: Historical climate records from the northeasternUnited States, 1640 to 1900, in: Climate since A.D. 1500, editedby: Bradley, R. S. and Jones, P. D., Routledge, London, 74–91,1995.
Baron, W. R., Gordon, G. A., Borns, H. W., and Smith, D. C.: Frost-free record reconstruction for eastern Massachusetts, 1733–1980,J. Clim. Appl. Meteorol., 23, 317–319, 1984.
Barrett, H. G.: El Niño Southern Oscillation from the pre-instrumental era: Development of logbook-based reconstruc-tions; and evaluation of multi-proxy reconstructions and cli-mate model simulations, Unpublished PhD thesis, University ofSheffield, Sheffield, UK, 2017.
Barrett, H. G., Jones, J. M., and Bigg, G. R.: Reconstructing El NinoSouthern Oscillation using data from ships’ logbooks, 1815–1854. Part II: Comparisons with existing ENSO reconstructionsand implications for reconstructing ENSO diversity, Clim. Dy-nam., 50, 3131–3152, 2018.
Barriendos, M.: Climatic variations in the Iberian Peninsula dur-ing the late Maunder Minimum (AD 1675–1715): An analysis ofdata from rogation ceremonies, Holocene, 7, 105–111, 1997.
Barriendos, M.: Climate and culture in Spain. Religious responsesto extreme climatic events in the Hispanic Kingdoms (16th–19th Centuries), in: Cultural Consequences of the Little Ice Age,edited by: Behringer, W., Lehmann, H., and Pfister, C., Vanden-hoeck and Ruprecht, Göttingen, 379–414, 2005.
Barriendos, M.: Climate change in the Iberian Peninsula: Indicatorof rogation ceremonies (16th–19th centuries), Revue d’HistoireModerne et Contemporaine, 57, 131–159, 2010.
Barriopedro, D., Gallego, D., Alvarez-Castro, M. C., Garcia-Herrera, R., Wheeler, D., Pena-Ortiz, C., and Barbosa, S. M.:
https://doi.org/10.5194/cp-17-1273-2021 Clim. Past, 17, 1273–1314, 2021

1304 D. J. Nash et al.: Climate indices in historical climate reconstructions
Witnessing North Atlantic westerlies variability from ships’ log-books (1685–2008), Clim. Dynam., 43, 939–955, 2014.
Bauch, M., Labbé, T., Engel, A., and Seifert, P.: A prequel tothe Dantean Anomaly: the precipitation seesaw and droughtsof 1302 to 1307 in Europe, Clim. Past, 16, 2343–2358,https://doi.org/10.5194/cp-16-2343-2020, 2020.
Bogolepov, M. A.: Climate fluctuations in European Russia in thehistorical age, Geology, Kushnerev and Co., Moscow, 1907.
Bogolepov, M. A.: Climate fluctuations in Western Europe from1000 to the year 1500, Geology, Kushnerev and Co., Moscow,1908.
Bogolepov, M. A.: Climate fluctuations and history, Kushnerev andCo., Moscow, 1911.
Bokwa, A., Limanówka, D., and Wibig, J.: Pre-instrumentalweather observations in Poland in the 16th and 17th century, in:History and Climate, edited by: Jones, P. D., Springer, Boston,9–27, 2001.
Borisenkov, E. P. (Ed.): Climate fluctuations over the past millen-nium, Gidrometeoizdat, Leningrad, 1988.
Borisenkov, E. P. and Paseckij, V. M.: Extreme natural phenomenain the Russian chronicles of the 11–17 centuries, Gidrometeoiz-dat, Leningrad, 1983.
Borisenkov, E. P. and Paseckij, V. M.: Millennial chronicle of ex-traordinary natural phenomena, Mysl’, Moscow, 1988.
Bothe, O., Wagner, S., and Zorita, E.: Inconsistencies between ob-served, reconstructed, and simulated precipitation indices forEngland since the year 1650 CE, Clim. Past, 15, 307–334,https://doi.org/10.5194/cp-15-307-2019, 2019.
Bozherianov, I. N.: Starving of the Russian nations from 1024 toyear 1906, Gannibal, Saint Petersburg, 1907.
Bravo-Paredes, N., Gallego, M. C., Domínguez-Castro, F., García,J. A., and Vaquero, J. M.: Pro-pluvia rogation ceremonies inExtremadura (Spain): Are they a good proxy of winter NAO?,Atmosphere, 11, 282, https://doi.org/10.3390/atmos11030282,2020.
Brázdil, R. and Kotyza, O.: History of Weather and Climate inthe Czech Lands I. Period 1000–1500, Zürcher GeographischeSchriften, 62, Zürich, 1995.
Brázdil, R. and Kotyza, O.: History of Weather and Climate in theCzech Lands II. Utilisation of Economic Sources for the Studyof Climate Fluctuation in the Louny Region in the Fifteenth-Seventeenth Centuries, Masaryk University, Brno, 2000.
Brázdil, R., Glaser, R., Pfister, C., Dobrovolný, P., Antoine, J. M.,Barriendos, M., Camuffo, D., Deutsch, M., Enzi, S., Guidoboni,E., Kotyza, O., and Rodrigo, F. S.: Flood events of selected Eu-ropean rivers in the sixteenth century, Climatic Change, 43, 239–285, 1999.
Brázdil, R., Pfister, C., Wanner, H., von Storch, H., and Luterbacher,J.: Historical climatology in Europe – the state of the art, ClimaticChange, 70, 363–430, 2005.
Brázdil, R., Cernušák, T., and Reznícková, L.: Weather informationin the diaries of the Premonstratensian Abbey at Hradisko, in theCzech Republic, 1693–1783, Weather, 63, 201–207, 2008.
Brázdil, R., Dobrovolný, P., Luterbacher, J., Moberg, A., Pfister,C., Wheeler, D., and Zorita, E.: European climate of the past500 years: new challenges for historical climatology, ClimaticChange, 101, 7–40, 2010.
Brázdil, R., Kundzewicz, Z. W., Benito, G., Demarée, G., Mac-Donald, N., and Roald, L. A.: Historical floods in Europe in the
past millennium, in: Changes in Flood Risk in Europe, edited by:Kundzewicz, Z. W., IAHS Press, Wallingford, 121–166, 2012.
Brázdil, R., Kotyza, O., Dobrovolný, P., Reznícková, L., andValášek, H.: Climate of the Sixteenth Century in the CzechLands (History of Weather and Climate in the Czech Lands 10),Masaryk University, Brno, 2013a.
Brázdil, R., Dobrovolný, P., Trnka, M., Kotyza, O., Reznícková,L., Valášek, H., Zahradnícek, P., and Štepánek, P.: Droughts inthe Czech Lands, 1090–2012 AD, Clim. Past, 9, 1985–2002,https://doi.org/10.5194/cp-9-1985-2013, 2013b.
Brázdil, R., Dobrovolný, P., Trnka, M., Büntgen, U., Reznícková,L., Kotyza, O., Valášek, H., and Štepánek, P.: Documentary andinstrumental-based drought indices for the Czech Lands back toAD 1501, Clim. Res., 70, 103–117, 2016.
Brázdil, R., Kiss, A., Luterbacher, J., Nash, D. J., andReznícková, L.: Documentary data and the study of pastdroughts: a global state of the art, Clim. Past, 14, 1915–1960,https://doi.org/10.5194/cp-14-1915-2018, 2018.
Brönnimann, S., Pfister, C., and White, S.: Archives of nature andarchives of society, in: The Palgrave Handbook of Climate His-tory, edited by: White, S., Pfister, C., and Mauelshagen, F., Pal-grave Macmillan, London, 27–36, 2018.
Brönnimann, S., Martius, O., Rohr, C., Bresch, D. N., and Lin, K.-H. E.: Historical weather data for climate risk assessment, Ann.NY Acad. Sci., 1436, 121–137, 2019.
Brooks, C. E. P.: Climate through the ages, 2nd revised edition,Ernest Benn Ltd, London, 1949.
Burchinskij, I. E.: On the climate of the past of the Russian Plain,Gidrometeoizdat, Leningrad, 1957.
Callaghan, J. and Helman, P.: Severe Storms on the East Coast ofAustralia, 1770–2008, Griffith Centre for Coastal Management,Griffith University, Southport, 2008.
Callaghan, J. and Power, S. B.: Variability and decline in the numberof severe tropical cyclones making land-fall over eastern Aus-tralia since the late nineteenth century, Clim. Dynam., 37, 647–662, 2011.
Callaghan, J. and Power, S. B.: Major coastal flooding in southeast-ern Australia 1860–2012, associated deaths and weather systems,Aust. Meteorol. Ocean., 64, 183–214, 2014.
Camenisch, C.: Endless cold: a seasonal reconstruction of temper-ature and precipitation in the Burgundian Low Countries duringthe 15th century based on documentary evidence, Clim. Past, 11,1049–1066, https://doi.org/10.5194/cp-11-1049-2015, 2015a.
Camenisch, C.: Endlose Kälte: Witterungsverlauf und Getreide-preise in den Burgundischen Niederlanden im 15. Jahrhundert,Wirtschafts-, Sozial- und Umweltgeschichte 5, Schwabe, Basel,2015b.
Camenisch, C. and Salvisberg, M.: Droughts in Bern and Rouenfrom the 14th to the beginning of the 18th century de-rived from documentary evidence, Clim. Past, 16, 2173–2182,https://doi.org/10.5194/cp-16-2173-2020, 2020.
Camuffo, D., Bertolin, C., Barriendos, M., Domínguez-Castro, F.,Cocheo, C., Enzi, S., Sghedoni, M., della Valle, A., Garnier,E., Alcoforado, M. J., Xoplaki, E., Luterbacher, J., Diodato, N.,Maugeri, M., Nunes, M. F., and Rodriguez, R.: 500-year temper-ature reconstruction in the Mediterranean Basin by means of doc-umentary data and instrumental observations, Climatic Change,101, 169–199, 2010.
Clim. Past, 17, 1273–1314, 2021 https://doi.org/10.5194/cp-17-1273-2021

D. J. Nash et al.: Climate indices in historical climate reconstructions 1305
Castorena, G., Sánchez Mora, E., Florescano, E., Padillo Ríos, G.,and Rodríguez Viqueira, L.: Análisis histórico de las sequíasen México Documentación de la Comisión del Plan NacionalHidráulico, Secretaría de Agricultura y Recursos Hidráulicos(SARH), Comisión del Plan Nacional Hidráulico, Mexico, 1980.
Catchpole, A. J. W.: Hudson’s Bay Company ships’ log-books assources of sea ice data, 1751–1870, in: Climate since A.D. 1500,edited by: Bradley, R. S. and Jones, P. D., Routledge, London,17–39, 1995.
Catchpole, A. J. W. and Faurer, M. A.: Summer sea ice severity inHudson Strait, 1751–1870, Climatic Change, 5, 115–139, 1983.
Catchpole, A. J. W. and Halpin, J.: Measuring summer sea ice sever-ity in Eastern Hudson Bay, 1751–1870, Can. Geogr., 31, 233–244, 1987.
Catchpole, A. J. W. and Hanuta, I.: Severe summer sea ice in Hud-son Strait and Hudson Bay following major volcanic eruptions,1751–1889 A.D., Climatic Change, 14, 61–79, 1989.
Catchpole, A. J. W., Moodie, D. W., and Kaye, B.: Content analysis:A method for the identification of dates of first freezing and firstbreaking from descriptive accounts, Prof. Geogr., 22, 252–257,1970.
Central Meteorological Bureau of China: Atlas of Drought andFlood Distribution in China over the Last 500 Years, China Car-tographic Publishing House, Beijing, 1981.
Chen, H.-F., Liu, Y.-C., Chiang, C.-W., Liu, X., Chou, Y.-M., andPan, H.-J.: China’s historical record when searching for tropi-cal cyclones corresponding to Intertropical Convergence Zone(ITCZ) shifts over the past 2 kyr, Clim. Past, 15, 279–289,https://doi.org/10.5194/cp-15-279-2019, 2019.
Chen, J. Q. and Shi, Y. F.: The comparison between 1000-yr wintertemperature change in the Yangtze river delta and ice core recordof Guliya, Journal of Glaciology and Geocryology, 24, 32–39,2002.
Chenoweth, M.: A reassessment of historical Atlantic basin tropi-cal cyclone activity, 1700–1855, Climatic Change, 76, 169–240,2006.
Chenoweth, M. and Divine, D.: A document-based 318-year record of tropical cyclones in the Lesser Antilles,1690–2007, Geochem. Geophy. Geosy., 9, Q08013,https://doi.org/10.1029/2008GC002066, 2008.
Chinese Academy of Social Science: The history of natural disas-ters and agriculture in each dynasty of China, Agriculture Press,Beijing, 1988.
Cook, E. R., Briffa, K. R., and Jones, P. D.: Spatial regression meth-ods in dendroclimatology – a review and comparison of two tech-niques, Int. J. Climatol., 14, 379–402, 1994.
Degroot, D.: “Never such weather known in these seas”: Climaticfluctuations and the Anglo-Dutch wars of the seventeenth cen-tury, 1652–1674, Environment and History, 20, 239–273, 2014.
Degroot, D.: Testing the limits of climate history: The quest for anortheast passage during the Little Ice Age, 1594–1597, J. Inter-discipl. Hist., 45, 459–484, 2015.
Degroot, D.: The Frigid Golden Age: Climate Change, the Little IceAge, and the Dutch Republic, 1560–1720, Cambridge UniversityPress, New York, USA, 2018.
Degroot, D.: War of the whales: Climate change, weather and Arcticconflict in the early seventeenth century, Environment and His-tory, 26, 549–577, 2020.
Degroot, D. and Ottens, S.: Climatological Database for theWorld’s Oceans, available at: https://www.historicalclimatology.com/cliwoc.html#, last access: 3 June 2021.
de Kraker, A. M. J.: Reconstruction of storm frequency in the NorthSea area of the pre-industrial period, 1400–1625 and the connec-tion with reconstructed time series of temperatures, History ofMeteorology, 2, 51–69, 2011.
Dobrovolný, P.: Analysis and interpretation: Calibration-verification, in: The Palgrave Handbook of Climate History,edited by: White, S., Pfister, C., and Mauelshagen, F., PalgraveMacmillan, London, 107–113, 2018.
Dobrovolný, P., Brázdil, R., Valášek, H., Kotyza, O., Macková, J.,and Halícková, M.: A standard paleoclimatological approach totemperature reconstruction in historical climatology: an examplefrom the Czech Republic, AD 1718–2007, Int. J. Climatol., 29,1478–1492, 2009.
Dobrovolný, P., Moberg, A., Brázdil, R., Pfister, C., Glaser, R., Wil-son, R., van Engelen, A., Limanówka, D., Kiss, A., Halícková,M., Macková, J., Riemann, D., Luterbacher, J., and Böhm, R.:Monthly, seasonal and annual temperature reconstructions forCentral Europe derived from documentary evidence and instru-mental records since AD 1500, Climatic Change, 101, 69–107,2010.
Dobrovolný, P., Brázdil, R., Trnka, M., Kotyza, O., and Valašek,H.: Precipitation reconstruction for the Czech Lands, AD 1501–2010, Int. J. Climatol., 35, 1–14, 2015.
Domínguez-Castro, F., Santisteban, J. I., Barriendos, M., and Medi-avilla, R.: Reconstruction of drought episodes for central Spainfrom rogation ceremonies recorded at the Toledo Cathedralfrom 1506 to 1900: A methodological approach, Global Planet.Change, 63, 230–242, 2008.
Domínguez-Castro, F., García-Herrera, R., Ribera, P., and Bar-riendos, M.: A shift in the spatial pattern of Iberiandroughts during the 17th century, Clim. Past, 6, 553–563,https://doi.org/10.5194/cp-6-553-2010, 2010.
Domínguez-Castro, F., Vaquero, J. M., Marin, M., Cruz Gallego,M., and Garcia-Herrera, R.: How useful could Arabic documen-tary sources be for reconstructing past climate?, Weather, 67, 76–82, 2012a.
Domínguez-Castro, F., Ribera, P., García-Herrera, R., Vaquero, J.M., Barriendos, M., Cuadrat, J. M., and Moreno, J. M.: Assess-ing extreme droughts in Spain during 1750–1850 from rogationceremonies, Clim. Past, 8, 705–722, https://doi.org/10.5194/cp-8-705-2012, 2012b.
Domínguez-Castro, F., García-Herrera, R., and Vaquero, J. M.: Anearly weather diary from Iberia (Lisbon, 1631–1632), Weather,70, 20–24, 2015.
Domínguez-Castro, F., Garcia-Herrera, R., and Vicente-Serrano, S.M.: Wet and dry extremes in Quito (Ecuador) since the 17th cen-tury, Int. J. Climatol., 38, 2006–2014, 2018.
Domínguez-Castro, F., Gallego, M. C., Vaquero, J. M., Herrera, R.G., Pena-Gallardo, M., El Kenawy, A., and Vicente-Serrano, S.M.: Twelve years of daily weather descriptions in North Amer-ica in the eighteenth century (Mexico City, 1775–86), B. Am.Meteorol. Soc., 100, 1531–1547, 2019.
Easton, C.: Les hivers dans l’Europe occidentale, E. J. Brill, Leiden,Netherlands„ 1928.
Endfield, G. H.: Climate and crisis in eighteenth century Mexico,Mediev. Hist. J., 10, 99–125, 2007.
https://doi.org/10.5194/cp-17-1273-2021 Clim. Past, 17, 1273–1314, 2021

1306 D. J. Nash et al.: Climate indices in historical climate reconstructions
Endfield, G. H. and Nash, D. J.: Drought, desiccation and dis-course: missionary correspondence and nineteenth-century cli-mate change in central southern Africa, Geogr. J., 168, 33–47,2002.
Erfurt, M., Glaser, R., and Blauhut, V.: Changing impactsand societal responses to drought in southwestern Ger-many since 1800, Reg. Environ. Change, 19, 2311–2323,https://doi.org/10.1007/s10113-019-01522-7, 2019.
Fang, X., Xiao, L., Ge, Q., and Zheng, J.: Changes of plantsphenophases and temperature in spring during 1888–1916around Changsha and Hengyang in Hunan Province, QuaternarySciences, 25, 74–79, 2005.
Fei, J., Hu, H., Zhang, Z., and Zhou, J.: Research on dust weatherin Beijing during 1860–1898: Inferred from the diary of TongheWeng, Journal of Catastrophology (Zaihai Xue), 24, 116–122,2009.
Fenby, C. D.: Experiencing, understanding and adapting to climatein south-eastern Australia, 1788–1860, unpublished PhD Thesis,School of Earth Sciences and School of Historical and Philo-sophical Studies, University of Melbourne, Australia, 2012.
Fenby, C. D. and Gergis, J.: Rainfall variations in south-easternAustralia part 1: consolidating evidence from pre-instrumentaldocumentary sources, 1788–1860, Int. J. Climatol., 33, 2956–2972, 2013.
Fernández-Fernández, M. I., Gallego, M. C., Domínguez-Castro, F.,Trigo, R. M., Garcia, J. A., Vaquero, J. M., Gonzalez, J. M. M.,and Duran, J. C.: The climate in Zafra from 1750 to 1840: historyand description of weather observations, Climatic Change, 126,107–118, 2014.
Fernández-Fernández, M. I., Gallego, M. C., Domínguez-Castro, F.,Trigo, R. M., and Vaquero, J. M.: The climate in Zafra from 1750to 1840: precipitation, Climatic Change, 129, 267–280, 2015.
Fernández-Fernández, M. I., Gallego, M. C., Domínguez-Castro, F.,Trigo, R. M., and Vaquero, J. M.: The climate in Zafra from1750 to 1840: temperature indexes from documentary sources,Climatic Change, 141, 671–684, 2017.
Florescano, E.: Precios del maíz y crisis agrícolas en México, ElColegio de México, Mexico, 1969.
Foley, J. C.: Droughts in Australia: Review of records from earliestyears of settlement to 1955, Bulletin No. 43, Bureau of Meteo-rology, Melbourne, 1957.
Fragoso, M., Carraça, M. D. G., and Alcoforado, M. J.: Droughtsin Portugal in the 18th century: A study based on newly founddocumentary data, Int. J. Climatol., 38, 5522–5541, 2018.
Fujiki, H.: Nihon chusei kisho saigaishi nenpyoko [Draft of aChronological Timeline for the History of Japanese MedievalCatastrophes], Koshi Shoin, Tokyo, 2007.
Gallego, D., Ordóñez, P., Ribera, P., Peña-Ortiz, C., and García-Herrera, R.: An instrumental index of the West African Monsoonback to the 19th century, Q. J. Roy. Meteor. Soc., 141, 3166–3176, 2015.
Gallego, D., García-Herrera, R., Peña-Ortiz, C., and Ribera,P.: The steady increase of the Australian Summer Mon-soon in the last 200 years, Scientific Reports, 7, 16166,https://doi.org/10.1038/s41598-017-16414-1, 2017.
Garcia, R. R., Diaz, H. F., Herrera, R. G., Eischeid, J., Prieto, M.D., Hernandez, E., Gimeno, L., Duran, F. R., and Bascary, A.M.: Atmospheric circulation changes in the tropical Pacific in-ferred from the voyages of the Manila galleons in the sixteenth-
eighteenth centuries, B. Am. Meteorol. Soc., 82, 2435–2455,2001.
García-Acosta, V., Pérez Zevallos, J. M., and Molina Del Villar,A.: Desastres Agrícolas en México. Catálogo histórico, Tomo I:Épocas prehispánica y colonial (958–1822), Fondo de CulturaEconómica (FCE), Centro de Investigaciones y Estudios Superi-ores en Antropología Social (CIESAS), Mexico, 2003.
García-Herrera, R. and Gallego, D.: Ship logbooks help to under-stand climate variability. In: Advances in Shipping Data Anal-ysis and Modeling, edited by: Ducruet, C., Routledge, London,37–51, 2017.
García-Herrera, R., Prieto, L., Gallego, D., Hernández, E., Gimeno,L., Können, G., Koek, F. B., Wheeler, D., Wilkinson, C., Pri-eto, M. R., Báez, C., and Woodruff, S.: CLIWOC MultilingualMeteorological Dictionary: An English-Spanish-Dutch-Frenchdictionary of wind force terms used by mariners from 1750to 1850, Koninklijke Nederlands Meteorologisch Instituut, DenHaag, 2003.
García-Herrera, R., Durán, F. R., Wheeler, D., Martín, E. H., Prieto,M. R., and Gimeno, L.: The use of Spanish and British documen-tary sources in the investigation of Atlantic hurricane incidencein historical times, in: Hurricanes and Typhoons: Past, Present,and Future, edited by: Murnane, R. J. and Liu, K.-B., ColumbiaUniversity Press, New York, 149–176, 2004.
García-Herrera, R., Gimeno, L., Ribera, P., and Hernandez,E.: New records of Atlantic hurricanes from Spanish doc-umentary sources, J. Geophy. Res.-Atmos., 110, D03109,https://doi.org/10.1029/2004JD005272, 2005a.
García-Herrera, R., Konnen, G. P., Wheeler, D. A., Prieto, M.R., Jones, P. D., and Koek, F. B.: CLIWOC: A climatologicaldatabase for the world’s oceans 1750–1854, Climatic Change,73, 1–12, 2005b.
García-Herrera, R., Können, G. P., Wheeler, D. A., Prieto, M. R.,Jones, P. D., and Koek, F. B.: Ship logbooks help analyze pre-instrumental climate, Eos, Transactions of the American Geo-physical Union, 87, 173–180, 2006.
García-Herrera, R., Díaz, H. F., García, R. R., Prieto, M. R., Bar-riopedro, D., Moyano, R., and Hernández, E.: A chronology ofEl Niño events from primary documentary sources in NorthernPeru, J. Climate, 21, 1948–1962, 2008.
García-Herrera, R., Barriopedro, D., Gallego, D., Mellado-Cano, J.,Wheeler, D., and Wilkinson, C.: Understanding weather and cli-mate of the last 300 years from ships’ logbooks, WIRES-Clim.Change, 9, e544, https://doi.org/10.1002/wcc.544, 2018.
Garnier, E.: Le renversement des saisons. Climats et sociétés enFrance (vers 1500 – vers 1850), Mémoire d’étude our l’obtentionde l’Habilitation à diriger des recherches, Université de Franche-Comté, Besançon, France, 2009.
Garnier, E.: Bassesses extraordinaires et grandes chaleurs. 500 ansde sécheresses et de chaleurs en France et dans les pays limitro-phes, Houille Blanche, 4, 26–42, 2010.
Garnier, E.: At the risk of floodwaters: historical flood risk andits social impacts in the area of the Wash in eastern England(Cambridgeshire, Norfolk, Lincolnshire), mid 17th century –end of the 19th century, Hydrology and Earth System SciencesDiscussions, 12, 6541–6573, https://doi.org/10.5194/hessd-12-6541-2015, 2015.
Garnier, E.: Historic drought from archives. Beyond the instrumen-tal record, in: Drought. Science and Policy, edited by: Iglesias,
Clim. Past, 17, 1273–1314, 2021 https://doi.org/10.5194/cp-17-1273-2021

D. J. Nash et al.: Climate indices in historical climate reconstructions 1307
A., Assimacopoulos, D., and Van Lanen, H. A. J., John Wiley &Sons, Hoboken NJ, USA, 45–67, 2018.
Garza, G. M. and Barriendos, M.: El Clima en la historia, Ciencias,51, 22–25, 1998.
Garza Merodio, G. G.: Frecuencia y duración de sequías en laCuenca de México de fines del siglo XVI a mediados del XIX,Investigaciones Geográficas, 2002, 106–115, 2002.
Garza Merodio, G. G.: Variabilidad climática en México a través defuentes documentales (siglos XVI al XIX), UNAM, Instituto deGeografía, Mexico City, Mexico, 2017.
Ge, Q.-S., Zheng, J. Y., Fang, X. Q., Man, Z. M., Zhang, X. Q.,Zhang, P. Y., and Wang, W. C.: Winter half-year temperature re-construction for the middle and lower reaches of the Yellow Riverand Yangtze River, China, during the past 2000 years, Holocene,13, 933–940, 2003.
Ge, Q.-S., Zheng, J. Y., Hao, Z. X., Zhang, P. Y., and Wang, W. C.:Reconstruction of historical climate in China – High-resolutionprecipitation data from Qing dynasty archives, B. Am. Meteorol.Soc., 86, 671–680, 2005.
Ge, Q.-S., Ding, L.-L., and Zheng, J.-Y.: Research on methodsof starting date of pre-summer rainy season reconstruction inFuzhou derived from Yu-Xue-Fen-Cun records, Advances inEarth Science, 26, 1200–1207, 2011.
Ge, Q., Hao, Z., Zheng, J., and Shao, X.: Temperaturechanges over the past 2000 yr in China and comparisonwith the Northern Hemisphere, Clim. Past, 9, 1153–1160,https://doi.org/10.5194/cp-9-1153-2013, 2013.
Ge, Q.-S., Hao, Z.-X., Zheng, J.-Y., and Liu, Y.: China: 2000 yearsof climate reconstruction from historical documents, in: The Pal-grave Handbook of Climate History, edited by: White, S., Pfister,C., and Mauelshagen, F., Palgrave Macmillan, London, 189–201,2018.
Gergis, J. and Ashcroft, L.: Rainfall variations in south-eastern Aus-tralia, Part 2: a comparison of documentary, early instrumen-tal and palaeoclimate records, 1788–2008, Int. J. Climatol., 33,2973–2987, 2013.
Gergis, J., Karoly, D. J., and Allan, R. J.: A climate reconstructionof Sydney Cove, New South Wales, using weather journal anddocumentary data, 1788–1791, Aust. Meteorol. Ocean., 58, 83–98, 2009.
Gergis, J., Gallant, A., Braganza, K., Karoly, D. J., Allen, K.,Cullen, L., D’Arrigo, R. D., Goodwin, I., Grierson, P., and Mc-Gregor, S.: On the long-term context of the 1997–2009 “BigDry” in south-eastern Australia: insights from a 206-year multi-proxy rainfall reconstruction, Climatic Change, 111, 923–944,2012.
Gergis, J., Ashcroft, L., and Garden, D.: Recent developments inAustralian climate history, in: The Palgrave Handbook of Cli-mate History, edited by: White, S., Pfister, C., and Mauelshagen,F., Palgrave Macmillan, London, 237–245, 2018.
Gergis, J., Ashcroft, L., and Whetton, P.: A historical perspective onAustralian temperature extremes, Clim. Dynam., 55, 843–868,2020.
Gil-Guirado, S., Espin-Sanchez, J. A., and Prieto, M. D.: Can welearn from the past? Four hundred years of changes in adapta-tion to floods and droughts. Measuring the vulnerability in twoHispanic cities, Climatic Change, 139, 183–200, 2016.
Gil-Guirado, S., Gómez-Navarro, J. J., and Montávez, J. P.: Theweather behind words – new methodologies for integrated hy-
drometeorological reconstruction through documentary sources,Clim. Past, 15, 1303–1325, https://doi.org/10.5194/cp-15-1303-2019, 2019.
Gioda, A. and Prieto, M. R.: Histoire des sécheresses andines. Po-tosí, El Niño et le Petit Âge Glaciaire. La Météorologie, Revuede la Société Météorologique de France, 8, 33–42, 1999.
Gioda, A., Prieto, A. R., and Forenza, A.: Archival climate historysurvey in the Central Andes (Potosí, 16th–17th Centuries), in:Prace Geograficzne, zeszyt 107, Instytut Geografii UJ, Kraków,107–112, 2000.
Glaser, R.: Klimageschichte Mitteleuropa. 1000 Jahre Wetter,Klima, Katastrophen, Primus Verlag, Darmstadt, 2001.
Glaser, R.: Klimageschichte Mitteleuropas, 1200 Jahre Wetter,Klima, Katastrophen: Mit Prognosen für das 21 Jahrhundert, 3rdedn., Primus, Darmstadt, 2013.
Glaser, R. and Riemann, D.: A thousand-year record of temperaturevariations for Germany and Central Europe based on documen-tary data, J. Quaternary Sci., 24, 437–449, 2009.
Glaser, R. and Stangl, H.: Historical floods in the DutchRhine Delta, Nat. Hazards Earth Syst. Sci., 3, 605–613,https://doi.org/10.5194/nhess-3-605-2003, 2003.
Glaser, R. and Stangl, H.: Climate and floods in Central Europesince AD 1000: Data, methods, results and consequences, Surv.Geophys., 25, 485–510, 2004.
Glaser, R., Brazdil, R., Pfister, C., Dobrovolný, P., Vallve, M. B.,Bokwa, A., Camuffo, D., Kotyza, O., Limanowka, D., Racz, L.,and Rodrigo, F. S.: Seasonal temperature and precipitation fluc-tuations in selected parts of Europe during the sixteenth century,Climatic Change, 43, 169–200, 1999.
Glaser, R., Rieman, D., Schönbein, J., Barriendos, M., Brázdil, R.,Bertolin, C., Camuffo, D., Deutsch, M., Dobrovolný, P., van En-gelen, A., Enzi, S., Halickova, M., Koenig, S. J., Kotyza, O., Li-manowka, D., Mackova, J., Sghedoni, M., Martin, B., and Him-melsbach, I.: The variability of European floods since AD 1500,Climatic Change, 101, 235–256, 2010.
Gong, G. F. and Hameed, S.: The variation of moisture conditions inChina during the last 2000 years, Int. J. Climatol., 11, 271–283,1991.
Gong, G. F., Zhang, P. Y., and Zhang, J. Y.: A study on the climateof the 18th century of the Lower Changjiang Valley in China,Geographic Research, 2, 20–33, 1983.
Grab, S. W. and Nash, D. J.: Documentary evidence of climate vari-ability during cold seasons in Lesotho, southern Africa, 1833–1900, Clim. Dynam., 34, 473–499, 2010.
Grab, S. W. and Zumthurm, T.: The land and its climate knows notransition, no middle ground, everywhere too much or too little:a documentary-based climate chronology for central Namibia,1845–1900, Int. J. Climatol., 38, e643–e659, 2018.
Haldon, J., Roberts, N., Izdebski, A., Fleitmann, D., McCormick,M., Cassis, M., Doonan, O., Eastwood, W., Elton, H., Ladstatter,S., Manning, S., Newhard, J., Nicoll, K., Telelis, I., and Xoplaki,E.: The climate and environment of Byzantine Anatolia: Inte-grating science, history, and archaeology, J. Interdiscipl. Hist.,45, 113–161, 2014.
Hannaford, M. J. and Nash, D. J.: Climate, history, society over thelast millennium in southeast Africa, WIRES-Clim. Change, 7,370–392, 2016.
https://doi.org/10.5194/cp-17-1273-2021 Clim. Past, 17, 1273–1314, 2021

1308 D. J. Nash et al.: Climate indices in historical climate reconstructions
Hannaford, M. J., Jones, J. M., and Bigg, G. R.: Early-nineteenth-century southern African precipitation reconstructions fromships’ logbooks, Holocene, 25, 379–390, 2015.
Hansen, C.: Chinese language, Chinese philosophy, and “Truth”, J.Asian Stud., 44, 491–519, 1985.
Hao, Z.-X., Zheng, J.-Y., Ge, Q.-S., and Wang, W.-C.: Wintertemperature variations over the middle and lower reaches ofthe Yangtze River since 1736 AD, Clim. Past, 8, 1023–1030,https://doi.org/10.5194/cp-8-1023-2012, 2012.
Hao, Z.-X., Yu, Y. Z., Ge, Q.-S., and Zheng, J. Y.: Reconstruction ofhigh-resolution climate data over China from rainfall and snow-fall records in the Qing Dynasty, WIRES-Clim. Change, 9, e517,https://doi.org/10.1002/wcc.517, 2018.
Heckmann, M.-L.: Zwischen Weichseldelta, Großer Wildnisund Rigaischem Meerbusen. Ökologische Voraussetzungen fürdie Landnahme im spätmittelalterlichen Baltikum, in: VonNowgorod bis London. Studien zu Handel, Wirtschaft undGesellschaft im mittelalterlichen Europa. Festschrift für StuargJenks zum 60. Geburtstag, edited by: Heckmann, M.-L. andRöhrkasten, J., V&R Unipress, Göttingen, 255–295, 2008.
Heckmann, M.-L.: Wetter und Krieg – im Spiegel erzählen-der Quellen zu Preußen und dem Baltikum aus dem 13.und 14. Jahrhundert, in: Pismiennosc pragmatyczna – Edy-torstwo zródełhistorycznych-archiwistyka. Studia ofiarowaneProfesorowi Januszowo Tandeckiemu w szescdziesiata piatarocznice urodzin, edited by: Czaia, R. and Kopinský, K., TNT,Torun, 191–212, 2015.
Hernández, M. E. and Garza Merodio, G. G.: Rainfall variabil-ity in Mexico’s Southern Highlands (instrumental and documen-tary phases), 17th to 21st centuries, in: Environmental quality inthe large cities and industrial zones: problems and management.Ecology and hydrometeorology of big cities and industrial zones(Russia-Mexico), Vol. I, Analysis of the environment, edited by:Karlin, N. L. and Shelutko, A. V., Russian State Hydrometeorol-ogy, University of St. Petersburg, St. Petersburg, Russia, 94–113,2010.
Herrera, R., Prieto, M. R., and Rojas, F.: Lluvias, sequías e inun-daciones en el Chaco semiárido argentino entre 1580 y 1900,Revista de la Junta de Estudios Históricos de Santa Fe, LXIX,173–200, 2011.
Hirano, J. and Mikami, T.: Reconstruction of winter climate varia-tions during the 19th century in Japan, Int. J. Climatol., 28, 1423–1434, 2008.
Holmes, D. G. and Lipo, T. A.: Pulse width modulation for powerconverters: principles and practice, Wiley-IEEE Press, Piscat-away NJ, USA, 2003.
Hunt, H. A.: Results of rainfall observations made in Victoria dur-ing 1840–1910. Including all available annual rainfall totals from1,114 stations; together with maps and diagrams, Bureau of Me-teorology, Melbourne, 1911.
Hunt, H. A.: Results of rainfall observations made in Queenslandincluding all available annual rainfall totals from 1040 stationsfor all years of record up to 1913; together with maps and dia-grams, Bureau of Meteorology, Melbourne, 1914.
Hunt, H. A.: Results of rainfall observations made in South Aus-tralia and the Northern Territory, including all available annualrainfall totals from 829 stations for all years of record up to 1917,with maps and diagrams; also, appendices, presenting monthly
and yearly meteorological elements for Adelaide and Darwin,Bureau of Meteorology, Melbourne, 1918.
Ichino, M., Masuda, K., Kitamoto, A., Hirano, J., and Sho, K.: Ex-perience of historical climatology as a material in Digital Hu-manities, in: Computers and the Humanities Symposium (De-cember 2017), Information Processing Society of Japan, Tokyo,139–146, 2017.
IJnsen, F. and Schmidt, F. H.: Onderzoek naar het Optreden vanWinterweer in Nederland, Scientific report, Royal NetherlandsMeteorological Institute, de Bilt, 1974.
Ingram, M. J., Farmer, G., and Wigley, T. M. L.: The use of docu-mentary sources for the study of past climates, in: Climate andHistory: Studies in Past Climates and their Impact on Man, editedby: Wigley, T. M. L., Ingram, M. J., and Farmer, G., CambridgeUniversity Press, Cambridge, UK, 180–213, 1981.
Ito, K.: Fujiki Hisashi nihon chusei saigaishi nenpyoko wo riyoshitakikohendo to saigai shiryo no kankei no kento. Daikikin no jikiwo chushin ni [Research on historical weather sources usingHisashi Fujiki’s “Draft of a Chronological Timeline for the His-tory of Medieval Japanese Catastrophes”. Focussing on “GreatFamine” Periods]. Kiko tekioshi project. Kekka hokokusho 1[Historical Adaptation Project, Working Papers 1], 65–75, 2014.
Jáuregui, E.: Algunos aspectos de las fluctuaciones pluviométricasen México en los últimos cien años, Boletín del Instituto de Ge-ografía, 9, 39–64, 1979.
Jevons, W. S.: Some data concerning the climate of Australia &New Zealand, in: Waugh’s Australian Almanac for the year 1859,James William Waugh, Sydney, Australia, 47–98, 1859.
Jones, P. D. and Salmon, M.: Preliminary reconstructions of theNorth Atlantic Oscillation and the Southern Oscillation Indexfrom measures of wind strength and direction taken during theCLIWOC period, Climatic Change, 73, 131–154, 2005.
Jusupovic, A. and Bauch, M.: Surprising eastern perspectives: His-torical climatology and Russian narrative sources, PAGES News,28, 48–49, https://doi.org/10.22498/pages.28.2.48, 2020.
Kelso, C. and Vogel, C. H.: The climate of Namaqualand in thenineteenth century, Climatic Change 83, 257–380, 2007.
Kiss, A.: Floods and Long-Term Water-Level Changes in MedievalHungary, Springer, Cham, 2019.
Klemm, F.: Witterungschronik des Barfüßerklosters Thann imOberelsaß von 1182–1700, Meteorologische Rundschau, 23/1,15–18, 1970.
Klimanov, V. A., Khotinskij, N. A., and Blagoveshchenskaia, N. V.:Climate fluctuations over the historical period in the centre ofthe Russian Plain, Bulletin of the Russian Academy of Sciences:Geographic Series, 1, 89–96, 1995.
Klimenko, V. and Solomina, O.: Climatic variations in the East Eu-ropean Plain during the last millennium: State of the art, in: ThePolish Climate in the European Context: An Historical Overview,edited by: Przybylak, R., Majorowicz, J., Brázdil, R., and Kejan,M., Springer, Dordrecht, 71–101, 2010.
Klimenko, V. V., Klimanov, V. A., Sirin, A. A., and Slepcov, A.M.: Climate change in the west of European part of Russia in thelate Holocene, Proceedings of the Russian Academy of Sciences,376, 679–683, 2001.
Koek, F. B. and Konnen, G. P.: Determination of wind force andpresent weather terms: The Dutch case, Climatic Change, 73, 79–95, 2005.
Clim. Past, 17, 1273–1314, 2021 https://doi.org/10.5194/cp-17-1273-2021

D. J. Nash et al.: Climate indices in historical climate reconstructions 1309
Kong, W. S. and Watts, D.: A unique set of climatic data from Ko-rea dating from 50 BC, and its vegetational implications, GlobalEcol. Biogeogr., 2, 133–138, 1992.
Küttel, M., Luterbacher, J., Zorita, E., Xoplaki, E., Riedwyl, N.,and Wanner, H.: Testing a European winter surface temperaturereconstruction in a surrogate climate, Geophys. Res. Lett., 34,L07710, https://doi.org/10.1029/2006GL027907, 2007.
Küttel, M., Xoplaki, E., Gallego, D., Luterbacher, J., Garcia-Herrera, R., Allan, R., Barriendos, M., Jones, P., Wheeler, D.,and Wanner, H.: The importance of ship log data: reconstructingNorth Atlantic, European and Mediterranean sea level pressurefields back to 1750, Clim. Dynam., 34, 1115–1128, 2010.
Lamb, H. H.: Climate. Past, Present and Future, vol. 2, Methuen,London, 1977.
Lamb, H. H.: Historic Storms of the North Sea, British Islesand Northwest Europe, Cambridge University Press, Cambridge,UK, 1992.
Leontovich, F. I.: Famine in Russia until the end of the last century,Northern Herald, March, 2–35, 1892.
Liakhov, M. E.: Climatic extremes in the central part of the Euro-pean territory of the USSR in the 13th–20th centuries, Bulletinof the Academy of Sciences of the USSR: Geographic Series, 6,68–74, 1984.
Lin, K.-H. E., Hsu, C. T., Wang, P. K., Hsu, S. M., Lin, Y. S.,Wan, C. W., Tseng, W. L., Wu, W. C., and Pan, W.: Reconstruct-ing historical typhoon series and spatiotemporal characteristicsfrom REACHES documentary records, J. Geogr. Sci., 93, 81–107, 2019.
Lin, K.-H. E., Wang, P. K., Pai, P.-L., Lin, Y.-S., and Wang, C.-W.: Historical droughts in the Qing dynasty (1644–1911) ofChina, Clim. Past, 16, 911–931, https://doi.org/10.5194/cp-16-911-2020, 2020.
Litzenburger, L.: Une ville face au climat. Metz à la fin du MoyenAge (1400–1530), Presses Universitaires de Nancy, Nancy, 2015.
Liu, B.: Phenological change in Yangtze Plain during late Ming Dy-nasty (1450–1649), Historical Geography, 35, 22–33, 2017.
Liu, K. B., Shen, C. M., and Louie, K. S.: A 1,000-year history oftyphoon landfalls in Guangdong, southern China, reconstructedfrom Chinese historical documentary records, Ann. Assoc. Am.Geogr., 91, 453–464, 2001.
Liu, Y., Wang, H., Dai, J., Li, T. S., Wang, H., and Tao, Z.: The ap-plication of phenological methods for reconstructing past climatechange, Geogr. Res., 33, 603–613, 2014.
Man, Z. M.: Some fundamentals in research on changes of warmand cold climate making use of historical records, Historical Ge-ography, 12, 21–31, 1995.
Mann, M. E. and Rutherford, S.: Climate reconstruction us-ing “Pseudoproxies”, Geophys. Res. Lett., 29, 139-1–139-4,https://doi.org/10.1029/2001GL014554, 2002.
Martín-Vide, J. and Barriendos, M.: The use of rogation ceremonyrecords in climatic reconstruction: a case study from Catalonia(Spain), Climatic Change, 30, 201–221, 1995.
Martín-Vide, J. and Vallvé, M. B.: The use of rogation ceremonyrecords in climatic reconstruction: a case study from Catalonia(Spain), Climatic Change, 30, 201–221, 1995.
Mauelshagen, F.: Klimageschichte der Neuzeit 1500–1900(Geschichte kompakt), Wissenschaftliche Buchgesellschaft,Darmstadt, 2010.
McAfee, R. J.: The fires of summer and the floods of winter: to-wards a climatic history for southeastern Australia, 1788–1860,Macquarie University Library, Sydney, Australia, 1981.
Meier, N., Rutishauser, T., Pfister, C., Wanner, H., and Luterbacher,J.: Grape harvest dates as a proxy for Swiss April to August tem-perature reconstructions back to AD 1480, Geophys. Res. Lett.,34, L20705, https://doi.org/10.1029/2007GL031381, 2007.
Mendoza, B., Jauregui, E., Diaz-Sandoval, R., Garcia-Acosta, V.,Velasco, V., and Cordero, G.: Historical droughts in central Mex-ico and their relation with El Nino, J. Appl. Meteorol., 44, 709–716, 2005.
Mendoza, B., Garcia-Acosta, V., Velasco, V., Jauregui, E., and Diaz-Sandoval, R.: Frequency and duration of historical droughts fromthe 16th to the 19th centuries in the Mexican Maya lands, Yu-catan Peninsula, Climatic Change, 83, 151–168, 2007.
Metcalfe, S. E.: Historical data and climatic change in Mexico – areview, Geogr. J., 153, 211–222, 1987.
Mikami, T.: Climatic variations in Japan reconstructed from histor-ical documents, Weather, 63, 190–193, 2008.
Mizukoshi, M.: Climatic reconstruction in central Japan during theLittle Ice Age based on documentary sources, Chigaku Zasshi[Journal of Geography], 102, 152–166, 1993.
Mizukoshi, M.: Kokiroku ni yoru 11/12/13/14/15/16 seiki notenkokiroku [Weather Documentation in Historical Sources ofthe 11th/12th/13th/14th/15th/16th Century], 6 volumes, TokyodoShuppan, Tokyo, 2004–2014.
Moodie, D. W. and Catchpole, A. J. W.: Environmental Datafrom Historical Documents by Content Analysis: Freeze-up andBreak-up of Estuaries on Hudson Bay, 1714–1871, Departmentof Geography, University of Manitoba, Winnipeg, Canada, 1975.
Mora Pacheco, K.: Conmociones bajo un “cielo conspirador”. Se-quías en el Altiplano Cundiboyacense, 1778–1828, in: VII Sim-posio de Historia Regional y Local, Universidad Industrial deSantander, Colombia, 2018.
Mutua, T. M. and Runguma, S. N.: Documentary driven chronolo-gies of rainfall variability for Kenya, 1845–1976, Journal ofClimatology and Weather Forecasting, 8, 255, available at:https://www.longdom.org/open-access/documentary-driven-chronologies-of-rainfall-variability-for-kenya–18451976.pdf(last access: 10 June 2021), 2020.
Nash, D. J.: Changes in precipitation over southern Africa duringrecent centuries, in: Oxford Research Encyclopedia of ClimateScience, Oxford University Press, Oxford, UK, 2017.
Nash, D. J. and Endfield, G. H.: A 19th century climate chronologyfor the Kalahari region of central southern Africa derived frommissionary correspondence, Int. J. Climatol., 22, 821–841, 2002.
Nash, D. J. and Endfield, G. H.: “Splendid rains have fallen”: linksbetween El Nino and rainfall variability in the Kalahari, 1840–1900, Climatic Change, 86, 257–290, 2008.
Nash, D. J. and Grab, S. W.: “A sky of brass and burning winds”:documentary evidence of rainfall variability in the Kingdom ofLesotho, Southern Africa, 1824–1900, Climatic Change, 101,617–653, 2010.
Nash, D. J. and Hannaford, M. J.: Historical climatology in Africa:A state of the art, PAGES News, 28, 42–43, 2020.
Nash, D. J., Pribyl, K., Klein, J., Neukom, R., Endfield, G. H.,Adamson, G. C. D., and Kniveton, D. R.: Seasonal rainfall vari-ability in southeast Africa during the nineteenth century recon-
https://doi.org/10.5194/cp-17-1273-2021 Clim. Past, 17, 1273–1314, 2021

1310 D. J. Nash et al.: Climate indices in historical climate reconstructions
structed from documentary sources, Climatic Change, 134, 605–619, 2016.
Nash, D. J., Pribyl, K., Endfield, G. H., Klein, J., and Adamson,G. C. D.: Rainfall variability over Malawi during the late 19thcentury, Int. J. Climatol., 38 (Suppl. 1), e629–e642, 2018.
Neukom, R., Prieto, M. D., Moyano, R., Luterbacher, J., Pfis-ter, C., Villalba, R., Jones, P. D., and Wanner, H.: An ex-tended network of documentary data from South Americaand its potential for quantitative precipitation reconstructionsback to the 16th century, Geophys. Res. Lett., 36, L12703,https://doi.org/10.1029/2009GL038351, 2009.
Neukom, R., Nash, D. J., Endfield, G. H., Grab, S. W., Grove, C.A., Kelso, C., Vogel, C. H., and Zinke, J.: Multi-proxy summerand winter precipitation reconstruction for southern Africa overthe last 200 years, Clim. Dynam., 42, 2713–2716, 2014a.
Neukom, R., Gergis, J., Karoly, D. J., Wanner, H., Curran, M., El-bert, J., Gonzalez-Rouco, F., Linsley, B. K., Moy, A. D., Mundo,I., Raible, C. C., Steig, E. J., van Ommen, T., Vance, T., Villalba,R., Zinke, J., and Frank, D.: Inter-hemispheric temperature vari-ability over the past millennium, Nat. Clim. Change, 4, 362–367,2014b.
Nicholls, N.: More on early ENSOs – evidence from Australian doc-umentary sources, B. Am. Meteorol. Soc., 69, 4–6, 1988.
Nicholson, S. E.: Climatic variations in the Sahel and other Africanregions during the past five centuries, J. Arid Environ., 1, 3–24,1978a.
Nicholson, S. E.: Comparison of historical and recent Africanrainfall anomalies with late Pleistocene and early Holocene,Palaeoecol. Afr., 10, 99–123, 1978b.
Nicholson, S. E.: The methodology of historical climate reconstruc-tion and its application to Africa, J. Afr. Hist., 20, 31–49, 1979.
Nicholson, S. E.: Saharan climates in historic times, in: The Sa-hara and the Nile, edited by: Williams, M. A. J. and Faure, H.,Balkema, Rotterdam, 173–200, 1980.
Nicholson, S. E.: The historical climatology of Africa, in: Climateand History, edited by: Wigley, T. M. L., Ingram, M. J., andFarmer, G., Cambridge University Press, Cambridge, UK, 249–270, 1981.
Nicholson, S. E.: Environmental change within the historical period,in: The Physical Geography of Africa, edited by: Goudie, A. S.,Adams, W. M., and Orme, A., Oxford University Press, Oxford,UK, 60–75, 1996.
Nicholson, S. E.: A semi-quantitative, regional precipitation dataset for studying African climates of the nineteenth century, part1. Overview of the data set, Climatic Change, 50, 317–353, 2001.
Nicholson, S. E.: A multi-century history of drought and wetter con-ditions in Africa, in: The Palgrave Handbook of Climate History,edited by: White, S., Pfister, C., and Mauelshagen, F., PalgraveMacmillan, London, 225–236, 2018.
Nicholson, S. E., Klotter, D., and Dezfuli, A. K.: Spatial reconstruc-tion of semi-quantitative precipitation fields over Africa duringthe nineteenth century from documentary evidence and gaugedata, Quaternary Res., 78, 13–23, 2012a.
Nicholson, S. E., Dezfuli, A. K., and Klotter, D.: A two-century pre-cipitation dataset for the continent of Africa, B. Am. Meteorol.Soc., 93, 1219–1231, 2012b.
Nicholson, S. E., Funk, C., and Fink, A.: Rainfall over the Africancontinent from the 19th through the 21st century, Global Planet.Change, 165, 114–127, 2018.
Norrgård, S.: Practising historical climatology in West Africa: a cli-matic periodisation 1750–1800, Climatic Change, 129, 131–143,2015.
Norrgård, S.: Royal Navy logbooks as secondary sources and theiruse in climatic investigations: introducing the log-board, Int. J.Climatol., 37, 2027–2036, 2017.
Ogilvie, A. E. J.: The past climate and sea-ice record from Iceland.Part 1: Data to A.D. 1780, Climatic Change, 6, 131–152, 1984.
Ogilvie, A. E. J.: Documentary evidence for changes in the climateof Iceland, A.D. 1500–1800, in: Climate since A.D. 1500, editedby: Bradley, R. S. and Jones, P. D., Routledge, London, 92–117,1992.
Ogilvie, A. E. J.: Sea-ice conditions off the coasts of Iceland A.D.1601–1850 with special reference to part of the Maunder Mini-mum period (1675–1715), AmS-Varia, 25, 9–12, 1996.
Ogilvie, A. E. J. and Farmer, G.: Documenting the Medieval cli-mate, in: Climates of the British Isles. Present, Past and Future,edited by: Hulme, M. and Barrow, E., Routledge, London, 1997.
Ogilvie, A. E. J. and Jónsson, T.: “Little Ice Age” research: A per-spective from Iceland, Climatic Change, 48, 9–52, 2001.
Oppokov, E. V.: Fluctuations in river flow in historical time, in: Re-search on Rivers of the USSR, vol. 4, State Institute of Hydrol-ogy, Leningrad, 1933.
Ordóñez, P., Gallego, D., Ribera, P., Peña-Ortiz, C., and García-Herrera, R.: Tracking the Indian Summer Monsoon onset backto the pre-instrumental period, J. Climate, 29, 8115–8127, 2016.
Ortlieb, L.: Las mayores precipitaciones históricas en Chile centraly la cronología de eventos ENOS en los siglos XVI–XIX, Rev.Chil. Hist. Nat., 67, 463–485, 1994.
Ortlieb, L.: Eventos El Niño y episodios lluviosos en el desiertode Atacama: el registro de los dos últimos siglos, Bulletin del’Institut Français d’Études Andines, 24, 519–537, 1995.
Ortlieb, L.: The documentary historical record of El Niño events inPeru: An update of the Quinn record, in: El Niño and the South-ern Oscillation: Multiscale Variability and Global and RegionalImpacts, edited by: Diaz, H. F. and Markgraf, V., Cambridge Uni-versity Press, Cambridge, UK, 207–297, 2000.
PAGES 2k Consortium: Continental-scale temperature variabilityduring the past two millennia, Nat. Geosci., 6, 339–346, 2013.
PAGES 2k Consortium: A global multiproxy database for temper-ature reconstructions of the Common Era, Scientific Data, 4,170088, https://doi.org/10.1038/sdata.2017.88, 2017.
Pauling, A., Luterbacher, J., and Wanner, H.: Evaluationof proxies for European and North Atlantic tempera-ture field reconstructions, Geophys. Res. Lett., 30, 1787,https://doi.org/10.1029/2003GL017589, 2003.
Pei, Q. and Forêt, P.: Introduction to the climate records of ImperialChina, Environ. Hist., 23, 863–871, 2018.
Perry, E. J.: Challenging the Mandate of Heaven – Popular protestin modern China, Crit. Asian Stud., 33, 163–180, 2001.
Pfister, C.: Klimageschichte der Schweiz 1525–1860. Das Klimader Schweiz und seine Bedeutung in der Geschichte vonBevölkerung und Landwirtschaft, Paul Haupt, Bern, 1984.
Pfister, C.: Monthly temperature and precipitation patterns in Cen-tral Europe from 1525 to the present. A methodology for quan-tifying man-made evidence on weather and climate, in: ClimateSince A.D. 1500, edited by: Bradley, R. S. and Jones, P. D., Rout-ledge, London, 118–142, 1992.
Clim. Past, 17, 1273–1314, 2021 https://doi.org/10.5194/cp-17-1273-2021

D. J. Nash et al.: Climate indices in historical climate reconstructions 1311
Pfister, C.: Raum-zeitliche Rekonstruktion von Witterungsanoma-lien und Naturkatastrophen 1496–1995. In cooperation withDaniel Brändli. Schlussbericht zum Projekt 4031-33198 des NFP31, vdf Hochschulverlag AG and ETH Zürich, Zurich, 1998.
Pfister, C.: Wetternachhersage. 500 Jahre Klimavariationen undNaturkatastrophen (1496–1995), Paul Haupt, Bern, Stuttgart,Wien, 1999.
Pfister, C.: Evidence from the archives of societies: Documentaryevidence – overview, in: The Palgrave Handbook of Climate His-tory, edited by: White, S., Pfister, C., and Mauelshagen, F., Pal-grave Macmillan, London, 37–47, 2018.
Pfister, C. and Hächler, S.: Überschwemmungskatastrophen imSchweizer Alpenraum seit dem Spätmittelalter. RaumzeitlicheRekonstruktion von Schadensmustern auf der Basis historischerQuellen, in: Historical Climatology in Different Climatic Zones,Würzburger Geographische Arbeiten 80, edited by: Glaser, R.and Walsh, R. P. D., Institut für Geographie/GeographischeGesellschaft, Würzburg, 127–148, 1991.
Pfister, C., Weingartner, R., and Luterbacher, J.: Hydrological win-ter droughts over the last 450 years in the Upper Rhine basin: amethodological approach, Hydrolog. Sci. J., 51, 966–985, 2006.
Pfister, C., Camenisch, C., and Dobrovolný, P.: Analysis and In-terpretation: Temperature and Precipitation Indices, in: The Pal-grave Handbook of Climate History, edited by: White, S., Pfis-ter, C., and Mauelshagen, F., Palgrave-Macmillan, London, 115–129, 2018.
Pichard, G. and Roucaute, E.: Une déclinaison régionale du Pe-tit Âge Glaciaire. Apport des archives historiques en Provence,Archéologie du Midi Medieval 27, 237–247, 2009.
Piervitali, E. and Colacino, M.: Evidence of drought in westernSicily during the period 1565–1915 from liturgical offices, Cli-matic Change, 49, 225–238, 2001.
Power, S. B. and Callaghan, J.: The frequency of major flooding incoastal southeast Australia has significantly increased since thelate 19th century, Journal of Southern Hemisphere Earth SystemsScience, 66, 2–11, 2016.
Prieto, M. R.: El clima de Mendoza durante los siglos XVII y XVIII,Meteorológica, XIV, 165–174, 1983.
Prieto, M. R.: Métodos para derivar información sobre precipita-ciones nivales de fuentes históricas en la Cordillera de los Andes,Zbl. Geo. Pal., 11/12, 1615–1624, 1984.
Prieto, M. R. and García-Herrera, R.: Documentary sources fromSouth America: Potential for climate reconstruction, Palaeo-geogr. Palaeocl., 281, 196–209, 2009.
Prieto, M. R. and Rojas, F.: Documentary evidence for changingclimatic and anthropogenic influences on the Bermejo Wetlandin Mendoza, Argentina, during the 16th–20th century, Clim. Past,8, 951–961, https://doi.org/10.5194/cp-8-951-2012, 2012.
Prieto, M. R. and Rojas, F.: Determination of droughts and highfloods of the Bermejo River (Argentina) based on documentaryevidence (17th to 20th century), J. Hydrol., 529, 676–683, 2015.
Prieto, M. R. and Rojas, F.: Climate history in Latin America, in:The Palgrave Handbook of Climate History, edited by: White, S.,Pfister, C., and Mauelshagen, F., Palgrave Macmillan, London,213–224, 2018.
Prieto, M. R., Herrera, R., and Dussel, P.: Historical evidences ofstreamflow fluctuations in the Mendoza River, Argentina, andtheir relationship with ENSO, Holocene, 9, 473–481, 1999.
Prieto, M. R., Garcia-Herrera, R., and Hernández, E.: Early recordsof icebergs in the South Atlantic Ocean from Spanish documen-tary sources, Climatic Change, 66, 29–48, 2004.
Prieto, M. R., Gallego, D., Garcia-Herrera, R., and Calvo, N.: De-riving wind force terms from nautical reports through contentanalysis. The Spanish and French cases, Climatic Change, 73,37–55, 2005.
Prieto, M. R., Rojas, F., and Castillo, L.: La climatología históricaen Latinoamérica. Desafíos y perspectivas, Bulletin de l’Institutfrançais d’études andines, 47, 141–167, 2019.
Quinn, W. H. and Neal, V. T.: The historical record of El Niñoevents, in: Climate Since A.D. 1500, edited by: Bradley, R. S.and Jones, P. D., Routledge, London, 623–648, 1992.
Quinn, W. H., Neal, V. T., and Antunez de Mayolo, S.E.: El Ninooccurrences over the past four and a half centuries, J. Geophys.Res., 92, 14449–14461, 1987.
Rácz, L.: Climate history of Hungary since 16th Century. Past,present and future, Centre for Regional Studies of the Hungar-ian Academy of Sciences, Pécs, 1999.
Rodrigo, F. S. and Barriendos, M.: Reconstruction of seasonal andannual rainfall variability in the Iberian peninsula (16th–20thcenturies) from documentary data, Global Planet. Change, 63,243–257, 2008.
Rodrigo, F. S., Estebanparra, M. J., and Castro-Diez, Y.: An attemptto reconstruct the rainfall regime of Andalusia (southern Spain)from 1601 ad to 1650 AD using historical documents, ClimaticChange, 27, 397–418, 1994.
Rodrigo, F. S., Esteban-Parra, M. J., and Castro-Diez, Y.: On theuse of the Jesuit order private correspondence records in climatereconstructions: A case study from Castille (Spain) for 1634–1648 AD, Climatic Change, 40, 625–645, 1998.
Rodrigo, F. S., Esteban-Parra, M. J., Pozo-Vazquez, D., and Castro-Diez, Y.: A 500-year precipitation record in Southern Spain, Int.J. Climatol., 19, 1233–1253, 1999.
Rohr, C.: Measuring the frequency and intensity of floods of theTraun River (Upper Austria), 1441–1574, Hydrolog. Sci. J., 51,834–847, 2006.
Rohr, C.: Extreme Naturereignisse im Ostalpenraum. Natur-erfahrung im Spätmittelalter und am Beginn der Neuzeit,Umwelthistorische Forschungen 4, Böhlau, Cologne, Weimar,Vienna, 2007.
Rohr, C.: Floods of the Upper Danube River and Its tributaries andtheir impact on urban economies (c. 1350–1600): The examplesof the towns of Krems/Stein and Wels (Austria), Environmentand History, 19, 133–148, 2013.
Rohr, C., Camenisch, C., and Pribyl, K.: European Middle Ages, in:The Palgrave Handbook of Climate History, edited by: White, S.,Pfister, C., and Mauelshagen, F., Palgrave-Macmillan, London,247–263, 2018.
Russell, H. C.: Climate of New South Wales: Descriptive, historical,and tabular, Charles Potter, Government Printer, Sydney, Aus-tralia, 1877.
Salvisberg, M.: Der Hochwasserschutz an der Gürbe. Eine Heraus-forderung für Generationen (1855–2010), Wirtschafts-, Sozial-und Umweltgeschichte 7, Schwabe, Basel, 2017.
Schwarz-Zanetti, G.: Grundzüge der Klima- und Umweltgeschichtedes Hoch- und Spätmittelalters in Mitteleuropa, Studentendruck-erei, Zürich, 1998.
https://doi.org/10.5194/cp-17-1273-2021 Clim. Past, 17, 1273–1314, 2021

1312 D. J. Nash et al.: Climate indices in historical climate reconstructions
Shabalova, M. V. and van Engelen, A. G. V.: Evaluation of a recon-struction of winter and summer temperatures in the low coun-tries, AD 764–1998, Climatic Change, 58, 219–242, 2003.
Shahgedanova, M. (Ed.): The physical geography of northern Eura-sia, Oxford University Press, Oxford, 2002.
Shen, X. Y. and Chen, J. Q.: Grain production and climatic variationin Taihu Lake Basin, Chinese Geogr. Sci., 3, 173–178, 1993.
Shi, F., Zhao, S., Guo, Z., Goosse, H., and Yin, Q.: Multi-proxy reconstructions of May–September precipitation field inChina over the past 500 years, Clim. Past, 13, 1919–1938,https://doi.org/10.5194/cp-13-1919-2017, 2017.
Sho, K., Shibuya, K., and Tominaga, A.: Examination of long-termchanges in the rainy season by comparing diary weather recordswith meteorological observation data, Journal of Hydrology andWater Resources, 30, 294–306, 2017.
Slepcov, A. M. and Klimenko, V. V.: Generalization of paleocli-matic data and reconstruction of the climate of Eastern Europefor the last 2000 years, History and Modernity, 1, 118–137, 2005.
Sturm, K., Glaser, R., Jacobeit, J., Deutsch, M., Brázdil, R., Pfister,C., Luterbacher, J., and Wanner, H.: Hochwasser in Mitteleuropaseit 1500 und ihre Beziehung zur atmosphärischen Zirkulation,Petermanns Geographische Mittelungen, 145, 14–23, 2001.
Su, Y., Fang, X. Q., and Yin, J.: Impact of climate change on fluctu-ations of grain harvests in China from the Western Han Dynastyto the Five Dynasties (206 BC–960 AD), Sci. China Earth Sci.,57, 1701–1712, 2014.
Tagami, Y.: Shohyoki chuki no nihonretto no kikohendo [Climatevariation of Japanese Islands in the middle Little Ice Age], Nin-gen hattatsu kagakubu kiyo [Bulletin of the Faculty of HumanDevelopment University of Toyama], 10, 161–173, 2015.
Tan, L. C., Ma, L., Mao, R. X., and Tsai, Y. J.: Past climate studiesin China during the last 2000 years from historical documents,Journal of Earth Environment, 5, 434–440, 2014.
Tan, P.-H. and Liao, H.-M.: Reconstruction of temperature, precip-itation and weather characteristics over the Yangtze River DeltaArea in Ming Dynasty, J. Geogr. Sci., 57, 61–87, 2012.
Tan, P.-H. and Wu, B.-L.: Reconstruction of climatic and weathercharacteristics in the Shanghai area during the Qing dynasty, J.Geogr. Sci., 71, 1–28, 2013.
Tejedor, E., de Luis, M., Barriendos, M., Cuadrat, J. M., Luter-bacher, J., and Saz, M. Á.: Rogation ceremonies: a key to un-derstanding past drought variability in northeastern Spain since1650, Clim. Past, 15, 1647–1664, https://doi.org/10.5194/cp-15-1647-2019, 2019.
Telelis, I. G.: Climatic fluctuations in the Eastern Mediterranean andthe Middle East AD 300–1500 from Byzantine documentary andproxy physical paleoclimatic evidence – A comparison, Jahrbuchder Österreichischen Byzantinistik, 58, 167–207, 2008.
Tian, H., Stige, L. C., Cazelles, B., Kausrud, K. L., Svarverud, R.,Stenseth, N. C., and Zhang, Z.: Reconstruction of a 1910-y-longlocust series reveals consistent associations with climate fluctu-ations in China, P. Natl. Acad. Sci. USA, 108, 14521–14526,2011.
Trouet, V., Harley, G. L., and Domínguez-Delmas, M.: Shipwreckrates reveal Caribbean tropical cyclone response to past radiativeforcing, P. Natl. Acad. Sci. USA, 113, 3169–3174, 2016.
Van Engelen, A. F. V., Buisman, J., and IJnsen, F.: A millenniumof weather, winds and water in the Low Countries, in: Historyand Climate. Memories of the Future?, edited by: Jones, P. D.,
Ogilvie, A. E. J., Davies, T. D., and Briffa, K. R., Kluwer Aca-demic/Plenum Publishers, New York, 101–123, 2001.
Veselovskij, K. S.: O klimate Rossii [About Russian climate], Pub-lishing House of the Imperial Academy of Sciences, Saint Pe-tersburg, 1857.
Vogel, C. H.: 160 years of rainfall in the Cape – has there been achange?, S. Afr. J. Sci., 84, 724–726, 1988.
Vogel, C. H.: A documentary-derived climatic chronology for SouthAfrica, 1820–1900, Climatic Change, 14, 291–307, 1989.
Vogt, S., Glaser, R., Luterbacher, J., Riemann, D., Al Dyab, G.,Schönbein, J., and Garcia-Bustamente, E.: Assessing the Me-dieval Climate Anomaly in the Middle East: The potential ofArabic documentary sources, PAGES News, 19, 28–29, 2011.
Wang, P. K.: Meteorological records from ancient chronicles ofChina, B. Am. Meteorol. Soc., 60, 313–317, 1979.
Wang, P. K.: On the relationship between winter thunder and the cli-matic change in China in the past 2200 years, Climatic Change,3, 37–46, 1980.
Wang, P. K. and Zhang, D.: An introduction to some historical gov-ernmental weather records of China, B. Am. Meteorol. Soc., 69,753–758, 1988.
Wang, P. K. and Zhang, D.: A study on the reconstruction of the 18thcentury meiyu (plum rains) activity of Lower Yangtze region ofChina, Sci. China Ser. B, 34, 1237–1245, 1991.
Wang, P. K. and Zhang, D.: Recent studies of the reconstruction ofeast Asian monsoon climate in the past using historical literatureof China, Meteorological Society of Japan, 70, 423–446, 1992.
Wang, P. K., Lin, K.-H. E., Liao, Y. C., Liao, H. M., Lin, Y. S.,Hsu, C. T., Hsu, S. M., Wan, C. W., Lee, S. Y., Fan, I. C., Tan,P. H., and Ting, T. T.: Construction of the REACHES climatedatabase based on historical documents of China, Scientific Data,5, 180288, https://doi.org/10.1038/sdata.2018.288, 2018.
Wang, R. S. and Wang, S. W.: Reconstruction of winter tempera-ture in Eastern China during the past 500 years using historicaldocuments, Acta Meteorol. Sin., 48, 379–386, 1990.
Wang, S. L., Ye, J. L., and Gong, D. Y.: Climate in China during theLittle Ice Age, Quaternary Sci. 1, 54–64, 1998.
Wang, S. W. and Gong, D. Y.: Climate in China during the fourspecial periods in Holocene, Prog. Nat. Sci., 10, 379–386, 2000.
Wang, S. W. and Wang, R. S.: Variations of seasonal and annualtemperatures during 1470–1979 in eastern China, Meteorologi-cal Bulletin, 48, 26–35, 1990.
Wang, S. W., Wang, K. S., Zhang, Z. M., and Ye, J. L.: The changeof drought and flood disasters over the areas of Yangtze andYellow rivers during 1380–1989, in: Diagnosis Research of Fre-quency and Economic Effect for Drought and Flood Disastersover Yangtze and Yellow Rivers, edited by: Wang, S. W. andHuang, Z. I., China Meteorological Press, Beijing, 41–54, 1993.
Ward, C. and Wheeler, D. A.: Hudson’s Bay Company ship’s log-books: a source of far North Atlantic weather data, Polar Rec.,48, 165–176, 2012.
Warren, H. N.: Results of rainfall observations made in New SouthWales, Sections I – VI, Districts 46 – 75, including rainfall tables(monthly and annual), discussion of rainfall and its relation toprimary industries, also temperature and humidity tables, recordsof floods, cyclones, and local storms, etc., Bureau of Meteorol-ogy, Canberra, 1948.
Watt, W. S.: Results of rainfall observations made in Tasmania in-cluding all available annual rainfall totals from 356 stations for
Clim. Past, 17, 1273–1314, 2021 https://doi.org/10.5194/cp-17-1273-2021

D. J. Nash et al.: Climate indices in historical climate reconstructions 1313
all years of record up to 1934, with maps and diagrams; andrecord of severe floods., Bureau of Meteorology, Melbourne,1936.
Wetter, O., Pfister, C., Weingartner, R., Luterbacher, J., Reist, T.,and Trösch, J.: The largest floods in the High Rhine basin since1268 assessed from documentary and instrumental evidence, Hy-drolog. Sci. J., 56, 733–758, 2011.
Wheeler, D. A.: Understanding seventeenth-century ships’ log-books: An exercise in historical climatology, Journal for Mar-itime Research, 6, 21–36, 2004.
Wheeler, D. A.: An examination of the accuracy and consistencyof ships’ logbook weather observations and records, ClimaticChange, 73, 97–116, 2005a.
Wheeler, D. A.: British naval logbooks from the late seventeenthcentury: New climatic information from old sources, History ofMeteorology, 2, 133–145, 2005b.
Wheeler, D. A. and Garcia-Herrera, R.: Ships’ logbooks in climato-logical research: Reflections and prospects, in: Trends and Di-rections in Climate Research, edited by: Gimeno, L., Garcia-Herrera, R., and Trigo, R. M., Ann. NY Acad. Sci., 1146, 1–15,2008.
Wheeler, D. A., Garcia-Herrera, R., Wilkinson, C., and Ward,C.: Atmospheric circulation and storminess derived from RoyalNavy logbooks: 1685 to 1750, Climatic Change, 101, 257–280,2010.
White, S.: North American climate history (1500–1800), in: ThePalgrave Handbook of Climate History, edited by: White, S.,Pfister, C., and Mauelshagen, F., Palgrave Macmillan, London,297–308, 2018.
Wilhelm, B., Ballesteros Canovas, J. A., Corella Aznar, J. P.,Kämpf, L., Swierczynski, T., Stoffel, M., Søren, E., and To-nen, W.: Recent advances in paleoflood hydrology: From newarchives to data compilation and analysis, Water Security, 3, 1–8, 2018.
Wilkinson, C.: British logbooks in UK archives, 17th–19th cen-turies – a survey of the range, selection and suitability of Britishlogbooks and related documents for climatic research, ClimaticResearch Unit, School of Environmental Sciences, University ofEast Anglia, Norwich, 2009.
Wilson, R., Tudhope, A., Brohan, P., Briffa, K. R., Osborn, T.,and Tett, S. F. B.: Two-hundred-fifty years of reconstructed andmodeled tropical temperatures, J. Geophys. Res., 111, C10007,https://doi.org/10.1029/2005JC003188, 2006.
Wozniak, T.: Naturereignisse im frühen Mittelalter: Das Zeugnisder Geschichtsschreibung vom 6. bis 11 Jahrhundert, De Gruyter,Berlin, 2020.
Xiao, L., Fang, X., and Zhang, X.: Location of rainbelt of Meiyuduring second half of 19th Century to early 20th Century, Scien-tia Geographica Sinica, 28, 385–389, 2008.
Xoplaki, E., Maheras, P., and Luterbacher, J.: Variability of climatein Meridional Balkans during the periods 1675–1715 and 1780–1830 and its impact on human life, Climatic Change, 48, 581–615, 2001.
Xoplaki, E., Luterbacher, J., Paeth, H., Dietrich, D., Steiner,N., Grosjean, M., and Wanner, H.: European spring and au-tumn temperature variability and change of extremes overthe last half millennium, Geophys. Res. Lett., 32, L15713,https://doi.org/10.1029/2005GL023424, 2005.
Yao, C. S.: A statistical approach to historical records of flood anddrought, J. Appl. Meteorol., 21, 588–594, 1982.
Yao, S. Y.: The geographical distribution of floods and droughts inChinese history, 206 B.C.–A.D. 1911, The Far Eastern Quarterly,2, 357–378, 1943.
Yi, L., Yu, H. J., Ge, J. Y., Lai, Z. P., Xu, X. Y., Qin, L., andPeng, S. Z.: Reconstructions of annual summer precipitationand temperature in north-central China since 1470 AD based ondrought/flood index and tree-ring records, Climatic Change, 110,469–498, 2012.
Yin, J., Su, Y., and Fang, X. Q.: Relationships between temperaturechange and grain harvest fluctuations in China from 210 BC to1910 AD, Quatern. Int., 355, 153–163, 2015.
Zaiki, M., Grossman, M. J., and Mikami, T.: Document-based re-construction of past climate in Japan, PAGES News, 20, 82–83,2012.
Zhang, D.: Winter temperature changes during the last 500 years inSouth China, Chinese Sci. Bull., 25, 497–500, 1980.
Zhang, D.: Preliminary analyses of the weather and climate duringdust storms in the historical time, Sci. China Ser. B, 24, 278–288,1984.
Zhang, D.: A Compendium of Chinese Meteorological Records ofthe Last 3,000 Years, Jiangsu Education Press, Nanjing, 2004.
Zhang, D. and Liu, C. J.: Continuation (1980–1992) to “YearlyCharts of Dryness/Wetness in China for the Last 500-year Pe-riod”, Meteorological Monthly, 19, 41–46, 1993.
Zhang, D. and Liu, C. Z.: Reconstruction of summer temperatureseries (1724–1903) in Beijing, Kexue Tongbao, 32, 1046–1049,1987.
Zhang, D. and Liu, Y.: A new approach to the reconstruction of tem-poral rainfall sequences from 1724–1904 Qing dynasty weatherrecords for Beijing, Quaternary Sci., 22, 199–208, 2002.
Zhang, D. and Wang, P.-K.: Reconstruction of the eighteenth cen-tury summer monthly precipitation series of Nanjing, Suzhou,and Hangzhou using the Clear and Rain Records of Qing Dy-nasty, J. Meteorol. Res.-PRC, 3, 261–278, 1989.
Zhang, D. and Wang, P.-K.: Reconstruction of the 18th centurysummer monthly precipitation series of Nanjing, Suzhou andHangzhou using Clear and Rain Records of Qing dynasty, Quar-terly Journal of Appled Meteorology, 1, 260–270, 1990.
Zhang, D., Liu, C., and Jiang, J.: Reconstruction of six regionaldry/wet series and their abrupt changes during the last 1000 yearsin East China, Quaternary Sci., 17, 1–11, 1997.
Zhang, D., Lee, X. C., and Liang, Y. Y.: Continuation (1993–2000)to “Yearly Charts of Dryness/Wetness in China for the Last 500-year Period”, Journal of Applied Meteorological Science, 14,379–384, 2003.
Zhang, J. C. and Crowley, T. J.: Historical climate records in Chinaand reconstruction of past climates, J. Climate, 2, 833–849, 1989.
Zhang, J. C. and Zhang, X. G.: Climatic fluctuations during the last500 years in China and their interdependence, Acta Meteorolog-ical Sinica, 37, 49–57, 1979.
Zhang, P. Y. and Gong, G. F.: Some characteristics of climate fluc-tuations in China since 16th century, Acta Geographica Sinica,46, 238–247, 1979.
Zheng, J. Y. and Zheng, S. Z.: An analysis on cold/warm anddry/wet in Shandong Province during historical times, Acta Ge-ographica Sinica, 48, 348–357, 1993.
https://doi.org/10.5194/cp-17-1273-2021 Clim. Past, 17, 1273–1314, 2021

1314 D. J. Nash et al.: Climate indices in historical climate reconstructions
Zheng, J. Y., Wang, W. C., Ge, Q.-S., Man, Z. M., and Zhang, P.Y.: Precipitation variability and extreme events in eastern Chinaduring the past 1500 years, Terr. Atmos. Ocean. Sci., 17, 579–592, 2006.
Zheng, J. Y., Ge, Q. S., Fang, Z. Q., and Zhang, X. Z.: Comparisonon temperature series reconstructed from historical documentsin China for the last 2000 years, Acta Meteorologica Sinica, 65,428–439, 2007.
Zheng, S. Z., Zhang, F. C., and Gong, G. F.: Preliminary analysisof moisture condition in southeastern China during the last twothousand years, in: Proceedings of Symposium on Climatic Vari-ations and Long-term Forecasting, Science Press, Beijing, 1977.
Zhogova, M. L.: Klimaticheskie zakonomernosti na territorii Rossiiv Trudah K.S. Veselovskogo [Climate Regularities of Russia inthe Works of K. S. Veselovsky], Natural Sciences: History ofNatural Science, 1, 160–167, 2013.
Zhou, Q., Zhang, P., and Wang, Z.: Reconstruction of annual wintermean temperature series in Hefei area during 1973–1991, ActaGeographica Sinica, 49, 332–337, 1994.
Zhu, C.: Climate pulsations during historical times in China, Geogr.Rev., 16, 274–281, 1926.
Zhu, C. and Wang, M.: Phenology, Science Press, Beijing, 1973.Zhu, K.: A preliminary study on climate change in China in the last
5000 years, Scientia Sinica Mathematica, 16, 168–189, 1973.
Clim. Past, 17, 1273–1314, 2021 https://doi.org/10.5194/cp-17-1273-2021