
Climate Change Update For the EMTF, March 6th meeting climate... · 2013-04-02 · Climate Change...
53
Climate Change Update Prepared for the Saskatoon Energy Management Task Force, March 6, 2013 By Peter Prebble Director of Environmental Policy Saskatchewan Environmental Society This slide show was prepared strictly for educational and not for profit purposes.
Transcript of Climate Change Update For the EMTF, March 6th meeting climate... · 2013-04-02 · Climate Change...

Climate Change Update Prepared for the Saskatoon Energy
Management Task Force, March 6, 2013
By Peter Prebble Director of Environmental Policy
Saskatchewan Environmental Society This slide show was prepared strictly for educational
and not for profit purposes.

Source: NASA Goddard Space Flight Centre Accessed in January 2013

Climate change influences take place within the context of natural climatic patterns such as the El Niño-Southern Oscillation
Source: National Climatic Data Centre of the U.S. National Oceanic and Atmospheric Administration

These charts display the key long-lived greenhouse gases responsible for climate change due to their radiative forcing. Together these gases account for about 96% of
the direct radiative forcing by long-lived greenhouse gases since 1750. Source: National Oceanic and Atmospheric Administration Annual Greenhouse Gas Index, 2012 (James H. Butler, NOAA
Earth System Research Laboratory)
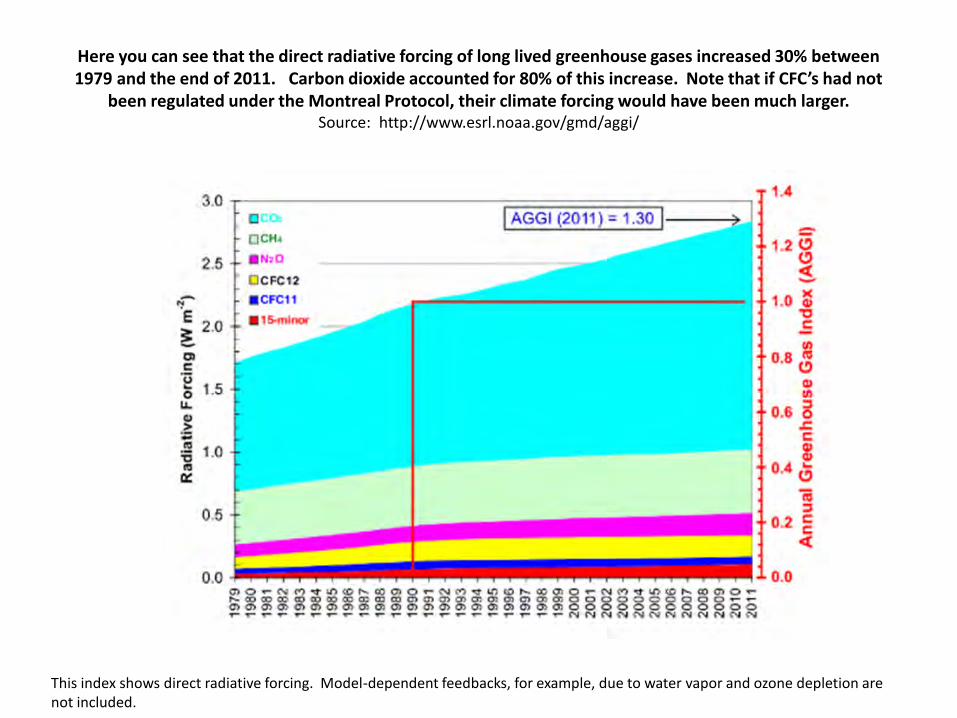
Here you can see that the direct radiative forcing of long lived greenhouse gases increased 30% between 1979 and the end of 2011. Carbon dioxide accounted for 80% of this increase. Note that if CFC’s had not
been regulated under the Montreal Protocol, their climate forcing would have been much larger. Source: http://www.esrl.noaa.gov/gmd/aggi/
This index shows direct radiative forcing. Model-dependent feedbacks, for example, due to water vapor and ozone depletion are not included.

Key Trends
• The years 2001 to 2012 represents 12 of the 14
warmest years globally in the 133 period of record.
• The global annual temperature has increased at an
average rate of 0.16 degrees Centigrade per decade
since 1970.
• 2010 -2012 mark the 34th, 35th, and 36th consecutive
year respectively with global temperatures above the
20th century average. • (Source for the information above: National Oceanic and Atmospheric Administration, State
of the Climate: Global Summary Information - December 2011 and December 2012)

2010 tied for the 2nd warmest year on record
• 2010 tied 2005 as the warmest year on record. • In 2010 nineteen countries set new national temperature
highs. • Temperatures are clearly reaching the maximum
tolerable level for being outdoors. • Of note was the record high set in Kuwait in 2010: 52.6
degrees Centigrade.
Source for temperature records listed above include:
The World Bank. Adaptation to a Changing Climate in the Arab Countries, Editor: Dorte Verner. Met Office: Hadley Centre. Evidence: The State of the Climate, 2010, page 18 NOAA State of the Climate: Global Summary Information, December 2012 • c

One of the key events in 2010 was the Russian heat wave. Russia experienced record high temperatures, extensive forest fires and a record heat wave that claimed almost 5,000 lives in Moscow alone. Moscow
recorded a new high of 37.2 degrees C In the photo below, Moscow's landmarks, including the Kremlin and St Basil's Cathedral, are shrouded in a thick, acrid haze.
Firefighters battled to prevent flames encroaching on the Russian capital. Moscow recorded 14,340 deaths in July 2010, up 4,824 from July 2009, amidst this major heat wave. Source: “Russian heatwave kills 5,000 as fires rage out of control” by Damien McElroy, The Telegraph, August 6, 2010.
Photo: AP Source: www.telegraph.co.uk/news/worldnews/europe/russia7931206/Russian-heatwave-ki....August 6, 2010
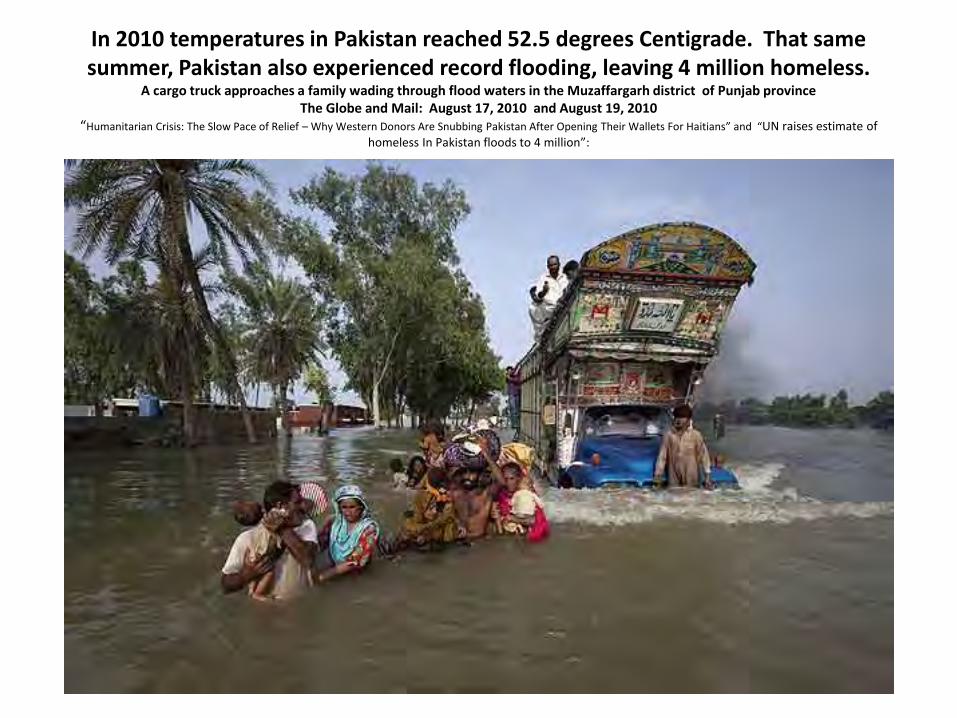
In 2010 temperatures in Pakistan reached 52.5 degrees Centigrade. That same summer, Pakistan also experienced record flooding, leaving 4 million homeless.
A cargo truck approaches a family wading through flood waters in the Muzaffargarh district of Punjab province The Globe and Mail: August 17, 2010 and August 19, 2010
“Humanitarian Crisis: The Slow Pace of Relief – Why Western Donors Are Snubbing Pakistan After Opening Their Wallets For Haitians” and “UN raises estimate of homeless In Pakistan floods to 4 million”:

A few global 2011 temperature highlights
• 2011 tied with 1997 as the 11th warmest year on record. The 2011 global average land surface temperature was 0.8°C above the 20th century average of 8.5°C, and ranked as the eighth warmest on record. The 2011 global average ocean temperature was 0.40°C above the 20th century average of 16.1°C, and ranked as the 11th warmest on record.
• The period July 2011 to June 2012 set a new temperature high in the contiguous United States. In 2011 drought spread across much of the U.S. from Florida to Arizona.
• Kuwait set yet another temperature record in 2011: 53.5 degrees C.

In 2012 the US drought became even more extensive. At one point in July 2012, 88 percent of the corn-growing region of the United States was affected by heat and
drought conditions. Credit: USDA Source: The Guardian, October 12, 2012

Australia faced more extreme weather in January 2013 setting a continent-wide temperature high.

In the second week of January, 2013 bush fires raged in southern Australia. Australian states like New South Wales exceeded 45 degrees Centigrade and instituted a new category to warn the public of fire risk that goes beyond extreme: “Catastrophic”.
Source: “Terrified family clings to dock for hours as wildfire rips through town and destroys their home” Associated Press and National Post January 10, 2013

This photo, taken as bush fires ravaged parts of Tasmania, may capture one of the moments that shifts public attitudes towards climate change in Australia. In it, the Holmes family is
pictured clinging to a wooden jetty in Dunalley, as wildfire destroys their home. Source: Associated Press and National Post January 10, 2013
Photo by Tim Holmes

The United Kingdom has been experiencing more precipitation since the turn of the century, and has also been breaking records for the amount of rainfall in a 24 hour time period. A record
for maximum rainfall in 24 hours was set in 2007. Then in 2009 a new record - 12.3 inches of rainfall in 24 hours – was set in Cumbria, U.K.
Source: Climate Progress, November 22, 2009

2011 and 2012 were two years of extreme weather in the United Kingdom – demonstrating how climate change can be an important factor in both increased
drought and more intense rainfall events. Source: The Observer, December 29, 2012

2012 was the wettest year in recorded history for England and the 3rd wettest for Wales. Four of the five wettest years since records were kept in
the United Kingdom have occurred since the year 2000. Source: UK Met Office, January 8, 2013 The data displayed below is for the UK.
1 2000 1337.3 mm
2 2012 1330.7 mm
3 1954 1309.1 mm
4 2008 1295.0 mm
5 2002 1283.7 mm
Precipitation Year

One part of the world where big changes are occurring is the Arctic. Here you see annual
average near-surface air temperature anomalies in the Arctic and sub-Arctic for the first decade
of the 21st century (2001-11) relative to the baseline period of 1971-2000. Data is from
NOAA/ESRL, Boulder, CO: http://www.esrl.noaa.gov/psd/.
Source: Arctic Report Card, 2012

In 2012 Arctic sea ice extent hit a new record low seasonal minimum. It is noteworthy that this
record sea ice melt did not happen in a year with record high average global temperatures,
underlining the reality that sweeping changes are occurring in the Arctic.
Source: Arctic Sea Ice News and Analysis Sept. 19, 2012

Megadroughts have hit the Amazon Rainforest in 2005 and again in 2010. The megadrought in the Amazon rainforest during the summer of 2005 caused widespread damage and die-
offs to trees, as depicted in this photo taken in Western Amazonia in Brazil. Image credit: NASA/JPL-Caltech “Study Finds Severe Climate Jeopardizing Amazon Forest” January 17, 2013

Aerial view of a drought affected area within the Amazon basin in November 2010 in Manaus, Brazil. A severe drought dropped water levels to its all-time low on the
Negro River, a major tributary of the Amazon river. Source: The Guardian, June 28, 2011 Photo Credit: Roadrigo Baleia/Getty Images

This photo shows women who live in the Loima hills of Kenya collecting water for cattle. Due to a lack of rain people have to go to greater and greater lengths to find water. The United Nations predicts a significant drop
in food production from rain fed agriculture in several African countries by 2020, adversely impacting food security on the continent. This is one of the important ways Africa is being impacted by climate change.
Source: Roger Job, The Guardian, September 2009.

As the atmosphere warms, it is able to hold more water vapour, with the result that flooding and severe weather is being experienced more widely across the world.
This is a significant factor in the growing number of climate related disasters. Source for the chart below: Web Site of the United Nations International Strategy for Disaster Reduction

A growing number of intensive rainfall events have occurred around the world over the past decade. Here for example, residents of Mumbai, India hang onto a rope to
cross the street during heavy rains in July 2005 that broke world records for total rainfall in 24 hours (94.42 cm)
The Hindu, July 28, 2005 (Mumbai bureau)

In the photo below flood victims move through deep water in their Bangkok neighbourhood. Outside Bankok in 2011 hundreds of factories were forced to close in the central Thai province
of Ayutthaya and Nonthaburi. Photograph by: Paula Bronstein, Getty Images
Source: Star Phoenix, October 28, 2011

Saskatchewan has also been hit by increased flooding, and intensive rainfall events. This photo shows much of Roche Percee, a village of 147 people in southeast Saskatchewan, under water. This event followed a
weekend of very heavy rains and the unavoidable release of water from major dams in the area. Source: CBC Saskatchewan, June 20, 2011 ‘Tiny town submerged by Saskatchewan flood’

SASKATCHEWAN’S PROVINCIAL DISASTER
ASSISTANCE PROGRAM SPENDING
Fiscal year ending March 31 Total spending
2002 $1,500,000 2003 $1,675,000 2004 $ 618,000 2005 $ 276,000 2006 $15,154,000 2007 $ 9,866,000 2008 $31,378,000
2009 $14,486,000
Spending on provincial disaster assistance in Saskatchewan has increased steadily since 2005. The increases shown in this chart have continued in 2010, 2011 and 2012. Chart prepared by Peter Prebble and Graham Barber

Another impact of climate change is a sharp decline in glaciers across much of the world. Glaciers in the Alps, for example, have lost approximately half their mass and
30% of glaciated areas have disappeared. The photo below is of the Otztal Mountains, South Tyrol, Central Alps. Photo Credit: HerbalGram Number 81, 2009 and Global
Observation Research Initiative, 2009.

Annual net surface mass balance since 1960 of four glaciers in the Queen Elizabeth Islands,
Nunavut, Canada, showing the sharp acceleration in mass loss rate since 2005 and the record
mass loss in 2010-11. Data is from the World Glacier Monitoring Service.
Published in the Arctic Report Card 2012, Figure 5.6
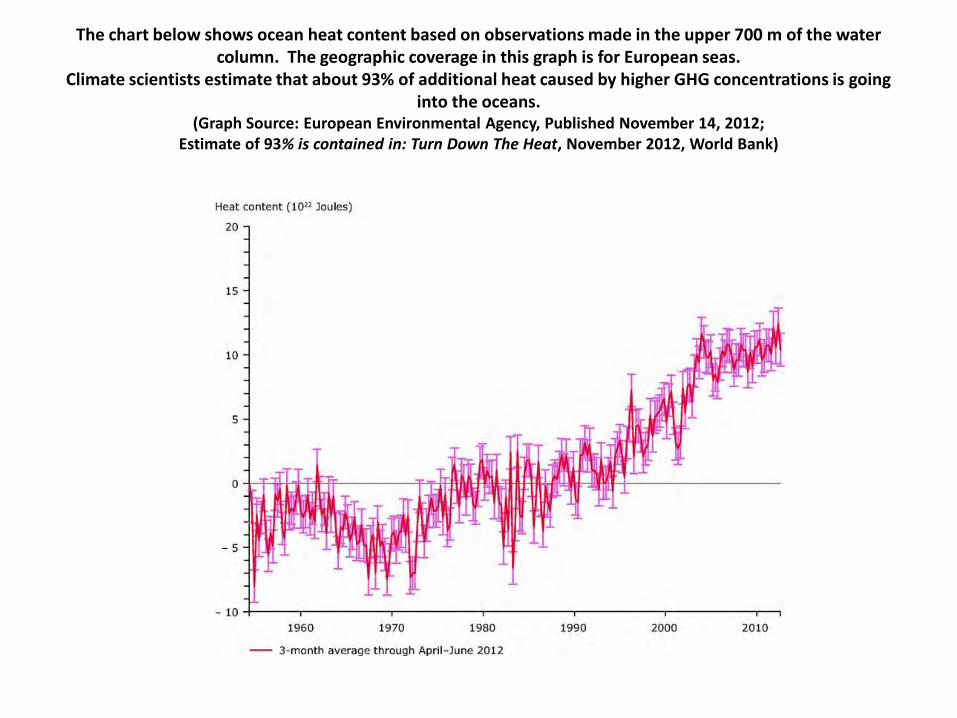
The chart below shows ocean heat content based on observations made in the upper 700 m of the water column. The geographic coverage in this graph is for European seas.
Climate scientists estimate that about 93% of additional heat caused by higher GHG concentrations is going into the oceans.
(Graph Source: European Environmental Agency, Published November 14, 2012; Estimate of 93% is contained in: Turn Down The Heat, November 2012, World Bank)

One of the worrisome impacts of climate change is the increased melting on Greenland that has become
evident in the past few years.
• Greenland is losing ice mass at five times the rate of the 1990’s.
• A Landmark international study released in Science in Nov 2012 into effects of climate change estimated that more than 4tn tonnes of ice from Greenland and Antarctica has melted in the past 20 years. It has flowed into the ocean, pushing up sea levels.

Contributions To Global Sea Levels Since 1972 Note the importance of thermal expansion and the sharp increase in contributions
from glacier melt and the melt of the Greenland ice sheet.
Source: European Environmental Agency Published Nov 16, 2012 Publication: Climate change, impacts and vulnerability in Europe 2012
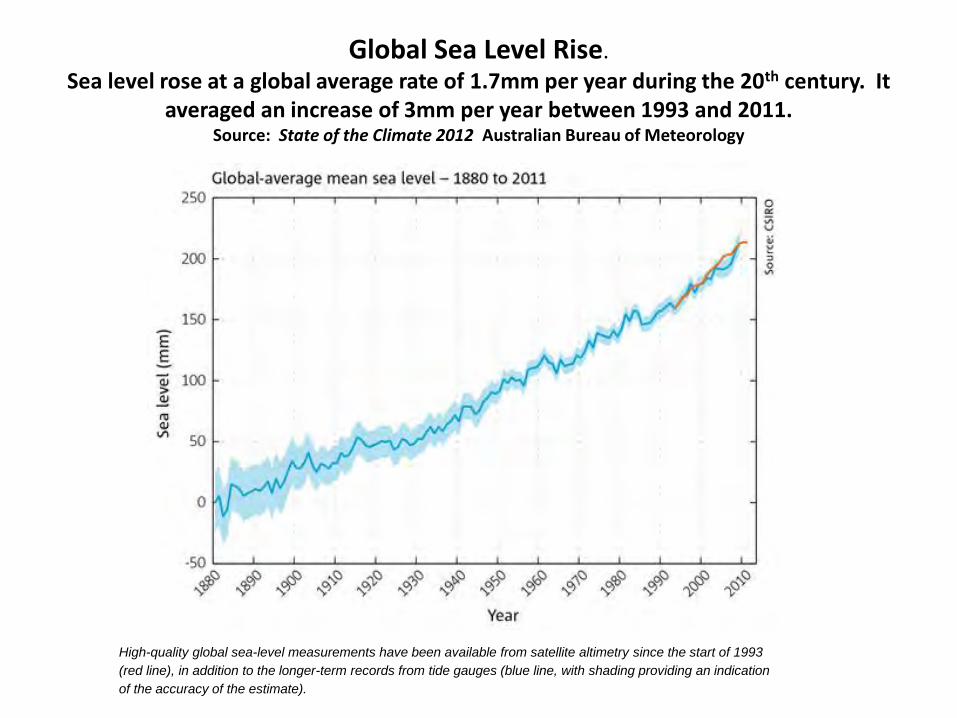
Global Sea Level Rise.
Sea level rose at a global average rate of 1.7mm per year during the 20th century. It averaged an increase of 3mm per year between 1993 and 2011.
Source: State of the Climate 2012 Australian Bureau of Meteorology
High-quality global sea-level measurements have been available from satellite altimetry since the start of 1993
(red line), in addition to the longer-term records from tide gauges (blue line, with shading providing an indication
of the accuracy of the estimate).
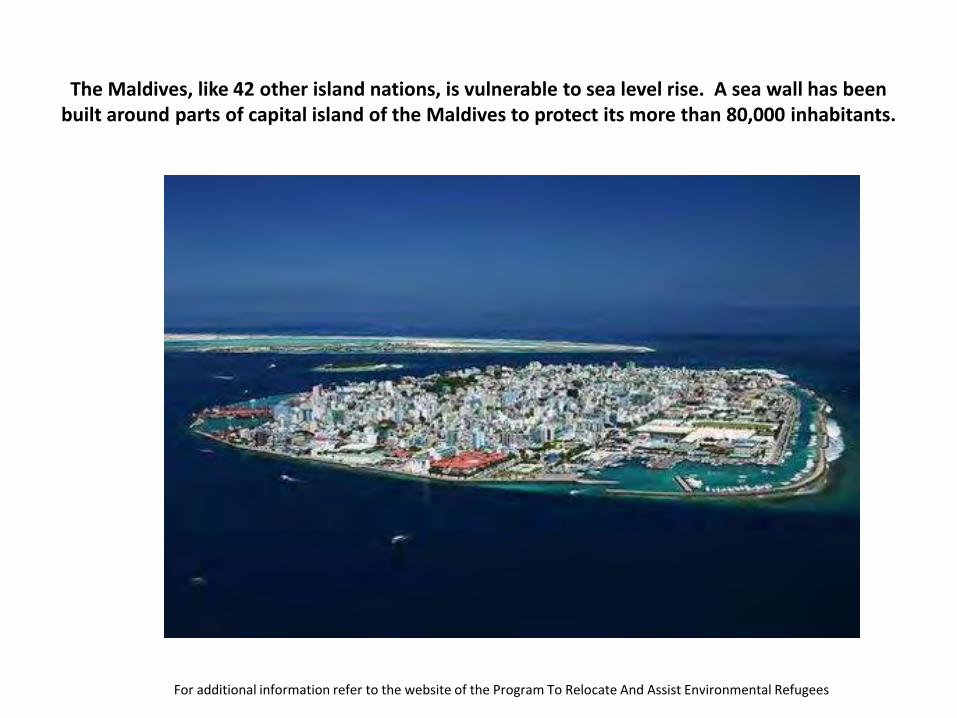
The Maldives, like 42 other island nations, is vulnerable to sea level rise. A sea wall has been
built around parts of capital island of the Maldives to protect its more than 80,000 inhabitants.
For additional information refer to the website of the Program To Relocate And Assist Environmental Refugees

To highlight the risk of sea level rise to his nation, the President of the Maldives held an underwater Cabinet meeting in 2009.
Source: Wade Norris. On February 7, 2012

Impacts come not only from higher sea levels, but from the surge of ocean waves and the resulting erosion. The photo below shows coastal erosion at Happisburg, Norfolk, England. The effects of erosion from sea surge is claiming land at a rapid rate. The U.K. government’s
environmental agency ‘Natural England’ has stated that nine miles of sea defenses between the villages of Eccles and Winterton are unsustainable “beyond the next 20-50 years.”
Source: The Guardian, April 17, 2008. Photo Credit: Graeme Robertson

Remnants of displaced homes on the edge of Ghoramara island in the Sundarbans. Only about one third of the island remains above sea level.
Photograph: Peter Caton, Content and photo from: The Guardian, January 14, 2010
Shukdev Das: 'I live in Ghoramara. I lost my house due to the rising sea water. We are certain that in the near future our island will also be under water. We don't know where we shall live‘. Photograph: Peter Caton, Citation and photograph from: The Guardian, January 14, 2010

Past and Future Sea Level Projections
Source: The Copenhagen Diagnosis, November 2009

Observed changes in ocean acidity (pH) compared to the concentration of carbon dioxide dissolved in seawater (p CO2) alongside the atmospheric CO2 record since 1956. The increasing
acidity of the oceans has negative implications for marine life. (Source: November 2012 World Bank Report, Turn Down the Heat, Figure 11
Additional explanatory note: A decrease in pH indicates an increase in acidity.)

Coral reefs took their second worst beating on record in 2010 because of near record high summer water temperatures over much of the world’s tropical oceans. This photo shows coral in Indonesia’s Wakatobi archipelago – a critical element of Indonesia’s economy. 70% was totally or partially bleached in 2010.
Source: Climate Change Hots Up In 2010 (Gallery, The Guardian, June 28, 2011)

Climate change is forcing many species in the Northern Hemisphere to shift their habitat northward. For example, the Scottish Crossbill is now confined to the very north of Scotland. Graham Madge, spokesperson for The Royal Society for the Protection of Birds (U.K.) notes that as Europe continues to warm, only Iceland
offers a homeland for the birds. However, the Crossbill will have difficulty flying the required distance. Source: The Guardian, March 1, 2009

IPCC Projected Extinction Risk
• “Approximately 20-30% of plant and animal species assessed so far are likely to be at increased risk of extinction if increases in global average temperature exceed 1.5-2.5 Centigrade.”
(Source: Intergovernmental Panel on Climate Change. IPCC 2007, Impacts & Adaptation, Summary for Policy Makers section)

Climate Change Scenario Maps for the Prairies in the 2020’s, 2050’s and 2080’s showing minimum, median and maximum projections for changes in mean annual
temperature. Source: Natural Resources Canada. From Impacts To Adaptation: Canada In A Changing Climate, 2007 Figure 9, Page 288

Scenarios For GHG Emissions Growth And Corresponding Global Surface Warming
Source: Intergovernmental Panel on Climate Change. IPCC 2007 The Physical Science Basis: SPM5

IPCC Estimates of the Range of Global Mean Equilibrium Surface Temperature Increases Above Pre-Industrial Temperatures (in degrees
Centigrade) For Different Levels of CO2 Equivalent Concentrations
CO2 equivalent Best Guess Likely Range 350 parts per million 1.0 C 0.6 - 1.4 C
450 parts per million 2.1 C 1.4 - 3.1 C
550 parts per million 2.9 C 1.9 - 4.1 C
650 parts per million 3.6 C 2.4 – 5.5 C
Source: Intergovernmental Panel for Climate Change: The Physical Science Basis, 2007 Summary of Table 10.8 on page 826.

Observed Global Carbon Dioxide Emissions From Fossil Fuel Burning And Cement Production Compared With Scenarios Predicted By IPCC Scientists In 2000
This slide demonstrates that the growth in greenhouse gas emissions is keeping pace with the very highest scenario for emission growth forecast by the Intergovernmental Panel on Climate Change. If this pattern continues, it increases the likelihood
that temperature increases by the end of the century will be at the higher end of the IPCC forecast.
Source: The Copenhagen Diagnosis: Updating The World On The Latest Climate Science November 2009

Global Emissions Pathways To Give 67% Chance Of Limiting Global Warming To 2 Degrees C.
Source: The Copenhagen Diagnosis, Figure 22, November 2009
Examples of global emission pathways where cumulative CO2 emissions equal 750 Gt during the time period 2010-2050 (1 Gt C = 3.67 Gt CO2). At this level, there is a 67% probability of limiting global warming to a maximum of 2°C. The graph shows that the later the peak in emissions is reached, the steeper their subsequent reduction has to be. The figure shows variants of a global emissions scenario with different peak years: 2011 (green), 2015 (blue) and 2020 (red). In order to achieve compliance with these curves, maximum annual reduction rates of 3.7 % (green), 5.3 % (blue) or 9.0 % (red) would be required (relative to 2008). (Source: German Advisory Council on Global Change; WBGU 2009).

Schematic representation of a two-stage model set-up to quantify the feasible 2020
emission windows to stay below 2 °C. Cutting global GHG emissions significantly by
2020 is key to avoiding dangerous climate change Source: “2020 emissions levels required to limit warming to below 2 °C” Nature Climate Change, December 16, 2012 Joeri Rogelj et al.
Quotes from the study: “Present unconditional emission reduction pledges (under the Copenhagen Accord) would lead to global emissions in 2020 of 55 Gt CO2e yr−1 and thus do not constitute a robust path for limiting global temperature increase to below 2 °C.” “Our emission pathways are at the high end of the literature range of 2 °C-consistent scenarios. This is because our analysis explicitly explores the maximum range of emissions in 2020, rather than exploring cost-optimal pathways.”

If the worst effects of climate change are to be avoided, the long lifetimes of carbon dioxide and nitrous oxide emissions in the atmosphere necessitate much deeper greenhouse gas
reductions than Saskatchewan and Canada are planning to achieve by 2020. The source for the table below is the Carbon Dioxide Information Analysis Web Site. (February, 2012. T.J. Blasing)
GAS
Pre-1750 tropospheric concentration1
Recent tropospheric concentration2
GWP3(100-yr time horizon)
Atmospheric lifetime4(years)
Increased radiative forcing 5 (W/m2)
Concentrations in parts per million (ppm) Carbon dioxide (CO2)
2806 390.57 1 ~ 1004 1.79
Concentrations in parts per billion (ppb) Methane (CH4) 7008 18719/17509 25 124 0.50
Nitrous oxide (N2O)
27010 3239/3229 298 1144 0.18
GAS
Pre-1750 tropospheric concentration1
Recent tropospheric concentration2
GWP3(100-yr time horizon)
Atmospheric lifetime4(years)
Increased radiative forcing 5 (W/m2)
Concentrations in parts per million (ppm) Carbon dioxide (CO2)
280 390.57 1 ~ 1004 1.79
Concentrations in parts per billion (ppb) Methane (CH4) 7008 18719/17509 25 124 0.50
Nitrous oxide (N2O)
27010 3239/3229 298 1144 0.18

A GHG reduction strategy should consider the lifetime of the key greenhouse gases. For example, a 50% reduction in CH4 emissions will stabilize their concentration in
the atmosphere at a slightly reduced level from today. However, for CO2 near elimination is required to stabilize concentrations in the atmosphere, and avert
catastrophic consequences.
• (a) Simulated changes in atmospheric CO2 concentration relative to the present-day for emissions stabilised at the current level (black), or at 10% (red), 30% (green), 50% (dark blue) and 100% (light blue) lower than the current level;
• (b) Simulated changes as in (a) for a trace gas with a lifetime of 120 years, driven by natural and anthropogenic fluxes (nitrous oxide)
• (c) Simulated changes as in (a) for a trace gas with a lifetime of 12 years, driven by only anthropogenic fluxes (example: methane)
Source: FAQ 10.3 Figure 1 Intergovernmental Panel on Climate Change, Working Group 1 (The Physical Science Basis), Chapter 10, page 824

In April of 2012, Maria van der Hoeven, Executive Director of the International Energy Agency warned energy ministers from the world’s biggest economies that
governments are falling badly behind on low-carbon energy installations.
“Our addiction to fossil fuels grows stronger each
year. Many clean energy technologies are available,
but they are not being deployed quickly enough to
avert potentially disastrous consequences.”
(Source for quote and photo:
The Guardian, April 25, 2012 “Governments
failing to avert catastrophic climate change: IEA urges
Ministers attending clean energy summit in London to be
gravely warned about continuing global addiction to
fossil fuels” by Fiona Harvey and Damian Carrington)
On current form, Maria van der Hoeven warned, the world is on track for warming of 6C by the end of the century – a level that would create catastrophe, wiping out agriculture in many areas and rendering swathes of the globe uninhabitable, as well as raising sea levels and causing mass migration.

In November 2012, Dr. Jim Yong Kim, President of the World Bank issued the report: Turn Down The Heat: Why A Four Degree C Warmer World Must Be Avoided. The quote below is from Dr. Kim and is part of the foreword in the World Bank report.
“The 4 degree C scenarios are devastating:
the inundation of coastal cities; increasing
risks for food production leading to higher
malnutrition rates; many dry regions becoming
dryer; wet regions wetter; unprecedented
heat waves in many regions, especially in the
tropics; substantial exacerbated water
scarcity in many regions;…. and irreversible loss
of biodiversity, including coral reef systems.”

Canada’s Changing Greenhouse Gas Reduction Targets. The Government of Canada’s current targets lack the ambition needed for Canada to adequately shoulder its responsibility to avoid
dangerous climate change. Source for the data below: Reality Check: The State of Climate Progress in Canada, October 2012 National
Roundtable on the Economy and the Environment
Canada’s changing targets
Year Target was Set Target Base Year Emissions (Mt CO2e)
Projected Emissions Target (Mt CO2e)
1988 20% below 1988 levels by 2005
588* 470 in 2005*
1990 Remain at 1990 levels by 2000
590 590 in 2000
1993 20% below 1988 levels by 2005
588* 470 in 2005*
1995 66Mt below 1995 levels by 2010
640 574 in 2010
1998 49Mt below 1998 levels by 2010
677 628 in 2010
2002 6% below 1990 levels by 20127
590 555 in 2012
2007 20% below 2006 levels by 20208
719 575 in 2020
2010 17% below 2005 levels by 20209
731 607 in 2020


