
Climate change projections to support natural...
33
GREENHOUSE 2013 Adelaide, October 8 - 11 Climate change projections to support natural resource management planning Penny Whetton, with acknowledgements to Aurel Moise, Jonas Bhend, Louise Wilson, Anthony Rafter, Leanne Webb, Ian Watterson, John Clarke, Tim Erwin, Marie Ekstrom, Kevin Hennessy & others
Transcript of Climate change projections to support natural...

GREENHOUSE 2013 Adelaide, October 8 - 11
Climate change projections to support natural resource management planning
Penny Whetton, with acknowledgements to Aurel Moise, Jonas Bhend, Louise Wilson, Anthony Rafter, Leanne Webb, Ian Watterson, John Clarke, Tim Erwin, Marie Ekstrom, Kevin Hennessy & others
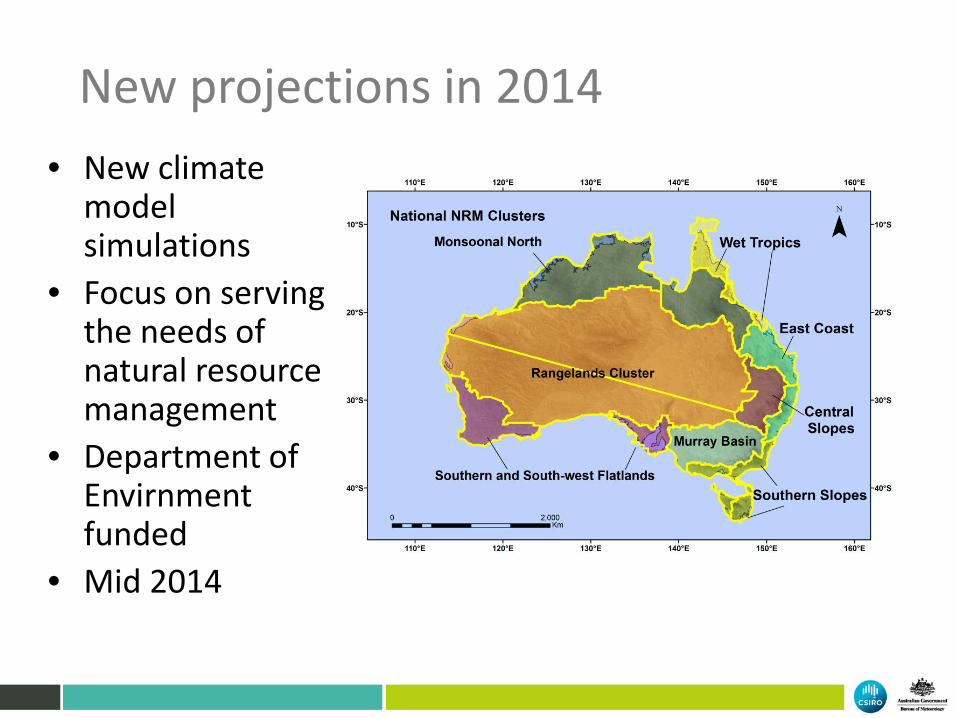
New projections in 2014 • New climate
model simulations
• Focus on serving the needs of natural resource management
• Department of Envirnment funded
• Mid 2014

NRM Planning
Impacts and adaptation
Climate projections
Supporting science
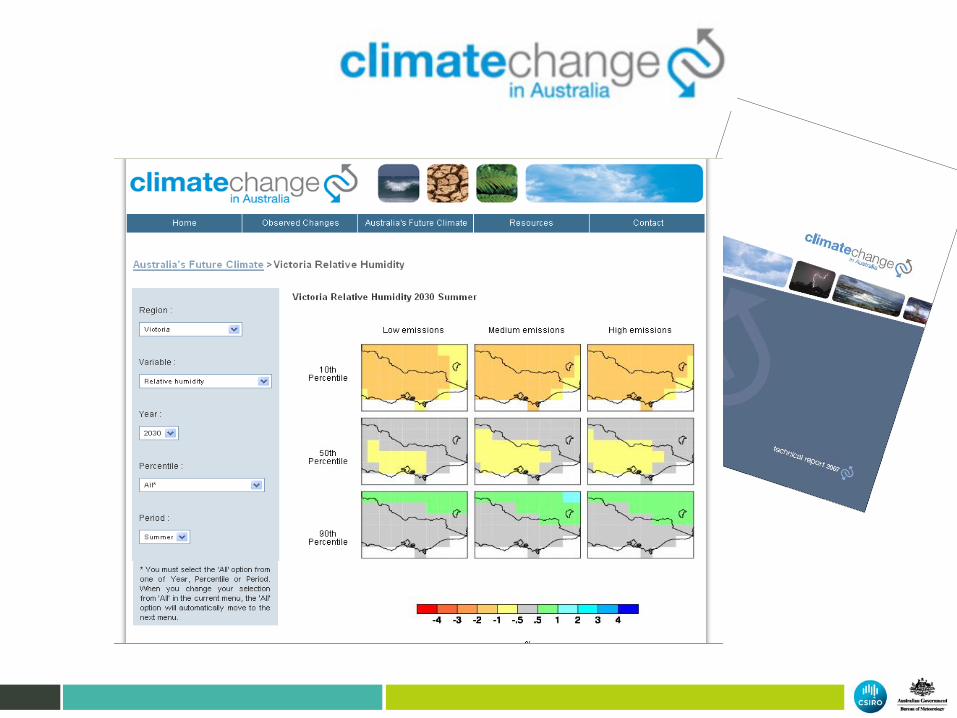
Regional NRM planning for Climate Change

Key elements of NRM projections project
Various emission scenarios and time slices out to 2100
Ranges of plausible changes for multiple variables with explanations about driving processes
Address a range of user needs •NRM planners •NRM impact
researchers •Eventually, every
one else?
Provide users with application-ready locally relevant data sets
Provide framework for existing (incl CMIP3) and future downscaled data sets from various sources
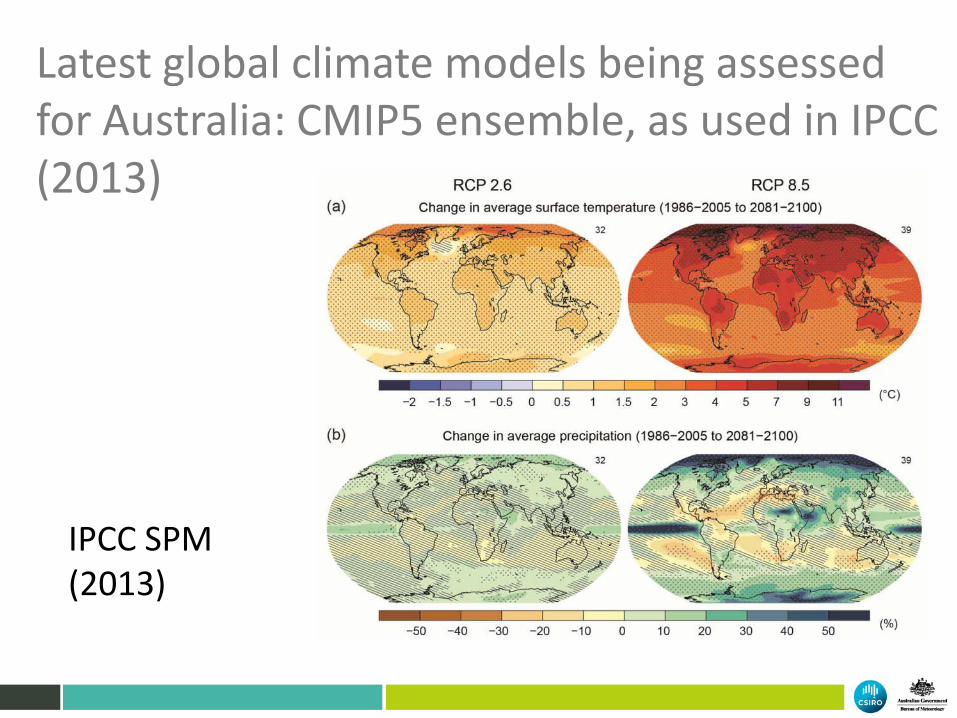
IPCC SPM (2013)
Latest global climate models being assessed for Australia: CMIP5 ensemble, as used in IPCC (2013)

Assessing Biases, seasonality, Variability models (e.g. ENSO), etc. • Most models do well (and
generally a little better than CMIP3)
• IPSL, (some) MIROCS, FGOALS,NorESM and the GISS models are potentially problematic
GCM regional evaluation: Assessment so far
Obs (AWAP) Models: Box&whiskers
Ackn: A. Moise, L. Wilson

Interim annual projected temperate change time series to 2090 for mid-range (RCP4.5; left) and high (RCP 8.5; right)
Understanding interim projection plots
Projected temperature: Rangelands cluster

Projected temperature: 2090, high emissions
Ackn. J. Bhend

Level of confidence in rainfall projections with warmer tones indicating rainfall decrease and cooler tones an increase in rainfall. The intensity of colour indicates the level of model agreement.
Direction of future rainfall change :CMIP5
Ackn: Ian Watterson
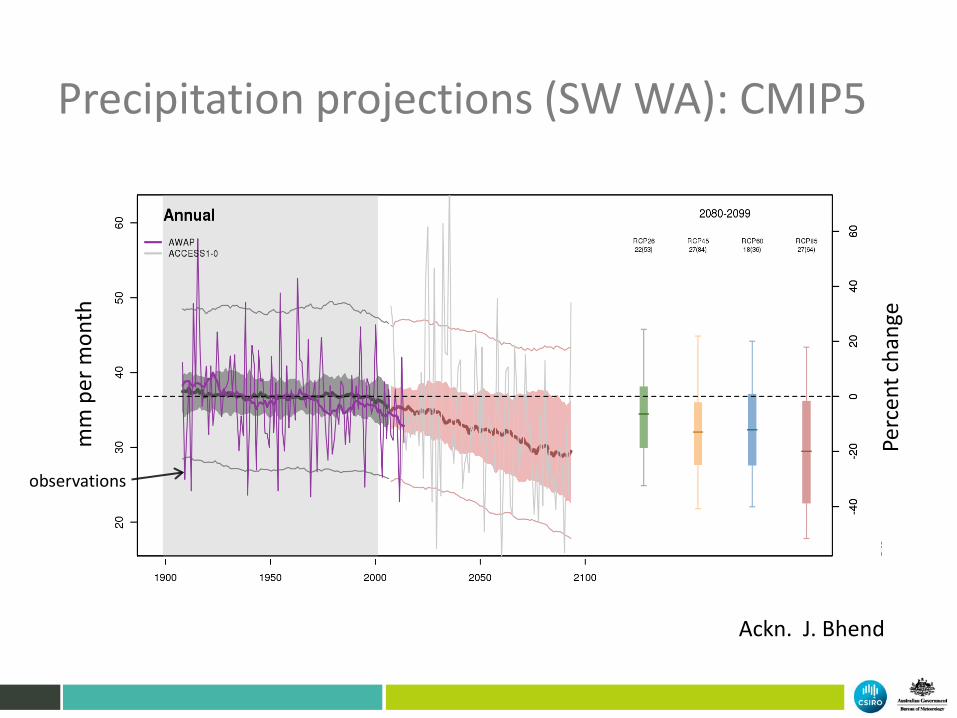
Precipitation projections (SW WA): CMIP5
observations
mm
per
mon
th
Perc
ent c
hang
e
Ackn. J. Bhend

| 12 |
Projected rainfall change: Rangelands
Ackn. J. Bhend
Ackn. J. Bhend
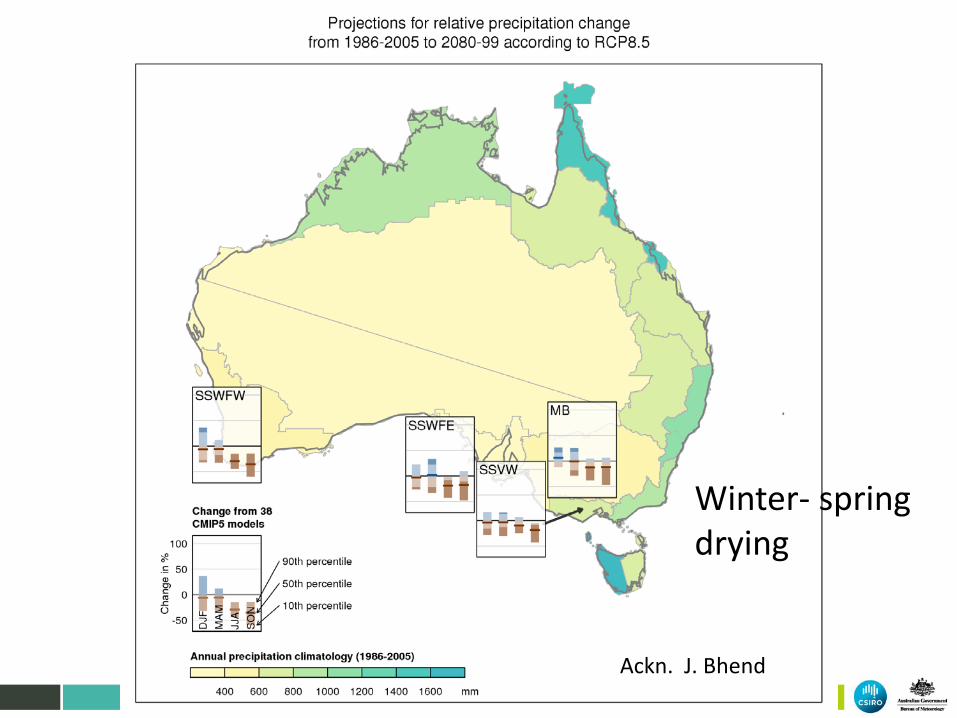
Winter- spring drying

Ackn. J. Bhend
Winter wetting
Ackn. J. Bhend
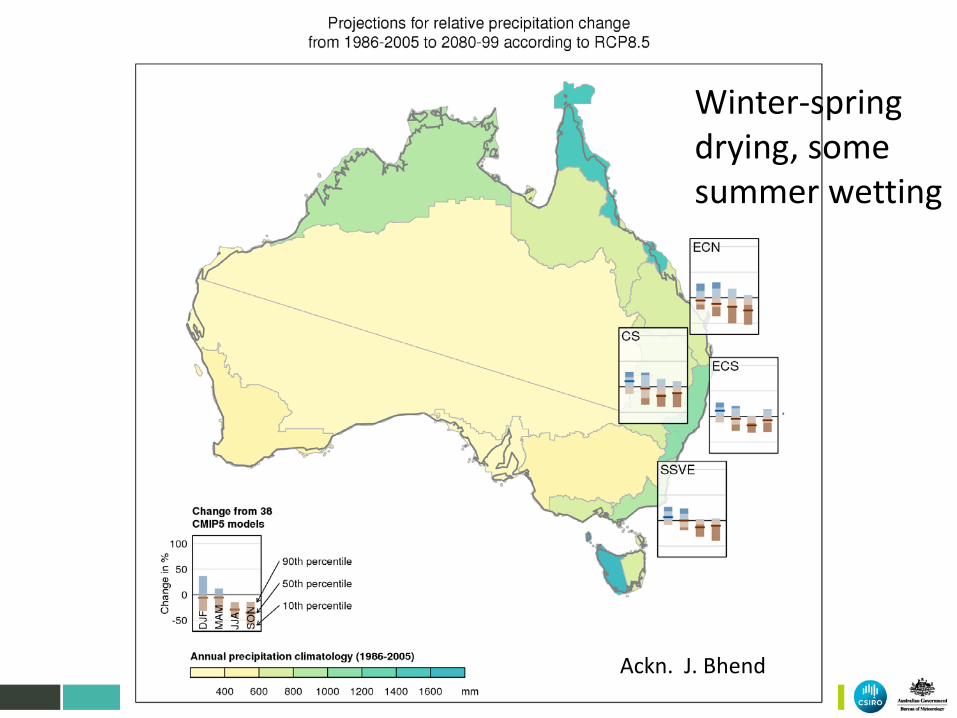
Winter-spring drying, some summer wetting
Ackn. J. Bhend
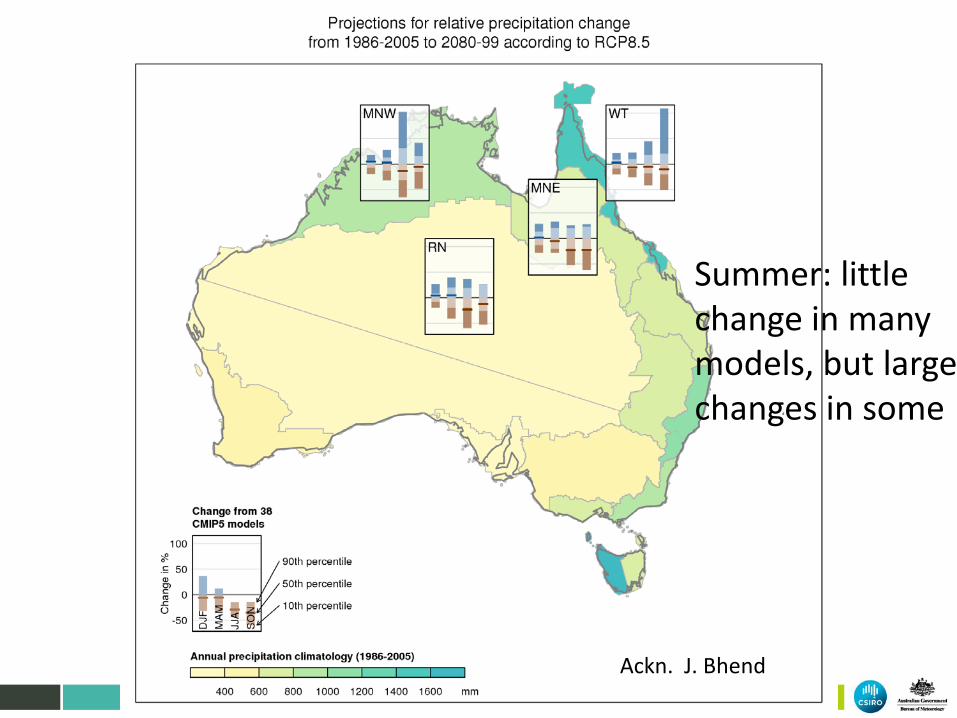
Summer: little change in many models, but large changes in some

Forming ranges of change from CMIP5 ensemble: Some issues to consider
• How to select simulations from the ensemble • Partitioning the ensemble • What is the effect of applying pattern scaling, if
applied? • Should we constrain the observations (effectively
weighting by historical performance)? – Climatological averages – Observed trends
Acknowledgment to Jonas Bhend

Ackn. Jonas Bhend

Forming ranges: summary points
• Most of the time differences between approaches are small
• However, resolution may be important in some smaller regions
• Constraining by model performance may have a significant effect in some cases
• But to generally adopt an approach other than the empirical distribution across all regions does not appear justified at this stage

Comparison with downscaled results (SDM method of Bertrand Timbal, BoM)
Projected changes to extremes

Wettest days (annual) Ackn: L Wilson, T. Rafter& J. Bhend
NRM 0813 | Louise Wilson & Tony Rafter 23 |
All days Wettest day (year) Wettest day (20 years)
Extreme wet days become wetter, even if average conditions don’t change
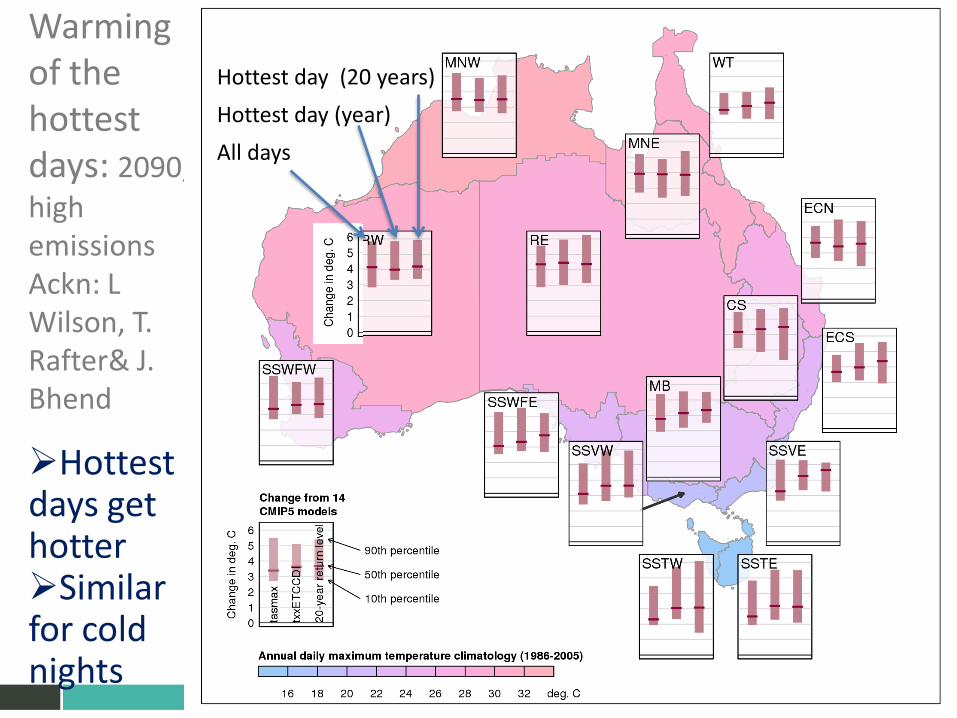
Warming of the hottest days: 2090, high emissions Ackn: L Wilson, T. Rafter& J. Bhend
NRM 0813 | Louise Wilson & Tony Rafter
All days Hottest day (year) Hottest day (20 years)
Hottest days get hotter Similar for cold nights
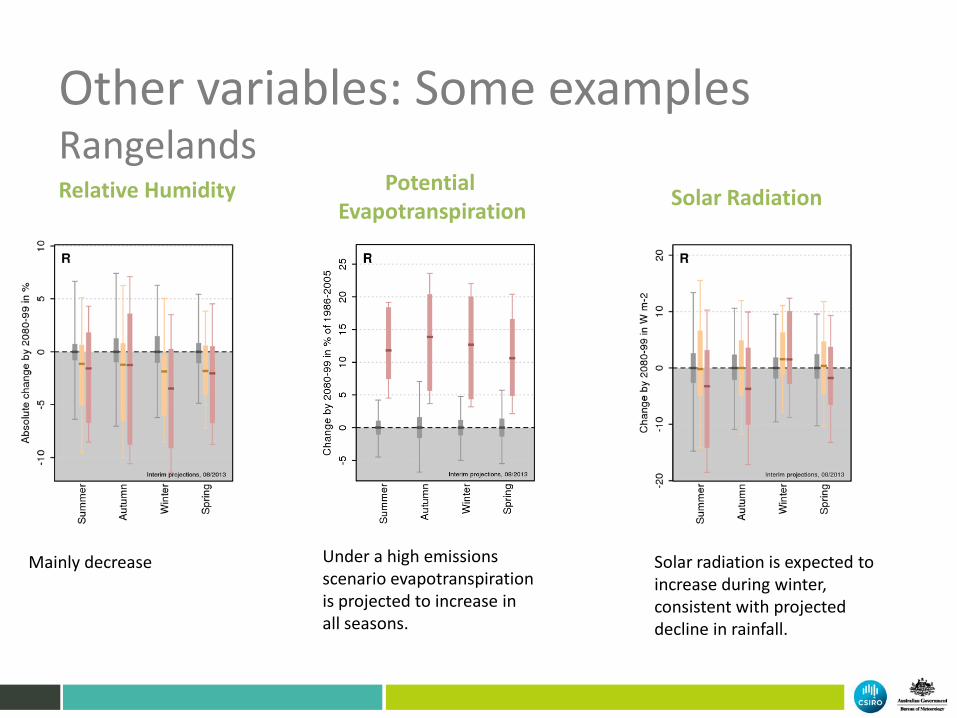
Mainly decrease
Under a high emissions scenario evapotranspiration is projected to increase in all seasons.
Solar radiation is expected to increase during winter, consistent with projected decline in rainfall.
Relative Humidity Potential Evapotranspiration Solar Radiation
Other variables: Some examples Rangelands
• Attended NRM meetings • Contribution to Element 2 project activities • Climate projection user panel
– Climate projection user interviews – Usage theme cluster meetings
• Interim projection statement • Data support and liaison
Assessing user needs
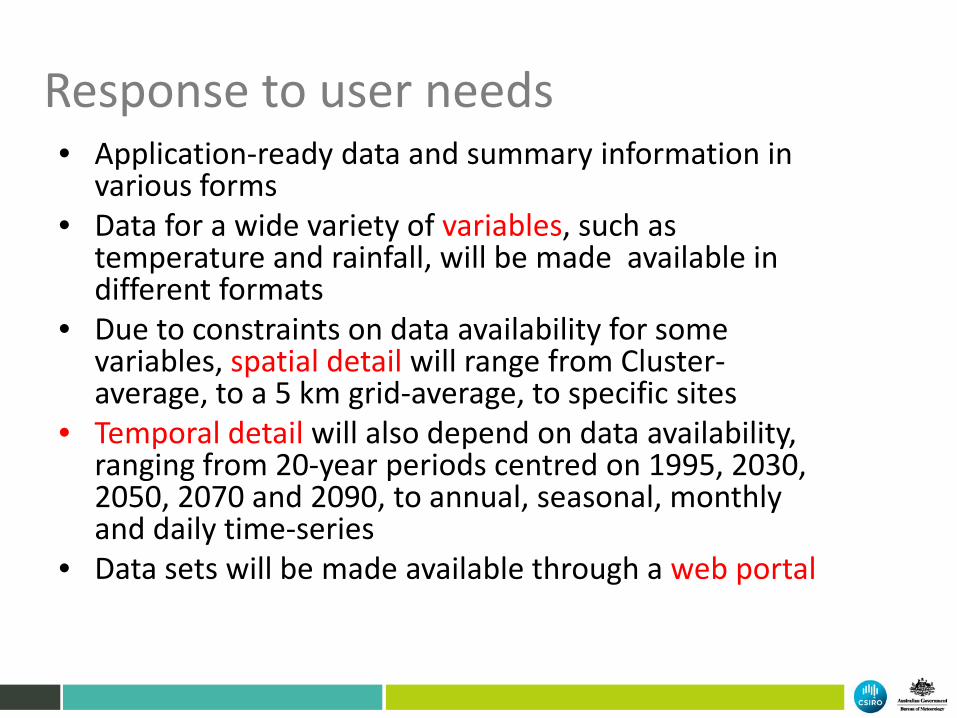
Response to user needs • Application-ready data and summary information in
various forms • Data for a wide variety of variables, such as
temperature and rainfall, will be made available in different formats
• Due to constraints on data availability for some variables, spatial detail will range from Cluster-average, to a 5 km grid-average, to specific sites
• Temporal detail will also depend on data availability, ranging from 20-year periods centred on 1995, 2030, 2050, 2070 and 2090, to annual, seasonal, monthly and daily time-series
• Data sets will be made available through a web portal
Model specific!
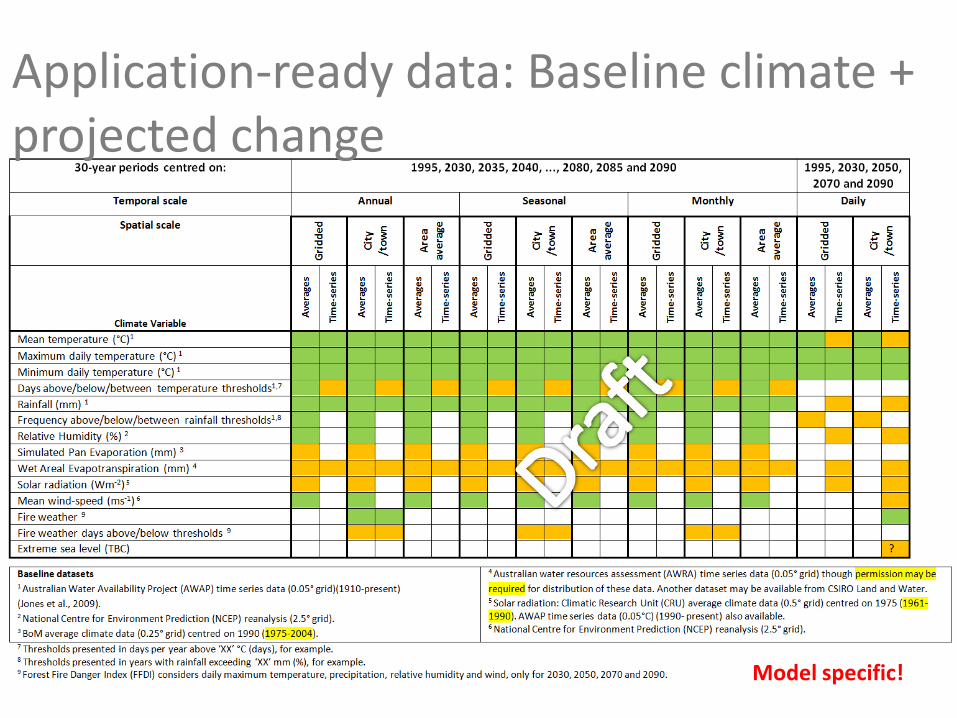
Application-ready data: Baseline climate + projected change
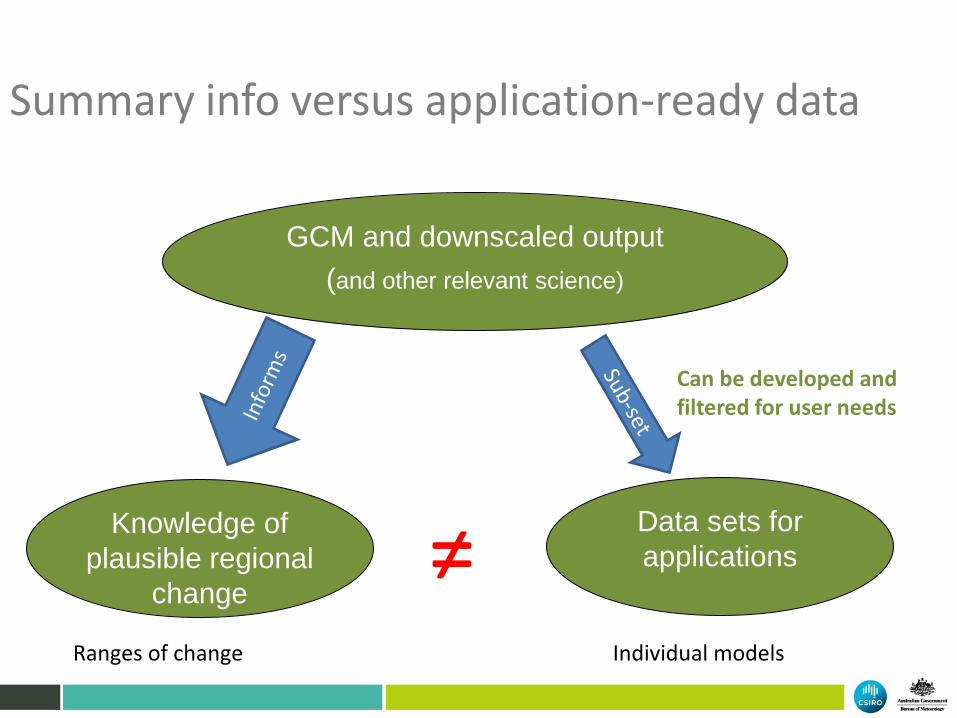
GCM and downscaled output (and other relevant science)
Can be developed and filtered for user needs
≠ Knowledge of plausible regional
change
Data sets for applications
Summary info versus application-ready data
Ranges of change Individual models
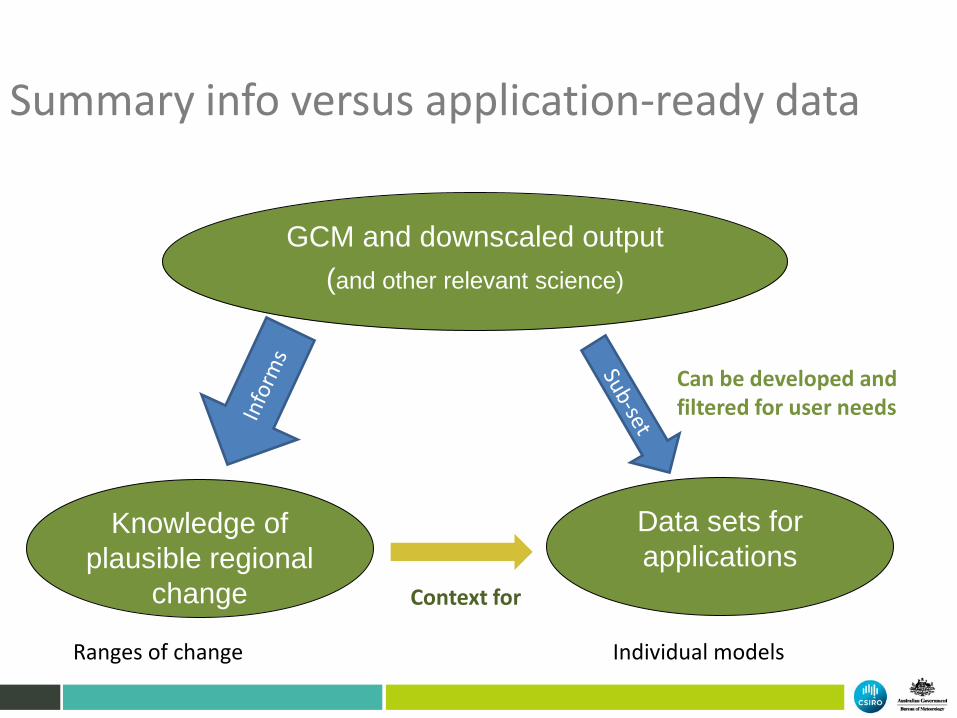
GCM and downscaled output (and other relevant science)
Can be developed and filtered for user needs
Knowledge of plausible regional
change
Data sets for applications
Context for
Summary info versus application-ready data
Ranges of change Individual models

GCM and downscaled output (and other relevant science)
Can be developed and filtered for user needs
Knowledge of plausible regional
change
Data sets for applications
Needs to be representative of
Summary info versus application-ready data
Ranges of change Individual models

Climate Futures software: A tool for developing a small set of individual model–based scenarios, tailored for decision making contexts
• Currently populated
with GCM cases only • Downscaled runs will
classified and available in this system too
• Will allow other climate model ensembles to be seen in the context of CMIP5 results
Acknowledgement to Tim Erwin and John Clarke
To conclude Many challenges presented by our NRM project responsibilities
• Getting the best we can out of CMIP5 • Identifying where downscaled data add value to the climate
change story • For technical users of the downscaled data sets (old and new),
making sure that they these data sets are set in the context of current understanding of regional climate change
Our developing approach • Keep things simple, unless additional complexity adds value • Plausible ranges versus representative applicable data sets • Organising application data sets based on descriptions of
future: Climate Futures • Completion by June 2014 and release sometime after that
Interim results so far, papers and reports to follow