Climate Change, Justice and Sustainability
38
Transcript of Climate Change, Justice and Sustainability


Climate Change, Justice and Sustainability


Ottmar Edenhofer • Johannes WallacherHermann Lotze-Campen • Michael RederBrigitte Knopf • Johannes MüllerEditors
Climate Change, Justice and Sustainability
Linking Climate and Development Policy

EditorsProf. Dr. Ottmar EdenhoferPotsdam Institute for Climate Impact
Research (PIK)Sustainable SolutionsTelegrafenberg A3114473 PotsdamGermany
Dr. Hermann Lotze-CampenPotsdam Institute for Climate Impact
Research (PIK)Climate Impacts and VulnerabilitiesTelegrafenberg A3114473 Potsdam Germany
Dr. Brigitte KnopfPotsdam Institute for Climate Impact
Research (PIK)Sustainable SolutionsTelegrafenberg A3114473 PotsdamGermany
Prof. Dr. Johannes WallacherInstitute for Social and Development StudiesMunich School of PhilosophyKaulbachstraße 31a80539 MünchenGermany
Dr. Michael RederInstitute for Social and Development StudiesMunich School of PhilosophyKaulbachstraße 31a80539 MünchenGermany
Prof. Dr. Johannes MüllerInstitute for Social and Development StudiesMunich School of PhilosophyKaulbachstraße 31a80539 MünchenGermany
ISBN 978-94-007-4539-1 ISBN 978-94-007-4540-7 (eBook)DOI 10.1007/978-94-007-4540-7Springer Dordrecht Heidelberg New York London
Library of Congress Control Number: 2012942333
© Springer Science+Business Media Dordrecht 2012This work is subject to copyright. All rights are reserved by the Publisher, whether the whole or part of the material is concerned, speci fi cally the rights of translation, reprinting, reuse of illustrations, recitation, broadcasting, reproduction on micro fi lms or in any other physical way, and transmission or information storage and retrieval, electronic adaptation, computer software, or by similar or dissimilar methodology now known or hereafter developed. Exempted from this legal reservation are brief excerpts in connection with reviews or scholarly analysis or material supplied speci fi cally for the purpose of being entered and executed on a computer system, for exclusive use by the purchaser of the work. Duplication of this publication or parts thereof is permitted only under the provisions of the Copyright Law of the Publisher’s location, in its current version, and permission for use must always be obtained from Springer. Permissions for use may be obtained through RightsLink at the Copyright Clearance Center. Violations are liable to prosecution under the respective Copyright Law.The use of general descriptive names, registered names, trademarks, service marks, etc. in this publication does not imply, even in the absence of a speci fi c statement, that such names are exempt from the relevant protective laws and regulations and therefore free for general use.While the advice and information in this book are believed to be true and accurate at the date of publication, neither the authors nor the editors nor the publisher can accept any legal responsibility for any errors or omissions that may be made. The publisher makes no warranty, express or implied, with respect to the material contained herein.
Printed on acid-free paper
Springer is part of Springer Science+Business Media (www.springer.com)

v
This book is a result of a large research project on Climate Change and Justice. It was initiated and driven by the need for new alliances spanning the scienti fi c and social domains of climate change, justice and sustainability. This has prompted four very dissimilar partners to join forces. From the scienti fi c domain, these are the Potsdam Institute for Climate Impact Research (PIK) and the Institute for Social and Development Studies in Munich (Institut für Gesellschaftspolitik, IGP). They combine scienti fi c results about the causes, consequences, and economics of climate change with ethical implications for development policy and sustainability. The commissioning parties and project partners are MISEREOR – the German Catholic Bishops’ Organisation for Development Cooperation, and the Munich Re Foundation – a non-pro fi t organization founded by the global risk carrier Munich RE. In this project, the scienti fi c community, development cooperation practitioners and experts from the insurance area have worked together to develop strategies for a global and yet equitable climate and energy policy.
At the same time, all four partners have embarked on a dialogue with those at the heart of this debate – the people directly affected, often the poor, in the countries of the global south. The multifaceted interaction with partners from developing and newly industrialised countries in a total of eight dialogue fora around the world has been challenging and enriching for all participants.
The aim of the project was to open up new pathways in which climate change mitigation, adaptation, development, and poverty reduction can be combined effec-tively, ef fi ciently, and equitably. Cooperation between such different partners is an af fi rmation of the need for new alliances to make this happen. Without dialogue and partnerships, the challenges will be met neither now nor in the future.
Potsdam Institute for Climate Impact Research (PIK) Ottmar Edenhofer Institute for Social and Development Johannes WallacherStudies in Munich (IGP) MISEREOR – the German Catholic Bishops’ Bernd BornhorstOrganisation for Development Cooperation Munich Re Foundation Thomas Loster
Preface


vii
Acknowledgements
The editors express their sincere thanks to all authors and co-authors for their valuable contributions to this book. The editors also wish to thank a large number of external reviewers for their constructive comments and suggestions on individual chapters.
The results of the project which eventually led to this book were made possible by the support of a large number of regional co-operators and participants in the dialogue fora. The editors express their gratitude to the following regional partners:
Bolivia: Anne Piepenstock and her team (Fundación Agrecol Andes), David Quezada Siles and his team (RED HÁBITAT)
Brazil: the Brazilian Bishops’ Conference (Conferência Nacional dos Bispos do Brasil, CNBB), the Forum “Climate Change” of MISEREOR partner organizations in Brazil, especially Irmã Delci, Maria Franzen, Daniel Rech and Roberto Malvezzi
El Salvador: Edín Martínez and Montserrat Cruz, the team at Fundación Salvadoreña de Desarrollo y Vivienda Mínima (FUNDASAL), Ricardo Quintanilla and Manuel Morán (Plataforma de Agricultura Sostenible), Ángel Ibarra (Unidad Ecologica Salvadoreña, UNES)
Indonesia: Fr. Pedro Walpole and Rowena Soriaga (Asia Forest Network, AFN), the team of Yayasan Wisnu, Hira Jhamtani, Leya Cattleya, Bernhard Kieser and Sunu Hardiyanta
Philippines: Roberto Yap and his team at the John J. Carroll Institute on Church and Social Issues
Sahel: Raymond Yoro (Caritas Devéloppement Niger, CADEV), Dramane Coulibaly (Centre d’Etudes Economiques et Sociales de l’Afrique Occidentale, CESAO-PRN), Bassirou Nouhou (Afrique Verte/ACSSA), Adam Toudou (Prolinnova Niger), Sabine Attama (Caritas Niamey)

viii Acknowledgements
South Africa: Brenda Martin and her team (Project 90 “Cut Carbon. Dare to Change”), Liziwe McDaid (The Green Connection), Monika Graaff (Incite Sustainability), Jessica Wilson and Taryn Pereira (Environmental Monitoring Group), Anton Cartwright (Centre for Criminology)
South Asia: The Indo-German Social Service Society (IGSSS), Heinz Peters and Nivedita Varshneya (Welthungerhilfe), Lea Herberg and Kasper Akermann (Sustainet Germany), Poonam Pande (Sustainet India), Sukanta Sen (Bangladesh Resource Centre for Indigenous Knowledge, BARCIK), Ajita Tiwari and Na fi sa D’Souza (LAYA)
The editors express their special thanks to MISEREOR staff who organized the regional dialogues and fi eld trips: Anja Mertineit, Sabine Dorlöchter-Sulser, Willi Thees, Karl Wirtz, Dorothee Klüppel, Almut Heider, Claudio Moser and Georg Krekeler.
The editors are very grateful for external support from a scienti fi c advisory board: Hartmut Graßl, Joachim von Braun, Saleemul Huq, Stephan Klasen, Harald Lesch, Dirk Messner and Wilhelm Vossenkuhl.
The editors acknowledge excellent editorial assistance from Helen Colyer, Lena Scheiffele and Franziska Faul. Finally, we wish to thank Takeesha Moerland-Torpey, Fritz Schmuhl and Purushothaman Saravanan at Springer Science+Business Media B.V. for their support in producing this book.
More information on the project “Climate Change and Justice – Climate policy as a component of fair globalization and sustainable poverty reduction” can be found at www.climate-and-justice.de .
Ottmar Edenhofer Johannes Wallacher
Hermann Lotze-Campen Michael Reder Brigitte Knopf
Johannes Müller

ix
1 Introduction ............................................................................................. 1Ottmar Edenhofer, Johannes Wallacher, Brigitte Knopf, Hermann Lotze-Campen, Michael Reder, and Johannes Müller
Part I Climate Impacts and Vulnerability
2 Vulnerability to Climate Change and Poverty ..................................... 9Hans-Martin Füssel
3 Climate Change and Water Supply ....................................................... 19Hans-Martin Füssel, Jens Heinke, Alexander Popp, and Dieter Gerten
4 Food Security in a Changing Climate ................................................... 33Hermann Lotze-Campen, Christoph Müller, Alexander Popp, and Hans-Martin Füssel
5 Vulnerability of Coastal Populations ..................................................... 45Hans-Martin Füssel
Part II Human Rights, Justice and Development
6 Climate Change and Human Rights ..................................................... 61Michael Reder
7 Triangle of Justice ................................................................................... 73Martin Kowarsch and Andreas Gösele
8 Development as Enhancement of Life Chances ................................... 91Johannes Müller
9 Criteria for Compatibility of Climate and Development Policies ....................................................................... 97Andreas Gösele and Johannes Wallacher
Contents
x Contents
10 Regulatory Policy: Guiding Social Principles and Individual Responsibility ................................................................ 105Johannes Wallacher and Johannes Müller
11 Cultures and Religions ........................................................................... 111Michael Reder and Johannes Müller
Part III Climate Change Mitigation Options: Challenges and Costs
12 The 2°C Target Reconsidered ................................................................ 121Brigitte Knopf, Martin Kowarsch, Christian Flachsland, and Ottmar Edenhofer
13 Climate Change Mitigation: Options, Costs and Risks ....................... 139Brigitte Knopf, Martin Kowarsch, Ottmar Edenhofer, and Gunnar Luderer
14 Land Use Management for Greenhouse Gas Mitigation ..................... 151Alexander Popp, Hermann Lotze-Campen, and Katrin Vohland
Part IV Climate Change Adaptation Options: Challenges and Costs
15 Adaptation in Water Management ........................................................ 163Hermann Lotze-Campen
16 Agricultural Adaptation Options: Production Technology, Insurance, Trade ................................................................ 171Hermann Lotze-Campen and Alexander Popp
17 The Role of Ecosystem Services in Increasing the Adaptive Capacity of the Poor ......................................................... 179Katrin Vohland, Ariane Walz, Alexander Popp, Hermann Lotze-Campen, and Wolfgang Cramer
Part V Case Studies on Climate Change Adaptation and Mitigation
18 Adaptation Options to Climate-Induced Glacier Retreat in Bolivia ....................................................................... 195Miriam Jeschke, Alexander Popp, and Hermann Lotze-Campen
19 Adaptation Options for Small Rice Farmers in the Philippines ......... 205Roberto C. Yap and Hermann Lotze-Campen
20 Deforestation, Indigenous Peoples, and the Poor in Indonesia ........... 215Pedro Walpole, Rowena Soriaga, and Hermann Lotze-Campen
21 Barriers for Avoiding Deforestation in Ecuador .................................. 219Jodi Thomas, Katrin Vohland, and Hermann Lotze-Campen

xiContents
22 Potentials and Limitations of Microinsurance for Protecting the Poor ........................................................................... 227Dirk Reinhard
23 From the Last Mile to the First: Risk Awareness is the Key ............... 239Thomas Loster
24 The Role of Development Cooperation in Climate Change Adaptation .............................................................. 247Anika Schroeder
Part VI A Global Deal for Linking Climate and Development Policy
25 Climate Policy in a Decentralised World .............................................. 257Christian Flachsland, Kai Lessmann, and Ottmar Edenhofer
26 A Global Carbon Market and the Allocation of Emission Rights................................................................................... 269Brigitte Knopf, Martin Kowarsch, Michael Lüken, Ottmar Edenhofer, and Gunnar Luderer
27 Mechanisms for Avoiding Deforestation and Forest Degradation .......................................................................... 287Alexander Popp, Gunnar Luderer, Kathrin Vohland, and Hermann Lotze-Campen
28 Worldwide Promotion and Diffusion of Climate-Friendly Technologies .......................................................... 297Andreas Gösele and Gunnar Luderer
29 International Adaptation Funding ........................................................ 311Hans-Martin Füssel, Stephane Hallegatte, and Michael Reder
30 Strengthening Development Politics and Global Partnership ............ 331Johannes Müller
31 Sustainable Development as a Cornerstone of a Future Energy System ..................................................................... 347Gerrit Hansen, Michael Jakob, and Susanne Kadner
32 Regional Dialogues on Climate Change and Justice: A Synthesis ......................................................................... 361Winfried Schneider
Index ................................................................................................................. 373


xiii
Acronyms
AD Avoided deforestation AF Adaptation Fund AR4 The Fourth Assessment Report of the IPCC AR5 The Fifth Assessment Report of the IPCC BAU Business as usual CARP Comprehensive Agrarian Reform Program CBD Convention on Biological Diversity CCAP Center for Clean Air Policy CCS Carbon capture and storage CDA Cooperative Development Authority CDC Common but differentiated convergence CDM Clean Development Mechanism CIESIN Centre for International Earth Science Information Network CFT Crop functional type CH
4 Methane
CO 2 Carbon dioxide
CO 2 -equ Carbon dioxide equivalent
COP Conferences of the Parties (UNFCCC) CSE Centre for Science and Environment CSOs Civil society organizations CSR Corporate social responsibility C&C Contraction and convergence DIE German Development Institute DIVA Dynamic and Interactive Vulnerability Assessment model DKKV German Committee for Disaster Reduction EITI Extractive Industries Transparency Initiative EJ Exajoule ETS Emissions Trading System EU European Union FACE Free Air Carbon Enrichment FAO Food and Agriculture Organization of the United Nations

xiv Acronyms
FGD Focus group discussions GCM General Circulation Model GDP Gross domestic product GDR Greenhouse Development Rights GHG Greenhouse gas GJ Gigajoule GNP Gross national product Gt Giga tons GtCO
2 Giga tons CO
2
GVA93 Global Vulnerability Assessment of Coastal Areas HadCM2 The second Hadley Centre coupled ocean-atmosphere GCM HDI Human Development Index HIV Human Immunode fi ciency Virus HPI Human Poverty Index IATI International Aid Transparency Initiative ICC Innuit Circumpolar Council ICCPR International Covenant on Civil and Political Rights ICESCR International Covenant on Economic, Social and Cultural Rights ICHRP International Council on Human Rights Policy IDNDR International Decade for Natural Disaster Reduction IEA International Energy Agency IEAs International Environmental Agreements IGP Institute for Social and Development Studies in Munich (Institut für
Gesellschaftspolitik) ILO International Labour Organization IMF International Monetary Fund IPCC Intergovernmental Panel on Climate Change IPR Intellectual property right IRRI International Rice Research Institute ISDR International Strategy for Disaster Reduction JRC Joint Research Centre LCCR Low-Carbon and Climate Resilient Development LDCF Least Developed Countries Fund LDCs Least-developed countries LEDS Low Emission Development Strategies LEIRP Low External Input Rice Production LPJmL Lund-Potsdam-Jena Dynamic Global Vegetation Model with managed
Land MA Millennium Ecosystem Assessment MAE Ministry of the Environment MAgPIE Model of Agricultural Production and its Impact on the Environment MASIPAG Magsasaka at Siyentipiko para sa Pag-unlad ng Agrikultura MDGs U.N. Millennium Development Goals MRV Monitoring, Reporting and Veri fi cation NAPA National Adaptation Programmes of Action

xvAcronyms
NGO Non-governmental organisation N
2 O Nitrous oxide
ODA Of fi cial Development Assistance OECD Organisation for Economic Co-operation and Development OHCHR Of fi ce of the United Nations High Commissioner for Human Rights PIK Potsdam Institute for Climate Impact Research PLACE-I Version 1 of the Population, Landscape, and Climate Estimates dataset PLACE-II Version 2 of the Population, Landscape, and Climate Estimates dataset PLDP Peoples Led Disaster Preparedness PPCR World Bank’s Pilot Program for Climate Resilience PRSP Poverty Reduction Strategy Papers RCI Responsibility and Capacity Index REDD Reduction of emissions from deforestation and forest degradation REMIND Re fi ned Model of Investments and Technological Development REMIND-R Re fi ned Model of Investments and Technological Development
- Regionalized R&D Research and development SCCF Special Climate Change Fund SNTCF Ecuadorian Outsourced National Forest Control System SOx Sulfur oxide SRES Special Report on Emissions Scenarios SRREN IPCC Special Report on Renewable Energy Sources TEEB The Economics of Ecosystems and Biodiversity UDHR Universal Declaration of Human Rights UNCESCR United Nations Committee on Economic, Social and Cultural Rights UNDP United Nations Development Programme UNECA United Nations Economic Commission for Africa UNEP United Nations Environment Programme UNFCCC United Nations Framework Convention on Climate Change WBGU German Advisory Council on Global Change WCDR World Conference on Disaster Reduction WCO World Customs Organization WHO World Health Organization WIPO World Intellectual Property Organization WMO World Meteorological Organization WTO World Trade Organization


xvii
Fig. 1.1 Relationship between population growth, increase in per capita income ( GDP ), and greenhouse gas emissions (Own representation, data for population and GDP based on Maddison 2008, emission data based on Schultz et al. 2008 and Mieville et al. 2009) .................................................................. 2
Fig. 1.2 Colours indicate the CO 2 trade balances of the different world
regions in 2004 (in Mt CO 2 ). Blue tones indicate an export
de fi cit of CO 2 , and red tones an export excess of CO
2 .
Arrows indicate the largest trade fl ows between the world regions .............................................................................. 3
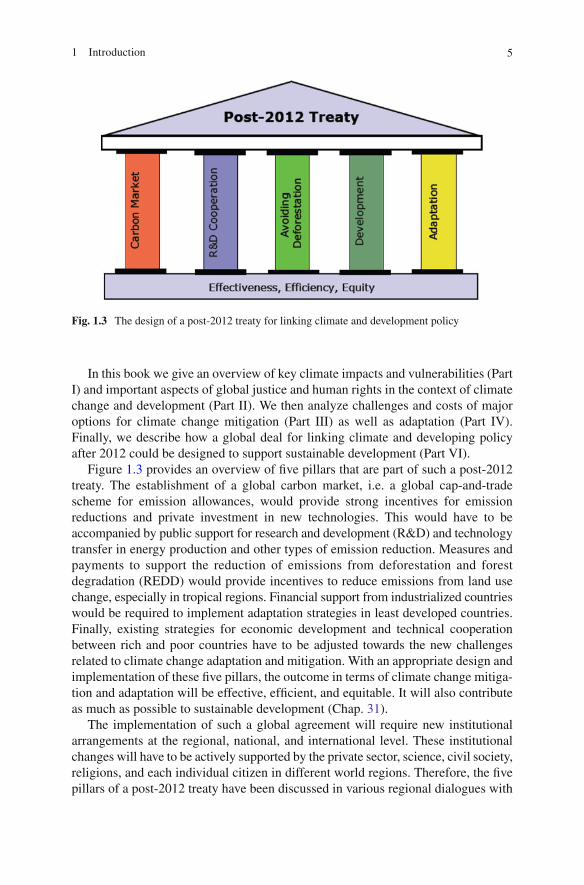
Fig. 1.3 The design of a post-2012 treaty for linking climate and development policy ................................................................... 5
Fig. 2.1 Climatic distribution of countries at different levels of development in terms of their population-weighted mean temperature and precipitation (see text for details) ................ 15
Fig. 3.1 Schematic representation of the water balance computed for each grid cell by the dynamic global vegetation and hydrological model LPJmL. The thick arrows indicate water fl uxes......................................................................... 21
Fig. 3.2 Projected change in ( a ) annual precipitation and ( b ) annual runoff between 1961–1990 and 2040–2069 for the SRES A2 emissions scenario. The maps show the median of the simulations based on 19 GCMs. The stronger the white shading of a region, the weaker is the agreement across the GCMs about the direction of future changes in water availability ........................ 22
Fig. 3.3 “Pessimistic” projections of the change in ( a ) annual precipitation and ( b ) annual runoff between 1961–1990 and 2040–2069 for the SRES A2 emissions scenario. The maps show the 10th percentile of water availability in each region based on projections from 19 GCMs (see text for details) .............. 24
List of Figures

xviii List of Figures
Fig. 3.4 ( a ) Uncertainty about changes in future water availability, expressed as coef fi cient of variation of changes in runoff between 1961–1990 and 2040–2069. ( b ) Human poverty index for developing countries ....................................................... 25
Fig. 3.5 Global distribution of physical and social factors of water poverty. ( a ) Fraction of renewable water resources used by humans. ( b ) Fraction of population without secure water supply ........................................................................ 27
Fig. 3.6 Green and blue water availability per capita for ( a ) “present” conditions (1996–2005) and ( b ) for “2050” conditions (the period 2046–2055), assuming both climate and demographic change ................................................................ 29
Fig. 4.1 Percentage change in agricultural production due to climate-related yield changes between 1990 and 2050 (mean across 19 different climate model results; mean across all food crops, weighted with their calorie content) ...................... 38
Fig. 5.1 Estimates for twenty- fi rst century sea level rise from semi-empirical models as compared to the IPCC Fourth Assessment Report (AR4) .............................................................. 46
Fig. 5.2 Population in large river deltas that would have to be resettled by 2050 assuming a continuation of the current trend of sea-level rise. Extreme: more than 1 million; high: more than 50,000; medium: more than 5,000 ................................ 48
Fig. 5.3 Percentage of ( a ) land area and ( b ) population in coastal regions below 5 m elevation .......................................... 51
Fig. 5.4 Increase in the percentage of population annually fl ooded by sea-level rise, assuming constant coastal protection and constant population ( a ) based on the DIVA model for a sea-level rise of 40 cm; ( b ) based on the Global Vulnerability Assessment for a sea-level rise of 100 cm ............... 52
Fig. 13.1 The basic problem of climate economy – fossil resources based on data and related historical and potential future CO
2
emissions based on model results. Reserves are understood as natural resources economically extractable with today’s methods and prices. Resources are understood as the future extractable amount of natural resources that exceeds the reserves; Historical consumption: Boden et al. (2009); Model scenarios: Knopf et al. (2009), Edenhofer et al. (2010). The fi gure fi rst appeared in Edenhofer et al. (2010). Visit The Energy Journal online at http://www.iaee.org/en/publications/journal.aspx ............................................................... 141

xixList of Figures
Fig. 13.2 Transformation of the world-wide energy system for the business-as-usual case and two climate protection targets (550 and 400 ppm CO
2 -eq) that equate with achieving
the 2°C target with probabilities of approximately 15% and 75% respectively. Historical data: IEA (2007a, b). In the model, mitigation starts with full international participation by 2010 ..................................................................... 142
Fig. 13.3 Global mitigation costs for a 400 ppm CO2-eq scenario (equivalent
to achieving the 2°C target with 75% probability), calculated as GDP losses (MERGE, REMIND) and energy system costs (POLES) from 2005 to 2100 relative to a business-as-usual scenario, with different technology scenarios for the energy system economy models MERGE, REMIND and POLES. Scenarios are explained in the text. “X” means that the climate protection target cannot be reached under these technical restrictions; “0” means that the relevant scenario has not been calculated. In the reference case ( blue ), all technologies are available ......................................................... 143
Fig. 13.4 Global mitigation costs related to the cumulative atmospheric CO
2 emissions for 2005–2100. Costs are calculated as cumulative
% GDP losses from 2005 to 2050 relative to a business-as-usual scenario with discounting of 3%. The cumulative emissions are an indicator of the probability of achieving the 2°C target (Meinshausen et al. 2009): the lower the cumulative emissions, the higher the probability of staying below 2°C ............................ 144
Fig. 14.1 Regional non-CO 2 greenhouse gas emissions
from agriculture in the year 2005 ................................................... 152 Fig. 14.2 Agricultural greenhouse gas emissions incorporating population
growth but also ( a ) changing dietary preferences towards higher value foods, such as meat and milk and ( b ) reduced demand for livestock products by 25% in each decade from 2015 to 2055 .......................................................................... 153
Fig. 14.3 Mitigation potential in the agricultural sector in the year 2030 .............................................................................. 154
Fig. 14.4 Bioenergy demand ( black dashed line ), additional CO 2
emissions from land use change due to cellulosic bioenergy crops without forest conservation ( orange solid line ) and additional N
2 O emissions from agricultural
intensi fi cation ( yellow solid line ) ................................................... 156
Fig. 25.1 Structure of a six player prisoners’ dilemma with symmetric players. The vertical axis indicates the payoff for one player as the number of players abating – indicated on the horizontal axis – varies .................................................................................... 259

xx List of Figures
Fig. 25.2 Structure of a six player chicken game with symmetric players. The vertical axis indicates the payoff for one player as the number of players abating – indicated on the horizontal axis – varies .................................................................................... 259
Fig. 25.3 Structure of a six player coordination game. The vertical axis indicates the payoff for one player as the number of players abating – indicated on the horizontal axis – varies ........................ 260
Fig. 26.1 Mitigation costs resulting from different allocation schemes. Mitigation costs are measured in terms of consumption losses relative to business-as-usual ( BAU ) aggregated over time (2010–2100) at a discount rate of 3%. Blue colours indicate allocation schemes, where the emission rights are distributed; red colours those where the reduction efforts are distributed. Regions: USA , JAP (Japan), EUR (Europe), RUS (Russia), MEA (Middle East), LAM (Latin America), OAS (Other Asia), CHN (China), IND (India), AFR (Africa), ROW (Rest of the World) ............................................................... 274
Fig. 26.2 Decomposition of cumulative consumption losses for the different regions in % of GDP aggregated for 2010–2100. Negative values indicate losses or additional investments, positive values indicate savings or gains. Note the different scales. For each region the brown bar on the right shows the consumption difference, and the stacked bar left to it shows the components. The decomposition is shown for a C&C allocation scheme. For other allocation schemes only the consumption losses ( right brown bar ) change according to Fig. 26.1 and the permit trade effect ( green bar ). All other components remain the same for all allocation schemes. Regions: USA , JAP (Japan), EUR (Europe), RUS (Russia), MEA (Middle East), LAM (Latin America), OAS (Other Asia), CHN (China), IND (India), AFR (Africa), ROW (Rest of the World) ........................................ 277
Fig. 31.1 Correlation between Energy use per capita and the HDI ............... 352

xxi
Table 2.1 Differential vulnerability between poor and wealthy countries for key climate-sensitive sectors (see text for details) ................. 14
Table 5.1 Countries most vulnerable to sea-level rise according to several potential vulnerability indicators (see text for details) ..................................................................... 50
Table 13.1 Different mitigation options and their associated unresolved challenges (middle column) and potential societal hazards (right column) ................................................... 145
Table 17.1 Selected climate impacts on ecosystems and human societies, and ecosystem services supporting adaptation ............ 184
Table 21.1 Process of corruption involved illegal logging ............................ 222
Table 22.1 The development of the number of clients in selected microinsurance providers ............................................................ 233
Table 22.2 Priority risks in selected countries ............................................... 235
Table 29.1 Total annual costs of adaptation in developing countries between 2010 and 2050 by region, for two climate scenarios and three aggregation methods (US $ billion at 2005 prices, no discounting) ............................................................................ 318
Table 29.2 Four de fi nitions of eligible adaptation, from the strictest (De fi nition 1) to the broadest (De fi nition 4) ................................ 319
Table 29.3 Potential indicators for prioritising adaptation funding ............... 325
Table 31.1 Energy indicators for sustainable development ........................... 349 Table 31.2 Number of people (million) lacking access to electricity
or relying on traditional biomass for cooking in 2009 in developing countries ................................................................ 353
List of Tables

1O. Edenhofer et al. (eds.), Climate Change, Justice and Sustainability: Linking Climate and Development Policy, DOI 10.1007/978-94-007-4540-7_1, © Springer Science+Business Media Dordrecht 2012
1.1 Introduction
In the twenty- fi rst century, human society faces three grand challenges: reducing worldwide poverty, enabling development, and avoiding dangerous climate change. Progress on all these challenges is slow, and possible solutions are increasingly interlinked.
While the relative share of extremely poor people in global population has decreased, mainly due to progress in East Asia, the absolute number of people with an income of less than US$1.25 per day is still increasing in many regions, especially Sub-Saharan Africa. The goal of the Millennium Declaration of the United Nations to reduce the share of people below the poverty line by half until 2015 will certainly be missed in many regions. There is a strong need for strategies to foster pro-poor growth and development over the coming decades.
Human innovation and the industrial revolution together with trade and competition in the nineteenth and twentieth century have led to an unprecedented growth of population and wealth in many parts of the world. This growth was facilitated by a “lottery price” (Sombart 1928 ) – the discovery of abundant fossil fuels, like coal, oil
O. Edenhofer (*) • B. Knopf Sustainable Solutions, Potsdam Institute for Climate Impact Research (PIK) , P.O. Box 60 12 03 , 14412 Potsdam , Germany e-mail: [email protected]
H. Lotze-CampenClimate Impacts and Vulnerabilities, Potsdam Institute for Climate Impact Research (PIK),P.O. Box 60 12 03, 14412 Potsdam, Germanye-mail: [email protected]
J. Wallacher • M. Reder • J. Müller Institute for Social and Development Studies (IGP) , Munich School of Philosophy , Kaulbachstr. 31a , 80539 Munich , Germany
Chapter 1 Introduction
Ottmar Edenhofer , Johannes Wallacher , Brigitte Knopf , Hermann Lotze-Campen , Michael Reder , and Johannes Müller

2 O. Edenhofer et al.
and gas. Since then, the traditional path of economic growth across the world was closely linked to rising emissions of greenhouse gases, mainly carbon dioxide (CO
2 )
(Fig. 1.1 ). However, already at the end of the nineteenth century it was shown by Svante Arrhenius that increasing CO
2 emissions from burning fossil fuels are
responsible for global warming and climate change. The creation of wealth in today’s rich parts of the world has been primarily based on the availability of cheap fossil fuels and the use of the atmosphere as disposal space for emissions.
Human society faces a dilemma. Energy use is a prerequisite for economic growth and development, but the current energy mix in most countries is associated with high greenhouse gas emissions. Further economic growth along a fossil-fuel-intensive path will almost certainly lead to dangerous climate change, with all the negative conse-quences, especially for many poor people in the developing world. For example, food security, water supply, and coastal protection will be affected in many regions of the world (Part I). On the other hand, if the use of fossil fuels is restricted and emissions are strongly reduced, many poor countries will lose the opportunity of relatively cheap economic growth and poverty reduction. Hence, the choice is between dangerous climate impacts and dangerous climate mitigation strategies.
Moreover, the link between climate change mitigation and poverty reduction raises fundamental issues of global justice (Part II). Poor people in least developed countries have not participated in the traditional growth path and have hardly contributed to global emissions. However, they will be most heavily affected by the negative impacts of climate change. They are also highly vulnerable and lack the means for appropriate adaptation measures.
The transformation of the energy system and widespread access to clean energy technologies for all are prerequisites for sustainable socio-economic development across the world. As emphasized in the Special Report on Renewable Energy Sources
Fig. 1.1 Relationship between population growth, increase in per capita income ( GDP ), and greenhouse gas emissions (own representation, data for population and GDP based on Maddison 2008 , emission data based on Schultz et al. 2008 and Mieville et al. 2009 )

31 Introduction
and Climate Change Mitigation (IPCC 2011 , Chapter 9), a low-carbon energy system can deliver multiple co-bene fi ts related to human health, environmental impacts, and energy security. However, strong incentives, like a cap-and-trade system for emission allowances and policy support for research and development, are required to initiate the energy transformation. If technological progress and technology transfer in the energy sector are slow, this may lead to higher energy prices with negative effects on poverty and income inequality, especially in developing countries.
The UN Climate Change Summits in Copenhagen (2009), Cancun (2010) and Durban (2011) have shown the chances and barriers to overcoming the dilemma on climate change mitigation and poverty reduction. In Copenhagen and Cancun, no global agreement on worldwide reductions of greenhouse gas emissions was achieved, and in Durban the possible starting year was postponed until 2020. Moreover, these conferences did not come up with suf fi cient fi nancial support for developing countries in their efforts to adapt to already unavoidable climate impacts. But it has now become clear that a solution to both challenges on poverty reduction and emission reduction has to be based on a new path for economic growth. Low-Carbon and Climate Resilient Development (LCCR) and Low Emission Development Strategies (LEDS) are new catchwords for a strategy to combine climate change mitigation (Part III) and climate change adaptation (Part IV) in a broader context of sustainable development (Chap. 31 ).
As a global agreement on emission reductions is hard to achieve, it could be argued that it is now time to undertake unilateral action and exclusively focus on “green growth” at the national level. But this neglects the in fl uence of international trade and the embedded emissions in traded goods. By balancing CO
2 emissions for
each country and taking into account these embedded emissions, it can be shown that industrialised countries are often net importers of CO
2 and that this “trade
de fi cit” has grown over the last years (Fig. 1.2 ). CO 2 -intensive industrial production
is increasingly relocated to emerging and developing countries, and especially
Fig. 1.2 Colours indicate the CO 2 trade balances of the different world regions in 2004 (in Mt
CO 2 ). Blue tones indicate an export de fi cit of CO
2 , and red tones an export excess of CO
2 . Arrows
indicate the largest trade fl ows between the world regions (Based on Peters et al. 2011 )

4 O. Edenhofer et al.
China has become the “work bench” of the world. Hence, if only unilateral action is taken to reduce emissions, emissions are likely to increase in other world regions due to international division of labour and outsourcing of emission-intensive industries. It is clear that a fragmented global climate policy regime will neither be effective nor ef fi cient. Instead, a global approach towards climate protection is required. This can be supported by national frontrunners which show the feasibility of low-carbon energy strategies.
An exclusive focus on national solutions also neglects the fact that climate mitigation and other key aspects of sustainable development are strongly linked to the management of so-called “Global Commons”. The atmosphere as a disposal space for greenhouse gases has to be managed as a global common resource. Likewise, tropical forests can be interpreted as a global common resource, as they store carbon and maintain biodiversity. Tropical deforestation is, apart from the energy system, another major source of greenhouse gas emissions (Chap. 14 ), Avoiding further deforestation will also require global cooperation, as developing and emerging countries with large forest areas are reluctant to give up opportunities for agricultural expansion and economic growth without compensation (Chap. 27 ).
The UN Climate Change Summit in Durban in December 2011 took up the idea of a global agreement again. While in the Kyoto protocol the world was divided into actors and non-actors, negotiators in Durban committed to reaching a global climate policy agreement by the year 2020. This outcome is probably too late to limit global warming to two degrees above the pre-industrial level. Moreover, it does not contain a binding roadmap for global emission reductions. However, the Durban Summit has shown an awareness that climate change and the overuse of global commons, like the atmosphere or tropical forests, require global solutions by the international community (Part VI).
In the preparation of the UN Conference on Sustainable Development in June 2012 in Rio de Janeiro it has also been acknowledged that energy use, climate change mitigation, and adaptation cannot be separated from poverty reduction and other dimensions of sustainable development, like agricultural production and food security, water availability, human health, and conservation of biodiversity and other ecosystem services. A sustainable development pathway along “green growth” will only be achieved, if resource use stays within acceptable environmental boundaries along all relevant dimensions. Sustainable development without climate protection will not be possible – climate protection not embedded in a broader social and environmental development context will most likely fail.
Moreover, the causes and consequences of climate change are not only a subject for the natural sciences or economics. Debates about the impacts of climate change necessarily exist within ethical frameworks. Often justice is the key concept, which plays an important role in the discussion about climate change and development policy. Issues of justice that arise in the context of climate change and poverty reduction need to be systematically considered. One important task of ethics is to reveal and re fl ect hidden implications. Therefore, a comprehensive concept of justice needs to be unfolded as a basis for further analysis. In our view, human rights provide a meaningful starting point for such a comprehensive concept of justice.
51 Introduction
In this book we give an overview of key climate impacts and vulnerabilities (Part I) and important aspects of global justice and human rights in the context of climate change and development (Part II). We then analyze challenges and costs of major options for climate change mitigation (Part III) as well as adaptation (Part IV). Finally, we describe how a global deal for linking climate and developing policy after 2012 could be designed to support sustainable development (Part VI).
Figure 1.3 provides an overview of fi ve pillars that are part of such a post-2012 treaty. The establishment of a global carbon market, i.e. a global cap-and-trade scheme for emission allowances, would provide strong incentives for emission reductions and private investment in new technologies. This would have to be accompanied by public support for research and development (R&D) and technology transfer in energy production and other types of emission reduction. Measures and payments to support the reduction of emissions from deforestation and forest degradation (REDD) would provide incentives to reduce emissions from land use change, especially in tropical regions. Financial support from industrialized countries would be required to implement adaptation strategies in least developed countries. Finally, existing strategies for economic development and technical cooperation between rich and poor countries have to be adjusted towards the new challenges related to climate change adaptation and mitigation. With an appropriate design and implementation of these fi ve pillars, the outcome in terms of climate change mitiga-tion and adaptation will be effective, ef fi cient, and equitable. It will also contribute as much as possible to sustainable development (Chap. 31 ).
The implementation of such a global agreement will require new institutional arrangements at the regional, national, and international level. These institutional changes will have to be actively supported by the private sector, science, civil society, religions, and each individual citizen in different world regions. Therefore, the fi ve pillars of a post-2012 treaty have been discussed in various regional dialogues with
Fig. 1.3 The design of a post-2012 treaty for linking climate and development policy

6 O. Edenhofer et al.
stakeholders in Latin America, Sub-Saharan Africa, and Asia (Chap. 32 ). Moreover, a collection of case studies is provided to put the global challenges into speci fi c regional contexts (Part V). Without a combination of multi-regional and multi-level approaches, no global agreement will ever be put into place. But it also holds that without a global agreement all regional and bottom-up approaches are doomed to fail in the long-term. The battle against climate change and the battle against global poverty will be won or lost together.
References
IPCC. (2011). IPCC Special Report on Renewable Energy Sources and Climate Change Mitigation. Prepared by Working Group III of the Intergovernmental Panel on Climate Change. In O. Edenhofer, R. Pichs-Madruga, Y. Sokona, K. Seyboth, P. Matschoss, S. Kadner, T. Zwickel, P. Eickemeier, G. Hansen, S. Schlömer, C. von Stechow (Eds.), Cambridge/New York: Cambridge University Press.
Maddison, A. (2008). The west and the rest in the world economy 1000–2030: Maddisonian and Malthusian interpretations. World Economics , 9 (4). Retrieved October 2008, from http://www.relooney.info/00_New_2733.pdf
Mieville, A., Granier, C., Liousse, C., Guillaume, B., Mouillot, F., Lamarque, J. F., et al. (2009). Emissions of gases and particles from biomass burning during the 20th century using satellite data and an historical reconstruction. Atmospheric Environment, 44 (11), 1469–1477. doi: 10.1016/j.atmosenv.2010.01.011 .
Peters, G., Minx, J., Weber, C., & Edenhofer, O. (2011). Growth in emission transfers via interna-tional trade from 1990 to 2008. PNAS . doi: 10.1073/pnas.1006388108 .
Schultz, M. G., Heil, A., Hoelzemann, J. J., Spessa, A., Thonicke, K., Goldammer, J., et al. (2008). Global wildland fi re emissions from 1960 to 2000. Global Biogeochemical Cycles, 22 (2). doi: 10.1029/2007GB003031 .
Sombart, W. (1928). Der moderne Kapitalismus: Historisch-systematische Darstellung des gesamteuropäischen Wirtschaftslebens von seinen Anfängen bis zur Gegenwart, Bd. III: Das Wirtschaftsleben im Zeitalter des Hochkapitalismus. Erster Halbband . Munich/Leipzig: Duncker & Humblot.

Part I Climate Impacts and Vulnerability

9O. Edenhofer et al. (eds.), Climate Change, Justice and Sustainability: Linking Climate and Development Policy, DOI 10.1007/978-94-007-4540-7_2, © Springer Science+Business Media Dordrecht 2012
2.1 Why Do We Talk About Vulnerability?
Which country, region, economic sector, or population group is most vulnerable to climate change? This question is frequently asked in political and scienti fi c debates about global climate change – but what exactly is meant by the “vulnerability” of regions or population groups? This question is not just academic, but can have substantial policy implications for prioritising international adaptation funding (see Chap. 29 ). This chapter presents the main interpretations of vulnerability in the climate change context. It discusses the relationship between vulnerability and poverty and it uses an integrated vulnerability concept to analyse the inequities created by global climate change. In this context, inequity refers to a situation where some nations and/or population groups suffer substantially more from the adverse impacts of climate change than represented by their respective share in the greenhouse emissions that have caused the problem.
The ordinary use of the word “vulnerability” refers to the capacity to be wounded, or the degree to which a system is likely to experience harm due to exposure to a hazard (Turner et al. 2003 ) . The scienti fi c use of “vulnerability” has its roots in geography and natural hazards research but this term is now a central concept in a variety of research contexts such as natural hazards and disaster management, ecology, public health, poverty and development, secure livelihoods and famine,
H.-M. Füssel (*) Sustainable Solutions, Potsdam Institute for Climate Impact Research (PIK) , P.O. Box 60 12 03 , 14412 Potsdam , Germany
European Environment Agency, Kongens Nytorv 6, 1050 Copenhagen, Denmark e-mail: [email protected]
Chapter 2 Vulnerability to Climate Change and Poverty
Hans-Martin Füssel

10 H.-M. Füssel
sustainability science, land change, and climate impacts and adaptation. Vulnerability is conceptualised in very different ways by scholars from different knowledge domains, and even within the same domain.
Natural scientists and engineers tend to apply the term in a descriptive manner that is universally applicable. For example, the vulnerability of buildings and other infrastructure to wind storms can be measured according to universal criteria across the world. Social scientists, in contrast, tend to use the word “vulnerability” in the context of a speci fi c explanatory model (Gow 2005 ; O’Brien et al. 2007 ) . Criteria for measuring the vulnerability of individuals, communities, and population groups are dependent on their speci fi c social context and cannot be easily transferred from one world region to another. The risk-hazard approach and the political economy approach have been combined and extended in various integrated approaches, most notably in the hazard-of-place model (Cutter 1993, 1996 ) and the coupled vulnera-bility framework (Turner et al. 2003 ) . These integrated approaches are widely used in the context of global environmental change and climate change, and they have informed the de fi nition of vulnerability to climate change in the International Panel on Climate Change (IPCC) Assessment Reports (IPCC 2007 ) . The multitude of de fi nitions of “vulnerability” is particularly problematic in interdisciplinary research on global change and climate change where many different scholarly communities contribute their respective concepts, models, and terminologies. For reviews of the conceptualisation of vulnerability in climate change research, see Kelly and Adger ( 2000 ) , Downing and Patwardhan ( 2004 ) , Kasperson et al. ( 2005 ) , Villagrán De León ( 2006 ) , Füssel ( 2007 ) , O’Brien et al. ( 2007 ) .
Most vulnerability assessments, including those in this study, are conducted to inform policy decisions in which high vulnerability is generally equated with a particularly large or urgent need to act. However, the criteria for prioritisation may differ signi fi cantly depending on the decision context, together with the particular concerns and the policy portfolio of the responsible organisation. For example, any imminent famine, independent of its cause, is an urgent reason for action from the perspective of a humanitarian organisation. However an international fund established to support adaptation to climate change in developing countries (see Chap. 29 ) will focus on those regions where climate change is a causal factor in decreasing food security. The necessity for subjective judgements is particularly clearly recognised by Wheeler ( 2011 ) , who develops three resource allocation formulae for interna-tional adaptation funding. These allocation formulae, or vulnerability indices, use the same underlying information but they combine it in different ways to re fl ect different institutional perspectives and priorities of potential funders.
The central questions in the context of this study are where climate change increases absolute poverty, creates poverty, or hampers the fi ght against poverty (Alwang et al. 2001 ) . This information is relevant for assessing the robustness of poverty reduction strategies to the impacts of climate change, as well as for prior-itising international adaptation funding.
Poverty eventually affects individuals and households, and there can be large variations in poverty within a region or even a community. Scenarios for future climate change and its impacts however, are only available at a much coarser spatial

112 Vulnerability to Climate Change and Poverty
resolution. A poverty-focused global assessment of vulnerability to climate change thus needs to acknowledge the gap between the desirable and the actually feasible level of detail. The analysis in this chapter focuses largely at the national level because countries are the main subjects of international climate policy. The following chapters discuss three risks from climate change that are particularly relevant for poor people around the world: decreased water supply (see Chap. 3 ), decreased food security (see Chap. 4 ), and threats to coastal settlements (see Chap. 5 ). These assessments combine information on current living conditions across countries with scenarios about global and regional climate change and its impacts.
2.2 Poverty and Vulnerability
What is the relationship between poverty and vulnerability to climate change? Climate change vulnerability assessments generally apply one of two vulnerability concepts: social vulnerability (also known as starting-point or contextual vulnerability) and outcome vulnerability (also known as end-point or integrated vulnerability) (Füssel 2007 ; O’Brien et al. 2007 ) .
Social vulnerability refers to the lack of capability of individuals, groups or com-munities to cope with and adapt to any external stress placed on their livelihoods and well-being. This is determined by the availability of resources and by the entitlement of individuals and groups to call on these resources (Blaikie et al. 1994 ; Adger and Kelly 1999 ) . While the scienti fi c literature does not fully agree on the exact relationship between poverty and vulnerability, there is wide agreement that poverty and social vulnerability share a common set of determinants (Alwang et al. 2001 ) . For example, people with low and/or irregular income, little savings, insuf fi cient education, and no access to medical care are particularly at risk of falling into absolute poverty and to losing their health or even their life as a result of climatic variations that exceed their capacity to cope. Statements that take it for granted that the poor are also the most vulnerable to global climate change generally assume this interpretation of vulnerability.
Social vulnerability can be determined at different levels, from individuals to com-munities and countries (Vincent 2007 ) . The social vulnerability of countries and regions is generally expressed through indices of their economic and social development, such as the Human Development Index (HDI) or the Human Poverty Index (HPI) (Gall 2007 ) . The HDI considers data on life expectancy, the level of formal education and material wealth; the HPI considers additional poverty-relevant data such as access to safe drinking water and prevalence of undernourishment in children (UNDP 2007 ) . Despite some differences in detail, these indices agree on the substantial vulnerability of developing countries, in particular of the least developed countries.
Generic indices of social vulnerability cannot fully represent the risks of climate change because they only consider their social determinants. For example, countries with densely populated coastal regions face a higher risk from sea-level rise than countries with comparable social vulnerability but without a large coastal population. To assess the

12 H.-M. Füssel
risks of climate change to different population groups and regions more comprehensively, integrated vulnerability concepts have been developed that combine information about climatic change and its expected impacts in a region with information about the social vulnerability of the population. Application of an integrated vulnerability concept is also crucial for any analysis of the vulnerability of the poor to climate change. However, the selection of appropriate vulnerability factors, their quanti fi cation, and their combination into a single index or a set of indices raises many empirical, methodological, and normative questions, which often determine the results of the assessment (Eriksen and Kelly 2007 ; Füssel 2009b ; Klein 2009 ; Wheeler 2011 ) .
2.3 (Why) Are the Poor Particularly Vulnerable to Climate Change?
Are the poor most strongly affected by climate change, and if so, why? Comprehensive assessments of the social impacts of climate change across countries typically distinguish the following vulnerability factors (Füssel 2010 ) :
1. Type and magnitude of regional climate change : anthropogenic climate change is a global phenomenon but with a complex spatial pattern. For example, it may lead to increasing precipitation in some regions and to decreasing precipitation in others.
2. Sensitivity to regional climate change : a given magnitude of climate change can cause very different biophysical impacts in different regions, depending on present climate and other environmental characteristics. For example, a warming of a few degrees may increase the agricultural potential in a cold region but decrease it in a region that is already very warm.
3. Importance of climate-sensitive activities : the relevance of climate change for a region and its economy is strongly in fl uenced by the importance of climate-sensitive sectors, systems, and activities. For example, ceteris paribus climate change will impact more strongly on countries where agriculture has a large share in the gross domestic product and the labour force than on countries where this share is small.
4. Ability to cope and adapt : the ability of population groups to cope and adapt is a key determinant of their vulnerability to climate change. For example, a decrease in food production by one fi fth in a poor country may push large sections of the population into deep poverty and hunger whereas a wealthy country may avoid catastrophic impacts by compensating decreased domestic production with increased food purchases from abroad.
The above factors are key determinants of the (integrated) vulnerability of a country to climate change. However, it is important to note that some of them are dif fi cult to quantify and that there is no agreed method for combining the individual factors to determine the integrated vulnerability of a region to climate change.
Table 2.1 addresses the question of this section (“Are the poor most strongly affected by climate change, and if so, why?”) at the country level, incorporating

132 Vulnerability to Climate Change and Poverty
selected results from Chaps. 3 to 5 . Speci fi cally, this table compares the integrated vulnerability of poor and wealthy countries for four climate-sensitive sectors based on a broad selection of national-level vulnerability factors. Note that the term “vulnerability” has been replaced by “social impacts” to avoid misinterpretations of the table by readers who apply a different vulnerability de fi nition. Wealth is measured by two indicators: gross domestic product (GDP) per capita measured according to purchasing power parity as an indicator of economic capability and the human development index (HDI) as an indicator of social capability (UNDP 2007 ) . All indicators are normalised so that they are not distorted by the size or population of a country. Red (blue) shading indicates that poor countries score signi fi cantly higher (lower) on a given vulnerability factor than wealthy countries, and the intensity of the shading indicates the degree of this disparity. Dark (light) colours denote that the absolute value of the unweighted rank correlation between wealth and the vulnerability factor is above 0.6 (between 0.3 and 0.6). Rank correlations below 0.3 are considered insigni fi cant and marked in grey. If a cell is marked by two colours, the top (bottom) part of a cell refers to the correlation of wealth with the top (bottom) vulnerability indicator. For example, the dark red shading of all cells in the socio-economic capacity rows indicates that poor countries (who have also generally contributed little to causing climate change) have a much weaker socio-economic capacity to adapt and to cope with the adverse impacts of climate change. The situation is not so straightforward, however, for the sensitivity and exposure dimensions.
The fi rst row of Table 2.1 combines the fi rst two out of the four vulnerability factors from the list above. The last row estimates the distribution of the social impacts of climate change across poor and wealthy countries based either on model-based global impact assessments (normal font) or on a synthesis of the vulnerability
Table 2.1 Differential vulnerability between poor and wealthy countries for key climate-sensitive sectors (see text for details) (Source: Adapted from Füssel 2010 )

14 H.-M. Füssel
Fig. 2.1 Climatic distribution of countries at different levels of development in terms of their population-weighted mean temperature and precipitation (see text for details) (Source: Own fi gure)
factors from the cells above (italic font). According to the last row of Table 2.1 , poor countries are much more vulnerable to climate change as it affects food security (see Chap. 4 ), coastal populations (see Chap. 5 ), and human health (not covered in detail in this book).
The greater vulnerability of poor countries compared to wealthier ones is largely caused by their lower socio-economic capacity to cope and adapt. In those sectors where temperature is an important determinant of the impacts of climate change (i.e., food security and human health), the biophysical sensitivity of poor countries also tends to be greater than those of rich countries because most poor countries currently have a very warm climate (see Fig. 2.1 ). In other sectors, the social impacts of climate change may fall predominantly on poor countries even if their sensitivity and exposure is comparable to, or even lower than, that of wealthy countries. For example, the percentage of the population living in coastal regions at less than 1 m elevation is higher on average in wealthy countries than in poor countries. However the increase in the population at risk of fl ooding is generally much higher in poor countries due to insuf fi cient levels of coastal protection.
Currently available data does not enable a robust comparison of the impacts of climate change on water supply between poor and wealthy countries. Global climate change can increase as well as decrease water availability in rich and poor countries, and there is considerable uncertainty about changes in water availability in many regions (see Chap. 3 ). For example, it is uncertain whether climate change will increase or decrease precipitation in the Sahelian zone or perhaps lead to frequent changes between wet and dry periods (Paeth et al. 2008 ) . Further complications arise from the interaction of global climate change and regional land-use change in determining future precipitation changes (Paeth and Thamm 2007 ) . In addition, the social impacts of climate change are not only determined by average annual water availability but also by seasonal water availability and by the predictability of water

152 Vulnerability to Climate Change and Poverty
supply. In any case, a given change in water availability will generally have larger social impacts in poor countries than in rich countries.
The fact that poor people have limited capacity to adapt to and cope with cli-mate change is obvious and well known. It has been argued that the primary rea-son that poor countries will suffer the bulk of economic damages from climate change is their warm present climate (Mendelsohn et al. 2006 ) . However, most current debates about the differential vulnerability of poor and rich people to cli-mate change still neglect the obvious fact that the poor and the rich tend to live in very different climatic zones. This difference is illustrated clearly in Fig. 2.1 , which shows the average temperature and precipitation of all countries based on climate data from New et al. ( 2002 ) . The average climate of a country was deter-mined by population-weighting based on population data from Balk and Yetman ( 2004 ) ; this implies that the climate of densely populated regions has a stronger in fl uence than the climate in sparsely populated regions. The size of a circle re fl ects the population size of a country, and the colour indicates the level of socio-economic development. Green dots represent countries listed in Annex II of the United Nations Framework Convention on Climate Change (UNFCCC), which includes all OECD member countries as of 1990, brown dots represent countries listed in Annex I but not in Annex II of the UNFCCC (i.e., economies in transition to a market economy), red dots represent the least developed countries, and blue dots represent all other countries (mostly developing countries but also some small developed countries). Interestingly, the (population-weighted) average cli-mate of all Annex I and Annex II countries (marked in green and brown) lies within the black “climate envelope” characterised by cool to moderate tempera-tures (4–18°C) and moderate precipitation levels (500–1,600 mm per year). While all Annex I and Annex II countries have an average temperature below 18°C, almost all least developed countries (with the exception of the mountainous coun-tries Afghanistan, Bhutan, Lesotho) currently have a mean temperature above this level. This observation is particularly important given that several macro-eco-nomic studies have found that a mean temperature between 10°C and 15°C is optimal for most economic sectors whereas warming above that level decreases economic productivity (Mendelsohn and Schlesinger 1999 ; Mendelsohn et al. 2000 ; Tol et al. 2004 ; Füssel 2009a ) .
When vulnerability is considered at the level of individuals or households, the particular vulnerability of the poor is due the following factors (Blaikie et al. 1994 ; Moser 1998 ; Alwang et al. 2001 ) :
If vulnerability is de fi ned with respect to a particular outcome (e.g., food depri-• vation or falling below the poverty line), poor people are more vulnerable than wealthy people simply because they are already much closer to this outcome. Poor people more often live in regions where the present climate is extreme • (i.e., very hot, dry, and/or variable) or prone to extreme weather events (e.g., tropical cyclones and storm surges). The livelihoods of the poor, in particular the rural poor, are heavily dependent on • natural resources and ecosystems services such as agriculture, fi shery, and the use of forest resources that are particularly sensitive to climatic changes.

16 H.-M. Füssel
Poor people have fewer fi nancial assets and other resources to enable them to adapt • to climate impacts and cope with the consequences of extreme weather events. Poor people generally have less access to weather-related information. As a • result, warnings of extreme weather events may not arrive in time for these people to protect themselves or their property. Poor people are often politically marginalised, such that they are less likely to • receive social services and government funding following a disaster.
In summary, a variety of socio-economic, climatic, and environmental factors make the poor much more vulnerable to climate change than the rich. At the same time, the poor have contributed very little to causing this problem. In other words, global climate change is a problem that historically has been caused mainly by the rich but whose adverse effects impact mostly the poor. Consideration of this “double inequity” (Stern 2007 ) is a key challenge for international climate policy. In particular, poor countries have a moral and a legal claim for international assistance in their efforts to adapt to climate change and to cope with its impacts (see Part II and Chap. 29 ). Given the large amount of past greenhouse gas emissions and the rapidly increasing emissions from emerging economies however, ambitious climate protection goals can only be achieved by cooperation and dedicated action of all large emitters (see Part III).
References
Adger, W. N., & Kelly, M. (1999). Social vulnerability to climate change and the architecture of entitlements. Mitigation and Adaptation Strategies for Global Change, 4 , 253–266.
Alwang, J., Siegel, P. B., & Jorgensen, S. L. (2001). Vulnerability: A view from different disciplines (Social protection Discussion Paper No. 0115). Washington, DC: World Bank. From http://siteresources.worldbank.org/SOCIALPROTECTION/Resources/SP-Discussion-papers/Social-Risk-Management-DP/0115.pdf
Balk, D., & Yetman, G. (2004). The global distribution of population: Evaluating the gains in resolution re fi nement (Documentation for GPW version 3). From http://beta.sedac.ciesin.columbia.edu/gpw/docs/gpw3_documentation_ fi nal.pdf
Blaikie, P., Cannon, T., Davis, I., & Wisner, B. (1994). At risk: Natural hazards, people’s vulner-ability and disasters . London: Routledge.
Cutter, S. L. (1993). Living with risk . London: Edward Arnold. Cutter, S. L. (1996). Vulnerability to environmental hazards. Progress in Human Geography, 20 ,
529–539. Downing, T. E., & Patwardhan, A. (2004). Assessing vulnerability for climate adaptation. In
B. Lim & E. Spanger-Siegfried (Eds.), Adaptation policy frameworks for climate change: Developing strategies, policies, and measures . Cambridge: Cambridge University Press (chapter 3).
Eriksen, S., & Kelly, P. (2007). Developing credible vulnerability indicators for climate adaptation policy assessment. Mitigation and Adaptation Strategies for Global Change, 12 (4), 495–524.
Füssel, H.-M. (2007). Vulnerability: A generally applicable conceptual framework for climate change research. Global Environmental Change, 17 , 155–167.
Füssel, H.-M. (2009a). New results on the in fl uence of climate on the distribution of population and economic activity (MPRA Paper No. 13788). From http://mpra.ub.uni-muenchen.de/13788/

172 Vulnerability to Climate Change and Poverty
Füssel, H.-M. (2009b). Review and quantitative analysis of indices of climate change exposure, adaptive capacity, sensitivity, and impacts (Background note to the World Development Report 2010). Washington, DC: World Bank. From http://siteresources.worldbank.org/INTWDR2010/Resources/5287678-1255547194560/WDR2010_BG_Note_Fussel.pdf
Füssel, H.-M. (2010). How inequitable is the global distribution of responsibility, capability, and vulnerability to climate change: A comprehensive indicator-based assessment. Global Environmental Change, 20 , 597–611.
Gall, M. (2007). Indices of social vulnerability to natural hazards: A comparative evaluation . PhD thesis. University of South Carolina. Columbia, SC. From http://webra.cas.sc.edu/hvri/education/docs/Melanie_Gall_2007.pdf
Gow, G. A. (2005). Policymaking for critical infrastructure . Aldershot: Ashgate. IPCC. (2007). Climate change 2007: Climate change impacts, adaptation, and vulnerability .
Cambridge: Cambridge University Press. Kasperson, J. X., Kasperson, R. E., Turner, B. L., II, Schiller, A., & Hsieh, W. (2005). Vulnerability
to global environmental change. In J. X. Kasperson & R. E. Kasperson (Eds.), Social contours of risk (Risk analysis, corporations & the globalization of risk, Vol. II, pp. 245–285). London: Earthscan (chapter 14).
Kelly, P. M., & Adger, W. N. (2000). Theory and practice in assessing vulnerability to climate change and facilitating adaptation. Climatic Change, 47 , 325–352.
Klein, R. J. T. (2009). Identifying countries that are particularly vulnerable to the adverse effects of climate change: An academic or a political challenge? Carbon and Climate Law Review, 3 , 284–291.
Mendelsohn, R., & Schlesinger, M. (1999). Climate-response functions. Ambio, 28 (4), 362–366. Mendelsohn, R., Morrison, W., Schlesinger, M., & Adronova, N. (2000). Country-speci fi c market
impacts from climate change. Climatic Change, 45 (1), 553–569. Mendelsohn, R., Dinar, A., & Williams, L. (2006). The distributional impact of climate change on
rich and poor countries. Environment and Development Economics, 11 (2), 159–178. Moser, C. O. N. (1998). The asset vulnerability framework: Reassessing urban poverty reduction
strategies. World Development, 26 , 1–19. New, M., Lister, D., Hulme, M., & Makin, I. (2002). A high-resolution data set of surface climate
over global land areas. Climate Research, 21 (1), 1–25. O’Brien, K., Eriksen, S., Nygaard, L. P., & Schjolden, A. (2007). Why different interpretations of
vulnerability matter in climate change discourses. Climate Policy, 7 , 73–88. Paeth, H., & Thamm, H.-P. (2007). Regional modelling of future African climate north of 15
degrees S including greenhouse warming and land degradation. Climatic Change, 83 (3), 401–427.
Paeth, H., Scholten, A., Friederichs, P., & Hense, A. (2008). Uncertainties in climate change predic-tion: El Niño-Southern Oscillation and monsoons. Global and Planetary Change, 60 , 265–288.
Stern, N. (2007). The economics of climate change: The Stern review . Cambridge: Cambridge University Press.
Tol, R. S. J., Downing, T. E., Kuik, O. J., & Smith, J. B. (2004). Distributional aspects of climate change impacts. Global Environmental Change, 14 (3), 259–272.
Turner, B. L., II, Kasperson, R. E., Matson, P. A., McCarthy, J. J., Corell, R. W., Christensen, L., Eckley, N., Kasperson, J. X., Luers, A., Martello, M. L., Polsky, C., Pulsipher, A., & Schiller, A. (2003). A framework for vulnerability analysis in sustainability science. Proceedings of the National Academy of Sciences, 100 , 8074–8079.
UNDP. (2007). Human development report 2007/2008 . New York: United Nations Development Programme. From http://hdr.undp.org/en/media/HDR_20072008_EN_Complete.pdf
Villagrán De León, J. C. (2006). Vulnerability: A conceptual and methodological review (SOURCE No. 4/2006). Bonn: UNU-EHS. From http://www.ehs.unu.edu/ fi le/get/3904
Vincent, K. (2007). Uncertainty in adaptive capacity and the importance of scale. Global Environmental Change, 17 (1), 12–24.
Wheeler, D. (2011). Quantifying vulnerability to climate change: Implications for adaptation assistance (CGD Working Paper 240). Washington, DC: Center for Global Development. From http://www.cgdev.org/content/publications/detail/1424759