Climate Change Intelligence For All Dr. Mark Chandler and Dr. Linda Sohl, NASA/GISS, Columbia...
16
Climate Change Intelligence For All Dr. Mark Chandler and Dr. Linda Sohl, NASA/GISS, Columbia University Dr. Galen McKinley, University of Wisconsin, Atmospheric and Oceanic Science Dr. Jack Williams, University of Wisconsin, Geography edgcm.columbia.edu
-
Upload
dylan-eaton -
Category
Documents
-
view
217 -
download
4
Transcript of Climate Change Intelligence For All Dr. Mark Chandler and Dr. Linda Sohl, NASA/GISS, Columbia...

Climate Change Intelligence For All
Dr. Mark Chandler and Dr. Linda Sohl, NASA/GISS, Columbia UniversityDr. Galen McKinley, University of Wisconsin, Atmospheric and Oceanic SciencesDr. Jack Williams, University of Wisconsin, Geography
edgcm.columbia.edu

The Greenhouse Effect

Allow educational institutions and individuals to run a global climate model on desktop computers
Encourage students to participate in the full scientific process• Experiment design• Running simulations• Analyzing data• Reporting on results
Facilitate collaborations between schools, universities, national labs, and the private sector so students become familiar with the role of teamwork in scientific research.
Demystify how scientists forecast future climate change as a way to deal with public skepticism about global warming.
EdGCM Project Objectives

GCM: General Circulation ModelGCM: Global Climate Model

At every grid cell GCMs calculate:
Temperature (T)Pressure (P)Winds (U, V)Humidity (Q)
Fundamental Physical Quantities

Seasonal and Diurnal CyclesLatent and Sensible Heat FluxesClouds and ConvectionPlanetary Boundary LayerGreenhouse GasesAerosolsSea IceGround HydrologyOcean Heat TransportOcean CirculationDynamic VegetationDynamic Ice SheetsCarbon Cycle Chemistry
Physical Processes Simulated by GCMs

Fundamental Physical Equations:
Tools of the Trade: Global Climate Models
(Henderson-Sellers, 1985)

Increased Grid ResolutionRequires Increased Computing Power
Rule of thumb:10X more CPUfor a doubling ofresolution
Increased Resolution RequiresIncreased Computing Resources
2000’s
1980’s(EdGCM)
1990’s

Global_Warming_Sim2.R Model II 8/24/2000
Owner: Dr. Mark Chandler, [email protected]: Paleoclimate GroupThis experiment simulates climate change based on a1 percent/year increase in CO2
Object modules:MainC9 DiagC9 RadC9FFTC9UTILC9
Data input files:7=G8X10_600Ma9=NOV1910.rsf_snowball15=O8X10_600Ma19=CD8X10_600Ma23=V8X10_600Ma26=Z8X101_600Ma21=RTAU.G25L1522=RPLK2529=Snowball_Earth_Regions
Label and Namelist:Global_Warming_Sim2 (Transient increase in CO2)
&INPUTZ TAUI=10176.,IYEAR=1900, KOCEAN=1, SRCOR=.95485638151, S0X=1.,CO2=.31746031746031, USET=0.,TAUE=35040., USESLP=-12., ISTART=3,KCOPY=2,NDPRNT=-1,TAUE=10177.,TAUP=95616.,
C** INITIALIZE SOME ARRAYS AT THE BEGINNING OF SPECIFIED DAYS fName = './prt/'//JMNTH0(1:3)//CYEAR//'.prt'//LABEL1(
IF(JDAY.NE.32) GO TO 294 JEQ=1+JM/2 DO 292 J=JEQ,JM DO 292 I=1,IM 292 TSFREZ(I,J,1)=JDAY JEQM1=JEQ-1 DO 293 J=1,JEQM1 DO 293 I=1,IM 293 TSFREZ(I,J,2)=JDAY GO TO 296 294 IF(JDAY.NE.213) GO TO 296 JEQM1=JM/2 DO 295 J=1,JEQM1 DO 295 I=1,IM 295 TSFREZ(I,J,1)=JDAY C**** INITIALIZE SOME ARRAYS AT THE BEGINNING OF EACH DAY 296 DO 297 J=1,JM DO 297 I=1,IM TDIURN(I,J,1)=1000. TDIURN(I,J,2)=-1000.
TDIURN(I,J,6)=-1000.
PEARTH=FDATA(I,J,2)*(1.-FDATA(I,J,3)) IF(PEARTH.GT.0.) GO TO 297 TSFREZ(I,J,1)=365. TSFREZ(I,J,2)=365. 297 CONTINUE
But, What Is a GCM really?: A Computer Program
Unix scripts and Fortran CodeRequiring significant programming skills to operate

A Global Climate Model- NASA/GISS Model II
A suite of software wrapped around a GCM to make it easier to operate the GCM, post-process and visualize the simulated climate variables, and organize the large volumes of input and output data.
Educational Global Climate Model
What is EdGCM?

Other Computer Code Wrappers
BLUE ICE: NCAR - Boulder, ColoradoBLUE ICE: NCAR - Boulder, Colorado

Design, Run, Organize Experiments
EdGCM
Analysis and Visualization
EdGCM
Post-process all of the binary GCM output (hundreds of climate variables)
Allow teachers to define variable setsScientific Visualization
Color and contour maps
Line plotsData
spreadsheets
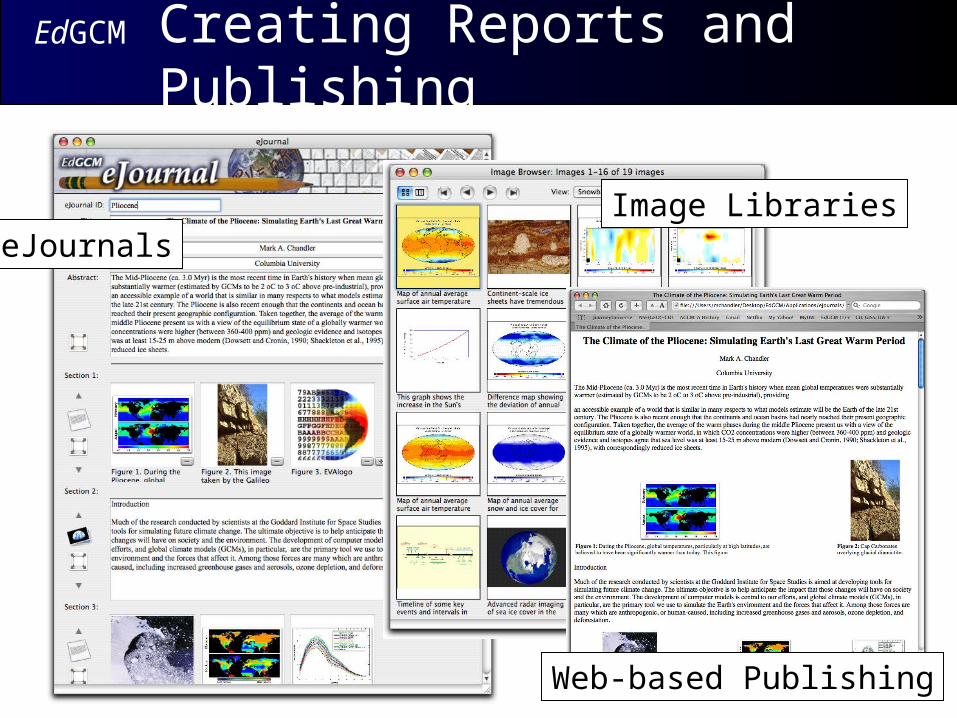
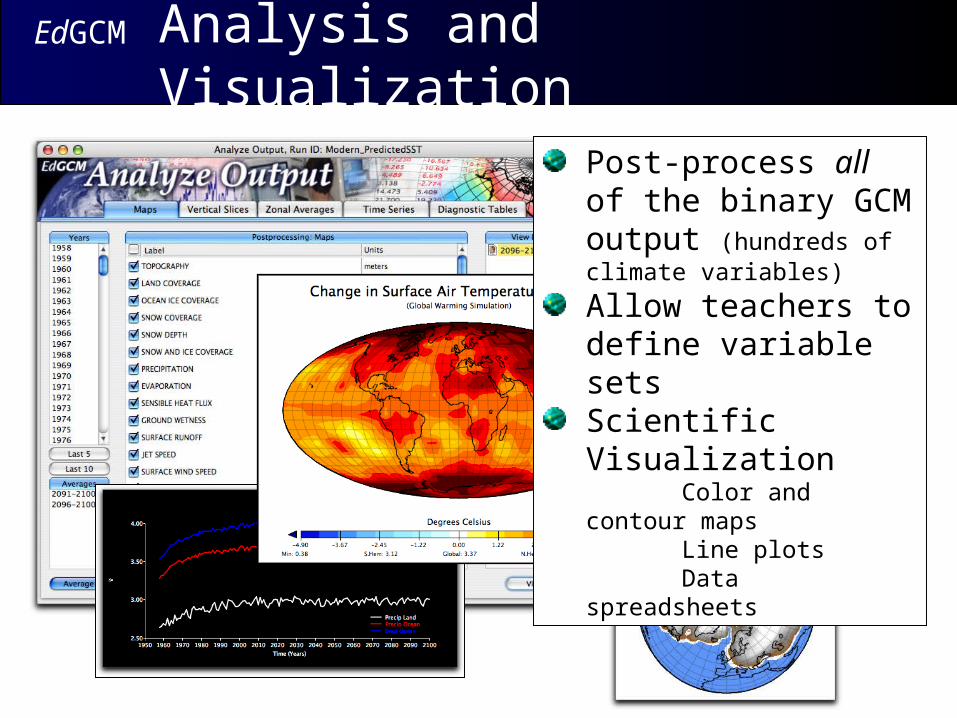
eJournalsImage Libraries
Web-based Publishing
Creating Reports and Publishing
EdGCM

The EdGCM Cooperative Website
Download Software and MaterialsSupport and Discussion ForumsCommunity and Student ShowcasesVideo Tutorials and Manuals

Distribution
edgcm.columbia.edu
Over 40,000 copies in distribution, on 7 continents