Climate Change, Gender Equality, and...
46
Climate Change, Gender Equality, and Conflict Mattias OTTERVIK * 1 and Jadice LAU †2 1,2 Department of Government and Public Administration , The Chinese University of Hong Kong March 24, 2017 Abstract What is the relationship between climate change, gender equality, and conflict? Longitudinal studies of China, the Middle East, and elsewhere show that food scarcity in the wake of climate change increases regional conflict. Relatedly, societies with higher levels of gender inequality tend to be more violent, as well as have higher birth rates. In theory, gender equal- ity could be a critical mediating factor between climate change and regional conflict by affecting the propensity for conflict and food scarcity. This pa- per addresses what role, if any, gender equality can play in ameliorating or exacerbating the impact of climate change on national and regional conflict. Using a quantitative study this research shows how gender equality affects development and demographics, which plays a key role in the link between climate change and regional conflict. This supports a growing body of re- search which suggests that gender equality is as much a practical problem as it is a moral one, and that gender equality is a precondition for, not merely the result of, peaceful and sustainable development. Keywords: Climate Change, Gender Equality, Conflict * [email protected] † [email protected] 1
Transcript of Climate Change, Gender Equality, and...
Climate Change, Gender Equality, andConflict
Mattias OTTERVIK*1 and Jadice LAU†2
1,2 Department of Government and Public Administration , TheChinese University of Hong Kong
March 24, 2017
Abstract
What is the relationship between climate change, gender equality, andconflict? Longitudinal studies of China, the Middle East, and elsewhereshow that food scarcity in the wake of climate change increases regionalconflict. Relatedly, societies with higher levels of gender inequality tend tobe more violent, as well as have higher birth rates. In theory, gender equal-ity could be a critical mediating factor between climate change and regionalconflict by affecting the propensity for conflict and food scarcity. This pa-per addresses what role, if any, gender equality can play in ameliorating orexacerbating the impact of climate change on national and regional conflict.Using a quantitative study this research shows how gender equality affectsdevelopment and demographics, which plays a key role in the link betweenclimate change and regional conflict. This supports a growing body of re-search which suggests that gender equality is as much a practical problem asit is a moral one, and that gender equality is a precondition for, not merelythe result of, peaceful and sustainable development.
Keywords: Climate Change, Gender Equality, Conflict
*[email protected]†[email protected]
1
Contents1 Introduction 3
2 Literature Review 42.1 Conceptualization of Conflict . . . . . . . . . . . . . . . . . . . . 42.2 Climate Change, Institutions, and Conflict . . . . . . . . . . . . . 5
2.2.1 Climate and Conflict . . . . . . . . . . . . . . . . . . . . 62.2.2 Institutions and Conflict . . . . . . . . . . . . . . . . . . 72.2.3 Gender, Development, and Conflict . . . . . . . . . . . . 8
2.3 Research Lacunae . . . . . . . . . . . . . . . . . . . . . . . . . . 10
3 Hypothesis 11
4 Research Design 134.1 Method of Analysis . . . . . . . . . . . . . . . . . . . . . . . . . 134.2 Operationalization of Variables . . . . . . . . . . . . . . . . . . . 15
5 Results and Interpretation 205.1 Step One: Gender Equality and Demographic Pressure . . . . . . 205.2 Step Two: Gender Equality and Conflict . . . . . . . . . . . . . . 215.3 Step Three: Path Analysis of Relationship Between Climate Change,
Gender, and Conflict . . . . . . . . . . . . . . . . . . . . . . . . 23
6 Conclusion 25
A Countries List 36
B Cross Sectional Analysis 40
C Regional Heterogeneity 45
2
Climate Change, Gender Equality, and Conflict
1 IntroductionThere is a growing body of scholarly research on the effects of climate change onconflict. This relationship has been examined by a number of scholars in differentregions. In China, longitudinal quantitative studies show that in the past 1,000years dynastic change and wars usually occurred during colder periods (Zhanget al. , 2006). The same but a weaker relationship was found in European history,where violent conflict was more intense when temperature fell (Tol & Wagner,2010). Lower temperatures in China and in Europe reduced food production,creating a Malthusian crisis that then led to social conflict, war, and in the caseof China, dynastic collapse.1 Some scholars studying the relationship betweenclimate change and conflict have turned their attention to the relationship in thecurrently conflict-ridden region the Middle East, and found that violent riots inthe past decade coincided with rapid rises in the global price of food, which wasdriven by a long period of droughts and a decrease in food supply (Lagi et al. ,2011). According to the Intergovernmental Panel on Climate Change (IPCC), theworld is now on the precipice of unprecedented climate change. The relationshipbetween climate change and conflict is therefore of increasing importance for thestudy of political science.
Institutions play a determinative role in economic productivity and escalat-ing or deescalating conflict. The debate over what these institutions are usuallyinclude, but are not limited to, regime type, quality of government, civilizationwhich includes Islamic culture and ethnic fractionalization, economic develop-ment, domestic institutions and historical roots. Of particular note is genderequality which is implicated in population growth, human capital formation thatincrease productivity, as well as conflict-level. All three have significant impacton a society’s response to climate change. This research is thus an investigationof how institutional factors in general, and gender equality in particular, can affectthe impact of climate change on conflict. The specific research question is doesgender equality mediate the effects of climate change on demographic pressure,and on conflict. The general contribution of the paper is that it starts the discussionof how institutions matter in the climate change-conflict relationship.
By addressing the desegregation of climate change-conflict studies from otherconflict researches, this paper acts as a bridge for both schools of study. If it showsthat the effect of climate change on conflict is not inevitable and direct, but con-tingent on other institutional factors, importantly and primarily gender equality.
1 A Malthusian crisis is a situation in which the population in a given area has exceeded its foodsupply and therefore mass starvation results.
3
Gender equality in particular appears to play a decisive part role in determininglevel of demographic pressure, and therefore conflict, once direct and indirect ef-fects are taken into account. Given the increasing likelihood that the world isfacing inevitable climate change, which have had dramatic consequences histori-cally, identifying the factors that ameliorate or exacerbate the social consequencesof climate change becomes critical.
This paper is divided into five sections. After this introduction, section 2 pro-vides a literature review on three areas: the conceptualization of conflict, the re-cent development of studies in the relationship between climate change and con-flict, and institutional factors for conflict. Based on the literature review the twohypotheses are formulated and presented in section 3. Section 4 then lays out theresearch design of the paper. It includes the description of the method of analysis,and the operationalization of variables and data sources. Section 5 discusses theresults and the interpretation of the results. Finally, the proposal is concluded insection 6.
2 Literature ReviewLargely due to the statistical sophistication in the field, there are different possi-bilities in conceptualizing conflict, and explaining it by climate change and otherinstitutions with the provision of empirical evidence. This section examines theseareas in sections 2.1 and 2.2, and addresses the research lacunae in section 2.3.Based on the literature review and research lacuna, section 2.3, closes with a re-search question and how study’s contribution to the field.
2.1 Conceptualization of ConflictConflict analyses have traditionally included all levels of conflict, from intra-personal conflict through to international conflict, and all stages of conflict es-calation and de-escalation (Ramsbotham et al. , 2011, p. 5). Some analysts onlyfocus on actual or potentially violent conflicts, while some others include differentlevels of political tension and emergent conflict.2 Despite the variety of concep-tualization of conflict, they can usually be analyzed in four ways: actor (whetherconflict is inter-state, intra-state, or extra-system), action (whether violent or non-violent), consequence (whether the conflict leads to a certain number of deaths),
2 For example, Escola de Cultura de Pau (ECP), based at the Autonomous University inBarcelona, measures political tension and emergent conflict in addition to manifest conflict; theConflict Barometer, developed at the University of Heidelberg and located within the Institutefor International Conflict Research (HIIK), also includes latent and emergent conflicts.
4
and issue (i.e. the reasons for the conflict).3
In this study, conflict is defined as the clashing of interests (positional differ-ences) over a certain issue of some duration and magnitude between at least twoparties, involving at least one state and one societal actor on each side of the con-flict, that are determined to pursue their interests and achieve their goals with theuse of violent force.4 It mainly covers intra-state wars for two reasons. First, cli-mate change-precipitated conflict is generally triggered by domestic demographicpressures (Zhang et al. , 2011). Second, interstate conflict has largely disappearedfrom the international system because of the territorial integrity norm enshrined inthe United Nations Charter (see Hui, 2005, p. 236-237), and most conflicts todayare either intrastate or internationalized intrastate conflicts (Harbom & Wallen-steen, 2010).
2.2 Climate Change, Institutions, and ConflictThis research builds on three literatures. The first is on the relationship betweenclimate change, food scarcity, social unrest, political instability and conflict (Zhanget al. , 2006, 2007; Zhang & Lee, 2010; Zhang et al. , 2011; Hsiang et al. , 2013;Hsiang & Burke, 2014). The second literature is on conflict itself. Political in-stitutions are the recurring theme in descriptions of major political instability andcollapse (Sørli et al. , 2005; Huntington, 1993, 1996; Fox & Sandler, 2004; Lai,2006; Montalvo & Reynal-Querol, 2005; Fearon & Laitin, 2001; Collier & Hoef-fler, 1998, 2004; Solingen, 2007; Fearon & Laitin, 2014; Halliday, 2005, p. 35-40). Finally, the third literature is on gender equality, conflict, and development,and how the position of women in a society affect how conflict-prone that societyis, state capacity (and thereby ability to provide public goods), and the humancapital formation required for development (Hudson, 2011; Hudson et al. , 2012,2015; Bowen et al. , 2015; Weiner, 2013; Dollar et al. , 1999; Swamya et al. ,2001; Wängnerud, 2010, 2012; Fatima, 2013). Read in sequence these literaturessuggest a causal relationship between climate change and conflict, but a relation-ship that is mediated by human institutions in general, and gender equality inparticular.
3 Examples of extra-systemic conflicts include imperial war, colonial war and internationalizedcivil war, (see Singer & Small, 1972, p. 381-382). Most studies since the 1950s confined thefield to interstate and related wars above a certain measurable threshold, such as the Correlatesof War (COW) Project, and University of Uppsala Conflict Data, which both define conflict asones that involve 1,000 or more deaths. This dimension is specifically required by in Universityof Uppsala Conflict Data Project. Unlike other datasets that only identify the actors and actions,this dataset “requires that the conflict should have an issue, an incompatibility”, see Wallensteen,2002, p. 24.
4 This conceptualization aligns with the definition of conflict suggested in Conflict Barometerdeveloped by the Heidelberg Institute for International Conflict Research (HIIK).
5
2.2.1 Climate and Conflict
Most of the research on climate and human conflict is very recent. In a state of thefield published in Science in 2014, 75 percent of the cited research was publishedafter 2009 and the median year of publication was 2011 (Hsiang & Burke, 2014).While different studies have focused on different regions, different periods, anddifferent levels of violence, the research suggests conflicts “at all scales and levelsof organization appear susceptible to climatic influence, and multiple dimensionsof the climate system are capable of influencing these various outcomes” (Hsiang& Burke, 2014, p. 1235367-1235369). The basic finding of studies on climatechange and conflict is that they are highly co-morbid. Conflict seems to follow inthe trails of climate change.
While the causal mechanism varies somewhat between studies, a generalizedmodel might be derived from Zhang et al. (2011). Food scarcity, or abundance, isthe driver. Changes in climate naturally affect the carrying capacity, the pop-ulation size the environment of a region can sustain, through changes in bio-productivity. For example, cold weather reduces the length of the growing sea-son, growth, and thereby food resources. Warmer periods, that are not droughts,increase food yields. Increases in carrying capacity promote peace and popula-tion growth, as in the case of the European Renaissance and then Enlightenment.Reductions in carrying capacity have three effects, famine, migration, and socialdisturbance, the latter of which often devolves to war. Sustained reductions incarrying capacity precipitate a Malthusian crisis and population crashes throughepidemics, war, and famine. Or, to put it differently, Pestilence, War, and Famine,and Death, prefer extended periods of cold and drought.
Research on the link between climate change and conflict can be roughly di-vided into two larger groups according to time coverage (see Hsiang et al. , 2013).Long-run studies cover several centuries and offer largely correlational evidencefor a causal link between climate change, conflict, and societal collapse. Thesestudies generally, but not always, cover institutional breakdown, population col-lapses and larger conflicts. An example of long-run studies is Zhang et al. (2006),which finds that in China “climatic change indeed played a very important role inthe switch of dynasties and the associated societal evolution, and was the majorunderlying cause of wars and cyclic population variations” (p. 474). This gen-eral pattern holds true for China (Zhang et al. , 2007; Zhang & Lee, 2010), aswell as pre-industrial Europe (Zhang et al. , 2011). Climate induced food scarcityappears to be a factor in events as diverse as the politico-economic turmoil ofthe Late Bronze Age Crisis (Kaniewski et al. , 2013), as well as for the regionsaffected by the Asian-Australian monsoon (Yancheva et al. , 2007).
Short-run studies cover several decades, and often focus on smaller phenom-ena, such as violent crime rather than inter- or intragroup conflicts (e.g. Andersen
6
& Mikkelsen, 2014; Jacob et al. , 2007; Ranson, 2014). However, the wars andrefugee crises in the Middle East have brought the focus to the relationship be-tween climate and larger conflicts. Cook et al. (2016) found that the Levant islikely experiencing the driest fifteen year period in 900 years. In particular, theconflict in Syria is connected to water scarcity caused by the region-wide droughtGleick (2014)); Kelleya et al. (2015); Worland (2015). In line with the causalmodel outlined in Zhang et al. (2011), food prices drives conflict, and researchon the global food price index, tracked by Food and Agriculture Organization ofthe United Nations (UNFAO), over the last decade suggests that political unrestis clustered around spikes in food prices (Lagi et al. , 2011; Brinkman & Hen-drix, 2011; Goldstone, 2011). In that vein, Malthus, not Voltaire, best explains theso-called Arab Spring, and the subsequent chaos (Perez & Stecker, 2013).
The strength of long-run, longitudinal studies such as those enabled by millen-nium long data is that they offer insight into a long-run relationship. The weak-ness, however, is that they offer few controls. In particular institutions are prob-lematic to control for, yet they seem to have a considerable effect, as evidencedby the fact that the relationship between climate change and conflict disappearsin Europe at the time of industrialization (Tol & Wagner, 2010). Industrializa-tion coincided with a number of institutional changes in Europe, the formation ofthe modern state (Tilly, 1992), democratic policies (which, according to AmartyaSen, eliminates starvation as well as enables non-violent conflict), reduced ethno-linguistic fractionalization (Weber, 1976; Anderson, 2006), concomittant withcomparatively high levels of gender equality through education of women, whichreduced fertility rates and increased human capital formation (Knodel & van deWalle, 1979). Conversely, the Middle East and North Africa which seems en-gulfed in the sort of Mathusian crisis described by Zhang et al. and others, havepoorly institutionalized states (see e.g. Weiner, 2013), low levels of democracy,low gender equality with high fertility rates, and low educational attainment lev-els for women, and overall low levels of human capital formation. These factorshave implications for carrying capacity, resource distribution, and conflict predis-position and resolution. The question is of course which factors precipitate orprevent a Malthusian crisis.
2.2.2 Institutions and Conflict
The second literature, that on conflict itself, is in some ways the mirror image ofthe literature on climate change and conflict. Institutions, as broadly defined byDouglass North, refer to humanly devised constraints that shape human interac-tion and structure incentives in exchange, no matter they are political, social oreconomic (North, 1994). From Brinton (1965)’s seminal work on social revolu-tions onwards this literature is exclusively focused on social institutions and se-
7
quencing of various stages of social unrest (Knutsen & Bailey, 1989; Tilly, 1992;Mann, 1984; Migdal, 1988; Migdal et al. , 1994; Hui, 2005). While hardship ingeneral, and food scarcity in particular, is a recurring theme in descriptions ofmajor political instability and conflict, it is merely mentioned in passing. Simi-larly, Collier and Hoeffler’s general model of civil war also argues that economicdevelopment and growth generally decrease the likelihood of conflict (Collier &Hoeffler, 1998, 2004). Other institutions including governance, regime types, civ-ilization including Islamic culture and ethnic fractionalization, and historical rootshave been argued to affect conflict by different scholars (Sørli et al. , 2005; Hunt-ington, 1993, 1996; Fox & Sandler, 2004; Lai, 2006; Montalvo & Reynal-Querol,2005; Fearon & Laitin, 2001; Collier & Hoeffler, 1998, 2004; Solingen, 2007;Fearon & Laitin, 2014; Halliday, 2005, p. 35-40). After all, institutions are be-lieved to be able to affect how conflicts are mediated, and would play a role indetermining how and whether social unrest escalates to regime instability.
2.2.3 Gender, Development, and Conflict
The third literature, on the relationship between gender equality on developmentand conflict can be divided into two. The first is on the link between genderequality and social and economic development. The second is on the link betweengender equality and the overall level of conflict in a society. In relation to theoverall relationship between climate change and conflict, gender equality can beexpected to affect the carrying capacity of a region by affecting population sizeand growth, and the overall economic productivity of the population. Genderequality also appears to affect how conflicts are resolved, as societies that areviolent towards women tend to have weaker states and are more violent overall.
From Friedrich Engels (1962) Origin of the Family, Private Property, and theState, originally published in 1884, through early and latter Modernization theo-rists gender equality was generally considered a product of social and economicdevelopment (Tipps, 1973; Inglehart & Welzel, 2009; see also Scott, 1996, p. 23-32. Following Boserup (1970) scholars made the critical connection between howwomen’s work affected their status in society (Rai, 2011, p. 29-30). In the late1990s a number of scholars found evidence for the reverse of what Engels andothers had posited, namely that gender equality affects rather than is a productof social and economic development. Daniel Kauffman of the World Bank wasone of the first to mention a possible link between gender equality and corruption(1998, p. 144). A year later Dollar et al. (1999) found a link between femaleparticipation in government and lower levels of corruption, consistent with micro-level evidence that “women may have higher standards of ethical behavior andbe more concerned with the common good” (p. 6). Later studies have replicatedthese results (see e.g. Swamya et al. , 2001; Wängnerud, 2010, 2012). Although
8

some have questioned the causal nature (see Sung, 2003), the relationship appearsto be widely agreed upon (Wängnerud, 2010, p. 4). Dollar et al. (1999) was writ-ten as part of a larger policy research project initiated by the World Bank, whichconcludes that “gender equality is an important part of a development strategy thatseeks to enable all people – women and men alike – to escape poverty and improvetheir standard of living” (World Bank, 2001, p. 1; see also UNICEF, 2007).
Gender equality does not only affect the overall level of development, but itseems to have a multiplier effect on development. In developing countries dif-ferences in human capital (education, age, and experience) between husband andwife has a significant effect on the education of children; the more human capitalthe wife has relative to her husband, the more tends to be spent on the educationof their children (Quisumbing & Maluccio, 1999; see also Burnet, 2011; Got-tlieb et al. , 2015). These results largely agree with developed countries, wherethe proportion of women in parliament is positively correlated with the sort ofsocial spending (Oskarsson & Wängnerud, 1995; Bolzendahl, 2009; Wängnerud,2009) that’s good for human capital formation, namely education and health care.Similarly, the higher women’s relative income are, the higher savings tend to be(Floro & Seguino, 2002). On a micro-level, Kristof & Wudunn (2009) write that“[b]ecause men now typically control the purse strings, it appears that the poorestfamilies in the world typically spend approximately ten times as much (20 percentof their income on average) on a combination of alcohol, prostitutes, candy, sug-ary drinks, and lavish feasts as they do on educating their children” (loc. 3565).Women who receive education have fewer, healthier, and better educated chil-dren (LeVine et al. , 2001; World Bank, 2001; see Currie, 1999; Deutsch, 1998).On a macro-level, gender equality promotes the human capital formation for girlsand boys, that increases social and economic development. The effect of genderequality goes further than human capital formation, and is, as suggested by Dol-lar et al. (1999), to have an effect on how countries are governed. For example,Fish (2002) argues that it is the lack of gender equality in the Muslim world thatexplains the lack of democracy, and poor governance broadly.
In the decade between 2000 and 2009 about three quarters of a million aca-demic articles and books were published on the topic corruption, representing a90-fold increased over the 1860-1969 decennial average. This recent academicinterest in corruption can likely be traced to two parallel discoveries. The firstwas that the electoral democracies of the West were not immune to corruption,or leastways not immune to the perception of corruption (Heywood, 1997). Thesecond was the importance of ‘good’ governance, and how uncorrupt governanceaffects development. Most scholars who have studied the subject have found thatthe relationship is causal, with corruption reducing social and economic devel-opment (Rothstein, 2014, p. 737). Corruption has generally been conceived ofas an agent-principal problem (see Rose-Ackerman, 2008, p. 552), with a sim-
9
ple remedy: changing the pay-off structure, i.e. increase punishment and reducepayouts and increased oversight of agents by the principal. In countries wherereforms of this nature have been enacted the results have been striking: “accord-ing to all available measures, in most countries that were plagued by widespreadcorruption before the reforms were initiated, corruption remains rampant even to-day” (Persson et al. , 2013, p. 453). One reason for why is likely that what “wetend loosely to call corruption is often the distribution of favors along clan lines”(Weiner, 2013, p. 81). Clans are in many parts of the world highly salient politicalactors, dominating societies, and individuals, (Weiner, 2013, p. 92), either substi-tuting for, coopting, or penetrating apparently modern governments (Hudson et al., 2015, p. 535). In those societies “government positions are generally sought andused to obtain additional assets for the clan and its members, and not to build upthe broader society or the institutions of the state” (Hudson et al. , 2015, p. 538).
Clans are predominantly, if not exclusively, patrilineal and patrilocal. Womenare often members only through their role as mothers of sons, who remain withinthe clans (Hudson et al. , 2012, loc. 329-336). To wit, “mechanisms of controlover female interests in sex, marriage, and reproduction may in fact be the mostvisible indicators of clan governance” (Hudson et al. , 2015, p. 540), as the verynarrowly defined roles for women are enforced by formal and informal institutions(Hudson et al. , 2012, p. 1352). Women are often subordinated in family law,given few or no rights. Because girls are not and will not be full members ofthe community they are born into, their education is not prioritized. The effectof underinvestment in girls’ education on long-term human capital formation hasbeen discussed previously. Not only does gender equality appear to reduce socialand economic development, but “male-dominant societies with family law thatseverely subordinates women in marriage tend towards state instability” (Bowenet al. , 2015, p. 668). Violence against women in the private sphere raises theoverall level of violence in society, and increases the likelihood of aggressiveaction in the international system (Hudson et al. , 2012).
Given the apparent role that gender equality plays mediating economic growth,population growth, and overall levels of violence, it should be an important me-diator in the causal chain that links climate change with conflict, ameliorating orexacerbating conflict.
2.3 Research LacunaeThis research combines the above three complementary literatures. Longitudinalstatistical studies of the relationship between climate change, social unrest, andconflict present as an important, in political science, generally overlooked causalchain. However, overlooking the role of institutions means that an important factoris left unexplored. In general, institutions can be expected to affect the impact of
10
climate change in two ways. First, institutions affect the level of demographicpressure of a society. High population growth and low food supply is the productnot only of climate change, but also human activity. Economic growth increasesfood supply either through production or import, while low birth rates reduces theecological footprint of a population. Second, institutions affect how conflict aremediated, and act as an important determinant in whether conflict deescalates orescalates. The more specific causal mechanisms of how institutions affect conflictare explained in section 4.
The contributions of this research are twofold. Firstly, understanding the insti-tutional factors that on the one hand reduce the impact of climate change on car-rying capacity and on the other hand serve to reduce the social tensions producedby the reductions in carrying capacity are important in a world which alreadyhas begun to feel the bite of climate change. According to the US Departmentof Defense four out of the ten trends influencing international security in 2010were directly related to climate change and carrying capacity (USJFCOM, 2010),and climate change continues to be a major concern for the department (Revkin,2017). Global climate will become both warmer and cooler as weather eventsbecome more extreme and more frequent (Bernstein et al. , 2007). The earth’scarrying capacity will be reduced especially in the regions that now see the high-est population growth (Bernstein et al. , 2007, p. 48). Secondly, reconciling therecent literature on climate change and conflict with the traditional literature fo-cused on conflict in general serve to contribute to both, strengthening the researchconducted in both.
3 HypothesisThe specific research question is does gender equality mediate the effects of cli-mate change on demographic pressure, and on conflict. The literature reviewin the previous section presented the background for the question. This subsec-tion mainly focuses on explaining the arguments by illustrating the causal mecha-nisms, hypothesis and null hypothesis.
The overall hypothesis is that the relationship between climate change andconflict is considerably mediated by human institutions, in particular gender equal-ity. Specifically:Hypothesis 1: The relationship between climate change and demographic pres-
sure is mediated by gender equality. Gender equality is directly implicatedin population growth and the human capital formation that improves eco-nomic productivity.
Hypothesis 2: Gender equality mediates the link between demographic pressureand conflict.
11
The fundamental micro foundation of the hypothesized causal link betweenclimate change and conflict is the individual-level, rational economic analysis ofthe relative costs and benefits of law abidance or violence. Violent opposition tothe state or societal actors have a potential cost to the violent individual in the formof punishment or retaliation, from imprisonment to death. Violence can also bebeneficial as the violence makes the capture of resources possible. At an aggregatelevel, accounting for individual variation, it is expected that as the relative costsand benefits increase or decrease, the level of violence in a society will be adjustedaccordingly. Widespread, organized intercommunal or intrastate violence is rarewhen resources are plentiful and widely shared because the potential cost of vio-lence will to most individuals outweigh the potential benefits. Conversely, socialpeace becomes hard when organized violence could enable a group of individu-als to capture scarce and necessary resources, especially when not acting will seethem deprived of those resources. A person who can look forward to a relativelylong, healthy, and comfortable life is unlikely to engage or participate in violentconflict. Conversely, a person whose life is likely to be nasty, brutish, and shortwill be highly likely to engage or participate in violent conflict.
Individual-level research shows that individuals who for one reason or anotherhave shorter life expectancies are more likely to engage in risky behaviour (Rosen,1988). Similarly, when and where possible for workers to negotiate a salary, riskyoccupations come with wage premiums proportionate to the age and danger of theoccupation (Aldy & Viscusi, 2008). In Africa young men with or at risk from get-ting HIV/AIDS are significantly more likely to engage in risky behaviour becausetheir expected shortened lifespan changes cost-benefit calculations (Lammers &Wijnbergen, 2008). The individual-level economic cost-benefit analysis in turnwill make societies more or less violent. Societies in which many individualshave more to lose than gain by violence will be peaceful, and societies in whichmany individuals have more to gain than lose will be more violent. The AIDSepidemic in Sub-Saharan Africa offers a natural experiment, which shows that “aone-year increase in life expectancy decreases the probability of civil war by 2.6percentage points” (Kustra, 2016). Climate change promotes violent conflict bychanging the relative cost and benefit of violence. Specifically, reductions in thecarrying capacity of a region reduce the resources available for every individual,meaning that the benefit of the capture of scarce resources will over time reducethe relative cost of violence. The longitudinal research by Zhang et al. and othershave clearly substantiated this relationship, as have more narrow research on thepresent-day Middle East. What is missing from the equation is, however, how theeffect of institutions is like on the causal chain.
Institutions can mediate the effect of climate change on conflict in two ways.First, human institutions affect demographic pressure by increasing or decreas-ing food production and population size. Carrying capacity is a function of bio-
12
productivity, which is affected not only by climate but also human activity. Irri-gation and fertilization can drastically increase the carrying capacity of a region.Alternatively, other forms of economic activity create the resources that can beexchanged for imported food. Similarly, population size is also determined byhuman activity. Reductions in carrying capacity become a problem only if thepopulation is at the limit of a region’s carrying capacity. Second, human institu-tions determine if and how conflicts are resolved. Societies with trusted, impartialpolitical institutions, and a mechanism for the peaceful replacement of leaders arelikely to be less violent. Critical to impartial institutions is impartial treatment ofall citizens, regardless of gender.
4 Research DesignThis is a quantitative study, designed to test the role of institutions on mediatingthe link between climate change and conflict. In particular, gender equality wouldin theory play an important role in mediating the link. Starting from Zhang et al.’sthree-step causal link, i.e. climate change reducing carrying capacity and thenthe reduction of carrying capacity creating social conflict, human institutions ingeneral and gender equality in particular are likely to mediate the link betweenclimate change in two ways, first by reducing the impact of climate change oncarrying capacity, and second by reducing the impact of climate change on theincidence of social conflict.
4.1 Method of AnalysisBecause the link between climate change and conflict is mediated by demographicpressure the analysis is in two steps. First, the effect of gender equality and cli-mate change on demographic pressure is considered. Second, the effect of genderequality and demographic pressure on conflict is considered. Third, The full mod-els are described and tested in sections 5.1 and 5.2. Finally, a path analysis isconducted in two steps in section 5.3.
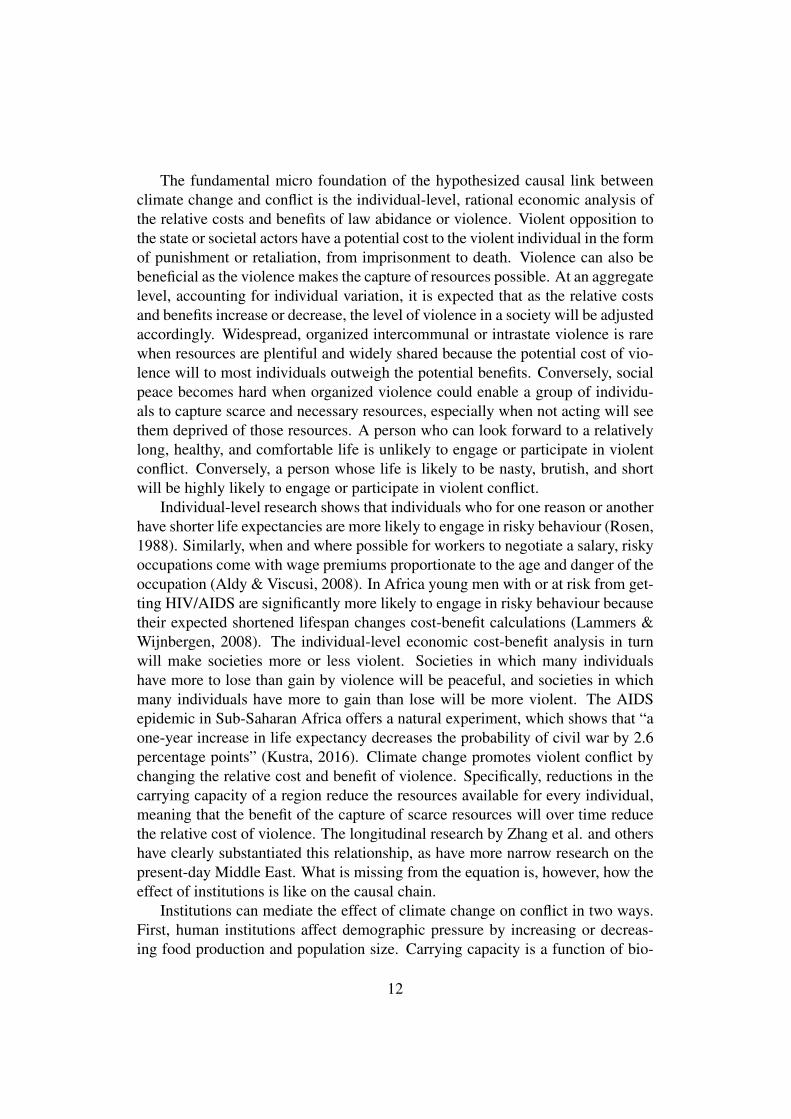
Based on the theoretical model in figure 1 the methodological approach isoutlined as follows. In the first step, the relationship between climate change,gender equality, and demographic pressure is analyzed. Demographic pressureis the dependent variable, and gender equality, climate change (in the form ofclimate events), and GDP per capita are the explanatory variables. Quality ofgovernment or good governance, level of democracy, and conflict, are controlvariables. GDP per capita captures food production or access to imported food,and is therefore an explanatory variable, even if it is also partially determined bygender equality. Good governance plays a critical role in the impartial access to
13
Climate Change, Institutions, and Conflict
DemographicPressure
Gender Equality
Climate Change Conflict
Economic Productivity
Gender Equality
Governance
Figure 1: Theoretical model of climate change, institutions, and conflict
public goods, such as water and irrigation (Rothstein, 2011). Regime type, orlevel of democracy, is included because “no famine has ever taken place in thehistory of the world in a functioning democracy”, not because all democracies arerich but because even in poor countries democratically elected leaders are stronglyincentivized to avert famines (Sen, 2001, p. 16). Finally, conflict is also includedas a control variable for completeness, because conflict, even when precipitatedby demographic pressure, reduces food production. The regression model for stepone is shown in equation (1).
DemoPressureti = β0Conflictti + β1GenderEqualityti+
β2Corruptionti + β3GDPCapitati+
β4ClimateEventsti + β5DemocracyLevelti+
αi + εti
(1)
In the second step the relationship between demographic pressure, genderequality, and conflict is analyzed. Conflict is the dependent variable, and gen-der equality, and governance are the explanatory variables. Impartial and trustedpolitical institutions and gender equality should in theory reduce conflict, with theformer being partially determined by the latter. GDP per capita, level of democ-racy, ethnic fractionalization, and regime durability are control variables. GDPper capita is included because richer societies tend to have fewer conflicts (Collier& Hoeffler, 1998, 2004). Level of democracy is included as it would, in theory,serve as a pressure valve, as the ability to‘throw the bums out’ offers a peacefulalternative to violent protest. Ethnic fractionalization and historical roots havebeen argued to affect conflict by different scholars (Montalvo & Reynal-Querol,
14
2005; Fearon & Laitin, 2001, 2014). Finally, demographic pressure is included asan explanatory variable. The regression model for step two is shown in equation(2).
Conflictti = β0DemoPressureti + β1GenderEqualityti+
β2Corruptionti + β3GDPCapitati+
β4DemocracyLevelti + β5EthnicFractionti+
β6RegimeDurabilityti + αi + εti
(2)
In the third and final step a path analysis is conducted to determine the effectgender equality plays, if any, on the other explanatory variables. In the same waythat the causal chain that links climate change and conflict is considered in twosteps, in the path analysis of the relationship between climate change and demo-graphic pressure and the relationship between demographic pressure and conflict,along with the respective mediators, are considered separately.
In all three steps a fixed effects estimation was conducted for the large-N paneldata to eliminate the time-invariant unobserved effect. All the variables were nor-malized, as discussed below, before running the regression models. The results ofthe regressions are presented and discussed in section 5, Results and Interpreta-tion.
4.2 Operationalization of VariablesAll variables, unless stated, are from the University of Gothenburg Quality ofGovernment (QoG) Institute Standard Dataset. The QoG Institute maintains manydatasets on various aspects of political systems. All variables in the cross-sectionquantitative analysis be found in the 2016 QoG dataset (Teorell et al. , 2016),while the panel data analysis uses a slightly newer version of the QoG datasetwhich offers longer time series of the variables (Teorell et al. , 2017), notably theFund for Peace’s Demographic Pressure and Security Apparatus, the dependentvariables in the two analyses. The Climate Events variable is missing from the2017 QoG dataset and was added from the 2016 QoG dataset.
The gender equality measure is from the UNDP’s Human Development Re-ports (HDR), again with the panel data analysis slightly more recent because ofbetter time-coverage (UNDP, 2015, 2016). The gender equality panel data wascomplemented with data from the 1990 HDR (UNDP, 1990), to extend the timeseries from 1995 to 1990 for about 130 countries. The combined QoG and HDRdataset was cut down to cover 1990 to 2015. The actual dataset is shorter than thisas some of the critical measures, such as governance, demographic pressure, andconflict, begin in 2000 and 2005 respectively.
15
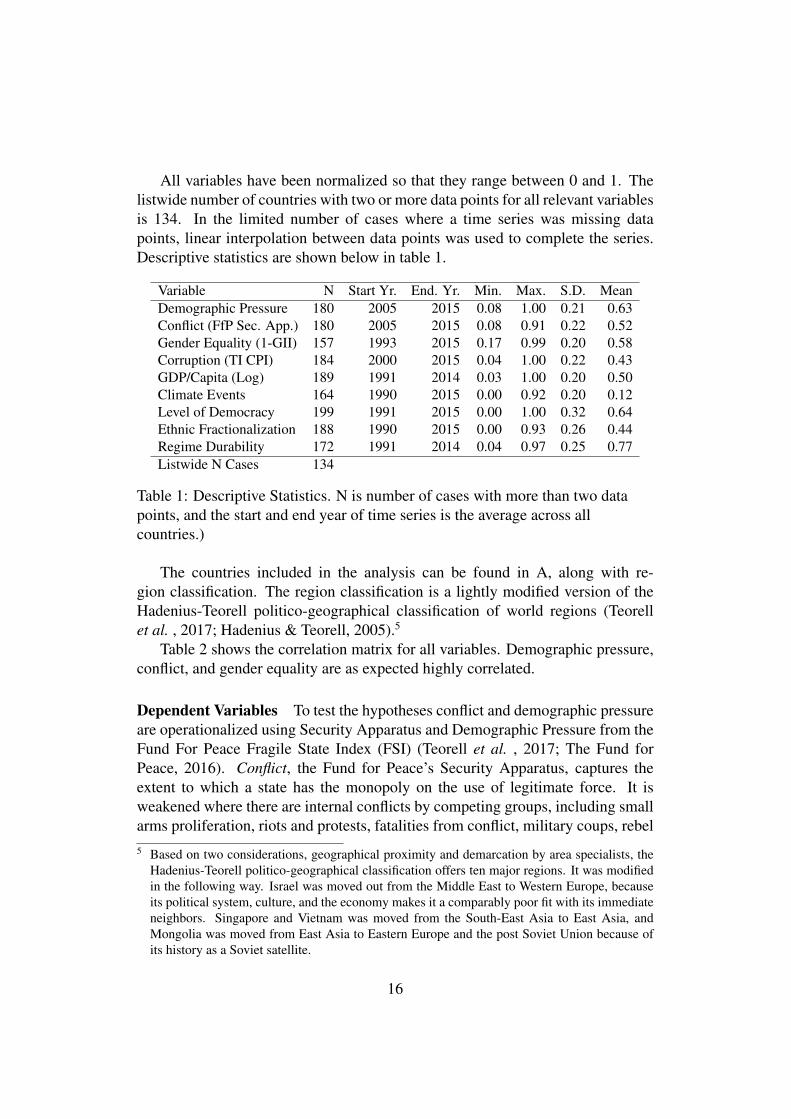
All variables have been normalized so that they range between 0 and 1. Thelistwide number of countries with two or more data points for all relevant variablesis 134. In the limited number of cases where a time series was missing datapoints, linear interpolation between data points was used to complete the series.Descriptive statistics are shown below in table 1.
Variable N Start Yr. End. Yr. Min. Max. S.D. MeanDemographic Pressure 180 2005 2015 0.08 1.00 0.21 0.63Conflict (FfP Sec. App.) 180 2005 2015 0.08 0.91 0.22 0.52Gender Equality (1-GII) 157 1993 2015 0.17 0.99 0.20 0.58Corruption (TI CPI) 184 2000 2015 0.04 1.00 0.22 0.43GDP/Capita (Log) 189 1991 2014 0.03 1.00 0.20 0.50Climate Events 164 1990 2015 0.00 0.92 0.20 0.12Level of Democracy 199 1991 2015 0.00 1.00 0.32 0.64Ethnic Fractionalization 188 1990 2015 0.00 0.93 0.26 0.44Regime Durability 172 1991 2014 0.04 0.97 0.25 0.77Listwide N Cases 134
Table 1: Descriptive Statistics. N is number of cases with more than two datapoints, and the start and end year of time series is the average across allcountries.)
The countries included in the analysis can be found in A, along with re-gion classification. The region classification is a lightly modified version of theHadenius-Teorell politico-geographical classification of world regions (Teorellet al. , 2017; Hadenius & Teorell, 2005).5
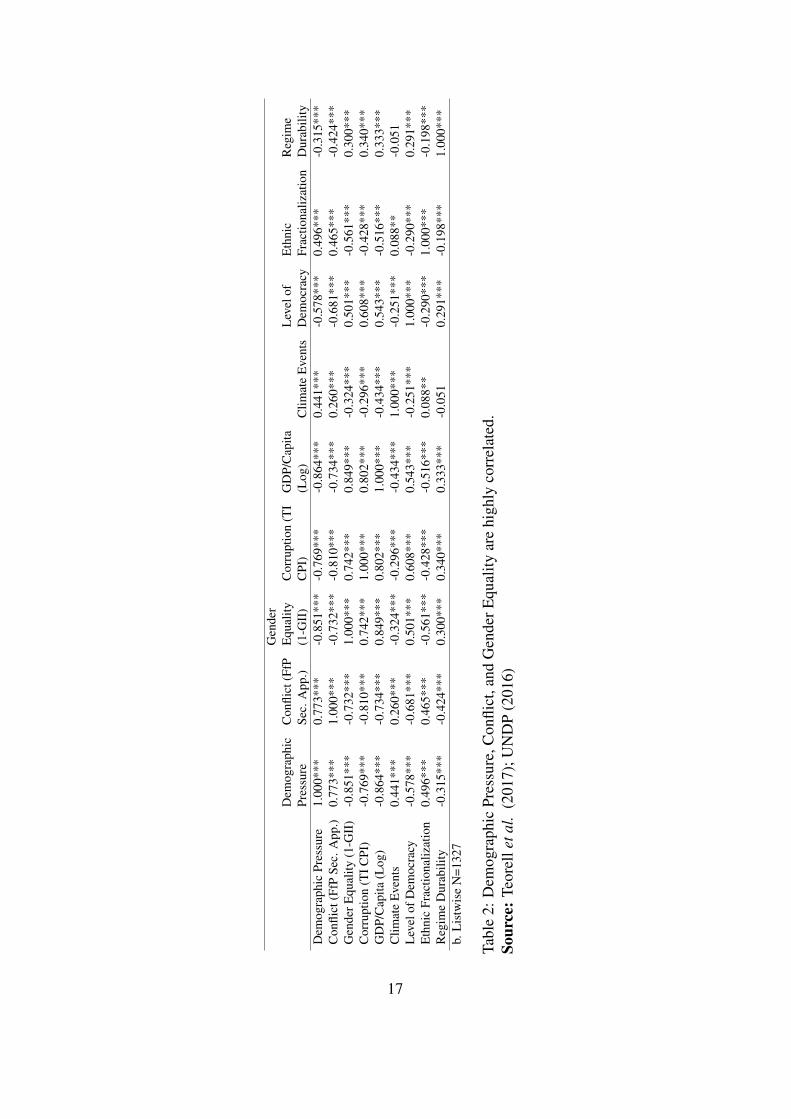
Table 2 shows the correlation matrix for all variables. Demographic pressure,conflict, and gender equality are as expected highly correlated.
Dependent Variables To test the hypotheses conflict and demographic pressureare operationalized using Security Apparatus and Demographic Pressure from theFund For Peace Fragile State Index (FSI) (Teorell et al. , 2017; The Fund forPeace, 2016). Conflict, the Fund for Peace’s Security Apparatus, captures theextent to which a state has the monopoly on the use of legitimate force. It isweakened where there are internal conflicts by competing groups, including smallarms proliferation, riots and protests, fatalities from conflict, military coups, rebel5 Based on two considerations, geographical proximity and demarcation by area specialists, the
Hadenius-Teorell politico-geographical classification offers ten major regions. It was modifiedin the following way. Israel was moved out from the Middle East to Western Europe, becauseits political system, culture, and the economy makes it a comparably poor fit with its immediateneighbors. Singapore and Vietnam was moved from the South-East Asia to East Asia, andMongolia was moved from East Asia to Eastern Europe and the post Soviet Union because ofits history as a Soviet satellite.
16
Dem
ogra
phic
Pres
sure
Con
flict
(FfP
Sec.
App
.)
Gen
der
Equ
ality
(1-G
II)
Cor
rupt
ion
(TI
CPI
)G
DP/
Cap
ita(L
og)
Clim
ate
Eve
nts
Lev
elof
Dem
ocra
cyE
thni
cFr
actio
naliz
atio
nR
egim
eD
urab
ility
Dem
ogra
phic
Pres
sure
1.00
0***
0.77
3***
-0.8
51**
*-0
.769
***
-0.8
64**
*0.
441*
**-0
.578
***
0.49
6***
-0.3
15**
*C
onfli
ct(F
fPSe
c.A
pp.)
0.77
3***
1.00
0***
-0.7
32**
*-0
.810
***
-0.7
34**
*0.
260*
**-0
.681
***
0.46
5***
-0.4
24**
*G
ende
rEqu
ality
(1-G
II)
-0.8
51**
*-0
.732
***
1.00
0***
0.74
2***
0.84
9***
-0.3
24**
*0.
501*
**-0
.561
***
0.30
0***
Cor
rupt
ion
(TIC
PI)
-0.7
69**
*-0
.810
***
0.74
2***
1.00
0***
0.80
2***
-0.2
96**
*0.
608*
**-0
.428
***
0.34
0***
GD
P/C
apita
(Log
)-0
.864
***
-0.7
34**
*0.
849*
**0.
802*
**1.
000*
**-0
.434
***
0.54
3***
-0.5
16**
*0.
333*
**C
limat
eE
vent
s0.
441*
**0.
260*
**-0
.324
***
-0.2
96**
*-0
.434
***
1.00
0***
-0.2
51**
*0.
088*
*-0
.051
Lev
elof
Dem
ocra
cy-0
.578
***
-0.6
81**
*0.
501*
**0.
608*
**0.
543*
**-0
.251
***
1.00
0***
-0.2
90**
*0.
291*
**E
thni
cFr
actio
naliz
atio
n0.
496*
**0.
465*
**-0
.561
***
-0.4
28**
*-0
.516
***
0.08
8**
-0.2
90**
*1.
000*
**-0
.198
***
Reg
ime
Dur
abili
ty-0
.315
***
-0.4
24**
*0.
300*
**0.
340*
**0.
333*
**-0
.051
0.29
1***
-0.1
98**
*1.
000*
**b.
Lis
twis
eN
=132
7
Tabl
e2:
Dem
ogra
phic
Pres
sure
,Con
flict
,and
Gen
derE
qual
ityar
ehi
ghly
corr
elat
ed.
Sour
ce:T
eore
llet
al.
(201
7);U
ND
P(2
016)
17
activity, military, bombings, etc. Security Apparatus is used for three reasons.First, it is theoretically significant as it demonstrates the discontent and conflict-ing acts of ordinary citizens. Second, the preponderance of research of climatechange and conflict uses civil conflicts as the dependent variable, which is cap-tured by this measurement. Third, it is an unambiguous measurement whereasviolence in general is not. Fund For Peace’s data set is well-respected, compre-hensive (capturing different aspects of pressures that all states experience), andoffers short-run time series covering 2005-2015.
Demographic Pressure captures “pressures and measures related to naturaldisasters, disease, environment, pollution, food scarcity, malnutrition, water scarcity,population growth, youth bulge, mortality”. This is a fairly wide measure, butcaptures the sort of Malthusian crisis that seems to play a critical in the link be-tween climate change and conflict. The literature on climate change focuses onreductions in carrying capacity, whereas the classical Malthusian crisis is causedby a population overshooting the (generally considered stable) carrying capacity.Before normalization and standardization the original measures range from 1-10,with lower values being better.
Explanatory and Control Variables The key independent variable is genderequality. It is measured by reversing the UNDP’s Gender Inequality Index (GII)(UNDP, 2016). The GII captures inequality in health, educational and politicalempowerment, and labor market. It was designed to measure gender inequalityalone, and as such “none of the underlying measures pertains to a country’s gen-eral level of development . . . developing countries can perform relatively well ifgender disadvantages are limited” (UNDP, 2010, p. 90). The gender equality datawas complemented with data from the 1990 HDR (UNDP, 1990), to extend thetime series from 1995 to 1990 for about 130 countries. Like the HDI, the scale isfrom 0 to 1, and reversing the GII means that higher values indicate higher lev-els of gender equality. For the 157 countries with more than two data points, theaverage starting year is 1993 and the average ending year is 2015.
Governance in general, and good governance in particular, is measured bycorruption, a ubiquitous measure in the good governance literature. TransparencyInternational (TI)’s Corruption Perception Index (CPI) captures perceptions ofcorruption in the public sector where corruption is defined as the abuse of publicoffice for private gain (Teorell et al. , 2017; Transparency International, 2015).No distinction between administrative and political corruption is made. Scoresrange between 0 and 100, where higher numbers indicate lower perceptions ofcorruption. For the 184 countries with more than two data points, the averagestarting year is 2000 and the average ending year is 2015.
Regime type is measured by using the Level of Democracy measure (Teorell
18
et al. , 2017; Hadenius & Teorell, 2005). It is a composite of the average ofFreedom House Political Rights and Civil Liberties (Teorell et al. , 2017; Free-dom House, 2015), and the Revised Combined Polity Score from the Polity IVproject (Teorell et al. , 2017; Marshall & Jaggers, 2014). Scores for countries thatare missing from Polity VI are imputed by regressing it on the average FreedomHouse measure. This index performs better both in terms of validity and reliabil-ity than its constituent parts. The scale is from 0 to 10, with higher scores indicatehigher levels of democracy. For the 199 countries with more than two data points,the average starting year is 1991 and the average ending year is 2015.
GDP per capita is used as a measure of overall productiveness of the economyof each country. The data originally comes from the World Bank World Develop-ment Indicator dataset (Teorell et al. , 2017; World Bank, 2016). It is the grossdomestic product divided by the estimated midyear population, and the data arein constant 2005 U.S. dollars. The data has been logged. For the 189 countrieswith more than two data points, the average starting year is 1991 and the averageending year is 2014.
Climate change is measured by using the World Bank’s Drought, Floods, Ex-treme Temperature indicator. It captures the percentage of the population thathas been affected by the sort of extreme climate events that are characteristic ofclimate between 1990 and 2009. Long drought can lead to losses to agriculture,affect inland navigation and hydropower plants, and cause a lack of drinking wa-ter and famine. Extreme temperature events are either cold waves or heat waves,which can damage agriculture, infrastructure, and property. Population affectedis the number of people injured, left homeless or requiring immediate assistanceduring a period of emergency resulting from a natural disaster. There are 164countries with more than two data points.
Ethnic fractionalization is operationalized using Alesina et al. (2003), whichreflects the probability that two randomly selected people from a given countrywill not share ethnicity. The scale is from 0 to 1, with higher scores indicatinghigher level of fractionalization. There are 172 countries with more than two datapoints.
Finally, historical roots are measured by Regime Durability, the number ofyears since the last regime change, also by the Polity IV Project (Teorell et al. ,2017; Marshall & Jaggers, 2014). It is measured by the number of years since themost recent regime change. For the 189 countries with more than two data points,the average starting year is 1991 and the average ending year is 2014. This value,like GDP per capita, has been logged. For the 172 countries with more than twodata points, the average starting year is 1991, and the average ending year is 2014.
19
5 Results and InterpretationThis section is divided into three subsections, each addressing one part of the re-search purpose provided in section 4.1. The first subsection addresses the questionof whether the relationship between demographic pressure, as a proxy variable forclimate change, and conflict can be mediated by institutional factors, especiallygovernance. The second subsection addresses the question of which institutionalfactors affect conflict during climate-induced reductions in the carrying capacity.The third subsection present.
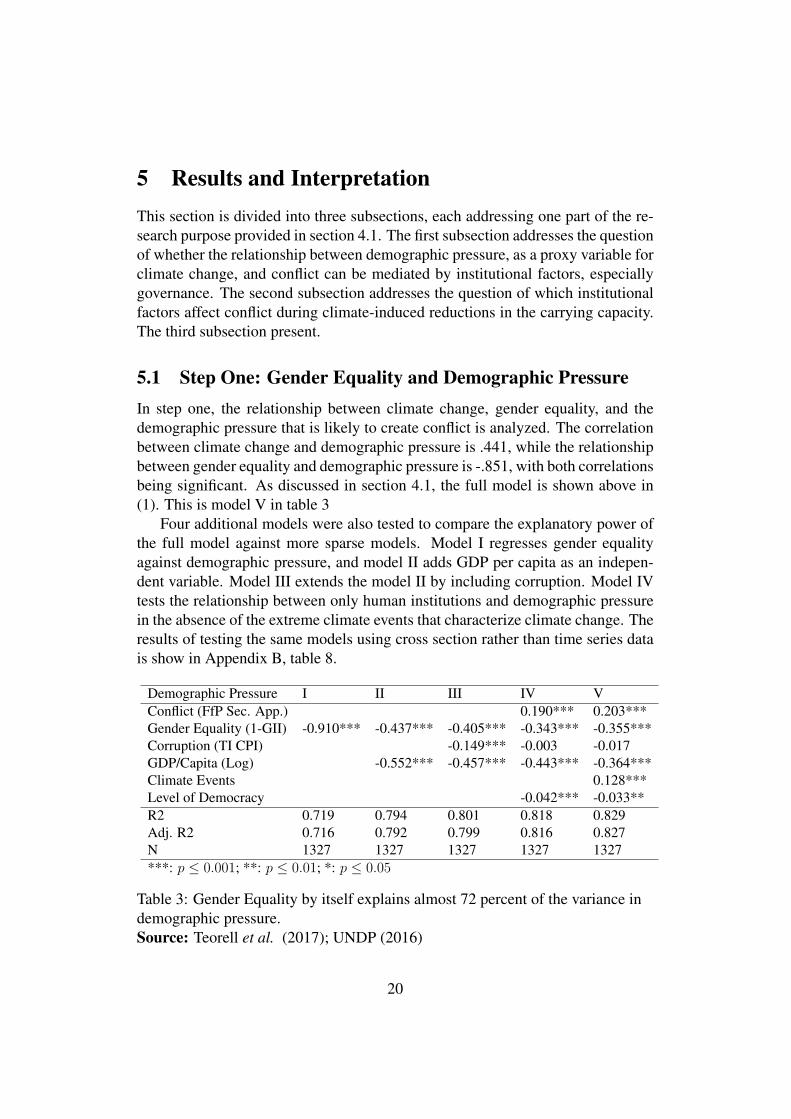
5.1 Step One: Gender Equality and Demographic PressureIn step one, the relationship between climate change, gender equality, and thedemographic pressure that is likely to create conflict is analyzed. The correlationbetween climate change and demographic pressure is .441, while the relationshipbetween gender equality and demographic pressure is -.851, with both correlationsbeing significant. As discussed in section 4.1, the full model is shown above in(1). This is model V in table 3
Four additional models were also tested to compare the explanatory power ofthe full model against more sparse models. Model I regresses gender equalityagainst demographic pressure, and model II adds GDP per capita as an indepen-dent variable. Model III extends the model II by including corruption. Model IVtests the relationship between only human institutions and demographic pressurein the absence of the extreme climate events that characterize climate change. Theresults of testing the same models using cross section rather than time series datais show in Appendix B, table 8.
Demographic Pressure I II III IV VConflict (FfP Sec. App.) 0.190*** 0.203***Gender Equality (1-GII) -0.910*** -0.437*** -0.405*** -0.343*** -0.355***Corruption (TI CPI) -0.149*** -0.003 -0.017GDP/Capita (Log) -0.552*** -0.457*** -0.443*** -0.364***Climate Events 0.128***Level of Democracy -0.042*** -0.033**R2 0.719 0.794 0.801 0.818 0.829Adj. R2 0.716 0.792 0.799 0.816 0.827N 1327 1327 1327 1327 1327***: p ≤ 0.001; **: p ≤ 0.01; *: p ≤ 0.05
Table 3: Gender Equality by itself explains almost 72 percent of the variance indemographic pressure.Source: Teorell et al. (2017); UNDP (2016)
20
Model I, looking solely at the relationship between gender equality and de-mographic pressure, turns out to have surprisingly high explanatory power as itexplains 72 percent of the variation in demographic pressure. The effect is alsoconsiderable. Hypothesis 1 looks very promising.
Model II, adding GDP per capita to model I, increased the explanatory power,with the model explaining almost 80 percent of the variation in demographic pres-sure. This stands to reason as demographic pressure is simply (food) productiondivided by the population size. The effect of gender equality on GDP per capita isanalyzed in step three, the path analysis, in section 5.3.
Model III added corruption to model II, but left explanatory power almostunchanged. As discussed below, and in section 5.3, the effect of corruption, or,rather, good governance, is likely to be largely indirect. In fact, with level ofdemocracy and conflict added to the model, as discussed below, corruption losessignificance.
Model IV is the same as Model V, with the exception of climate events whichis missing. Adding conflict and level of democracy to model III increases theexplanatory power to almost 82 percent. Corruption loses significance, and theeffect of democracy appears to be low.
Model V is the full model shown above in equation (1). It explains 83 per-cent of the variation of demographic pressure. Gender equality has almost thesame effect as GDP per capita. All independent variables behave as expected withconflict and climate events increasing demographic pressure, and gender equality,GDP per capita, and level of democracy reducing it.
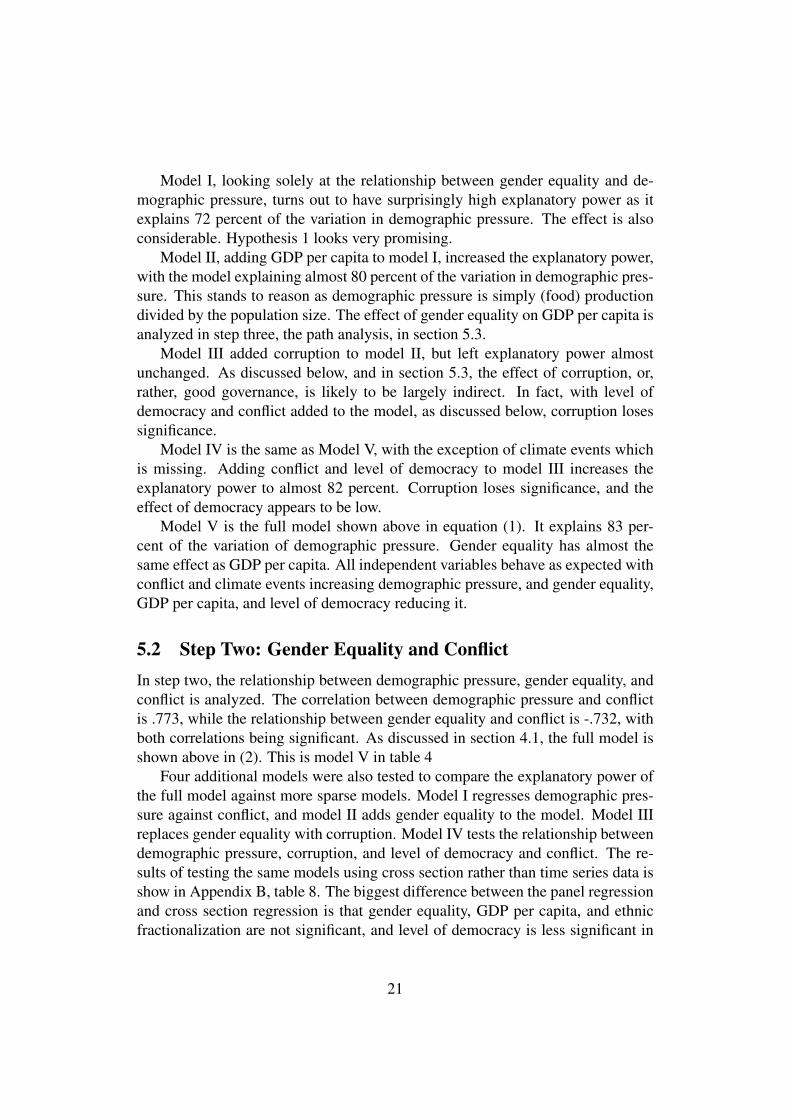
5.2 Step Two: Gender Equality and ConflictIn step two, the relationship between demographic pressure, gender equality, andconflict is analyzed. The correlation between demographic pressure and conflictis .773, while the relationship between gender equality and conflict is -.732, withboth correlations being significant. As discussed in section 4.1, the full model isshown above in (2). This is model V in table 4
Four additional models were also tested to compare the explanatory power ofthe full model against more sparse models. Model I regresses demographic pres-sure against conflict, and model II adds gender equality to the model. Model IIIreplaces gender equality with corruption. Model IV tests the relationship betweendemographic pressure, corruption, and level of democracy and conflict. The re-sults of testing the same models using cross section rather than time series data isshow in Appendix B, table 8. The biggest difference between the panel regressionand cross section regression is that gender equality, GDP per capita, and ethnicfractionalization are not significant, and level of democracy is less significant in
21
the cross section analysis. The overall explanatory power of the models is thesame.
Conflict I II III IV VDemographic Pressure 0.799*** 0.561*** 0.388*** 0.322*** 0.264***Gender Equality (1-GII) -0.301*** -0.163***Corruption (TI CPI) -0.561*** -0.460*** -0.438***GDP/Capita (Log) 0.148***Level of Democracy -0.182*** -0.173***Ethnic Fractionalization 0.050***Regime Durability -0.132***R2 0.605 0.626 0.718 0.752 0.777Adj. R2 0.601 0.622 0.715 0.750 0.774N 1327 1327 1327 1327 1327***: p ≤ 0.001; **: p ≤ 0.01; *: p ≤ 0.05
Table 4: While gender equality by itself appears to have some explanatory power,it is weaker than corruption, and explains less of overall variance.Source: Teorell et al. (2017); UNDP (2016)
Model I, looking solely at the relationship between demographic pressure andconflict, explains about 60 percent of the variation in conflict level. The effect ofdemographic pressure is high, but the explanatory power is, comparatively, weak.
Model II, adding gender equality model I, increased the explanatory power,with the model explaining almost 63 percent of the variation in conflict. This is asmall difference compared to the first model, and leaves more than a third of thevariation in conflict unaccounted for. The effect of gender inequality on corruptionis tested below.
Model III, replacing gender equality with corruption, has considerably higherexplanatory power than model II. Demographic pressure and corruption explains72 percent of the variation in conflict. Corruption appears to have both a largerand more significant effect on conflict when demographic pressure is controlledfor.
Model IV, adding level of democracy to model III, increased the explanatorypower to account for three quarters of the variance in conflict. The effect of levelof democracy is weak compared to demographic pressure. As in the previousmodels with corruption as an independent variable, corruption continues to havethe largest effect on conflict.
Model V is the full model shown above in equation (2). It explains 77 percentof the variation of demographic pressure, a very minor increase from model IV. Allindependent variables behave as expected, with the exception of GDP per capita,which, when other variables are controlled for, increases conflict considerably.It’s not clear what to make of this, but is worth looking into.
22
5.3 Step Three: Path Analysis of Relationship Between Cli-mate Change, Gender, and Conflict
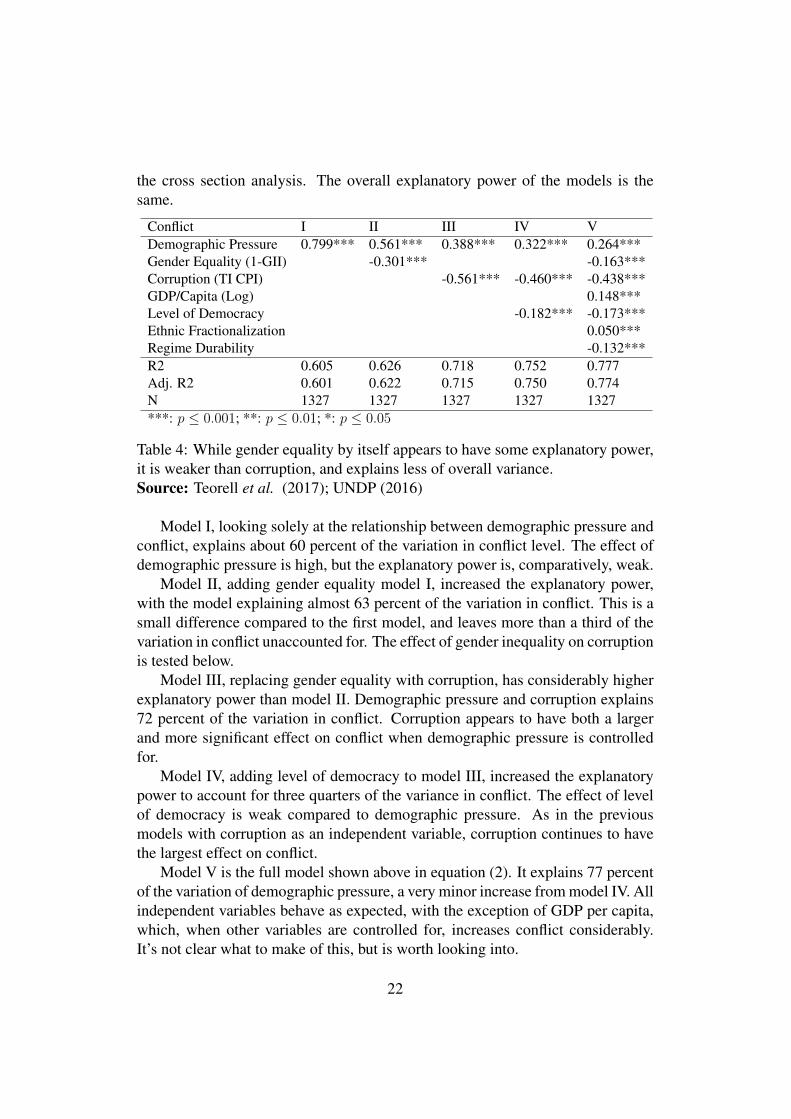
In the third and final step a path analysis is conducted to determine the effectgender equality plays, if any, on the other explanatory variables. The path analysisof the relationship between climate change and demographic pressure and therelationship between demographic pressure and conflict, along with the respectivemediators, are considered separately
Path Analysis of the Effect of Gender Equality on Demographic Pressure
Demographic Pressure
Level of Democracy
Gender Equality
GDP/Capita(logged)
Corruption
Conflict.203***
-.355***.567***R2: .78
-.364***
.017
-.033**
Significance: *** = 0; ** = 0.001; * = 0.01; . = 0.05
Climate Change
.228***R2: .78
N: 134Adj. R2: .827
.128***
.720*** R2: .24
Figure 2: Gender equality and corruption together explain almost 80 percent ofthe variance in GDP per capita, and gender equality apparently has a highereffect on GDP per capita than corruption. By contrast, gender equality has littleexplanatory power for variance in level of democracy.
First, the relationship between GDP per capita, gender equality, and demo-graphic pressure was examined, as shown in figure 2. Specifically, the effect ofgender equality on level of democracy, and (along with corruption) on GDP percapita was tested. The effect of gender equality on level of democracy is low, withgender equality by itself explaining only 25 perfect of the variance of democracylevel. By contrast, gender equality and corruption explain almost 80 percent ofthe variance in GDP per capita.
Because the measure used to operationalize gender equality narrowly capturesinequality, “none of the underlying measures pertain to country’s general level ofdevelopment” (UNDP, 2010, p. 90). As such, gender equality is not a reflection ofdevelopment level, but rather, appears to be a determinant, as theory and historysuggest. Combining the direct effects of gender equality on demographic pressure,
23
with the indirect effect, mediated by GDP per capita, there is little evidence forthe null hypothesis of hypothesis 1. Put differently, gender equality appears tobe play a considerable role in determining the demographic pressure which hashistorically lead to conflict. It appears that gender equality plays a larger rolein demographic pressure than climate change, at least as operationalized in thisstudy. The regions of world suffering the most from the demographic pressures ofclimate change are also the regions with the highest level of gender inequality.
Path Analysis of the Effect of Gender Equality on Conflict
Conflict
Level of Democracy
DemographicPressure Corruption
-.438***
.163***
.264***
-.173**
Significance: *** = 0; ** = 0.001; * = 0.01; . = 0.05N: 134
Adj. R2: .774
Gender Equality
GDP/Capita(logged)
.148***
.757***R2: .54
Regime Durability
-.0132**
Ethnic Fractionalization
-.050***
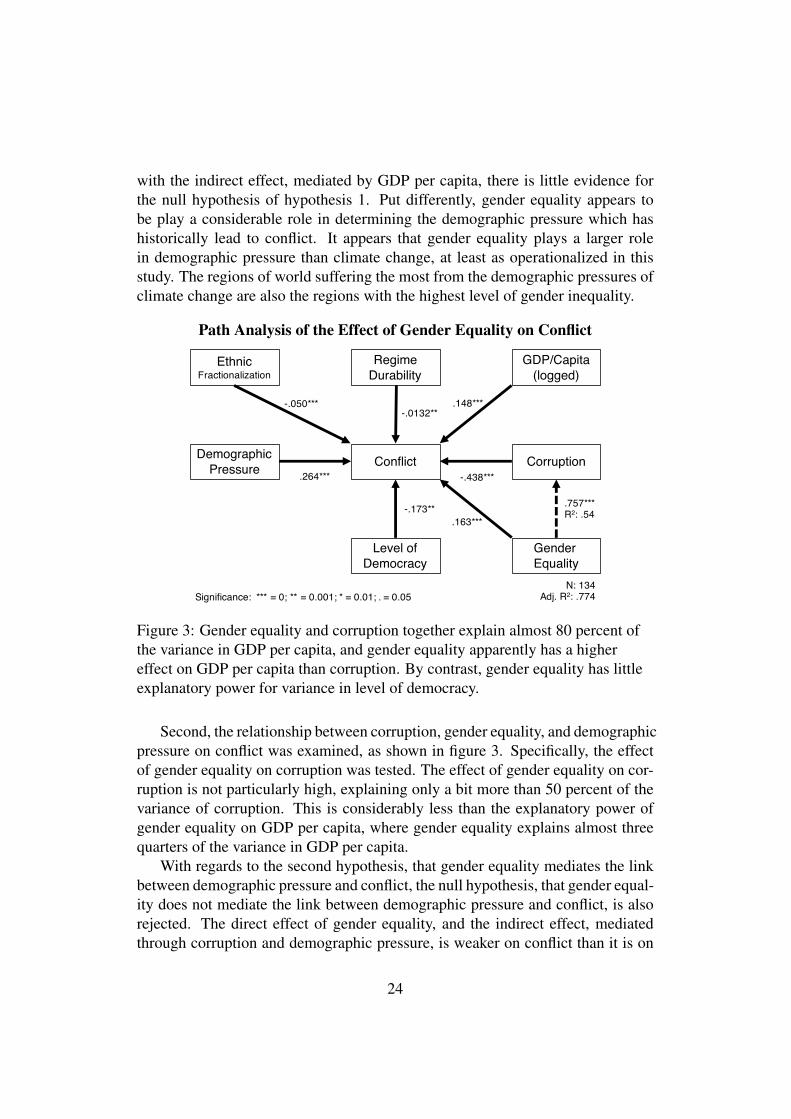
Figure 3: Gender equality and corruption together explain almost 80 percent ofthe variance in GDP per capita, and gender equality apparently has a highereffect on GDP per capita than corruption. By contrast, gender equality has littleexplanatory power for variance in level of democracy.
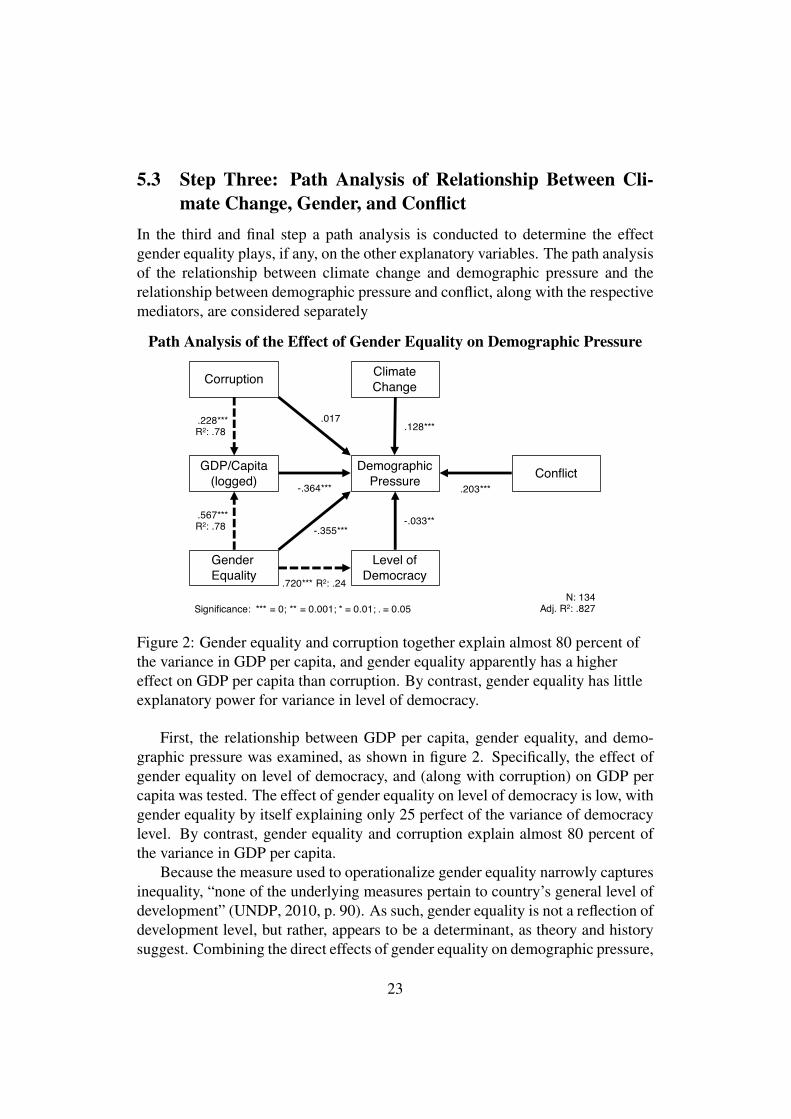
Second, the relationship between corruption, gender equality, and demographicpressure on conflict was examined, as shown in figure 3. Specifically, the effectof gender equality on corruption was tested. The effect of gender equality on cor-ruption is not particularly high, explaining only a bit more than 50 percent of thevariance of corruption. This is considerably less than the explanatory power ofgender equality on GDP per capita, where gender equality explains almost threequarters of the variance in GDP per capita.
With regards to the second hypothesis, that gender equality mediates the linkbetween demographic pressure and conflict, the null hypothesis, that gender equal-ity does not mediate the link between demographic pressure and conflict, is alsorejected. The direct effect of gender equality, and the indirect effect, mediatedthrough corruption and demographic pressure, is weaker on conflict than it is on
24
demographic pressure. It nevertheless appears to have a considerable impact onlevel of conflict, at least as measure by the Fund for Peace’s Security Apparatusindicator. Put differently, the overall hypothesis that the relationship between cli-mate change and conflict is considerably mediated by human institutions can notbe rejected, and that gender equality in particular, seems to play an important rolein alleviating, or exacerbating, the effects of climate change.
6 ConclusionThis study presents a first attempt to study human resilience to the effects of cli-mate change. While most of the international efforts to tackle climate change hasbeen focused on averting it, or limiting its magnitude, it is perhaps time to alsoturn to the question of how to increase human resilience to its effects. Given thehistorical relationship between climate change and conflict, this is of pressing con-cern. Longitudinal studies have shown a strong link between climate change andconflict as changes in climate affect carrying capacity, which lead to demographicpressure. Such demographic pressure in turn leads to conflict as expensive orscarce food resources create famines and social unrest. Based on recent literaturethat considers gender equality not a product of social and economic development,but rather as a precursor or partial determinant for it, this study tested the effect ofgender equality in the causal chain that links climate change and conflict.
Starting from the research question does gender equality mediate the effectsof climate change on demographic pressure, and on conflict, the overall hypoth-esis was that the relationship between climate change and conflict is consider-ably mediated by human institutions in general, and gender equality in particular.Two more narrow hypotheses were tested. First, that relationship between climatechange and demographic pressure is mediated by gender equality. Demographicpressure is naturally higher in areas with low levels of gender equality. Second,that the relationship demographic pressure is again mediated by gender equality,as gender equality affects both levels of violence and corruption.
With regards to the first hypothesis, combining the direct effects of genderequality on demographic pressure, with the indirect effect, mediated by GDP percapita, there is little evidence for the null hypothesis. Gender equality appearsto play a considerable role in determining the demographic pressure which hashistorically lead to conflict. Osver the course of the past decade it appears thatgender equality plays a larger role in demographic pressure than climate change,at least as operationalized in this study. The regions of world suffering the mostfrom the demographic pressures of climate change are also the regions with thehighest level of gender inequality.
With regards to the second hypothesis, the null hypothesis, that gender equal-
25
ity does not mediate the link between demographic pressure and conflict, is alsorejected. The direct effect of gender equality, and the indirect effect, mediatedthrough corruption and demographic pressure, is weaker on conflict than it is ondemographic pressure. It nevertheless appears to have a considerable impact onlevel of conflict, at least as measure by the Fund for Peace’s Security Apparatusindicator.
From this study is seems clear that overall hypothesis that the relationship be-tween climate change and conflict is considerably mediated by human institutionscan not be rejected. Gender equality in particular, seems to play an important rolein alleviating, or exacerbating, the effects of climate change. These results deservemore study, with the important limitation of the current study the short time spanoffered by the operationalization.
26
ReferencesAldy, Joseph E., & Viscusi, W. Kip. 2008. Adjusting the Value of a Statistical Life
for Age and Cohort Effects. The Review of Economics and Statistics, 90(3),573–581.
Alesina, Alberto, Devleeschauwer, Arnaud, Easterly, William, Kurlat, Sergio, &Wacziarg, Romain. 2003. Fractionalization. Journal of Economic Growth, 8(2),155–194.
Andersen, David Delfs Erbo, & Mikkelsen, Kim Sass. 2014. How State Bureau-cracies Become Effective. In: Annual Meeting of the Danish Political ScienceAssociation (DPSA) Oct. 23-24.
Anderson, Benedict. 2006. Imagined communities: reflections on the origin andspread of nationalism. London: Verso.
Bernstein, Lenny, Bosch, Peter, Canziani, Osvaldo, Chen, Zhenlin, Christ, Re-nate, Davidson, Ogunlade, Hare, William, Huq, Saleemul, Karoly, David,Kattsov, Vladimir, Kundzewicz, Zbigniew, Liu, Jian, Lohmann, Ulrike, Man-ning, Martin, Matsuno, Taroh, Menne, Bettina, Metz, Bert, Mirza, Monirul,Nicholls, Neville, Nurse, Leonard, Pachauri, Rajendra, Palutikof, Jean, Parry,Martin, Qin, Dahe, Ravindranath, Nijavalli, Reisinger, Andy, Ren, Jiawen, Ri-ahi, Keywan, Rosenzweig, Cynthia, Rusticucci, Matilde, Schneider, Stephen,Sokona, Youba, Solomon, Susan, Stott, Peter, Stouffer, Ronald, Sugiyama,Taishi, Swart, Rob, Tirpak, Dennis, Vogel, Coleen, Yohe, Gary, & Barker, Terry.2007. Climate Change 2007: Synthesis Report. Geneva: IPCC.
Bolzendahl, Catherine. 2009. Making the Implicit Explicit: Gender Influenceson Social Spending in Twelve Industrialized Democracies, 1980–99. SocialPolitics, 16(1), 40–81.
Boserup, Ester. 1970. Woman’s role in economic development. London: GeorgeAllen & Unwin.
Bowen, Donna Lee, Hudson, Valerie M., & Nielsen, Perpetua Lynne. 2015. StateFragility and Structural Gender Inequality in Family Law: An Empirical Inves-tigation. Laws, 4(4), 654–672.
Brinkman, Henk-Jan, & Hendrix, Cullen S. 2011. Food Insecurity and ViolentConflict: Causes, Consequences, and Addressing the Challenges. OccasionalPaper 24. World Food Programme.
Brinton, Crane. 1965. The Anatomy of Revolution. Englewood: Prentice-Hall.
27
Burnet, Jennie E. 2011. Women Have Found Respect: Gender Quotas, SymbolicRepresentation, and Female Empowerment in Rwanda. Politics & Gender, 7(3),303–334.
Collier, Paul, & Hoeffler, Anke. 1998. On Economic Causes of Civil War. OxfordEconomic Papers, 50(4), 563–573.
Collier, Paul, & Hoeffler, Anke. 2004. Greed and Grievance in Civil War. OxfordEconomic Papers, 56(4), 563–595.
Cook, Benjamin I., Anchukaitis, Kevin J., Touchan, Ramzi, Meko, David M.,& Cook, Edward R. 2016. Spatiotemporal drought variability in the Mediter-ranean over the last 900 years. Journal of Geophysical Research: Atmospheres,121(2060-2074).
Currie, Janet. 1999. Is the Impact of Health Shocks Cushioned by SocioeconomicStatus? The Case of Low Birthweight. American Economic Review, 89(2),245–250.
Deutsch, Ruthanne. 1998. Does Child Care Pay? Labor Force Participation andthe Earnings Effects of Access to Child Care in the Favelas of Rio de Janeiro.IDB Working Paper 384. Inter-American Development Bank, Washington, D.C.
Dollar, David, Fishman, Raymond, & Gatti, Roberta. 1999 (October). Are WomenReally the “Fairer” Sex? Corruption and Women in Government. Policy Re-search Report on Gender and Development, Working Paper 4. The World BankDevelopment Research Group/Poverty Reduction and Economic ManagementNetwork.
Engels, Friedrich. 1962. Der Ursprung der Familie, des Privateigentums und desStaats. In: Marx Engels Werke. Band 21. Berlin: Dietz Verlag.
Fatima, Goher. 2013. Gender inequality in human capital accumulation and eco-nomic growth: a comparative analysis of Pakistan and Sri Lanka. Asia PacificJournal of Social Work and Development, 23(4), 242–252.
Fearon, James D., & Laitin, David D. 2001. Ethnicity, Insurgency, and CivilWar. In: Annual Meetings of the American Political Science Association, SanFrancisco, CA, August 30-September 2, 2001.
Fearon, James D., & Laitin, David D. 2014. Does contemporary armed conflicthave ‘deep historical roots’? In: Annual Meetings of the American PoliticalScience Association, Washington, DC, August 28-31, 2014.
28
Fish, M. Steven. 2002. Islam and Authoritarianism. World Politics, 55(1), 4–37.
Floro, Maria Sagrario, & Seguino, Stephanie. 2002 (September). Gender Effectson Aggregate Saving. Policy Research Report on Gender and Development,Working Paper 23. The World Bank Development Research Group/Poverty Re-duction and Economic Management Network.
Fox, Jonathan, & Sandler, Shmuel. 2004. Bringing Religion into InternationalRelations. New York: Palgrave Macmillan.
Freedom House. 2015. Freedom in the World.
Gleick, Patrick H. 2014). Water, Drought, Climate Change, and Conflict in Syria.Weather Climate Society, 6(3), 331–340.
Goldstone, Jack A. 2011. Understanding the Revolutions of 2011. Foreign Affairs,90(8), 8–16.
Gottlieb, Jessica, Grossman, Guy, & Robinson, Amanda Lea. 2015 (February).Do men and women have different policy preferences, and if so, why?: Deter-minants and implications of ‘good’ and ‘bad’ gender gaps in Africa. WorkingPaper 153. AfroBarometer.
Hadenius, Axel, & Teorell, Jan. 2005. Assessing Alternative Indices of Democ-racy. In: C&M Working Papers 6, IPSA.
Halliday, Fred. 2005. The Middle East in International Relations: Power, Politicsand Ideology. Cambridge: Cambridge University Press.
Harbom, Lotta, & Wallensteen, Peter. 2010. Armed conflict 1948-2009. Journalof Peace Research, 47(4), 501–509.
Heywood, Paul. 1997. Political Corruption: Problems and Perspectives. In: Hey-wood, Paul (ed), Political Studies: Political Corruption, vol. 45. Political Stud-ies Association of the UK.
Hsiang, Solomon M., & Burke, Marshall. 2014. Climate, conflict, and socialstability: what does the evidence say? Climatic Change, 123(1), 39–55.
Hsiang, Solomon M., Burke, Marshall, & Miguel, Edward. 2013. Quantifying theInfluence of Climate on Human Conflict. Science, 341(6151), 1235367.
Hudson, Valerie M. 2011. But Now Can See: One Academic’s Journey to Femi-nist Security Studies. Politics & Gender, 7(4), 586–590.
29
Hudson, Valerie M., Ballif-Spanvill, Bonnie, Caprioli, Mary, & Emmett, Chad F.2012. Sex and World Peace. Columbia University Press. Kindle Edition.
Hudson, Valerie M., Bowen, Donna Lee, & Nielsen, Perpetua Lynne. 2015. ClanGovernance and State Stability: The Relationship between Female Subordina-tion and Political Order. American Political Science Review, 109(3), 535–555.
Hui, Victoria Tin-bor. 2005. War and State-Formation in Ancient China and EarlyModern Europe. Oxford: Oxford University Press.
Huntington, Samuel P. 1993. The Clash of Civilizations? Foreign Affairs, 72(3),22–49.
Huntington, Samuel P. 1996. The Clash of Civilizations and the Remaking ofWorld Order. New York: Simon and Schuster.
Inglehart, Ronald, & Welzel, Christian. 2009. How Development Leads toDemocracy: What We Know About Modernization. Foreign Affairs, 88(2),33–48.
Jacob, Brian, Lefgren, Lars, & Moretti, Enrico. 2007. The Dynamics of CriminalBehavior: Evidence from Weather Shocks. The Journal of Human Resources,42(3), 489–527.
Kaniewski, David, Campo, Elise Van, Guiot, Joël, Burel, Sabine Le, Otto, Thierry,& Baeteman, Cecile. 2013. Environmental Roots of the Late Bronze Age Crisis.PLoS ONE, 8(8), 1–10.
Kaufmann, Daniel. 1998. Challenges in the Next Stage of Anti-corruption. In:New perspectives on combating corruption. Washington D.C.: The WorldBank.
Kelleya, Colin P., Mohtadi, Shahrzad, Canec, Mark A., Seagerc, Richard, & Kush-nirc, Yochanan. 2015. Climate change in the Fertile Crescent and implicationsof the recent Syrian drought. PNAS, 112(11), 3241–3246.
Knodel, John, & van de Walle, Etienne. 1979. Lessons from the Past: Policy Im-plications of Historical Fertility Studies. Population and Development Review,5(2), 217–245.
Knutsen, L. Torbjørn, & Bailey, Jennifer L. 1989. Over the Hill? Anatomy ofRevolution at Fifty. Journal of Peace Research, 26(4), 421–431.
30
Kristof, Nicholas D., & Wudunn, Sheryl. 2009. Half the Sky: Turning Oppressioninto Opportunity for Women Worldwide. Knopf Doubleday Publishing Group.Kindle Edition.
Kustra, Tyler. 2016. HIV/AIDS, Life Expectancy, and the Opportunity CostModel of Civil War. Journal of Conflict Resolution.
Lagi, Marco, Bertrand, Karla Z., & Bar-Yam, Yaneer. 2011. The food crises andpolitical instability in North Africa and the Middle East. Available at SSRN1910031. New England Complex Systems Institute.
Lai, Brian. 2006. An Empirical Examination of Religion and Conflict in the Mid-dle East, 1950–1992. Foreign Policy Analysis, 2(1), 21–36.
Lammers, Judith, & Wijnbergen, Sweder Van. 2008. HIV/AIDS, Risk Aversionand Intertemporal Choice. Discussion Paper 2007-098/1. Tinbergen Institute.
LeVine, Robert, LeVine, Sarah, & Schnell, Beatrice. 2001. "Improve the Women":Mass Schooling, Female Literacy, and Worldwide Social Change. HarvardEducational Review, 71(1), 1–51.
Mann, Michael. 1984. The Autonomous Power of the State: Its Origins, Mecha-nisms, and Results. European Journal of Sociology, 25(2), 185–213.
Marshall, Monty G., & Jaggers, Keith. 2014. The Polity IV Project.
Migdal, Joel, Kohli, Atul, & Shue, Vivienne (eds). 1994. State Power and So-cial Forces: Domination and Transformation in the Third World. New York:Cambridge University Press.
Migdal, Joel S. 1988. Strong Societies and Weak States: State-Society Relationsand State Capabilities in the Third World. Princeton, NJ: Princeton UniversityPress.
Montalvo, Jose G., & Reynal-Querol, Marta. 2005. Ethnic Polarization, PotentialConflict, and Civil Wars. The American Economic Review, 95(3), 796–816.
North, Douglass C. 1994. Institutional Change: A Framework of Analysis. Avail-able at SSRN 6041. Washington University in Saint Louis: Department of Eco-nomics.
Oskarsson, Maria, & Wängnerud, Lena. 1995. Kvinnor som väljare och valda.Om betydelsen av kön i svenska politik. (Women as voters and elected. On theimportance of gender in Swedish politics). Lund: Studentlitteratur.
31
Perez, Ines, & Stecker, Tiffany. 2013. Climate Change and Rising Food PricesHeightened Arab Spring. Scientific American, March 4.
Persson, Anna, Rothstein, Bo, & Teorell, Jan. 2013. Why Anticorruption ReformsFail—Systemic Corruption as a Collective Action Problem. Governance, 26(3),449–471.
Quisumbing, Agnes R., & Maluccio, John A. 1999 (October). IntrahouseholdAllocation and Gender Relations: New Empirical Evidence. Policy ResearchReport on Gender and Development, Working Paper 2. The World Bank Devel-opment Research Group/Poverty Reduction and Economic Management Net-work.
Rai, Shirin M. 2011. Gender and Development: Theoretical Perspectives. In:Visvanathan, Nalini, Duggan, Lynn, Nisonoff, Laurie, & Wiegersma, Nancy(eds), The Women, Gender, and Development Reader. Zed Books.
Ramsbotham, Oliver, Miall, Hugh, & Woodhouse, Tom. 2011. ContemporaryConflict Resolution. Cambridge: Polity.
Ranson, Matthew. 2014. Crime, Weather, and Climate Change. Journal of Envi-ronmental Economics and Management, 67(3), 274–302.
Revkin, Andrew. 2017. Trump May Not Care About Climate Change, But thePentagon Does. Mother Jones, Mar. 15.
Rose-Ackerman, Susan. 2008. Corruption. In: Rowley, Charles K., & Schnei-der, Friedrich G. (eds), Readings in Public Choice and Constitutional PoliticalEconomy. New York: Springer.
Rosen, Sherwin. 1988. The Value of Changes in Life Expectancy. Journal of Riskand Uncertainty, 1(3), 285–304.
Rothstein, Bo. 2011. The Quality of Government: Corruption, Social Trust, andInequality in International Perspective. Cambridge University Press. KindleEdition.
Rothstein, Bo. 2014. What is the Opposite of Corruption. Third World Quarterly,35(5), 737–752.
Scott, Catherine V. 1996. Gender and Development: Rethinking Modernizationand Dependency Theory. Boulder: Lynne Riener Publishers.
Sen, Amartya. 2001. Development as Freedom. Oxford New York: Oxford Uni-versity Press.
32
Singer, Joel David, & Small, Melvin. 1972. The Wages of War, 1816-1965: AStatistical Handbook. New Jersey: John Wiley & Sons.
Solingen, Etel. 2007. Pax Asiatica versus Bella Levantina: The Foundations ofWar and Peace in East Asia and the Middle East. American Political ScienceReview, 101(4), 757–780.
Sørli, Mirijam E., Gleditsch, Nils Petter, & Strand, Håvard. 2005. Why is ThereSo Much Conflict in the Middle East? Journal of Conflict Resolution, 49(1),141–165.
Sung, Hung-En. 2003. Fairer Sex or Fairer System? Gender and CorruptionRevisited. Social Forces, 82(3), 703–712.
Swamya, Anand, Knack, Stephen, Lee, Young, & Azfard, Omar. 2001. Genderand Corruption. Journal of Development Economics, 64(1), 25–55.
Teorell, Jan, Dahlberg, Stefan, Holmberg, Sören, Rothstein, Bo, Khomenko,Anna, & Svensson, Richard. 2016. The Quality of Government Dataset, versionJan16. University of Gothenburg: The Quality of Government Institute.
Teorell, Jan, Dahlberg, Stefan, Holmberg, Sören, Rothstein, Bo, Khomenko,Anna, & Svensson, Richard. 2017. The Quality of Government Dataset, versionJan17. University of Gothenburg: The Quality of Government Institute.
The Fund for Peace. 2016. The Fund for Peace Fragile States Index.
Tilly, Charles. 1992. Coercion, Capital and European States, AD 990-1990. Ox-ford: Blackwell Publishing.
Tipps, Dean C. 1973. Modernization Theory and the Comparative Study of So-cieties: A Critical Perspective. Comparative Studies in Society and History,15(2), 199–226.
Tol, Richard S.J., & Wagner, Sebastian. 2010. Climate change and violent conflictin Europe over the last millennium. Climatic Change, 99, 65–79.
Transparency International. 2015. Transparency International Corruption Per-ception Index.
UNDP. 1990. Human Development Report 1990. New York: United NationsDevelopment Programme.
UNDP. 2010. Human Development Report 2010. New York: United NationsDevelopment Programme.
33
UNDP. 2015. Human Development Report 2015: Work for Human Development.New York: United Nations Development Programme.
UNDP. 2016. Human Development Report 2016: Human Development for Ev-eryone. New York: United Nations Development Programme.
UNICEF. 2007. The State of the World’s Children 2007: Women and Children:The Double Dividend of Gender Equality. New York: UNICEF.
USJFCOM. 2010. The Joint Operating Environment 2010:. Tech. rept. UnitedStates Joint Forces Command.
Wallensteen, Peter. 2002. Understanding Conflict Resolution. London: Sage.
Wängnerud, Lena. 2009. Women in Parliaments: Descriptive and SubstantiveRepresentation. Annual Review of Political Science, 12, 51–69.
Wängnerud, Lena. 2010. Variation in Corruption between Mexican States: Elab-orating the Gender Perspective. In: APSA 2010 Annual Meeting Paper.
Wängnerud, Lena. 2012. Why women are less corrupt than men. In: Holmberg,Sören, & Rothstein, Bo (eds), Good Government: The Relevance of PoliticalScience. North Hampton: Edward Elgar.
Weber, Eugen. 1976. Peasants into Frenchmen: the Modernization of RuralFrance 1870-1914. Stanford: Stanford University Press.
Weiner, Mark S. 2013. The Rule of the Clan: What an Ancient Form of SocialOrganization Reveals About the Future of Individual Freedom. Farrar, Strausand Giroux. Kindle Edition.
Worland, Justin. 2015. Why Climate Change and Terrorism Are Connected:Drought in Syria has contributed to instability. Time, Nov. 15.
World Bank. 2001. Engendering Development: Through Gender Equality inRights, Resources, and Voice. Oxford: Oxford University Press.
World Bank. 2016. Worldbank World Development Indicators.
Yancheva, Gergana, Nowaczyk1, Norbert R., Mingram, Jens, Dulski, Peter, Schet-tler, Georg, Negendank, Jörg F. W., Liu, Jiaqi, Sigman, Daniel M., Peterson,Larry C., & Haug, Gerald H. 2007. Influence of the Intertropical ConvergenceZone on the East Asian Monsoon. Nature, 445, 74–77.
Zhang, David D., & Lee, Harry F. 2010. Climate Change, Food Shortage and War:A Quantitative Case Study in China during 1500–1800. Catrina, 5(1), 63–71.
34
Zhang, David D., Jim, C.Y., Lin, George C-S, He, Yuan-Qing, Wang, James, &Lee, Harry F. 2006. Climatic Change, Wars and Dynastic Cycles in China Overthe Last Millennium. Climatic Change, 459–477.
Zhang, David D., Zhang, Jane, Lee, Harry F., & He, Yuan-qing. 2007. ClimateChange and War Frequency in Eastern China over the Last Millennium. HumanEcology, 403–414.
Zhang, David D., Lee, Harry F., Wang, Cong, Lie, Baosheng, Peia, Qing, Zhang,Jane, & An, Yulun. 2011. The Causality Analysis of Climate Change and Large-Scale Human Crisis. PNAS, 108(42), 17296–17301.
35
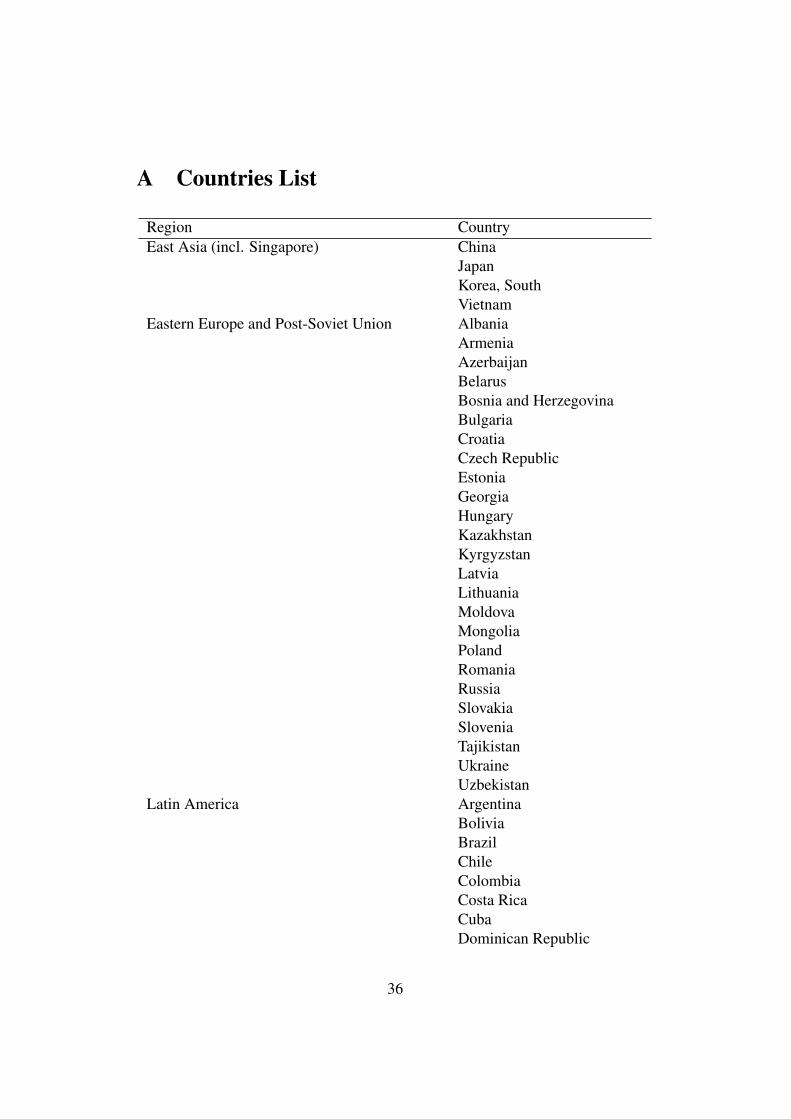
A Countries List
Region CountryEast Asia (incl. Singapore) China
JapanKorea, SouthVietnam
Eastern Europe and Post-Soviet Union AlbaniaArmeniaAzerbaijanBelarusBosnia and HerzegovinaBulgariaCroatiaCzech RepublicEstoniaGeorgiaHungaryKazakhstanKyrgyzstanLatviaLithuaniaMoldovaMongoliaPolandRomaniaRussiaSlovakiaSloveniaTajikistanUkraineUzbekistan
Latin America ArgentinaBoliviaBrazilChileColombiaCosta RicaCubaDominican Republic
36
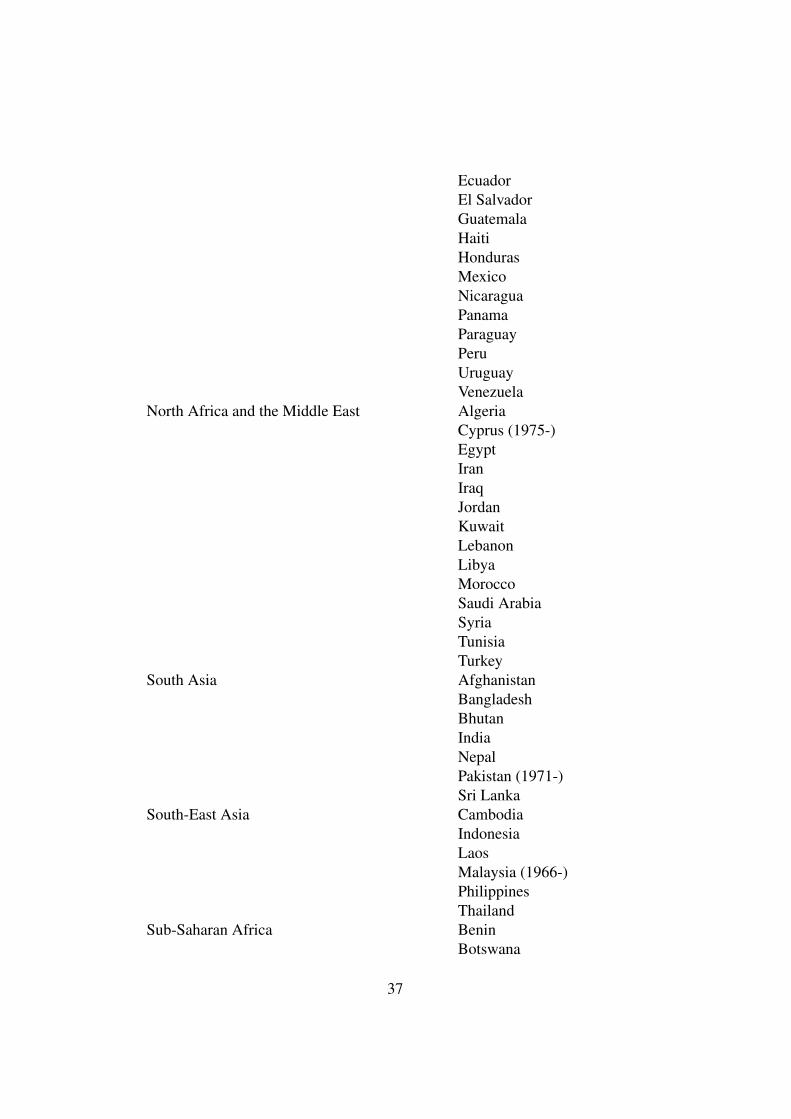
EcuadorEl SalvadorGuatemalaHaitiHondurasMexicoNicaraguaPanamaParaguayPeruUruguayVenezuela
North Africa and the Middle East AlgeriaCyprus (1975-)EgyptIranIraqJordanKuwaitLebanonLibyaMoroccoSaudi ArabiaSyriaTunisiaTurkey
South Asia AfghanistanBangladeshBhutanIndiaNepalPakistan (1971-)Sri Lanka
South-East Asia CambodiaIndonesiaLaosMalaysia (1966-)PhilippinesThailand
Sub-Saharan Africa BeninBotswana
37
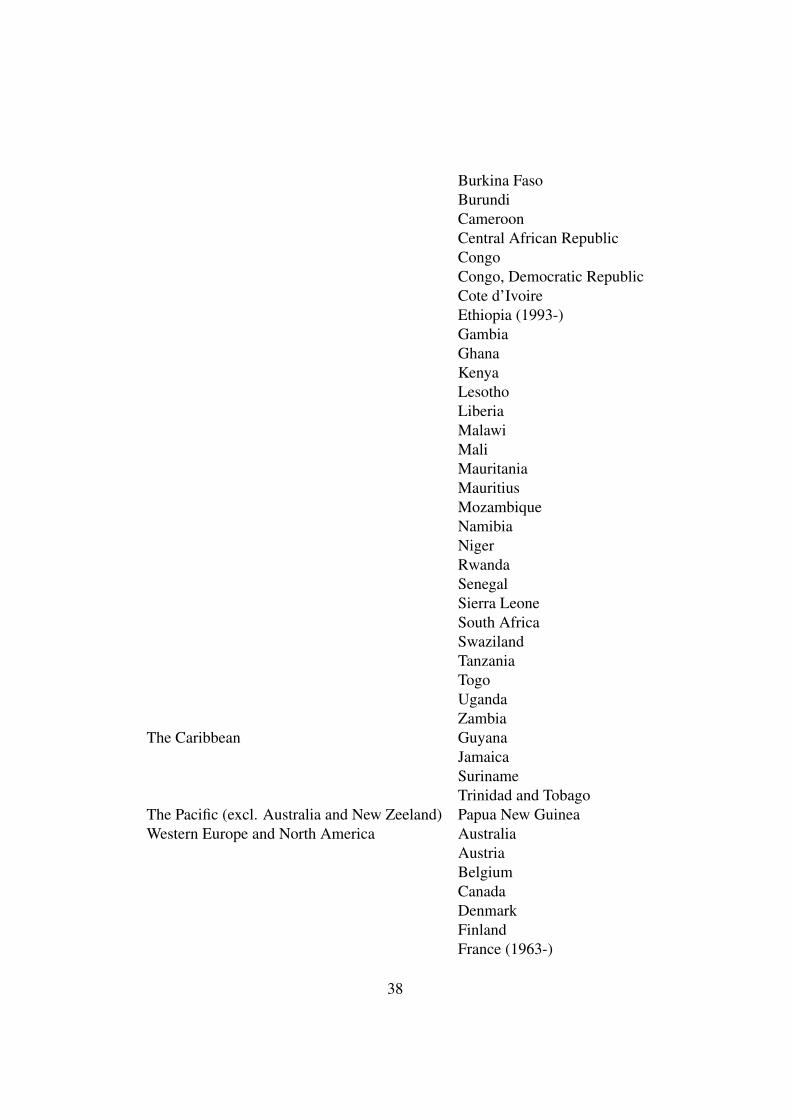
Burkina FasoBurundiCameroonCentral African RepublicCongoCongo, Democratic RepublicCote d’IvoireEthiopia (1993-)GambiaGhanaKenyaLesothoLiberiaMalawiMaliMauritaniaMauritiusMozambiqueNamibiaNigerRwandaSenegalSierra LeoneSouth AfricaSwazilandTanzaniaTogoUgandaZambia
The Caribbean GuyanaJamaicaSurinameTrinidad and Tobago
The Pacific (excl. Australia and New Zeeland) Papua New GuineaWestern Europe and North America Australia
AustriaBelgiumCanadaDenmarkFinlandFrance (1963-)
38
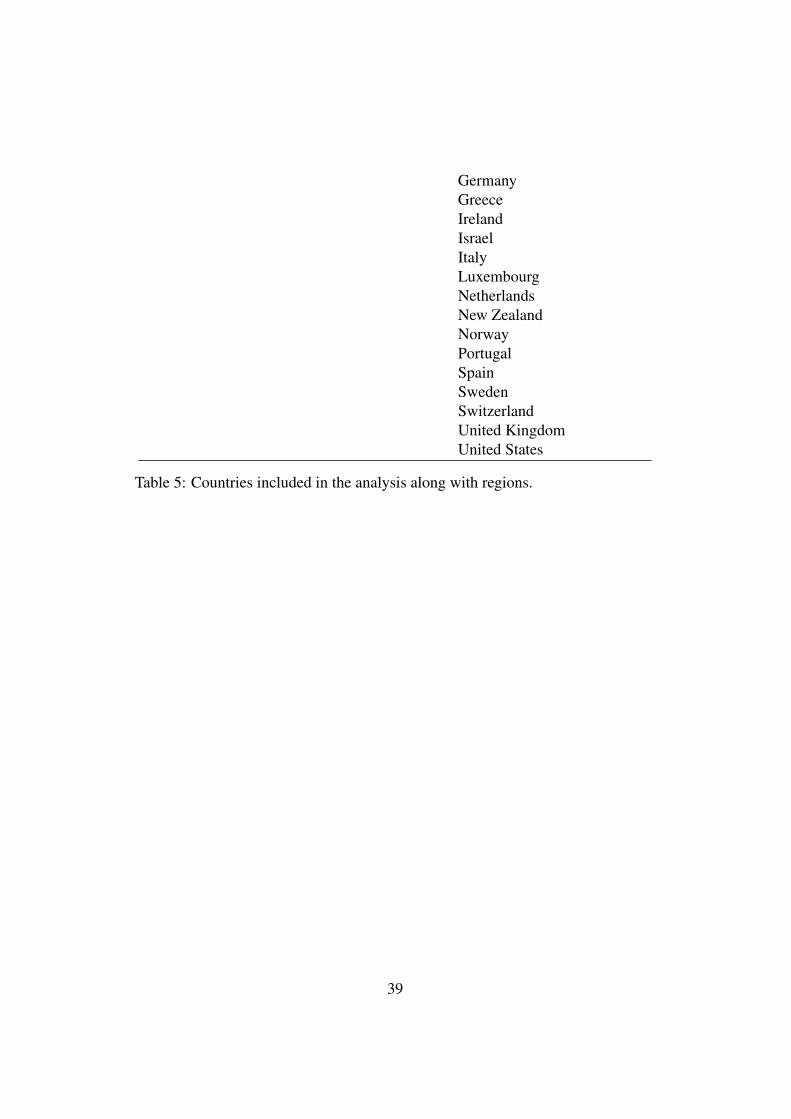
GermanyGreeceIrelandIsraelItalyLuxembourgNetherlandsNew ZealandNorwayPortugalSpainSwedenSwitzerlandUnited KingdomUnited States
Table 5: Countries included in the analysis along with regions.
39
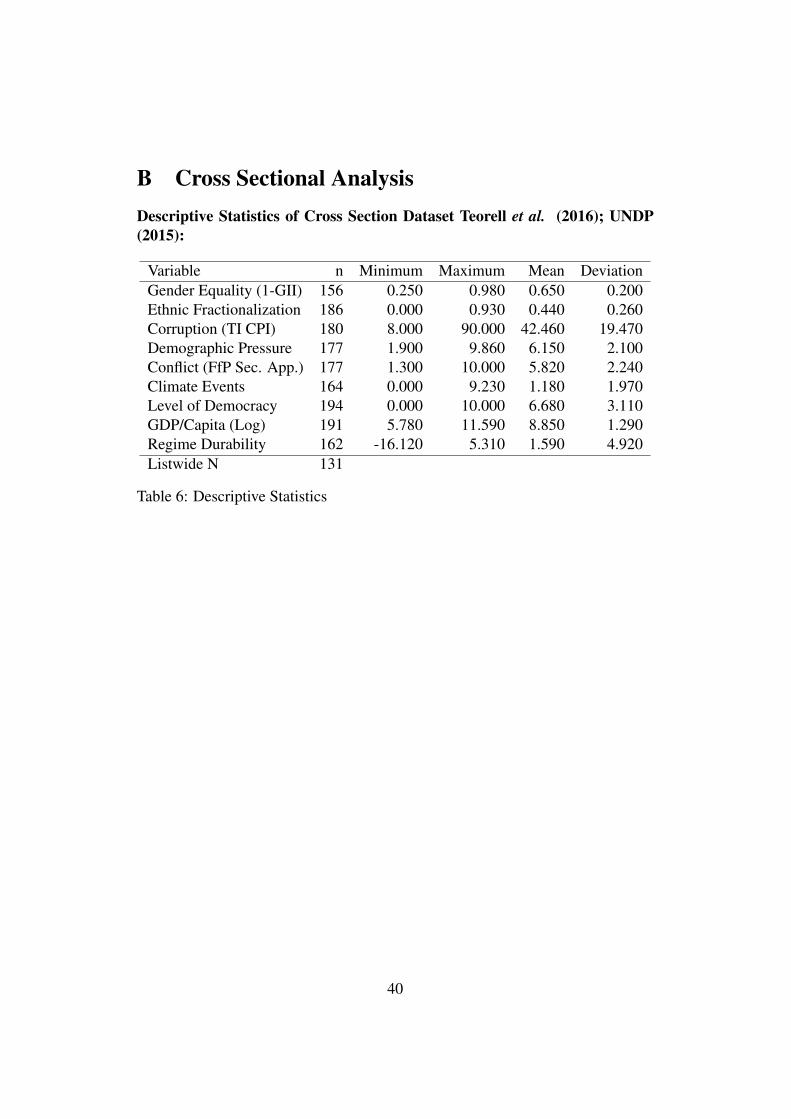
B Cross Sectional AnalysisDescriptive Statistics of Cross Section Dataset Teorell et al. (2016); UNDP(2015):
Variable n Minimum Maximum Mean DeviationGender Equality (1-GII) 156 0.250 0.980 0.650 0.200Ethnic Fractionalization 186 0.000 0.930 0.440 0.260Corruption (TI CPI) 180 8.000 90.000 42.460 19.470Demographic Pressure 177 1.900 9.860 6.150 2.100Conflict (FfP Sec. App.) 177 1.300 10.000 5.820 2.240Climate Events 164 0.000 9.230 1.180 1.970Level of Democracy 194 0.000 10.000 6.680 3.110GDP/Capita (Log) 191 5.780 11.590 8.850 1.290Regime Durability 162 -16.120 5.310 1.590 4.920Listwide N 131
Table 6: Descriptive Statistics
40

Correlation Matrix for Cross Section Data (following page):
41
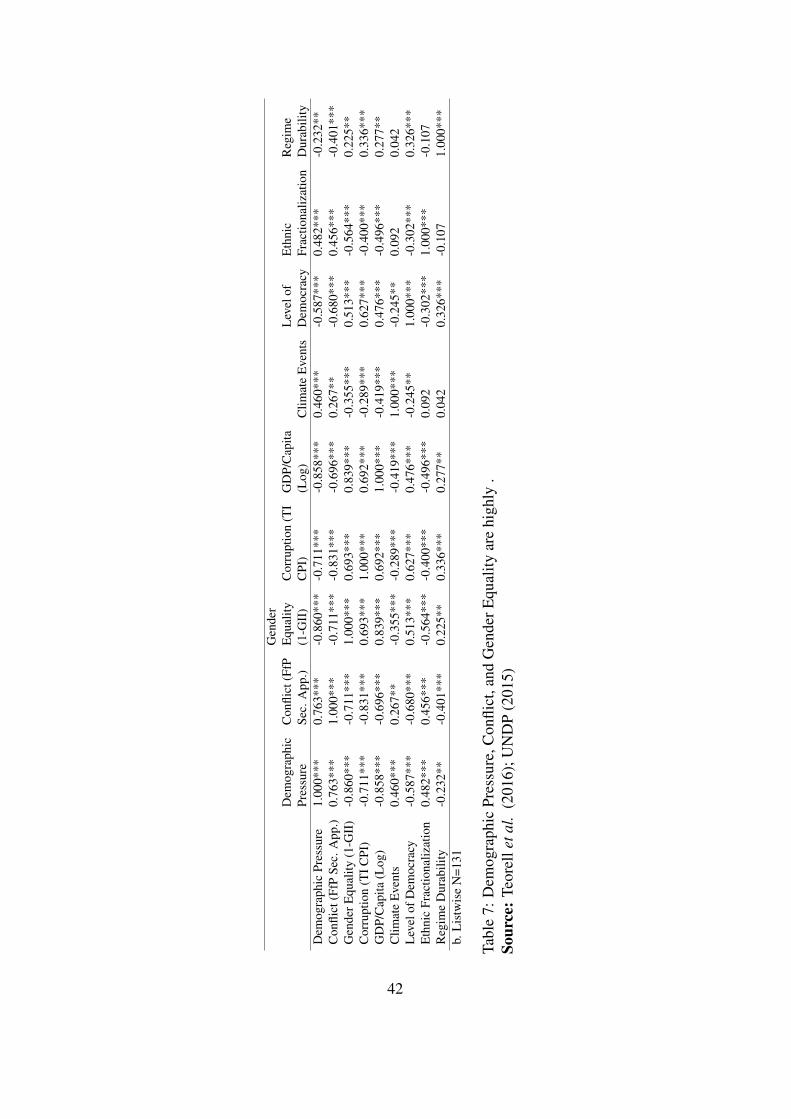
Dem
ogra
phic
Pres
sure
Con
flict
(FfP
Sec.
App
.)
Gen
der
Equ
ality
(1-G
II)
Cor
rupt
ion
(TI
CPI
)G
DP/
Cap
ita(L
og)
Clim
ate
Eve
nts
Lev
elof
Dem
ocra
cyE
thni
cFr
actio
naliz
atio
nR
egim
eD
urab
ility
Dem
ogra
phic
Pres
sure
1.00
0***
0.76
3***
-0.8
60**
*-0
.711
***
-0.8
58**
*0.
460*
**-0
.587
***
0.48
2***
-0.2
32**
Con
flict
(FfP
Sec.
App
.)0.
763*
**1.
000*
**-0
.711
***
-0.8
31**
*-0
.696
***
0.26
7**
-0.6
80**
*0.
456*
**-0
.401
***
Gen
derE
qual
ity(1
-GII
)-0
.860
***
-0.7
11**
*1.
000*
**0.
693*
**0.
839*
**-0
.355
***
0.51
3***
-0.5
64**
*0.
225*
*C
orru
ptio
n(T
ICPI
)-0
.711
***
-0.8
31**
*0.
693*
**1.
000*
**0.
692*
**-0
.289
***
0.62
7***
-0.4
00**
*0.
336*
**G
DP/
Cap
ita(L
og)
-0.8
58**
*-0
.696
***
0.83
9***
0.69
2***
1.00
0***
-0.4
19**
*0.
476*
**-0
.496
***
0.27
7**
Clim
ate
Eve
nts
0.46
0***
0.26
7**
-0.3
55**
*-0
.289
***
-0.4
19**
*1.
000*
**-0
.245
**0.
092
0.04
2L
evel
ofD
emoc
racy
-0.5
87**
*-0
.680
***
0.51
3***
0.62
7***
0.47
6***
-0.2
45**
1.00
0***
-0.3
02**
*0.
326*
**E
thni
cFr
actio
naliz
atio
n0.
482*
**0.
456*
**-0
.564
***
-0.4
00**
*-0
.496
***
0.09
2-0
.302
***
1.00
0***
-0.1
07R
egim
eD
urab
ility
-0.2
32**
-0.4
01**
*0.
225*
*0.
336*
**0.
277*
*0.
042
0.32
6***
-0.1
071.
000*
**b.
Lis
twis
eN
=131
Tabl
e7:
Dem
ogra
phic
Pres
sure
,Con
flict
,and
Gen
derE
qual
ityar
ehi
ghly
.So
urce
:Teo
rell
etal
.(2
016)
;UN
DP
(201
5)
42
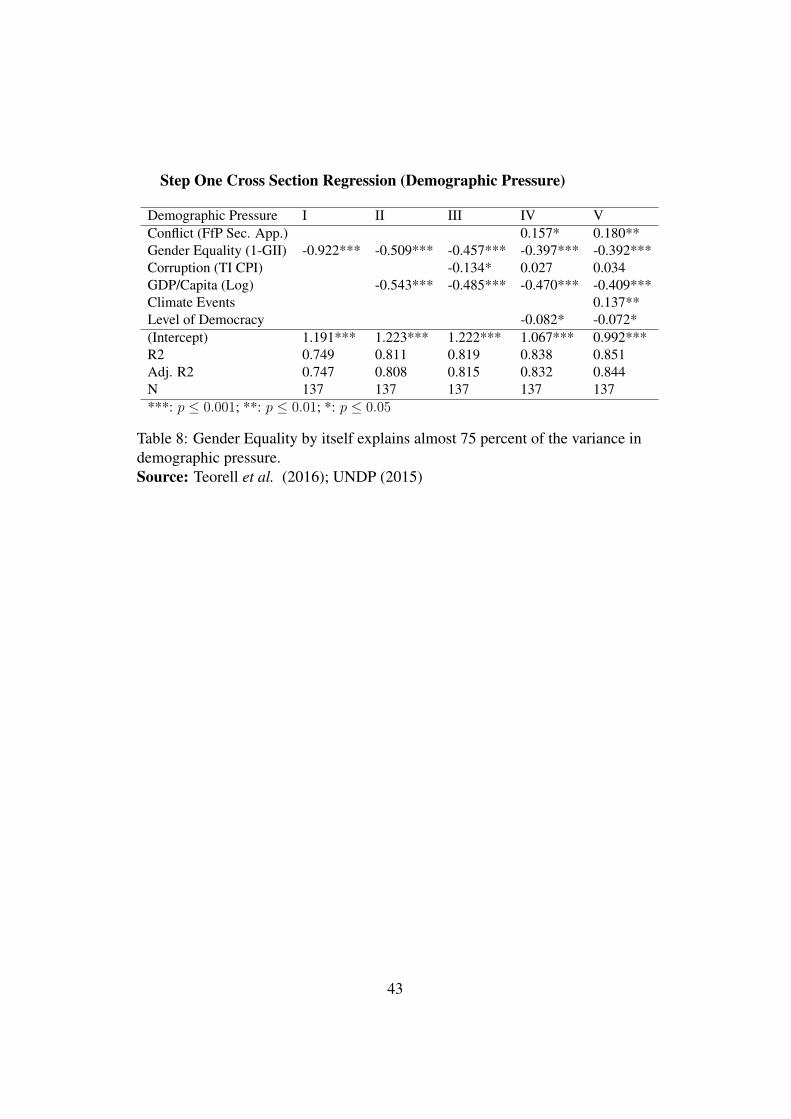
Step One Cross Section Regression (Demographic Pressure)
Demographic Pressure I II III IV VConflict (FfP Sec. App.) 0.157* 0.180**Gender Equality (1-GII) -0.922*** -0.509*** -0.457*** -0.397*** -0.392***Corruption (TI CPI) -0.134* 0.027 0.034GDP/Capita (Log) -0.543*** -0.485*** -0.470*** -0.409***Climate Events 0.137**Level of Democracy -0.082* -0.072*(Intercept) 1.191*** 1.223*** 1.222*** 1.067*** 0.992***R2 0.749 0.811 0.819 0.838 0.851Adj. R2 0.747 0.808 0.815 0.832 0.844N 137 137 137 137 137***: p ≤ 0.001; **: p ≤ 0.01; *: p ≤ 0.05
Table 8: Gender Equality by itself explains almost 75 percent of the variance indemographic pressure.Source: Teorell et al. (2016); UNDP (2015)
43
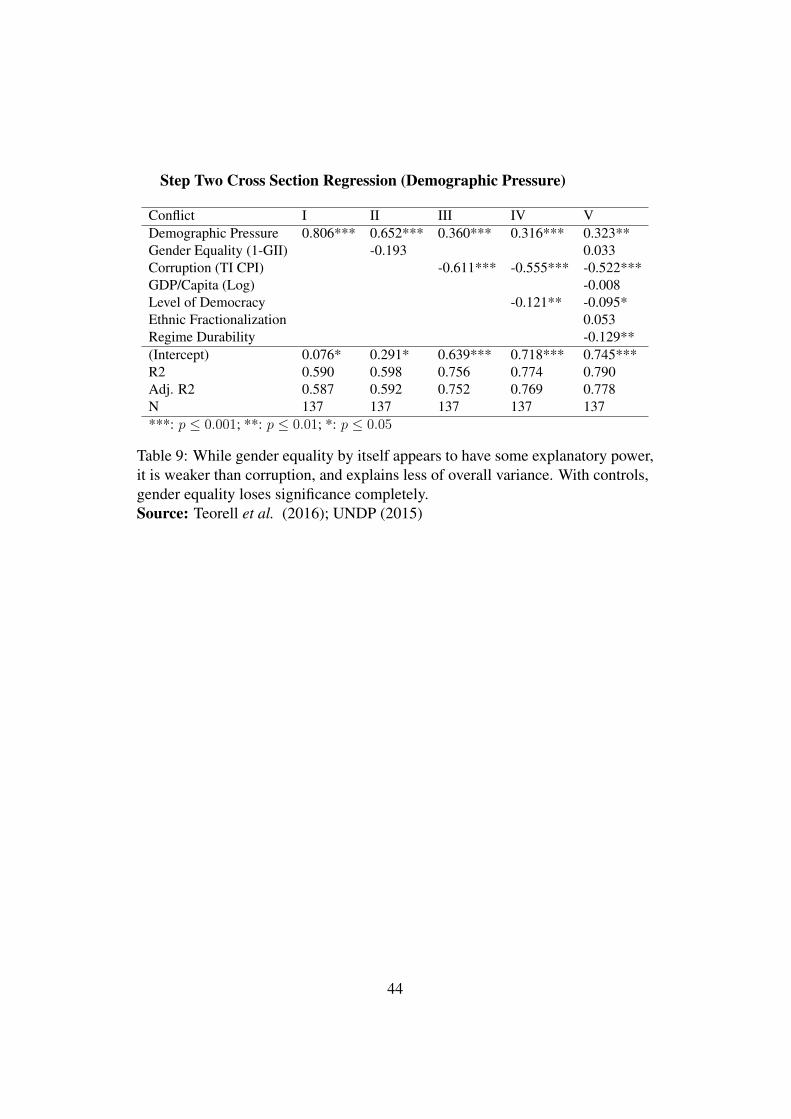
Step Two Cross Section Regression (Demographic Pressure)
Conflict I II III IV VDemographic Pressure 0.806*** 0.652*** 0.360*** 0.316*** 0.323**Gender Equality (1-GII) -0.193 0.033Corruption (TI CPI) -0.611*** -0.555*** -0.522***GDP/Capita (Log) -0.008Level of Democracy -0.121** -0.095*Ethnic Fractionalization 0.053Regime Durability -0.129**(Intercept) 0.076* 0.291* 0.639*** 0.718*** 0.745***R2 0.590 0.598 0.756 0.774 0.790Adj. R2 0.587 0.592 0.752 0.769 0.778N 137 137 137 137 137***: p ≤ 0.001; **: p ≤ 0.01; *: p ≤ 0.05
Table 9: While gender equality by itself appears to have some explanatory power,it is weaker than corruption, and explains less of overall variance. With controls,gender equality loses significance completely.Source: Teorell et al. (2016); UNDP (2015)
44
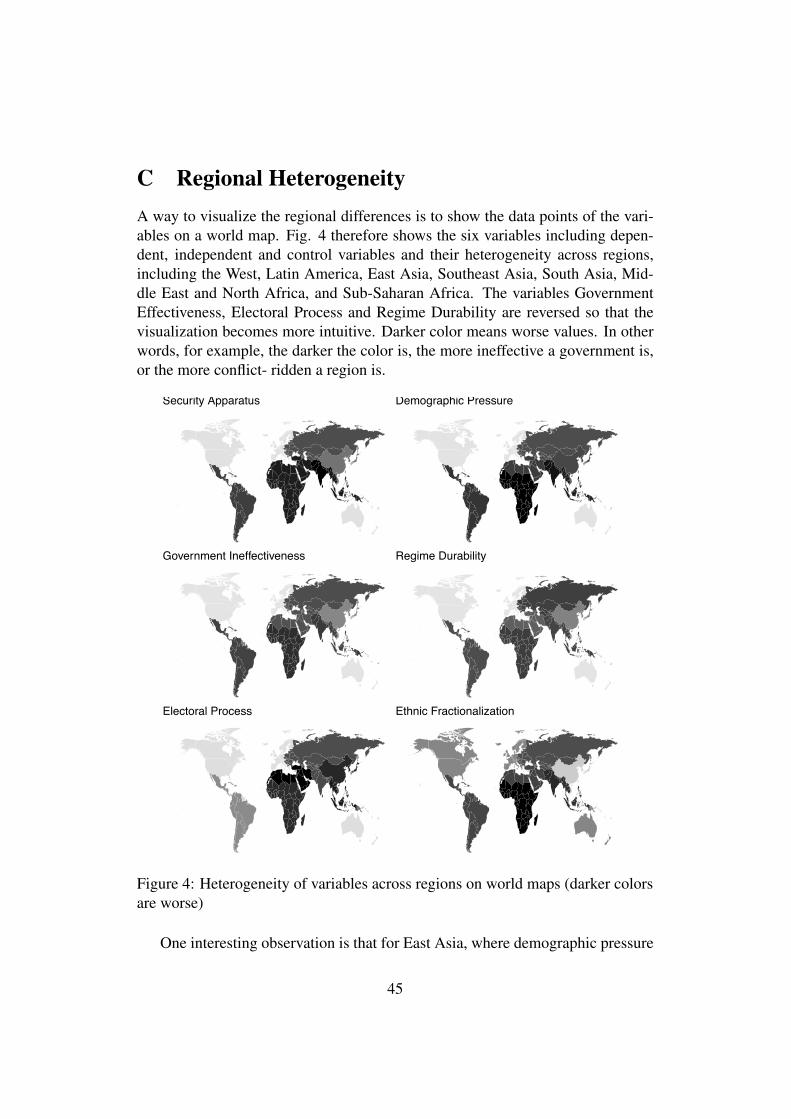
C Regional HeterogeneityA way to visualize the regional differences is to show the data points of the vari-ables on a world map. Fig. 4 therefore shows the six variables including depen-dent, independent and control variables and their heterogeneity across regions,including the West, Latin America, East Asia, Southeast Asia, South Asia, Mid-dle East and North Africa, and Sub-Saharan Africa. The variables GovernmentEffectiveness, Electoral Process and Regime Durability are reversed so that thevisualization becomes more intuitive. Darker color means worse values. In otherwords, for example, the darker the color is, the more ineffective a government is,or the more conflict- ridden a region is.
Security Apparatus Demographic Pressure
Government Ineffectiveness Regime Durability
Electoral Process Ethnic Fractionalization
Figure 4: Heterogeneity of variables across regions on world maps (darker colorsare worse)
One interesting observation is that for East Asia, where demographic pressure
45
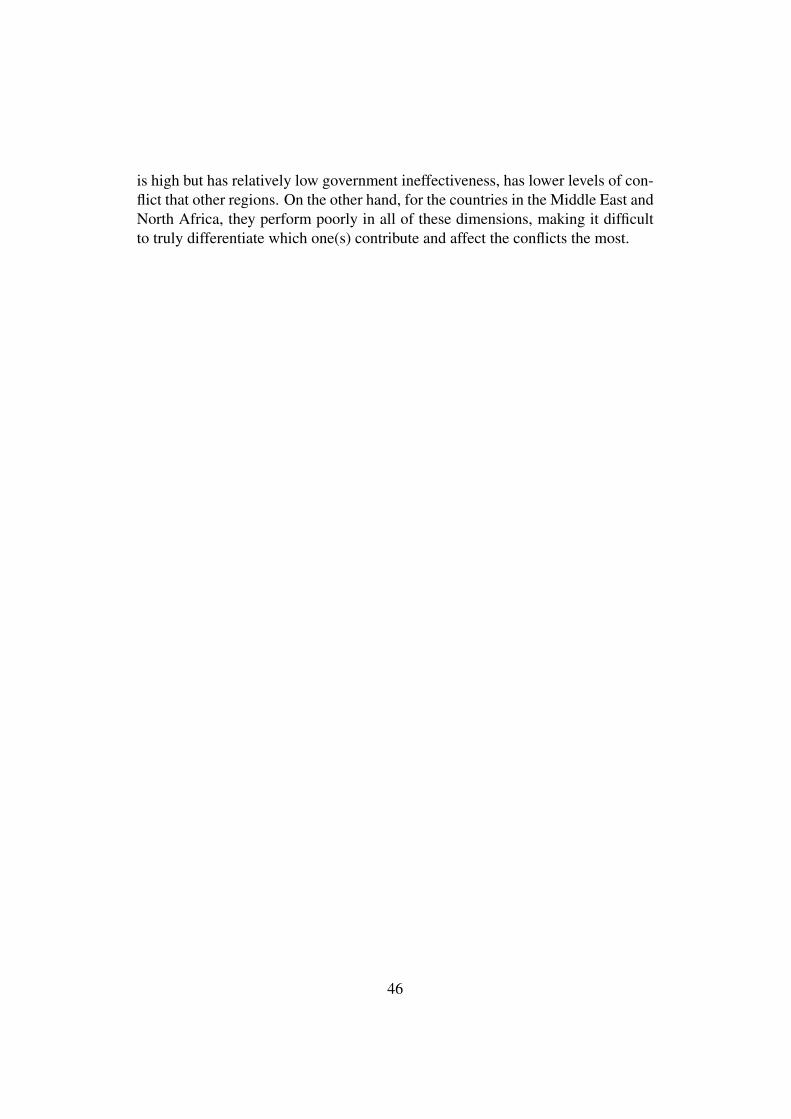
is high but has relatively low government ineffectiveness, has lower levels of con-flict that other regions. On the other hand, for the countries in the Middle East andNorth Africa, they perform poorly in all of these dimensions, making it difficultto truly differentiate which one(s) contribute and affect the conflicts the most.
46


![Gender Equality[1]](https://static.fdocuments.net/doc/165x107/55cf8541550346484b8c02d5/gender-equality1.jpg)