Climate Change for Interpreters at Katmai National Park · the physics of climate change, how it...
25
Climate Change info for Interpreters at Katmai National Park LOREM IPSUM
Transcript of Climate Change for Interpreters at Katmai National Park · the physics of climate change, how it...

Climate Change info for Interpreters at Katmai National Park
LOREM IPSUM

KATMAI NATIONAL PARK AND PRESERVE
1
Climate Change

SECTION 1
Climate change is one of the greatest challenges
humanity faces in the 21st century. Climate change
impacts they way national parks are used and
managed and the ecosystems within them. It alters
weather patterns and ocean temperatures,
increases the risk of drought, can exacerbate
habitat loss and extinction, causes sea level rise,
and affects our ability to grow and access food
across the globe.
The scientific consensus on human-caused
climate change is overwhelming: humans,
primarily through the burning of fossil fuels like
oil and coal, are forcing earth’s climate to warm.
There is no scientifically plausible alternative
theory that explains the changes to Earth’s climate
we are experiencing today.
In this chapter, you’ll find basic information about
the physics of climate change, how it may impact
Katmai’s resources, visitor surveys regarding opinions on climate
change, and techniques to help you interpret climate change.
Consider weaving relevant climate change messages into your programs,
social media posts, and roving contacts. With so much
misunderstanding and misinformation about climate change and the
potential consequences of no action, we have a duty to interpret this
topic.
Climate Change and Interpreters
2
NPS Director Jon Jarvis and others explain why interpreters in the National Park Service have a chance to make a big difference helping the public understand and care about climate change.
Climate Change and the Role of Interpreters

SECTION 2
The information in this section is gleaned from a
variety of sources, especially climate.nasa.gov. Other
sources are linked to within the text.
What is the greenhouse effect?The greenhouse effect is a natural phenomenon
whereby heat-trapping gases in the atmosphere,
primarily water vapor, keep the Earth’s surface warm.
Without the greenhouse effect, our planet could not
support life as we know it. Human activities,
primarily by burning fossil fuels and changing land
cover patterns, are increasing the concentrations of
some of these gases, like carbon dioxide, amplifying
the natural greenhouse effect.
In This Section
1. What is the greenhouse effect?
2. How does CO2 trap heat?
3. Evidence for Human-Caused Climate Change
4. Other Evidence and Impacts
Climate Change Basics
3

Certain gases in the atmosphere
block heat from escaping.
Long-lived gases that remain
semi-permanently in the
atmosphere and do not respond
physically or chemically to changes
in temperature are described as
"forcing" climate change. Gases,
such as water vapor, which
respond physically or chemically to
changes in temperature are seen as
"feedbacks."
How does CO2 trap heat?Carbon dioxide (CO2) is a minor but very important component of the
atmosphere. Carbon dioxide is released through natural processes such
as biological respiration, volcano eruptions, and through human
activities such as deforestation, land use changes, and burning fossil
fuels. The coal or oil burning process combines carbon with oxygen in
the air to make CO2. Humans have increased atmospheric CO2
concentration by a third since the Industrial Revolution began. This is
the most important long-lived forcing of climate change.
By burning fossil fuels, humans have essentially thickened the insulating
blanket around Earth. CO2 is transparent to visible light, but not infrared
energy. Sunlight reaching earth heats the land, ocean, and atmosphere.
Some of that sunlight is reflected back to space by the surface, clouds, or
ice. Much of the sunlight that reaches Earth is absorbed and warms the
planet. Infrared energy, radiating towards space from Earth’s surface and
atmosphere is trapped and reemitted by CO2. Therefore, an increase in
4
Are You Climate Literate?
This PDF contains the basics on earth’s climate. Source: http://pmm.nasa.gov/education/articles/climate-literacy-essential-principles-climate-sciences
The above graphic lists four highlights from the Intergovernmental Panel on Climate Change's (IPCC) Fifth Assessment Report Summary for Policy Makers, released September 27, 2013, which more than 25 NASA scientists helped author and review. The report is the work of 209 lead authors and 50 review editors from 39 countries, and over 600 contributing authors from 32 countries. Source: http://climate.nasa.gov/climate_resources/26/

CO2 increases the atmosphere’s ability to absorb and retain heat.
The consequences of changing the natural atmospheric greenhouse are
difficult to predict, but certain effects seem likely:
• On average, Earth will become warmer. People in some regions may
welcome warmer temperatures, but others may not.
• Warmer conditions will probably lead to more evaporation and
precipitation overall, but individual regions will vary, some becoming
wetter and others dryer.
• A stronger greenhouse effect will warm the oceans and partially melt
glaciers and other ice, increasing sea level. Ocean water also will
expand if it warms, contributing further to sea level rise.
• Meanwhile, some crops and other plants may respond favorably to
increased atmospheric CO2, growing more vigorously and using water
more efficiently. At the same time, higher temperatures and shifting
climate patterns may change the areas where crops grow best and
affect the makeup of natural plant communities.
Evidence for Human-Caused Climate ChangeMany lines of evidence lead scientists to conclude that humans,
primarily through burning of fossil fuels, are changing Earth’s climate.
Atmospheric CO2 Levels are Increasing: CO2 levels in the atmosphere
have climbed rapidly since the Industrial Revolution. In late January
2016, the level of CO2 in the mid-troposphere was 402 ppm.
CO2 Increase is From Fossil Fuels: By measuring the changing ratios of
different carbon isotopes in the atmosphere, scientists can trace how
Ancient air bubbles trapped in ice enable us to step back in time and see what Earth's atmosphere, and climate, were like in the distant past. They tell us that levels of carbon dioxide (CO2) in the atmosphere are higher than they have been at any time in the past 400,000 years. During ice ages, CO2 levels were around 200 parts per million (ppm), and during the warmer interglacial periods, they hovered around 280 ppm. In 2013, CO2 levels surpassed 400 ppm for the first time in recorded history. This recent relentless rise in CO2 shows a remarkably constant relationship with fossil-fuel burning, and can be well accounted for based on the simple premise that about 60 percent of fossil-fuel emissions stay in the air. Today, we stand on the threshold of a new geologic era, which some term the Anthropocene, one where the climate is very different to the one our ancestors knew.
If fossil-fuel burning continues at a business-as-usual rate, such that humanity exhausts the reserves over the next few centuries, CO2 will continue to rise to levels of order of 1500 ppm. The atmosphere would then not return to pre-industrial levels even tens of thousands of years into the future. This graph not only conveys the scientific measurements, but it also underscores the fact that humans have a great capacity to change the climate and planet. Source: http://climate.nasa.gov/climate_resources/24/
5

much carbon is from fossil fuels.
Isotope signatures are a smoking
gun that directly connects the rise
in atmospheric CO2 directly to
humanity’s emissions.
Carbon has three isotopes—12C, 13C, and 14C. Two of these, 12C and 13C, are stable. They are not
radioactive and do not decay into
another element or isotope. 14C is
radioactive and has a half life of
5,730 years. Since fossil fuels are
millions of years old and 14C half
life is so short, fossil fuels do not
contain 14C.
By studying how the ratio of these
isotopes have changed in the
atmosphere, scientists have
determined that the atmospheric
increase in carbon dioxide is
dominated by fossil fuel emissions. During photosynthesis, plants prefer
to take in 12C over 13C. Simply put, plants have less 13C compared to 12C
than the atmosphere. Fossil fuels also have less 13C relative to 12C than
the atmosphere. Why? Fossil fuels are ancient plants.
Therefore, when CO2 from fossil fuels enter the atmosphere, the amount
of 14C and 13C in the atmosphere goes down. This is precisely what has
been measured.
The relative proportion of 13C in our
atmosphere is steadily decreasing over
time. Most fossil fuels, which are
ancient plant and animal material, have
the same 13C isotopic fingerprint as
other plants. The annual trend–the
overall decrease in atmospheric 13C–is
explained by the addition of carbon
dioxide to the atmosphere that must
come from the terrestrial biosphere
and/or fossil fuels. Since the amount of 14C in the atmosphere is not going up
either—it’s going down too—then the
increase in carbon (i.e. CO2) in the
atmosphere can only be from fossil
fuels. Read more in-depth information
at
http://www.esrl.noaa.gov/gmd/outreach/isotopes/.
CO2 Absorbs Infrared Energy: Carbon dioxide’s ability to absorb
infrared energy has been known since the 19th century. Now, satellite
technology allows us to measure warming from CO2 and other
greenhouse gases in the upper atmosphere.
CO2 and other gases absorb infrared energy along certain wavelengths
and the amount of radiation of these wavelengths outgoing into space
6
While global CO2 levels in the atmosphere have risen, the levels of certain elements of carbon in the atmosphere, like 13C and 14C, have decreased.

can be measured. Doing this demonstrates CO2 is adding considerable
warming along with ozone (O3) and methane (CH4).
In 2001, John Harries and others published a paper in Nature
documenting direct experimental evidence for a significant increase in
the Earth's greenhouse effect that is consistent with greenhouse gases.
Emissions infrared radiation into space have decreased at exactly the
same wavelengths that CO2 is best at absorbing. Less infrared radiation is
reaching space because there is more CO2 in the atmosphere to absorb it.
Find more information at
https://www.skepticalscience.com/empirical-evidence-for-CO2-enhanc
ed-greenhouse-effect-basic.htm.
Global Temperatures have Increased: All four major global surface
temperature reconstructions show that Earth has warmed since 1880.
Most of this warming has occurred since the 1970s, with the 20 warmest
years having occurred since 1981 and with all 10 of the warmest years
occurring in the past 12 years. Even though solar output declined in the
2000s, resulting in an unusually deep solar minimum in 2007-2009,
surface temperatures continued to increase.
In sum, we know that CO2 absorbs and reemits infrared energy. We
know that CO2 levels in the atmosphere are increasing. We know that the
increase comes from humans burning fossils fuels. We know that
temperatures in the ocean and atmosphere are increasing. All lines of
evidence point towards humans as the cause for the climate change we
experience today.
Other Evidence and Impacts1. Warming Oceans and More Acidic Oceans: The oceans have
absorbed much of the earth’s increased heat, with the top 700 meters
7
Less infrared energy is reaching space from Earth because CO2 and other greenhouse gases are absorbing it. (Harries, 2001)
Temperature data from four international science institutions. All show rapid warming in the past few decades and that the last decade has been the warmest on record. Data sources: NASA's Goddard Institute for Space Studies, NOAA National Climatic Data Center, Met Office Hadley Centre/Climatic Research Unit and the Japanese Meteorological Agency.

(about 2,300 feet) of ocean showing warming of 0.302 degrees
Fahrenheit since 1969 (NASA, http://climate.nasa.gov/evidence/).
When water absorbs CO2, it can form a weak, but important acid
called carbonic acid (H₂CO₃). Since the beginning of the Industrial
Revolution, the pH of surface ocean waters has fallen by 0.1 pH units.
Since the pH scale, like the Richter scale, is logarithmic, this change
represents approximately a 30 percent increase in acidity. Source:
http://www.pmel.noaa.gov/CO2/story/What+is+Ocean+Acidification
%3F.
2. Sea Levels are Rising: Global sea level rose about 17 centimeters (6.7
inches) in the last century. The rate in the last decade, however, is
nearly double that of the last century.
3. Extreme Events are More Frequent: The number of record high
temperature events in the United States has been increasing, while the
number of record low temperature events has been decreasing, since
1950. The U.S. has also witnessed increasing numbers of intense
rainfall events.
4. Glaciers, Ice Caps, and Sea Ice are Shrinking: The Greenland and
Antarctic ice sheets have decreased in mass. Glaciers are retreating
almost everywhere around the world — including in the Alps,
Himalayas, Andes, Rockies, Alaska, and Africa. Both the extent and
thickness of Arctic sea ice has declined rapidly over the last several
decades.
5. Decreased Snow Cover: Satellite observations reveal that the
amount of spring snow cover in the Northern Hemisphere has
decreased over the past five decades and that the snow is melting
earlier.
8
Arctic Sea Ice Minimum: Arctic sea ice reaches its minimum each September. September Arctic sea ice is now declining at a rate of 13.4 percent per decade, relative to the 1981 to 2010 average. This animation shows the difference in the area, volume and depth of the average September Arctic sea ice between 1979 and 2013. Each grid cell of the ground plane is 1,000 kilometers in width, or one million square kilometers per cell. The depth of the sea ice is measured in meters. Source: http://svs.gsfc.nasa.gov/cgi-bin/details.cgi?aid=4206
SECTION 3
Alaska and the Arctic are warming more rapidly than
much of the rest of the planet. At first glance, this
temperature change could be welcomed. However,
climate change will fundamentally alter the state’s
ecology and potentially the way of life for people all
across the state. Since Alaska is so varied
geographically, ecologically, and climatologically,
changes will happen in different ways and at different
rates across the state.
Because of its cold-adapted features and rapid
warming, climate change impacts on Alaska are
already pronounced, including earlier spring
snowmelt, reduced sea ice, widespread glacier
retreat, warmer permafrost, drier landscapes, and
more extensive insect outbreaks and wildfire.
This section outlines some of the changes observed
and modeled for Alaska and the Katmai region.
In This Section
1. Projected Climate Change in Alaska
2. Shrinking Glaciers
3. Thawing Permafrost
4. Changing Oceans and Ocean Acidification
5. Native Communities
6. Terrestrial Changes
Climate Change Impacts on Alaska and Katmai
9
The information in this section is derived primarily from Ch. 22 Alaska in the 2014 Climate Change Impacts in the United States, National Climate Assessment available at http://nca2014.globalchange.gov/report/regions/alaska. Tap on the image to read the PDF. The website also has expanded content and is well worth visiting. Both the PDF and website include citations. Other information specific to the Katmai area is included and cited when necessary.

Projected Climate Change in AlaskaAverage annual temperatures in Alaska are projected to rise by an
additional 2°F to 4°F by 2050. If global emissions continue to increase
during this century, temperatures can be expected to rise 10°F to 12°F in
the north, 8°F to 10°F in the Interior Alaska, and 6°F to 8°F in the rest of
the state. Even with substantial emissions reductions, Alaska is projected
to warm by 6°F to 8°F in the north and 4°F to 6°F in the rest of the state
by the end of the century.
Annual precipitation is projected to increase, especially in northwestern
Alaska, as part of the broad pattern of increases projected for high
northern latitudes. Annual precipitation increases of about 15% to 30%
10
Alaska Will Continue to Warm Rapidly
Northern latitudes are warming faster than more temperate regions, and Alaska has already warmed much faster than the rest of the country. Maps show changes in temperature, relative to 1971-1999, projected for Alaska in the early, middle, and late parts of this century, if greenhouse gas emissions continue to increase (higher emissions, A2), or are substantially reduced (lower emissions, B1).

are projected for the region by late this century if global emissions
continue to increase. All models project increases in all four seasons.
However, increases in evaporation due to higher air temperatures and
longer growing seasons are expected to reduce water availability in most
of the state.
The length of the growing season in interior Alaska has increased 45%
over the last century and that trend is projected to continue. This could
improve conditions for agriculture where moisture is adequate, but will
reduce water storage and increase the risks of more extensive wildfire
and insect outbreaks across much of Alaska. Changes in dates of
snowmelt and freeze-up would influence seasonal migration of birds
and other animals, increase the likelihood and rate of northerly range
expansion of native and non-native species, alter the habitats of both
ecologically important and endangered species, and affect ocean
currents.
Shrinking GlaciersMost glaciers in Alaska and British Columbia are shrinking substantially.
This trend is expected to continue and has implications for hydropower
production, ocean circulation patterns, fisheries, and global sea level
rise.
Alaska is home to some of the largest glaciers and fastest loss of glacier
ice on Earth. This rapid ice loss is primarily a result of rising
temperatures. Loss of glacial volume in Alaska and neighboring British
Columbia, Canada, currently contributes 20% to 30% as much surplus
freshwater to the oceans as does the Greenland Ice Sheet – about 40 to
70 gigatons per year, comparable to 10% of the annual discharge of the
Mississippi River. Alaska is home to 11% Earth’s mountain glaciers, but
25% of mountain glacier’s total contribution to sea level rise. In Alaska,
most glacial retreat is due to warmer temperatures, not a reduction in
precipitation (Shad O’Neel, USGS glaciologist in a presentation to Earth
to Sky participants, Oct. 14, 2015).
Glaciers continue to respond to climate warming for years to decades
after warming ceases, so ice loss is expected to continue, even if air
temperatures were to remain at current levels. The global decline in
glacial and ice-sheet volume is predicted to be one of the largest
contributors to global sea level rise during this century.
11
Fourpeaked Glacier: Then and Now
Fourpeaked Mountain area seen from Cape Douglas in 1904 (R. Stone) and 2005 (M. Jorgenson). Comparison with Stone’s 1904 image shows dramatic retreat of Fourpeaked Glacier (left) and an unnamed glacier (right). In 1904, both glaciers were near their maximal extent after the Little Ice Age. 1904 photo courtesy USGS. Tap on the icon to see the before and after photos.
Mount Douglas: Then and Now
Unnamed glacier south of Cape Douglas seen in 1895 (C. Purington) and 2005 (M. Jorgenson). Purington’s photograph shows the glacier’s terminus at or near its maximal extent following the Little Ice Age. By 2005, it had retreated out of the field of view. Tall scrub has established widely on morainal surfaces, but not on the continually disturbed floodplain of the glacial stream. 1895 photo courtesy USGS. Tap on the icon to see the before and after photos.

Glaciers supply about half of the total freshwater input to the Gulf of
Alaska. Water from glacial landscapes is also recognized as an important
source of organic carbon, phosphorus, and iron that contribute to high
productivity in coastal waters, so changes in these inputs could alter
critical nearshore fisheries.
Katmai’s glaciers cover around 915 km2 (350 mi2) based on 2009 satellite
imagery around 2009, including glaciers wholly or partly inside of the
park boundary. In Katmai the number of glaciers counted on 1950s
USGS topographic maps was 255 glaciers, and 298 glaciers in satellite
imagery, an increase of 17%. However, the glacial area decreased from
1,060 km2 to 915 km2 (410 mi2 to 350 mi2), or -14%.
Most glaciers in the Katmai area are receding, like most glaciers in
Alaska, but glaciers that were covered by thick deposits of 1912 ash are
not receding and some have advanced. Terminus retreat was the
response seen in most individual glaciers, including notable retreats by
glaciers on Fourpeaked and Douglas mountains in the northeast section
of the park and Hallo Glacier and others on Kukak Volcano.
(Information on Katmai’s glaciers in the last two paragraphs are from a
12
Spotted Glacier: Then and Now
Spotted Glacier area looking west in 1904 (T. Stanton) and 2005 (M. Jorgenson). In 1904 the glacier was near its maximal extent following the Little Ice Age, but in the last century the glacier has retreated about 6 km. The young morainal surface has been colonized by alders and scattered trees, while the center of the valley is occupied by a moraine-dammed lake. Thaw of ice-cored moraine has formed several kettle ponds. 1904 photo courtesy USGS. Tap on the icon to see the before and after photos.
Glacial Change on Mount Mageik
On Mount Mageik, all glaciers have retreated since they were first photographed. Ash fall on Mageik thins from 50 cm on its northeast to 5 cm on its southeast and nearly all of it was removed within a few decades. National Geographic Society photo from 1919 and 2010 photo from M. Fitz. Tap on the photo to see the before and after photos.
Debris covered glaciers respond to climate change differently than bare ice. The lower portions of the Knife Creek Glaciers are covered with a heavy mantle of ice and pumice from the 1912 Novarupta-Katmai eruption which insulates the glaciers and slows melting. As much as 12 meters of fallout remain on parts of the Knife Creek Glaciers on Trident. As a result, the Knife Creek Glaciers have advanced over top of the 1912 ash flow.

draft Katmai Geologic Report. The final report should be available in
2016).
Thawing PermafrostAlaska differs from most of the rest of the U.S. in having permafrost –
frozen ground that restricts water drainage and therefore strongly
influences landscape water balance and the design and maintenance of
infrastructure. Permafrost near the Alaskan arctic coast has warmed 4°F
to 5°F at 65 foot depth, since the late 1970s and 6°F to 8°F at 3.3 foot
depth since the mid-1980s. In Alaska, 80% of land is underlain by
permafrost, and of this, more than 70% is vulnerable to subsidence upon
thawing because of ice content that is either variable, moderate, or high.
Thaw is already occurring in interior and southern Alaska and in
northern Canada, where permafrost temperatures are near the thaw
point. Models project that permafrost in Alaska will continue to thaw
and some models project that near-surface permafrost will be lost
entirely from large parts of Alaska by the end of the century.
Although the average annual temperature at King Salmon is above
freezing, isolated permafrost is present in the western portion of Katmai
on the coastal plain under areas insulated by peat and thick vegetation
mats. The presence of the permafrost is possibly due to the insulating
properties of overlying peat, or remnants of the Pleistocene glaciations.
Frost-wedge crack nets are present at higher elevations on a pass near
Kaguyak caldera (Hults, Chad. Draft Katmai Geologic Report. 2016).
Changes in terrestrial ecosystems in Alaska and the Arctic may be
influencing the global climate system. Permafrost soils throughout the
entire Arctic contain almost twice as much carbon as the atmosphere.
Warming and thawing of these soils increases the release of carbon
dioxide and methane through increased decomposition. Thawing
permafrost also delivers organic-rich soils to lake bottoms, where
decomposition in the absence of oxygen releases additional methane.
Extensive wildfires also release carbon that contributes to climate
13
The Big Thaw
Projections for average annual ground temperature at a depth of 3.3 feet over time if emissions of heat-trapping gases continue to grow (higher emissions scenario, A2), and if they are substantially reduced (lower emissions scenario, B1). Blue shades represent areas below freezing at a depth of 3.3 feet, and yellow and red shades represent areas above freezing at that depth, based on the GIPL 1.0 model. (Figure source: Permafrost Lab, Geophysical Institute, University of Alaska Fairbanks).

warming.The capacity of the Yukon River Basin in Alaska and adjacent
Canada to store carbon has been substantially weakened since the 1960s
by the combination of warming and thawing of permafrost and by
increased wildfire. Expansion of tall shrubs and trees into tundra (which
is happening in Katmai too, not just in the arctic) makes the surface
darker and rougher, increasing absorption of the sun’s energy and
further contributing to warming. This warming is likely stronger than the
potential cooling effects of increased carbon dioxide uptake associated
with tree and shrub expansion. The shorter snow-covered seasons in
Alaska further increase energy absorption by the land surface, an effect
only slightly offset by the reduced energy absorption of highly reflective
post-fire snow-covered landscapes. This spectrum of changes in Alaskan
and other high-latitude terrestrial ecosystems jeopardizes efforts by
society to use ecosystem carbon management to offset fossil fuel
emissions.
Changing Oceans and Ocean AcidificationOcean acidification, rising ocean temperatures, declining sea ice, and
other environmental changes interact to affect the location and
abundance of marine fish, including those that are commercially
important, those used as food by other species, and those used for
subsistence. Overall habitat extent is expected to change as well, though
the degree of the range migration will depend upon the life history of
particular species.
Ocean waters globally have become 30% more acidic due to absorption
of large amounts of human-produced carbon dioxide (CO2) from the
atmosphere. This CO2 interacts with ocean water to form carbonic acid
that lowers the ocean’s pH (ocean acidification). The polar ocean is
particularly prone to acidification because of low temperatures, and low
salt content, the latter resulting from the large freshwater input from
melting sea ice and large rivers. Acidity reduces the capacity of key
plankton species and shelled animals to form and maintain shells and
other hard parts, and therefore alters the food available to important fish
species. A lower pH will have particularly strong societal effects on the
Bering Sea on Alaska’s west coast because of its high-productivity
commercial and subsistence fisheries.
At some times of year, acidification has already reached a critical
threshold for organisms living on Alaska’s continental shelves. Certain
algae and animals that form shells (such as clams, oysters, and crab) use
carbonate minerals (aragonite and calcite) that dissolve below that
threshold. These organisms form a crucial component of the marine
food web that sustains life in the rich waters off Alaska’s coasts. It is not
difficult to connect the dots and see that changes in ocean chemistry can
14
How Does Ocean Acidification Work?
Scroll though this window to learn more about how ocean acidification happens. Based on information from http://climateinterpreter.org/content/ocean-acidification.
Ocean acidification occurs when CO2 is absorbed into water at a high
rate. It reacts with water molecules (H2O) to form carbonic acid
(HCO3). This compound then breaks down into a hydrogen ion (H+)
and carbonate (HCO3). The presence of all these hydrogen ions is
what decreases the pH, or acidifies the ocean. This can be summed
up with a nifty chemical equation: CO2 + H2O -> H + HCO3.
The saga does not end here, unfortunately. That carbonate molecule
(HCO3) is going to go on to cause trouble for marine organisms. Once
carbon dioxide (CO2) has mixed with water molecules (H2O) to form

have large impacts on fish like salmon and the animals (including
humans) that depend on salmon.
Native CommunitiesWith the exception of oil-producing regions in the north, rural Alaska is
one of the most extensive areas of poverty in the U.S. in terms of
household income, yet residents pay the highest prices for food and fuel.
Alaska Native Peoples, who are the most numerous residents of this
region, depend economically, nutritionally, and culturally on hunting
and fishing for their livelihoods.
Hunters speak of thinning sea and river ice that makes harvest of wild
foods more dangerous, changes to permafrost that alter spring run-off
patterns, a northward shift in seal and fish species, and rising sea levels
with more extreme tidal fluctuations. Responses to these changes are
often constrained by regulations. Coastal erosion is destroying
infrastructure. Impacts of climate change on river ice dynamics and
spring flooding are threats to river communities but are complex, and
trends have not yet been well documented. Major food sources are
under stress due to many factors, including lack of sea ice for marine
mammals.
Terrestrial ChangesClimate change is causing dramatic shifts in Alaska’s terrestrial
ecosystems.
Biome Shifts: Between 1970 and 2000, the snow-free season increased
by approximately 10 days across Alaska, primarily due to earlier
snowmelt in the spring. A longer growing season has potential economic
benefits, providing a longer period of outdoor and commercial activity
such as tourism. However, there are also downsides.
Winter extreme low temperatures have increased and mean annual and
warm season temperatures have increased. More extensive and severe
wildfires could shift the forests of Interior Alaska during this century
from dominance by spruce to broadleaf trees for the first time in the past
4,000 to 6,000 years.
White spruce forests in Alaska’s interior are experiencing declining
growth due to drought stress and continued warming could lead to
widespread death of trees. In Interior Alaska, aspen and spruce trees
have shown a negative response to warm summer temperatures. This
15
This graph shows the correlation between rising CO2 in the atmosphere measured at Mauna Loa with rising CO2 levels in the nearby ocean at Station Aloha in Hawaii. As more CO2 accumulates in the ocean, the pH of the ocean decrease. http://www.pmel.noaa.gov/CO2/file/Hawaii+Carbon+Dioxide+Time-Series

indicates that conditions for optimal
growth may be surpassed by a
warming climate in that region.
The opposite is true in western and
southwestern Alaska, where
conditions for tree growth have been
historically suboptimal. Tree growth
is increasing in western Alaska (where
trees are sparse and growing
conditions are suboptimal) and
declining to near survival limits in the
Interior.
In Lake Clark National Park, white
spruce reacted variably to warmer
temperatures since 1950. Trees in
plots that did not experience drought
stress increased growth, while
drought stressed trees did not.
(Driscoll, et al (2005). Divergent tree
growth response to recent climatic
warming, Lake Clark National Park
and Preserve, Alaska. Geophys. Res.
Lett., 32, L20703,
doi:10.1029/2005GL024258)
Overall, it is likely that spruce and other forest trees will expand their
range in western and southwestern Alaska. Interior Alaska may see a
significant biome shift to an ecosystem better adapted to seasonal
drought. More locally, Katmai and the King Salmon area will no longer
be the southwestern extent of spruce in Alaska. Spruce will continue to
expand into southward along the Alaska Peninsula. Katmai and western
Alaska may soon have optimal growing conditions for white spruce.
Forest Fires: Could wildfire become a part of Katmai’s ecosystem?
Natural fires in Katmai are very rare, and almost unheard of. However, in
2015 one natural fire burned just a few miles outside of the park’s
northwest boundary. Under changing climate conditions, the average
area burned per year in Alaska is projected to double by the middle of
this century. Any increase in wildfire in Katmai would be a significant
increase.
Wildfire has mixed effects on habitat. It generally improves habitat for
berries, mushrooms, and moose, but reduces winter habitat for caribou
because lichens, a key winter food source for caribou, require 50 to 100
years to recover after wildfire.
Insects Outbreaks: Climate plays a key role in determining the extent
and severity of insect outbreaks. Recent spruce bark beetle outbreaks in
south-central Alaska and in Katmai have been tied to milder winter time
conditions and warm spring and summer temperatures. See sidebar: Little Monsters on the next page.
16
Shrub and Tree Advance in King Salmon, Alaska
Naknek River from crest of bluff above “River Camp” public access site southeast of King Salmon, in 1918 (J. Sayre) and 2005 (G. Frost). Kenai birch and balsam poplar trees have become so dense on the bluff that it is now impossible to locate Sayre’s precise 1918 vantage point. Although it is possible that the clearing in the 1918 image was created by human disturbance, repeated photographs elsewhere in the area confirm that trees have become much more abundant in the King Salmon area over the last century. 1918 photo courtesy National Geographic Society. Tap on the icon to see the before and after photos.

The impacts of insect outbreaks are easy to observe at Brooks River. This was originally posted on the Katmai Terrane Blog in 2014 (http://www.nps.gov/katm/blogs/Little-Monsters.htm). While the post does a good job interpreting the interaction between bark beetles and spruce trees, it does not incorporate climate change info. How could it be rewritten to also interpret climate change?
INTERACTIVE 1.1 Little Monsters
Prior to 2006, Katmai’s spruce forests appeared healthy. Under the
dense canopy of needles, little light filtered through to the forest
floor where mosses and shade tolerant shrubs held a dominant
foothold. Reaching toward the sky were many spires of
green-needled spruces that intercepted much of the incoming light.
Katmai's spruce forest appeared healthy less than a decade ago. (NPS
Photo)
Today, however, even the casual observer walking through those
same forests will find something amiss. The standing spruce are now
dead skeletons of their former selves. Light easily reaches the forest
floor. Mosses are being overtaken by vigorous grasses and tall
shrubs. Something swept through this forest, and like a pandemic
17

SECTION 4
Before reading further, answer these questions and
record your answers in the widget on this page.
• What percentage of the public believe that humans
are changing the climate?
• How concerned do you think Katmai’s visitors are
about climate change?
• Do you think Katmai’s visitors want more or less
information about climate change?
This section presents survey information regarding
climate change. Some surveys were national and
other were more local. No Katmai-specific survey
has attempted to measure attitudes and beliefs
concerning climate change, but we can glean much
insight from other surveys. Keep your answers in
mind as you read further. Do your assumptions
correlate with the survey data?
In This Section
1. Six Americas
2. Climate Change Education Partnership Visitor Survey
3. Visitor Perceptions of Climate Change at Kenai Fjords
Visitor Survey Information on Climate Change
18
Knowledge of the Audience: Climate Change
What do you think the public thinks about climate change? Record your thoughts in this widget.

Six AmericasThis survey found that Americans fall along a spectrum of attitudes
towards global warming. Two-thirds of people surveyed were either
cautious (23%), concerned (31%), or alarmed (13%) about climate
change. Only 13% were dismissive of it. .
Climate Change Education Partnership Visitor SurveyHow do visitors to national parks and wildlife refuges view climate
change? Do they want to learn more or less about it?
In this survey, which includes results from Kenai National Park and
Kenai National Wildlife Refuge, results reveal that visitors care deeply
about these natural landscapes and differ significantly from the broader
American public in regards to their knowledge and opinions on climate
change, willingness to take mitigating actions, perceptions of climate
change impacts, and desire for climate change education.
Most respondents stated that the national parks and national wildlife
refuge system is extremely or very important to themselves and their
family (95%) and were equally concerned about the future of the
national parks and national wildlife refuges (74%). Most visitors
surveyed indicated that they think climate change will harm the national
park/wildlife refuge they visited a great deal (42%) and that it is being
harmed now (32%).
19
In-Depth Information on the Six Americas Survey
How do each of the Americas view global warming? Scroll through the window above to read more or go to http://climatecommunication.yale.edu/about/projects/global-warmings-six-americas/.
This in-depth information is from
http://climatecommunication.yale.edu/wp-content/uploads/2016/02/
2009_05_Global-Warmings-Six-Americas.pdf.
The Alarmed are the segment most convinced that global warming is
happening. Global warming is very important to them and they are
very worried about it. The Alarmed have thought a lot about the issue,
believe they are well informed about the causes, consequences, and
potential solutions, and are highly unlikely to change their minds. The
Alarmed believe there is a scientific consensus that global warming is
happening, and overwhelmingly believe that human activities are the
primary cause. Compared to the other five segments, they are the
most likely to view it as a threat to them personally and to future
generations, and as already harming people in the United States,
rather than in the distant future.
The Concerned are also convinced that global warming is happening,
although they are less certain than the Alarmed. The issue is also less
important to them than the Alarmed, yet they are relatively worried
about it . The Concerned have thought some about global warming,
believe they are somewhat informed about the causes, consequences,

When asked about their perceptions of climate change, many visitors
surveyed were sure that climate change is happening (77%). Most
visitors stated that the issue is important (84%), indicating the salience
of the issue. In addition, many respondents asserted that they feel
responsible for contributing to climate change (54%).
The majority of survey respondents
believe they can already see the
effects of climate change at national
parks and wildlife refuges (70%)
and most visitors would like to learn
more about climate change at these
places (67%). Many visitors
indicated that they have not
received any information on the
subject at the park or refuge they
visited (66%) but would prefer to
receive this information via trailside
exhibits (42%) or online (46%).
According to most respondents,
actions visitors can take to reduce climate change is the most important
topic for parks/refuges to address (78%). Additionally, most visitors are
willing (91%) to change their behaviors in the park or refuge they visited
to mitigate climate change.
Based on this research, it is apparent that the visitors to national parks
and wildlife refuges care deeply for this protected land, see how climate
change is affecting it, and want to be engaged in protecting these parks
and refuges themselves. This audience wants to learn more about climate
change and the actions they can take to mitigate its effects on these
treasured landscapes. With proper education, visitors can become
important advocates in the need to respond to climate change, both
within the parks and refuges, and their communities.
20
At Kenai National Wildlife Refuge, both visitors and employees were surveyed about climate change. Staff underestimated the concern the refuge’s visitors had for the climate change. The vast majority of visitors wanted more information on climate change.
Staff and Visitor Attitudes Towards Climate Change at Kenai National Wildlife Refuge
Climate Change Education Partnership Executive Summary
Read the executive summary of the Climate Change Education Partnership Visitor Survey Summary report.

Visitor Perceptions of Climate Change at Kenai Fjords National ParkResults from this survey indicate that five distinct groups of Kenai Fjords
visitors exist, who differ statistically and conceptually regarding their
levels of beliefs in 1) the occurrence of global climate change, 2) the
influence of humans on global climate change, and their self-perceived
awareness of 3) climate-related biophysical change at Kenai Fjords
National Park. Only 10% of people survey were doubtful and unaware
of human-caused climate change. More in-depth information from this
survey can be read in the scrolling window below or at
http://www.nps.gov/akso/nature/science/ak_park_science/PDF/2011Vo
l10-2/climate-change-segmentation-groups-at-kefj.pdf.
21
In the Kenai Fjords National Park survey, the size of each bubble is an approximate representation of each groups’ percent of the overall study sample. Twenty-nine percent of people were convinced and aware, 23% were convinced and partially aware, 20% were cautious and moderately aware, 18% were convinced and unaware, and 10% were doubtful and unaware.
The researchers for the climate change survey at Kenia Fjords
National Park made these recommendations to Kenai Fjords’ staff.
Consider how you can adapt these for Katmai. Could links between
bears, salmon, and oceans be your hook?
• Considering the Kenai Fjords National Park (KEFJ) segmentation
groups, 3 of the 5 groups agree or completely agree that global
climate change is happening, and that global climate change is at
least partially caused by human actions. However, 4 of the 5
groups are only partially aware or unaware of climate-related
biophysical change at the park. Therefore, communication and
interpretation with visitors should perhaps highlight biophysical
change at the park to increase visitors’ awareness of park-specific
biophysical change. Consequently, limited attention and time
should perhaps be spent on informing visitors about the
occurrence and anthropogenic influences on climate change.
• Communication about park-specific change should perhaps start
with discussions about glaciers (since a majority of visitors are
aware of glacial related change at KEFJ, and since glaciers rank
highly important to visitors). Next, communication can transition
into topics such as increased vegetation and a decrease in Steller
sea lions, since visitors are less aware of these two elements.
• When interpreting global climate change for visitors, KEFJ staff
may benefit from discussing values related to the environment,
plants, animals, and ecosystems (i.e., biospheric value orientation).
• The data suggests that glaciers and habitat for marine life are
• The majority of the sample seems to be well-educated and first
• It seems most of the visitors in this study engaged in a boat tour or
• The results suggest that repeat visitors may spend in excess of
• It seems most visitors do not identify books and the internet as the
• The phrase global climate change obviously means different things
• Approximately 10% of visitors who reported visiting Exit Glacier
• The time series analysis indicates that beliefs and perceptions

SECTION 5
Interpreting this topic may seem daunting, but not
when you consider that the evidence for it is very
strong, the vast majority of people want to know
more about it, and park visitors care about the
impacts of climate change on national parks. Please
consider this boiler plate advice on how to
successfully craft climate messages into your
programs and informal visitor contacts.
TechniquesChildren: Kids have a wide sphere of influence
among their families. If children care about a topic,
then their parents are likely to care too. Encourage
In This Section
1. Techniques
2. Climate Change Metaphors
Interpreting Climate Change
22

kids to be leaders and stewards. As you do so, avoid
presenting doom and gloom scenarios to them.
Focus on hope: Avoiding framing climate change as a
crisis only. That tends to shut down thinking. It also
promotes common tropes in public conversation as the
dueling viewpoint which invites skepticism and
rhetorical tone which incites distrust.
Ask the right questions: Not ”Do you believe in climate
change?” But,
• Do you understand the realities of climate change?
• What climate change impacts do you see?
Frame your message effectively: Make it relevant to the audience. This
is a tenet of interpretation.
Framing sets an issue within an appropriate context to achieve a desired
interpretation or perspective. The intention is not to deceive or
manipulate people, but to make credible climate science more accessible.
Indeed, since it is impossible not to frame an issue, climate change
communicators need to ensure they consciously select a frame that will
resonate with their audience.
For example, most people visit Katmai to view bears or go fishing. If
climate change impacts salmon, then bears, bear-watching, trout fishing
and many other activities that people come here for will change. Can you
frame climate change information around their experience or the
resources they care about protecting?
Along those lines, also keep messages place based.
People show greater interest and engagement when
climate change messages focus on the park or refuge
they visited.
If you are interpreting to people from Alaska Native
communities, use stories from elders when discussing
climate change to tell personal, local stories about our
changing landscape.
Keep it simple: Global warming can be explained fairly
simply when you understand how it happens and how
we know it is happening.
Climate Change MetaphorsThese metaphors from the Frameworks Institute’s Getting to the Heart
of the Matter (http://www.frameworksinstitute.org/). They are easy to
remember, understand, and offer a starting point to explain several
aspects of climate change and its impacts.
Climate’s Heart: This explanatory metaphor enables people to think
and talk more productively about the role of the ocean with the climate
system. The metaphor is as follows.
“The oceans regulate the climate system the way your heart regulates the
flow of blood throughout your body. The heart sustains the body by
controlling the circulation of blood, making sure the right amount gets
to all parts of the body — not too much and not too little. The oceans act
as the climate’s heart, sustaining the climate by controlling the
circulation of things like heat and humidity.
23
Psychology of Climate Change Communication
This document provides excellent advice about communication climate change information, especially concerning framing.
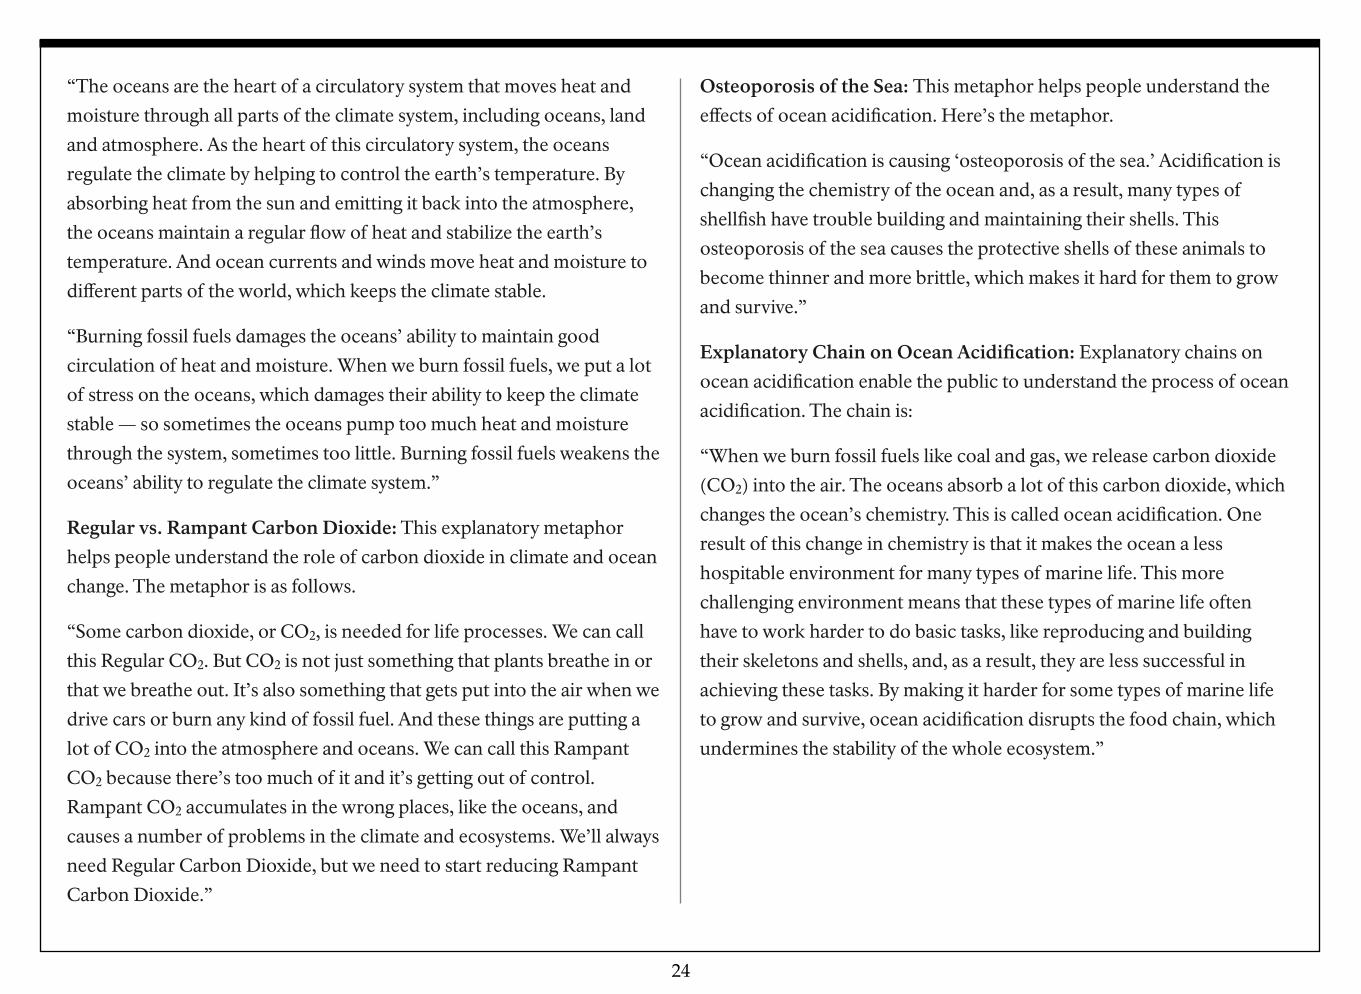
“The oceans are the heart of a circulatory system that moves heat and
moisture through all parts of the climate system, including oceans, land
and atmosphere. As the heart of this circulatory system, the oceans
regulate the climate by helping to control the earth’s temperature. By
absorbing heat from the sun and emitting it back into the atmosphere,
the oceans maintain a regular flow of heat and stabilize the earth’s
temperature. And ocean currents and winds move heat and moisture to
different parts of the world, which keeps the climate stable.
“Burning fossil fuels damages the oceans’ ability to maintain good
circulation of heat and moisture. When we burn fossil fuels, we put a lot
of stress on the oceans, which damages their ability to keep the climate
stable — so sometimes the oceans pump too much heat and moisture
through the system, sometimes too little. Burning fossil fuels weakens the
oceans’ ability to regulate the climate system.”
Regular vs. Rampant Carbon Dioxide: This explanatory metaphor
helps people understand the role of carbon dioxide in climate and ocean
change. The metaphor is as follows.
“Some carbon dioxide, or CO2, is needed for life processes. We can call
this Regular CO2. But CO2 is not just something that plants breathe in or
that we breathe out. It’s also something that gets put into the air when we
drive cars or burn any kind of fossil fuel. And these things are putting a
lot of CO2 into the atmosphere and oceans. We can call this Rampant
CO2 because there’s too much of it and it’s getting out of control.
Rampant CO2 accumulates in the wrong places, like the oceans, and
causes a number of problems in the climate and ecosystems. We’ll always
need Regular Carbon Dioxide, but we need to start reducing Rampant
Carbon Dioxide.”
Osteoporosis of the Sea: This metaphor helps people understand the
effects of ocean acidification. Here’s the metaphor.
“Ocean acidification is causing ‘osteoporosis of the sea.’ Acidification is
changing the chemistry of the ocean and, as a result, many types of
shellfish have trouble building and maintaining their shells. This
osteoporosis of the sea causes the protective shells of these animals to
become thinner and more brittle, which makes it hard for them to grow
and survive.”
Explanatory Chain on Ocean Acidification: Explanatory chains on
ocean acidification enable the public to understand the process of ocean
acidification. The chain is:
“When we burn fossil fuels like coal and gas, we release carbon dioxide
(CO2) into the air. The oceans absorb a lot of this carbon dioxide, which
changes the ocean’s chemistry. This is called ocean acidification. One
result of this change in chemistry is that it makes the ocean a less
hospitable environment for many types of marine life. This more
challenging environment means that these types of marine life often
have to work harder to do basic tasks, like reproducing and building
their skeletons and shells, and, as a result, they are less successful in
achieving these tasks. By making it harder for some types of marine life
to grow and survive, ocean acidification disrupts the food chain, which
undermines the stability of the whole ecosystem.”
24