CLIMATE CHANGE & EXTREME WEATHER PILOT … Molden.pdfCLIMATE CHANGE & EXTREME WEATHER PILOT PROJECT...
24
CLIMATE CHANGE & EXTREME WEATHER PILOT PROJECT Office of Strategic Planning and Projects Connecticut Department of Transportation
-
Upload
hoangxuyen -
Category
Documents
-
view
224 -
download
0
Transcript of CLIMATE CHANGE & EXTREME WEATHER PILOT … Molden.pdfCLIMATE CHANGE & EXTREME WEATHER PILOT PROJECT...

CLIMATE CHANGE & EXTREME WEATHER PILOT PROJECT
Off ice of Strategic Planning and Projects Connecticut Department of Transportation
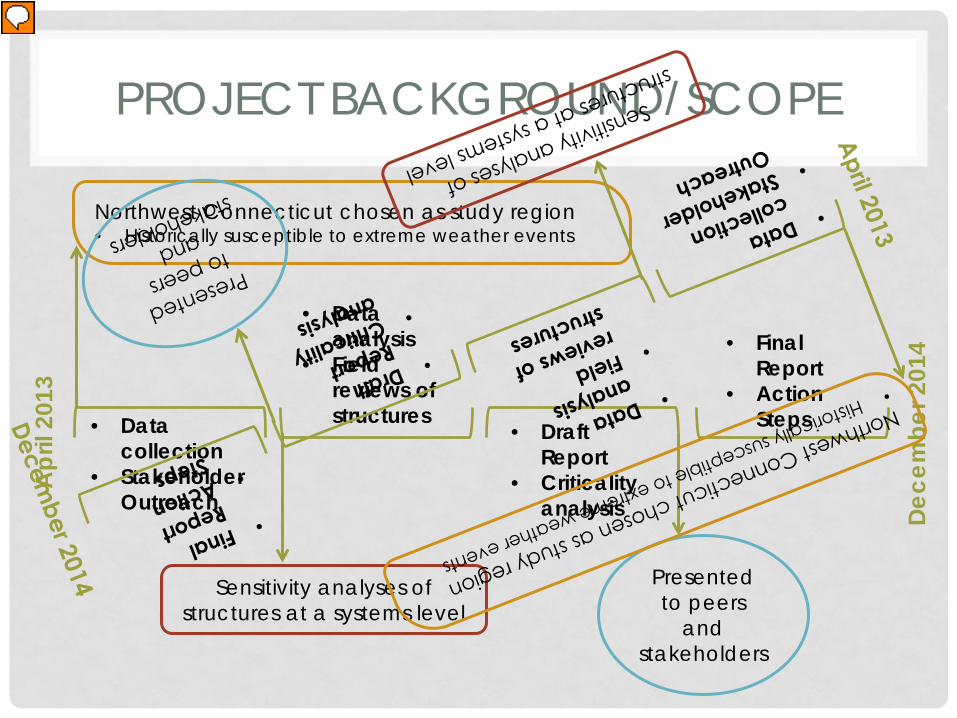
PROJECT BACKGROUND/SCOPE A
pril
2013
Dece
mbe
r 201
4
• Draft Report
• Criticality analysis
• Data collection
• Stakeholder Outreach
• Final Report
• Action Steps
• Data analysis
• Field reviews of structures
Sensitivity analyses of structures at a systems level
Northwest Connecticut chosen as study region • Historically susceptible to extreme weather events
Presented to peers
and stakeholders
Presenter
Presentation Notes
Mention, backwater flooding, coastal inundation We already know a lot about structures longer than 20 feet
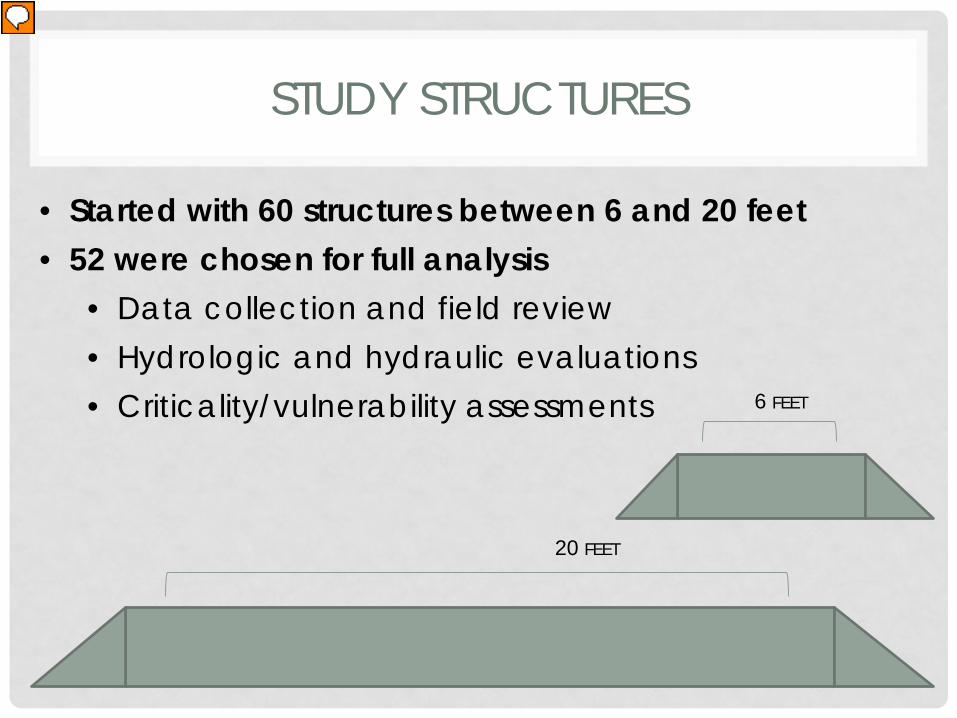
STUDY STRUCTURES
6 FEET
20 FEET
• Started with 60 structures between 6 and 20 feet • 52 were chosen for full analysis
• Data collection and field review • Hydrologic and hydraulic evaluations • Criticality/vulnerability assessments
Presenter
Presentation Notes
Dual Approach: Hydraulic Evaluations Context based evaluation of adaptive capacity of structures: sensitivity analyses Criticality Assessment Analysis of social, spatial, and hydraulic factors to determine relative levels of risk to each structure

STUDY STRUCTURES
• Average structure age: 81 years • 34 study structures satisfy hydraulic design criteria
• 13 of those vulnerable to scour
• 18 study structures do not satisfy hydraulic design criteria
• 19 structures are critical, 14 satisfy do not satisfy hydraulic design criteria, 2 have adaptive capacity
Presenter
Presentation Notes
Sensitivity Analyses: Bridge assessments and field studies 60 were reviewed in the field 52 of the structures were selected for further evaluation Hydrologic calculations for sensitivity analyses Criticality Assessment: Combined hydraulic assessments with spatial and social considerations Traffic and road data from HPMS FEMA flood zones Emergency facilities Scour critical structures Census- Including At-Risk Populations
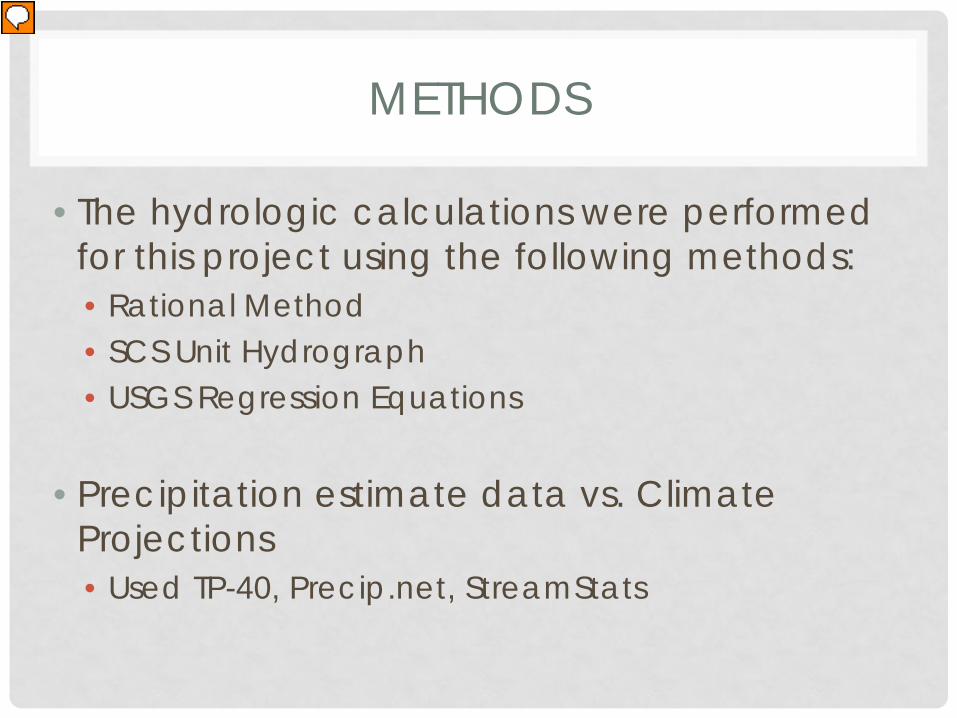
METHODS
• The hydrologic calculations were performed for this project using the following methods: • Rational Method • SCS Unit Hydrograph • USGS Regression Equations
• Precipitation estimate data vs. Climate Projections • Used TP-40, Precip.net, StreamStats
Presenter
Presentation Notes
Methods rely on size of drainage area
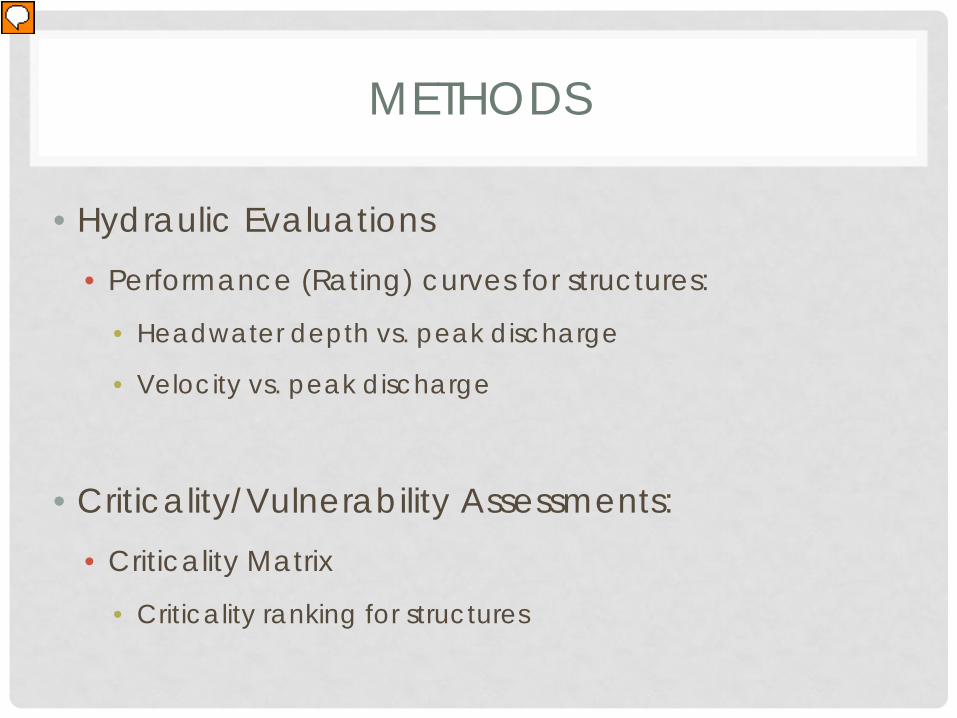
METHODS
• Hydraulic Evaluations • Performance (Rating) curves for structures:
• Headwater depth vs. peak discharge
• Velocity vs. peak discharge
• Criticality/Vulnerability Assessments: • Criticality Matrix
• Criticality ranking for structures
Presenter
Presentation Notes
Performance curves were developed using FHWA Culvert Hydraulic Analysis Software “HY-8” available on FHWA Hydraulic Engineering webpage
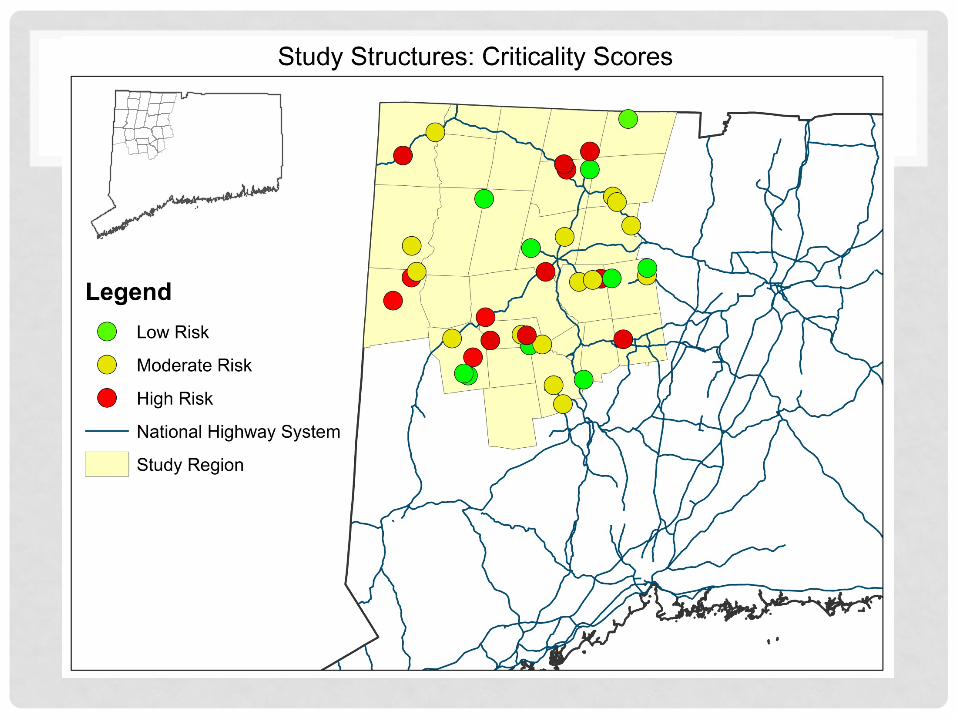
ANALYSIS RESULTS
• Following slides are examples of:
• Results of performance curve calculations and
adaptive capacity analyses
• Results of Criticality/Vulnerability assessments
• Maps of study and structure areas
• Low, Moderate, and High Risk structures

0
2
4
6
8
10
12
14
16
18
20
0 500 1000 1500 2000 2500 3000 3500
HEA
DW
AT
ER
DEP
TH (
FT.)
PEAK DISCHARGE (CFS)
STRUCTURE NO. 02423HEADWATER DEPTH VS. PEAK DISCHARGE
Continuing with the example presented in Figure 2, a 2-inch or an approximate 24% increase in the 100-year, 24-hour precipitation would increase the current 100-year peak discharge estimate of 881 cfs by 366 cfs to 1,247 cfs (horizontal scale), a 41.5% increase. As illustrated by the rating curve, a 2-inch increase in precipitation would move the 100-year peak discharge estimate to slightly above the current 500-year peak discharge estimate of 1,221 cfs. The resulting headwater depth would increase by approximately 1.9-ft, from 6.9-ft to 8.8-ft (vertical scale).
OV
ERTO
PPIN
G B
EGIN
S
HW
/D =
1.5
FREE
BO
AR
D =
1 F
T.
100-
YEA
R D
ISC
HA
RG
E
INLE
TSU
BM
ERG
ED
500-
YEA
R D
ISC
HA
RG
E
100-year design headwater depth is below the depths at 1-ft freeboard and HW/D = 1.5, therefore structure satisfies headwater design criteria
Presenter
Presentation Notes
Performance Curve

CRITICALITY MATRIX
Very Low to Low Moderate Critical to Very Critical
1 2 3 4 5 6 7 8 9 10
Hydr
aulic
High adaptive capacity Moderate adaptive capacity Low adaptive capacity
No history of closure History of periodic closures Significant history of closure
Scour critical
Satisfies WSE criteria Adjacent to scour critical structures Does not satisfy WSE criteria
Spat
ial Outside FEMA flood zones Within 500 year FEMA flood zone Within 100 year FEMA flood zone
Low concentration of impervious surfaces
Moderate concentration of impermeable surfaces
High concentration of impermeable surfaces
Soci
al
Low ADT & V/C Moderate ADT & V/C High ADT & V/C
0-4 accidents 5 or more accidents Emergency route
Non-NHS, non-emergency route NHS route Emergency services cluster
Structure: 06712 Location: Watertown
Year Built: 1966 Criticality Ranking: 4

0
2
4
6
8
10
12
0 50 100 150 200 250 300 350 400
HE
AD
WA
TE
R D
EPT
H (F
T.)
PEAK DISCHARGE (CFS)
STRUCTURE NO. 02200HEADWATER DEPTH VS. PEAK DISCHARGE
100-
YE
AR
TP-
40 &
PR
EC
IP.N
ET
50
-YR
DI
SCHA
RGE
OV
ER
TO
PPIN
G B
EG
INS
HW
/D =
1.5
FREEBOARD = 1
INLET SUBMERGED50
-YE
AR
TP-
40 D
ISCH
ARG
E
100-
YE
AR
PR
EC
IP.N
ET
DIS
CHAR
GE
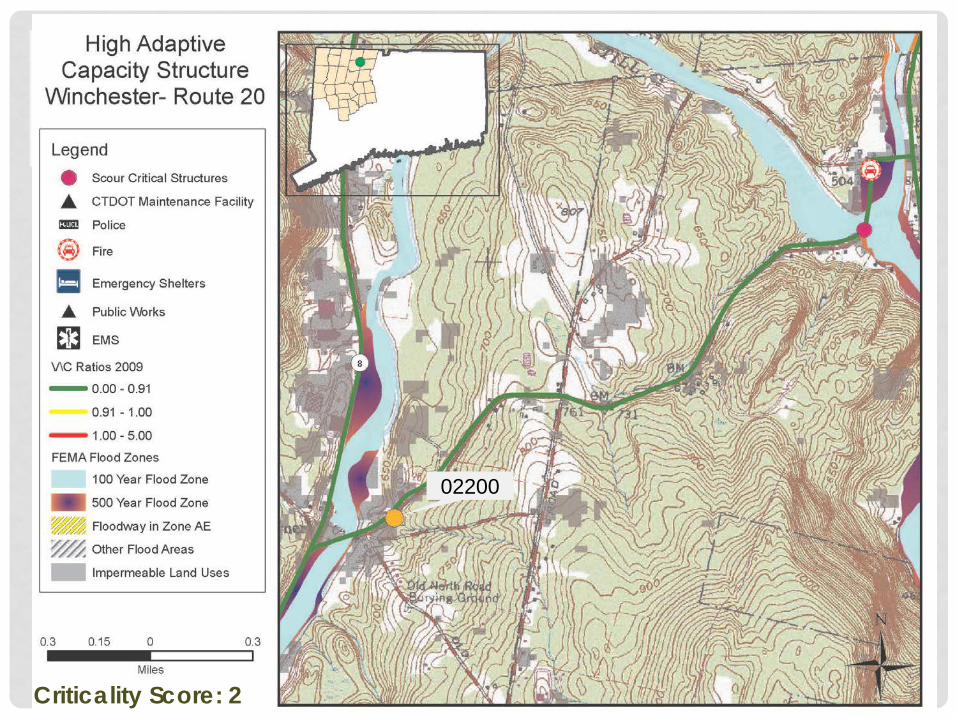
Criticality Score: 2
02200


Example: Little to No Adaptive Capacity
Presenter
Presentation Notes
Performance Curve 1: No freeboard and close to overtopping the road. Structure built in 1948. SCS Method (can be overly conservative)
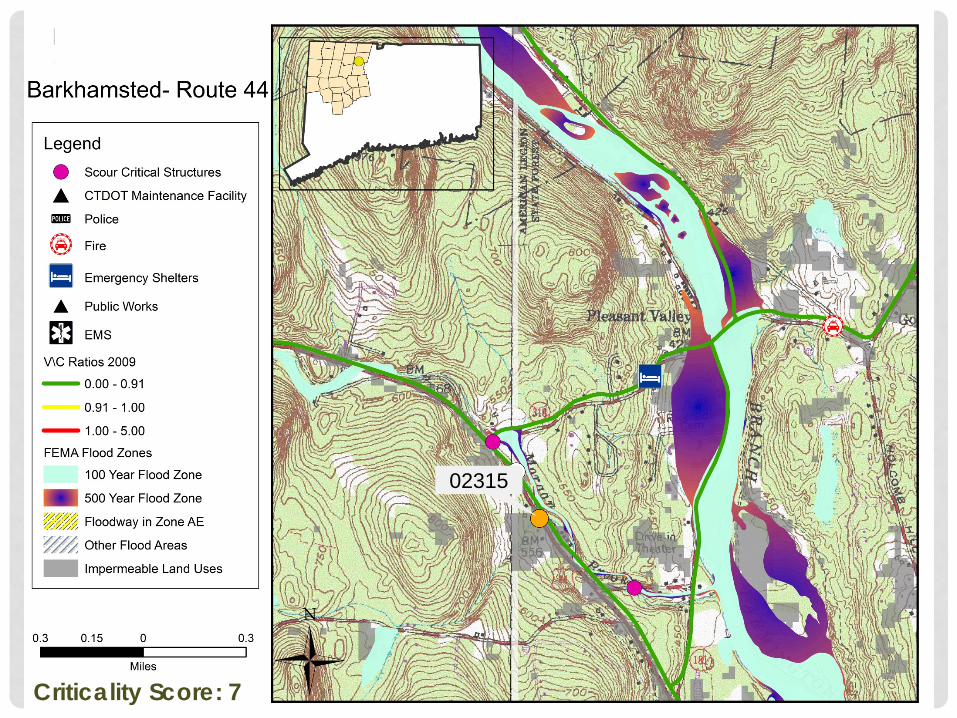
Criticality Score: 7
02315

Example: Significant Adaptive Capacity
Presenter
Presentation Notes
Performance Curve #2: Significant capacity above the 100 year design storm. Structure built in 1958. StreamStats method

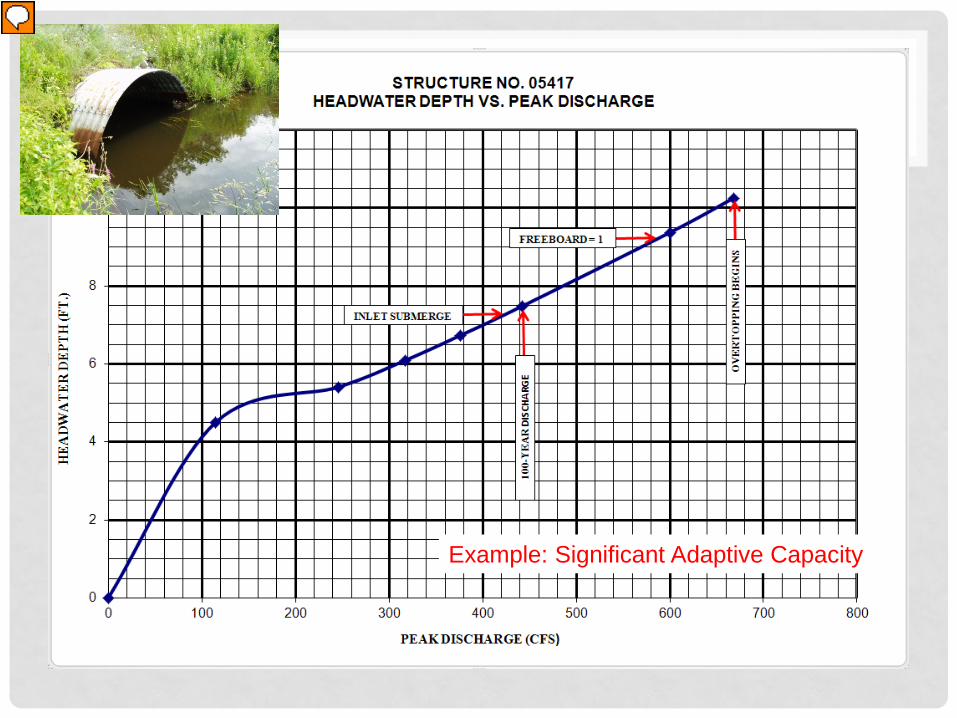
Criticality Score: 8
05417
Presenter
Presentation Notes
Structure built in 1956
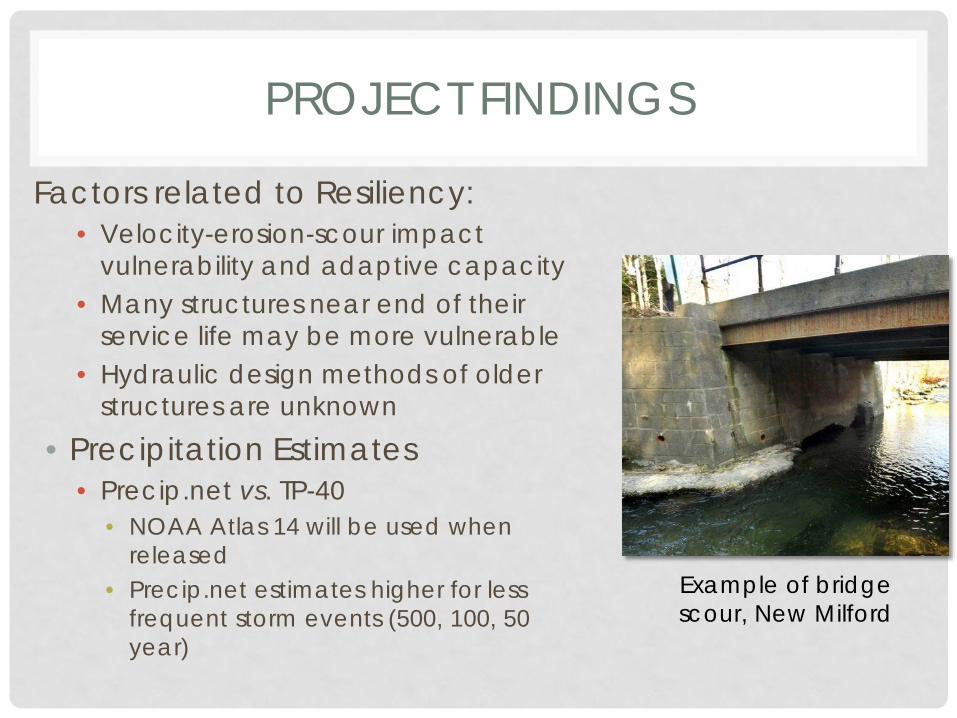
PROJECT FINDINGS
Factors related to Resiliency: • Velocity-erosion-scour impact
vulnerability and adaptive capacity • Many structures near end of their
service life may be more vulnerable • Hydraulic design methods of older
structures are unknown • Precipitation Estimates
• Precip.net vs. TP-40 • NOAA Atlas 14 will be used when
released • Precip.net estimates higher for less
frequent storm events (500, 100, 50 year)
Example of bridge scour, New Milford

PROJECT FINDINGS
• Keep data/tools up to date (rainfall, stream gage, regression equations)
• “Check” frequency discharge should be carefully examined
• Reassess hydrologic methods and practices with or in anticipation of release of NOAA Atlas 14
NOAA Atlas 14 not available yet for Connecticut
21

NEEDS / FURTHER RESEARCH
• Precipitation projections from climate models • Uncertainty in precipitation/discharge estimates vs.
uncertainty in climate change projections • Guidelines, examples and tools to conduct risk and
cost benefit analyses • Developing and integrating cost factors into criticality
assessments

NEXT STEPS
• Outline a plan/process to better incorporate risk assessment/life cycle cost-benefit analysis into hydraulic design and asset management
• Discuss regression equation update with USGS and seek funding • Re-establish statewide “hydrology committee” • Work with municipalities on context dependent adaptation
strategies and other tools for at-risk structures • Stay current with studies, best practices, guidance, and revisions
to FHWA’s Climate Change and Extreme Weather Vulnerability Assessment Framework.

THANK YOU
Project Contacts
Michael Hogan [email protected]
David Elder [email protected]
Stephanie Molden [email protected]