declaration of the world peoples' conference on climate change and ...
Upload
jordan-bowmanCategory
view
35download
3description
Climate Change Declaration Reporting
Jenny CassellsSector Manager – Carbon Trust Scotland
Agenda
Local Authority carbon performanceSection 2 overviewSection 2 reporting elementsRecommendations for reporting structure
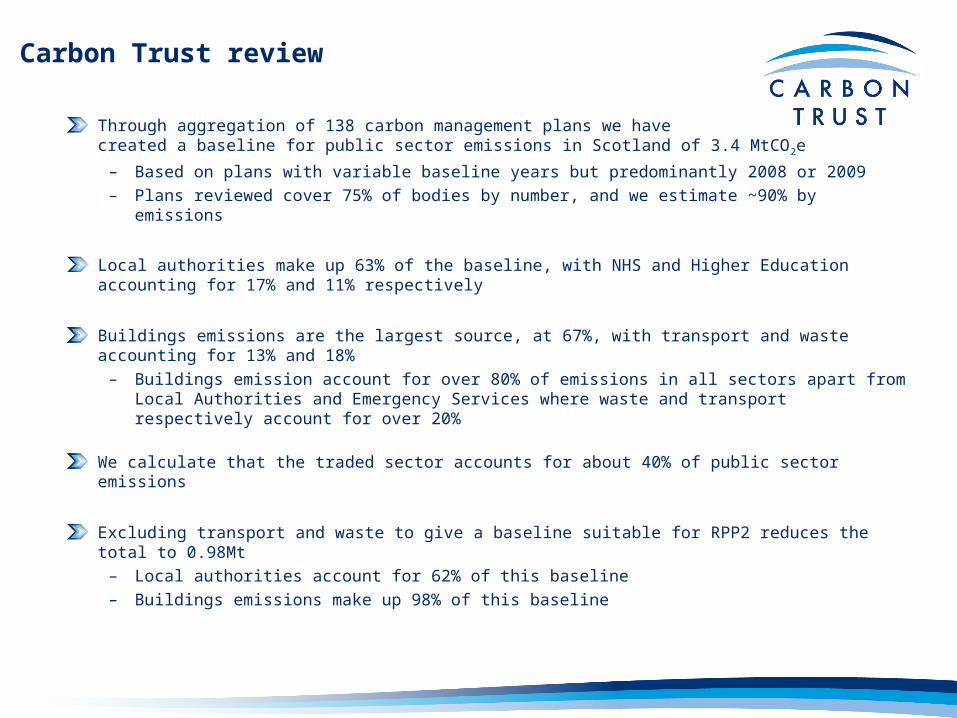
Carbon Trust review
Through aggregation of 138 carbon management plans we have created a baseline for public sector emissions in Scotland of 3.4 MtCO2e
– Based on plans with variable baseline years but predominantly 2008 or 2009– Plans reviewed cover 75% of bodies by number, and we estimate ~90% by
emissions
Local authorities make up 63% of the baseline, with NHS and Higher Education accounting for 17% and 11% respectively
Buildings emissions are the largest source, at 67%, with transport and waste accounting for 13% and 18%
– Buildings emission account for over 80% of emissions in all sectors apart from Local Authorities and Emergency Services where waste and transport respectively account for over 20%
We calculate that the traded sector accounts for about 40% of public sector emissions
Excluding transport and waste to give a baseline suitable for RPP2 reduces the total to 0.98Mt
– Local authorities account for 62% of this baseline– Buildings emissions make up 98% of this baseline
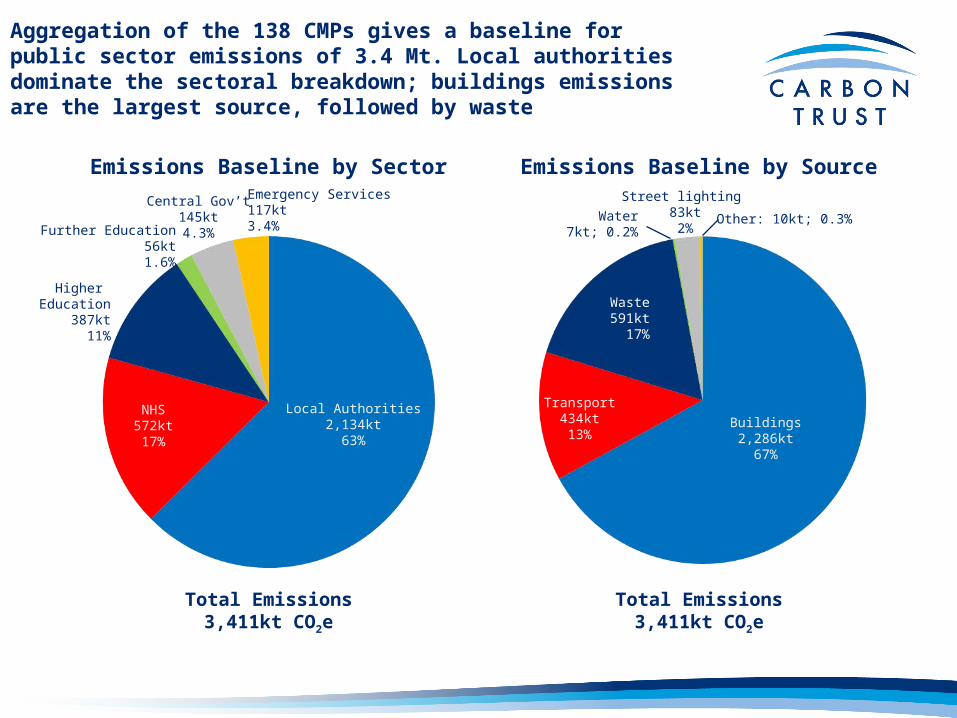
Aggregation of the 138 CMPs gives a baseline for public sector emissions of 3.4 Mt. Local authorities dominate the sectoral breakdown; buildings emissions are the largest source, followed by waste
Total Emissions3,411kt CO2e
Emissions Baseline by Sector
Total Emissions3,411kt CO2e
Emissions Baseline by Source
Local Authorities2,134kt
63%
NHS572kt17%
Higher Education
387kt11%
Further Education56kt1.6%
Central Gov’t145kt4.3%
Emergency Services117kt3.4%
Buildings2,286kt
67%
Transport434kt13%
Waste591kt
17%
Street lighting 83kt2%
Water7kt; 0.2%
Other: 10kt; 0.3%
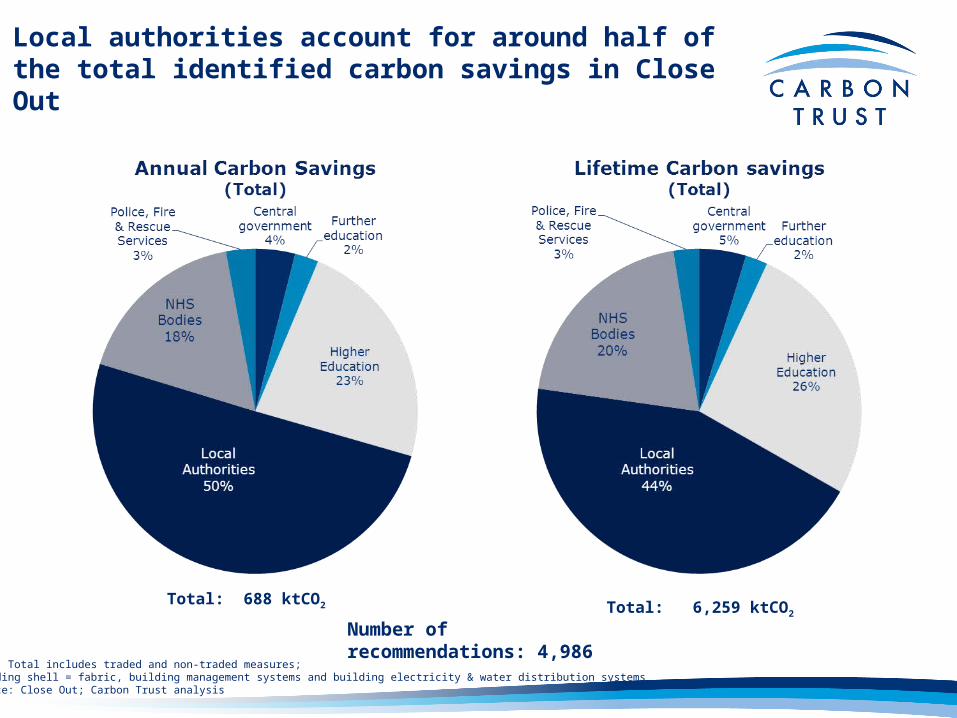
Local authorities account for around half of the total identified carbon savings in Close Out
Total: 688 ktCO2 Total: 6,259 ktCO2 Number of
recommendations: 4,986Note: Total includes traded and non-traded measures; Building shell = fabric, building management systems and building electricity & water distribution systemsSource: Close Out; Carbon Trust analysis
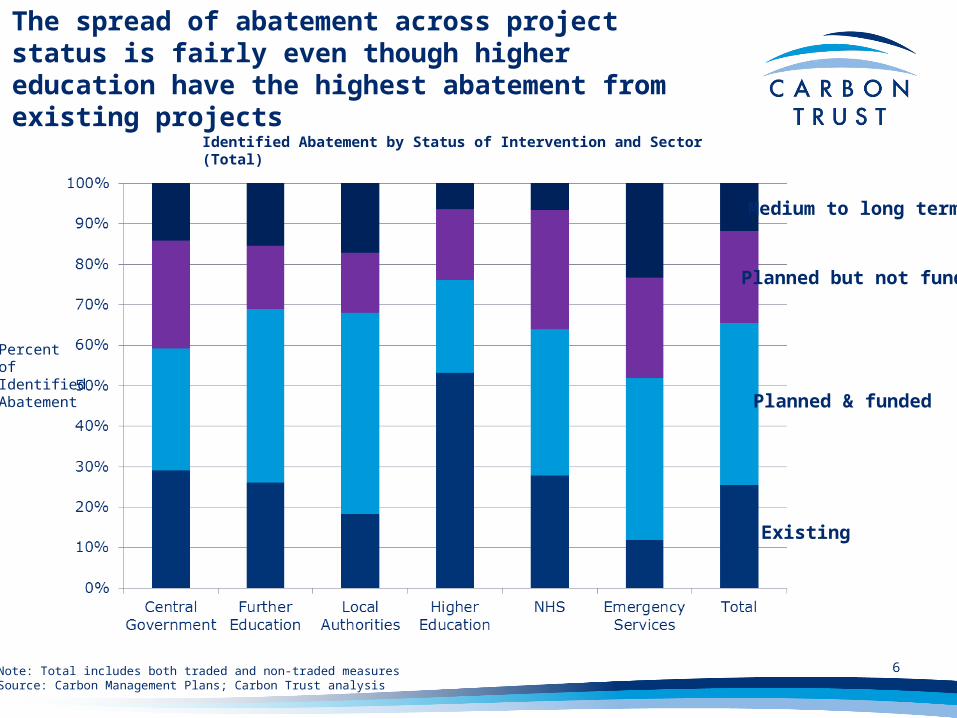
The spread of abatement across project status is fairly even though higher education have the highest abatement from existing projects
6
Identified Abatement by Status of Intervention and Sector(Total)
Planned but not funded
Existing
Planned & funded
Medium to long term
PercentofIdentifiedAbatement
Note: Total includes both traded and non-traded measuresSource: Carbon Management Plans; Carbon Trust analysis
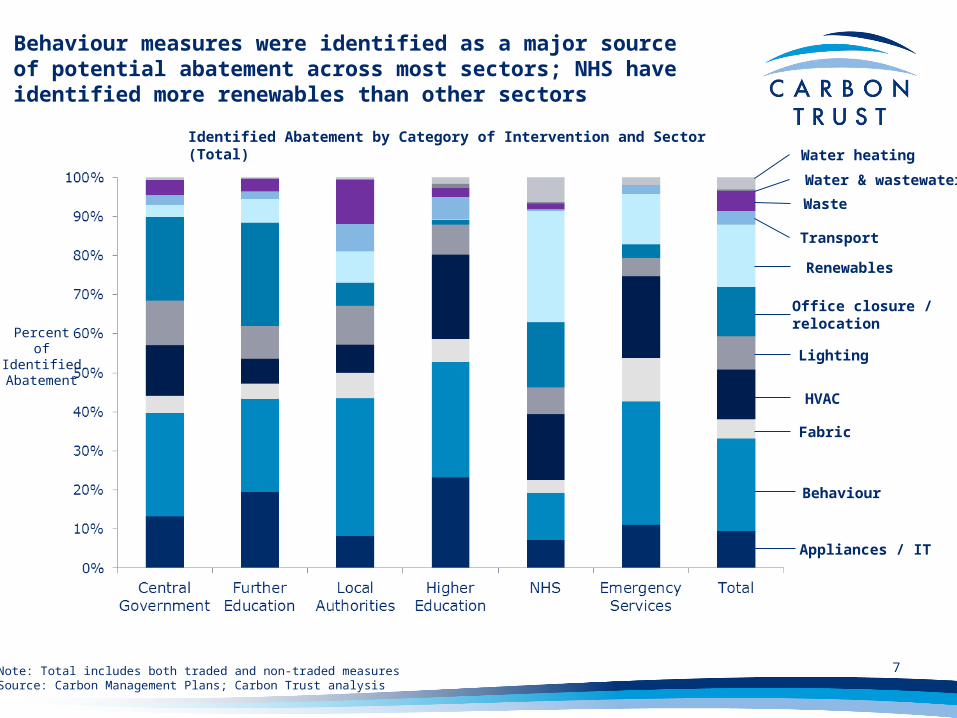
Behaviour measures were identified as a major source of potential abatement across most sectors; NHS have identified more renewables than other sectors
7Note: Total includes both traded and non-traded measuresSource: Carbon Management Plans; Carbon Trust analysis
Identified Abatement by Category of Intervention and Sector(Total)
Percentof
IdentifiedAbatement
Water heating
Water & wastewater
Waste
Transport
Renewables
Office closure / relocation
Lighting
HVAC
Fabric
Behaviour
Appliances / IT
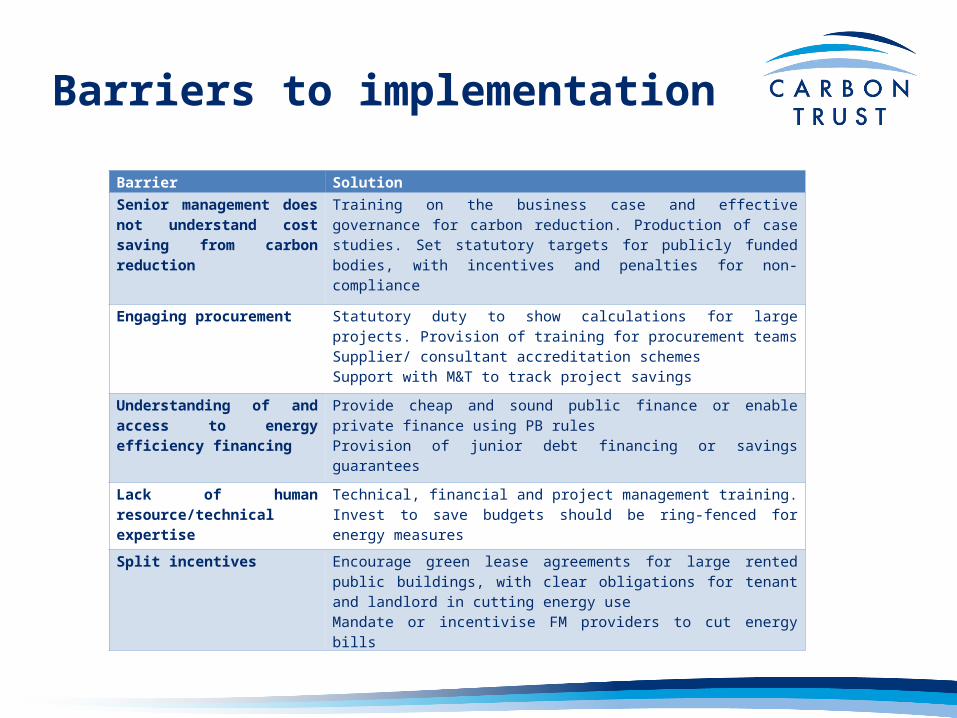
Barriers to implementation
Barrier Solution
Senior management does not understand cost saving from carbon reduction
Training on the business case and effective governance for carbon reduction. Production of case studies. Set statutory targets for publicly funded bodies, with incentives and penalties for non-compliance
Engaging procurement Statutory duty to show calculations for large projects. Provision of training for procurement teamsSupplier/ consultant accreditation schemesSupport with M&T to track project savings
Understanding of and access to energy efficiency financing
Provide cheap and sound public finance or enable private finance using PB rulesProvision of junior debt financing or savings guarantees
Lack of human resource/technical expertise
Technical, financial and project management training. Invest to save budgets should be ring-fenced for energy measures
Split incentives Encourage green lease agreements for large rented public buildings, with clear obligations for tenant and landlord in cutting energy useMandate or incentivise FM providers to cut energy bills
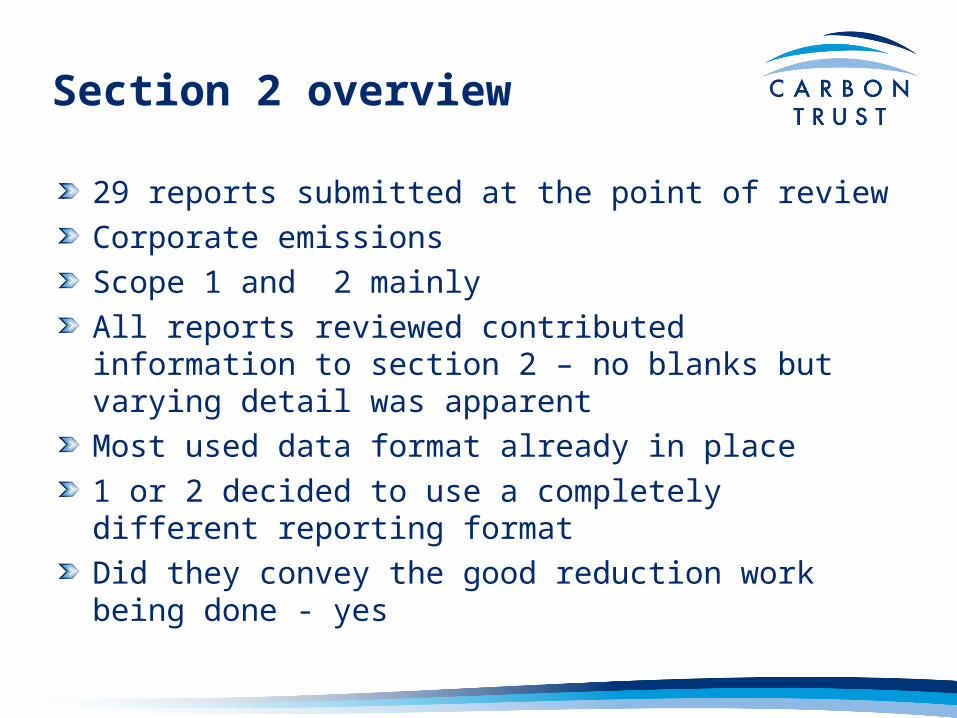
Section 2 overview
29 reports submitted at the point of reviewCorporate emissionsScope 1 and 2 mainlyAll reports reviewed contributed information to section 2 – no blanks but varying detail was apparentMost used data format already in place1 or 2 decided to use a completely different reporting formatDid they convey the good reduction work being done - yes
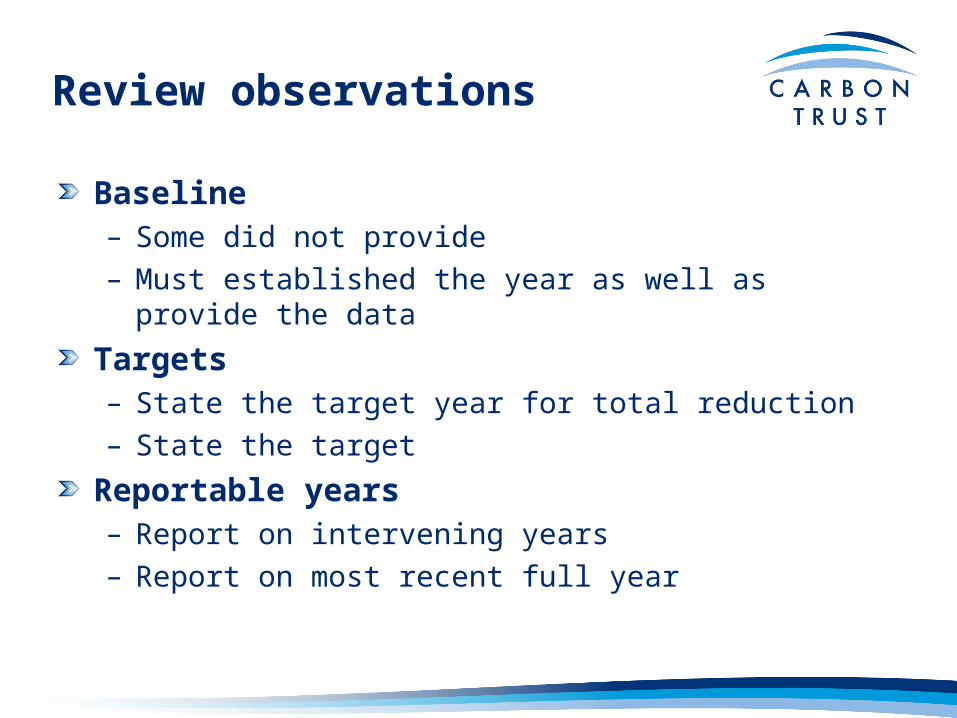
Review observations
Baseline – Some did not provide– Must established the year as well as provide the
data
Targets– State the target year for total reduction– State the target
Reportable years– Report on intervening years – Report on most recent full year
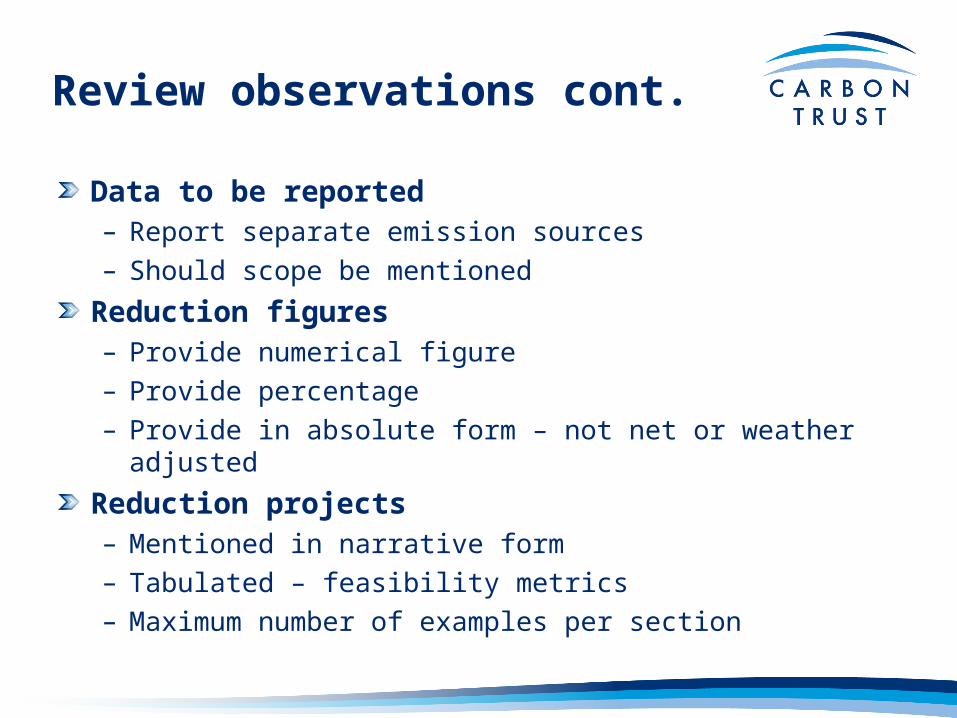
Review observations cont.
Data to be reported– Report separate emission sources – Should scope be mentioned
Reduction figures– Provide numerical figure– Provide percentage – Provide in absolute form – not net or weather adjusted
Reduction projects– Mentioned in narrative form– Tabulated – feasibility metrics– Maximum number of examples per section
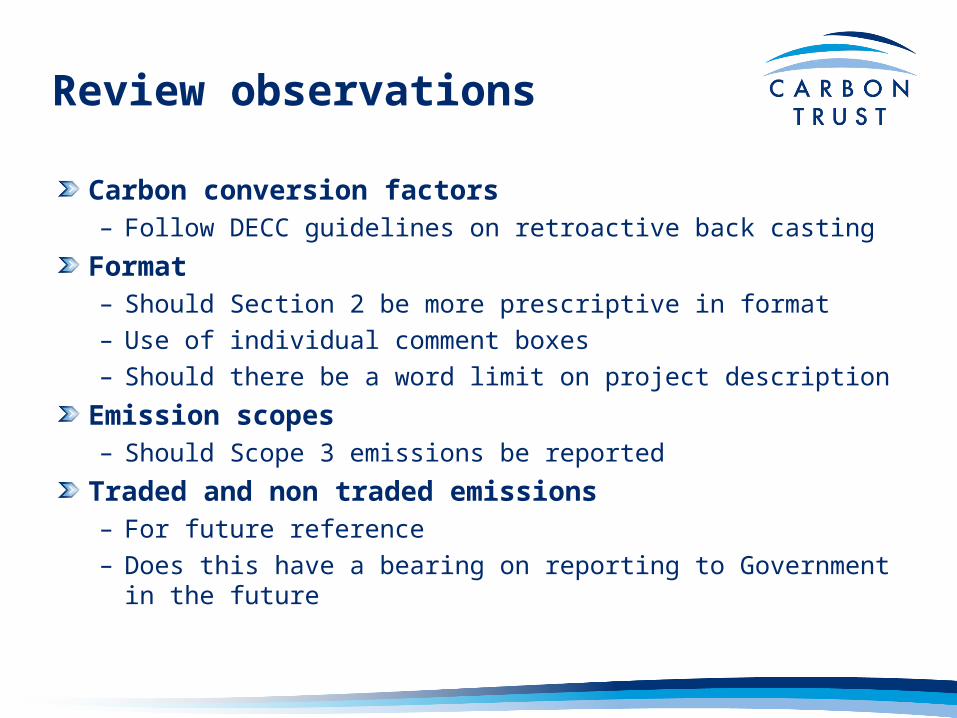
Review observations
Carbon conversion factors– Follow DECC guidelines on retroactive back casting
Format– Should Section 2 be more prescriptive in format– Use of individual comment boxes– Should there be a word limit on project description
Emission scopes– Should Scope 3 emissions be reported
Traded and non traded emissions– For future reference– Does this have a bearing on reporting to Government in
the future
Review observations
Report length– Shortest report was 5 pages and longest was 34
pages can make for difficulties in review– Is there an optimum
Conclusions
Improve paritySimplify the reporting structureOptimise reporting lengthFollow the formatSpecify key topics for commentReport auditingKey supportTraining

Thank you
Questions?